Elaborating Hungarian Segment of the Global Map of Salt-Affected Soils (GSSmap): National Contribution to an International Initiative

 ,
,  and
and
Abstract

1. Introduction
2. Materials and Methods
2.1. GSSmap Specifications
2.2. Soil Data, Conversion and Harmonization
2.3. Environmental Covariates
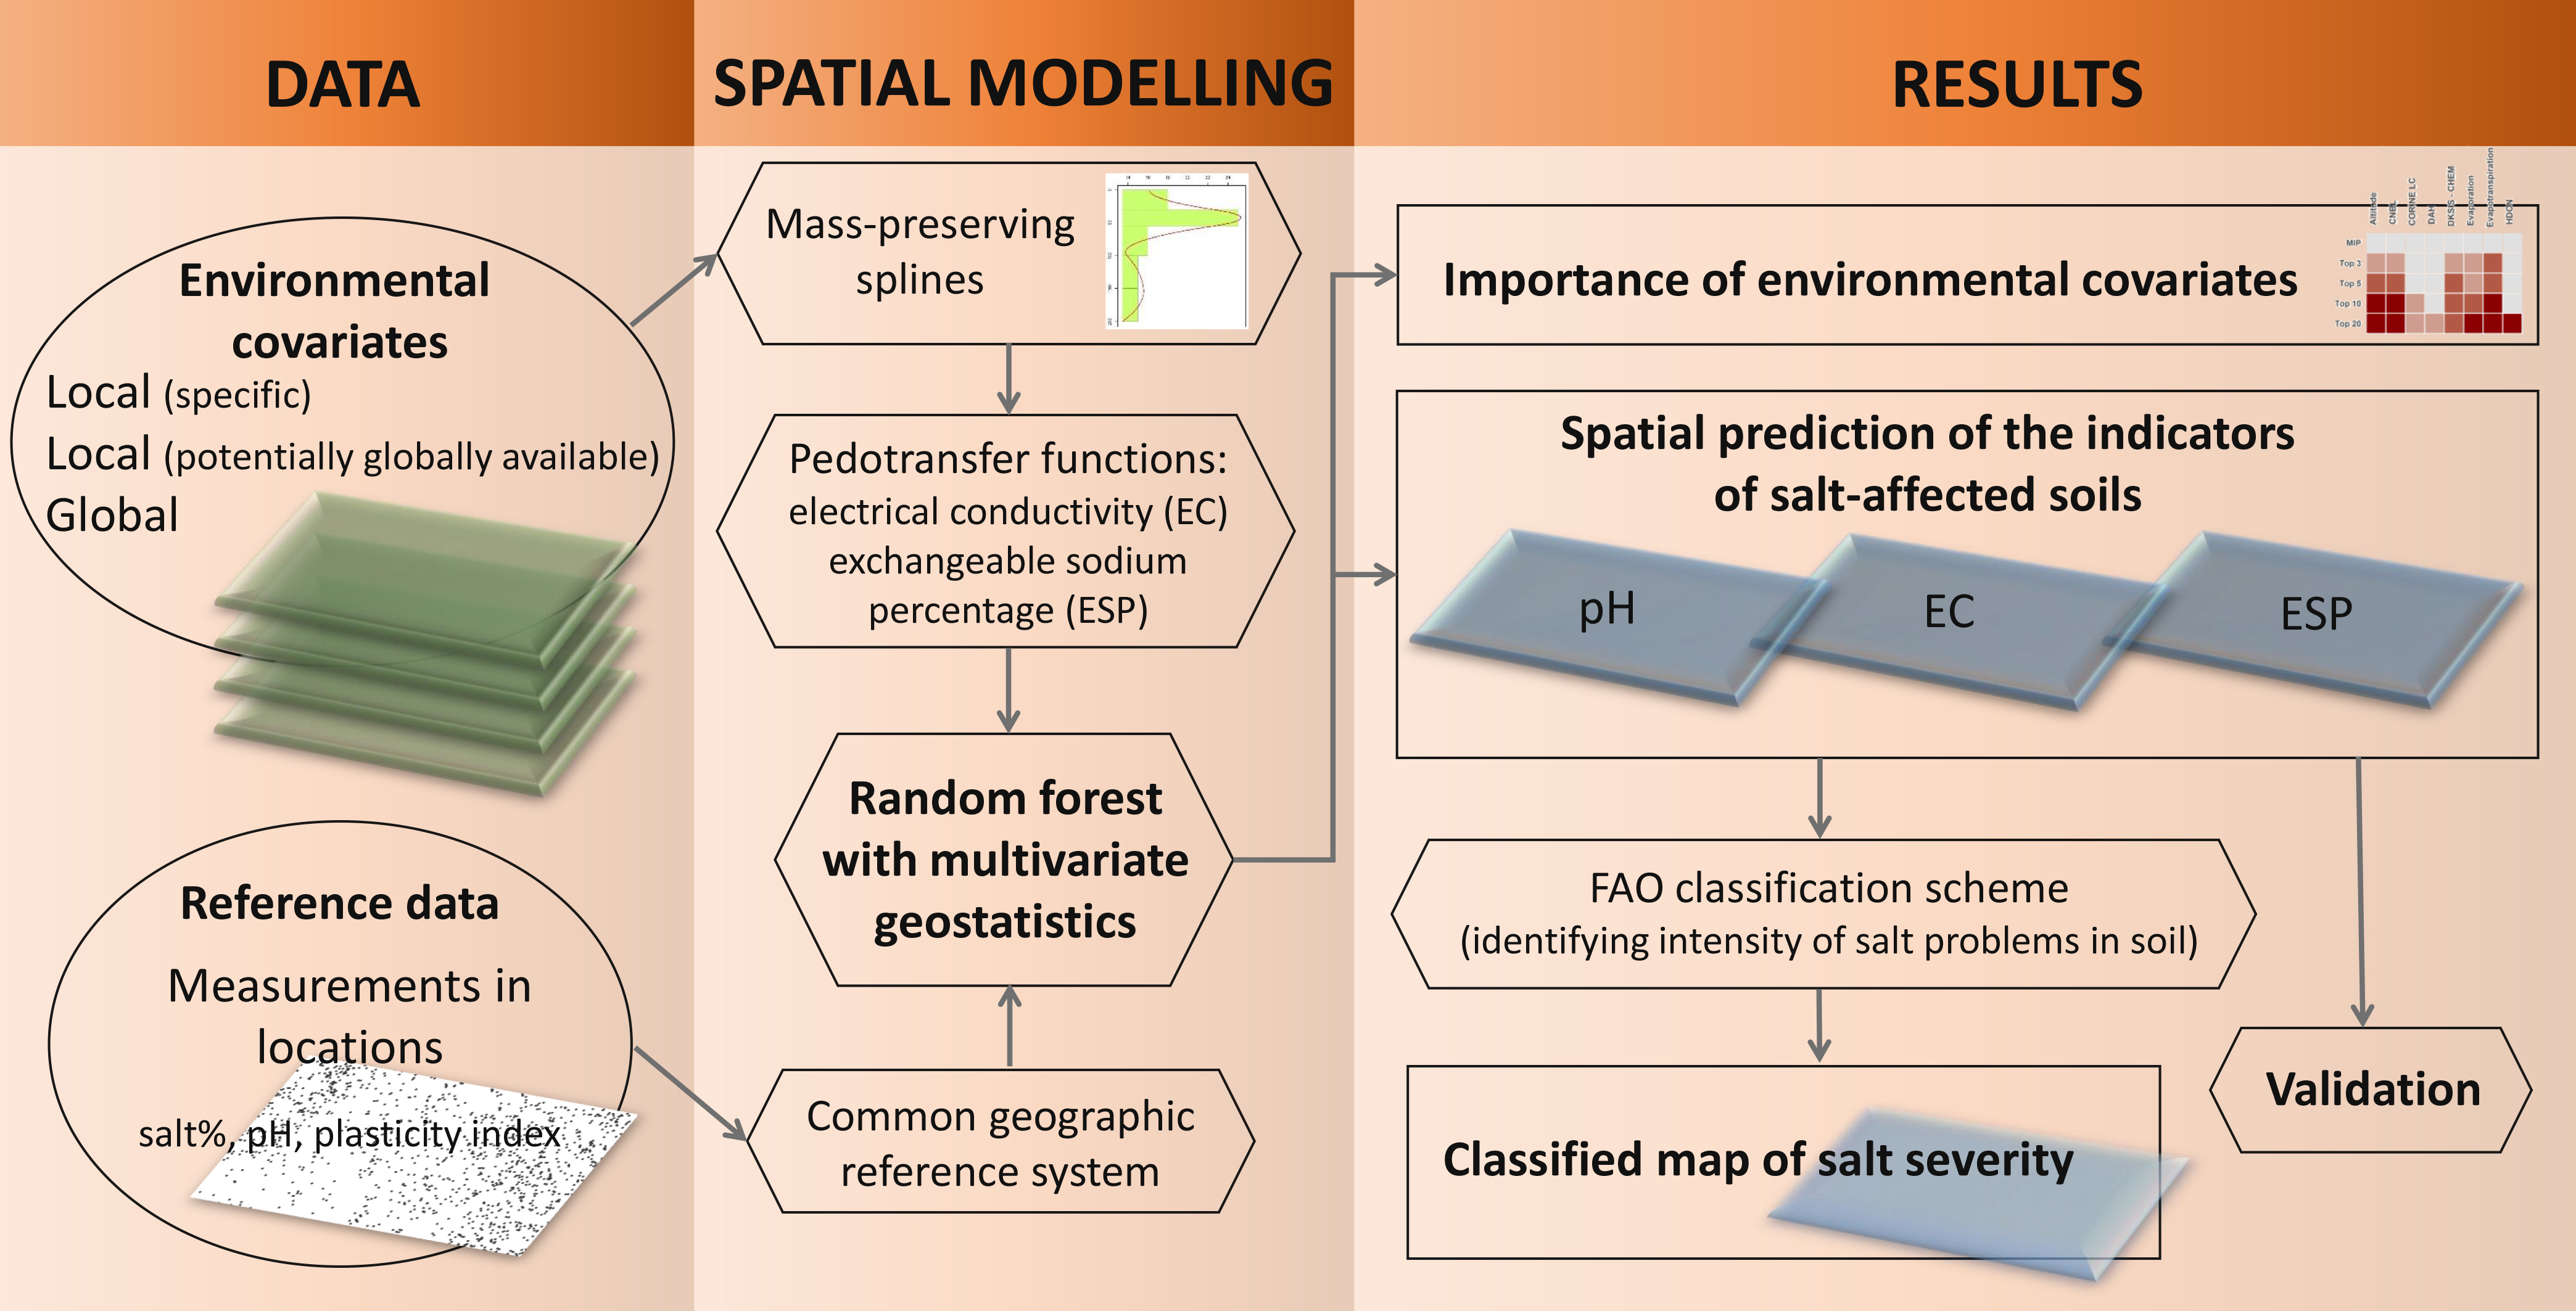
2.4. Spatial Modelling and Classification of SAS
2.5. Quantification and Propagation of Uncertainty
2.6. Validation
3. Results
3.1. Spatial Prediction of SAS Indicators
3.2. Performance of Spatial Predictions and Uncertainty Quantifications
3.3. Classified Maps of Salt Severity
4. Discussion
4.1. On the Interpretability of Machine Learning Algorithms
4.2. Remotely Sensed Information as Important Covariates for SAS Mapping
4.3. Pros And Cons of Using Multivariate Geostatistics
5. Conclusions
Supplementary Materials
Author Contributions
Funding
Acknowledgments
Conflicts of Interest
References
- Hengl, T.; Mendes de Jesus, J.; Heuvelink, G.B.M.; Ruiperez Gonzalez, M.; Kilibarda, M.; Blagotić, A.; Shangguan, W.; Wright, M.N.; Geng, X.; Bauer-Marschallinger, B.; et al. SoilGrids250m: Global gridded soil information based on machine learning. PLoS ONE 2017, 12, e0169748. [Google Scholar] [CrossRef] [PubMed]
- Arrouays, D.; Grundy, M.G.; Hartemink, A.E.; Hempel, J.W.; Heuvelink, G.B.M.; Hong, S.Y.; Lagacherie, P.; Lelyk, G.; McBratney, A.B.; McKenzie, N.J.; et al. GlobalSoilMap. Toward a Fine-Resolution Global Grid of Soil Properties. Adv. Agron. 2014, 125, 93–134. [Google Scholar] [CrossRef]
- Yigini, Y.; Olmedo, G.F.; Reiter, S.; Baritz, R.; Viatkin, K.; Vargas, R. Soil Organic Carbon Mapping Cookbook, 2nd ed.; FAO: Rome, Italy, 2018. [Google Scholar]
- Omuto, C.T.; Vargas, R.R.; El Mobarak, A.M.; Mohamed, N.; Viatkin, K.; Yigini, Y. Mapping of Salt-Affected Soils: Technical Manual; FAO: Rome, Italy, 2020. [Google Scholar]
- Vitharana, U.W.A.; Mishra, U.; Mapa, R.B. National soil organic carbon estimates can improve global estimates. Geoderma 2019, 337, 55–64. [Google Scholar] [CrossRef]
- Szatmári, G.; Pirkó, B.; Koós, S.; Laborczi, A.; Bakacsi, Z.; Szabó, J.; Pásztor, L. Spatio-temporal assessment of topsoil organic carbon stock change in Hungary. Soil Tillage Res. 2019, 195, 104410. [Google Scholar] [CrossRef]
- Heuvelink, G.B.M. It’s the accuracy. Pedometron 2015, 37, 14–16. [Google Scholar]
- Hengl, T. On usability of soil maps (and on global soil data models vs stitching together of individual disparate soil maps). Pedometron 2015, 38, 19–24. [Google Scholar]
- Szabolcs, I. Review of Research on Salt Affected Soils. Natural Resources Research; UNESCO: Paris, France, 1979. [Google Scholar]
- Minasny, B.; McBratney, A.B. Digital soil mapping: A brief history and some lessons. Geoderma 2016, 264, 301–311. [Google Scholar] [CrossRef]
- Söderström, M.; Sohlenius, G.; Rodhe, L.; Piikki, K. Adaptation of regional digital soil mapping for precision agriculture. Precis. Agric. 2016, 17, 588–607. [Google Scholar] [CrossRef]
- Piikki, K.; Wetterlind, J.; Söderström, M.; Stenberg, B. Three-dimensional digital soil mapping of agricultural fields by integration of multiple proximal sensor data obtained from different sensing methods. Precis. Agric. 2014, 16, 29–45. [Google Scholar] [CrossRef]
- Decsi, B.; Vári, Á.; Kozma, Z. The effect of future land use changes on hydrologic ecosystem services: A case study from the Zala catchment, Hungary. Biol. Futur. 2020, 1, 3. [Google Scholar] [CrossRef]
- Decsi, B.; Ács, T.; Kozma, Z. Long-term Water Regime Studies of a Degraded Floating Fen in Hungary. Period. Polytech. Civ. Eng. 2020, 64, 951–963. [Google Scholar] [CrossRef]
- Jolánkai, Z.; Kardos, M.K.; Clement, A. Modification of the MONERIS Nutrient Emission Model for a Lowland Country (Hungary) to Support River Basin Management Planning in the Danube River Basin. Water 2020, 12, 859. [Google Scholar] [CrossRef]
- Tóth, G.; Hermann, T.; Szatmári, G.; Pásztor, L. Maps of heavy metals in the soils of the European Union and proposed priority areas for detailed assessment. Sci. Total Environ. 2016, 565, 1054–1062. [Google Scholar] [CrossRef] [PubMed]
- Pásztor, L.; Szabó, K.Z.; Szatmári, G.; Laborczi, A.; Horváth, Á. Mapping geogenic radon potential by regression kriging. Sci. Total Environ. 2016, 544, 883–891. [Google Scholar] [CrossRef] [PubMed]
- Szilassi, P.; Szatmári, G.; Pásztor, L.; Árvai, M.; Szatmári, J.; Szitár, K.; Papp, L. Understanding the Environmental Background of an Invasive Plant Species (Asclepias syriaca) for the Future: An Application of LUCAS Field Photographs and Machine Learning Algorithm Methods. Plants 2019, 8, 593. [Google Scholar] [CrossRef] [PubMed]
- Tanács, E.; Belényesi, M.; Lehoczki, R.; Pataki, R.; Petrik, O.; Standovár, T.; Pásztor, L.; Laborczi, A.; Szatmári, G.; Molnár, Z.; et al. Országos, nagyfelbontású ökoszisztéma- alaptérkép: Módszertan, validáció és felhasználási lehetőségek. Természetvédelmi Közlemények 2019, 25, 34–58. [Google Scholar] [CrossRef]
- Laborczi, A.; Bozán, C.; Körösparti, J.; Szatmári, G.; Kajári, B.; Túri, N.; Kerezsi, G.; Pásztor, L. Application of Hybrid Prediction Methods in Spatial Assessment of Inland Excess Water Hazard. ISPRS Int. J. Geo-Inf. 2020, 9, 268. [Google Scholar] [CrossRef]
- Pásztor, L.; Laborczi, A.; Takács, K.; Szatmári, G.; Fodor, N.; Illés, G.; Farkas-Iványi, K.; Bakacsi, Z.; Szabó, J. Compilation of Functional Soil Maps for the Support of Spatial Planning and Land Management in Hungary. In Soil Mapping and Process Modeling for Sustainable Land Use Management; Pereira, P., Brevik, E.C., Munoz-Rojas, M., Miller, B.A., Eds.; Elsevier Ltd.: Amsterdam, The Nethelands, 2017; pp. 293–317. [Google Scholar]
- Veronesi, F.; Schillaci, C. Comparison between geostatistical and machine learning models as predictors of topsoil organic carbon with a focus on local uncertainty estimation. Ecol. Indic. 2019, 101, 1032–1044. [Google Scholar] [CrossRef]
- Nussbaum, M.; Spiess, K.; Baltensweiler, A.; Grob, U.; Keller, A.; Greiner, L.; Schaepman, M.E.; Papritz, A. Evaluation of digital soil mapping approaches with large sets of environmental covariates. Soil Discuss. 2017, 1–32. [Google Scholar] [CrossRef]
- Szabó, B.; Szatmári, G.; Takács, K.; Laborczi, A.; Makó, A.; Rajkai, K.; Pásztor, L. Mapping soil hydraulic properties using random-forest-based pedotransfer functions and geostatistics. Hydrol. Earth Syst. Sci. 2019, 23, 2615–2635. [Google Scholar] [CrossRef]
- Keskin, H.; Grunwald, S. Regression kriging as a workhorse in the digital soil mapper’s toolbox. Geoderma 2018, 326, 22–41. [Google Scholar] [CrossRef]
- Mulder, V.L.; de Bruin, S.; Schaepman, M.E.; Mayr, T.R. The use of remote sensing in soil and terrain mapping—A review. Geoderma 2011, 162, 1–19. [Google Scholar] [CrossRef]
- Dwivedi, R.S. Remote Sensing of Soils; Springer: Berlin/Heidelberg, Germany, 2017; ISBN 9783662537404. [Google Scholar]
- Pásztor, L.; Takács, K. Remote sensing in soil mapping—A review. Agrokémia és Talajt. 2014, 63, 353–370. [Google Scholar] [CrossRef]
- Lugassi, R.; Goldshleger, N.; Chudnovsky, A. Studying Vegetation Salinity: From the Field View to a Satellite-Based Perspective. Remote Sens. 2017, 9, 122. [Google Scholar] [CrossRef]
- Dehni, A.; Lounis, M. Remote sensing techniques for salt affected soil mapping: Application to the Oran region of Algeria. Procedia Eng. 2012, 33, 188–198. [Google Scholar] [CrossRef]
- Bakacsi, Z.; Tóth, T.; Makó, A.; Barna, G.; Laborczi, A.; Szabó, J.; Szatmári, G.; Pásztor, L. National level assessment of soil salinization and structural degradation risks under irrigation. Hungarian Geogr. Bull. 2019, 68, 141–156. [Google Scholar] [CrossRef]
- Schillaci, C.; Acutis, M.; Lombardo, L.; Lipani, A.; Fantappiè, M.; Märker, M.; Saia, S. Spatio-temporal topsoil organic carbon mapping of a semi-arid Mediterranean region: The role of land use, soil texture, topographic indices and the in fl uence of remote sensing data to modelling. Sci. Total Environ. 2017, 601–602, 821–832. [Google Scholar] [CrossRef]
- Sigmond, E. Hungarian Alkali Soils and Methods of Their Reclamation; California Agricultural Experiment Station: Berkeley, CA, USA, 1927. [Google Scholar]
- Szabolcs, I. Salt-Affected Soils; CRC Press: Boca Raton, FL, USA, 1989. [Google Scholar]
- Szabolcs, I. European Solonetz Soils and Their Reclamation; Akadémia Kiadó: Budapest, Hungary, 1971. [Google Scholar]
- Tóth, T.; Szendrei, G. A hazai szikes talajok és a szikesedés valamint a sófelhalmozódási folyamatok rövid jellemzése. Topogr. Mineral. Hungariae 2006, 9, 7–20. [Google Scholar]
- Mádlné Szőnyi, J.; Simon, S.; Tóth, J.; Pogácsás, G. Connection between surface and groundwaters in the case of Kelemen-lake and Kolon-lake. Általános Földtani Szle. 2005, 30, 93–110. [Google Scholar]
- Bakacsi, Z.; Kuti, L. Agrogeological investigation on a salt affected landscape in the Danube Valley, Hungary. Agrokémia és Talajt. 1998, 47, 29–38. [Google Scholar]
- Arany, S. A hortobágyi ősi szíkes legelőkön végzett talajfelvételek. Kísérletügyi Közlemények Pallas részvénytársaság sajtója 1926, 29, 48–71. [Google Scholar]
- Magyar, P. Adatok a Hortobágy növényszociológiai és geobotanikai viszonyaihoz. Erdészeti kisérletek 1928, 30, 26–63. [Google Scholar]
- Szabolcs, I. Hortobágy Talajai; Mezőgazdasági Kiadó: Budapest, Hungary, 1954. [Google Scholar]
- Szabolcs, I. Salt-Affected Soils in Europe; Springer: Berlin/Heidelberg, Germany, 1974. [Google Scholar]
- Filep, G. Correlations between the chemical characteristics of salt-affected soils. Agrokem. es Talajt. 1999, 48, 419–430, (In Hungarian with an English summary). [Google Scholar]
- Filep, G.; Wafi, M.J.K. Calculation of the salt concentration of the soil solution and the sodium saturation of the soil (ESP) from saturation extract indices. Agrokémia és Talajt. 1993, 42, 245–256, (In Hungarian with an English summary). [Google Scholar]
- Bishop, T.F.A.; McBratney, A.B.; Laslett, G.M. Modelling soil attribute depth functions with equal-area quadratic smoothing splines. Geoderma 1999, 91, 27–45. [Google Scholar] [CrossRef]
- Pásztor, L.; Laborczi, A.; Bakacsi, Z.; Szabó, J.; Illés, G. Compilation of a national soil-type map for Hungary by sequential classification methods. Geoderma 2018, 311, 93–108. [Google Scholar] [CrossRef]
- Pásztor, L.; Szabó, J.; Bakacsi, Z. Digital processing and upgrading of legacy data collected during the 1:25 000 scale Kreybig soil survey. Acta Geod. Geophys. Hungarica 2010, 45, 127–136. [Google Scholar] [CrossRef]
- Bashfield, A.; Keim, A. Continent-wide DEM Creation for the European Union. In Proceedings of the 34th International Symposium on Remote Sensing of Environment—The GEOSS Era: Towards Operational Environmental Monitoring, Sydney, Australia, 10–15 April 2011. [Google Scholar]
- Bakacsi, Z.; Laborczi, A.; Szabó, J.; Takács, K.; Pásztor, L. Az 1:100 000-es földtani térkép jelkulcsának és a FAO rendszer talajképző kőzet kódrendszerének javasolt megfeleltetése. Agrokémia és Talajt. 2014, 63, 189–202. [Google Scholar] [CrossRef]
- Pásztor, L.; Szabó, J.; Bakacsi, Z. Application of the Digital Kreybig Soil Information System for the delineation of naturally handicapped areas in Hungary. Agrokémia és Talajt. 2010, 59, 47–56. [Google Scholar] [CrossRef]
- Conrad, O.; Bechtel, B.; Bock, M.; Dietrich, H.; Fischer, E.; Gerlitz, L.; Wehberg, J.; Wichmann, V.; Böhner, J. System for Automated Geoscientific Analyses (SAGA) v. 2.1.4. Geosci. Model Dev. 2015, 8, 1991–2007. [Google Scholar] [CrossRef]
- Breiman, L. Random forests. Mach. Learn. 2001, 45, 5–32. [Google Scholar] [CrossRef]
- Gudmann, A.; Csikós, N.; Szilassi, P.; Mucsi, L. Improvement in Satellite Image-Based Land Cover Classification with Landscape Metrics. Remote Sens. 2020, 12, 3580. [Google Scholar] [CrossRef]
- Szabó, Z.C.; Mikita, T.; Négyesi, G.; Gyöngyi Varga, O.; Burai, P.; Takács-Szilágyi, L.; Szabó, S. Uncertainty and Overfitting in Fluvial Landform Classification Using Laser Scanned Data and Machine Learning: A Comparison of Pixel and Object-Based Approaches. Remote Sens. 2020, 12, 3652. [Google Scholar] [CrossRef]
- Phinzi, K.; Abriha, D.; Bertalan, L.; Holb, I.; Szabó, S. Machine Learning for Gully Feature Extraction Based on a Pan-Sharpened Multispectral Image: Multiclass vs. Binary Approach. ISPRS Int. J. Geo-Information 2020, 9, 252. [Google Scholar] [CrossRef]
- Hengl, T.; Leenaars, J.G.B.; Shepherd, K.D.; Walsh, M.G.; Heuvelink, G.B.M.; Mamo, T.; Tilahun, H.; Berkhout, E.; Cooper, M.; Fegraus, E.; et al. Soil nutrient maps of Sub-Saharan Africa: Assessment of soil nutrient content at 250 m spatial resolution using machine learning. Nutr. Cycl. Agroecosystems 2017, 109, 77–102. [Google Scholar] [CrossRef]
- Hengl, T.; Heuvelink, G.B.M.; Kempen, B.; Leenaars, J.G.B.; Walsh, M.G.; Shepherd, K.D.; Sila, A.; MacMillan, R.A.; De Jesus, J.M.; Tamene, L.; et al. Mapping soil properties of Africa at 250 m resolution: Random forests significantly improve current predictions. PLoS ONE 2015, 10, 1–26. [Google Scholar] [CrossRef]
- Goovaerts, P. Geostatistics for Natural Resources Evaluation; Oxford University Press: Oxford, UK, 1997; ISBN 9780195115383. [Google Scholar]
- Webster, R.; Oliver, M.A. Geostatistics for Environmental Scientists, 2nd ed.; Wiley: Hoboken, NJ, USA, 2007; ISBN 0470028580. [Google Scholar]
- Heuvelink, G. Uncertainty quantification of GlobalSoilMap products. In GlobalSoilMap; CRC Press: Boca Raton, FL, USA, 2014; pp. 335–340. [Google Scholar]
- Chilès, J.-P.; Delfiner, P. Geostatistics: Modeling Spatial Uncertainty: Second Edition, 2nd ed.; Wiley Blackwell: Hoboken, NJ, USA, 2012; ISBN 9780470183151. [Google Scholar]
- Szatmári, G.; Pásztor, L. Comparison of various uncertainty modelling approaches based on geostatistics and machine learning algorithms. Geoderma 2019, 337, 1329–1340. [Google Scholar] [CrossRef]
- Heuvelink, G.B.M. Uncertainty and Uncertainty Propagation in Soil Mapping and Modelling. In Pedometrics; McBratney, A.B., Minasny, B., Stockmann, U., Eds.; Springer International Publishing: Berlin/Heidelberg, Germany, 2018; pp. 439–461. [Google Scholar]
- Shannon, C.E. A mathematical theory of communication. Bell Syst. Tech. J. 1948, 27, 379–423. [Google Scholar] [CrossRef]
- Lin, L.I.-K. A Concordance Correlation Coefficient to Evaluate Reproducibility. Biometrics 1989, 45, 255. [Google Scholar] [CrossRef]
- Nash, J.E.; Sutcliffe, J.V. River flow forecasting through conceptual models part I—A discussion of principles. J. Hydrol. 1970, 10, 282–290. [Google Scholar] [CrossRef]
- Deutsch, C.V. Direct assessment of local accuracy and precision. In Geostatstics Wollongong ’96; Baafi, E.Y., Schofield, N.A., Eds.; Kluwer Academic Publishers: Amsterdam, The Netherlands, 1997; pp. 115–125. [Google Scholar]
- Molnár, S.; Bakacsi, Z.; Balog, K.; Bolla, B.; Tóth, T. Evolution of a salt-affected lake under changing environmental conditions in Danube-Tisza interfluve. Carpathian J. Earth Environ. Sci. 2019, 14, 77–82. [Google Scholar] [CrossRef]
- Manchuk, J.G.; Leuangthong, O.; Deutsch, C.V. The proportional effect. Math. Geosci. 2009, 41, 799–816. [Google Scholar] [CrossRef]
- Stefanovits, P. Magyarország Talajai, 2nd ed.; Akadémia Kiadó: Budapest, Hungary, 1963. [Google Scholar]
- Tóth, T.; Kovács, Z.A.; Rékási, M. XRF-measured rubidium concentration is the best predictor variable for estimating the soil clay content and salinity of semi-humid soils in two catenas. Geoderma 2019, 342, 106–108. [Google Scholar] [CrossRef]
- Breiman, L. Statistical Modeling: The Two Cultures. Stat. Sci. 2001, 16, 199–231. [Google Scholar] [CrossRef]
- Wadoux, A.M.J.-C.; Minasny, B.; McBratney, A.B. Machine learning for digital soil mapping: Applications, challenges and suggested solutions. Earth Sci. Rev. 2020, 210, 103359. [Google Scholar] [CrossRef]
- Barredo Arrieta, A.; Díaz-Rodríguez, N.; Del Ser, J.; Bennetot, A.; Tabik, S.; Barbado, A.; Garcia, S.; Gil-Lopez, S.; Molina, D.; Benjamins, R.; et al. Explainable Artificial Intelligence (XAI): Concepts, taxonomies, opportunities and challenges toward responsible AI. Inf. Fusion 2020, 58, 82–115. [Google Scholar] [CrossRef]
- Tziolas, N.; Tsakiridis, N.; Ben-Dor, E.; Theocharis, J.; Zalidis, G. Employing a multi-input deep convolutional neural network to derive soil clay content from a synergy of multi-temporal optical and radar imagery data. Remote Sens. 2020, 12. [Google Scholar] [CrossRef]
- Csillag, F.; Pásztor, L.; Biehl, L.L. Spectral band selection for the characterization of salinity status of soils. Remote Sens. Environ. 1993, 43, 231–242. [Google Scholar] [CrossRef]
- Kertész, M.; Csillag, F. Kummert Optimal tiling of heterogeneous images. Int. J. Remote Sens. 1995, 16, 1397–1415. [Google Scholar] [CrossRef]
- Tóth, T.; Csillag, F.; Biehl, L.L.; Michéli, E. Characterization of semivegetated salt-affected soils by means of field remote sensing. Remote Sens. Environ. 1991, 37, 167–180. [Google Scholar] [CrossRef]
- Tóth, T.; Kertész, M. Application of soil-vegetation correlation to optimal resolution mapping of solonetzic rangeland. Arid Soil Res. Rehabil. 1996, 10, 1–12. [Google Scholar] [CrossRef]
- Wackernagel, H. Multivariate Geostatistics; Springer: Berlin/Heidelberg, Germany, 2003. [Google Scholar]
- Cressie, N.A.C. Statistics for Spatial Data; Wiley: Hoboken, NJ, USA, 1993. [Google Scholar]


| SAS Indicator | Formula | Reference |
|---|---|---|
| EC [dS·m−1] | Filep [43] | |
| ESP [%] | Filep and Wafi [44] |
| SAS Indicator | Depth | Min | Max | Mean | Median | SD | Skewness |
|---|---|---|---|---|---|---|---|
| pH [-] | 0–30 cm | 3.740 | 10.406 | 6.917 | 7.216 | 1.085 | −0.594 |
| 30–100 cm | 4.234 | 10.420 | 7.463 | 7.792 | 0.997 | −0.739 | |
| EC [dS·m−1] | 0–30 cm | 0.012 | 25.865 | 0.896 | 0.444 | 1.490 | 6.983 |
| 30–100 cm | 0.012 | 25.767 | 1.003 | 0.470 | 1.713 | 5.631 | |
| ESP [%] | 0–30 cm | 0.001 | 67.091 | 0.705 | 0.011 | 3.828 | 10.340 |
| 30–100 cm | 0.001 | 67.651 | 3.064 | 0.435 | 6.658 | 4.248 |
| Factors | Covariates | Reference or Source |
|---|---|---|
| Soil, soil surface | Soil type | Pásztor et al. [46] |
| DKSIS, chemical properties of soils | Pásztor et al. [47,50] | |
| Brightness index | Sentinel-2 | |
| Normalized difference salinity index | Sentinel-2 | |
| Normalized difference salinity index 2 | Sentinel-2 | |
| Salinity index 5 | Sentinel-2 | |
| Salinity ratio | Sentinel-2 | |
| Climate | Long-term mean annual evaporation | OMSZ |
| Long-term mean annual evapotranspiration | OMSZ | |
| Long-term mean annual precipitation | OMSZ | |
| Long-term mean annual temperature | OMSZ | |
| Organisms | CORINE Land Cover | CLC project |
| Normalized difference vegetation index | Sentinel-2 | |
| Soil adjusted vegetation index | Sentinel-2 | |
| Vegetation soil salinity index | Sentinel-2 | |
| Topography | Altitude | DEM |
| Channel network base level | DEM | |
| Diurnal anisotropic heating | DEM | |
| Horizontal distance to channel network | DEM | |
| LS factor | DEM | |
| Mass balance index | DEM | |
| Multiresolution ridge top flatness | DEM | |
| Multiresolution valley bottom flatness | DEM | |
| Multi-scale topographic position index | DEM | |
| Profile curvature | DEM | |
| SAGA wetness index | DEM | |
| Slope | DEM | |
| Stream power index | DEM | |
| Surface area | DEM | |
| Terrain ruggedness index | DEM | |
| Topographic position index | DEM | |
| Topographic wetness index | DEM | |
| Total curvature | DEM | |
| Vertical distance to channel network | DEM | |
| Geology | Parent material | Bakacsi et al. [49] |
| Indices | Abbreviation | Formula |
|---|---|---|
| Brightness index | BI | |
| Normalized difference salinity index | NDSI | |
| Salinity index 5 | SI-5 | |
| Salinity ratio | SR | |
| Normalized difference vegetation index | NDVI | |
| Soil adjusted vegetation index | SAVI | |
| Vegetation soil salinity index | VSSI |
| Severity Classes for EC | EC [dS·m−1] | Severity Classes for ESP | ESP [%] |
|---|---|---|---|
| None | <0.75 | None | <15.00 |
| Slight salinity | 0.75–2.00 | Slight sodicity | 15.00–30.00 |
| Moderate salinity | 2.00–4.00 | Moderate sodicity | 30.00–50.00 |
| Strong salinity | 4.00–8.00 | Strong sodicity | 50.00–70.00 |
| Very strong salinity | 8.00–15.00 | Extreme sodicity | >70.00 |
| Extreme salinity | >15.00 |
| SAS Indicators | Depth | ME | RMSE | CCC | NSE |
|---|---|---|---|---|---|
| pH | 0–30 cm | <0.001 | 0.744 | 0.692 | 0.528 |
| 30–100 cm | −0.004 | 0.613 | 0.764 | 0.621 | |
| EC | 0–30 cm | 0.006 | 1.370 | 0.642 | 0.426 |
| 30–100 cm | 0.001 | 1.251 | 0.708 | 0.524 | |
| ESP | 0–30 cm | −0.017 | 2.255 | 0.531 | 0.333 |
| 30–100 cm | −0.015 | 2.987 | 0.593 | 0.383 |
Publisher’s Note: MDPI stays neutral with regard to jurisdictional claims in published maps and institutional affiliations. |
© 2020 by the authors. Licensee MDPI, Basel, Switzerland. This article is an open access article distributed under the terms and conditions of the Creative Commons Attribution (CC BY) license (http://creativecommons.org/licenses/by/4.0/).
Share and Cite
Szatmári, G.; Bakacsi, Z.; Laborczi, A.; Petrik, O.; Pataki, R.; Tóth, T.; Pásztor, L. Elaborating Hungarian Segment of the Global Map of Salt-Affected Soils (GSSmap): National Contribution to an International Initiative. Remote Sens. 2020, 12, 4073. https://doi.org/10.3390/rs12244073
Szatmári G, Bakacsi Z, Laborczi A, Petrik O, Pataki R, Tóth T, Pásztor L. Elaborating Hungarian Segment of the Global Map of Salt-Affected Soils (GSSmap): National Contribution to an International Initiative. Remote Sensing. 2020; 12(24):4073. https://doi.org/10.3390/rs12244073
Chicago/Turabian StyleSzatmári, Gábor, Zsófia Bakacsi, Annamária Laborczi, Ottó Petrik, Róbert Pataki, Tibor Tóth, and László Pásztor. 2020. "Elaborating Hungarian Segment of the Global Map of Salt-Affected Soils (GSSmap): National Contribution to an International Initiative" Remote Sensing 12, no. 24: 4073. https://doi.org/10.3390/rs12244073
APA StyleSzatmári, G., Bakacsi, Z., Laborczi, A., Petrik, O., Pataki, R., Tóth, T., & Pásztor, L. (2020). Elaborating Hungarian Segment of the Global Map of Salt-Affected Soils (GSSmap): National Contribution to an International Initiative. Remote Sensing, 12(24), 4073. https://doi.org/10.3390/rs12244073