Article

Monitoring Land Surface Temperature Change with Landsat Images during Dry Seasons in Bac Binh, Vietnam

1
State Key Laboratory of Information Engineering in Surveying, Mapping and Remote Sensing, Wuhan University, 129 Luoyu Road, Wuhan 430079, China
2
School of Remote Sensing and Information Engineering, Wuhan University, 129 Luoyu Road, Wuhan 430079, China
3
Hubei Province Engineering Center for Intelligent Geoprocessing, 129 Luoyu Road, Wuhan 430079, China
4
German Aerospace Center (DLR), Earth Observation Center (EOC), Muenchener Strasse 20, 82234 Wessling, Germany
*
Author to whom correspondence should be addressed.
Remote Sens. 2020, 12(24), 4067; https://doi.org/10.3390/rs12244067
Submission received: 31 October 2020 / Revised: 30 November 2020 / Accepted: 7 December 2020 / Published: 11 December 2020
(This article belongs to the Special Issue Understanding Urban Systems Using Remote Sensing)

Abstract

:
Global warming-induced climate change evolved to be one of the most important research topics in Earth System Sciences, where remote sensing-based methods have shown great potential for detecting spatial temperature changes. This study utilized a time series of Landsat images to investigate the Land Surface Temperature (LST) of dry seasons between 1989 and 2019 in the Bac Binh district, Binh Thuan province, Vietnam. Our study aims to monitor LST change, and its relationship to land-cover change during the last 30 years. The results for the study area show that the share of Green Vegetation coverage has decreased rapidly for the dry season in recent years. The area covered by vegetation shrank between 1989 and 2019 by 29.44%. Our findings show that the LST increase and decrease trend is clearly related to the change of the main land-cover classes, namely Bare Land and Green Vegetation. For the same period, we find an average increase of absolute mean LST of 0.03 °C per year for over thirty years across all land-cover classes. For the dry season in 2005, the LST was extraordinarily high and the area with a LST exceeding 40 °C covered 64.10% of the total area. We expect that methodological approach and the findings can be applied to study change in LST, land-cover, and can contribute to climate change monitoring and forecasting of impacts in comparable regions.

Graphical Abstract

1. Introduction

According to the Intergovernmental Panel on Climate Change (IPCC) 2018 “Special Report Global Warming of 1.5 °C”, climate change is occurring at a faster rate in recent years [1]. The Earth is warming and climate change causes negative impacts across the globe, including Vietnam. The Bac Binh district is a region in Vietnam, which is undergoing urbanization processes, accompanied by increasing tourism and socio-economic development. These trends come along with land-cover changes and land-use conflicts, resulting in a reduction of natural vegetation and the increase land used for infrastructure, settlement and industry, as well as agriculture and aquaculture. Climate change, along with urbanization, causes severe impacts in Vietnam, like the intensification and durations of floods and droughts. These heat-related changes put ecosystems under stress and affect the wellbeing of the local population with extreme heat events [2,3,4,5,6].
Land Surface Temperature (LST) is one of the most important climate variables and is crucial for the determination of the radiative energy budget of the Earth’s surface [7]. It can describe processes such as the heat flux between land surface and the atmosphere and is therefore a valuable indicator for climate change [8]. LST also complements near surface air-temperature data and spatial in nature, thus contributing to the Sustainable Development Goal 13, Climate Action [9]. Many studies have proven the suitability of medium- to high-resolution satellite imagery to retrieve area-wide LST [10,11,12,13,14]. Most of these studies use Landsat images for LST time series analysis to derive trends and understand climate change and urbanization effects [15,16,17]. Using only LST values from a single Landsat scene to represent one season or one whole year shows some limitation of the LST value representativeness due the local daily temperature fluctuation. To overcome this, we used all the available dry season Landsat images for each year to ensure that the derived average LST better represents the year in the trend of the 30-year study period.
While many studies have been conducted on various LST trends, there are currently few LST studies done in Vietnam. Thanh Hoan et al. [18] compared land-use types and the LST derived from a single image acquisition to understand the urban heat island effect of Hanoi city. Another work has been undertaken for the city of Can Tho in the Mekong Delta [19] using Landsat image to monitor the temperature difference between urban and suburban areas from 1996 to 2016. Several other studies have used MODIS satellite imagery for LST value extraction [20,21,22,23]. MODIS product come with a large scene coverage and a relative low spatial resolution and is therefore suitable for large study areas. For the proposed study with a focus on the Bac Binh district, we utilize a Landsat time series dataset with higher spatial resolution compared to MODIS in order to achieve a higher level of detail for the LST information. We monitor the extent of four land-cover types (Bare Land, Green Vegetation, Water Bodies, Built-up Area), and the respective ranges of LST during the last 30 years. Using the Landsat archive, we can extend our study period to 30 years, back to 1989, which is important for monitoring temperature-related phenomena.
There is only one meteorological station in the surroundings of the study area that provides air temperature measurements, therefore satellite images are a useful source of data for studying the LST patterns, land-cover change and effects of climate change in the area. The proposed approach exemplifies and discusses how to use Landsat image for LST monitoring in an area with a limited number of meteorological stations. The Landsat-derived LST is verified by MODIS-derived LST as well as the in-situ data from the nearby meteorological station.
The monitoring of LST aids the understanding of the local climate settings and trends, which are important for the development of mitigation and adaptation measures for sustainability in the Bac Binh district. The focus of this study is monitoring change in four land-cover types (Bare Land, Green Vegetation, Water Bodies, Built-up Area), LST change, and the interrelation between LST and land-cover during thirty years in Bac Binh. This approach can be used for climate change research, natural resource management, and it can be applied to comparable regions.

2. Study Area and Data

2.1. Study Area

The Bac Binh district, Binh Thuan province is located in the south central coastal region of Vietnam (Figure 1), with an area of 1825 km2 and a population of more than 129,374 in 2019 [24]. Cho Lau and Luong Son are two small towns of this rural district. Its topography is hilly with an average altitude of 200 m and slopes below 8° to the west and plain sandy coastal area to the east. Bac Binh’s climate is characterized by two seasons: the dry season (from November to April) and the rainy season (from May to October). The average total precipitation in the dry season in the south-central coastal region of Vietnam is very low (below 50 mm for 6 months of dry season). January and February are the driest months that may have 0 mm rainfall [25].
In recent years, the study area has undergone rapid socio-economic development [26,27]. Population growth, urban expansion, and the changes in land-cover and the increases in temperature have been creating negative effects on the environment and affecting people’s health and quality of life.

2.2. Data

This study uses Landsat imagery acquired from the United States Geological Survey (USGS) between 1989 and 2019 to derive the LST and land-cover for the Bac Binh area [28]. The dataset is comprised of three generations of Landsat sensors: Landsat TM, Landsat ETM+, and Landsat OLI TIRS. The Landsat Level 1T products are ortho-corrected [29,30,31] and have a spatial resolution of 30 m for the multispectral bands. Thermal infrared bands used in the study are Band 6 for Landsat TM and Landsat ETM+ (spatial resolution of 120 m), and Band 10 for Landsat OLI TIRS (spatial resolution of 100 m). Multiple Landsat images are used for the derivation of land-cover and LST during dry season in the study area in each year of observation (Table 1). The selected images are cloud-free scenes, with the scanning time between around 10:30 a.m to 11:30 a.m local time. In addition, MODIS-LST (Day-time MOD11A2) products from 2001 to 2019 were acquired and used for comparison and evaluation of the Landsat-derived LST results [32,33,34]. The MOD11A2 LST product has a temporal resolution of eight days and a spatial resolution of 1 km.

3. Methodology

Prior to the extraction of LST from the thermal infrared spectral band of the Landsat imagery, we applied the Fast Line-of-sight Atmospheric Analysis of Spectral Hypercubes (FLAASH) algorithm for the atmospheric correction of all Landsat images [35,36,37]. In this study, the LST calculation using Landsat images is based on the radiative transfer equation method, with the emissivity value derived through the NDVI. The process of extracting LST is illustrated in Figure 2.
LST is calculated following Equation (1) [38,39,40,41]:
LST = T B 1 + λ T B ρ l n ε
where LST is the land surface temperature in K. The LST value in K is converted in degrees Celsius (by subtracting 273.15) for the results and discussion sections of this study; T B is the brightness temperature in K; λ is wavelength of the emitted radiance (For Landsat TM, λ = 11.457 μm. For Landsat ETM+, λ = 11.269 μm. For Landsat OLI TIRS, λ = 10.904 μm); ρ = (h*c)/σ = 1.438 * 10−2 mK; σ is the Boltzmann constant (1.38 × 10⁻²³ J/K); h is the Planck’s constant (6.26 × 10⁻³⁴ JS); c is the velocity of light (2.998 × 10⁸ m/s); ε is the land surface emissivity (LSE). To calculate the LST from Equation (1), it is necessary to derive T B and ε.

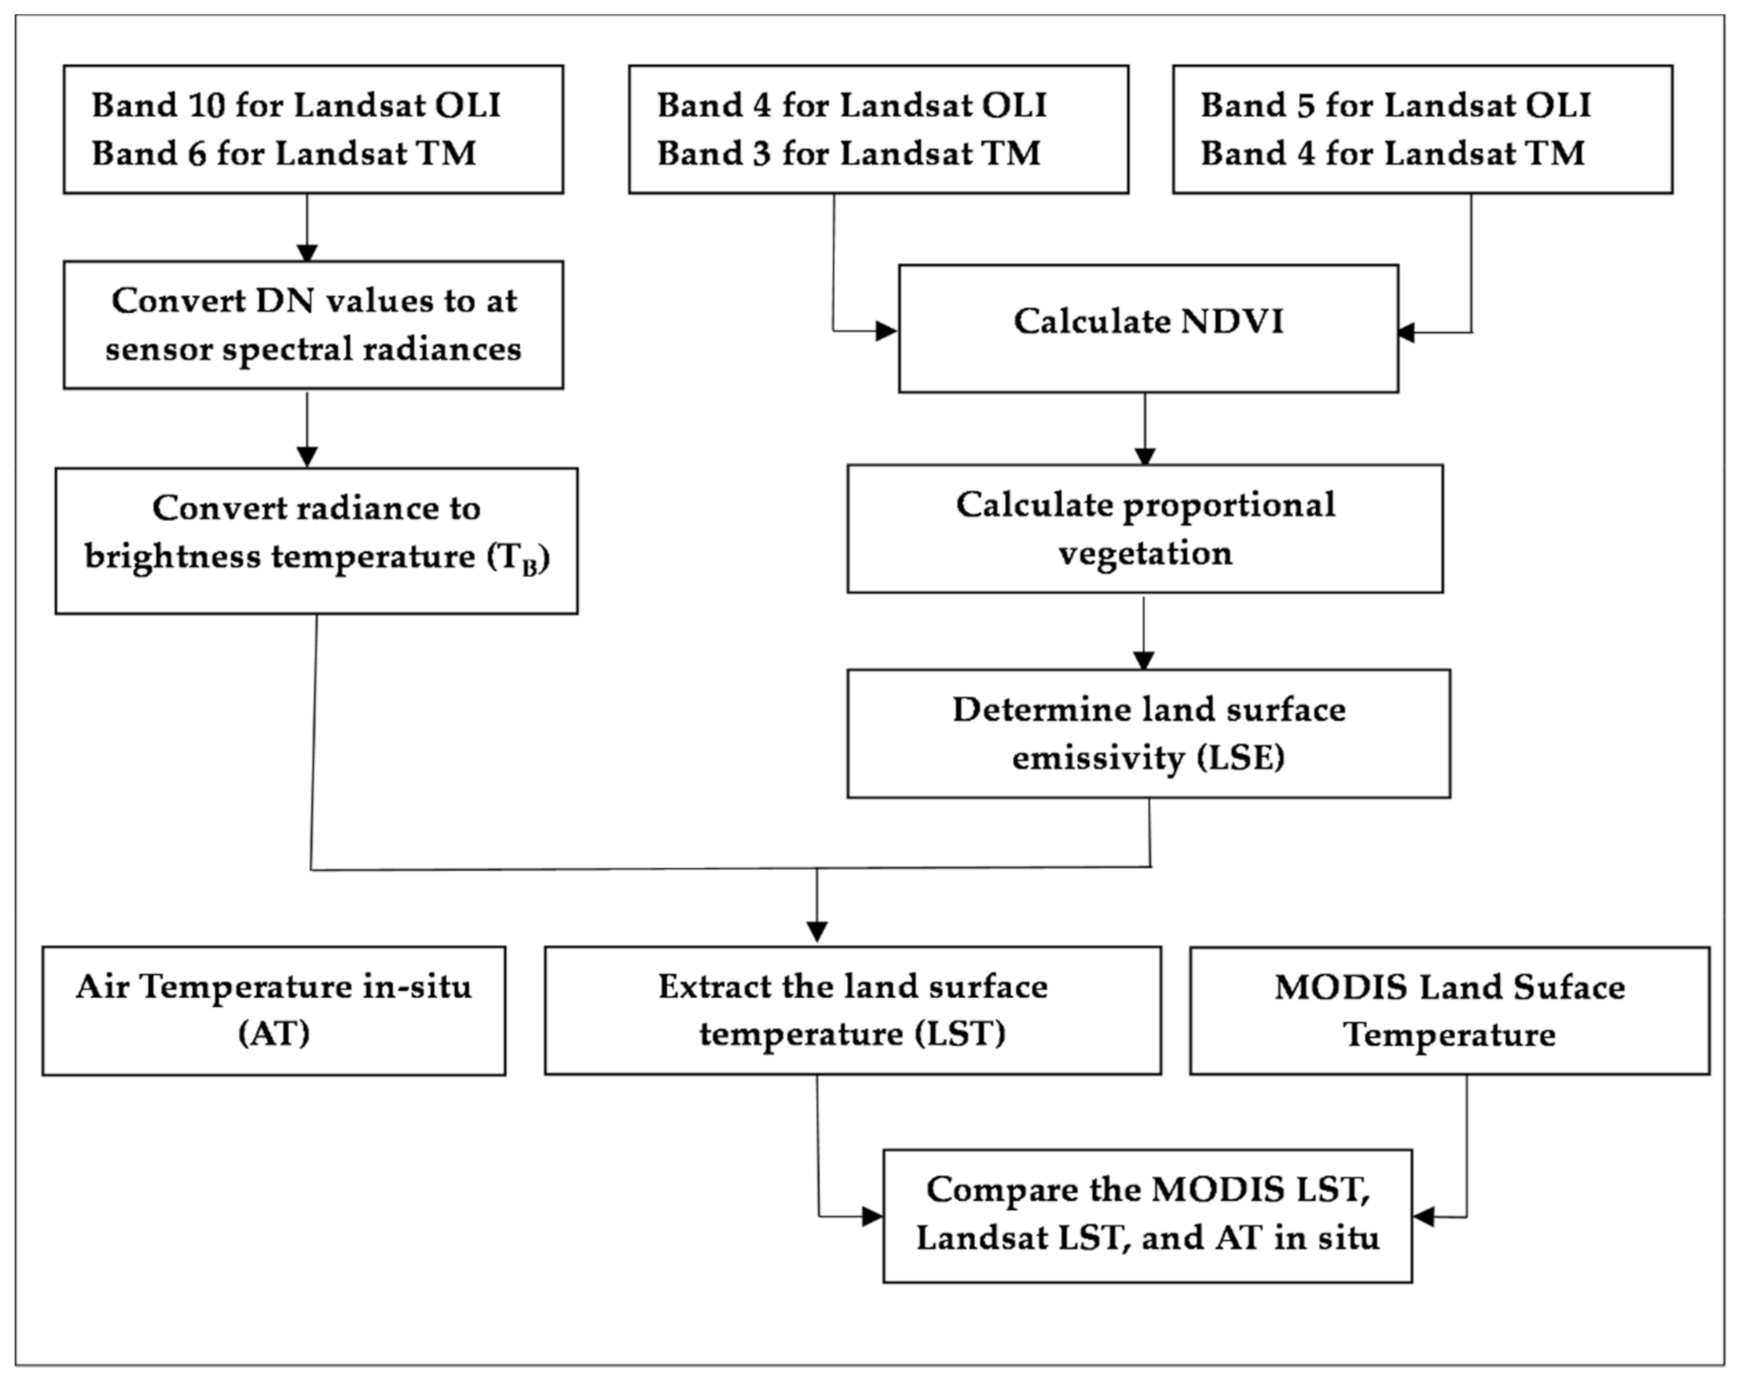
3.1. Extract the Brightness Temperature Value ( T B )

The brightness temperature, TB, can be calculating using Equations (2) and (3):
T B = K 2 l n K 1 L λ + 1
where L λ is the spectral radiance and K 1 and K 2 are constants. For Landsat TM, K 1 = 607.76, K 2 = 1260.56. For Landsat ETM+, K 1 = 666.09, K 2 = 1282.71. For Landsat OLI TIRS, K 1 = 774.88, K 2 = 1321.07.
To extract T B value, it is necessary to convert the digital number value (DN) of the image to L λ . To process multi-temporal Landsat image for the study area, the conversion for Landsat TM, Landsat ETM+, Landsat OLI TIRS images is carried out using Equations (3)–(5), respectively [42,43,44]:
For Landsat TM the value is calculated using band 6 applying Equation [45]:
L λ = G r e s c a l e · D N + B r e s c a l e
where Grescale = 0.0551584 (Wm2sr1 μm1)/ D N , and Brescale = 1.2378 (Wm2sr1 μm1)/ D N .
For Landsat ETM+ the value is calculated using band 6 applying Equation [46]:
L λ = L λ m a x L λ m i n Q c a l m a x Q c a l m i n Q c a l Q c a l m i n + L λ m i n
where Q c a l is the quantized calibrated pixel value in (DN); Q c a l m i n is the minimum quantized calibrate pixel value corresponding to L λ m i n and Q c a l m a x is the maximum quantized calibrate pixel value corresponding to L λ m a x ; L λ m i n is the minimum spectral radiance scale to Q c a l m i n value in (Wm2sr1 μm1), and L λ m a x is the maximum spectral radiance scale to Q c a l m a x value in (Wm2sr1 μm1).
For Landsat OLI TIRS the value is calculated using band 10 applying Equation [47]:
L λ = M L Q c a l + A L
where M L and A L are provided conversion factors, and Q c a l is the quantized calibrated pixel value.

3.2. Extract of LSE Value

The LSE can be extracted from remote sensing image based on land-cover or vegetation index. The use of NDVI is more advantageous as it can calculate the emission at the pixel level. The emission and spectral reflectance can be measured to find the empirical relationship between LSE and NDVI using Equation (6) [48,49,50]:
ε = 1.0094 + 0.047 l n N D V I
However, Equation (6) is only effective for a homogeneous land-cover area, for example, an area of healthy vegetation only or bare land-cover only. In this study, project area is classified into four land-cover types: (1) Water Bodies, (2) Bare Land, (3) Green Vegetation, and (4) Built-up Area. We used Equation (7) to calculate the respective LSE [51]:
ε = ε v p v + ε s 1 p v
where ε v is the LSE for the land-cover class Green Vegetation area, ε s is the LSE for Bare Land, and p v is the share of Green Vegetation per pixel with values from 0 to 1. p v is calculated by relating the NDVI values of Bare Land and Green Vegetation with the ratio shown in Equation (8) [34,52,53,54]:
p v = N D V I N D V I b N D V I v N D V I b 2
where N D V I b and N D V I v are N D V I for Bare Land and Green Vegetation, respectively. The N D V I is derived applying Equation (9):
N D V I = N I R R E D N I R + R E D
where N I R and R E D are pixel values in near infrared and red bands on the image, respectively. For Landsat TM: band 3 is red, and band 4 is near infrared. For Landsat ETM+: band 3 is red, and band 4 is near infrared. For Landsat OLI TIRS: band 4 is red, and band 5 is near infrared. For N D V I values <   N D V I b , p v is set to 0. For N D V I values > N D V I v p v is set to 1 [13,55].

3.3. Extract of LST from MODIS Images and Comparison with Landsat-Derived LST

Google Earth Engine (GEE) was used to access LST from the MOD11A2 products during the dry seasons between the years 2001 and 2019. For the conversion from a DN value to degrees Celsius value, the following equation was applied:
LST = D N 0.02 273.15
where LST is the Land Surface Temperature in degrees Celsius and 0.02 is the scale factor of the MODIS LST product [56]. We calculated the mean LST value of all pixels in the study area of each selected MODIS scene. Again, the mean LST values of all the scenes of each dry season is combined into dry season mean LST value that represents each year in the chain of thirty years in our study. This MODIS-derived LST results are used to evaluate the Landsat LST results.

4. Results

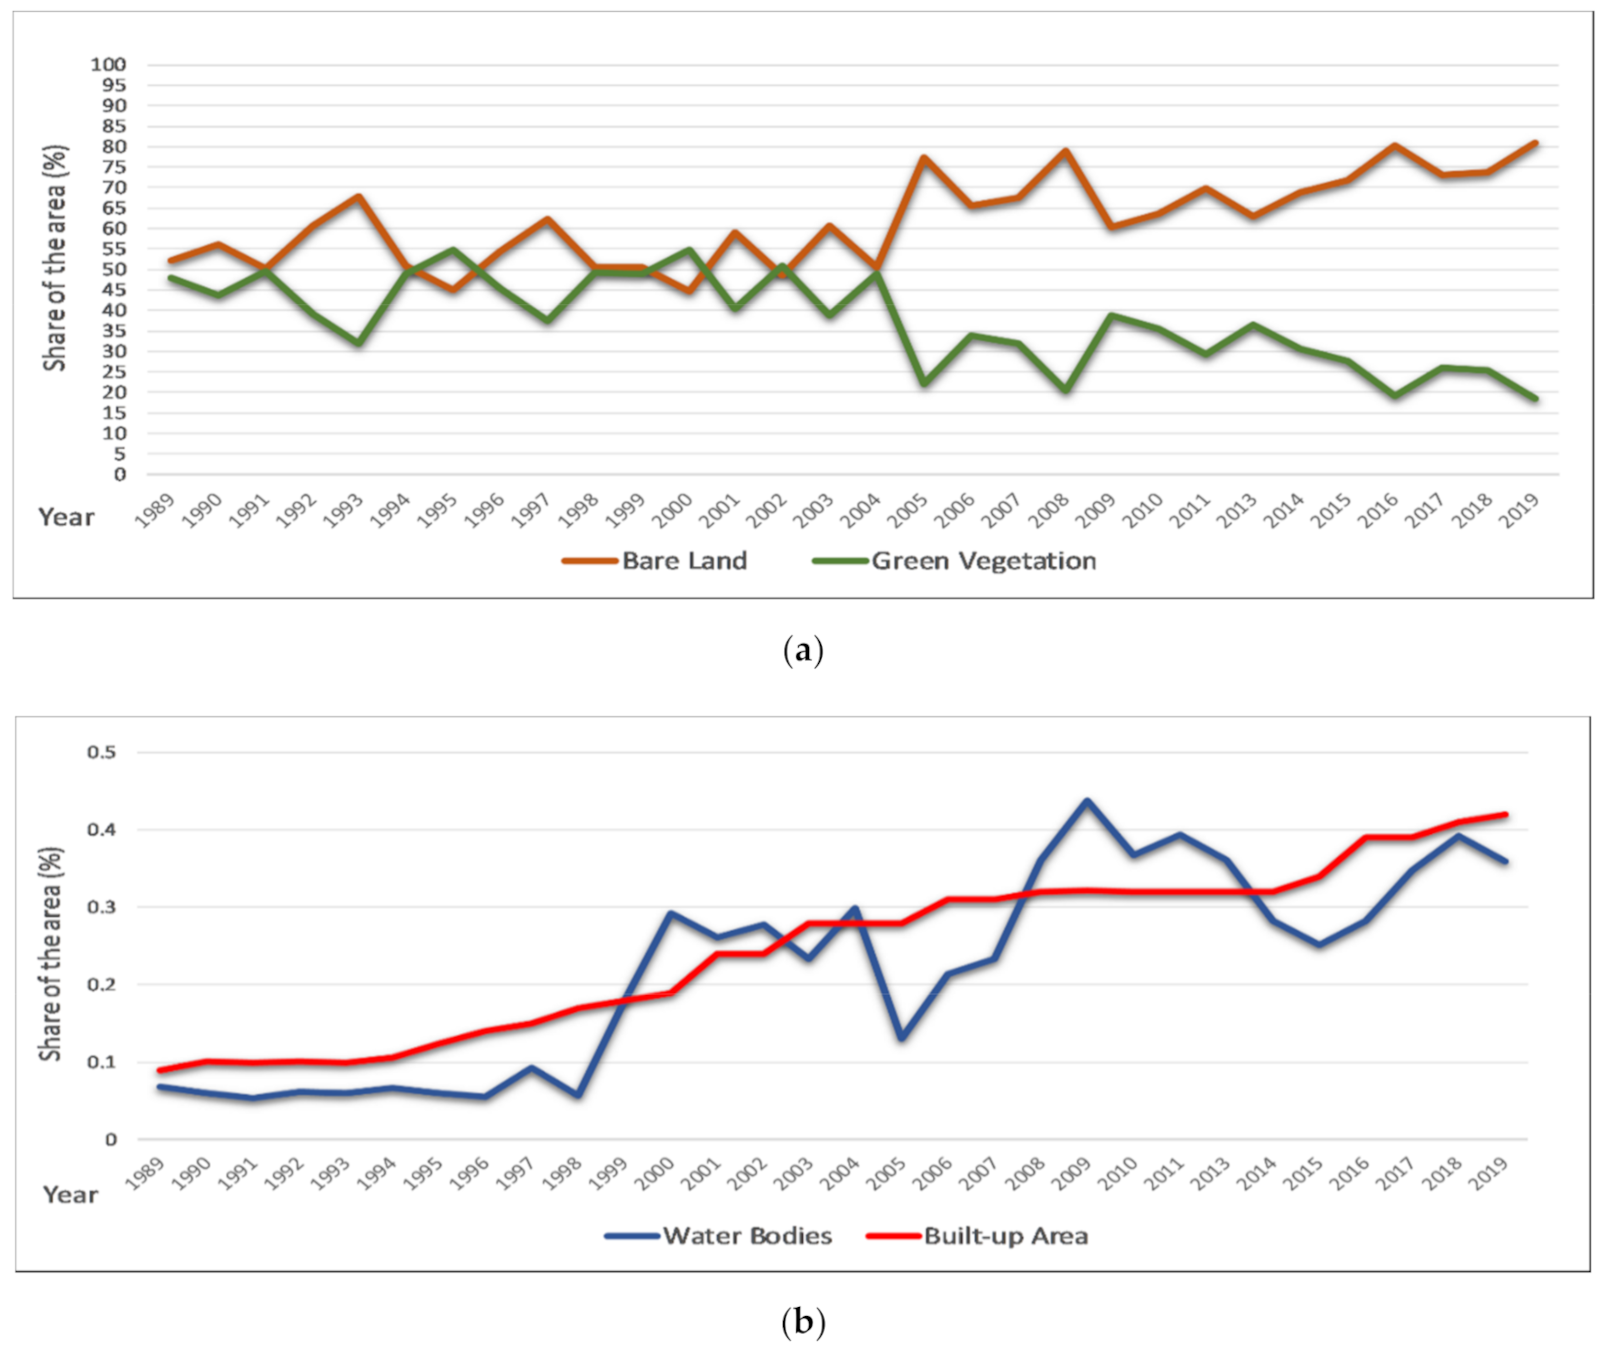
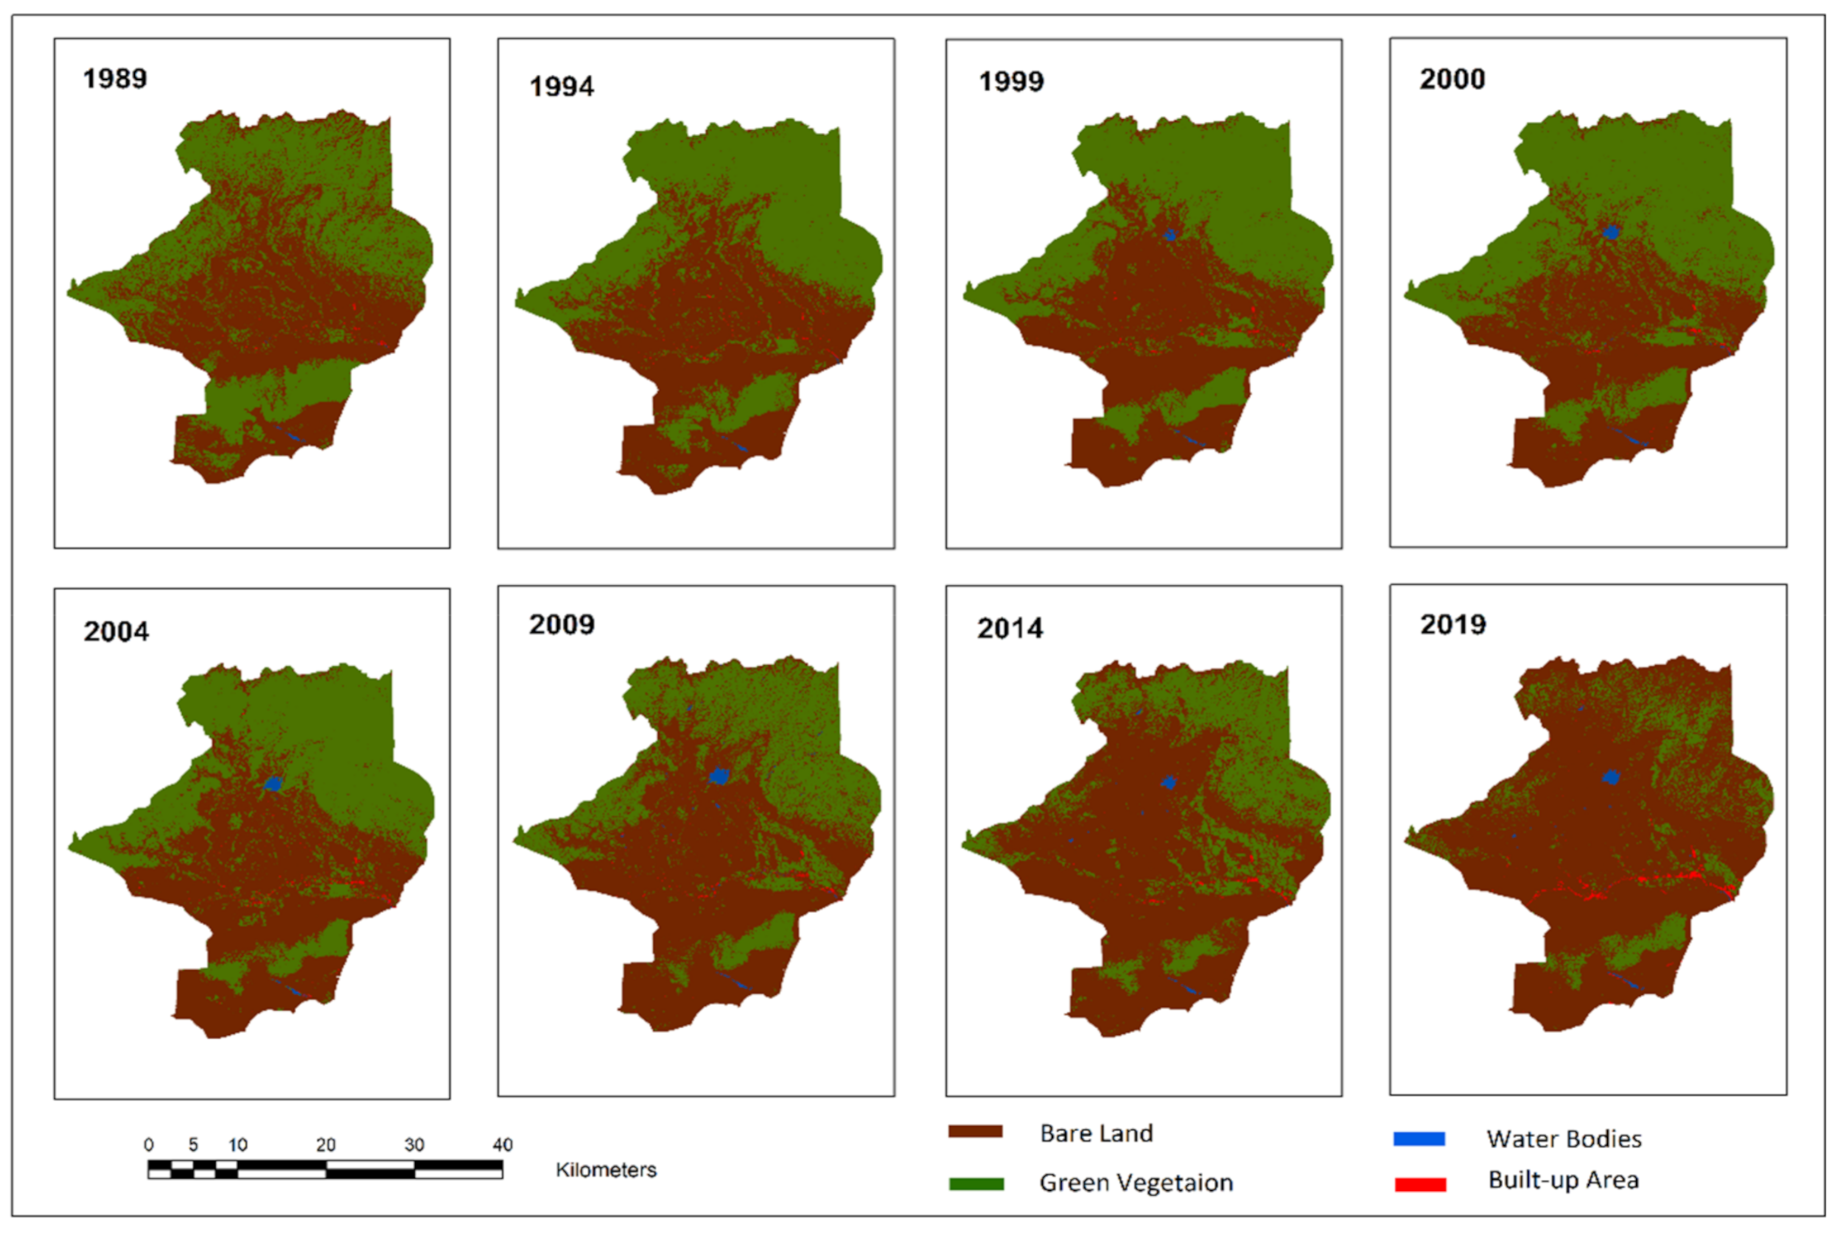
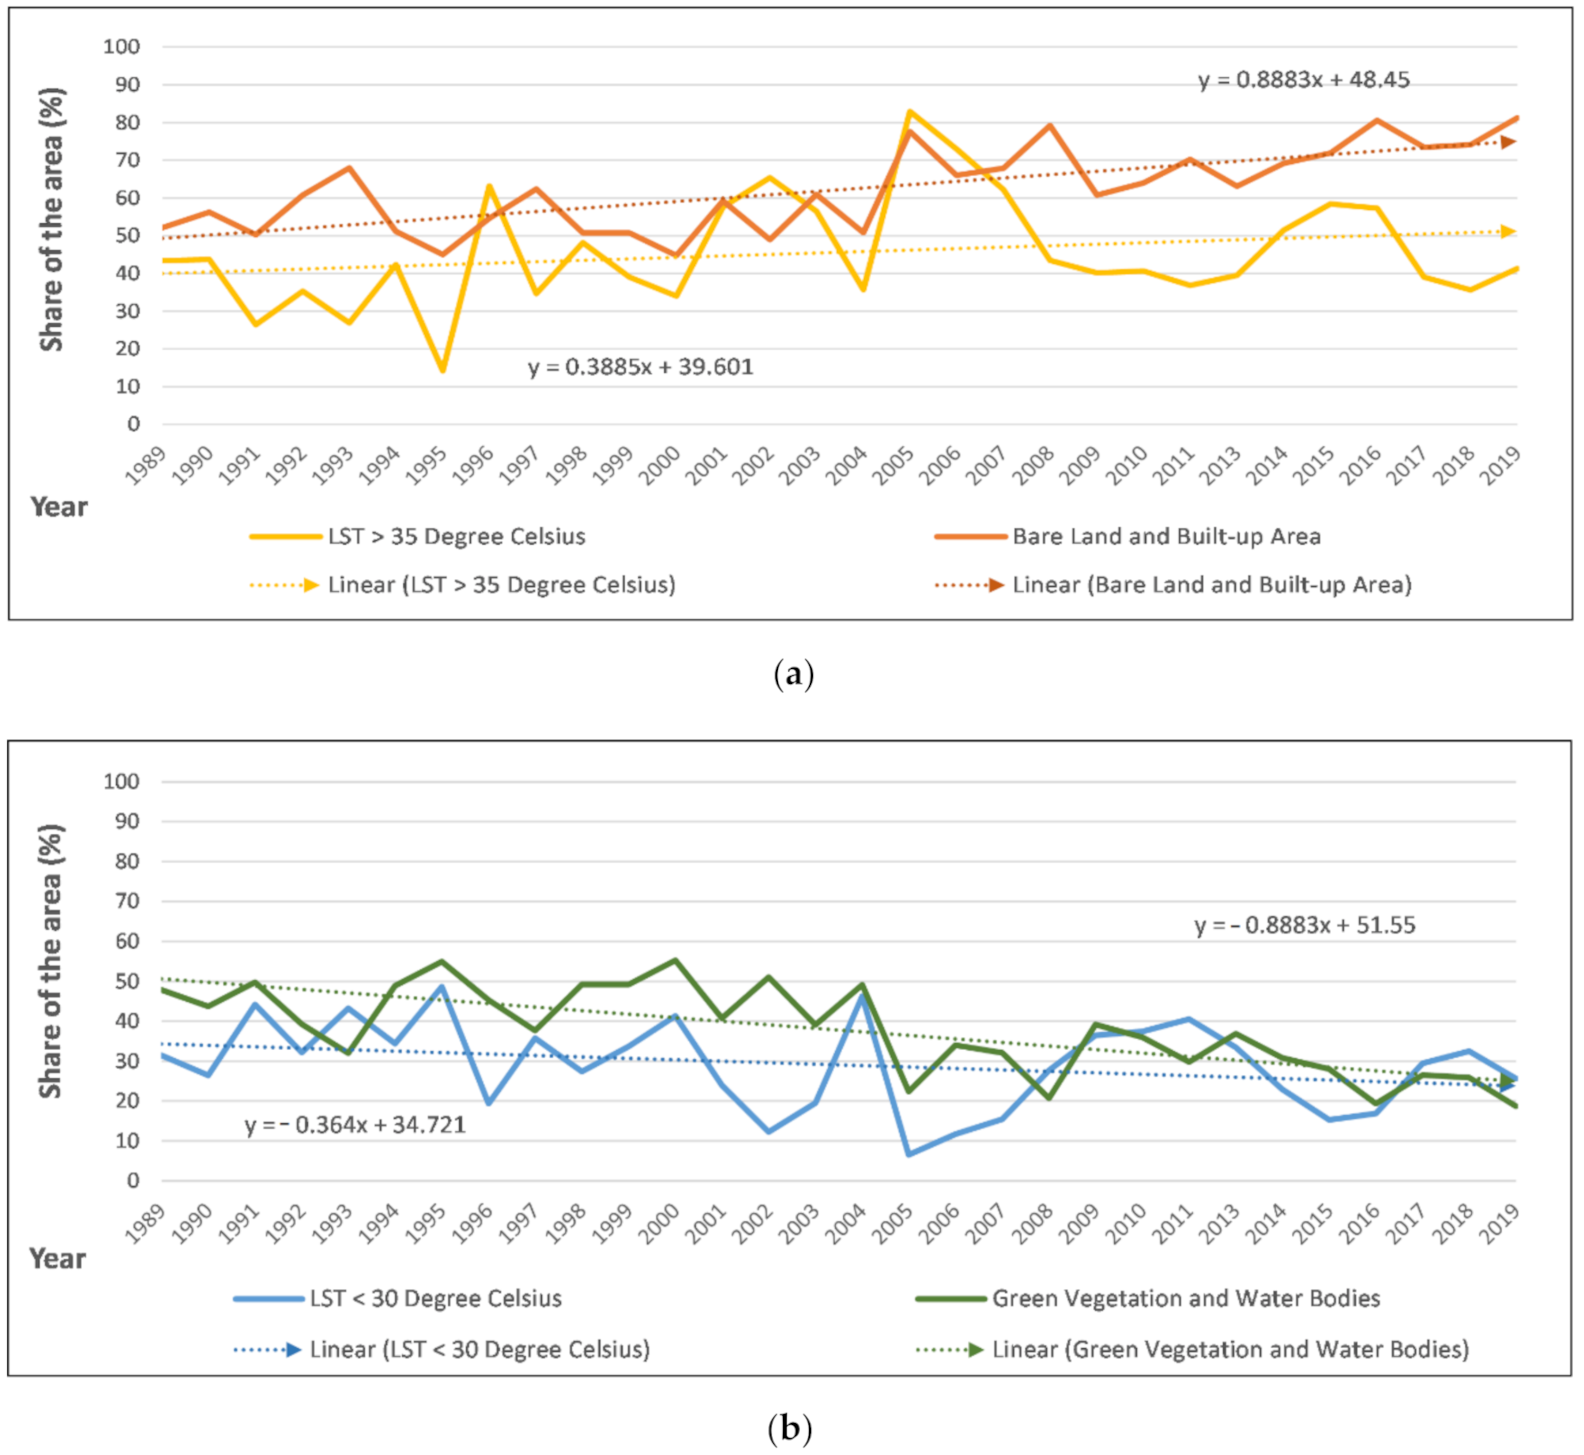
4.1. Land-Cover Change

Four land-cover types were derived for the Bac Binh study area, (1) Bare Land (including dry vegetation on cropland, shrubland or grassland), (2) Green Vegetation (photosynthetic active vegetation), (3) Water Bodies and (4) Built-up Area. In this study, we applied a supervised classification with the maximum likelihood algorithm to classify Landsat image into the four land-cover types for each year from 1989 to 2019 [57,58,59]. The training areas were selected by visual interpretation of the land-cover classes, selected individually on each scene. For the land-cover classification, accuracy assessment was done by a visual check at three time periods using high resolution SPOT-5 (for 2000, 2010) and SPOT-6 (for 2019) satellite images. The classification accuracy at the randomly distributed check points for the three time-spots is shown in Table 2 with the user’s accuracy (UA), producer’s accuracy (PA), and the overall accuracy (OA), kappa coefficient [60].
The same classification approach has been applied to all Landsat images listed in Table 1. Therefore, we assume that the accuracies of Table 2 are representative for land-cover classification from 1989 to 2019.
The land-cover classes Green Vegetation and Bare Land dominate the study area with 47% and 52% in 1989 respectively. In Figure 3a, the change in share of Green Vegetation and Bare land over the 30 year time period is shown. A steady decline of the share of Green Vegetation can be observed from 2004 to 2019, while the share of Bare Land increases (Figure 3a and Figure 4). The average Green Vegetation area of the first decade (1989 to 1998) covered 45% of the total project area and declined to cover only 28% on average in the period of 2010 to 2019. The class Bare Land accounted for 55% coverage in the first ten years (1989 to 1998) of the total area, whereas the in the last ten years (2010 to 2019) the class represents the dominating land-cover with a share of 71.38% of the total study area.
The areas categorized as Water Bodies and Built-up Area cover less than 1% of the project area in total, however these classes have increased 4 to 5 times over the thirty years of the observed period. The area covered by Water Bodies increased from 1.25 km2 (corresponding 0.07% of total area) to 6.54 km2 (0.36%) and the Built-up Area from 1.80 km2 (0.09%) to 7.66 km2 (0.42%).
This change in land-cover has occurred at a faster rate over the last ten years than it has previously and suggests that the natural forest area and other vegetated areas have been significantly reduced. At the same time, along with processes associated with socio-economic developments, the Water Bodies and Built-up Areas has increased.

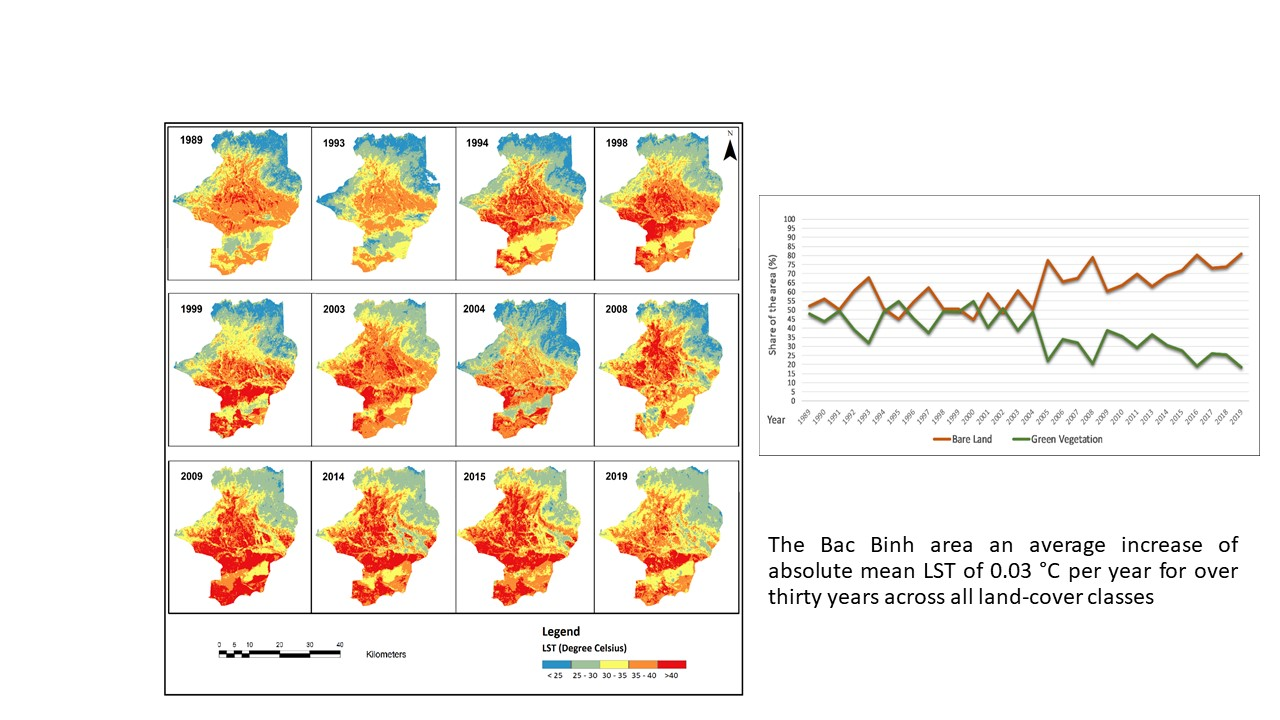
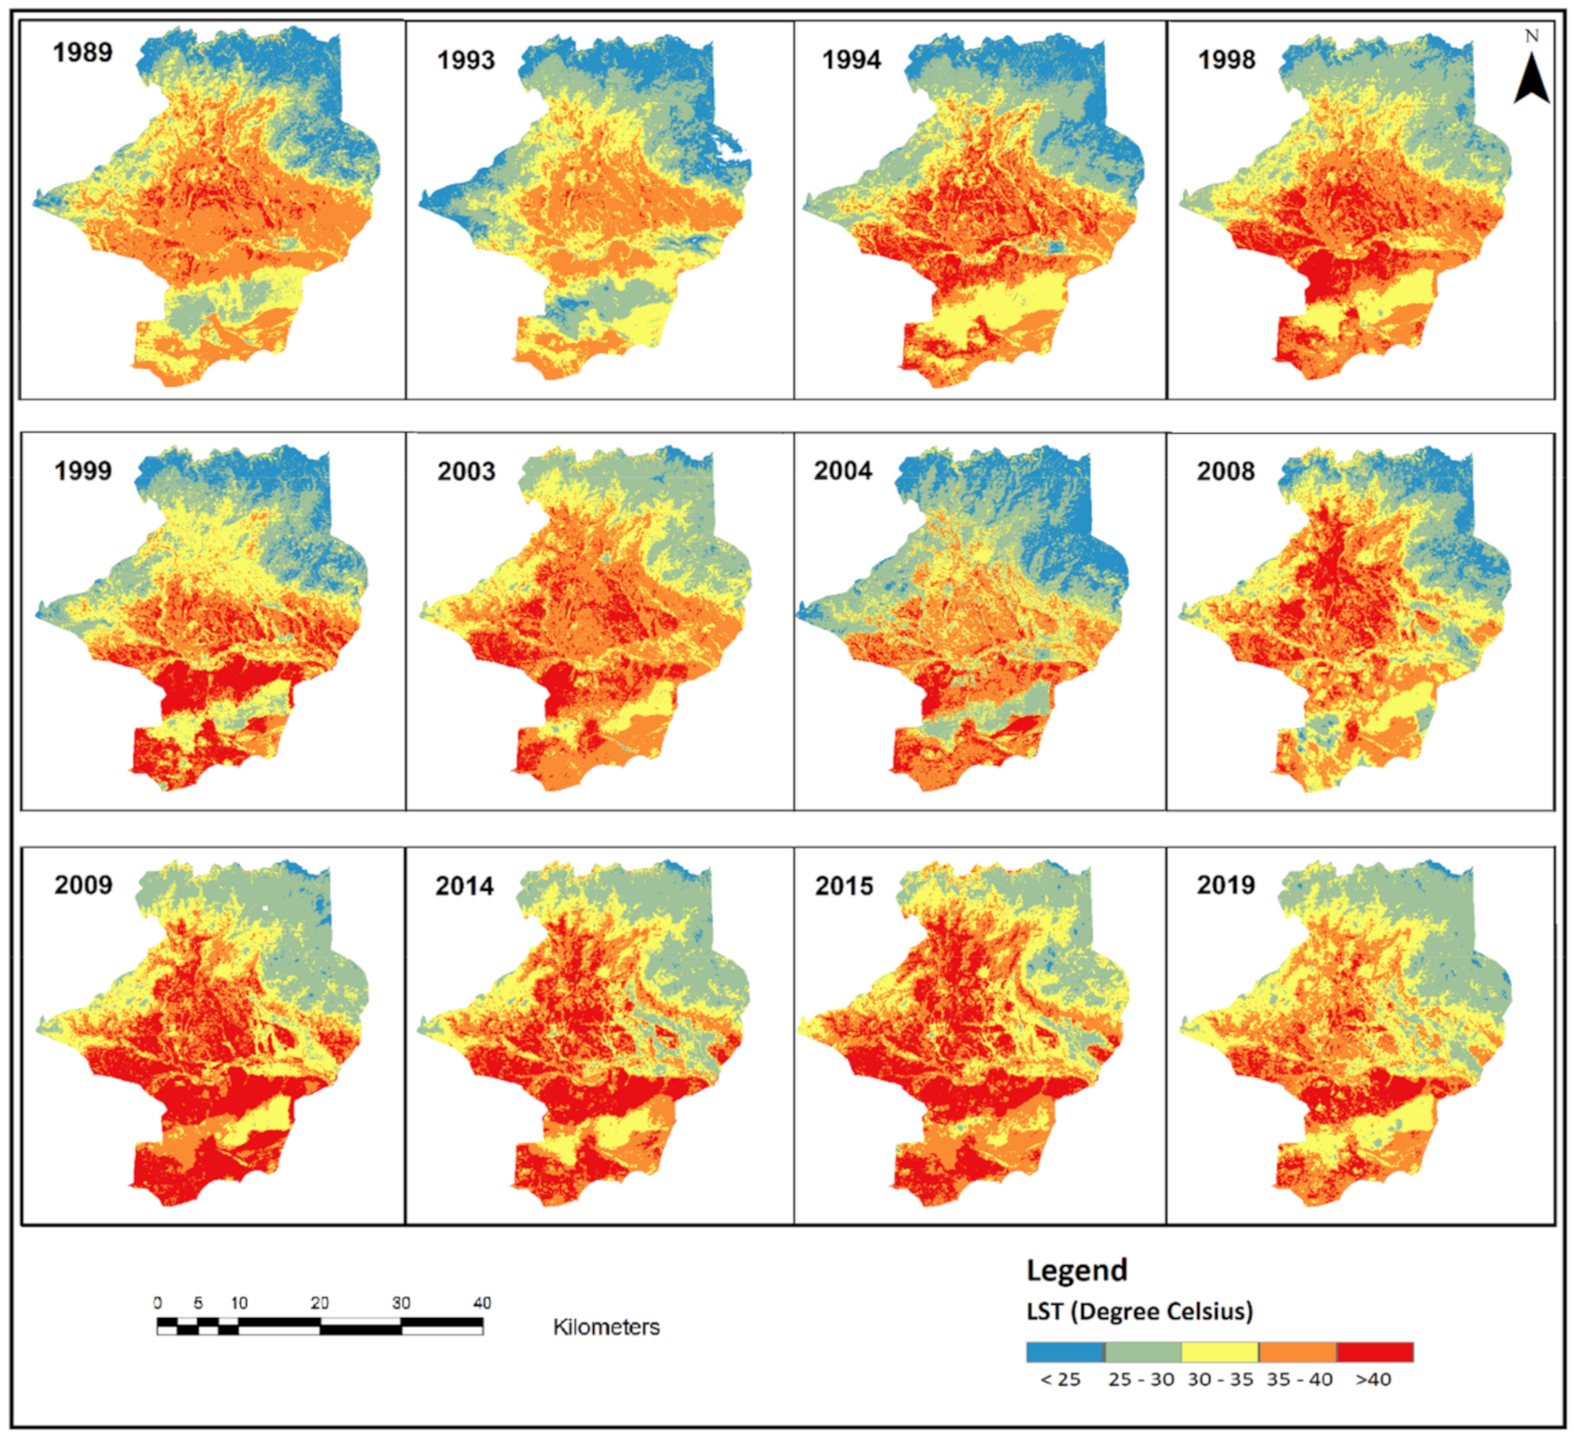
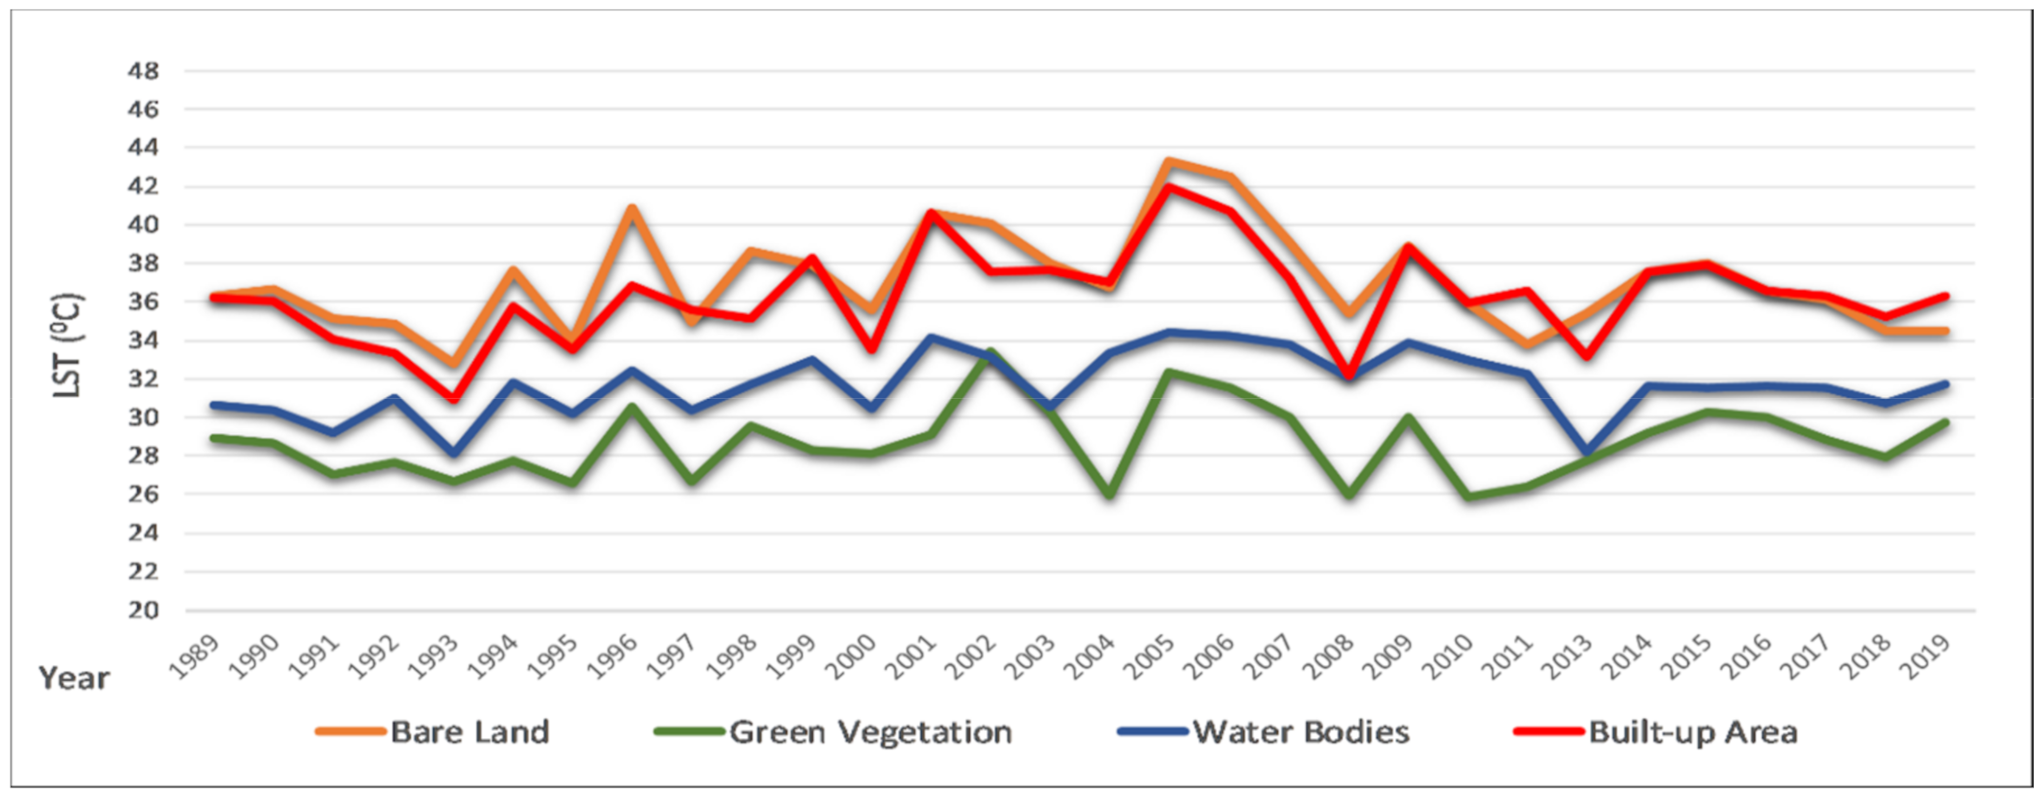
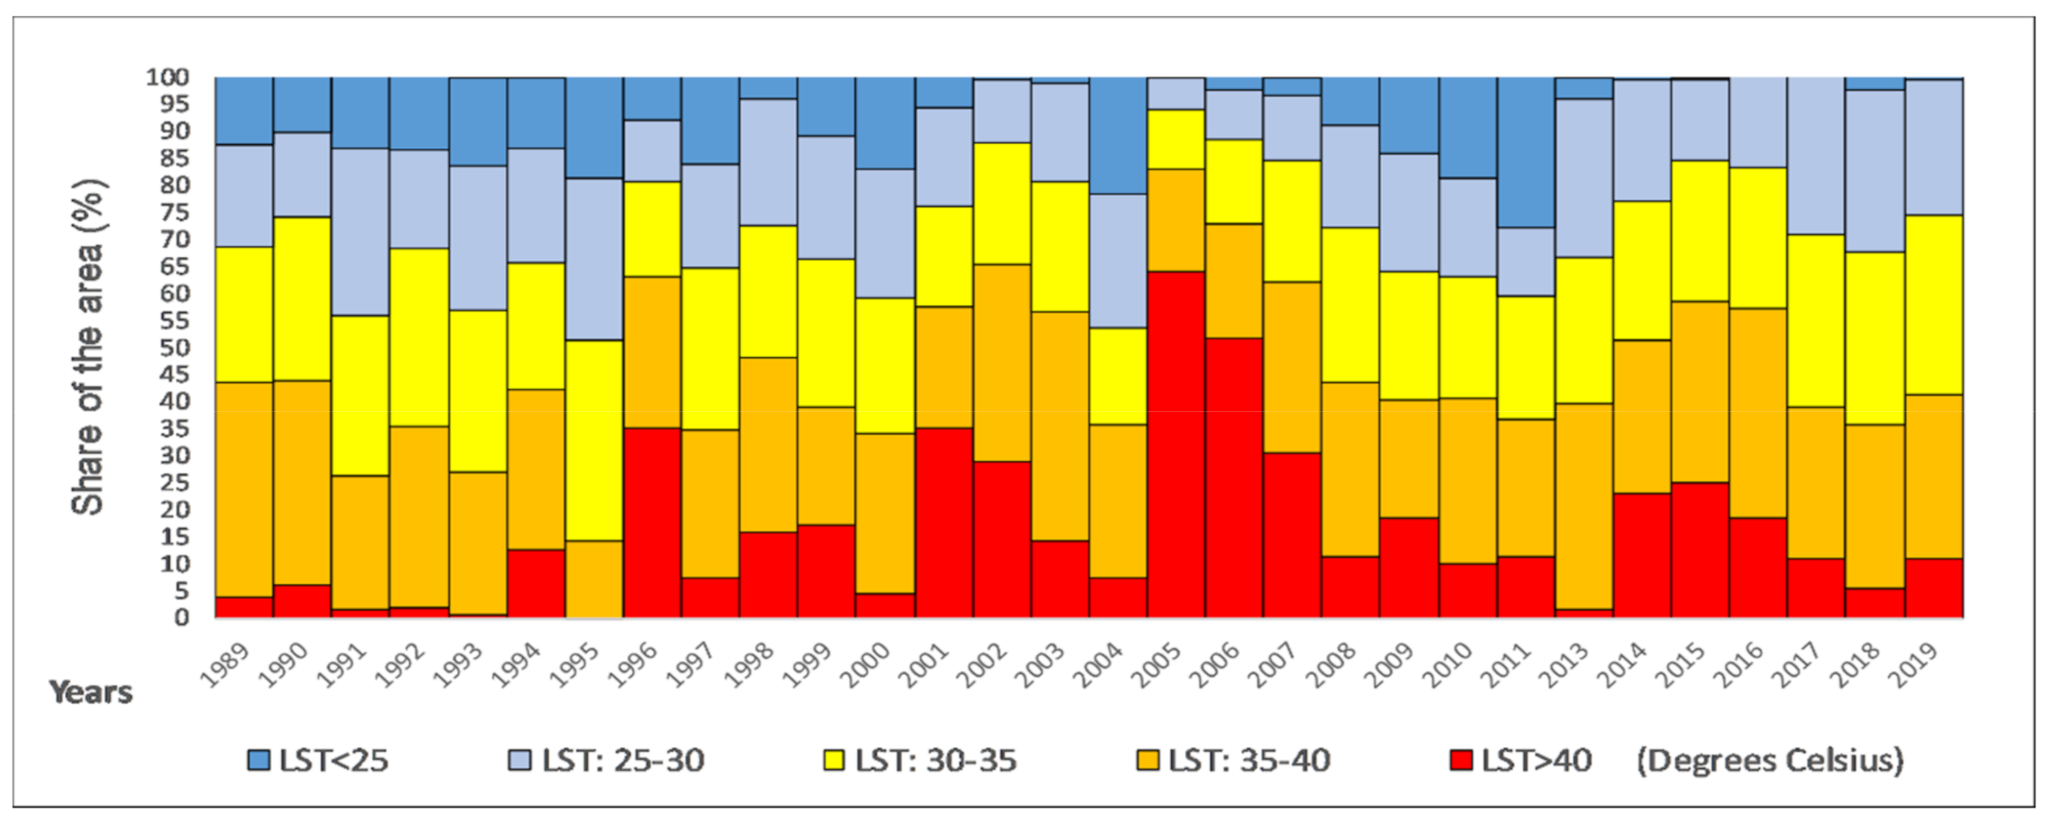
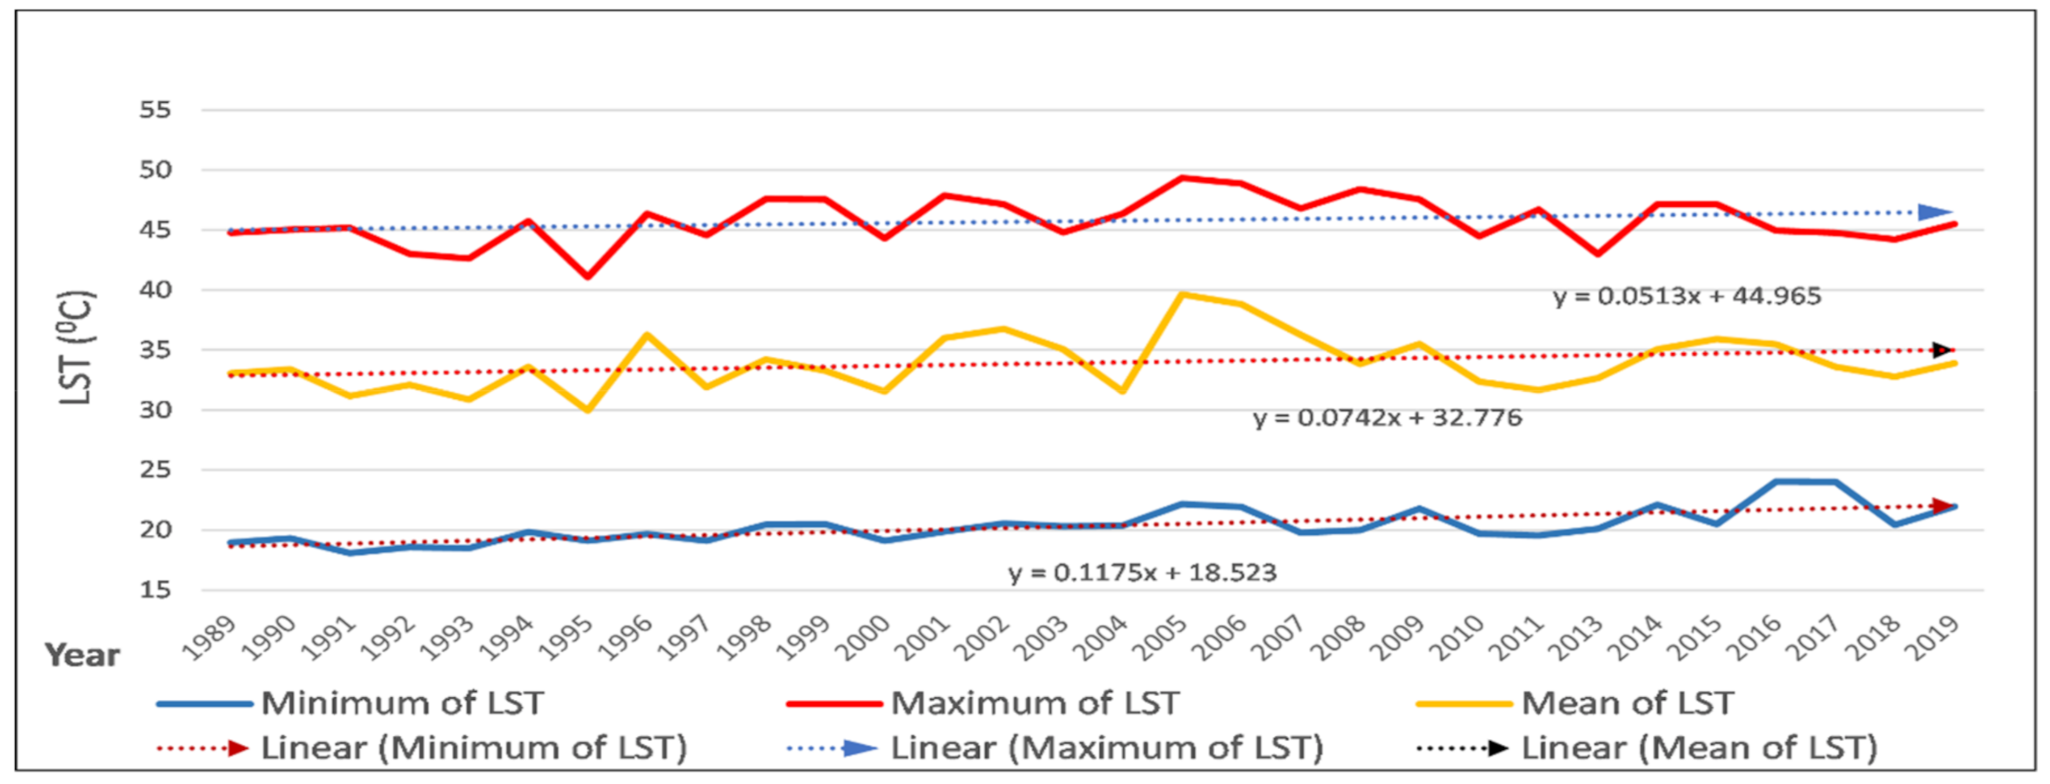
4.2. LST Results and Trends

The LST was derived from the Landsat images for the entire thirty-year period from 1989 to 2019. Figure 5 illustrates the spatial distribution of the LST mean of all scenes of each dry season for selected years.
The differences in mean LST between the four land-cover types are relatively large, with the difference in LST between Bare Land and Green Vegetation cover being greatest (Figure 6). By taking the average LST value for each land-cover class for each observed dry season, the LST for Bare Land and Built-up Area show a similar behavior and have higher value than Green Vegetation and Water Bodies area by about 2 to 4 °C (Figure 6). The years 2005 and 2006 show relatively high LST values. Over the thirty years, the average LST mean value of the (1) Entire study area is 33.91 °C, (2) Bare Land is 37.07 °C, (3) Green Vegetation is 28.70 °C, (4) Water Bodies is 31.69 °C and (5) Built-up Area is 36.27 °C.
For further analysis, we classified the project area by LST mean value into five ranges: (1) <25 °C, (2) 25–30 °C, (3) 30–35 °C, (4) 35–40 °C, and (5) >40 °C. Figure 7 shows the percentage of the total area in each range. In 1995, 2004, 2010, and 2011 the coverage of < 25 °C area were 18.59%, 21.65%, 18.99%, and 27.76% respectively, which indicate years with particularly low LST. In contrast, in the hot years, 2002, 2005, 2016, and 2019, the areas affected by LST < 25 °C were very small, with the coverage below 1% of the total area, especially in 2016 where the coverage accounted for only 0.03%. In the years 2005 and 2006, the coverage of LST range higher than 40 °C are 64.10% and 51.68%, respectively.
Figure 8 shows the changes and steady increases in minimum, maximum, and mean LST values over thirty years in the project area.
Average LST values of minimum, maximum, and mean LST over the thirty years were 20.34 °C, 45.76 and 33.91 °C, respectively. The differences in minimum and maximum yearly average LST value was 25.42 °C. The smallest difference was in 2017 (20.76 °C), and the largest was in 2008 (28.44 °C). The absolute average value increase in LST is calculated by the following equation:
Δ = i = 2 n ( Y i Y i 1 ) n 1
where Δ is an absolute average increase, decrease the value of the mean LST, Y i is mean LST value, and n is the total number of observation periods equivalent to 30.
We determine Δ according to Equation (11) for the Landsat image scenes over thirty years from 1989 to 2019. The calculation of Δ corresponds to the three LST trends: (a) the absolute average of the minimum LST values increased by 0.1 °C per year; (b) the absolute average maximum LST values increased by 0.03 °C per year; and (c) the absolute average LST increased by 0.03 °C per year over the thirty years. The result shows that minimum LST tends to have higher increase than the maximum LST and average LST. This can be explained by the close correlation of LST with the decreasing area of Green Vegetation class in the study area. During the past thirty years, the Green Vegetation area has been reduced significantly, from 1989 accounting for nearly half of the project area, to it only accounting for 18.37% in 2019. In addition, Green Vegetation is also the class with the lowest LST among four land-cover types calculated in the area.

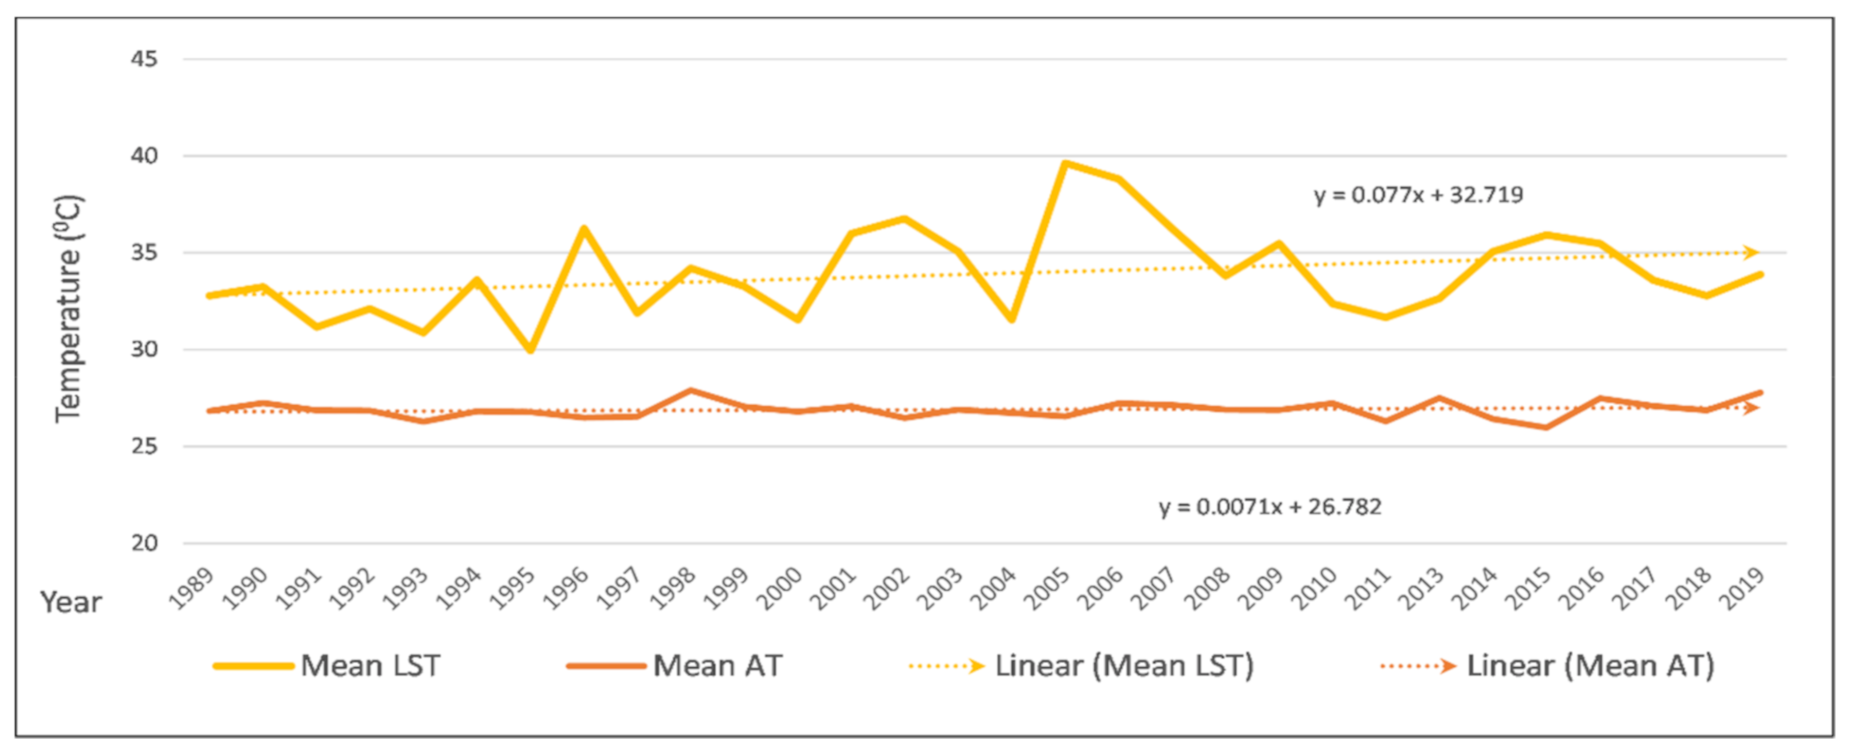
4.3. Comparison of Landsat LST, MODIS LST and Air Temperature (AT) In-Situ Measurements

To verify the Landsat-derived LST values, MODIS LST products (MOD11A2) were derived and averaged for each the dry season of each observation [32,61,62]. The MOD11A2 product is available from 2001 to 2019. The average Landsat LST data and the respective average MODIS products are shown in Table 3:
From the data, we find that the difference in LST between the two types of images is relatively small. The difference in LST average values from 2001 to 2009 is −0.04 °C (the average LST values of the Landsat image is smaller than MODIS’s LST average values). The largest difference in 2004 is −1.37 °C, the smallest difference in 2007 is −0.005 °C.
Table 4 shows the range of LST values between minimum and maximum of the MODIS images (from 32.22 °C to 38.75 °C) is smaller than the Landsat images (from 31.53 °C to 39.63 °C). The standard deviation value of MODIS (1.85) is also smaller than the Landsat (2.29). In this study, we used MOD11A2 LST to compare with the Landsat LST images, and R M S E (root mean square error) is calculated by the following equation:
R M S E = 1 n ( L S i M O D i ) 2 n
where L S is mean LST value of the Landsat image, M O D is mean LST value of the MOD11A2 image, i is the number of the years, and n is the total number of periods.
In addition, we calculated the relationship of LST between Landsat and MOD11A2 images by the r coefficient (Pearson correlation coefficient) to evaluate the reliability of the results. Equation (13) for calculating the coefficient r:
r = i = 1 n L S i L S ¯ M O D i M O D ¯ i = 1 n L S i L S ¯ 2 i = 1 n M O D i M O D ¯ 2
where L S is mean LST value of the Landsat image, M O D is mean LST value of the MOD11A2 image, L S ¯ and M O D ¯ are average of Landsat and MOD11A2 mean values, i is the number of the years, and n is the total number of period.
The RMSE (root mean square error) value obtained was 0.79 °C and the r (Pearson correlation coefficient) value was 0.94. With the relatively small RMSE value of 0.79 °C, we found that the LST value obtained from the Landsat image is highly reliable for the project area. In addition, the correlation coefficient r is close to 1, which also shows a very high positive correlation between the Landsat LST values and the MODIS LST values. According to the results, we are convinced that the Landsat images can be used to retrieve reliable LST for the project area.
To verify LST data derived from Landsat image, historic AT data from the nearby weather station (Phan Thiet weather station at 108°06′E 10°56′N, about 45 km to the south from the study area) were used. They were collected daily throughout the last thirty years of study period [63]. This dataset is accessible from the website of National Climatic Data Center, U.S. Department of Commerce (https://www7.ncdc.noaa.gov/CDO/cdo). Figure 9 shows, side by side, the dry season average AT recoded at the weather station and the LST from Landsat for Bac Binh district. The difference between these two sets of temperature mean value are +7.02 °C. The average absolute temperature collected at the meteorological station (AT) in the dry season also increased by 0.03 °C per year in the period 1989–2019 at the same increase rate as LST derived from the Landsat image series.

4.4. Correlation between LST and Land-Cover

The land-cover classification results from Landsat image over time show the predominance of the two main land-cover types: Green Vegetation and Bare Land in the project area. The total coverage of these two classes is more than 99% for all the thirty years. The land-cover change in the project area is mainly between these two classes Green Vegetation and Bare Land, from Green Vegetation to Bare Land. The Water Bodies and Built-up Area cover always only less than 1% and the change of these land-cover classes has limited influence in the area.
In Figure 10a, we see the steady increase of the share of Bare Land and Built-up classes and the area with LST values >35 °C. Figure 10b shows a consistent coverage decrease of Water Bodies and Green Vegetation areas and a simultaneous decrease of the area with LST values <30 °C during the observed thirty years. Applying Equation (13) to investigate the correlation coefficient between share of the study area with LST < 30 °C and the share of the area of Green Vegetation and Water Bodies, the value r = 0.50 was obtained. For the area with LST > 35 °C and the area of Bare Land and Built-up Areas classes, r = 0.94 was obtained. Both suggests a high positive correlation between the sets of data. This result shows that the area with LST > 35 °C vs. Bare Land and Built-up Areas classes has a higher correlation than the area with LST < 30 °C vs. Green Vegetation and Water Bodies cover classes.

5. Discussion

The land-cover classification accuracy has been validated for the years 2000, 2010 and 2019 using high-resolution SPOT images. The overall accuracy is in the range from 70% to 80% with a Kappa coefficient of 0.63 and 0.73. These values are in range with other studies [64,65], indicating an acceptable quality for the further analysis. The classification results show that classes Bare Land and Green Vegetation dominate the study area and that the land-cover has changed greatly over thirty years. The share of Bare Land area has increased from 52.0% to 80.9% (from 949 km2 to 1,475 km2), while the share of Green Vegetation cover decreased from 47.8% to 18.37% (from 872 to 335 km2) in the 1989–2019 study period. Decreasing precipitation, groundwater depletion and soil degradation are identified as drivers of this land-cover change, leading to the decrease of forested areas and even to desertification processes of the Bare Land covered areas [66,67].
Another type of land use change in the area has also been addressed in local government reports, according to which, the expansion and development of urban residential areas, tourist areas and mineral resource exploitation are continuously intensified [68]. The research result shows clear evidence of these changes. The Built-up Area has increased by more than 500% during thirty years of observation (Figure 3b). Along with that, we also found that the area covered by Water Bodies increased four-fold as result of expanding reservoirs for storing water for daily life and for irrigation. An example is the Ca Giay Lake, one of the biggest reservoirs in the area. The dam for the reservoir was constructed from 1996 to 1999 [69] that finally contributed to the increase of Water Bodies coverage from 0.07% to 0.36% (increased by 5.3 km2) 1989–2019 period. The increase of Water Bodies area from 1999 marks the first operation of the dam after the construction period (Figure 3b).
For the monitoring of LST change, this study used Landsat images, which have a higher spatial resolution than MODIS images, which was used in similar previous research on regions in Vietnam [70]. To ensure the LST value representativeness, our study used multiple Landsat scenes for each dry season (2 to 4 scenes) to obtain LST values instead of using only one scene for the whole season as it has been done in other studies [71]. The average LST of 37.07 °C for the thirty years period for the Bare Land area is always higher than the average LST of the other land-cover classes. Moreover, the average LST for Green Vegetation area is 28.70 °C and always lower than the LST of other land-cover classes. The difference between the average LST values for the two largest land-cover classes Bare Land and Green Vegetation is relative high (8.37 °C). This result is consistent with the finding from previous research on the Bare Land and Green Vegetation LST [72]. The general increase in LST over the last 30 years are in line with the 2018 IPCC report. [1]. During these thirty years, the average dry season LST shows an annual increase of 0.03 °C. The area experiencing an LST < 25 °C decreased on average by 0.41% per year and the area affected by a LST > 40 °C increased in average by 0.25% per year. There has been significant human impact on the natural land-cover area in this area, with groundwater resources and forest areas decreasing as a result to human exploitation [73,74,75,76]. We assume that the increase in LST during the dry season in Bac Binh are closely linked to the observed land-cover changes, especially the conversion from Green Vegetation to Bare Land.
To evaluate the reliability of the study result, we compared the LST value derived from Landsat image with LST extracted from MODIS MOD11A2 products (Table 3 and Table 4) and AT recorded from the nearby weather monitoring station (Figure 9). The MODIS LST for each year is an average value from all images of dry season. The Landsat LST and MODIS LST comparison shows an average difference of −0.04 °C. The difference between The Landsat LST and MODIS LST in our research are consistent with findings in other studies [77,78]. The comparison shows a solid correlation between the Landsat LST and MODIS LST value series with RMSE = 0.79 °C and high positive correlation r = 0.94 that indicates the reliability of the Landsat-derived LST.
When comparing the LST results derived from Landsat images and recorded AT value from the nearby weather monitoring station, we found the same temperature increase trend of 0.03 °C per year in both datasets. However, there is constant absolute temperature difference where AT value is about 7 °C lower than LST. In other published research results [79,80], it has been observed that at the same location in clear cloudless weather, the LST measured on the ground is usually higher than AT measured in 2 m height. In our research, the nearby weather monitoring station is about 45 km outside the study area and located near the coastline where the temperature in this region is expected to be lower than in our study area. The comparison of LST and AT shows a consistent temperature increase for both sets of measurements. Coincident with the results from other studies [79,80], the LST and AT values in our study area are highly correlated during the thirty years from 1989 to 2019.
The AT measurements of the Phan Thiet weather station, as well as regional climate databases (http://berkeleyearth.lbl.gov/regions/vietnam) confirm the low LST value for 2011, as well as high values for example for the years 1998 and 2015. Yet, the extremely high average LST value with 39.63 °C for 2005, which was confirmed by the MODIS MOD11A2 product for the respective year, can neither be explained by the AT measurement of the 2005 dry-period nor by regional climate statistics.
The thirty-year LST dataset allowed detailed monitoring and analyses the relation between land-cover change and the LST fluctuation in the project area. In contrast to other studies in Vietnam and worldwide [20,81,82] that investigated only at the difference in LST between different regions or different land-cover types, our research also compares the increase and decrease of trends of LST levels with the trends of land-cover change. The results show a close relationship between the change in coverage of Green Vegetation and Water Bodies versus the area with LST < 30 °C, as well as between Built-up Area and Bare Land area versus the area with LST > 35 °C. The total area of Bare Land, Built-up Area and the area with LST > 35 °C have steadily increased, while the total area of Green Vegetation, Water Bodies area and the area with LST < 30 °C are decreasing. Analyses came up with correlation value between area with LST > 35 °C and Bare Land and Built-up Areas classes, r = 0.94, that shows close correlation between the increase of the area with LST > 35 °C and the increase of Bare Land and Built-up Area. This leads to the conclusion that the land-cover change in the project area contributes significantly to the LST increase.

6. Conclusions

The results proved the suitability of monitoring LST using Landsat multi-temporal satellite images. The study shows that, during thirty years of social and economic development, the land-cover in the study area has been changed significantly in the Bac Binh district, Vietnam. The share of Bare Land has increased from 52.0% to 80.9% (from 949 km2 to 1,475 km2), while the share of Green Vegetation cover decreased from 47.8% to 18.37% (from 872 to 335 km2) in the 1989–2019 study period. The area covered by Water Bodies and Built-up Area has increased more than four- and five-fold respectively.
We have shown that areas affected by high LST (>35 °C) have increased over the past thirty years, during which, the absolute average LST has increased on average by 0.03 °C per year. In addition, we used LST value obtained from MODIS and AT from a weather monitoring station for comparison and evaluation of the Landsat-derived LST. The results confirm the Landsat derived LST trends. MODIS LST and AT datasets also showed a 0.03 °C increase in temperature per year as the LST derived from the Landsat time-series.
The research result shows that the area with LST < 30 °C and the area of Green Vegetation and Water Bodies land-cover classes are similarly decreasing. At the same time, the opposite trend is seen with the relationship between the area with LST > 35 °C and the area of Bare Land and Built-up Area. This indicates a clear correlation between the LST trends and the change in land-cover types of the region over the 30-year study period.
This is the first study on the change of LST for a thirty-year period in the Bac Binh area. The high spatial resolution and the results from the LST time series provide a detailed and reliable dataset, compared to other studies that investigate correlating trends of LST and land-cover. The study uses multiple image scenes per dry season to ensure LST representativeness and validates the results successfully with MODIS LST products and AT measurements of a nearby weather station.
In order to achieve a more comprehensive assessment and analysis on the development of LST in this study area or comparable sites, it will be necessary to perform the analysis on the entire year, including the rainy season. Yet, the results for the dry-season provide valuable information, which might contribute to a better understanding of the climate change effects and to develop adaptation strategies for water management and spatial planners to better cope with climate change and warming of the Bac Binh study area.

Author Contributions

Writing—original draft preparation, T.D.; writing—review and editing, F.B., M.W., M.Z. and P.Y.; supervision, P.Y. All authors have read and agreed to the published version of the manuscript.

Funding

This research was funded by LIESMARS (State Key Laboratory of Information Engineering in Surveying, Mapping and Remote Sensing, Wuhan University) of Wuhan University.

Acknowledgments

The Landsat TM, Landsat ETM+, and Landsat OLI TIRS images were downloaded from the United States Geological Survey (USGS) website (https://earthexplorer.usgs.gov/). The MOD11A2 imagery were accessed from: Moderate Resolution Imaging Spectroradiometer (https://modis.gsfc.nasa.gov/), and the open source image processing code is from Google Earth Engine (https://code.earthengine.google.com/). The Air Temperature from Phan Thiet weather station was retrieved from National Climatic Data Center, U.S. Department of Commerce (https://www7.ncdc.noaa.gov/CDO/cdo). We would like to thank the Wuhan University for their funding support for Dang Thanh Tung to pursue a Ph.D. program at LIESMARS (State Key Laboratory of Information Engineering in Surveying, Mapping and Remote Sensing, Wuhan University).

Conflicts of Interest

The authors declare no conflict of interest.

References

  1. Masson-Delmotte, T.; Zhai, P.; Pörtner, H.; Roberts, D.; Skea, J.; Shukla, P.; Pirani, A.; Moufouma-Okia, W.; Péan, C.; Pidcock, R. IPCC: Summary for Policymakers. In Global warming of 1.5 C. An IPCC Special Report on the Impacts of Global Warming of 1.5 °C above Pre-Industrial Levels and Related Global Greenhouse Gas Emission Pathways, in the Context of Strengthening the Global. 2018. Available online: https://www.ipcc.ch/sr15/chapter/spm/ (accessed on 6 October 2018).
  2. Solomon, S.; Qin, D.; Manning, M.; Chen, Z.; Marquis, M.; Averyt, K.; Tignor, M.; Miller, H. IPCC Fourth Assessment Report (AR4). Available online: https://www.ipcc.ch/report/ar4/syr/ (accessed on 4 January 2007).
  3. Bangalore, M.; Smith, A.; Veldkamp, T. Exposure to floods, climate change, and poverty in Vietnam. Econ. Disasters Clim. Change 2018. [Google Scholar] [CrossRef] [Green Version]
  4. Tien Thanh, N.; Dutto Aldo Remo, L. Projected changes of precipitation idf curves for short duration under climate change in central Vietnam. Hydrology 2018, 5, 33. [Google Scholar] [CrossRef] [Green Version]
  5. Du, T.L.T.; Bui, D.D.; Nguyen, M.D.; Lee, H. Satellite-Based, Multi-Indices for Evaluation of Agricultural Droughts in a Highly Dynamic Tropical Catchment, Central Vietnam. Water 2018, 10, 659. [Google Scholar] [CrossRef] [Green Version]
  6. Opitz-Stapleton, S.; Sabbag, L.; Hawley, K.; Tran, P.; Hoang, L.; Nguyen, P.H. Heat index trends and climate change implications for occupational heat exposure in Da Nang, Vietnam. Clim. Serv. 2016, 2, 41–51. [Google Scholar] [CrossRef] [Green Version]
  7. Hulley, G.C.; Ghent, D.; Göttsche, F.M.; Guillevic, P.C.; Mildrexler, D.J.; Coll, C. Land Surface Temperature. In Taking the Temperature of the Earth; Elsevier: Amsterdam, The Netherlands, 2019; pp. 57–127. [Google Scholar] [CrossRef]
  8. Schneider, P.; Hook, S.J. Space observations of inland water bodies show rapid surface warming since 1985. Geophys. Res. Lett. 2010, 37. [Google Scholar] [CrossRef] [Green Version]
  9. General, A. Transforming Our World: The 2030 Agenda for Sustainable Development; UN: New York, NY, USA, 2015. [Google Scholar]
  10. Ferreira, L.S.; Duarte, D.H.S. Exploring the relationship between urban form, land surface temperature and vegetation indices in a subtropical megacity. Urban. Clim. 2019, 27, 105–123. [Google Scholar] [CrossRef]
  11. Sayão, V.M.; Demattê, J.A.M.; Bedin, L.G.; Nanni, M.R.; Rizzo, R. Satellite land surface temperature and reflectance related with soil attributes. Geoderma 2018, 325, 125–140. [Google Scholar] [CrossRef]
  12. Sobrino, J.A.; Jiménez-Muñoz, J.C.; Paolini, L. Land surface temperature retrieval from LANDSAT TM 5. Remote Sens. Environ. 2004, 90, 434–440. [Google Scholar] [CrossRef]
  13. Zhang, Z.M.; He, G.J. Generation of Landsat surface temperature product for China, 2000–2010. Int. J. Remote Sens. 2013, 34, 7369–7375. [Google Scholar] [CrossRef]
  14. Simwanda, M.; Ranagalage, M.; Estoque, R.C.; Murayama, Y. Spatial analysis of surface urban heat islands in four rapidly growing African Cities. Remote Sens. 2019, 11, 1645. [Google Scholar] [CrossRef] [Green Version]
  15. Shi, Y.; Zhang, Y. Remote sensing retrieval of urban land surface temperature in hot-humid region. Urban. Clim. 2018, 24, 299–310. [Google Scholar] [CrossRef]
  16. Fu, P.; Weng, Q. Temporal dynamics of land surface temperature from Landsat TIR time series images. IEEE Geosci. Remote Sens. Lett. 2015, 12, 2175–2179. [Google Scholar] [CrossRef]
  17. Athick, A.M.A.; Shankar, K.; Naqvi, H.R. Data on time series analysis of land surface temperature variation in response to vegetation indices in twelve wereda of Ethiopia using mono window, split window algorithm and spectral radiance model. Data Brief 2019, 27, 104773. [Google Scholar] [CrossRef] [PubMed]
  18. Thanh Hoan, N.; Liou, Y.-A.; Nguyen, K.-A.; Sharma, R.; Tran, D.-P.; Liou, C.-L.; Cham, D. Assessing the Effects of Land-Use Types in Surface Urban Heat Islands for Developing Comfortable Living in Hanoi City. Remote Sens. 2018, 10, 1965. [Google Scholar] [CrossRef] [Green Version]
  19. Son, N.-T.; Thanh, B.-X. Decadal assessment of urban sprawl and its effects on local temperature using Landsat data in Cantho city, Vietnam. Sustain. Cities Soc. 2018, 36, 81–91. [Google Scholar] [CrossRef]
  20. Son, N.T.; Chen, C.F.; Chen, C.R.; Chang, L.Y.; Minh, V.Q. Monitoring agricultural drought in the Lower Mekong Basin using MODIS NDVI and land surface temperature data. Int. J. Appl. Earth Obs. Geoinf. 2012, 18, 417–427. [Google Scholar] [CrossRef]
  21. Wang, C.; Myint, S.; Wang, Z.; Song, J. Spatio-Temporal Modeling of the Urban Heat Island in the Phoenix Metropolitan Area: Land Use Change Implications. Remote Sens. 2016, 8, 185. [Google Scholar] [CrossRef] [Green Version]
  22. Cao, X.; Feng, Y.; Wang, J. Remote sensing monitoring the spatio-temporal changes of aridification in the Mongolian Plateau based on the general Ts-NDVI space, 1981–2012. J. Earth Syst. Sci. 2017, 126. [Google Scholar] [CrossRef]
  23. Jiang, M.; Lin, Y. Desertification in the south Junggar Basin, 2000–2009: Part I. Spatial analysis and indicator retrieval. Adv. Space Res. 2018, 62, 1–15. [Google Scholar] [CrossRef]
  24. General_Statistics_Office. Completed Results of the 2019 Viet Nam Population and Housing Census; General Statistics Office of Vietnam: Hanoi, Vietnam, 2020; p. 840. [Google Scholar]
  25. MONRE. Climate Change and Sea Level Rise Scenarios for Vietnam. Available online: https://www.preventionweb.net/files/11348_ClimateChangeSeaLevelScenariosforVi.pdf (accessed on 12 June 2019).
  26. Binh Thuan Statistical Office. Socio-Economic Situation in the First 6 Months of 2019. Available online: http://cucthongke.vn/xem-tin-tuc.aspx?idp=1&idc=23662 (accessed on 12 June 2019).
  27. Committee for Ethnic Minority affairs Web Portal The Inspection Depatrment of Central Committee Work in Bac Binh District Party Committee. Available online: http://www.cema.gov.vn/uy-ban-dan-toc-voi-dia-phuong/doan-kiem-tra-ban-chi-dao-trung-uong-lam-viec-voi-huyen-uy-bac-binh-binh-thuan-ve-cong-tac-dan-toc.htm (accessed on 12 April 2019).
  28. United States Geological Survey. Available online: https://earthexplorer.usgs.gov/ (accessed on 12 April 2019).
  29. Roy, D.P.; Wulder, M.A.; Loveland, T.R.; Woodcock, C.E.; Allen, R.G.; Anderson, M.C.; Helder, D.; Irons, J.R.; Johnson, D.M.; Kennedy, R.; et al. Landsat-8: Science and product vision for terrestrial global change research. Remote Sens. Environ. 2014, 145, 154–172. [Google Scholar] [CrossRef] [Green Version]
  30. Claverie, M.; Vermote, E.F.; Franch, B.; Masek, J.G. Evaluation of the Landsat-5 TM and Landsat-7 ETM+ surface reflectance products. Remote Sens. Environ. 2015, 169, 390–403. [Google Scholar] [CrossRef]
  31. Kilic, A.; Allen, R.; Trezza, R.; Ratcliffe, I.; Kamble, B.; Robison, C.; Ozturk, D. Sensitivity of evapotranspiration retrievals from the METRIC processing algorithm to improved radiometric resolution of Landsat 8 thermal data and to calibration bias in Landsat 7 and 8 surface temperature. Remote Sens. Environ. 2016, 185, 198–209. [Google Scholar] [CrossRef] [Green Version]
  32. Ruiz-Verdú, A.; Jiménez, J.C.; Lazzaro, X.; Tenjo, C.; Delegido, J.; Pereira, M.; Sobrino, J.A.; Moreno, J. Comparison of modis and landsat-8 retrievals of chlorophyll-a and water temperature over Lake Titicaca. In Proceedings of the 2016 IEEE International Geoscience and Remote Sensing Symposium (IGARSS), Beijing, China, 10–15 July 2016. [Google Scholar]
  33. Al-Hamdan, M.; Quattrochi, D.; Bounoua, L.; Lachir, A.; Zhang, P. Using Landsat, MODIS, and a Biophysical Model to Evaluate LST in Urban Centers. Remote Sens. 2016, 8, 952. [Google Scholar] [CrossRef] [Green Version]
  34. Bendib, A.; Dridi, H.; Kalla, M.I. Contribution of Landsat 8 data for the estimation of land surface temperature in Batna city, Eastern Algeria. Geocarto Int. 2017, 32, 503–513. [Google Scholar] [CrossRef]
  35. Li, B.; Ti, C.; Zhao, Y.; Yan, X. Estimating Soil Moisture with Landsat Data and Its Application in Extracting the Spatial Distribution of Winter Flooded Paddies. Remote Sens. 2016, 8, 38. [Google Scholar] [CrossRef] [Green Version]
  36. El-Hattab, M.; Amany, S.M.; Lamia, G.E. Monitoring and assessment of urban heat islands over the Southern region of Cairo Governorate, Egypt. Egypt. J. Remote Sens. Space Sci. 2018, 21, 311–323. [Google Scholar] [CrossRef]
  37. Nguyen, T.; Lin, T.-H.; Chan, H.-P. The Environmental Effects of Urban Development in Hanoi, Vietnam from Satellite and Meteorological Observations from 1999–2016. Sustainability 2019, 11, 1768. [Google Scholar] [CrossRef] [Green Version]
  38. Valor, E.; Caselles, V. Mapping land surface emissivity from NDVI. Application to European African and South American areas. Remote Sens. Environ. 1996, 57, 167–184. [Google Scholar] [CrossRef]
  39. Wang, S.; Ma, Q.; Ding, H.; Liang, H. Detection of urban expansion and land surface temperature change using multi-temporal landsat images. Resour. Conserv. Recycl. 2018, 128, 526–534. [Google Scholar] [CrossRef]
  40. Sejati, A.W.; Buchori, I.; Rudiarto, I. The spatio-temporal trends of urban growth and surface urban heat islands over two decades in the Semarang Metropolitan Region. Sustain. Cities Soc. 2019, 46. [Google Scholar] [CrossRef]
  41. Sun, Y.; Gao, C.; Li, J.; Wang, R.; Liu, J. Quantifying the Effects of Urban Form on Land Surface Temperature in Subtropical High-Density Urban Areas Using Machine Learning. Remote Sens. 2019, 11, 959. [Google Scholar] [CrossRef] [Green Version]
  42. Chatterjee, R.S.; Singh, N.; Thapa, S.; Sharma, D.; Kumar, D. Retrieval of land surface temperature (LST) from landsat TM6 and TIRS data by single channel radiative transfer algorithm using satellite and ground-based inputs. Int. J. Appl. Earth Obs. Geoinf. 2017, 58, 264–277. [Google Scholar] [CrossRef]
  43. Peng, J.; Ma, J.; Liu, Q.; Liu, Y.; Hu, Y.; Li, Y.; Yue, Y. Spatial-temporal change of land surface temperature across 285 cities in China: An urban-rural contrast perspective. Sci. Total Environ. 2018, 635, 487–497. [Google Scholar] [CrossRef] [PubMed]
  44. Zhang, Y.; Sun, L. Spatial-temporal impacts of urban land use land cover on land surface temperature: Case studies of two Canadian urban areas. Int. J. Appl. Earth Obs. Geoinf. 2019, 75, 171–181. [Google Scholar] [CrossRef]
  45. Chander, G.; Markham, B. Revised Landsat-5 TM radiometric calibration procedures and postcalibration dynamic ranges. IEEE Trans. Geosci. Remote Sens. 2003, 41, 2674–2677. [Google Scholar] [CrossRef] [Green Version]
  46. United States Geological Survey. Landsat 7 (L7) Data Users Handbook. Available online: https://www.usgs.gov/media/files/landsat-7-data-users-handbook (accessed on 5 December 2019).
  47. Zanter, K. Landsat 8 (L8) Data Users Handbook; Landsat Science Official Website, US Geological Survey: Reston, VA, USA, 2016. [Google Scholar]
  48. Van De Griend, A.A.; Owe, M. On the relationship between thermal emissivity and the normalized difference vegetation index for natural surfaces. Int. J. Remote Sens. 1993, 14, 1119–1131. [Google Scholar] [CrossRef]
  49. Wang, H.; Li, X.B.; Long, H.L.; Xu, X.; Bao, Y. Monitoring the effects of land use and cover type changes on soil moisture using remote-sensing data: A case study in China’s Yongding River basin. Catena 2010, 82, 135–145. [Google Scholar] [CrossRef]
  50. Bonafoni, S.; Anniballe, R.; Gioli, B.; Toscano, P. Downscaling Landsat Land Surface Temperature over the urban area of Florence. Eur. J. Remote Sens. 2016, 49, 553–569. [Google Scholar] [CrossRef]
  51. Sobrino, J.A.; Jiménez-Muñoz, J.C.; Sòria, G.; Romaguera, M.; Guanter, L.; Moreno, J.; Plaza, A.; Martínez, P. Land surface emissivity retrieval from different VNIR and TIR sensors. IEEE Trans. Geosci. Remote Sens. 2008, 48, 316–327. [Google Scholar] [CrossRef]
  52. Carlson, T.N.; Riziley, D.A. On the Relation between NDVI, Fractional Vegetation Cover, and Leaf Area Index. Remote Sens. Environ. 1997, 62, 241–252. [Google Scholar] [CrossRef]
  53. Zhao, S.; Cong, D.; He, K.; Yang, H.; Qin, Z. Spatial-Temporal Variation of Drought in China from 1982 to 2010 Based on a modified Temperature Vegetation Drought Index (mTVDI). Sci. Rep. 2017, 7, 17473. [Google Scholar] [CrossRef] [PubMed]
  54. Madanian, M.; Soffianian, A.R.; Soltani Koupai, S.; Pourmanafi, S.; Momeni, M. The study of thermal pattern changes using Landsat-derived land surface temperature in the central part of Isfahan province. Sustain. Cities Soc. 2018, 39, 650–661. [Google Scholar] [CrossRef]
  55. Guanter, L.; Del Carmen González-Sanpedro, M.; Moreno, J. A method for the atmospheric correction of ENVISAT/MERIS data over land targets. Int. J. Remote Sens. 2010, 28, 709–728. [Google Scholar] [CrossRef]
  56. Wan, Z. MODIS_Collection6_LST_Products_UsersGuide; ERI, University of California: Santa Barbara, CA, USA, 2013. [Google Scholar]
  57. Jia, X.; Richards, J.A. Efficient maximum likelihood classification for imaging spectrometer data sets. IEEE Trans. Geosci. Remote Sens. 1994, 32, 274–281. [Google Scholar] [CrossRef] [Green Version]
  58. Reis, S. Analyzing land use/land cover changes using remote sensing and GIS in Rize, North-East Turkey. Sensors 2008, 8, 6188–6202. [Google Scholar] [CrossRef]
  59. Li, C.; Wang, J.; Wang, L.; Hu, L.; Gong, P. Comparison of Classification Algorithms and Training Sample Sizes in Urban Land Classification with Landsat Thematic Mapper Imagery. Remote Sens. 2014, 6, 964–983. [Google Scholar] [CrossRef] [Green Version]
  60. Jensen, J.R. Introductory Digital Image Processing: A Remote Sensing Perspective; Prentice-Hall Inc.: Upper Saddle River, NJ, USA; Michigan University: Ann Arbor, MI, USA, 1996. [Google Scholar]
  61. Tan, Z.; Liu, S.; Wylie, B.K.; Jenkerson, C.B.; Oeding, J.; Rover, J.; Young, C. MODIS-informed greenness responses to daytime land surface temperature fluctuations and wildfire disturbances in the Alaskan Yukon River Basin. Int. J. Remote Sens. 2012, 34, 2187–2199. [Google Scholar] [CrossRef]
  62. Horowitz, F.G. MODIS Daily Land Surface Temperature Estimates in Google Earth Engine as an Aid in Geothermal Energy Siting. In Proceedings of the Proceedings World Geothermal Congress, Melbourne, Australia, 16–24 April 2015. [Google Scholar]
  63. Menne, M.J.; Durre, I.; Korzeniewski, B.; McNeal, S.; Thomas, K.; Yin, X.; Anthony, S.; Ray, R.; Vose, R.S.; Gleason, B.E. Global historical climatology network-daily (GHCN-Daily), Version 3. Phan Thiet. NOAA National Climatic Data Center. NOAA Natl. Clim. Data Cent. 2012. [Google Scholar] [CrossRef]
  64. Foody, G.M. Explaining the unsuitability of the kappa coefficient in the assessment and comparison of the accuracy of thematic maps obtained by image classification. Remote Sens. Environ. 2020, 239, 111630. [Google Scholar] [CrossRef]
  65. Rwanga, S.S.; Ndambuki, J.M. Accuracy assessment of land use/land cover classification using remote sensing and GIS. Int. J. Geosci. 2017, 8, 611–622. [Google Scholar] [CrossRef] [Green Version]
  66. ThienNhien.Net. Thousands of Precious Wood Blocks in Song Luy Forest Have Been Lowered. Available online: https://www.thiennhien.net/2017/12/26/hang-ngan-khoi-go-quy-o-rung-song-luy-bi-triet-ha/ (accessed on 26 December 2017).
  67. Vietnam Agency. Binh Thuan Drought. Available online: https://dantocmiennui.vn/cuoc-chien-chong-sa-mac-hoa-o-binh-thuan/232632.html (accessed on 12 June 2019).
  68. Land Use in Bac Binh Distric. 2019. Available online: https://stnmt.binhthuan.gov.vn/mDefault.aspx?sid=1326&pageid=3601&catid=65791&id=566154&catname=dat-dai&title=ke-hoach-su-dung-dat-nam-2019-huyen-bac-binh (accessed on 18 December 2019).
  69. MARD. Decision on Promulgating the Operating Process for Regulating Ca Giay Lake in Binh Thuan Province. Available online: https://thuvienphapluat.vn/van-ban/xay-dung-do-thi/Quyet-dinh-52-2005-QD-BNN-Quy-trinh-van-hanh-dieu-tiet-ho-chua-nuoc-Ca-Giay-tinh-Binh-Thuan-4378.aspx (accessed on 24 August 2005).
  70. Phan, T.N.; Kappas, M.; Nguyen, K.T.; Tran, T.P.; Tran, Q.V.; Emam, A.R. Evaluation of MODIS land surface temperature products for daily air surface temperature estimation in northwest Vietnam.pdf. Int. J. Remote Sens. 2019. [Google Scholar] [CrossRef]
  71. Fonseka, H.P.U.; Zhang, H.; Sun, Y.; Su, H.; Lin, H.; Lin, Y. Urbanization and Its Impacts on Land Surface Temperature in Colombo Metropolitan Area, Sri Lanka, from 1988 to 2016. Remote Sens. 2019, 11, 957. [Google Scholar] [CrossRef] [Green Version]
  72. Lai, S.; Leone, F.; Zoppi, C.J.S. Spatial Distribution of Surface Temperature and Land Cover: A Study Concerning Sardinia, Italy. Sustainability 2020, 12, 3186. [Google Scholar] [CrossRef] [Green Version]
  73. Vietnam Agency. Titanium Exploitation in Binh Thuan. Available online: https://baotintuc.vn/kinh-te/quy-hoach-khai-thac-su-dung-titan-bai-2-loi-bat-cap-hai-20190515122346606.htm (accessed on 15 May 2019).
  74. MONRE. To Definitely Handle the Situation of Illegal Mineral Exploitation. Available online: http://www.monre.gov.vn/Pages/bac-binh-%E2%80%93-binh-thuan--xu-ly-dut-diem-tinh-trang-khai-thac-khoang-san-trai-phep.aspx (accessed on 12 February 2020).
  75. Vietnam Agency. Bac Binh District Focuses on Rectifying Illegal Mineral Exploitation Activities in the Area. Available online: https://www.binhthuan.gov.vn/4/469/65117/567281/tin-dia-phuong/huyen-bac-binh-tap-trung-chan-chinh-hoat-dong-khai-thac-khoang-san-trai-phep-tren-dia-ban.aspx (accessed on 20 January 2020).
  76. Vietnam Agency. Bac Binh Applies High Technology in Agricultural Production. Available online: https://dantocmiennui.vn/kinh-nghiem-lam-an/bac-binh-ung-dung-cong-nghe-cao-trong-san-xuat-nong-nghiep/282631.html (accessed on 23 January 2020).
  77. Brown, M.E.; Pinzón, J.E.; Didan, K.; Morisette, J.T.; Tucker, C.J. Evaluation of the consistency of long-term NDVI time series derived from AVHRR, SPOT-vegetation, SeaWiFS, MODIS, and Landsat ETM+ sensors. IEEE Trans. Geosci. Remote Sens. 2006, 44, 1787–1793. [Google Scholar] [CrossRef]
  78. Weng, Q.; Fu, P.; Gao, F. Generating daily land surface temperature at Landsat resolution by fusing Landsat and MODIS data. Remote Sens. Environ. 2014, 145, 55–67. [Google Scholar] [CrossRef]
  79. Good, E.J.; Ghent, D.J.; Bulgin, C.E.; Remedios, J.J. A spatiotemporal analysis of the relationship between near-surface air temperature and satellite land surface temperatures using 17 years of data from the ATSR series. J. Geophys. Res. Atmos. 2017, 122, 9185–9210. [Google Scholar] [CrossRef]
  80. Gallo, K.; Hale, R.; Tarpley, D.; Yu, Y. Evaluation of the relationship between air and land surface temperature under clear-and cloudy-sky conditions. J. Appl. Meteorol. Climatol. 2011, 50, 767–775. [Google Scholar] [CrossRef]
  81. Tran, H.T.; Campbell, J.B.; Tran, T.D.; Tran, H.T. Monitoring drought vulnerability using multispectral indices observed from sequential remote sensing (Case Study: Tuy Phong, Binh Thuan, Vietnam). Geosci. Remote Sens. 2017, 54, 167–184. [Google Scholar] [CrossRef] [Green Version]
  82. Islam, S.; Ma, M. Geospatial Monitoring of Land Surface Temperature Effects on Vegetation Dynamics in the Southeastern Region of Bangladesh from 2001 to 2016. ISPRS Int. J. Geoinf. 2018, 7, 486. [Google Scholar] [CrossRef] [Green Version]
Figure 1. Study area—Bac Binh district, Binh Thuan province, Vietnam.
Remotesensing 12 04067 g001
Figure 2. Workflow to extract LST from Landsat images.
Remotesensing 12 04067 g002
Figure 3. Share of land-cover classes in dry season from Landsat images from 1989 and 2019. (a) Bare Land and Green Vegetation, (b) Water Bodies and Built-up Area.
Remotesensing 12 04067 g003
Figure 4. Land-cover classes for 1989, 1994, 1999, 2000, 2004, 2009, 2014, and 2019.
Remotesensing 12 04067 g004
Figure 5. LST (°C) maps for selected years between 1989 and 2019.
Remotesensing 12 04067 g005
Figure 6. The mean LST (°C) by land-cover type from 1989 to 2019.
Remotesensing 12 04067 g006
Figure 7. Coverage percentage by LST ranges from 1989 to 2019.
Remotesensing 12 04067 g007
Figure 8. Minimum, mean and maximum value of LST from 1989 to 2019.
Remotesensing 12 04067 g008
Figure 9. Comparison of Landsat LST with AT in-situ measurements of Phan Thiet weather station from 1989 to 2019.
Remotesensing 12 04067 g009
Figure 10. Change trends for LST range and land-cover by classes from 1989 to 2019. (a) Share of are with LST > 35 °C vs. share of area with Bare Land and Built-up Area, (b) Share of are with LST < 35 °C vs. share of area with Green Vegetation and Water Bodies.
Remotesensing 12 04067 g010
Table 1. List of processed Landsat images for the Bac Binh area.
NoPeriodSensorNoPeriodSensor
YearMonthDateYearMonthDate
0119890125LandSat TM1620040103LandSat TM
19890201LandSat TM20040424LandSat TM
19890306LandSat TM
0219891227LandSat TM1720050105LandSat TM
19900213LandSat TM20050222LandSat TM
19900317LandSat TM20050326LandSat TM
0319901214LandSat TM1820060313LandSat TM
19910131LandSat TM20060414LandSat TM
19910421LandSat TM
0419911214LandSat TM1920070127LandSat TM
19920203LandSat TM20070228LandSat TM
19920322LandSat TM20070401LandSat TM
0519921201LandSat TM2020080318LandSat TM
19930309LandSat TM20080318LandSat TM
19930322LandSat TM20080403LandSat TM
0619940123LandSat TM2120090116LandSat TM
19940312LandSat TM20090217LandSat TM
19940413LandSat TM20090321LandSat TM
0719941225LandSat TM2220091218LandSat TM
19950110LandSat TM20100204LandSat TM
19950211LandSat TM20100210LandSat ETM +
0819960113LandSat TM2320110106LandSat TM
19960129LandSat TM20110207LandSat TM
19960301LandSat TM
0919970131LandSat TM2420130417LandSat OLI
19970304LandSat TM20130119LandSat ETM +
19970421LandSat TM
1019971201LandSat TM2520140130LandSat OLI
19980102LandSat TM20140215LandSat OLI
19980323LandSat TM20140319LandSat OLI
1119990206LandSat TM2620150218LandSat OLI
19990310LandSat TM20150322LandSat OLI
20150407LandSat OLI
1219991223LandSat TM2720160120LandSat OLI
20000328LandSat TM20160221LandSat OLI
20160308LandSat OLI
1320010110LandSat TM2820170207LandSat OLI
20010227LandSat TM20170223LandSat OLI
20010331LandSat TM20170311LandSat OLI
1420020105LandSat ETM +2920180125LandSat OLI
20020206LandSat ETM +20180216LandSat OLI
20020310LandSat ETM +20180314LandSat OLI
1520030108LandSat ETM +3020190128LandSat OLI
20030225LandSat ETM +20190213LandSat OLI
20030329LandSat ETM +20190317LandSat OLI
Table 2. Land-cover classification accuracy for selected years.
Year Bare Land
(%)
Green Vegetation
(%)
Water Bodies
(%)
Built-Up Area
(%)
Overall Accuracy
(%)
Kappa Coefficient
2000User’s accuracy61.0165.4779.5677.9773.360.63
Producer’s accuracy62.0765.4780.7476.03
2010User’s accuracy63.0164.3680.1578.8973.250.63
Producer’s accuracy67.6462.9281.3975.43
2019User’s accuracy68.4266.2689.3186.8280.750.73
Producer’s accuracy67.2467.9087.9787.50
Table 3. The comparison of mean LST from Landsat and MODIS11A2 from 2001 to 2019.
YearLandsat-LST (°C)MODIS11A2-LST (°C)Difference (°C)YearLandsat-LST (°C)MODIS11A2-LST (°C)Difference(°C)
200135.9835.130.85201032.3633.32−0.96
200236.7636.120.63201131.6533.01−1.36
200335.0636.15−1.10201332.6332.84−0.21
200431.5332.90−1.37201435.0534.440.62
200539.6338.710.92201535.9235.290.63
200638.8038.350.45201635.4735.68−0.21
200736.2536.30−0.05201733.5933.350.24
200833.8135.10−1.28201832.7732.220.55
200935.4834.930.54201933.8733.470.40
Table 4. Statistical comparisons between LST of Landsat and MOD11A2 images from 2001 to 2019.
NoLST ImageMinimum (°C)Maximum (°C)Mean (°C)Standard Deviation
1Landsat31.5339.6334.812.29
2MODIS11A232.2238.7134.851.85
Publisher’s Note: MDPI stays neutral with regard to jurisdictional claims in published maps and institutional affiliations.

