Opinion

Multi-Year Winter Variations in Suspended Sediment Flux through the Bohai Strait

1
College of Marine Geosciences, Ocean University of China, 238 Songling Road, Qingdao 266100, China
2
Key Lab of Submarine Sciences & Prospecting Techniques, MOE, Ocean University of China, 238 Songling Road, Qingdao 266100, China
*
Author to whom correspondence should be addressed.
Remote Sens. 2020, 12(24), 4066; https://doi.org/10.3390/rs12244066
Submission received: 4 November 2020 / Revised: 25 November 2020 / Accepted: 8 December 2020 / Published: 11 December 2020
(This article belongs to the Section Ocean Remote Sensing)

Abstract

:
The Bohai Strait is the only channel that allows material exchanges between the Bohai Sea and the Yellow Sea. It is also the only channel for the transportation of materials from the Yellow River to the Yellow Sea and the East China Sea. The supply of suspended sediment from the Bohai Sea plays a decisive role in the evolution of the mud area in the northern Yellow Sea and even the muddy area in the southern Yellow Sea. Previous studies have demonstrated that sediment exchange through the Bohai Strait occurs mainly in winter, but due to the lack of long-term observational data, changes in the sediment flux over multiple years have not been studied. In this paper, based on L1B data from the MODIS (Moderate Resolution Imaging Spectroradiometer) -Aqua satellite, an interannual time series of the suspended sediment concentration (SSC) at each depth layers in the Bohai Strait in winter was established through 16 cruises that benefited from the complete vertical mixing water in the strait in winter. The numerical model FVCOM, (Finite-Volume Community Ocean Model) which is forced by the hourly averaged wind field, reflected the effect of winter gales. With the model simulated winter current from 2002 to the present and the SSC at each layer, multi-year winter suspended sediment flux data were obtained for the Bohai Strait. This study found that in the winter, the suspended sediment output from the Bohai Sea to the Yellow Sea through the southern part of the Bohai Strait, while the suspended sediment input from the Yellow Sea to the Bohai Sea is through the northern part. In terms of long-term changes, the net flux ranged between 1.22 to 2.70 million tons in winter and showed a weak downward trend. The output flux and input flux both showed an upward trend, but the increase rate of the input flux was 51,100 tons/year, which was higher than the increase of the output flux rate (46,100 tons/year). These changes were mainly controlled by the increasing strength of east component of winter wind. And the weak decrease in net flux is controlled by the difference of output and input flux.

Graphical Abstract

1. Introduction

Research on the suspended sediment fluxes of the Bohai Strait is relatively extensive, with a variety of technical methods. Seasonal variation in the flux and the differences in the suspended sediment concentration (SSC) between different water layers are mainly controlled by the advance and retreat of the cold water mass in the northern Yellow Sea and the temperature and salinity changes in the Bohai Strait [1,2,3]. Suspended sediment transport though the Bohai Strait is concentrated mainly on the south side of the Bohai Strait and occurs mainly in winter. This is driven by the eastward current in the southern Bohai Strait and the effects of winter wind [4,5,6], and the scope is mainly restricted by current fronts [7]. Concerning the factors that affect SSC and suspended sediment flux, previous studies have focused on the results related to wind magnitude, wind direction, water temperature, salinity, river-delivered sediments, shoreline evolution and even the sea ice [8,9,10,11,12,13,14]. Compared with the number of studies at the seasonal scale, rare works are conducted on the multi-year variations in flux in the Bohai Strait.
Satellite remote sensing is widely used in suspended sediment distribution in the Bohai Strait and adjacent seas [1,11,15]. Obvious seasonal variation is found in the SSC near the Bohai Strait [1,9,15], with the highest value in winter and lower value in other seasons. This is caused by the wind velocity change, which can strengthen the hydrodynamic conditions such as waves and currents during a strong winter wind period. Thus, there is a strip of water with high SSC from the northern Shandong Peninsula to the east, bypassing the eastern Shandong Peninsula [2,5]. From the perspective of long-term changes, the SSC in different areas of the Bohai Sea are quite different. The study found that the areas around the Yellow River mouth, Bohai Bay, and Laizhou Bay experienced the largest changes. However, the interannual changes in the SSC in the central Bohai Sea and the northern Yellow Sea are very small [1,15]. Although satellite remote sensing is often used in suspended sediment study, it is typically applied to the sea surface water, and it has few applications in the study of middle-depth and deeper waters.
In addition, in previous studies on the flux of suspended sediment, the surface flux is generally retrieved by remote sensing, while the mid-bottom flux generally relies on the short-term measured or model simulated SSC and current data [16,17,18]. However, due to the lack of accurate sediment movement parameters, the accuracy of the SSC simulation is not satisfactory enough. Moreover, due to the lack of long-term measured current data, there are very few studies on the interannual variation in suspended sediment flux through the Bohai Strait. Therefore, this paper uses remote sensing SSC, in situ measured SSC and the numerical simulate currents to study the multi-year winter variation of the sediment flux in the Bohai Strait. Sediment flux in the Bohai Strait in winter is of great significance to material exchanges between the Bohai Sea and the Yellow Sea, the water quality environment in the marine pastures of the northern Shandong Peninsula, and the formation of muddy areas in the northern Yellow Sea as well as the southern Yellow Sea [14,15]. This study is also valuable as a reference in how to retrieve mid-bottom SSC from sea surface satellite data.

2. Study Area

The Bohai Sea is a shallow semi-enclosed inner shelf sea in northeastern China (Figure 1), with a total area of 77,000 km2 and an average water depth of 18 m [19]. The Bohai Sea is geographically composed by three shallow bays, Laizhou Bay, Bohai Bay, and Liaodong Bay, and the central Bohai Basin (Figure 1). Four main rivers deliver fresh water and sediment to the Bohai Sea, namely the Yellow River, the Haihe River, the Luanhe River, and the Liaohe River, among which the Yellow River has the highest water discharge and sediment load to the sea [11]. Approximately 70~90% of the Yellow River’s discharged sediment deposited around the Yellow River mouth [15,20,21], and the rest was transported to the open seas [1,15]. The Bohai Sea is connected to the Yellow Sea through the Bohai Strait. The Bohai Strait gradually deepens from south to north with a maximum water depth of more than 60 m. The Bohai Strait is a necessary channel for water exchange between the Bohai Sea and the Yellow Sea, and it is also the only pathway for the long distance transportation of suspended sediments delivered by the Yellow River. The width of the Bohai Strait is 106 km, with a line of islands extending from the Shandong peninsula, starting with Nanchangshan to Beihuangcheng, covering half of this distance across the strait. Thus, there should be an insular baffle which must effect on the circulation of sediment-laden waters.

3. Data and Methodology

3.1. Measured Hydrological Parameters

The measured data in this study mainly include SSC, water turbidity, temperature and salinity by SeaBird 911 conductivity-temperature-depth system (CTD). These in situ data were mainly used for the retrieval of remote sensing data and the verification of the retrieved results. The resolution of the temperature, salinity, and turbidity data was 1 m, and the resolution of the SSC data was based on the number of layers in the different water depths (generally 3–6 layers). To ensure a sufficient data volume, this study used measured data from different seasons for retrieval in order to obtain a retrieval model that can be applied to all seasons. The first dataset is from the joint voyage of the National Natural Science Foundation of China (11 cruises in total, see Figure 1), undertaken mainly by the “Dongfanghong 2” scientific research ship of Ocean University of China. The second dataset is from the joint voyage of the Qingdao Marine Science and Technology Pilot National Laboratory “Transparent Ocean” plan undertaken by the “Innovation 1” scientific research vessel of the Yantai Institute of Coastal Zone Research, Chinese Academy of Sciences in 2018 (3 cruises in total, see Table 1).

3.2. Fitting Methods for Each Water Layer

Due to the influence of stronger winter winds in the Bohai Sea and the Bohai Strait, the water bodies become fully mixed (Figure 2), with the water turbidity in the upper and lower layers relatively uniform. Therefore, the winter turbidity data over many years can be used to establish a fitting relationship between the surface layer and deeper layers in order to translate the surface remote sensing retrieval results into SSC in the middle and bottom layers.
According to the previous studies, the SSC in seawater had a significant correlation with the distribution of seawater turbidity. Thus, turbidity values can be converted into SSC values [3,7]. Since surface SSC retrievals use measured SSC data from multiple cruises, it is necessary to convert the turbidity of each layer into the SSC before fitting the relationship between the surface turbidity and the turbidity of each layer. The conversion formula used in this article is the conversion method established by Liu et al. The specific method is as follows (Figure 3).
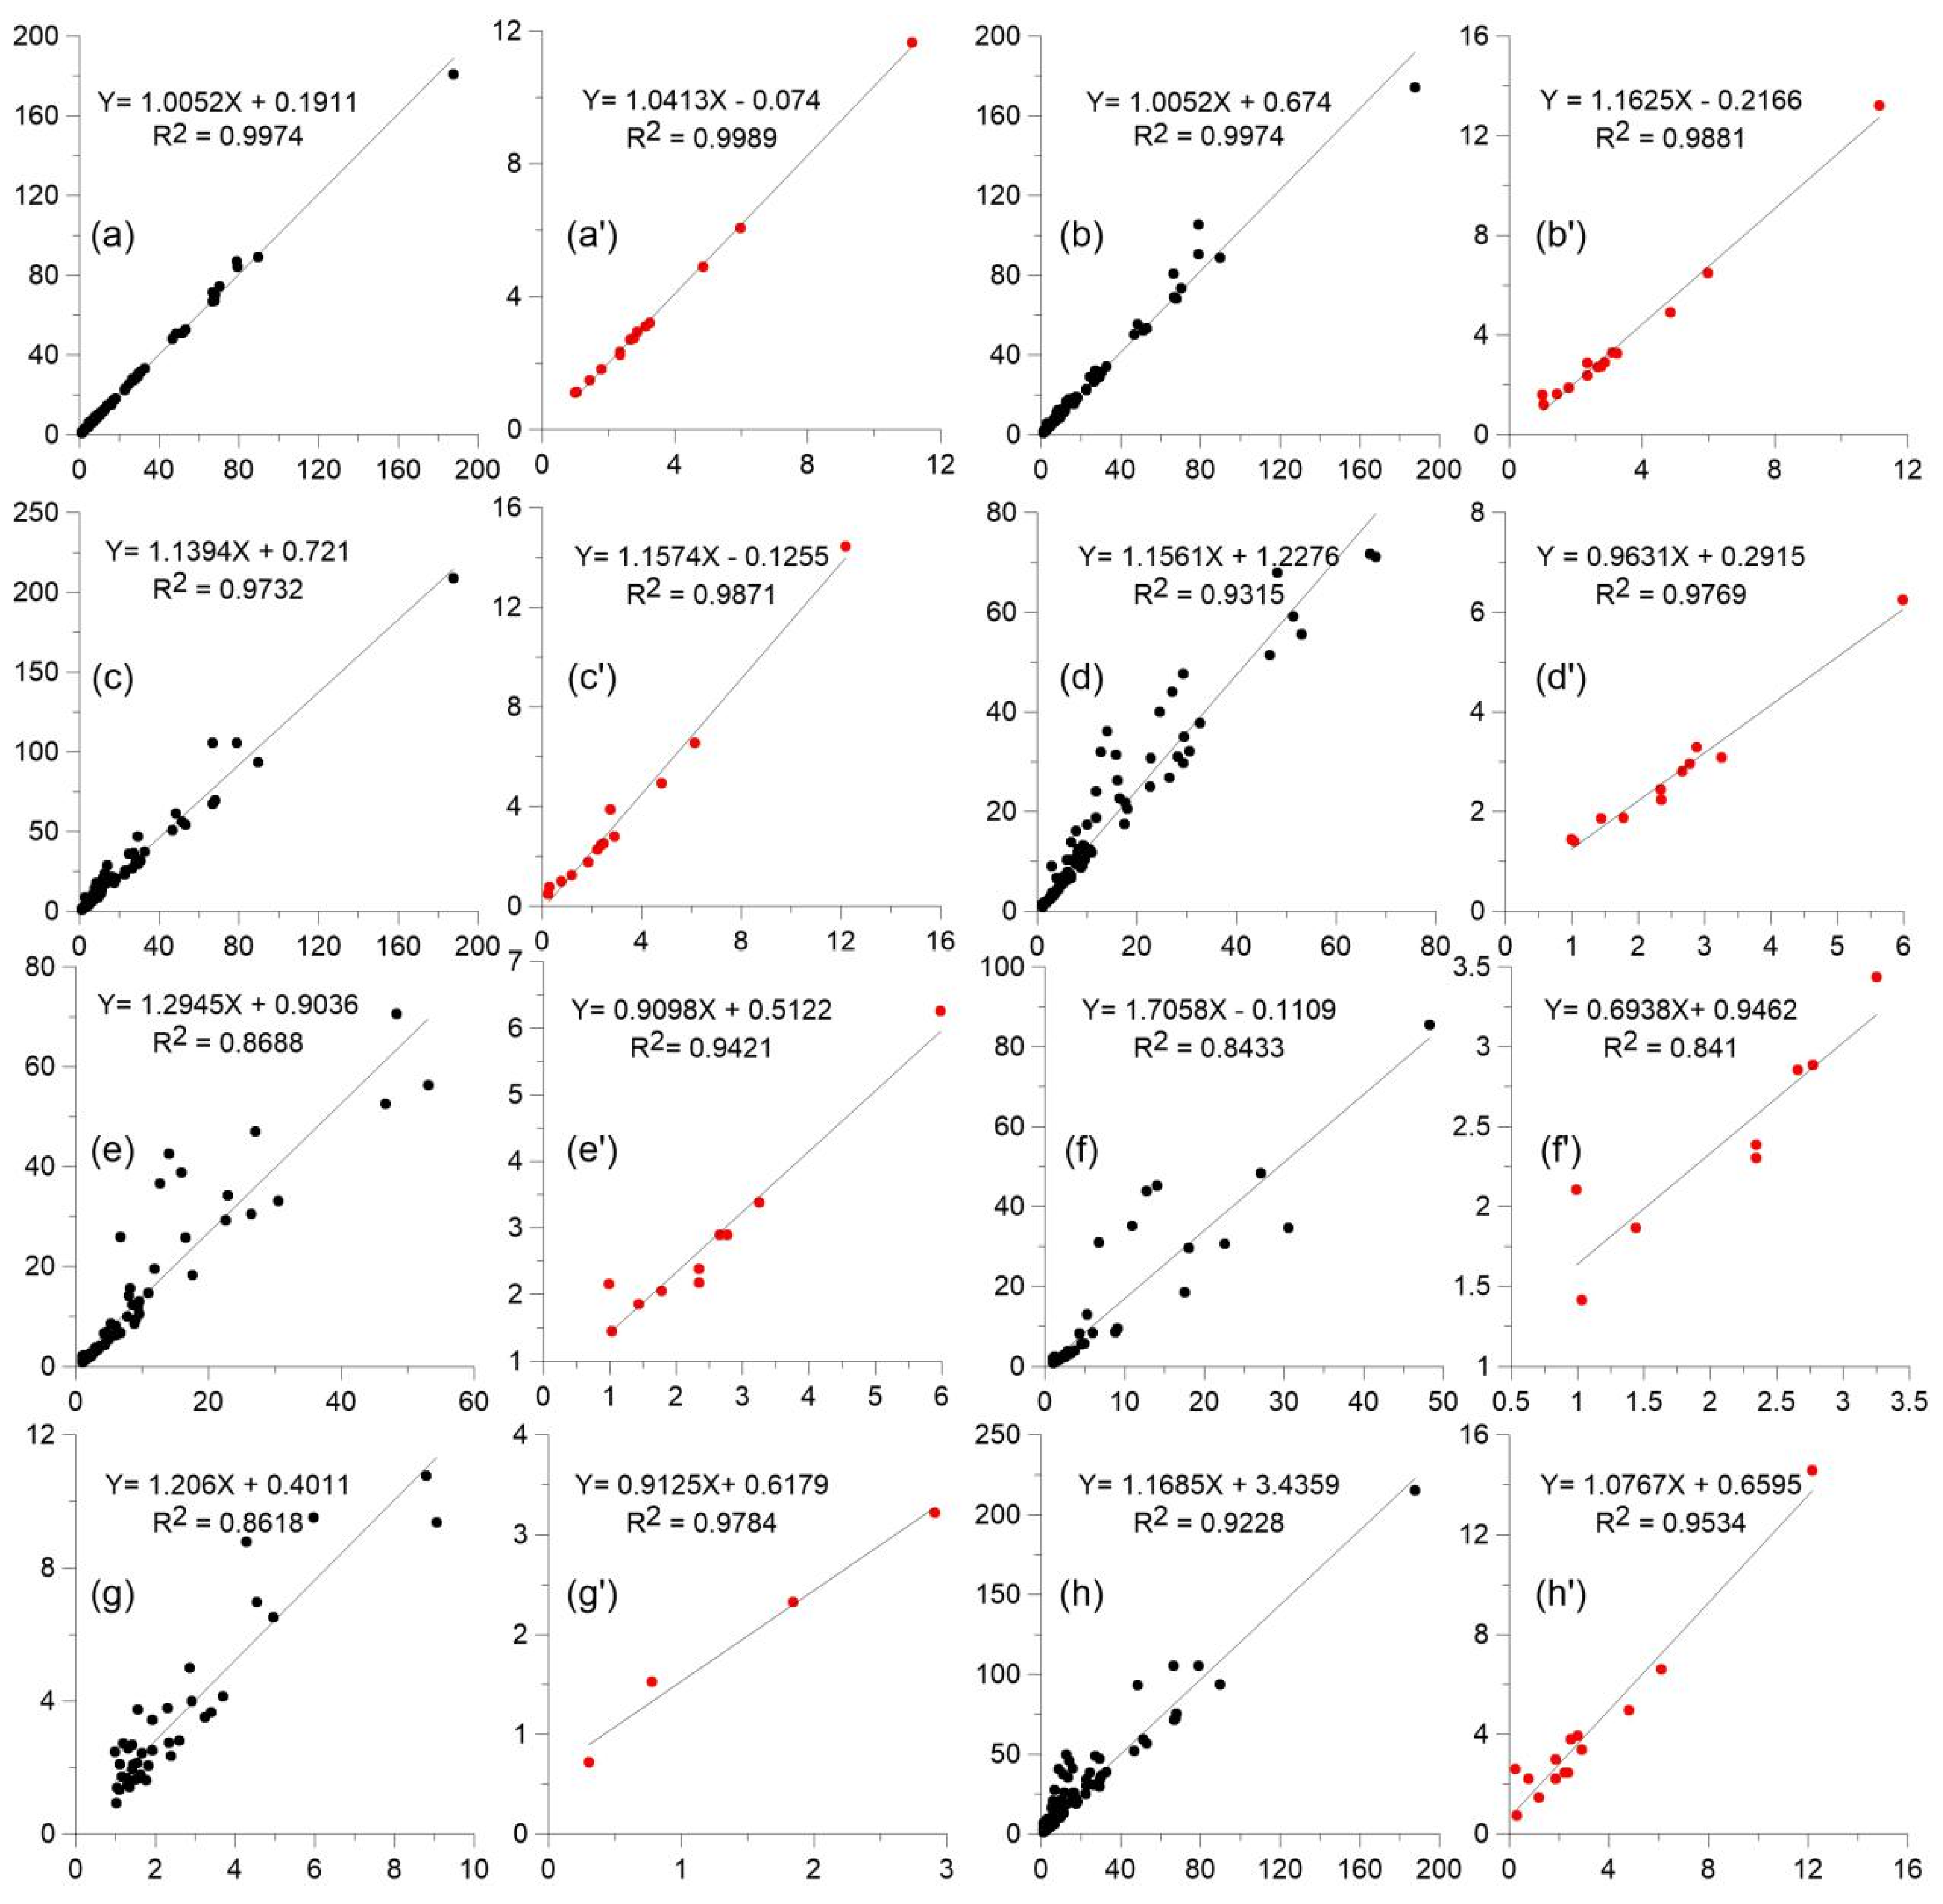
Figure 4 shows that the surface SSC has obvious linear relationships with the SSCs of the other layers. The correlation coefficient (R2) gradually decreases from the surface layer to the bottom layer, but the lowest value is still above 0.84. The root mean square error (RMSE) gradually increases from the surface to the bottom and is nearly always below 3.3 mg/L (Table 2), which indicates an acceptable fit for this article.

3.3. Remote Sensing Data

The remote sensing image data used were Moderate Resolution Imaging Spectroradiometer (MODIS)-Aqua satellite data downloaded from the NASA website (https://www.nasa.gov). The Level-1B (L1B) data for December, January, and February of each year from 2002 to 2018 (the winter of 16 years) were obtained. The images had a spatial resolution of 1 km.
The remote sensing data in this study were processed and transformed mainly using the SeaWiFS Data Analysis System (SeaDAS) software officially provided by NASA for atmospheric correction, cloud removal and other preliminary processing. The L1B remote sensing data were batched into Level-2 remote sensing reflectance (Rrs). When establishing a remote sensing retrieval model, the Rrs that best matched the measured data in time and space was selected. A time control period within 3 h was effective for our data. A fitting relationship between the remote sensing data and the measured data was established. In addition, because there is visible sea ice in the Bohai Sea and the Yellow Sea in winter, sea ice has a great influence on SSC retrieval. Therefore, this study used methods described in previous studies to remove the influence of sea ice [14,15].
With the above method, this study used the measured surface SSC at 28 stations to fit the remote sensing data of the Rrs555 band and establish a remote sensing retrieval model. The retrieval fitting function is as follows:
SSC = Exp (101.8 × Rrs555) × 1.301
The measured surface SSC had a high degree of fit with Rrs555; the R2 was 0.9522 (Figure 5a), indicating that the established retrieval model had good accuracy and met the requirements of this study.
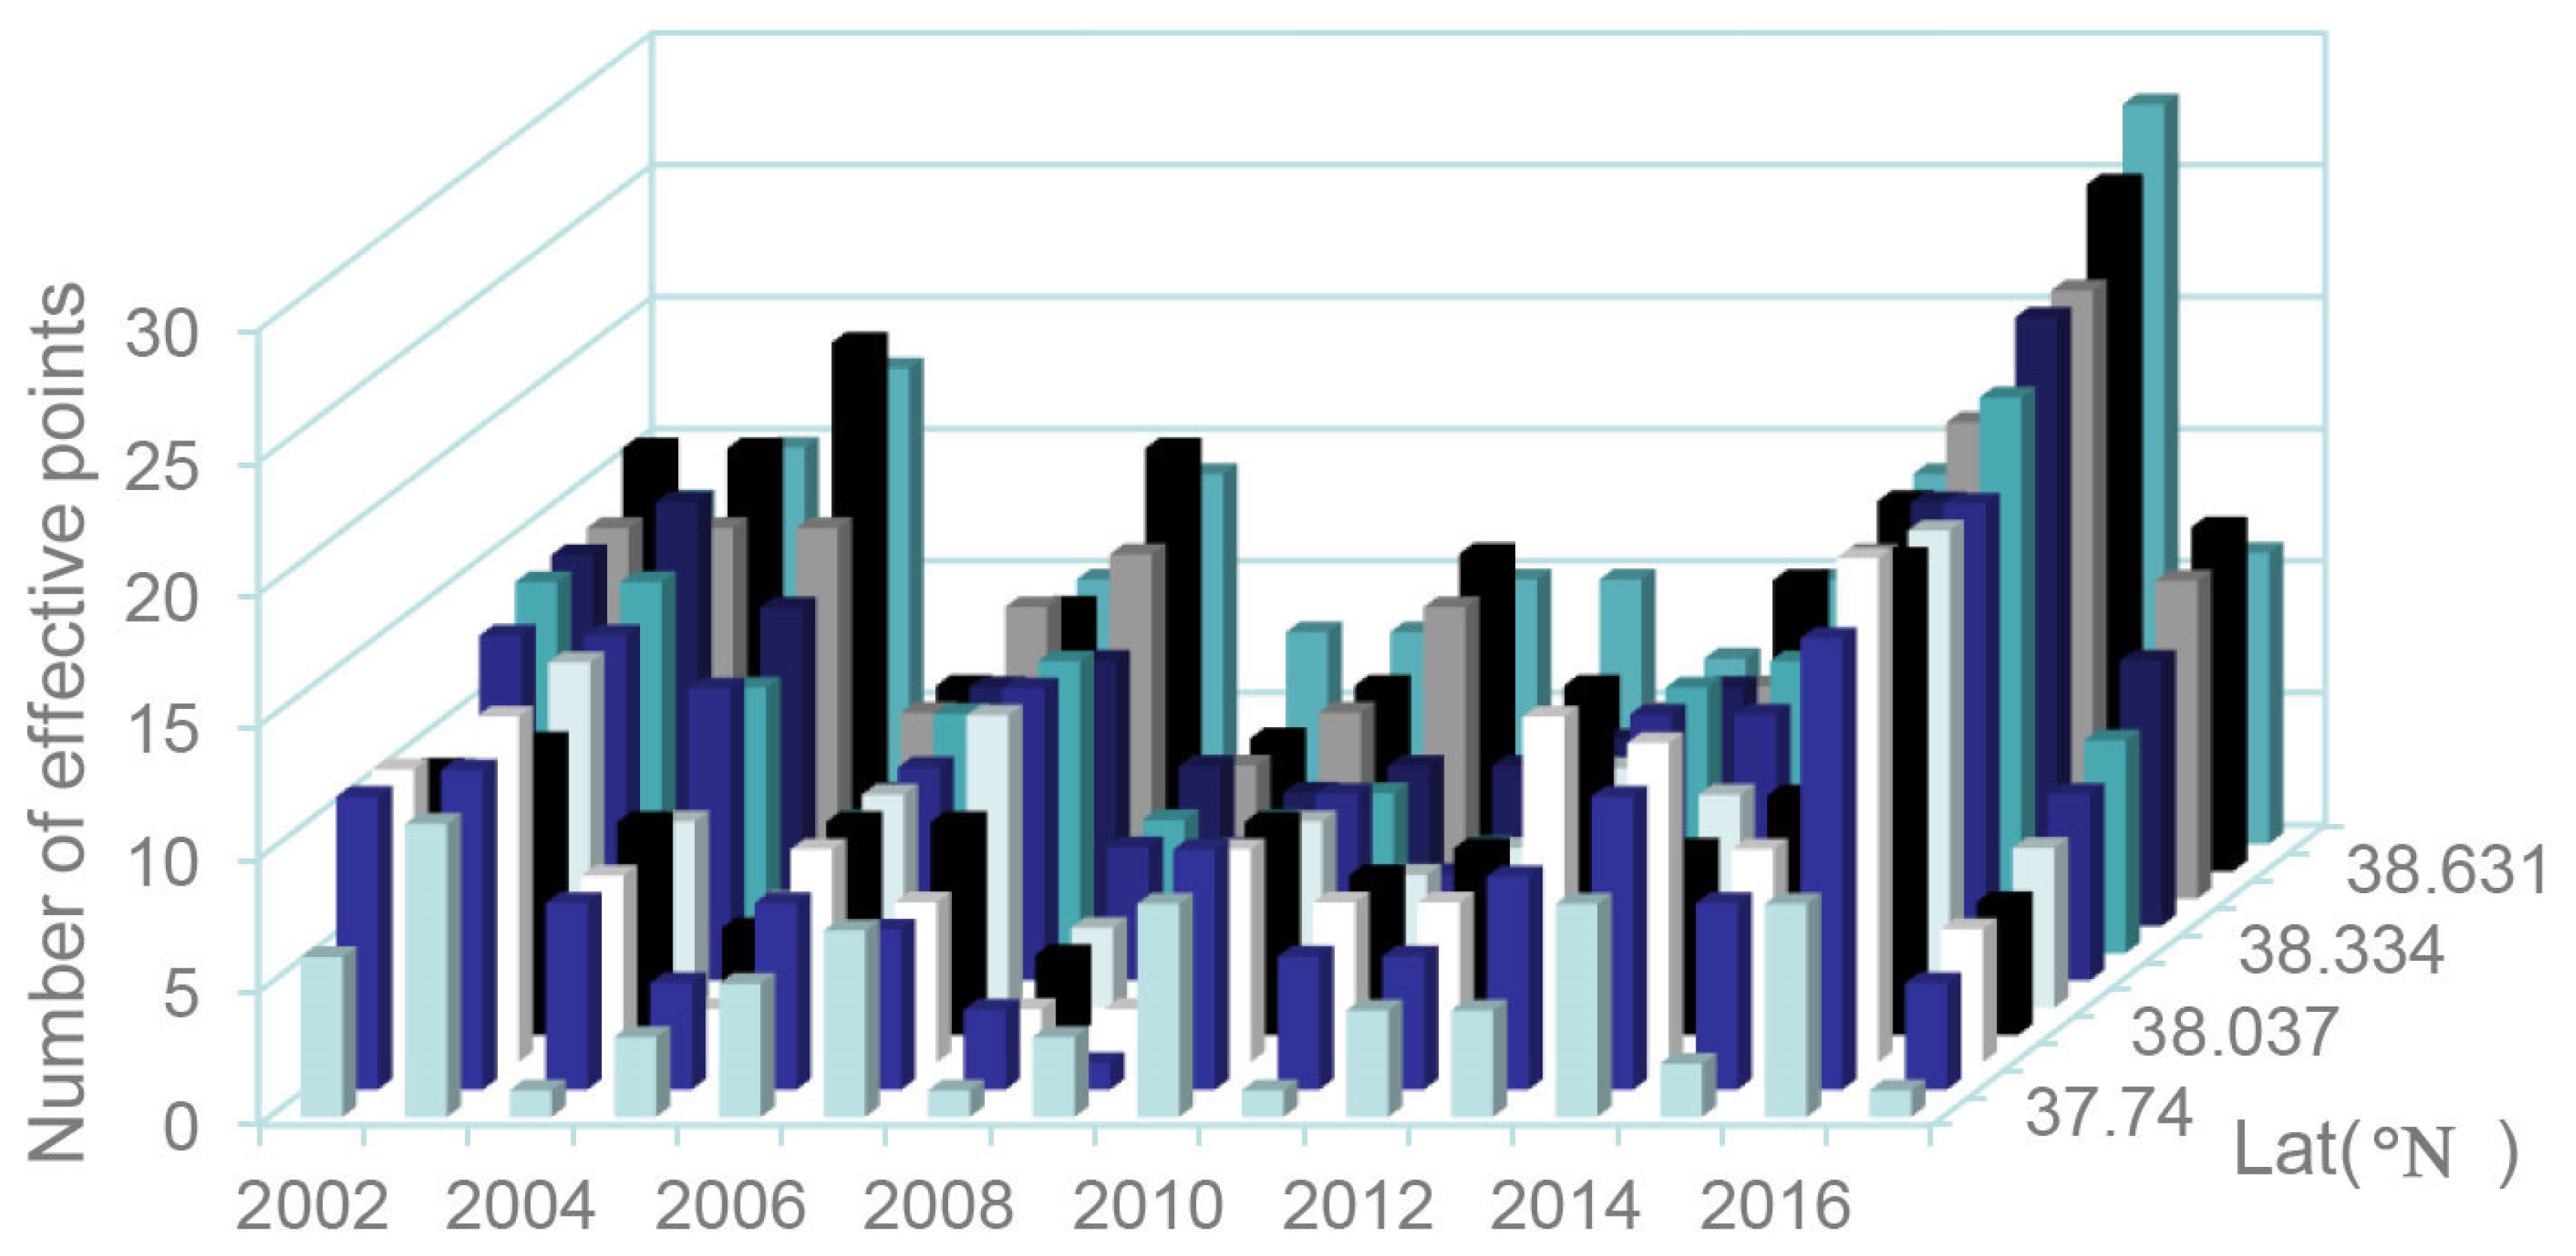
Figure 2 shows that the area with high SSC values in winter is mainly concentrated in the southern part of the Bohai Strait; this may indicate that suspended sediment transport in the Bohai Strait occurs mainly in this area. The difference between the acquisition times of the satellite image and the in situ data was less than 3 h, the spatial difference was less than 500 m, and the remaining data after the sea ice was removed were considered as valid data values. To control the quality of the data, when calculating the average SSC in winter, if there were fewer valid points in the southern Bohai Strait and nearby areas, the SSC value in that year was considered to be an unreliable value. Figure 6 shows that the number of valid points was low in 2008 and 2009, and the number of valid points in the southern Bohai Strait was extremely low in 2009 (Figure 6). Therefore, the data from 2009 were considered unreliable. In the following analysis, when analyzing the overall trends, unreliable results were not included.

3.4. Other Data

In this paper, the runoff and sediment transport data for the Yellow River were derived from the statistics from Lijin Station in the “Chinese River Sediment Bulletin”. In addition, this study used cross-calibrated multi-platform (CCMP) wind field data to analyze the effect of wind on the transport of suspended sediment. The CCMP wind field data are vector data derived from remote sensing systems (RSS); their temporal resolution is 6 h, and their spatial resolution is 0.25° × 0.25° (http://www.remss.com/measurements/ccmp).

3.5. Suspended Sediment Flux Calculation Method

Using the current data simulated by the Finite-Volume Community Ocean Model (FVCOM) and the predicted data for the suspended sediments in various layers of the Bohai Strait in winter over many years, the output and input fluxes of the suspended sediments were calculated quantitatively. To study the trend of the suspended sediment transport in the Bohai Strait in winter over many years, we first used the equation [22,23] (1):
F S = 0 H C U d z
The single-width fluxes at various points across the Bohai Strait were calculated, where FS represents the single-width flux at a given point, H represents the water depth (unit: m), C represents predicted SSC (unit: mg/L) fitted at each layer, and U represents the seasonal average velocity (unit: m/s). Then, Equation (2) was used to calculate the suspended sediment flux across the entire Bohai Strait:
F r = 0 S F S d s
where S represents the distance between the first and last points in the section.
Considering that the satellite image and the measured data were fitted in the form of a seasonal average, and considering the quality of the satellite image, the seasonal average result was used for the flux calculation. The established FVCOM applied hourly wind data from 2012 to 2018. The model also considered the effects of strong winter winds and different wind speed and direction conditions. The model has been verified in detail to prove its reliability [24].

4. Results

4.1. Multi-Year Variations in the Surface SSC in the Bohai Strait

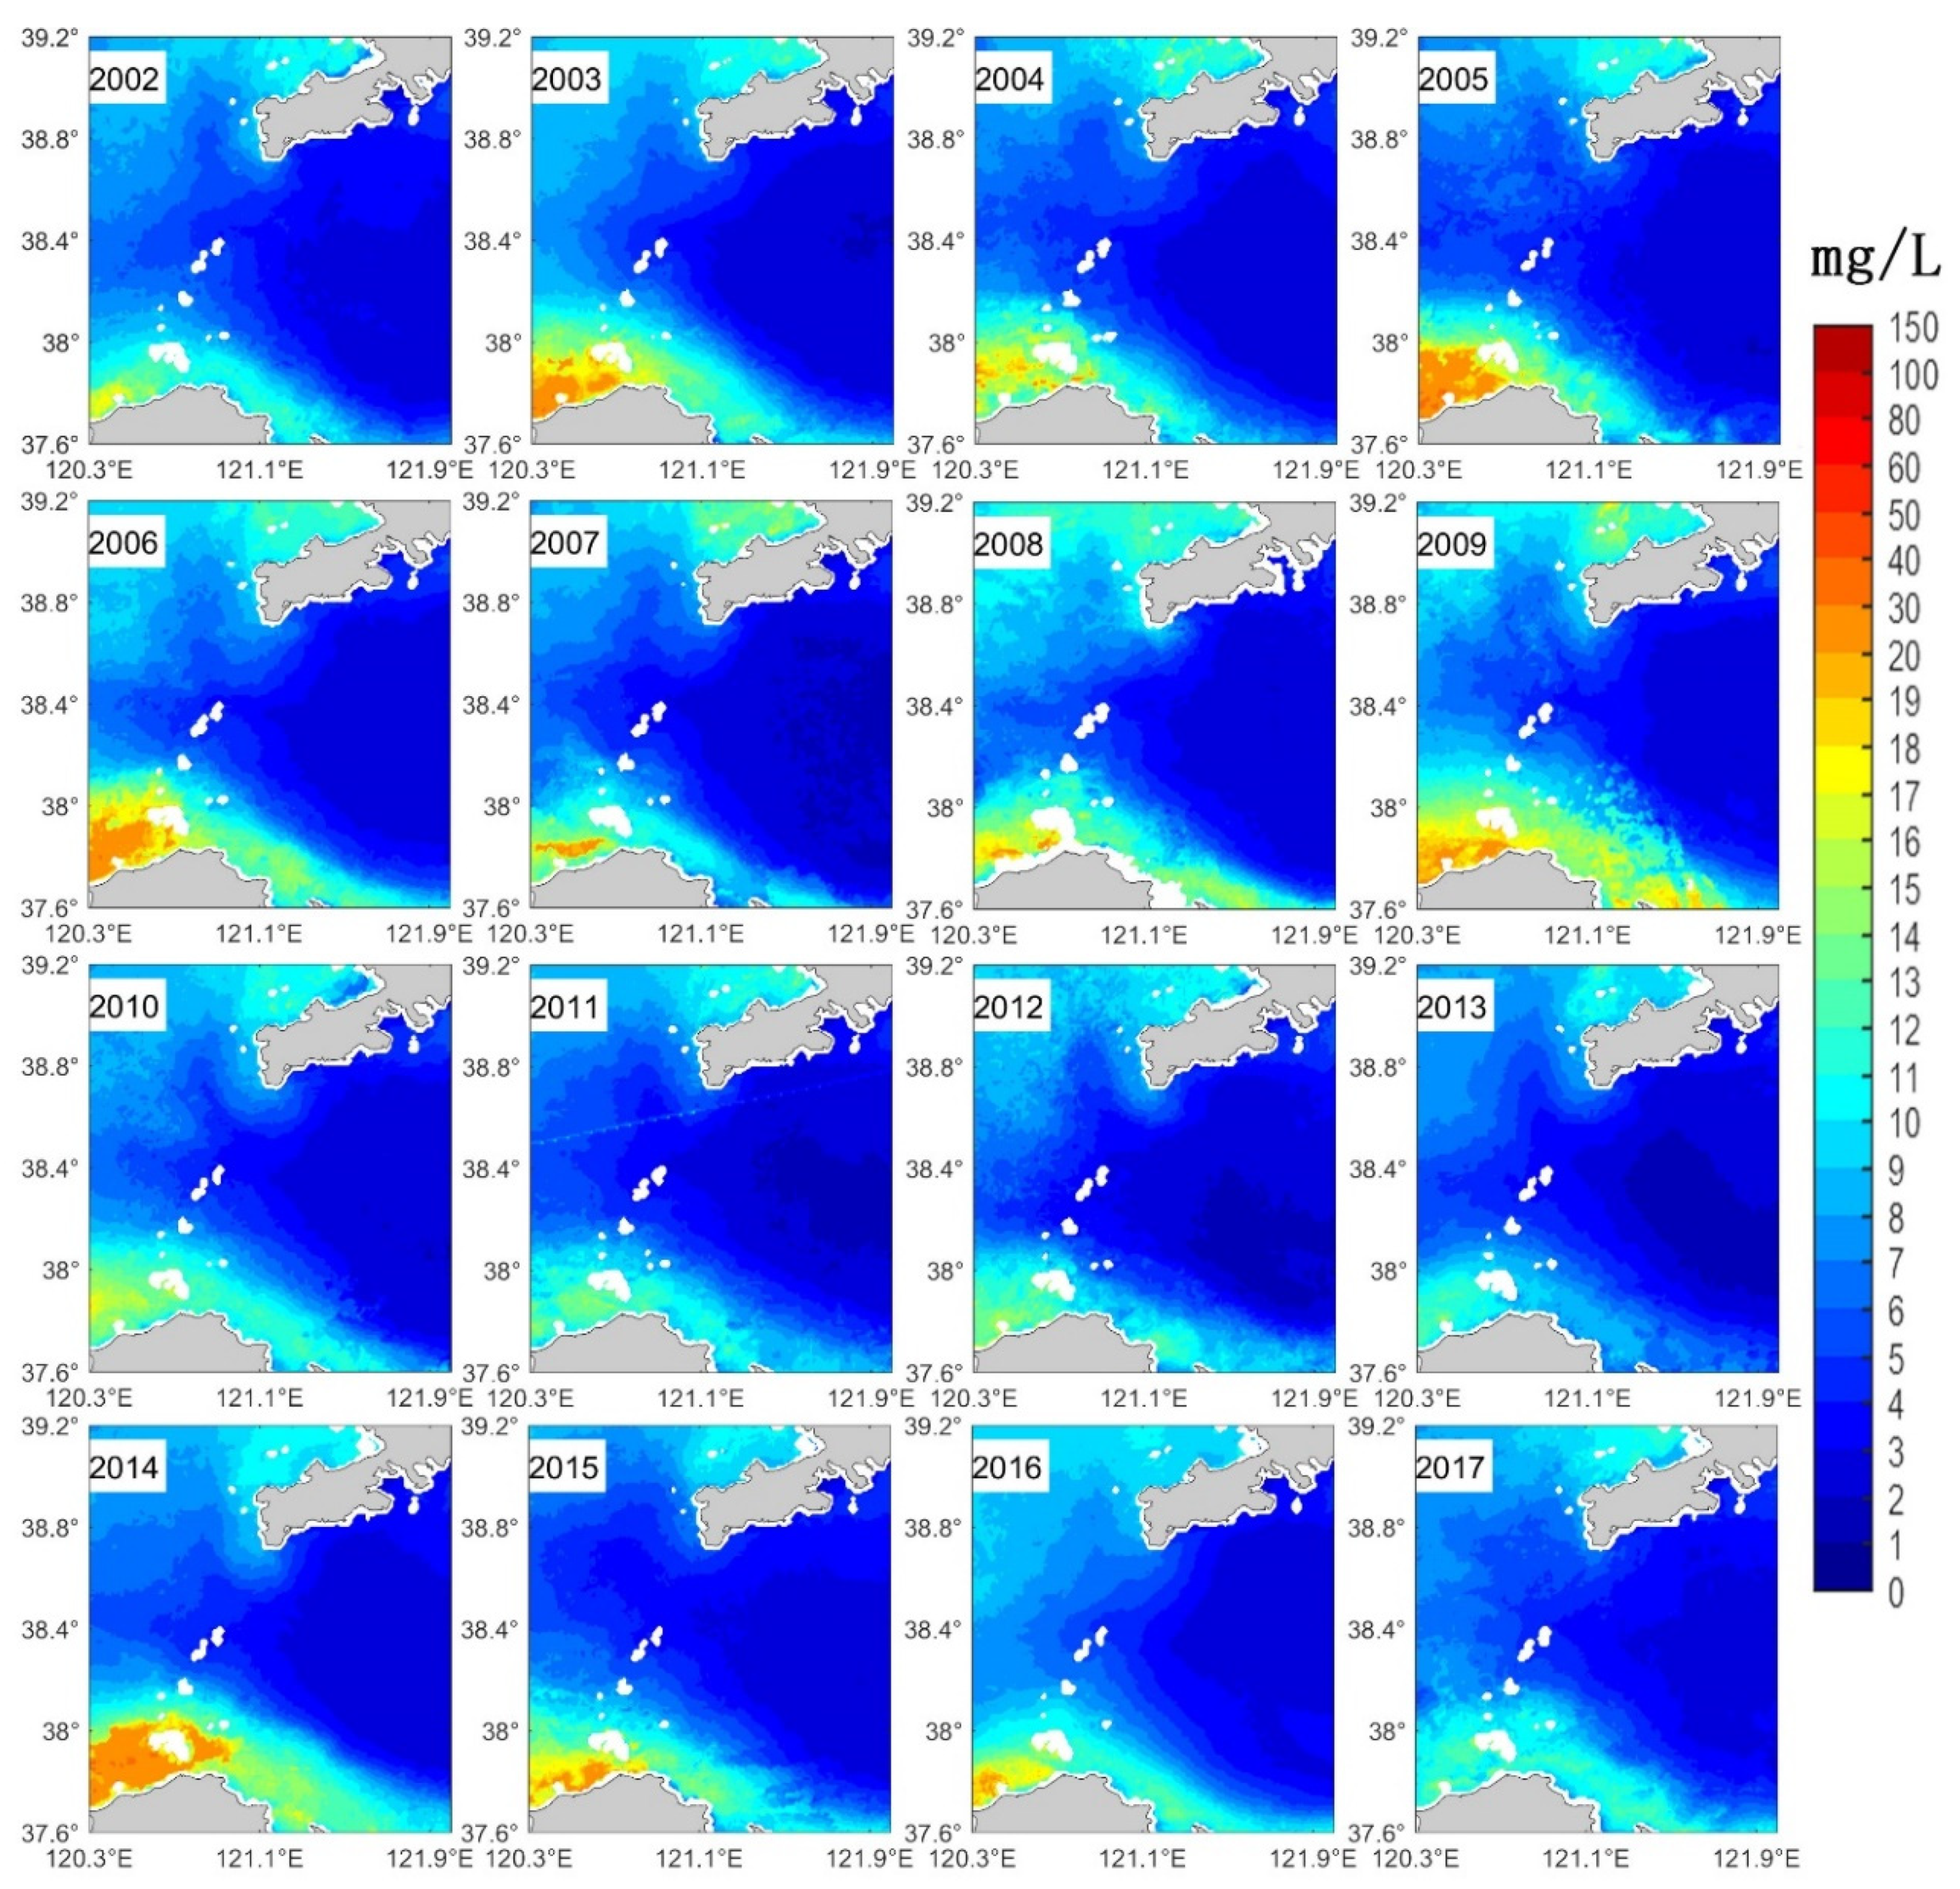
The surface SSC of the Bohai Strait exhibits obvious temporal and special variations. The interannual variation in the surface SSC in the northern Bohai Strait is small, with the difference between the highest and the lowest value is only approximately 5 mg/L (Figure 7). The surface SSC in the southern Strait varies greatly, and the difference between the highest and lowest values is approximately 28 mg/L. The southern part of the Bohai Strait is bounded by the northern islands of the Shandong Peninsula. The magnitude of change in the western strait is greater than that in the eastern. The difference between the highest and lowest value over these years in the eastern part of the strait is less than 10 mg/L. This maybe caused by the barrier effect of the island [17].

4.2. Multi-Year Variations in SSC Flux in the Bohai Strait in Winter

Due to the north-side inflow and the south-side outflow current, the suspended sediment will be transported in different directions between the southern and northern Bohai Strait (Figure 8) which directed from the Bohai Sea to the Yellow Sea in the south, and from the Yellow Sea to the Bohai Sea in the north. However, as along with the water depth deepen, the location of the boundary between waters with opposite flux directions changes significantly. The surface boundary is relatively stable throughout the year, mainly located near 38.56°N. There is a clear interannual change in the mid-level shear front, and the boundary generally exists between 38.47°N and 38.53°N. The position of the bottom boundary is also relatively stable near 38.4°N. The location of the boundary gradually moves southwardly with increasing depth. This is mainly because the surface currents of the Bohai Strait is mainly controlled by the east component of the winter wind, which clearly exhibited a stronger output flux corresponds to the heavy northwesterly wind (Figure 8a). The bottom of the Bohai Strait is invaded mainly by a warm current from the Yellow Sea. The intensity of the Yellow Sea Warm Current gradually weakens from the bottom to the top, so the location of the boundary gradually moves south from the surface to the bottom [1,24,25].
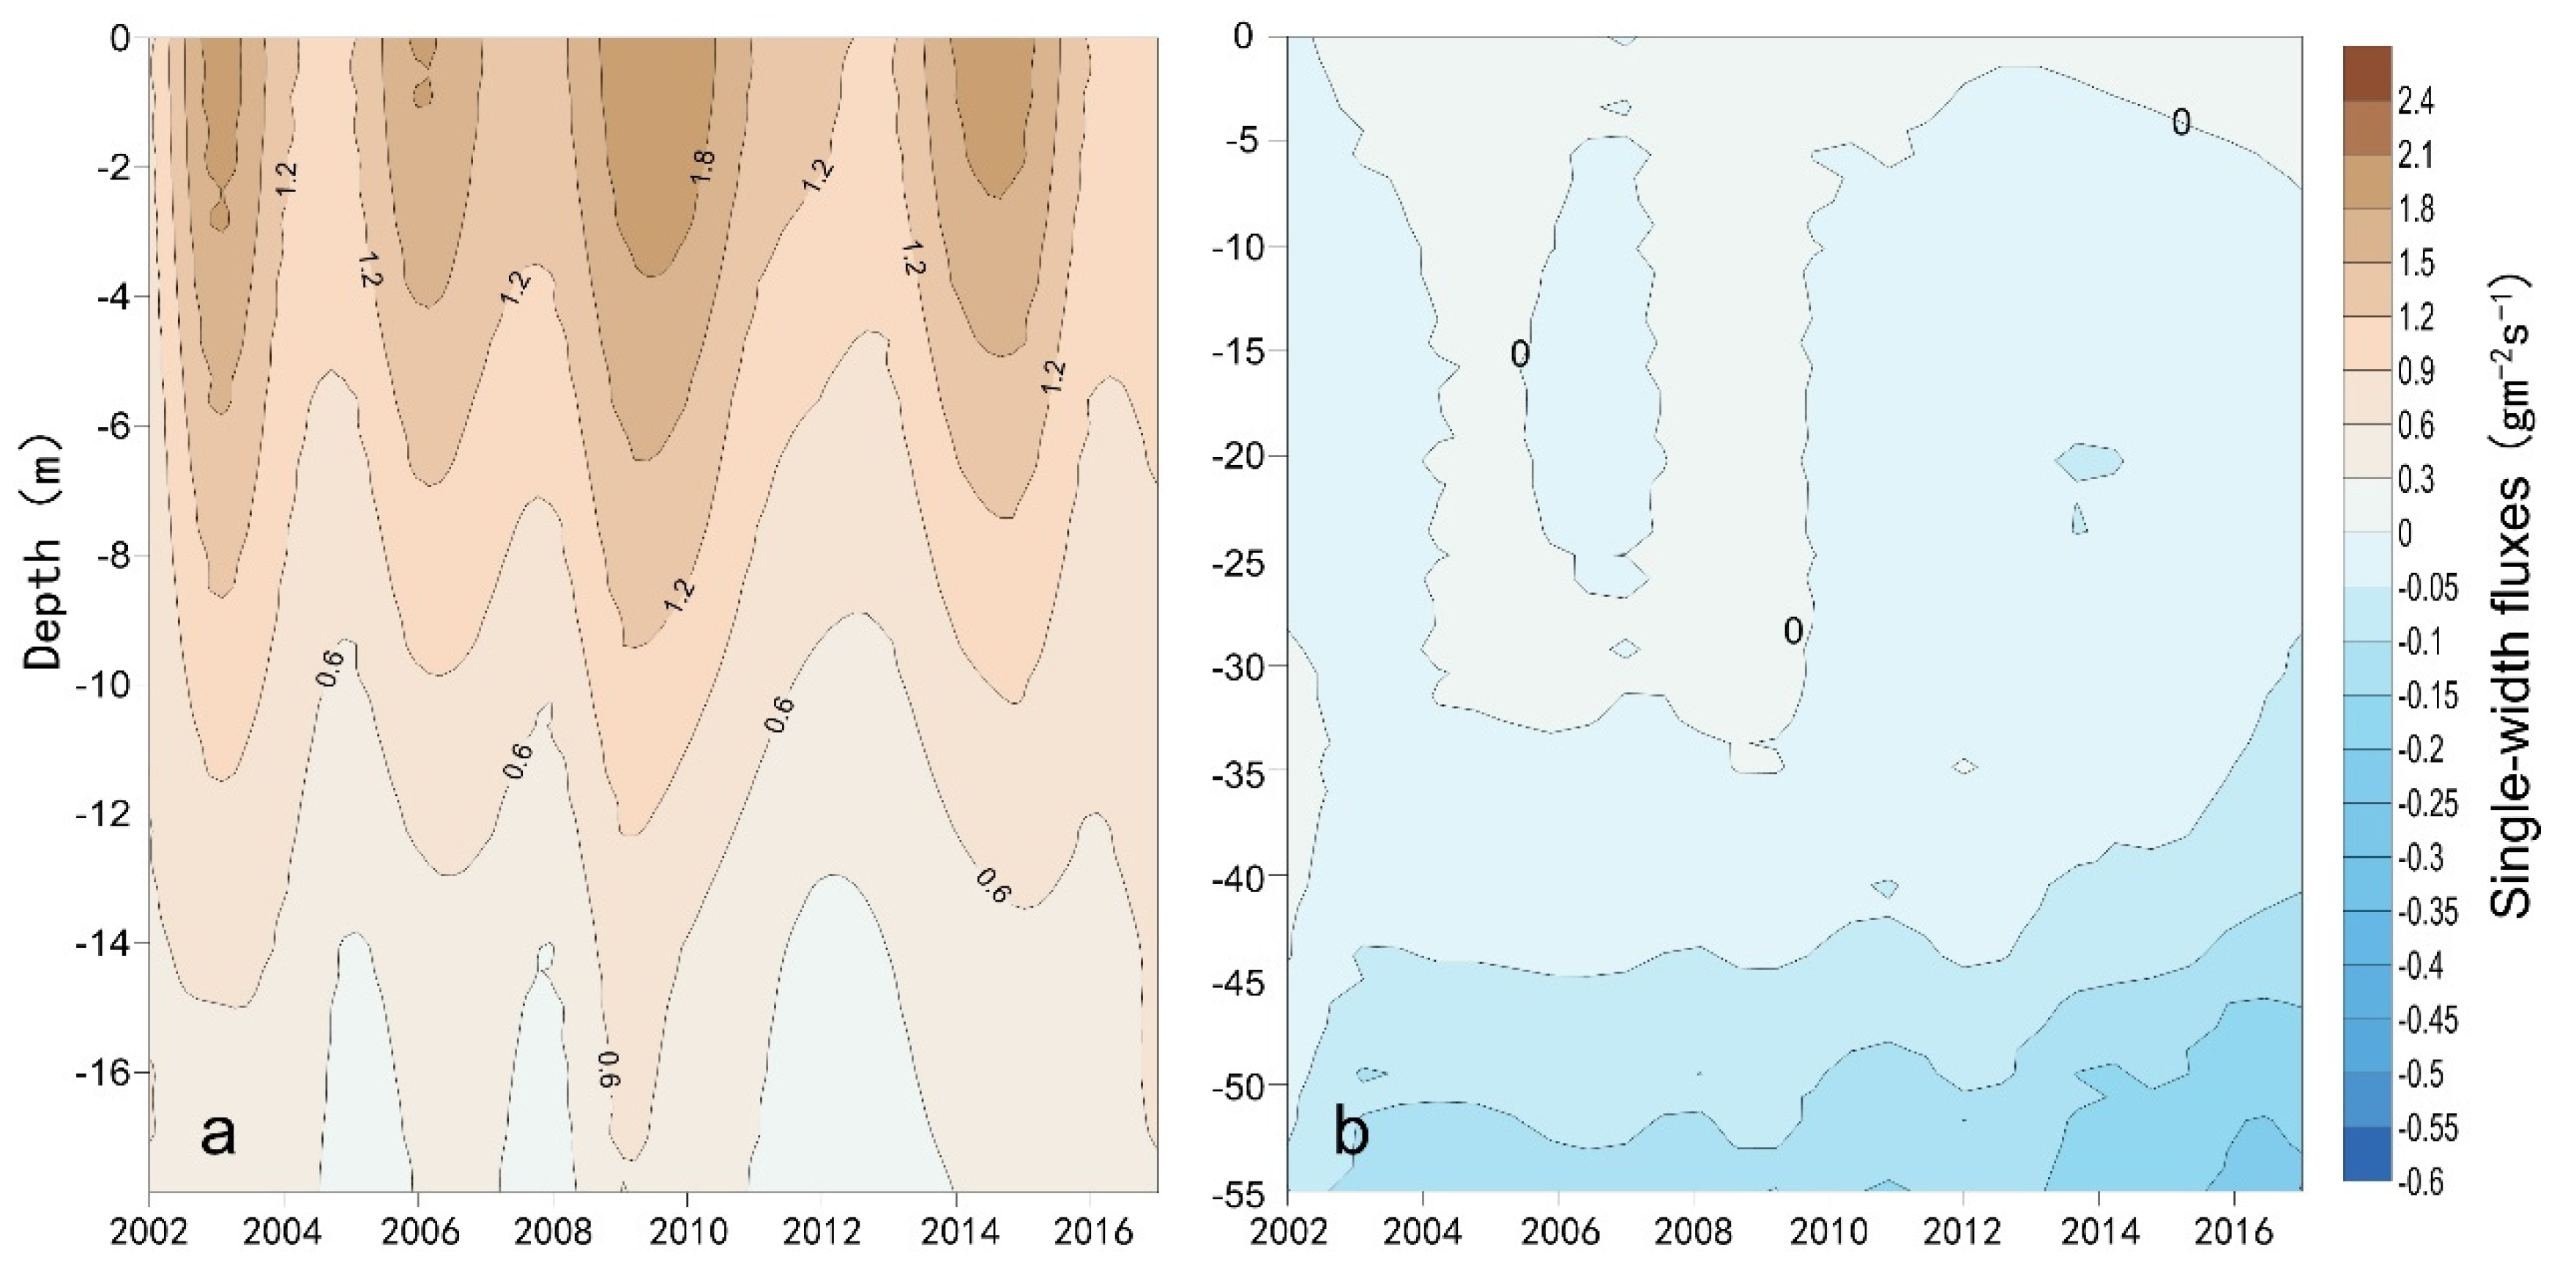
To better study the vertical differences in the multi-year variations of the suspended sediment flux in the Bohai Strait in winter, fluxes at two stations located in the southern and northern Bohai Strait respectively were compared (Figure 9). Most of the output flux occurred at the surface layer in the southern Bohai Strait, which gradually decrease downward. This is mainly because the southern part of the Bohai Strait is affected by strong northwesterly winds in winter, and the SSC mixes well vertically, while the surface current velocity is significantly higher than the bottom current. The multi-year variations of suspended sediment flux in the northern Bohai Strait were more complicated than those in the southern part. The middle and lower layers in the northern part of the strait were mainly represented by the westward input flux. This process is close related to the Yellow Sea Warm Current, which is a upwind current carrying a large amount of suspended sediment through the Yellow Sea into the Bohai Strait, and finally, into the Bohai Sea. The higher output flux in the upper layers in 2004, 2005, 2007 to 2009, is roughly corresponding to the larger north component of winter wind.

5. Discussion

5.1. Multi-Year Variations in the Output Flux of Suspended Sediment in the Bohai Strait in Winter

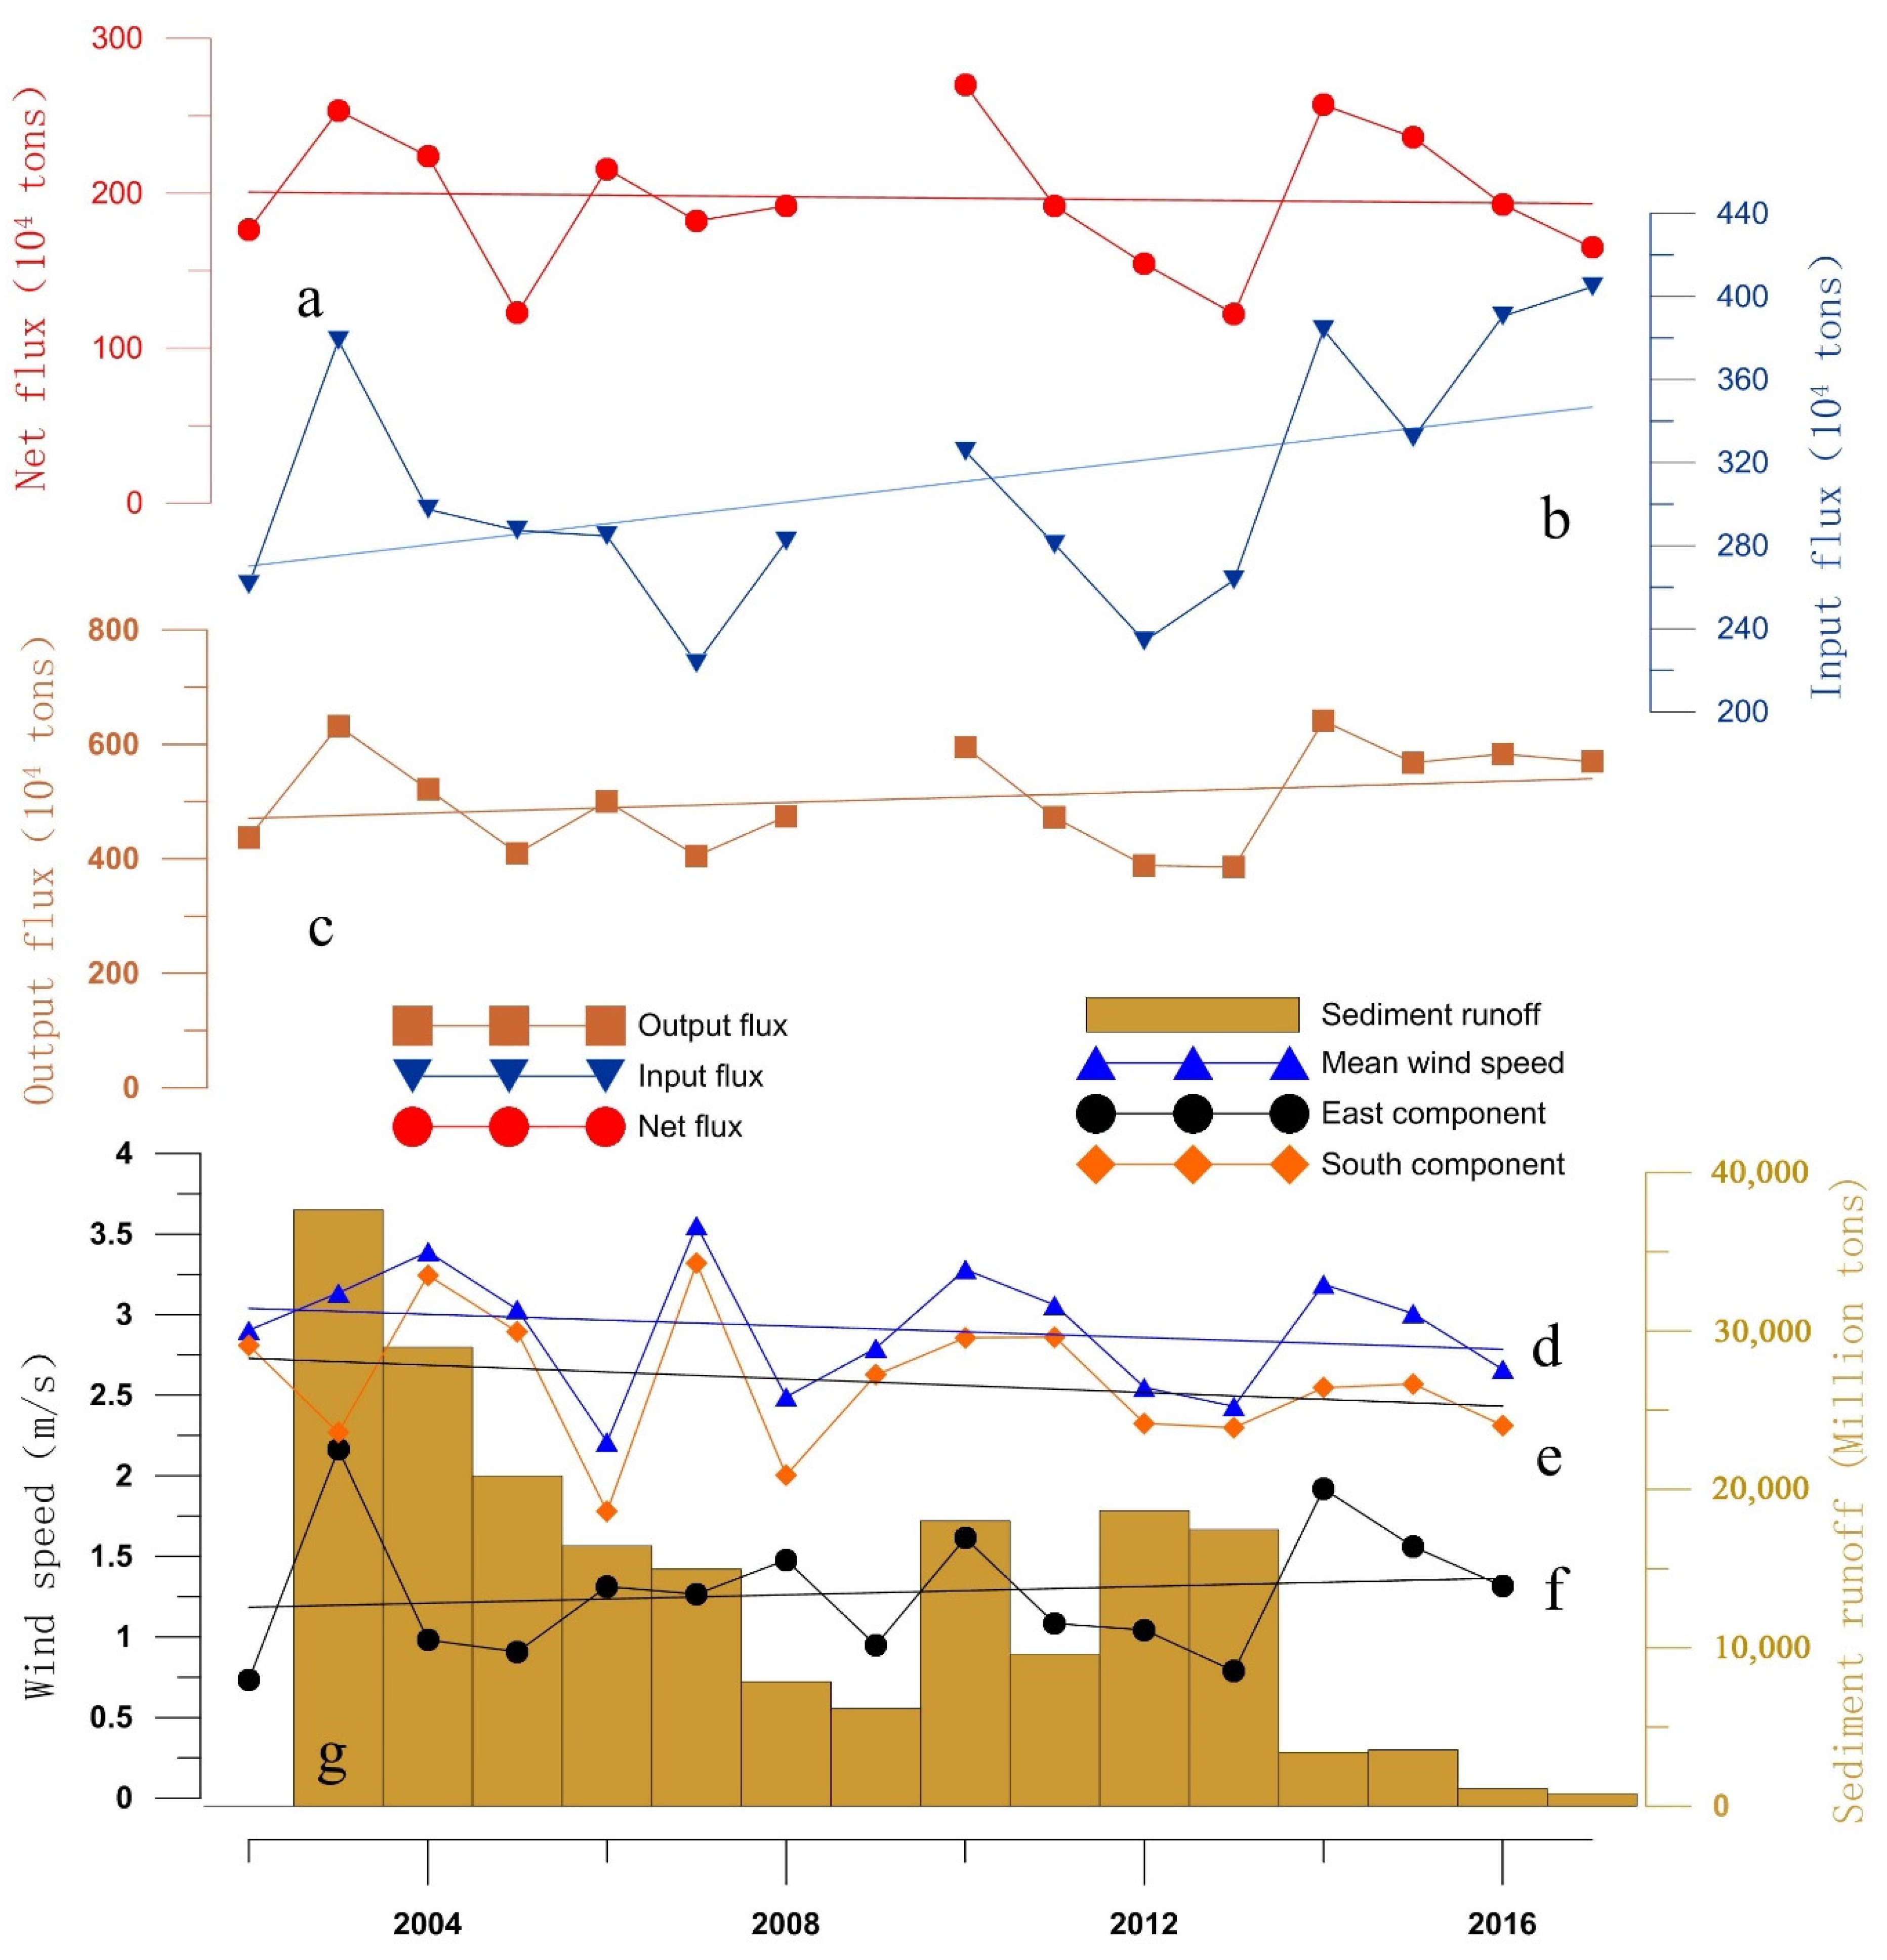
The output and input flux represents the sediment transported from the Bohai Sea to the Yellow Sea and from the Yellow Sea to the Bohai Sea, respectively. The sum vector of the output and input flux is the net flux. To further analyze the relationship between the fluxes of the Bohai Strait and various influencing factors, this section calculates the sediment volume of the Yellow River, the average wind speed in winter each year, the east component of wind (east is represented by positive values, west is represented by negative values), and the south component (south is represented by positive values, north is represented by negative values); the trend lines of each influencing factor are calculated separately (Figure 10).
The output flux of suspended sediment in the Bohai Strait in winter ranged between 3.86 and 6.41 million tons during the study period and exhibited a slow upward trend overall, with an increase of approximately 46,100 tons/year (Figure 10c). The output flux has a strong correlation with the east component of winter wind. When the east component is larger, the output flux in the Bohai Strait is also larger resulted from the increased currents. In 2003 and 2014, when the east component was relatively high, the output flux in the Bohai Strait was the largest (above 6.321 million tons in both years). The lowest values of the east component, in 2012 and 2013, corresponded to the lowest output flux values from 2002 to 2017 (3.884 million tons and 3.856 million tons, respectively). This trend is the opposite of the decreasing trend of the average wind speed in the Bohai Sea and the Yellow River in winter. Therefore, the output flux of suspended sediment in the Bohai Strait is mainly controlled by the east component of wind in winter. The intense east component of wind caused the water piling up to southeast while the sea surface height in Bohai Sea fell significantly, effectively forming a northward pressure gradient [26]. A large quantity of the water escape from Bohai Sea to Yellow Sea through Bohai Strait. Meanwhile, the relatively high sea surface height is distributed along the northern coast of the Shandong Peninsula, and the Northern Shandong Coastal Current is markedly enhanced because of geostrophic balance. Furthermore, intensified waves facilitate the rapid increase of SSC in the shallow water of southern Bohai Sea, which is then carried out of Bohai Sea by the Northern Shandong Coastal Current. This period is the main transport stage of the sediments from Bohai Sea [16,17].

5.2. Multi-Year Variations in the Input Flux of Suspended Sediment in the Bohai Strait in Winter

From 2002 to 2017, the input flux of suspended sediment in the Bohai Strait in winter ranged between 2.233 and 4.047 million tons. The magnitude of the change in the input flux was much smaller than that in the output flux. The overall input flux also showed an upward trend, and the increase rate was higher than that of the output flux, reaching 51,100 tons/year (Figure 10b). The change in the input flux depended mainly on the Yellow Sea Warm Current flowing westward into the Bohai Sea, and its main channel varied within the strait. The Yellow Sea Warm Current is an upwind positive-pressure flow originating from the southern Yellow Sea [27], which is also related to the strength of east component winter wind (Figure 10f). Its velocity is small, and the SSC in the Yellow Sea is lower than that in the Bohai Sea, thus the input flux of suspended sediment is relatively lower than output in winter. Thus both of the input and output flux are induced by the east component of winter wind.

5.3. Multi-Year Variations in the Net Flux of Suspended Sediment in the Bohai Strait in Winter

Overall, the net flux in the Bohai Strait ranged from 1.22 to 2.70 million tons. The net flux changed steadily over the years, showing a very slow downward trend, with a decline of only 4960 tons/year (Figure 10a). The net flux is controlled by the difference between the input and output. In the years when the east component was larger, the net flux in the Bohai Strait was also larger. In the years when the east component was above 1.6 m/s, the net flux in the Bohai Strait exceeded 2.5 million tons. The net flux in 2013, which corresponded to the smallest east component of winter wind, was the lowest, approximately 1.22 million tons. The net flux in the Bohai Strait has little to do with the sediment transport volume of the Yellow River, which indicates that the sediment in the Bohai Strait is mainly derived from the resuspension of sediments in the Bohai Sea.

6. Conclusions

Considering the vertical well mixed water in the Bohai Strait in winter, remote sensing data from MODIS-Aqua in combination with in situ measured water turbidity and SSC were used to establish a remote sensing model in order to translate the surface remote sensing retrieval results into SSC in each water layers in winter. Then, by incorporating current data simulated by FVCOM, the suspended sediment flux in the Bohai Strait in winter of 2002 to 2018 was obtained.
The output suspended sediment flux occurs in the southern part of the Bohai Strait in winter from the Bohai Sea to the northern Yellow Sea, and the sediment flux gradually decreases from the surface downward. This is mainly because of the stronger wind-driven current at the surface layer than that at the bottom, while the input sediment flux directing from the northern Yellow Sea to the Bohai Sea occurs in the middle and lower layers of the northern part of the strait. This process is mainly affected by the Yellow Sea Warm Current which carries suspended sediment flowing into the Bohai Strait.
In terms of long-term changes, the net sediment flux to the Yellow Sea ranged between 1.22 and 2.70 million tons in winter, showing a slight downward trend. That is because of a relatively smaller increase rate of output flux by 46,100 tons/year comparing to the increase rate of input flux by 51,100 tons/yr. The multi-year winter variations in the suspended sediment flux in the strait are mainly controlled by the east component of the winter wind. This is necessary for the accurate study of sediment transport in different types of straits in the world.

Author Contributions

Conceptualization, L.Q.; methodology, L.Q., X.L. and Y.Z.; formal analysis and validation, L.Q. and X.L.; writing—original draft preparation, X.L. and Y.Z.; writing—review & editing, L.Q. and W.X.; data curation, X.L. and P.L.; visualization, X.L. and P.L.; supervision, L.Q. and Y.Z. All authors have read and agreed to the published version of the manuscript.

Funding

This study was supported by the National Key Research and Development Program of China (grant number 2017YFE0133500), National Natural Science Foundation of China (NSFC grant number 42076179), the Shandong Key Research and Development Program (grant number 2019GHY112057), the National Natural Science Foundation of China (NSFC grant numbers 41476030, 41806072), the Ministry of Science and Technology of China (grant number 2016YFA0600903), and the Project of Taishan Scholar.

Acknowledgments

The field cruises were supported by the NSFC ship time sharing project (Transparent Marine). Part of the mooring data are archived in Ocean and Atmosphere Data Center of Ocean University of China. Thanks for all the efforts of Dongfanghong 2 and Chuangxin 1.

Conflicts of Interest

The authors declare no conflict of interest.

References

  1. Liu, X.M.; Qiao, L.L.; Zhong, Y.; Wan, X.Q.; Xue, W.J.; Liu, P. Pathways of suspended sediments transported from the Yellow River mouth to the Bohai Sea and Yellow Sea. Estuar. Coast. Shelf Sci. 2020, 236, 106639. [Google Scholar] [CrossRef]
  2. Yu, J.; Wang, H.J.; Bi, N.S.; Xiao, H.H.; Zhang, Y. Seasonal distribution and variation of suspended sediment in the yellow sea in 2010 based on retrieved monthly data from MODIS L1B imagery. Mar. Geol. Quat. Geol. 2014, 34, 1–9. [Google Scholar]
  3. Li, A.C.; Qiao, L.L.; Wan, X.Q.; Ma, W.W. Distribution, Flux and seasonal variation of suspended particulate matters in the Bohai strait. Oceanol. Limnol. Sinica 2016, 47, 310–318, (In Chinese, with English abstract). [Google Scholar]
  4. Wang, G.Z.; Gao, S. Characteristics of Yellow-Bohai Sea water exchange and suspended sediment: Their effects on sedimentation in the Bohai sea. Mar. Sci. Bull. 2002, 21, 43–48. [Google Scholar]
  5. Liu, X.M.; Qiao, L.L.; Wan, X.Q.; Zhong, Y.; Ma, W.W.; Liu, P. The sediment transport channel of the yellow river. Oceanol. Limnol. Sinica 2019, 50, 49–60, (In Chinese, with English abstract). [Google Scholar]
  6. Xiao, H.H. Distribution of Suspended Sediment in Bohai Sea and Yellow Sea: Seasonal Variability and Diffusion Fluxes. Master’s Thesis, Ocean University of China, Qingdao, China, 2014. (In Chinese, with English abstract). [Google Scholar]
  7. Wang, Y.Z.; Qiao, L.L.; Yang, Z.S.; Bao, X.W. Research on suspended sediment transport mechanisms along northeast coast of Shandong Peninsula in summer and in winter. J. Sediment Res. 2012, 5, 49–57. [Google Scholar]
  8. Choi, J.; Park, Y.J.; Lee, B.R.; Eom, J.; Ryu, J.H. Application of the Geostationary Ocean Color Imager (GOCI) to mapping the temporal dynamics of coastal water turbidity. Remote Sens. Environ. 2014, 146, 24–35. [Google Scholar] [CrossRef]
  9. Pang, C.; Yu, W. Spatial modes of suspended sediment concentration in surface water in Bohai Sea and their temporal variations. Adv. Water Resour. 2013, 24, 722–727. [Google Scholar]
  10. Li, Z.; Li, M.Z.; Dai, Z.J.; Zhao, F.F.; Li, J.F. Intratidal and neap-spring variations of suspended sediment concentrations and sediment transport processes in the north branch of the Changjiang estuary. Acta Oceanolog. Sin. 2015, 34, 137–147. [Google Scholar] [CrossRef]
  11. Wang, H.J.; Wang, A.M.; Bi, N.S.; Zeng, X.M.; Xiao, H.H. Seasonal distribution of suspended sediment in the Bohai Sea, China. Cont. Shelf Res. 2014, 90, 17–32. [Google Scholar] [CrossRef]
  12. Liu, X.; Wang, M.H. River runoff effect on the suspended sediment property in the upper Chesapeake Bay using MODIS observations and ROMS simulations. J. Geophys. Res. Ocean. 2014, 119, 8646–8661. [Google Scholar] [CrossRef]
  13. Shi, W.; Wang, M.H.; Jiang, L.D. Spring-neap tidal effects on satellite ocean color observations in the Bohai Sea, Yellow Sea, and East China Sea. J. Geophys. Res. 2011, 116, C12032. [Google Scholar] [CrossRef]
  14. Shi, W.; Wang, M.H. Sea ice properties in the Bohai Sea measured by MODIS-Aqua: 1. Satellite algorithm development. J. Marine. Systems. 2012, 95, 32–40. [Google Scholar] [CrossRef]
  15. Zhou, Z.; Bian, C.W.; Wang, C.H.; Jiang, W.S.; Bi, R. Quantitative assessment on multiple timescale features and dynamics of sea surface suspended sediment concentration using remote sensing data. J. Geophys. Res.: Ocean. 2017, 122, 8739–8752. [Google Scholar] [CrossRef]
  16. Duan, H.Q.; Xu, J.P.; Wu, X.; Wang, H.J.; Wang, C.H. Periodic Oscillation of Sediment Transport Influenced by Winter Synoptic Events, Bohai Strait, China. Water 2020, 12, 986. [Google Scholar] [CrossRef] [Green Version]
  17. Wang, C.H.; Liu, Z.Q.; Harris, C.K.; Wu, X.; Wang, H.J.; Bian, C.W.; Bi, N.S.; Duan, H.Q.; Xu, J.P. The Impact of Winter Storms on Sediment Transport Through a Narrow Strait, Bohai, China. J. Geophys. Res. Oceans 2020, 125, e2020JC016069. [Google Scholar] [CrossRef]
  18. Wu, X.; Wu, H.; Wang, H.J.; Bi, N.S.; Duan, H.Q.; Wang, C.H.; Bian, C.W.; Xu, J.P. Novel, repeated surveys reveal new insights on sediment flux through a narrow strait, Bohai, China. J. Geophys. Res. Oceans 2019, 124, 6927–6941. [Google Scholar] [CrossRef]
  19. Yang, Z.S.; Ji, Y.J.; Bi, N.S.; Lei, K.; Wang, H.J. Sediment transport off the Huanghe (Yellow River) delta and in the adjacent Bohai Sea in winter and seasonal comparison. Estuar. Coast. Shelf Sci. 2011, 93, 173–181. [Google Scholar] [CrossRef]
  20. Bornhold, B.; Yang, Z.S.; Keller, G.H.; Prior, D.B.; Zhuang, Z.Y. Sedimentary framework of the modern Huanghe (Yellow River) delta. Geo-Mar. Lett. 1986, 6, 77–83. [Google Scholar] [CrossRef]
  21. Martin, J.; Zhang, J.; Shi, M.C.; Zhou, Q. Actual flux of the Huanghe (yellow river) sediment to the Western Pacific Ocean. Netherlands J. Sea Res. 1993, 31, 243–254. [Google Scholar] [CrossRef]
  22. Zhong, Y.; Qiao, L.L.; Song, D.H.; Ding, Y.; Xue, C. Impact of cold water mass on suspended sediment transport in the South Yellow Sea. Mar. Geol. 2020, 428, 106244. [Google Scholar] [CrossRef]
  23. Wang, Y.Z.; Zhang, Y.Q.; Sun, H.F. Seasonal variation of suspended sediment distribution and flux in coastal waters of eastern Shandong peninsula. Acta Sedimentol. Sin. 2019, 37, 541–549, (In Chinese, with English abstract). [Google Scholar]
  24. Liu, J.P.; Xu, K.H.; Li, A.C.; Millioman, J.D.; Velozzi, D.M.; Xiao, S.B.; Yang, Z.S. Flux and fate of Yangtze River sediment delivered to the East China Sea. Geomorphology 2007, 85, 208–224. [Google Scholar] [CrossRef]
  25. Yang, Z.S.; Liu, J.P. A unique Yellow River-derived distal subaqueous delta in the Yellow Sea. Mar. Geol. 2007, 240, 169–176. [Google Scholar] [CrossRef]
  26. Ding, Y.; Bao, X.W.; Yao, Z.G.; Bi, C.C.; Wan, K.; Bao, M.; Jiang, Z.P.; Song, J.; Gao, J. Observational and model studies of synoptic current fluctuations in the Bohai Strait on the Chinese continental shelf. Ocean Dyn. 2019, 69, 323–351. [Google Scholar] [CrossRef]
  27. Ding, Y.; Bao, X.W.; Yao, Z.G.; Song, D.H.; Song, J.; Gao, J.; Li, J.Y. Effect of coastal-trapped waves on the synoptic variations of the Yellow Sea Warm Current during winter. Cont. Shelf Res. 2018, 167, 14–31. [Google Scholar] [CrossRef]
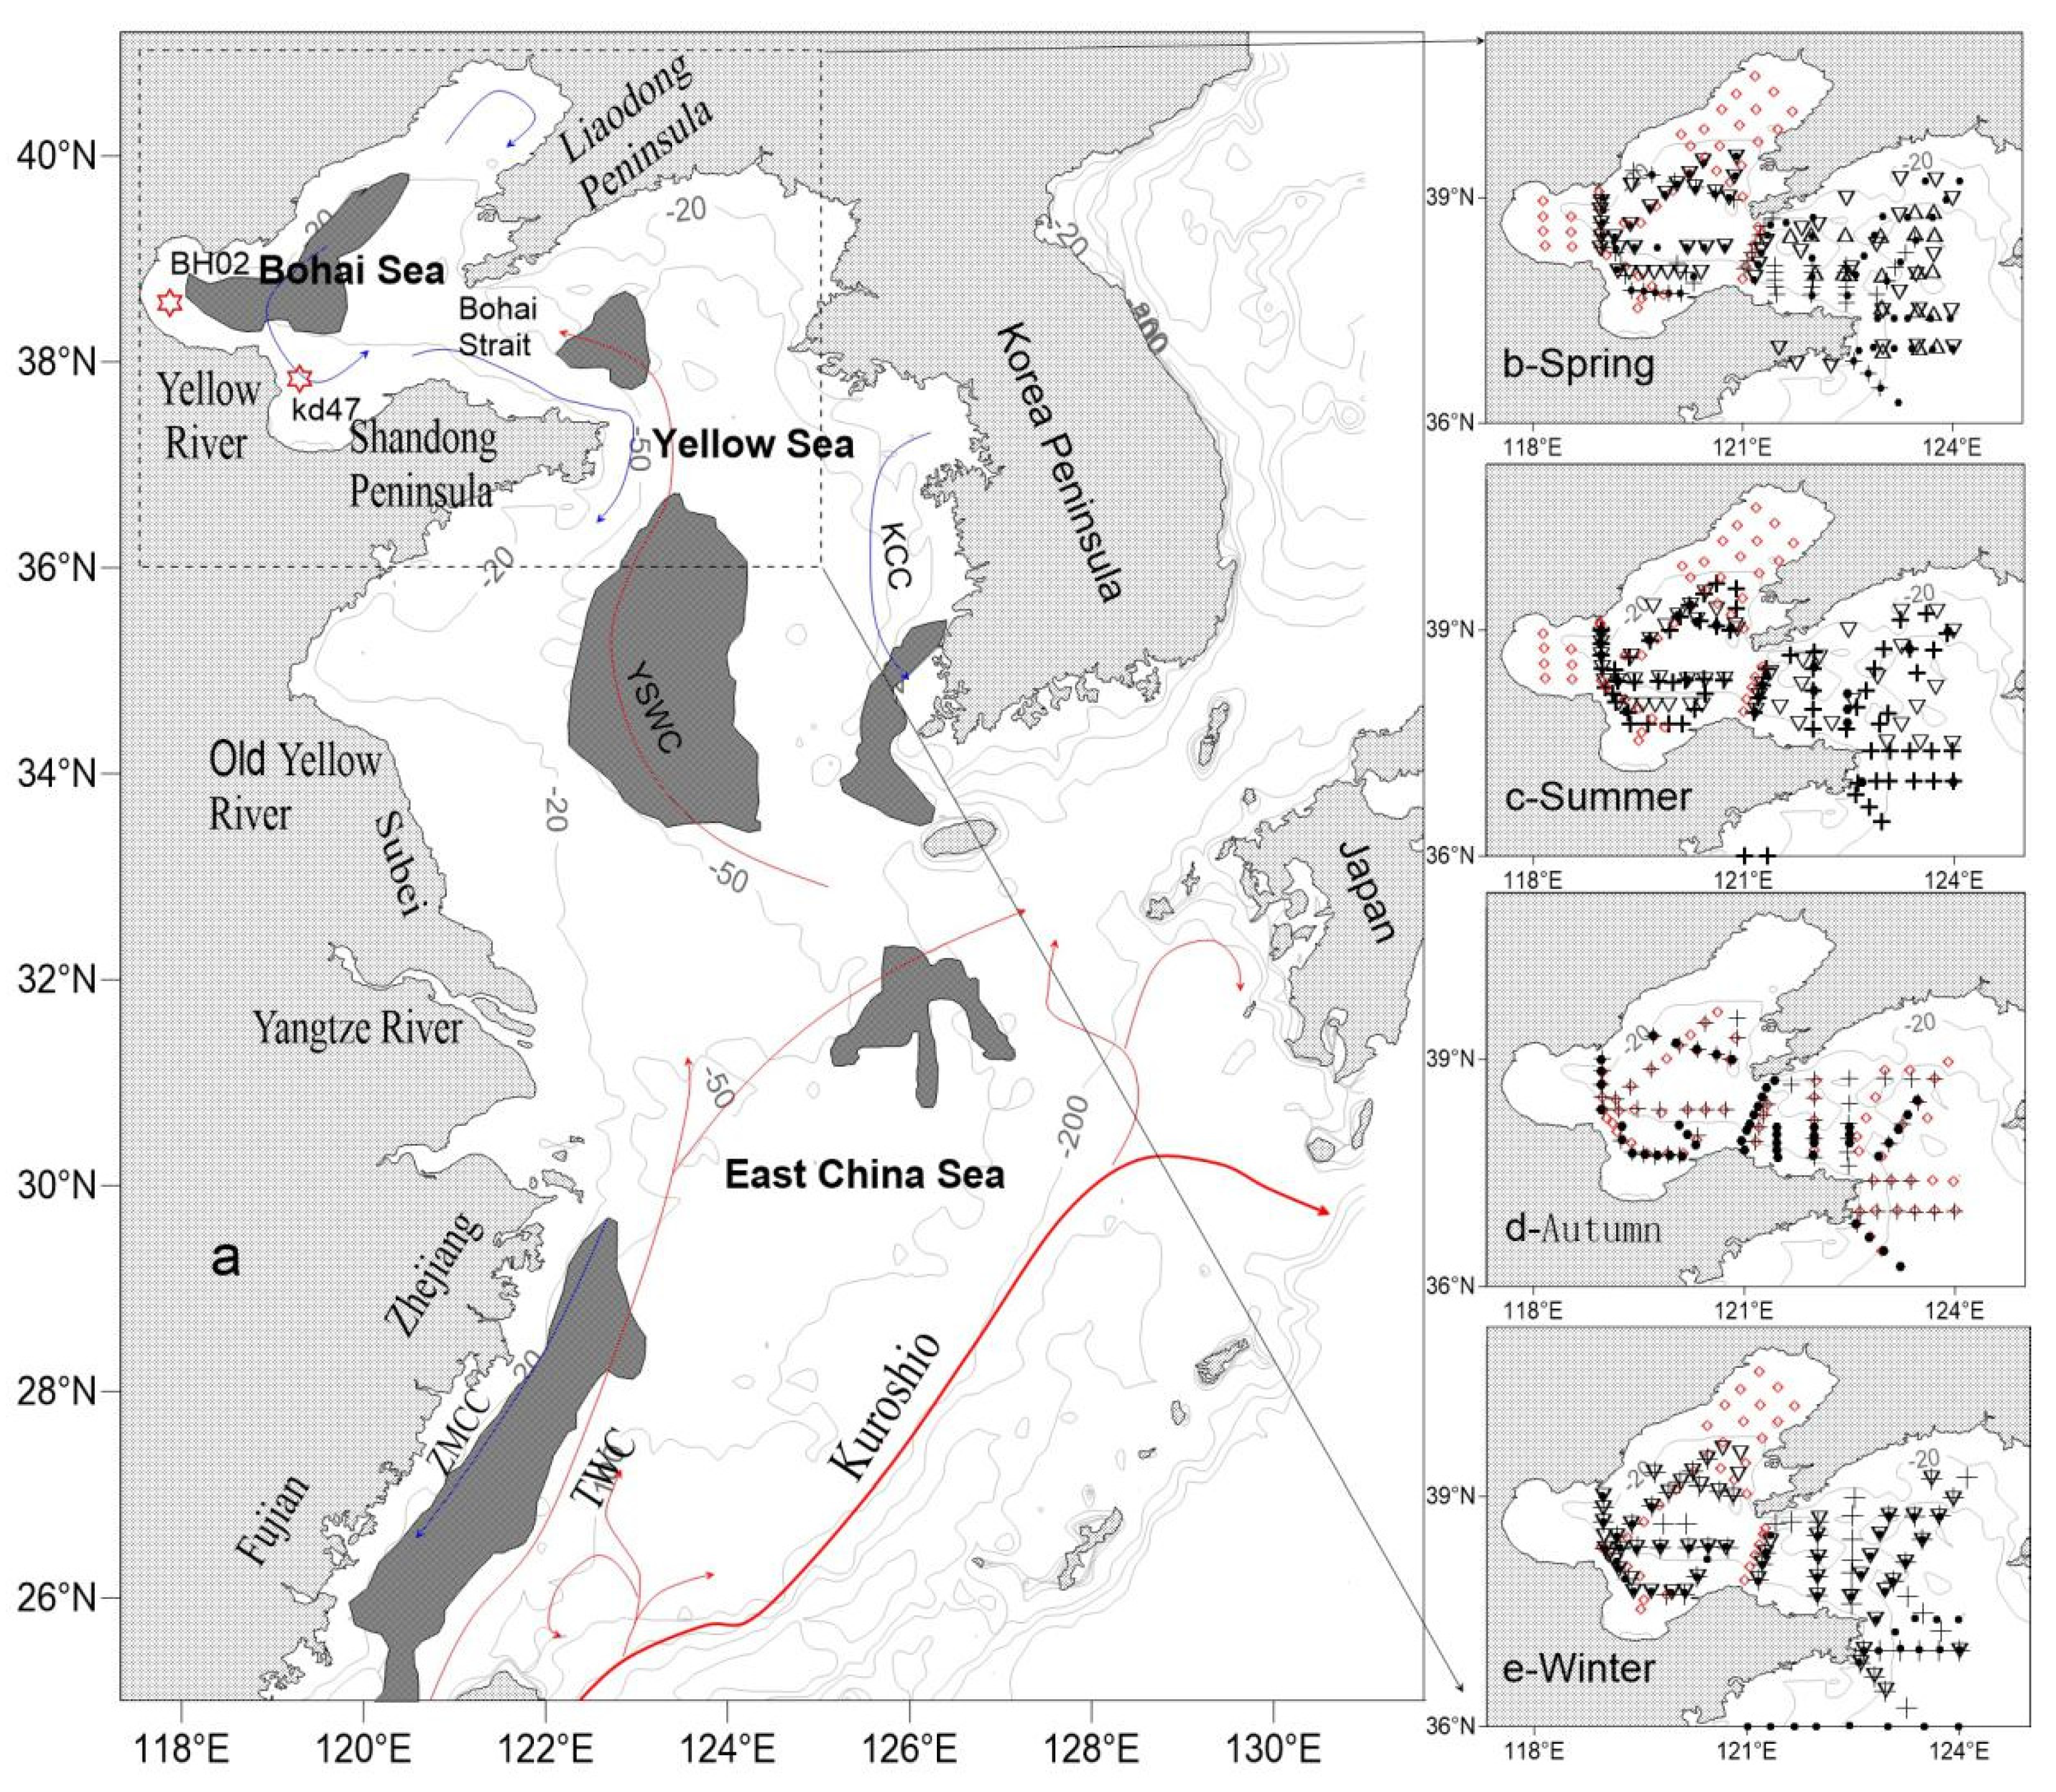
Figure 1. Distribution of observation stations ((a) study area; (b) 5 cruises in spring; (c) 4 cruises in summer; (d) 4 cruises in autumn; (e) 4 cruises in winter). The regions in dark gray indicate the muddy deposition areas.
Remotesensing 12 04066 g001
Figure 2. Vertical distribution of measured water turbidity along the transect in the Bohai Strait in winter.
Remotesensing 12 04066 g002
Figure 3. Relationship between measured SSC (mg/L) and measured turbidity (nephelometric turbidity units (NTU)).
Remotesensing 12 04066 g003
Figure 4. Fitting relationships between the SSCs of the surface layer (horizontal axis) and the other layers (vertical axis, (a) surface layer and 5 m layer, (b) surface layer and 10 m layer, (c) surface layer and 15 m layer, (d) surface layer and 20 m layer, (e) surface layer and 25 m layer, (f) surface layer and 30 m layer, (g) surface layer and 40 m layer, (h) surface layer and bottom layer; black points represent all stations; red points represent the Bohai Strait stations).
Remotesensing 12 04066 g004
Figure 5. A fitting relationship between in situ SSC and Rrs555. The remote sensing retrieval formula (a) and the verification results (b).
Remotesensing 12 04066 g005
Figure 6. Effective data volume of satellite images at different locations in the Bohai Strait.
Remotesensing 12 04066 g006
Figure 7. Multi-year variations in the surface SSC in the Bohai Strait.
Remotesensing 12 04066 g007
Figure 8. Single-width fluxes in the Bohai Strait at the surface layer (a), middle layer (b), and bottom layer (c); Positive values indicate output flux from the Bohai Sea to the Yellow Sea, and negative values indicate input flux from the Yellow Sea to the Bohai Sea; The red line represents the boundary between the input flux and the output flux.
Remotesensing 12 04066 g008
Figure 9. The multi-year variations in single-width sediment fluxes at different locations in the Bohai Strait. Location details are provided in Figure 1a. The flux at the station in the southern Bohai Strait (a) and in the northern Strait (b). Positive values indicate output flux from the Bohai Sea to the Yellow Sea, and negative values indicate input flux from the Yellow Sea to the Bohai Sea.
Remotesensing 12 04066 g009
Figure 10. Suspended sediment fluxes and influencing factors in the Bohai Strait in winter ((a) net flux, (b) input flux, (c) output flux, (d) wind speed, (e) south component of winter wind, (f) east component of winter wind, (g) sediment runoff).
Remotesensing 12 04066 g010
Table 1. Information about the cruises from 2010 to 2019.
SeasonSymbolNumber of SamplesSurvey DateSurvey Elements
Spring+5229 April 2010–4 May 2010suspended sediment concentration (SSC)
6611 May 2012–18 May 2012SSC
4718 April 2018–29 April 2018SSC
5728 April 2019–6 May 2019SSC
2011 May 2019–14 May 2019SSC
Summer2521 June 2011–27 June 2011SSC
+718 July 2016–14 July 2016SSC
4517 August 2018–26 August 2018SSC
5226 July 2019–1 August 2019SSC
Autumn4914 September 2010–21 September 2010SSC
+6112 November 2012–19 November 2012SSC
599 September 2017–16 September 2017SSC
Winter+6520 November 2011–1 December 2011SSC
6114 January 2016–30 January 2016Water temperature, salinity, turbidity
6229 December 2017–8 January 2018Water temperature, salinity, turbidity
3422 November 2018–12 December 2018Water temperature, salinity, turbidity
Table 2. Correlation of the fitting relationship between the SSCs of the surface layer and the other layers at the stations in the Bohai Strait.
Surface-5 mSurface-10 mSurface-15 mSurface-20 mSurface-25 mSurface-30 mSurface-40 mSurface-Bottom
R20.99890.98810.98710.97690.94210.84330.86180.9534
RMSE0.1930.6390.9522.3031.4711.541.633.304
Publisher’s Note: MDPI stays neutral with regard to jurisdictional claims in published maps and institutional affiliations.