Article

Spaceborne Multifrequency PolInSAR-Based Inversion Modelling for Forest Height Retrieval

by
Shashi Kumar
1,*,
Himanshu Govil
2,
Prashant K. Srivastava
3,
Praveen K. Thakur
1 and
Satya P. S. Kushwaha
1
1
Indian Institute of Remote Sensing, Dehradun 248001, India
2
Department of Applied Geology, National Institute of Technology, Raipur 492010, India
3
Institute of Environment and Sustainable Development, Banaras Hindu University, Uttar Pradesh 221005, India
*
Author to whom correspondence should be addressed.
Remote Sens. 2020, 12(24), 4042; https://doi.org/10.3390/rs12244042
Submission received: 22 October 2020 / Revised: 28 November 2020 / Accepted: 7 December 2020 / Published: 10 December 2020

Abstract

:
Spaceborne and airborne polarimetric synthetic-aperture radar interferometry (PolInSAR) data have been extensively used for forest parameter retrieval. The PolInSAR models have proven their potential in the accurate measurement of forest vegetation height. Spaceborne monostatic multifrequency data of different SAR missions and the Global Ecosystem Dynamics Investigation (GEDI)-derived forest canopy height map were used in this study for vegetation height retrieval. This study tested the performance of PolInSAR complex coherence-based inversion models for estimating the vegetation height of the forest ranges of Doon Valley, Uttarakhand, India. The inversion-based forest height obtained from the three-stage inversion (TSI) model had higher accuracy than the coherence amplitude inversion (CAI) model-based estimates. The vegetation height values of GEDI-derived canopy height map did not show good relation with field-measured forest height values. It was found that, at several locations, GEDI-derived forest height values underestimated the vegetation height. The statistical analysis of the GEDI-derived estimates with field-measured height showed a high root mean square error (RMSE; 5.82 m) and standard error (SE; 5.33 m) with a very low coefficient of determination (R2; 0.0022). An analysis of the spaceborne-mission-based forest height values suggested that the L-band SAR has great potential in forest height retrieval. TSI-model-based forest height values showed lower p-values, which indicates the significant relation between modelled and field-measured forest height values. A comparison of the results obtained from different SAR systems is discussed, and it is observed that the L-band-based PolInSAR inversion gives the most reliable result with low RMSE (2.87 m) and relatively higher R2 (0.53) for the linear regression analysis between the modelled tree height and the field data. These results indicate that higher wavelength PolInSAR datasets are more suitable for tree canopy height estimation using the PolInSAR inversion technique.

Graphical Abstract

1. Introduction

Spaceborne remote sensing technique is an important tool to measure different parameters of forest vegetation to understand the forest carbon fluxes for the modelling of gross primary production and net ecosystem production [1]. The carbon cycle of the Earth is the most important parameter, which regulates the optimum climatic conditions suitable for all life forms on the Earth [2,3,4,5]. However, the recent loss of equilibrium of the Earth’s carbon cycle, mainly caused due to human activity, has likely triggered recent climate changes which could be harmful to the biosphere of the Earth [6,7,8]. Because of these reasons, accurate tracking and measures to achieve a better understanding of the Earth’s carbon cycle are very important for sustaining life. The spaceborne synthetic-aperture radar (SAR) systems can provide high-resolution information of the Earth objects with large coverage in one scene. Earth-observation-based active and passive sensors have also been used as a tool to retrieve forest parameters for inaccessible areas [9,10,11,12,13]. Nowadays, remote sensing is used as a primary source to do forest mapping and monitoring at regular intervals [14]. Among these technologies, SAR remote sensing has an advantage of forest canopy and cloud penetration capability due to the long-wavelength range of electromagnetic (EM) waves compared to optical remote sensing and the active nature of the SAR system, which allows for night operation. The SAR systems can be operated in different imaging modes to acquire the data according to the requirement of the application to retrieve structural and biophysical parameters of a forest area [15]. Several studies have shown the potential of SAR remote sensing for forest mapping and monitoring [16,17,18,19]. Polarimetric SAR modelling for retrieval of forest parameters has become a successful tool to retrieve scattering contributed by different scatterers within small forest patches for structural and biophysical characterization of the forest [20,21,22,23]. Forest tree height is directly related to biomass (AGB) and carbon stock [24,25,26,27]. The height of the forest trees needs to be measured at regular intervals to understand the spatiotemporal changes in the aboveground biomass and carbon stock.
The interferometric technique of SAR-based sensing has shown great potential to retrieve forest height with reliable accuracy [28,29,30]. The potential of SAR tomography has also been investigated successfully for forest height retrieval and scattering power retrieval at different height levels [31,32,33,34]. The requirement of a large number of interferometric pairs is a major limitation of the SAR tomography and sometimes it becomes difficult to implement this technology for forest height retrieval in the absence of several repeat passes of the data. Polarimetric SAR interferometry (PolInSAR) involves all of the possible polarimetric combinations and is hence better than SAR interferometry in resolving the coherence optimization problem to obtain the optimum scattering mechanisms related to different scattering mechanisms from the canopy [35].
Polarimetric acquisitions of an interferometric pair provide the capability to improve the interferogram quality for optimum coherence estimates with highly accurate phase information [36]. Several studies have been carried in the last few years to establish the capability of PolInSAR for forest height measurement [37,38,39,40]. The development of inversion models with PolInSAR data can provide a useful approach to retrieve forest height from SAR-based remote sensing [41,42,43,44]. The polarimetric SAR interferometry-based modelling approach for vegetation height of a forest area has been successfully implemented with airborne SAR data [42,43,45,46,47]. Fewer studies have been carried out to retrieve forest tree height from PolInSAR inversion using spaceborne SAR data [48]. The normal baseline component of the interferometric acquisition plays a significant role in vertical wavenumber generation for inversion-based models of PolInSAR data [49,50]. For a spaceborne bistatic or airborne SAR system, the system parameters could be easily planned with higher accuracy to derive vertical baseline components However, in monostatic SAR systems, the large spatial baseline of interferometric acquisition over a forest area results in very low coherence. The InSAR data, with small baseline components, provide a solution to obtain reliable coherence from the forest. The PolInSAR data acquisition, with a small baseline, gives a very high altitude of ambiguity that is not suitable for the forest stand height of 30–40 m tall trees. To overcome this problem, coherence amplitude inversion (CAI) and three-stage inversion (TSI) were performed with a vertical wavenumber file that was generated by the altitude of ambiguity equal to twice the forest height. The main objective of this present study is to retrieve forest tree height with the help of multifrequency spaceborne PolInSAR data. PolInSAR-based vegetation height estimation has been studied by many using various algorithms and models [51,52,53,54,55]. The potential of spaceborne PolInSAR data is evaluated in this study using TSI and CAI modelling approaches. Three-stage inversion is extensively used in the PolInSAR model, which uses a random volume over the ground (RVoG) model for height estimation of forest vegetation [56,57]. This study utilizes monostatic multifrequency (L-, C-, and X-band) spaceborne PolInSAR data for inversion modelling to retrieve forest height.

2. Study Area and Dataset

The two forest ranges (Barkot and Thano) in Doon Valley, Uttarakhand, India were selected for spaceborne multifrequency-based inversion modeling. These forest ranges lie between the Shivalik Hills and the Himalayan Mountains. Figure 1 shows the standard false-color composite (FCC) of the Sentinel-2B optical multispectral data that was acquired on 16 December 2018. The three spectral bands (842 nm, 665 nm, and 560 nm) of 10 m spatial resolution were used to generate the FCC (Figure 1), which enhances the forest and vegetation cover in red. The vegetation cover of both the forest ranges of the Doon Valley is visible in the red color as shown in Figure 1. Nearby features, such as the agricultural area, the urban settlement of Rishikesh City, and the waters of the Ganges River, are clearly visible in various bands of the FCC according to their surface reflectance.
The vegetation type map of the two forest ranges is shown in Figure 2a. The topography of the terrain for these study sites is flat, which is advantageous to retrieve actual PolSAR-based parameters without rigor geometric correction. Sal (Shorea robusta) trees (Figure 2b,c)) are the main species of both the forest ranges. The other vegetation species are Teak (Tectona grandis) plantation, Sisham (Dalbergia sissoo), and Khair (Acacia catechu).
Figure 2a shows the location of the field-measurement in the Barkot and Thano forest ranges of Doon Valley. The Barkot and Thano Forests are covered by dense Sal (Shorea robusta), Khair-Sissoo/Sisham (Acacia catechu-Dalbergia sissoo), and mixed miscellaneous forests. Field-collected forest tree heights from 100 locations in the Barkot and Thano Forests [48,58] were used for validation of the PolInSAR-based modelled vegetation height map. Square plots of 12.5 m2 size were made for the field-based forest height measurement. The field data collection for tree height measurement was done using the Nikon Forestry Pro Laser Range Finder and Laser Dendrometer (Criterion RD1000). The position of the plot locations was measured with the Trimble Juno handheld GPS. The field data were collected in the accessible region of the forest ranges and the distribution of plots is shown in Figure 2a. Figure 2b shows tree height measurements using the Terrestrial Lase Scanner (TLS) in the forest plot. In a separate research work, TLS-based measurement for forest parameter retrieval were carried out between November 2014 to February 2015 for limited plot locations [59]. It was found that the maximum difference between field-based forest height using handheld equipment and TLS data-based estimates was 0.81 m [59]. Figure 2d shows a sample plot design that was made in the field for tree height measurement. The forest ranges of Doon Valley predominantly dominate Sal trees, which can also be seen for both these forest ranges as shown in Figure 2a. Considering that most of the area is covered by Sal forest, we planned to collect a good number of data from this vegetation type, according to which plots were made in the field. Table 1 shows the number of plots of the field-collected data for forest height measurement in different vegetation species of the forest ranges.
Plot-wise average forest height of the field-measured data for the 100 locations in the Barkot and Thano forest ranges are shown in Figure 3. Error bars with a standard deviation of average forest height for all the 100 field-measured forest plots are shown in Figure 3. It is observed that, for most of the locations, the average forest height was more than 20 m.

2.1. Global Forest Canopy Height Map

The global forest canopy height map was developed by integrating the lidar-based structural measurement for forest vegetation of the Global Ecosystem Dynamics Investigation (GEDI) data and Landsat multitemporal surface reflectance data [60,61]. The product id Forest_height_2019_NASIA of 30 m spatial resolution global forest canopy height map was used to prepare a forest height map of the Uttarakhand state of India. Most of the forest cover shows vegetation height with a difference of less than 35 m from the forest height values. Three more values, 101, 102, and 103, were also obtained from the data, representing water, snow/ice, and no data, respectively [60]. The Barkot and Thano forest ranges of Doon Valley, Uttarakhand, India, are shown in the red circle in Figure 4. A subset was taken from the Uttarakhand forest height map, which is shown in Figure 5 to show the vegetation height in the two forest ranges.
Figure 5 shows a subset of 30 m spatial resolution of the global forest canopy height that was generated by the integration of GEDI-based forest height metrics with Landsat multitemporal data.

2.2. Polarimetric SAR Interferometry (PolInSAR) Data

Polarimetric SAR Interferometry (PolInSAR) combines interferograms obtained at different polarizations [62]. Generally, all of the spaceborne SAR are monostatic SAR systems in which a single antenna is used to transmit and receive EM waves. Figure 6 shows the PolInSAR geometry in which PolSAR data were acquired by maintaining a temporal gap between two acquisitions to generate an interferometric pair. The two acquisitions provide two scattering matrices (Figure 6) represented by Equation (1).
The scattering matrix of the first acquisition is represented by S1 and the second acquisition or slave data is represented by S2. The matrix elements are represented as polarimetric combinations of horizontal and vertical polarizations of the electric field vector of the EM wave. To get an interferometric pass, the platform positions between two acquisitions must be separated by a baseline.
The multifrequency data used in this study were acquired from spaceborne SAR systems, ALOS-2 PALSAR-2, RADARSAT-2, and TerraSAR-X. A detailed description of the multifrequency polarimetric interferometric data is given in Table 2.
Figure 7 shows the color composite of model-based polarimetric decomposition of L-band, C-band, and X-band SAR data. Yamaguchi’s four components decomposition model was used to generate scattering elements from the polarization orientation angle (POA)-compensated PolSAR coherency matrix [63]. Forest vegetation is a dominant source of volume scattering of the incident EM wave. In the polarimetric decomposition-based output of the multifrequency SAR data, this can be easily seen in green. The double-bounce scatterers and single-bounce scatterers are represented in red and blue, respectively. It is visible in the PolSAR data that the dry river channels of the Doon Valley showed surface scattering (blue color). The urban structures showed the dominance of double-bounce scattering, and these features are highlighted in red/pink in the false color composite image of the SAR data. The polarimetric decomposed image of L-band ALOS-2 PALSAR-2 showed high volume scattering in comparison to the TerraSAR-X and RADARSAT-2 C-band datasets. The long-wavelength of L-band ALOS-2 can penetrate the top canopy surface to provide scattering information contributed due to the entire volume of the tree. Due to the deep penetration of microwave signals into the forest vegetation and multiple scattering from the entire structure of the vegetation cover, the degree of volume scattering in L-band observations was higher than C- and X-band SAR data.

3. Methodology

The present work utilized L-, C-, and X-band PolInSAR data-based TSI modelling for forest stand height estimation. The methodological steps are shown in Figure 8. The single-look complex data was initially corrected from slant range ambiguity to provide actual ground information in the range direction. Radiometric calibration was performed to calculate scattering matrix on multifrequency polarimetric interferometric pairs of SAR data. The scattering matrix was generated with four polarimetric combinations of first and second acquisitions of interferometric pairs of complex SAR data.
[ S 1 ] = [ S H H 1 S H V 1 S V H 1 S V V 1 ]   and   [ S 2 ] = [ S H H 2 S H V 2 S V H 2 S V V 2 ] .
The scattering matrices were coregistered with subpixel accuracy for accurate phase estimation at interferometric processing. The coregistered PolInSAR pairs were orthorectified with the help of the Range Doppler Terrain Correction tool in SNAP v 6.0 [64].
The Pauli feature vector [65], which is a first-order polarimetric representation of the scattering matrix, was generated from the coregistered orthorectified product for all of the SAR data. The Pauli feature vectors of reference and secondary images were multiplied with their transconjugate to generate a 6 × 6 coherency matrix as shown in Equation (2) [41].
[ T 6 ] = [ k _ 1 k _ 2 ] [ k _ 1 T k _ 2 T ] = [ [ T 11 ] [ Ω 12 ] [ Ω 12 ] T [ T 22 ] ] k _ 1 = 1 2 [ S H H 1 + S V V 1 S H H 1 S V V 1 2 S H V 1 ] T   and k _ 2 = 1 2 [ S H H 2 + S V V 2 S H H 2 S V V 2 2 S H V 2 ] T .
where [T11] and [T22] are 3 × 3 coherency matrices of reference and secondary images and these matrices follow the characteristics of Hermitian matrices, while [Ω12] is derived from the interferometric Hermitian product of Pauli feature vectors k _ 1   and   k _ 2 of PolInSAR pairs.
The Interferometric coherence of PolSAR data was estimated with the help of a 6 × 6 coherency matrix that represents the complex correlation coefficients of a feature in the SAR data during the two acquisitions. The interferometric acquisition of PolSAR data is capable to retrieve coherence due to different scatterers in a SAR resolution cell.
When an EM wave hits the target, the coherence of an object changes with polarization due to different scattering behavior in different polarimetry channels. The PolInSAR coherence (γ) is represented in Equation (3) with the help of elements of the 6 × 6 coherency matrix [36,41].
γ = ω 1 T [ Ω 12 ] ω 2 ω 1 T [ T 11 ] ω 1 ω 2 T [ T 22 ] ω 2
where ω 1 and ω 2 represent the two scattering mechanisms and * indicates the complex conjugate. The spatial averaging is also shown in Equation (3) as an angular bracket and 6 × 6 coherency matrix elements are calculated using Equations (4)–(6).
[ T 11 ] = [ | S H H 1 + S V V 1 | 2 ( S H H 1 + S V V 1 ) ( S H H 1 S V V 1 ) 2 ( S H H 1 + S V V 1 ) S 1 H V ( S H H 1 S V V 1 ) ( S H H 1 + S V V 1 ) | S H H 1 S V V 1 | 2 2 ( S H H 1 S V V 1 ) S 1 H V 2 S H V 1   ( S H H 1 + S V V 1 ) 2 S H V 1   ( S H H 1 S V V 1 ) 4 | S H V 1 | 2 ]
[ T 22 ] = [ | S H H 2 + S V V 2 | 2 ( S H H 2 + S V V 2 ) ( S H H 2 S V V 2 ) 2 ( S H H 2 + S V V 2 ) S 2 H V ( S H H 2 + S V V 2 ) ( S H H 2 S V V 2 ) | S H H 2 S V V 2 | 2 2 ( S H H 2 S V V 2 ) S 2 H V 2 S H V 2   ( S H H 2 + S V V 2 ) 2 S H V 2   ( S H H 2 S V V 2 ) 4 | S H V 2 | 2 ]
[ Ω 12 ] = [ ( S H H 1 + S V V 1 ) ( S H H 2 + S V V 2 ) ( S H H 1 + S V V 1 ) ( S H H 2 S V V 2 ) 2 ( S H H 1 + S V V 1 ) S H V 2 ( S H H 1 S V V 1 ) ( S H H 2 + S V V 2 ) ( S H H 1 S V V 1 ) ( S H H 2 S V V 2 ) 2 ( S H H 1 S V V 1 ) S H V 2 2 S H V 1   ( S H H 2 + S V V 2 ) 2 S H V 1   ( S H H 2 S V V 2 ) 4 S H V 1 S H V 2 ]

3.1. Three-Stage Inversion (TSI) Modelling

The TSI model is an extension of the fully polarimetric SAR data-based expression of a two-layer model [66] to estimate the vertical structure of tree species [41]. The PolInSAR-based TSI model is very popular for forest height retrieval [49,58,67,68,69,70]. The TSI model includes the identification of the ground phase and volumetric coherence of the effective scattering center of forest vegetation for inversion-based forest height retrieval. PolInSAR-based TSI uses the complex coherences of all the polarimetric combinations to identify the ground phase and volumetric coherence with minimum ambiguity. A best-fit line is determined in the complex plane to find the optimum ground phase and volumetric coherence. The point on the best-fit line with the lowest value of ground to volume scattering ratio will be the most suitable input for volumetric coherence [41,71,72].
The complex coherence, γ , of the PolInSAR data for forest vegetation is shown in Equation (7) [41].
γ = ω T ( e i ϕ 1 I 2 V + e 2 σ h v cos θ 0 T g e i ϕ 1 ) ω ω T ( I 1 V + e 2 σ h v cos θ 0 T g ) ω
where
I 1 V = e 2 σ h v cos θ 0 h v e 2 σ z cos θ 0 T V d z   and   I 2 V = e 2 σ h v cos θ 0 h v e 2 σ z cos θ 0 e i k z z T V d z T V = m v [ 1 0 0 0 μ 0 0 0 μ ] 0 μ 0.5 T g = m g [ 1 t 12 0 t 12 t 22 0 0 0 t 33 ] .
The complex coherence is polarization-dependent and can be represented as a straight line in the complex plane of PolInSAR coherence:
γ ( ω ) = e i ϕ 1 ( γ v + L ( ω ) ( 1 γ v ) ) 0 L ( ω ) 1
where
L ( ω ) = μ ( ω ) 1 + μ ( ω )   a n d   μ ( ω ) = 2 σ cos θ 0 ( e 2 σ h v cos θ 0 1 ) ω T T g ω ω T T V ω
γ v = 2 σ cos θ 0 ( e 2 σ h v cos θ 0 1 ) 0 h v e i k z z e 2 σ z / cos θ 0 d z
where, ω is a unitary complex vector, γ, is interferometric complex coherence that is dependent on the choice of polarization of the SAR data, φ is the interferometric phase of the ground topography, μ ( ω ) shows ground to volume scattering ratio, θ0 is the angle of incidence of the incident EM waves of the SAR system, and attenuation of the EM waves through vegetation canopy is represented by σ. In Equations (8) and (10) γ v is polarization independent and is expressed as an integral of vertical wavenumber (kz), angle of incidence, and wave extinction coefficient. The effective vertical interferometric wavenumber (kz) is determined by the SAR imaging parameters. Baseline during the interferometric acquisition of SAR data and spaceborne platform to target range distance is used to derive k z , as in
k z =   4 π B n λ R s i n θ .
where Bn is the normal component of the baseline, λ is the wavelength of the SAR system, and R is the platform to the target distance. The value of R is retrieved from metadata by multiplying the speed of the electromagnetic wave and half of the total time taken by the wave to track the target. The interferometric wavenumber (kz) depends on the SAR parameter and it is a crucial parameter that affects the PolInSAR inversion-based forest height [50]. The normal baseline component ( B n ) plays an important role in deriving the vertical wavenumber [49]. This work utilized the vertical interferometric wavenumber that was generated from the spaceborne SAR parameters of multifrequency data and a derived normal baseline component. The normal baseline component was calculated according to the altitude of ambiguity greater than (approximately double) the forest height of the study area.

3.2. Coherence Amplitude Inversion (CAI) Modelling

Electromagnetic waves transmitted by a SAR system mainly interact with the top canopy surface of the forest vegetation. The top canopy surface contributes an amount of the backscattered signal, and twigs and branches of the forest vegetation contribute to the remaining portion. The top canopy surface is an unstable structure in nature, which shows very low interferometric coherence. If the SAR waves are able to interact with stable structures of the forest vegetation like big branches, then the interferometric coherence will become high for these features. Generally, in SAR interferometry, the height of an object is measured from the difference of the interferometric phases of the top and bottom of the surface. It is very difficult to retrieve interferometric phases of ground and forest vegetation for the locations having low interferometric coherence [44]. To overcome the problem of the interferometric phase coherence, an amplitude-based approach was proposed in which the ground is identified with polarimetric channels that have a low surface-to-volume ratio [71] The PolInSAR coherence amplitude-based inversion model for forest height retrieval is shown in Equation (12):
min h v { F = | γ ˜ w v | | p p 1 e p 1 h v 1 e p h v 1 | }   where   { p = 2 σ   c o s θ p 1 = p + i k z .
Here, the function F is minimized for the inversion-based modelling [72], hv represents the height of the vegetation, and σ represents the attenuation of an electromagnetic wave due to vegetation and volume only coherence is represented by γ ˜ w v .

4. Results

This section describes the results of PolInSAR-based inversion modelling for forest height estimation using multifrequency spaceborne SAR data.

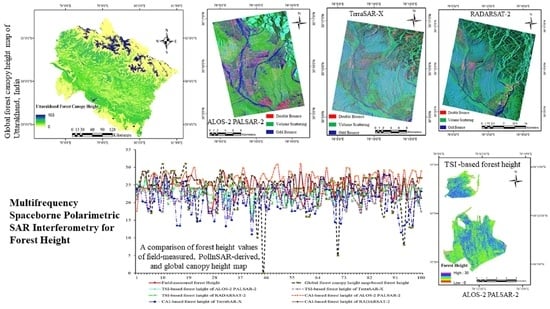
Multifrequency PolInSAR Data for Forest Height Estimation

Polarimetric SAR interferometry-based inversion modelling was implemented to generate the forest height. Forest height retrieval was performed with all the possible coherence combinations and interferometric vertical wavenumber file. The CAI technique assumes that volume scattering is at the top of the canopy and generally, cross-polarimetric channels are selected as input in the modelling approach for inversion-based height retrieval.
The PolInSAR data has the capability to generate complex coherence in several polarimetric combinations, but the combination having the lowest ground-to-volume ratio is the most suitable for inversion-based forest height retrieval. Figure 9a,b show the TSI-based and CAI-based forest height maps that were generated from the PolInSAR pair of ALOS-2 PALSAR-2 data. Forest heights generated from RADARSAT-2 and TerraSAR-X are shown in Figure 10a,b and Figure 11a,b, respectively. The modelled outputs of the forest heights were validated with field-measured values using the coefficient of determination (R2), root mean square error (RMSE), standard error of the estimate (SE), and p-value. To validate the modelled output of the forest height of PolInSAR inversion-based modelling, field data were used for 100 locations in the study area.
Figure 12a shows the TSI-based forest height generated from the PolInSAR pair of ALOS-2 PALSAR-2 data. Forest heights generated from RADARSAT-2 and TerraSAR-X are shown in Figure 12b,c, respectively. In addition to the best-fit regression, the line confidence interval (CI) and prediction interval (PI) were also drawn. The CI is marked with a broken line in yellow, the PI is marked with a solid line in black, and the best-fit regression line is shown in blue. The CI with a 95% confidence interval ensures that it has a 95% probability of being the best-fit line between the upper and lower limits that are marked as the broken line in yellow in Figure 12. The CI with 95% still has a probability of 5% in which the true best-fit linear regression line may fall outside the confidence interval limits/boundaries. It is evident in Figure 12 that the best-fit regression line for all the modelled output for forest height retrieval did not go outside of the upper and lower limits of the CI.
The 95% prediction interval (PI) indicates the area where 95% of the datapoints will fall and predicts a range in which a future observation will fall. Figure 12 shows that one datapoint fell outside the prediction interval boundary for the linear regression with ALOS-2 PALSAR-2 and RADARSAT-2 data. The linear regression with TerraSAR-X data shows that four datapoints fell outside the boundary of the prediction interval.
The linear regression between the field data and modelled output of multifrequency PolInSAR data (Figure 12) shows that the coefficients of determination (R2) of TSI-based forest height for ALOS-2 PALSAR-2, RADARSAT-2, and TerraSAR-X were 0.53, 0.32, and 0.43, respectively, with RMSE values of 2.87 m, 3.74 m, and 4.53 m. The standard error of the estimate (SE) for TSI-based approach for L-band, C-band, and X-band data were 1.56 m, 1.73 m, and 2.17 m, respectively (Table 3). The relationship between field-measured forest height and TSI-based modelled height shows the highest R2 from ALOS-2 PALSAR-2 data. The lowest R2 (0.32) was obtained from RADARSAT-2 data. RMSE obtained from the multifrequency SAR data shows that the error value of PolInSAR inversion-based height retrieval was 2.87 m for ALOS-2 PALSAR-2, 3.74 m for RADARSAT-2, and 4.53 m for TerraSAR-X data. From Figure 12 and Table 3, it is obvious that the highest R2 and lowest RMSE was obtained from the long-wavelength L-band PolInSAR pair of ALOS-2 PALSAR-2. The reason for the accuracy of L-band likely lies in the canopy penetration capability of L-band SAR for the detection of ground coherence, phase, and identification of the volume scattering center at the top of the canopy. A moderate accuracy in forest height retrieval was obtained from X-band SAR data due to the high spatial resolution of TerraSAR-X, which enables the retrieval of ground information through canopy gaps.
CAI-based forest height maps of multifrequency PolInSAR data are shown in Figure 13. The forest height values of modelled output varied from 0 m to 30 m in the TSI-based inversion. CAI-based PolInSAR vegetation height values ranged from 0 m to 33 m. The best-fit regression line of CAI-based forest height for ALOS-2 PALSAR-2, RADARSAT-2, and TerraSAR-X data fell between the upper and lower limits of the 95% confidence interval. Four datapoints of the linear regression with CAI modelling for ALOS-2 PALSAR-2 fell outside of the prediction interval boundary with the 95% confidence interval. Two datapoints for RADARSAT-2 and three for TerraSAR-X fell outside of the prediction interval boundary.
Figure 13 shows the relation between the field-based forest height and CAI-based modelled height. A very low coefficient of determination was obtained from CAI-based height retrieval for all the PolInSAR data. CAI-based PolInSAR inversion for forest height retrieval from ALOS-2 PALSAR-2 showed an R2 of 0.04. No correlation was obtained between modelled forest height of RADARSAT-2 data and field-measured forest height. The relationship between field-measured forest height and CAI-based forest height of TerraSAR-X data showed an R2 of 0.05. A comparison of CAI-based PolInSAR inversion with field-measured forest height gave an RMSE of 4.48 m for ALOS-2 PALSAR-2, 3.88 m for RADARSAT-2 and 4.90 m for TerraSAR-X data. The standard error of the estimate (SE) were 2.53 m for ALOS-2 PALSAR-2, 2.09 m for RADARSAT-2, and 3.91 m for TerraSAR-X data.
Global forest canopy height map-based vegetation height values for the field-measured plot locations were retrieved to make a comparison as shown in Figure 14. For the 100 plot locations, a comparison of vegetation height values of field-measured forest heights, global forest canopy height-based measurements, and PolInSAR-based height values of TSI and CAI models for multifrequency spaceborne SAR is shown in Figure 15. Figure 14 shows that the best-fit regression line for global forest canopy height map-based vegetation height was between the 95% confidence interval boundaries, and three points fell outside of the prediction interval boundaries. Figure 15 shows that the vegetation height for plot numbers 45, 71, and 94 were underestimated in the global forest canopy height map. The field-based measurements for the forest height for plots 45, 71, and 94 were 24 m, 25 m, and 26 m, respectively, and their corresponding values in the global forest canopy height map were 0 m, 5 m, and 8 m. The linear regression between field-measured and global forest canopy height-based forest height shows a very low coefficient of determination (0.0022) with 5.82 m RMSE and 5.33 m SE.
A comparison of forest height estimates of different spaceborne missions is shown in Table 3. The model-estimated forest heights were statistically tested for their significance using p-values, which indicate the probability of a result being observed. For a statistically significant observation, the p-value should be smaller than the significance level. The smaller p-value shows that there was a significant relation between field-measured and model-estimated forest height values. Higher p-values (near to 1) indicate observations by chance [73]. In Table 3, a very low p-value was shown by most of the forest height observations except for the GEDI mission and RADARSAT-2-based CAI model. The p-value with a 95% confidence level for the GEDI mission and RADARSAT-2-based CAI model was greater than the significance level (0.05). It is visible in Figure 13 and Table 3 that the R2 between CAI-based forest height and field-measured forest height was very low for L-, C-, and X-band PolInSAR data. The RMSE of ALOS-2 PALSAR-2, RADARSAT-2, and TerraSAR-X were 4.48 m, 3.88 m, and 4.90 m, respectively. The standard errors of CAI model estimates with L-, C-, and X- band data were 2.53 m, 2.09 m, and 3.91 m, respectively. It is evident from Table 3, Figure 12, and Figure 13 that TSI-based PolInSAR inversion provided better R2, RMSE, SE, and p-values in forest height retrieval in comparison to the CAI-based modelling approach

5. Discussion

Nowadays, polarimetric SAR data acquisition in interferometric mode shows a great potential in modelling to estimate forest parameters [74,75,76]. Several studies have been carried out for SAR image-based forest height estimation and most successfully demonstrated airborne systems [42,77,78]. Very few studies have studied spaceborne SAR for forest height retrieval compared to aerial SAR systems [48,55,58]. An automated framework was proposed by Lie et al. (2021) to retrieve the vegetation height of a tropical forest using spaceborne TanDEM-X SAR interferometry with 2–3 m accuracy [79]. Lee and Fatoyinbo (2015) performed the PolInSAR inversion technique and retrieved mangrove height using X-band TanDEM-X data with a good correlation coefficient (0.851–0.919) and low RMSE values (1.069–1.727 m) [80]. An investigation was done by Kugler et al. (2014) to find the suitability of X-band TanDEM-X data for PolInSAR inversion-based vegetation height retrieval of a boreal, a temperate, and a tropical site [81]. In the investigation, it was found that the modelled vegetation height for boreal forest showed a very good result with 0.91 coefficient of determination and a low RMSE (1.58 m). Linear regression between the lidar-based and PolInSAR-model-based vegetation height for the temperate and tropical forest showed a 0.89 coefficient of determination with 2.3 m RMSE and a 0.98 coefficient of determination with 2.1 m RMSE [81]. Several other studies were also conducted in which highly accurate results were reported by the researchers [68,82,83,84,85].
In this study, field data were collected for 100 plot locations and used to validate the forest height values of multifrequency spaceborne SAR data and GEDI-derived canopy height. The field data acquisition was done in 2014 and 2015. Spaceborne SAR-system-based L-band ALOS-2 PALSAR-2 and X-band TerraSAR-X data were acquired in 2015 and RADARSAT-2 data were acquired in 2014. Due to the deep penetration capacity of L-band SAR, it was easily possible to detect PolInSAR complex coherences contributed by ground and volume scatterers. The lowest RMSE and SE and highest coefficient of determination were obtained from TSI model-based forest height of ALOS-2 PALSAR-2 data. RADARSAT-2 data also showed reasonable results with its limitation of less penetration capability of the SAR system. The reason behind the reasonably good result of the C-band RADARSAT-2 is the interferometric coherence, which was preserved for the study area due to interferometric data acquisition with a very short baseline. The very short baseline data may be good to preserve interferometric coherence, but the altitude of ambiguity was very high. To resolve this issue, the vertical wavenumber was simulated with an appropriate altitude of ambiguity according to the maximum forest height of the study area. Due to precise complex coherence and simulated vertical baseline, it became possible to obtain reasonably good results from the C-band SAR data. A comparison of results of all the sensors shows that a high RMSE and SE and a reasonably good coefficient of determination with a significant p-value was obtained from the X-band TerraSAR-X SAR system. The reason behind the reasonably acceptable results for the X-band SAR is its spatial resolution, which was highest among all the spaceborne SAR sensors used in this study. The PolInSAR TerraSAR-X data was acquired with a range resolution of 1.36 m and Azimuth resolution of 2.86 m, which enables the sensor to detect ground information through canopy gaps. The analysis of forest height values of spaceborne missions suggests that vegetation height values from the TSI-based model have greater significance for this forest area than other approaches. The complex coherence optimization process of the TSI approach to find ground and top of the vegetation coherence is more rigorous and authentic in comparison to the CAI method as shown in Equations (10) and (11).
The integrated GEDI-derived canopy height with Landsat timeseries data showed a very low coefficient of determination (0.0022) with a high RMSE (5.81 m) and SE (5.33 m). The p-value was also very high, which does not indicate a significant relationship between the vegetation height values of field-measured and GEDI-derived estimates. The main reason behind this may be a large temporal gap (approximately 4 years) between the field data collection and GEDI product. The field data was acquired in 2014 and the GEDI-derived canopy height map was generated in 2019. The error was highest at three plot locations, which were plot numbers 45, 71, and 94. The field-measured values for these locations were 24 m for plot number 45, 25 m for plot number 71, and 26 m for plot number 94, and their respective values in GEDI-derived product were 0 m, 5 m, and 8 m. To understand the reason why the error was high, high-resolution timeseries images of Google Earth were used to visualize the point locations. It is visible in the Google Earth image (Figure 16) of the study area that plot number 45, for which the vegetation height value in GEDI-derived global forest map was assigned as zero, lies in the dense forest with a height of 24 m in the field-measured data.

6. Conclusions

The prime focus of the study was to evaluate the PolInSAR data for forest height retrieval. ALOS-2 PALSAR-2, RADARSAT-2, and TerraSAR-X acquired multifrequency spaceborne PolInSAR data in L-, C-, and X-band. It was found that the PolInSAR coherence has the capability to characterize the features based on the coherence contribution due to different types of scatters in the acquired area. The Polarimetric Interferometric SAR (PolInSAR) technique provides interferometric dataset pairs with multiple polarizations, which have the potential to accurately estimate the forest height. In contrast to the normal interferometric SAR datasets, the availability of multiple polarizations in the PolInSAR datasets helps to optimize the interferometric coherence using the combination of different polarization channels for accurate scattering mechanism retrieval from the ground targets. The optimization of the interferometric coherence maximizes the quality of interferograms and phase information required for accurate forest height retrieval. The multifrequency PolInSAR datasets were analyzed in this research to assess the potential of these datasets for accurate forest height retrieval. GEDI-derived global forest canopy map-based vegetation height values were also tested against the field-measured height values. The vegetation height values of GEDI-derived product showed mismatches with field measurement at several locations, and consequently, a high RMSE (5.82 m) and SE (5.33 m) and a very low R2 (0.0022) were obtained through the linear regression. In the field-measured vegetation height and GEDI-derived estimates, there was a gap of approximately 4–5 years. Due to this large temporal gap and the mismatch in height values at several locations, the p-value, with a 95% confidence level, had not shown a significant relation with the field data. The TSI and CAI modelling approaches were implemented on monostatic PolInSAR data to generate forest height maps. The statistical analysis of the modelled vegetation height showed the supremacy of the TSI approach over other techniques. By performing the Three-Stage Inversion (TSI) technique for forest height estimation using the L-band, C-band, and X-band PolInSAR datasets, it was found that the ALOS-2 PALSAR-2 L-band dataset was able to provide a better tree height estimate with an R2 value of 0.53 for the linear regression between the modelled tree height and field data. The R2 values obtained for the TSI model with C-band and X-band datasets were 0.32 and 0.43, respectively. The mean error analysis of the tree height estimated from the TSI modelling and field data showed that, for the L-band ALOS-2 PALSAR-2 dataset, the error was 2.87 m; for the C-band RADARSAT-2 dataset, the error was 3.74 m; and for the X-band TerraSAR-X dataset, the mean error was 4.53 m. The L-band TSI model-based forest height showed the most reliable result with low RMSE (2.87 m), relatively higher R2 (0.53), and a significant p-value (1.73 × 10⁻¹⁷). The CAI-based PolInSAR inversion showed a very low coefficient of determination between model-derived forest height and field-measured forest height. The p-value analysis of the CAI model-based vegetation height showed marginal significant relation between field-measured and model-estimated forest height values for L- and X-band SAR data. No significant relationships between field-measured and CAI model-estimated forest height were obtained for C-band SAR data. The p-value of CAI model-based vegetation height for RADARSAT-2 data was greater than the significance level. This trend indicates that the TSI model is best suited to correctly assess forest height. Whereas the study area of the Doon Valley forest ranges was mainly dominated by saline trees, future research could include a variety of vegetation and forest types for PolInSAR-model-based forest elevation retrieval under different geographic and climatic conditions.

Author Contributions

Conceptualization, S.K. and S.P.S.K.; methodology, S.K.; software, S.K. and S.P.S.K.; validation, S.K., and H.G.; formal analysis, S.K.; H.G. investigation, writing—original draft preparation, S.K.; writing—review and editing, S.K., S.P.S.K., H.G., P.K.S., and P.K.T., satellite data acquisition, S.K., P.K.T., and field data S.K., S.P.S.K.; visualization, S.K., H.G.; funding acquisition, P.K.S., H.G. All authors have read and agreed to the published version of the manuscript.

Funding

This research received no external funding.

Acknowledgments

The authors would like to express their sincere gratitude to the whole research team of ESA for providing SNAP 6.0 and PolSARPro 4.2 tools for polarimetric processing of the SAR data. The authors are thankful to the German Aerospace Center (DLR) Oberpfaffenhofen for providing TerraSAR-X/TanDEM-X data under the Project Id -NTI_POLI6635 on PolInSAR Tomography for aboveground biomass estimation and the Japan Aerospace Exploration Agency (JAXA) for providing the L-band ALOS-2 PALSAR-2 datasets under the proposal number 1408 of RA4 with the title Hydrological parameter retrieval and glacier dynamics study with L-band SAR data. The Technology Development Programmes (TDP) of the Indian Space Research Organisation (ISRO) supported this research. The RADARSAT-2 data were purchased from the MDA corporation under the ISRO TDP. The research was carried under a TDP code: Z1Z12022E301-303 on the development of semi-empirical/numerical models for biophysical characterization of tropical forests using spaceborne PolSAR and PolInSAR techniques. The authors are thankful to the Indian Institute of Remote Sensing (IIRS), ISRO for providing all the support to carry out this research work. Valuable suggestions from Shree Kamal Pandey, Scientist, Geoweb services, IT & Distance Learning Department, IIRS, and Shree Bhaskar R. Nikam, Scientist, Water Resources Department, IIRS, helped in analysing the modelling output.

Conflicts of Interest

The authors declare no conflict of interest.

References

  1. Chirici, G.; Chiesi, M.; Corona, P.; Salvati, R.; Papale, D.; Fibbi, L.; Sirca, C.; Spano, D.; Duce, P.; Marras, S.; et al. Estimating daily forest carbon fluxes using a combination of ground and remotely sensed data. J. Geophys. Res. Biogeosci. 2016, 121, 266–279. [Google Scholar] [CrossRef] [Green Version]
  2. Adloff, M.; Reick, C.H.; Claussen, M. Earth system model simulations show different feedback strengths of the terrestrial carbon cycle under glacial and interglacial conditions. Earth Syst. Dyn. 2018, 9, 413–425. [Google Scholar] [CrossRef] [Green Version]
  3. Zhang, S.; Pang, B.; Zhang, Z. Carbon footprint analysis of two different types of hydropower schemes: Comparing earth-rockfill dams and concrete gravity dams using hybrid life cycle assessment. J. Clean. Prod. 2015, 103, 854–862. [Google Scholar] [CrossRef]
  4. Shao, P.; Zeng, X.; Sakaguchi, K.; Monson, R.K.; Zeng, X. Terrestrial carbon cycle: Climate relations in eight CMIP5 earth system models. J. Clim. 2013, 26, 8744–8764. [Google Scholar] [CrossRef]
  5. Falkowski, P.; Scholes, R.J.; Boyle, E.; Canadell, J.; Canfield, D.; Elser, J.; Gruber, N.; Hibbard, K.; Hogberg, P.; Linder, S.; et al. The global carbon cycle: A test of our knowledge of earth as a system. Science 2000, 290, 291–296. [Google Scholar] [CrossRef] [Green Version]
  6. Jones, A.D.; Calvin, K.V.; Shi, X.; Di Vittorio, A.V.; Bond-Lamberty, B.; Thornton, P.E.; Collins, W.D. Quantifying Human-Mediated Carbon Cycle Feedbacks. Geophys. Res. Lett. 2018, 45, 11370–11379. [Google Scholar] [CrossRef]
  7. Chen, H.; Zhu, Q.; Peng, C.; Wu, N.; Wang, Y.; Fang, X.; Gao, Y.; Zhu, D.; Yang, G.; Tian, J.; et al. The impacts of climate change and human activities on biogeochemical cycles on the Qinghai-Tibetan Plateau. Glob. Chang. Biol. 2013, 19, 2940–2955. [Google Scholar] [CrossRef]
  8. Raupach, M.R. Ecosystem Services and the Global Carbon Cycle. In Ecosystem Services and Carbon Sequestration in the Biosphere; Lal, R., Lorenz, K., Hüttl, R.F., Schneider, B.U., von Braun, J., Eds.; Springer: Dordrecht, The Netherlands, 2013; pp. 155–181. ISBN 978-94-007-6455-2. [Google Scholar]
  9. Van Leeuwen, M.; Nieuwenhuis, M. Retrieval of forest structural parameters using LiDAR remote sensing. Eur. J. For. Res. 2010, 129, 749–770. [Google Scholar] [CrossRef]
  10. Kangas, A.; Astrup, R.; Breidenbach, J.; Fridman, J.; Gobakken, T.; Korhonen, K.T.; Maltamo, M.; Nilsson, M.; Nord-Larsen, T.; Næsset, E.; et al. Remote sensing and forest inventories in Nordic countries–roadmap for the future. Scand. J. For. Res. 2018, 33, 397–412. [Google Scholar] [CrossRef] [Green Version]
  11. Gleason, C.; Im, J. A review of remote sensing of forest biomass and biofuel: Options for small-area applications. GIScience Remote Sens. 2011, 48, 141–170. [Google Scholar] [CrossRef]
  12. Chen, X.; An, S.; Chen, J.; Liu, Y.; Xu, C.; Yang, H. A review on forest ecosystem biophysical parameter retrieval from remotely sensed data. Chin. J. Ecol. 2005, 24, 1074–1079. [Google Scholar]
  13. Zhao, J.; Li, J.; Liu, Q. Review of forest vertical structure parameter inversion based on remote sensing technology. Yaogan Xuebao/J. Remote Sens. 2013, 17, 697–716. [Google Scholar]
  14. Lutz, D.A.; Washington-Allen, R.A.; Shugart, H.H. Remote sensing of boreal forest biophysical and inventory parameters: A review. Can. J. Remote Sens. 2008, 34, S286–S313. [Google Scholar] [CrossRef]
  15. Story, M.; Polcyn, F.; Imhoff, M.; Vermillion, C.; Khan, F. Forest Canopy Characterization and Vegetation Penetration Assessment with Space-Borne Radar. IEEE Trans. Geosci. Remote Sens. 1986, GE-24, 535–542. [Google Scholar]
  16. Beaudoin, A.; Le Toan, T.; Goze, S.; Nezry, E.; Lopes, A.; Mougin, E.; Hsu, C.C.; Han, H.C.; Kong, J.A.; Shin, R.T. Retrieval of forest biomass from SAR data. Int. J. Remote Sens. 1994, 15, 2777–2796. [Google Scholar] [CrossRef]
  17. Luckman, A.; Baker, J.; Kuplich, T.M.; Corina da Costa, F.Y.; Alejandro, C.F. A study of the relationship between radar backscatter and regenerating tropical forest biomass for spaceborne SAR instruments. Remote Sens. Environ. 1997, 60, 1–13. [Google Scholar] [CrossRef]
  18. Luckman, A.J. Correction of SAR imagery for variation in pixel scattering area caused by topography. IEEE Trans. Geosci. Remote Sens. 1998, 36, 344–350. [Google Scholar] [CrossRef]
  19. Kumar, S.; Pandey, U.; Kushwaha, S.P.; Chatterjee, R.S.; Bijker, W. Aboveground biomass estimation of tropical forest from Envisat advanced synthetic aperture radar data using modeling approach. J. Appl. Remote Sens. 2012, 6, 063588. [Google Scholar] [CrossRef]
  20. Main, R.; Mathieu, R.; Kleynhans, W.; Wessels, K.; Naidoo, L.; Asner, G.P. Hyper-temporal C-band SAR for baseline woody structural assessments in deciduous savannas. Remote Sens. 2016, 8, 661. [Google Scholar] [CrossRef] [Green Version]
  21. Vaglio, G.L.; Pirotti, F.; Callegari, M.; Chen, Q.; Cuozzo, G.; Lingua, E.; Notarnicola, C.; Papale, D. Potential of ALOS2 and NDVI to estimate forest above-ground biomass, and comparison with lidar-derived estimates. Remote Sens. 2017, 9, 18. [Google Scholar] [CrossRef] [Green Version]
  22. Ningthoujam, R.K.; Balzter, H.; Tansey, K.; Morrison, K.; Johnson, S.C.M.; Gerard, F.; George, C.; Malhi, Y.; Burbidge, G.; Doody, S.; et al. Airborne S-band SAR for forest biophysical retrieval in temperate mixed forests of the UK. Remote Sens. 2016, 8, 609. [Google Scholar] [CrossRef] [Green Version]
  23. Bharadwaj, P.S.; Kumar, S.; Kushwaha, S.P.S.; Bijker, W. Polarimetric scattering model for estimation of above ground biomass of multilayer vegetation using ALOS-PALSAR quad-pol data. Phys. Chem. Earth Parts A/B/C 2015, 83–84, 187–195. [Google Scholar] [CrossRef]
  24. Solberg, S.; Næsset, E.; Gobakken, T.; Bollandsås, O.-M. Forest biomass change estimated from height change in interferometric SAR height models. Carbon Balance Manag. 2014, 9, 1–12. [Google Scholar] [CrossRef] [PubMed] [Green Version]
  25. Lefsky, M.A.; Harding, D.J.; Keller, M.; Cohen, W.B.; Carabajal, C.C.; Bom Espirio-Santo, F.; Hunter, M.O.; Oliveira, R. Estimates of forest canopy height and aboveground biomass using ICESat. Geophys. Res. Lett. 2005, 32. [Google Scholar] [CrossRef] [Green Version]
  26. Wang, M.; Sun, R.; Xiao, Z. Estimation of forest canopy height and aboveground biomass from spaceborne LiDAR and Landsat imageries in Maryland. Remote Sens. 2018, 10, 344. [Google Scholar] [CrossRef] [Green Version]
  27. Wang, X.; Ouyang, S.; Sun, O.J.; Fang, J. Forest biomass patterns across northeast China are strongly shaped by forest height. For. Ecol. Manage. 2013, 293, 149–160. [Google Scholar] [CrossRef]
  28. Treuhaft, R.N.; Madsen, S.N.; Moghaddam, M.; van Zyl, J.J. Vegetation characteristics and underlying topography from interferometric radar. Radio Sci. 1996, 31, 1449–1485. [Google Scholar] [CrossRef]
  29. Balzter, H.; Rowland, C.S.; Saich, P. Forest canopy height and carbon estimation at Monks Wood National Nature Reserve, UK, using dual-wavelength {SAR} interferometry. Remote Sens. Environ. 2007, 108, 224–239. [Google Scholar] [CrossRef]
  30. Askne, J.I.H.; Dammert, P.B.G.; Ulander, L.M.H.; Smith, G.S. C-Band Repeat-Pass Interferometric SAR Observations of the Forest. IEEE Trans. Geosci. Remote Sens. 1997, 35, 25–35. [Google Scholar] [CrossRef]
  31. Tebaldini, S. Single and multipolarimetric SAR tomography of forested areas: A parametric approach. IEEE Trans. Geosci. Remote Sens. 2010, 48, 2375–2387. [Google Scholar] [CrossRef]
  32. Aguilera, E.; Nannini, M.; Reigber, A. Wavelet-based compressed sensing for SAR tomography of forested areas. IEEE Trans. Geosci. Remote Sens. 2013, 51, 5283–5295. [Google Scholar] [CrossRef] [Green Version]
  33. Nannini, M.; Scheiber, R.; Horn, R.; Moreira, A. First 3-D reconstructions of targets hidden beneath foliage by means of polarimetric SAR tomography. IEEE Geosci. Remote Sens. Lett. 2012, 9, 60–64. [Google Scholar] [CrossRef] [Green Version]
  34. Kumar, S.; Joshi, S.K. SAR Tomography for forest structure investigation. In Proceedings of the Asia Pacific Microwave Conference 2016, New Delhi, India, 5–9 December 2016; pp. 1–4. [Google Scholar]
  35. Xue, F.; Wang, X.; Xu, F.; Wang, Y. Polarimetric SAR Interferometry: A Tutorial for Analyzing System Parameters. IEEE Geosci. Remote Sens. Mag. 2020, 8, 83–107. [Google Scholar] [CrossRef]
  36. Cloude, S.R.; Papathanassiou, K.P. Polarimetric SAR interferometry. IEEE Trans. Geosci. Remote Sens. 1998, 36, 1551–1565. [Google Scholar] [CrossRef]
  37. Kumar, S. PolInSAR and PolTomSAR based Modelling for Characterization of Forest Parameters; Indian Institute of Technology: Roorkee, India, 2019. [Google Scholar]
  38. Garestier, F.; Dubois-Fernandez, P.; Champion, I.; Toan, T. Le Pine forest investigation using high resolution P-band Pol-InSAR data. Remote Sens. Environ. 2011, 115, 2897–2905. [Google Scholar] [CrossRef]
  39. Le Toan, T.; Quegan, S.; Davidson, M.W.J.; Balzter, H.; Paillou, P.; Papathanassiou, K.; Plummer, S.; Rocca, F.; Saatchi, S.; Shugart, H.; et al. The BIOMASS mission: Mapping global forest biomass to better understand the terrestrial carbon cycle. Remote Sens. Environ. 2011, 115, 2850–2860. [Google Scholar] [CrossRef] [Green Version]
  40. Oveisgharan, S.; Saatchi, S.S.; Hensley, S. Sensitivity of Pol-InSAR Measurements to Vegetation Parameters. IEEE Trans. Geosci. Remote Sens. 2015, 53, 6561–6572. [Google Scholar] [CrossRef]
  41. Cloude, S.R.; Papathanassiou, K.P. Three-stage inversion process for polarimetric SAR interferometry. IEEE Proc. Radar Sonar Navig. 2003, 150, 125–134. [Google Scholar] [CrossRef] [Green Version]
  42. Neumann, M.; Ferro-Famil, L.; Reigber, A. Estimation of forest structure, ground, and canopy layer characteristics from multibaseline polarimetric interferometric SAR data. IEEE Trans. Geosci. Remote Sens. 2010, 48, 1086–1104. [Google Scholar] [CrossRef] [Green Version]
  43. Asopa, U.; Kumar, S. UAVSAR Tomography for Vertical Profile Generation of Tropical Forest of Mondah National Park, Gabon. Earth Sp. Sci. 2020, 7, e2020EA001230. [Google Scholar] [CrossRef]
  44. Papathanassiou, K.P.; Cloude, S.R. Single-baseline polarimetric SAR interferometry. IEEE Trans. Geosci. Remote Sens. 2001, 39, 2352–2363. [Google Scholar] [CrossRef] [Green Version]
  45. Garestier, F.; Dubois-Fernandez, P.C.; Papathanassiou, K.P. Pine forest height inversion using single-pass X-band PolInSAR data. IEEE Trans. Geosci. Remote Sens. 2008, 46, 59–68. [Google Scholar] [CrossRef]
  46. Neumann, M.; Saatchi, S.S.; Ulander, L.M.H.; Fransson, J.E.S. Assessing Performance of L- and P-Band Polarimetric Interferometric SAR Data in Estimating Boreal Forest Above-Ground Biomass. IEEE Trans. Geosci. Remote Sens. 2012, 50, 714–726. [Google Scholar] [CrossRef]
  47. Shiroma, G.H.X.; de Macedo, K.A.C.; Wimmer, C.; Moreira, J.R.; Fernandes, D. The Dual-Band PolInSAR Method for Forest Parametrization. IEEE J. Sel. Top. Appl. Earth Obs. Remote Sens. 2016, 9, 3189–3201. [Google Scholar] [CrossRef]
  48. Kumar, S.; Khati, U.G.; Chandola, S.; Agrawal, S.; Kushwaha, S.P.S. Polarimetric SAR Interferometry based modeling for tree height and aboveground biomass retrieval in a tropical deciduous forest. Adv. Sp. Res. 2017, 60, 571–586. [Google Scholar] [CrossRef]
  49. Liao, Z.; He, B.; van Dijk, A.I.J.M.; Bai, X.; Quan, X. The impacts of spatial baseline on forest canopy height model and digital terrain model retrieval using P-band PolInSAR data. Remote Sens. Environ. 2018, 210, 403–421. [Google Scholar] [CrossRef]
  50. Kugler, F.; Lee, S.-K.; Hajnsek, I.; Papathanassiou, K.P. Forest Height Estimation by Means of Pol-InSAR Data Inversion: The Role of the Vertical Wavenumber. IEEE Trans. Geosci. Remote Sens. 2015, 53, 5294–5311. [Google Scholar] [CrossRef]
  51. Erten, E.; Lopez-Sanchez, J.M.; Yuzugullu, O.; Hajnsek, I. Retrieval of agricultural crop height from space: A comparison of SAR techniques. Remote Sens. Environ. 2016, 187, 130–144. [Google Scholar] [CrossRef] [Green Version]
  52. López-Martínez, C.; Fàbregas, X.; Pipia, L. Forest parameter estimation in the Pol-InSAR context employing the multiplicative–additive speckle noise model. ISPRS J. Photogramm. Remote Sens. 2011, 66, 597–607. [Google Scholar] [CrossRef]
  53. Lopez-Sanchez, J.M.; Vicente-Guijalba, F.; Erten, E.; Campos-Taberner, M.; Garcia-Haro, F.J. Retrieval of vegetation height in rice fields using polarimetric SAR interferometry with TanDEM-X data. Remote Sens. Environ. 2017, 192, 30–44. [Google Scholar] [CrossRef] [Green Version]
  54. Stebler, O.; Meier, E.; Nüesch, D. Multi-baseline polarimetric {SAR} interferometry—First experimental spaceborne and airborne results. ISPRS J. Photogramm. Remote Sens. 2002, 56, 149–166. [Google Scholar] [CrossRef]
  55. Zhang, Y.; He, C.; Xu, X.; Chen, D. Forest vertical parameter estimation using PolInSAR imagery based on radiometric correction. ISPRS Int. J. Geo-Inf. 2016, 5, 186. [Google Scholar] [CrossRef] [Green Version]
  56. Bao, Z.; Guo, R.; Suo, Z.; Lu, H. S-RVoG model for forest parameters inversion over underlying topography. Electron. Lett. 2013, 49, 618–620. [Google Scholar]
  57. Wang, C.; Wang, L.; Fu, H.; Xie, Q.; Zhu, J. The Impact of Forest Density on Forest Height Inversion Modeling from Polarimetric InSAR Data. Remote Sens. 2016, 8, 291. [Google Scholar] [CrossRef] [Green Version]
  58. Kumar, S.; Garg, R.D.; Kushwaha, S.P.S.; Jayawardhana, W.G.N.N.; Agarwal, S. Bistatic PolInSAR Inversion Modelling for Plant Height Retrieval in a Tropical Forest. Proc. Natl. Acad. Sci. India Sect. A Phys. Sci. 2017, 87, 817–826. [Google Scholar] [CrossRef]
  59. Kumar, S.; Sara, R.; Singh, J.; Agrawal, S.; Kushwaha, S.P.S. Spaceborne PolInSAR and ground-based TLS data modeling for characterization of forest structural and biophysical parameters. Remote Sens. Appl. Soc. Environ. 2018, 11, 241–253. [Google Scholar] [CrossRef]
  60. Hansen, M.; Kommareddy, I. Global Forest Canopy Height. 2019. Available online: https://glad.umd.edu/dataset/gedi (accessed on 22 November 2020).
  61. Potapov, P.; Li, X.; Hernandez-Serna, A.; Tyukavina, A.; Hansen, M.C.; Kommareddy, A.; Pickens, A.; Turubanova, S.; Tang, H.; Silva, C.E.; et al. Mapping global forest canopy height through integration of GEDI and Landsat data. Remote Sens. Environ. 2020, 112165. [Google Scholar] [CrossRef]
  62. Moreira, A.; Prats-iraola, P.; Younis, M.; Krieger, G.; Hajnsek, I.; Papathanassiou, K.P. A tutorial on synthetic aperture radar. IEEE Geosci. Remote Sens. Mag. 2013, 1, 6–43. [Google Scholar] [CrossRef] [Green Version]
  63. Yamaguchi, Y.; Sato, A.; Boerner, W.M.; Sato, R.; Yamada, H. Four-Component Scattering Power Decomposition With Rotation of Coherency Matrix. IEEE Trans. Geosci. Remote Sens. 2011, 49, 2251–2258. [Google Scholar] [CrossRef]
  64. European Space Agency Sentinel Application Platform (SNAP) V 6.0. Available online: https://step.esa.int/main/toolboxes/snap/ (accessed on 14 September 2018).
  65. Cloude, S.R.; Pottier, E. A Review of Target Decomposition Theorems in Radar Polarimetry. IEEE Trans. Geosci. Remote Sens. 1996, 34, 498–518. [Google Scholar] [CrossRef]
  66. Treuhaft, R.N.; Siqueira, P.R. Vertical structure of vegetated land surfaces from interferometric and polarimetric radar. Radio Sci. 2000, 35, 141–177. [Google Scholar] [CrossRef] [Green Version]
  67. Xie, Q.; Zhu, J.; Wang, C.; Fu, H.; Lopez-Sanchez, J.M.; Ballester-Berman, J.D. A modified dual-baseline PolInSAR method for forest height estimation. Remote Sens. 2017, 9, 819. [Google Scholar] [CrossRef] [Green Version]
  68. Liao, Z.; He, B.; Bai, X.; Quan, X. Improving Forest Height Retrieval by Reducing the Ambiguity of Volume-Only Coherence Using Multi-Baseline PolInSAR Data. IEEE Trans. Geosci. Remote Sens. 2019, 57, 8856–8866. [Google Scholar] [CrossRef]
  69. Wenxue, F.; Huadong, G.; Xinwu, L.; Bangsen, T.; Zhongchang, S. Extended Three-Stage Polarimetric SAR Interferometry Algorithm by Dual-Polarization Data. IEEE Trans. Geosci. Remote Sens. 2016, 54, 2792–2802. [Google Scholar] [CrossRef]
  70. Khati, U.; Singh, G.; Kumar, S. Potential of Space-Borne PolInSAR for Forest Canopy Height Estimation Over India-A Case Study Using Fully Polarimetric L-, C-, and X-Band SAR Data. IEEE J. Sel. Top. Appl. Earth Obs. Remote Sens. 2018, 11, 2406–2416. [Google Scholar] [CrossRef]
  71. Cloude, S.R. Pol-InSAR Training Course. Available online: https://earth.esa.int/documents/653194/656796/Pol-InSAR_Training_Course.pdf (accessed on 14 September 2020).
  72. Cloude, S.R. Polarization coherence tomography. Radio Sci. 2006, 41, 1–27. [Google Scholar] [CrossRef]
  73. Chekanov, S.V. Probability and Statistics. In Numeric Computation and Statistical Data Analysis on the Java Platform; Springer International Publishing: Cham, Switzerland, 2016; pp. 351–397. ISBN 978-3-319-28531-3. [Google Scholar]
  74. Liao, Z.; He, B.; Quan, X.; van Dijk, A.I.J.M.; Qiu, S.; Yin, C. Biomass estimation in dense tropical forest using multiple information from single-baseline P-band PolInSAR data. Remote Sens. Environ. 2019, 221, 489–507. [Google Scholar] [CrossRef]
  75. Denbina, M.; Simard, M.; Hawkins, B. Forest Height Estimation Using Multibaseline PolInSAR and Sparse Lidar Data Fusion. IEEE J. Sel. Top. Appl. Earth Obs. Remote Sens. 2018, 11, 3415–3433. [Google Scholar] [CrossRef]
  76. Aghabalaei, A.; Ebadi, H.; Maghsoudi, Y. Forest height estimation based on the RVoG inversion model and the PolInSAR decomposition technique. Int. J. Remote Sens. 2020, 41, 2684–2703. [Google Scholar] [CrossRef]
  77. Lee, S.-K.; Kugler, F.; Papathanassiou, K.P.; Hajnsek, I. Quantification of temporal decorrelation effects at L-band for polarimetric SAR interferometry applications. IEEE J. Sel. Top. Appl. Earth Obs. Remote Sens. 2013, 6, 1351–1367. [Google Scholar] [CrossRef]
  78. Simard, M.; Denbina, M. An assessment of temporal decorrelation compensation methods for forest canopy height estimation using airborne L-band same-day repeat-pass polarimetric SAR interferometry. IEEE J. Sel. Top. Appl. Earth Obs. Remote Sens. 2018, 11, 95–111. [Google Scholar] [CrossRef]
  79. Lei, Y.; Treuhaft, R.; Gonçalves, F. Automated estimation of forest height and underlying topography over a Brazilian tropical forest with single-baseline single-polarization TanDEM-X SAR interferometry. Remote Sens. Environ. 2021, 252, 112132. [Google Scholar] [CrossRef]
  80. Lee, S.-K.; Fatoyinbo, T.E. TanDEM-X Pol-InSAR Inversion for Mangrove Canopy Height Estimation. IEEE J. Sel. Top. Appl. Earth Obs. Remote Sens. 2015, 8, 3608–3618. [Google Scholar] [CrossRef]
  81. Kugler, F.; Schulze, D.; Hajnsek, I.; Pretzsch, H.; Papathanassiou, K.P. TanDEM-X Pol-InSAR performance for forest height estimation. IEEE Trans. Geosci. Remote Sens. 2014, 52, 6404–6422. [Google Scholar] [CrossRef]
  82. Wang, X.; Xu, F. A PolinSAR Inversion Error Model on Polarimetric System Parameters for Forest Height Mapping. IEEE Trans. Geosci. Remote Sens. 2019, 57, 5669–5685. [Google Scholar] [CrossRef]
  83. Sun, X.; Wang, B.; Xiang, M.; Jiang, S.; Fu, X. Forest height estimation based on constrained Gaussian Vertical Backscatter model using multi-baseline P-band Pol-InSAR data. Remote Sens. 2019, 11, 42. [Google Scholar] [CrossRef] [Green Version]
  84. Brigot, G.; Simard, M.; Colin-Koeniguer, E.; Boulch, A. Retrieval of forest vertical structure from PolInSAR Data by machine learning using LIDAR-Derived features. Remote Sens. 2019, 11, 381. [Google Scholar] [CrossRef] [Green Version]
  85. Berninger, A.; Lohberger, S.; Zhang, D.; Siegert, F. Canopy height and above-ground biomass retrieval in tropical forests using multi-pass X-and C-band Pol-InSAR data. Remote Sens. 2019, 11, 2105. [Google Scholar] [CrossRef] [Green Version]
Figure 1. Sentinel-2 False Color Composite (FCC) image of the study area.
Remotesensing 12 04042 g001
Figure 2. (a) Vegetation type map of the forest ranges, (b) Terrestrial Lase Scanner (TLS)-based forest height measurement, (c) Sal trees, and (d) sample plot design.
Remotesensing 12 04042 g002
Figure 3. Field-measured plot-wise average forest height with error bars.
Remotesensing 12 04042 g003
Figure 4. The 30 m spatial resolution global forest canopy height map of Uttarakhand, India.
Remotesensing 12 04042 g004
Figure 5. A subset of global forest canopy height map for the Barkot and Thano forest ranges.
Remotesensing 12 04042 g005
Figure 6. Polarimetric synthetic-aperture radar interferometry (PolInSAR) geometry.
Remotesensing 12 04042 g006
Figure 7. Polarimetric decomposition-based scattering representation of (a) ALOS-2 PALSAR-2 L-band, (b) TerraSAR-X band, and (c) RADARSAT-2 C-band SAR data.
Remotesensing 12 04042 g007
Figure 8. Methodology for PolInSAR inversion modelling for forest height retrieval.
Remotesensing 12 04042 g008
Figure 9. ALOS-2 PALSAR-2 inversion-based forest height for the Barkot and Thano forest ranges using (a) the TSI model and (b) the CAI model.
Remotesensing 12 04042 g009
Figure 10. RADARSAT-2 inversion-based forest height for the Barkot and Thano forest ranges using (a) the TSI model and (b) the CAI model.
Remotesensing 12 04042 g010
Figure 11. TerraSAR-X inversion-based forest height for the Barkot and Thano forest ranges using (a) the TSI model and (b) the CAI model.
Remotesensing 12 04042 g011
Figure 12. Linear regression with 95% confidence interval for TSI-based inversion modelling of (a) L-band SAR data, (b) C-band SAR data, and (c) X-band SAR data.
Remotesensing 12 04042 g012aRemotesensing 12 04042 g012b
Figure 13. Linear regression with 95% confidence interval for CAI-based inversion modelling of (a) L-band SAR data, (b) C-band SAR data, and (c) X-band SAR data.
Remotesensing 12 04042 g013aRemotesensing 12 04042 g013b
Figure 14. Linear regression with 95% confidence interval between field-measured and global forest canopy height map-based forest height.
Remotesensing 12 04042 g014
Figure 15. A comparison of forest height values of field-measured, PolInSAR-derived, and global canopy height map.
Remotesensing 12 04042 g015
Figure 16. Google Earth view of plot numbers 45, 71, and 94.
Remotesensing 12 04042 g016
Table 1. Number of plots of the field-collected data for forest height measurement.
Forest Vegetation TypeNo. of Plots
Khair-Sisham Forest5
Mixed Miscellaneous Forest18
Sal Forest77
Table 2. Description of the multifrequency polarimetric interferometric data.
PolInSAR DataTerraSAR-XRADARSAT-2ALOS-2 PALSAR-2
Acquisition ReferenceSecondaryReferenceSecondaryReferenceSecondary
Date of acquisition21 January 201512 February 201527 January 201420 February 20149 August 201523 August 2015
PolarisationQuad-pol (HH+HV+VH+VV)
Wavelength (cm)/frequency (GHz)3.10/9.645.55/5.424.25/1.236
Resolution (m),
range & azimuth
1.36 & 2.864.7 & 9.52.86 & 3.236
Absolute orbit4215942493322913194865456752
Near range incidence angle24.5924.5433.4533.4521.5621.55
Far range incidence angle26.7326.7935.0735.0725.9325.93
Perpendicular baseline (m)10567.9284.37
Temporal baseline (days)222414
Altitude of ambiguity (m)35.85215.05455.16
Table 3. Comparison of forest height values obtained from different spaceborne earth observation missions.
MissionApproachCoefficient of Determination (R2)Root Mean Square Error (RMSE)Standard Error
(SE)
p-Value with 95%
Confidence Level
ALOS-2 PALSAR-2TSI0.532.87 m1.56 m1.73 × 10−17
CAI0.044.48 m2.53 m0.040
RADARSAT-2TSI0.323.74 m1.73 m1.22 × 10−9
CAI0.003.88 m2.09 m0.906
TerraSAR-XTSI0.434.53 m2.17 m2.08 × 10−13
CAI0.054.90 m3.91 m0.019
GEDIIntegration of GEDI-derived canopy height with Landsat timeseries data0.00225.82 m5.33 m0.644
Publisher’s Note: MDPI stays neutral with regard to jurisdictional claims in published maps and institutional affiliations.

