Abstract
Subfootprint variability (SFV), or representativeness error, is variability within the footprint of a satellite that can impact validation by comparison of in situ and remote sensing data. This study seeks to determine the size of the sea surface salinity (SSS) SFV as a function of footprint size in two regions that were heavily sampled with in situ data. The Salinity Processes in the Upper-ocean Regional Studies-1 (SPURS-1) experiment was conducted in the subtropical North Atlantic in the period 2012–2013, whereas the SPURS-2 study was conducted in the tropical eastern North Pacific in the period 2016–2017. SSS SFV was also computed using a high-resolution regional model based on the Regional Ocean Modeling System (ROMS). We computed SFV at footprint sizes ranging from 20 to 100 km for both regions. SFV is strongly seasonal, but for different reasons in the two regions. In the SPURS-1 region, the meso- and submesoscale variability seemed to control the size of the SFV. In the SPURS-2 region, the SFV is much larger than SPURS-1 and controlled by patchy rainfall.
1. Introduction
Sea surface salinity (SSS) has been measured by satellite for over 10 years from three different platforms, ESA’s Soil Moisture and Ocean Salinity (SMOS), NASA and CONAE’s Aquarius and NASA’s Soil Moisture Active Passive (SMAP). The value of these measurements to the scientific community and for practical applications has become clear over this time as has the need for continuity. SMOS has been aloft since 2009 and, though still returning good data, is long past its expected lifetime. Aquarius stopped transmitting in 2015. SMAP, also still returning good data, is having to rely on ancillary measurements of sea surface roughness because its onboard scatterometer stopped functioning soon after launch. A comprehensive review on satellite measurement of SSS has been provided by [1]. Given all of this, there has been much interest in developing new missions to measure SSS, and thus the need to understand the parameters of a such a mission.
Currently-used SSS sensors are passive microwave L-band radiometers, and use a relatively long wavelength of radiation to make their measurement, although the possibility of using other frequencies has also been explored (e.g., [2]). The measurements for L-band are thus averages over a large footprint, 10 s to 100 s of kilometers depending on the frequency of radiation and configuration of the satellite. Subfootprint variability (SFV) is the variance within the footprint of a satellite measurement [3,4,5]. Because satellite SSS measurements are areal averages over a relatively large footprint [6], and because existing validation is carried out by comparison to in situ point measurements from floats, moorings and so on [7,8,9,10,11], there is a mismatch that can introduce error into the validation process as explained in detail by [3]. The size of this error is beginning to be estimated and understood [3,4,5,12]. However, these important previous studies have been based on the footprint the size of Aquarius, 100 km, whereas the SMAP and SMOS missions have smaller footprints. The amount of SFV should depend on the size of the footprint, as well as many other factors such as season, geographic location and the strength of mesoscale and submesoscale stirring of the SSS field.
One of the most interesting results that has come out of the increased measurement of SSS over the past decade is on the spatial scales of variability. While other surface variables measured by satellite, namely sea surface temperature (SST) and sea surface height (SSH), have relatively large scales [13,14,15], SSS variability occurs on a smaller scale [16]. Very high resolution numerical modelling, with output focused on the western North Pacific and Arabian Sea [17], found that approximately 50% of open ocean SSS variance in these regions is on a scale of 50 km or less. That is, most ocean variance occurs on a scale that is smaller than the footprint of Aquarius, and of similar size to that of SMAP or SMOS. Solid and detailed evaluation of SFV based on observations is very much needed but still lacking. We here leverage two field campaigns, which were expressly designed for understanding near-surface salinity processes [18,19], to evaluate SFV.
This paper is an extension of [3], who assumed the footprint size to be a constant 100 km. In the present work, we explore how SFV depends on footprint size, and begin to understand the dynamics that cause SFV. The approach is to look at two heavily sampled regions, in which contrasting dynamical processes are present, a couple of the small number places in the ocean where SFV can be reliably determined using in situ data. We guess that SFV can be roughly related to four causes: (1) rainfall-induced fresh patches (e.g., [20]); (2) internal ocean submesoscale and mesoscale variability (e.g., [5,21]); (3) large-scale fronts such as the North Equatorial Countercurrent (NECC) front that moves between the equator and 10°N [22] and (4) mean gradients. These four causes are ordered roughly in terms of scale from smallest to largest.
The two regions we are studying are Salinity Processes in the Upper-ocean Regional Study 1 (SPURS-1) and SPURS-2. SPURS-1 is a field campaign that took place in the subtropical North Atlantic in the period 2012–2013 ([18] and references therein) centered on a mooring at (24.5°N, 38°W). The SPURS-1 region is evaporation dominated, with small gradients and weak currents. SPURS-2 took place in the tropical eastern North Pacific in the period 2016–2017 ([19] and references therein) centered on a mooring at (10°N, 125°W). The SPURS-2 region is precipitation dominated, with strong currents, and falls within the intertropical convergence zone (ITCZ) for part of the year [23]. See [3] Figure 3 for the locations. We expect that SFV will be induced mainly by cause (2) above in the SPURS-1 region and by causes (1)–(3) in the SPURS-2 region.
2. Data and Methods
This work uses the same dataset and methods as [3], and the reader is referred to Section 2 of that paper for a more detailed description than is given here.
For the SPURS-1 region, we use a combination of drifter, waveglider and shipboard thermosalinograph (TSG) measurements [24] to compute estimates of SFV. In the SPURS-2 region [25], we use waveglider measurements only—the region is too dynamic to make much use of drifter measurements for this purpose, and the cruises were usually too distant from the location of the central mooring to be useful. SFV is derived from the weighted variance within a defined footprint of size 2d0. In [3], the footprint size is fixed at 100 km, whereas here it is allowed to vary from 20 to 100 km to determine the dependence of SFV on footprint size. Specifically, the SFV is obtained from taking the square root of
where the weight function wi for each observation is
Si is the observed SSS. The sum, C, is taken over all the observations being used to compute SFV at a given point in time - SFV was computed over 7 day blocks of time. di is the distance of each observation from the location of the central mooring, i.e., (24.6°N, 38°W) for SPURS-1 and (10°N, 125°W) for SPURS-2. The weighted average SSS, , is
We display plots of median SFV, termed σ50, as a function of footprint size over the approximately 1 year of available data at each site.
This paper uses the same Regional Ocean Modeling System (ROMS) [24,26] output as was used in [3], and the method of computing SFV is the same as for the in situ data.
Brief use is made of radar-derived rainfall collected during the SPURS-2 cruise in October November 2017. The data come from the Sea-viewing Polarimetric (SEA-POL) radar described by [27,28]. Brief use is also made of rainfall data collected at the SPURS-1 and SPURS-2 central moorings [29,30]
Data source digital object identifiers (dois) are as follows:
- SPURS-1
- ○
- Drifters: doi: 10.5067/SPUR1-DRIFT
- ○
- TSGs: doi: 10.5067/SPUR1-TSG00
- ○
- Wavegliders: doi: 10.5067/SPUR1-GLID3
- ○
- Mooring rainfall: doi: 10.5067/SPUR1-MOOR1
- SPURS-2
- ○
- Wavegliders: doi: 10.5067/SPUR2-GLID3
- ○
- Radar rainfall: doi: 10.5067/SPUR2-RNRDR
- ○
- Mooring rainfall: doi: 10.5067/SPUR2-MOOR1
- ROMS
- ○
- SPURS-1: doi: 10.15139/S3/6ILDLJ
- ○
- SPURS-2: doi: 10.15139/S3/UNJ8FX
3. Results
3.1. In Situ Results
Time series of SFV (Figure 1) in the SPURS regions indicate that it is a seasonal quantity, tending to be largest in summer and fall (June–December) and smallest in winter and spring (January–May). SFV in the SPURS-2 region is larger than SPURS-1, though the difference is least in the low variance season. In most instances, SFV is larger at the 100 km footprint size for both regions. There are isolated time periods when this is reversed, especially in the SPURS-1 region. There tends to be a larger distinction as a function of scale for the SPURS-1 region. That is, for SPURS-1, the ratio of 100 km SFV to 20 km SFV is generally larger than for SPURS-2.
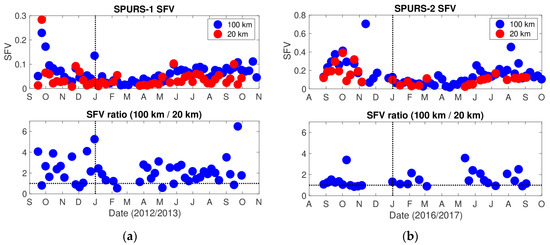
Figure 1.
Time series of SFV in the SPURS regions. Top panels: Blue markers are SFV using a 100 km footprint size. Red markers use a 20 km footprint. Bottom panels: Ratio of 100 km to 20 km SFV. That is, the ratio of the blue markers in the top panels to the red markers. The horizontal dashed line indicates where this ratio is 1. (a) SPURS-1; (b) SPURS-2. Note vertical axes are not consistent between the top panels.
The findings from the time series are presented in simpler form using σ50 (Figure 2). As also seen in Figure 1, SFV is as much as 4X larger at SPURS-2 than SPURS-1. At SPURS-1, SFV increases with footprint size from 20 to 60 km, and then levels off at approximately 0.05. At the SPURS-2 site, SFV does not increase at all from 20 to 60 km, and then increases a little bit. There is proportionally much less dependence on footprint size at SPURS-2 than SPURS-1, in agreement with Figure 1.
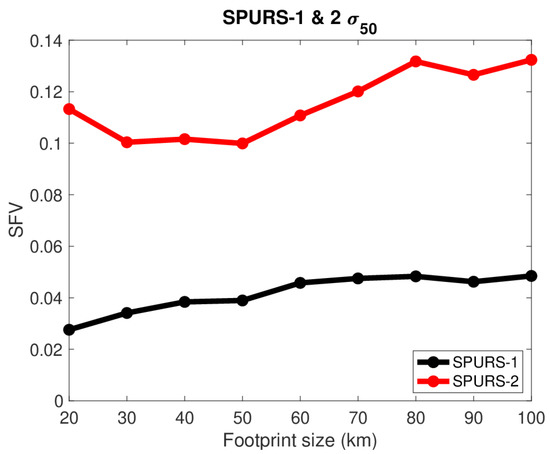
Figure 2.
Median SFV (σ50) as a function of footprint size for SPURS-1 (black) and SPURS-2 (red) in situ data.
In the SPURS-1 region, there is little rainfall between March 1 and August 31 [29], and in the SPURS-2 region between February 1 and May 31 [30]. (Henceforth we use months in an inclusive sense. That is, “March–August” means March 1–August 31.) Additionally, at the SPURS-2 site, the NECC front is well south of the mooring during those “dry” months [23]. So, for both sites, one can assume that any SFV there during these periods is due to internal variance within the ocean and not imprinted directly by the atmosphere through precipitation. Evaporation may imprint some SFV, but not likely much as SSS anomalies imposed by evaporation tend to dissipate quickly [31].
Separating the SFV out during the wet and dry periods (Figure 3), one can see a sharp contrast between the regions. In the SPURS-1 region, SFV increases strongly with footprint size from 20 to 70 km during the dry season, but only out to 40 km in the wet season. SFV is about the same between wet and dry seasons to 40 km. At larger footprint sizes, it is counterintuitively much larger during the dry season. The dry season corresponds to spring and summer, so one has to assume that internal variability is larger during these months than during fall and winter at 50+ km length scales. This seems consistent with [32] who found elevated eddy kinetic energy (EKE) in the SPURS-1 region during the months of April–September. Larger EKE presumably means stronger eddy activity at the mesoscale, and thus larger variability of SSS at that scale as well.
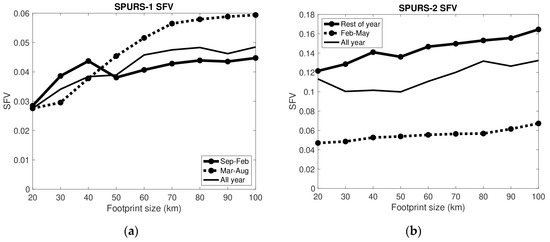
Figure 3.
Median SFV (σ50) vs. footprint size in the SPURS regions. Solid lines with markers: wet season. Thinner solid lines with no markers: all year, same as curves shown in Figure 2. Dashed lines with markers: dry season. (a) SPURS-1. Dry season is March–August. (b) SPURS-2. Dry season is February–May. Note vertical axes are not consistent between the panels.
At the SPURS-2 site, the situation is very different. Wet season SFV is much larger than dry season. Dry season median SFV is comparable between the two regions at the largest (70–100 km) scales, but smaller in the SPURS-1 region at smaller scales.
It should be noted that the dry season and the low SFV season are not the same for the SPURS-1 region. The dry season is March–August, whereas the low SFV season is approximately January–April (Figure 1a). On the other hand, the dry season and low SFV season do mostly overlap for the SPURS-2 region. This suggests that there is seasonal variability inherent to the ocean at the SPURS-1 site that may be more important than rainfall in determining the size of SFV. A similar plot separating high SFV and low SFV seasons at the SPURS-1 site is presented in Figure 4. This may be a more logical way of separating parts of the year for SPURS-1, and shows the variation of SFV with scale, which is consistent between low SFV and high SFV seasons. Both curves level off at approximately 70 km footprint size.
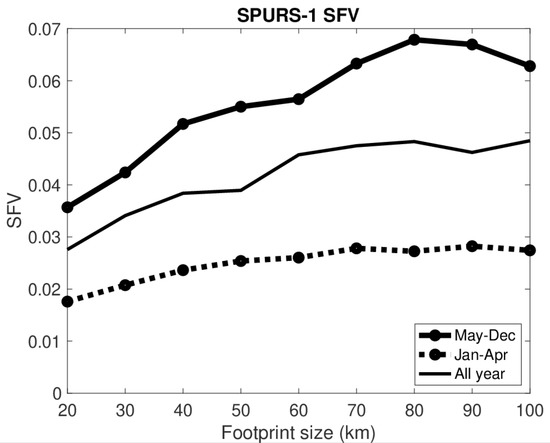
Figure 4.
As in Figure 3a. However, the dashed line is for January–April, and the solid line with symbols is for the rest of the year, May–December.
In the SPURS-2 region, the fact that the wet season SFV is so much larger than the dry season may be related to either (1) increased precipitation, and thus imprinted small scale variability, (2) the migratory presence of the NECC front during the summer and fall [23], (3) seasonally increased mesoscale variability—or (4) some combination of these. Distinguishing these factors is not easy. One clue is the fact that there is not much dependence of SFV on scale. If rainfall is ubiquitous during these months (a typical example is shown in Figure 5), and it produces small fresh patches throughout the region, and if SFV can be enhanced by even one fresh patch in a given snapshot, then that argues for the importance of rainfall in determining SFV. In other words, if the scale of rain-induced fresh patches is smaller than the 20 km we have been studying here and most SSS variance is due to these patches, then we would see less scale dependence of SFV as is the case at the SPURS-2 site. It is harder to make such an argument for the NECC front. As footprint size increases it has an increased probability of encompassing the front, and thus should have a strong dependence on scale.
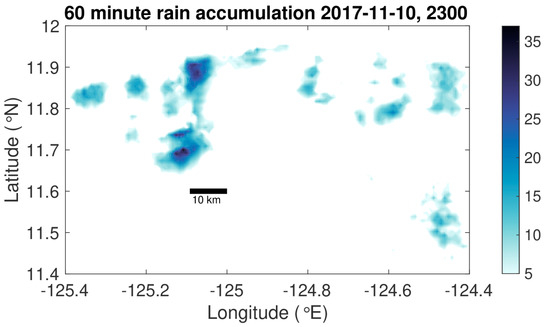
Figure 5.
The 60 min rain accumulation (mm) from the SPURS-2 cruise on 11-November-2017 at 2300Z. No color means less than 5 mm. The data are from the SEA-POL radar used during the cruise [27,28]. This is a typical configuration of rainfall in the region at this time of year. A bar showing 10 km distance is also included. The location of this area is shown in [3], Figure 3b.
We can test whether SFV depends on precipitation by plotting SFV against 7 day maximum rain rate (Figure 6). The scatter plots show a clear relationship between rain rate and SFV even though the precipitation data used to make these plots are from the SPURS central moorings, and thus may not be representative of the entire footprint. So, in both regions there is evidence that rainfall plays at least some role in generating SFV at a range of spatial scales. The larger the scale, the greater the correlation between SFV and rainfall. Interestingly, the correlations are higher for the SPURS-1 region, where rainfall is much smaller, than for the SPURS-2 region. The results of Figure 3a and Figure 6a seem contradictory at first glance, but one must remember that the points in Figure 6a only represent the wet season.
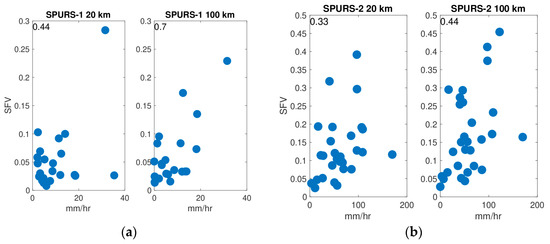
Figure 6.
SPURS SFV vs. maximum rain rate measured at the central mooring when this value exceeds 2 mm/hr. Maximum rain rate was determined over the same weekly time intervals as the SFV. Correlation values are shown at the top left of each panel. All are significant at the 95% level, except for SPURS-1 at 20 km which is significant at the 90% level. Left panels: 20 km footprint size. Right panels: 100 km footprint size. (a) SPURS-1. (b) SPURS-2. Note vertical axes are not consistent between the panels.
To understand the spatial variability better, semivariograms were plotted (Figure 7) using the in situ data from each site from the simple estimator [33]
where S(xi) is the salinity at point xi and N(ν) is the number of pairs of salinity values where the distance between them is ν.
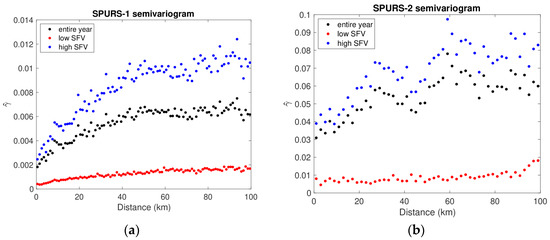
Figure 7.
Semivariograms as a function of distance computed from in situ data. (a) SPURS-1. Red symbols, January–April. Black symbols, entire year. Blue symbols, May–December. (b) SPURS-2. Red symbols, February–May. Black symbols, entire year. Blue symbols, June–January. Note vertical axes are not consistent between the panels.
The semivariogram shows the scales of variability. This function is closely related to the spatial covariance as explained by [33]. It is the mean squared difference between values as a function of spatial separation. The semivariogram value at zero separation, the “nugget” in the parlance of [33], normally describes a kind of instrumental error. In this case, as these values were computed using 7 day snapshots, the nugget is the variance over a 7 day period.
The semivariograms for SPURS-1 are much as one would expect, with small values at small separation, increasing to a plateau (the “sill”) at 50 km or so (the “range”). The semivariogram during the low SFV period is much smaller, but it contains the same dependence on separation distance.
The semivariogram at SPURS-2 is very different. It appears to increase from 0 to 20 km during the wet season, reaches a plateau, and then becomes very noisy at a distance beyond that. Thus, a rough estimate of the decorrelation scale is that 20 km. During the dry season (red symbols), though, it appears that there is almost no dependence of the semivariogram on scale, because of the way the axes are presented in Figure 7, it does actually increase. Despite this, there is no obvious sill or range during the dry season.
3.2. ROMS Results
Time series of SFV computed from the ROMS (Figure 8) contrast the two regions, and show the difference between the model and the in situ results presented in the previous section. It should be noted here that the model encompasses a somewhat different time period than the in situ data collection. For SPURS-1, the model covers January 1, 2012–December 31, 2012, whereas the field campaign lasted from September 2012 to September 2013, thus overlapping by 4 months. For SPURS-2, the model covers February 1, 2017–January 31, 2018, whereas the field campaign went from August 2016 to November 2017, giving ~9 months of overlap.
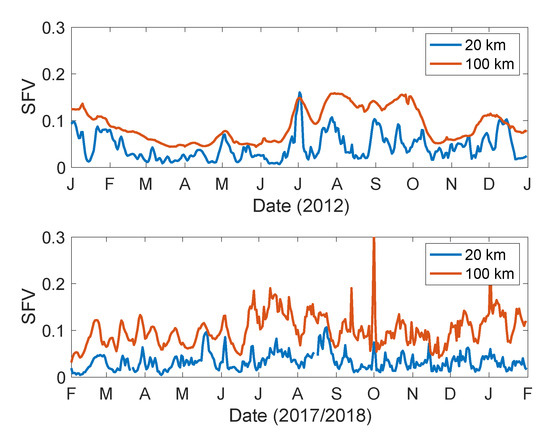
Figure 8.
ROMS-evaluated SFV for SPURS-1 (upper) and SPURS-2 (lower). Red (blue) curves are for 100 km (20 km) footprint size.
The SPURS-1 model output has similar seasonality as the in situ results (Figure 1 and Figure 4). Minimum values of SFV are in February–June. The sizes match more or less the ones presented in Figure 2 for 20 km footprint size, but the ROMS shows a larger value of SFV for 100 km footprint size than in situ, ~0.08 vs. 0.05. At almost no time does the 20 km SFV exceed the 100 km as shown in Figure 1a. The 100 km time series is smoother than the 20 km one. Thus, the separation of SFV by scale seen in the in situ data (Figure 4) is also evident in the ROMS results, but to a greater degree.
For SPURS-2, the results are different. Values of SFV at 20 km fluctuate, but on short time scales and little seasonality is evident. The 20 km SFV is much smaller (~0.03) than the median in situ value of Figure 2 (~0.12). At 100 km, the SFV from the ROMS (~0.1) is still smaller than the in situ value (~0.13), but not by as much. Not much seasonality is evident at 100 km either, though SFV is slightly elevated in July–September. There is some change in the time scales of variability of SFV. The time series of 100 km SFV fluctuates much more rapidly after the beginning of July than before. There is a clear separation of scale for the SPURS-2 region as there was for SPURS-1.
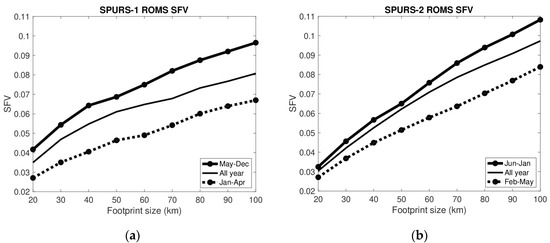
These results are summarized in Figure 9. Strikingly, the two curves of Figure 9 from the different SPURS regions are very similar in contrast to Figure 2. Both show a stronger increase in SFV as a function of spatial scale than is seen in Figure 2. SFV at 100 km is somewhat less for SPURS-1 than SPURS-2, but they are nearly the same at smaller scales. The SPURS-2 region has a smaller separation as a function of season than SPURS-1 (Figure 9).
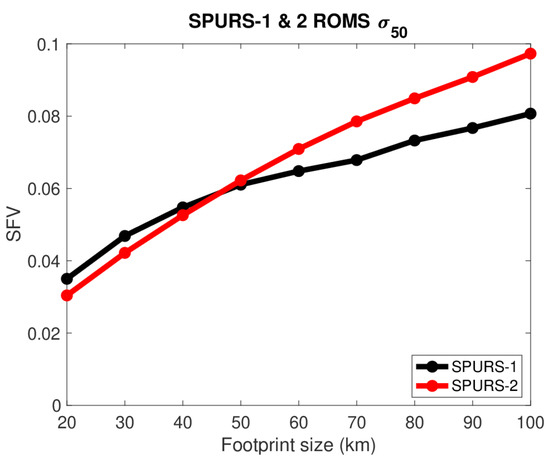
Figure 9.
As in Figure 2, but for ROMS output.
One of the main differences between the model and the real ocean is the forcing. The ocean is forced with rainfall that occurs in small, patchy bursts, especially in the SPURS-2 region (Figure 5; [27,28,34,35]). These bursts create rain puddles on kilometer scales [20]. The ROMS is forced with 18 km NCEP (National Centers for Environmental Prediction) GFS (Global Forecast System) winds and precipitation [26], and thus lacks the small-scale variability in freshwater forcing which could lead to large values of SFV. Perhaps this is what causes the relatively small SFV and lack of seasonality in the SPURS-2 results especially at short spatial scales. SFV in the ROMS may be mainly a measure of ocean variability, not variability imposed externally by patchy rainfall. Thus, the black curve in Figure 8 for SPURS-1 is similar to the (dashed) one for the dry season in Figure 3a. There is no such similarity for SPURS-2. The relatively smaller amount of seasonality in the ROMS than in the in situ data supports the role of small rain patches in generating SFV.
4. Discussion
We have explored SFV in two different regions and found that it varies by scale differently in each place. We have used two tools to make these conclusions. The first is an in situ dataset of drifters, shipboard measurements and wavegliders for SPURS-1 and wavegliders only for SPURS-2 [3]. The second is high-resolution regional simulations. Neither of these tools is perfect. The in situ data are not comprehensive in areal and temporal coverage and contain a mixture of skin surface and bulk mixed layer observations. This may be a bigger issue in the SPURS-2 region because rain events produce thin low salinity layers there [20,36,37]. The model lacks completely realistic forcing. It may be missing mixed-layer dynamics that are important in determining or hindering the ability of fresh patches to be incorporated into the bulk mixed layer and in turn affect the statistics of horizontal variability, again especially in the SPURS-2 region [38].
Comparison of the two regions is illuminating though. In general, the SPURS-2 region has much higher SFV than SPURS-1 (Figure 2), as determined from in situ data. (Model results are different—Figure 9 and Figure 10.) Another result is that SFV in the SPURS-1 region has a stronger scale dependence than that of SPURS-2, especially in the high SFV season (compare top curves in Figure 3b and Figure 4). The SPURS-1 SFV has clear plateaus at 60+ km in all seasons (Figure 4 and Figure 7), whereas the scale dependence in SPURS-2 increases continuously as a function of footprint size (Figure 3b and Figure 7).
The scales of variability are straightforward to compute and interpret for SPURS-1. For SPURS-2, doing this requires a more detailed analysis than has been attempted here. Possibly, SSS variability is not isotropic in low latitudes and has different scales in the zonal and meridional directions, though this is not the conclusion of [39]. Research is ongoing into this.
In terms of design of future satellite missions, one can use Figure 2, Figure 3b and Figure 4 to get an idea of how much SFV to expect for a given footprint. The size of a footprint is determined by the frequency of radiation being measured, the diameter of the antenna, the height of the satellite above the Earth, etc., parameters which can be determined in the design phase of a satellite. The numbers displayed in Figure 2, Figure 3b and Figure 4 can be factored into error budgets for future missions, remembering that error associated with SFV is just a mismatch of scales between in situ validation measurements and footprint average values [3]. More importantly, the results presented here give a sense of how much variability is being captured by a given footprint. If one wanted to capture scales of variability smaller than the mesoscale, that would mean a smaller than ~50–100 km footprint in mid-latitude and larger in the tropics [13]. Microwave SSS sensors are more sensitive in the tropics because of the warmer temperatures [6]. If the large SFV of 0.12–0.16 in the wet season is factored in, the accuracy of the retrievals may be better than previously thought there.
This study highlights the complexity of SFV, with its spatial and temporal dependence. No area of the ocean is the same. The two regions we have studied may be thought of as open ocean extremes. The SPURS-1 region is extreme for high evaporation, high SSS and low precipitation. The SPURS-2 region has heavy and patchy rainfall (Figure 5), strong and seasonally-varying currents and associated frontal features [22,23]. Ideally, one would wish to quantify SFV over the entire and less extreme open ocean in order to better characterize the error structure of satellite-derived SSS. This would involve many more SPURS-like experiments. Unfortunately, this is not practically possible and so we are left with guessing at its magnitude. Another possibility would be to use high-resolution models to make estimates of SFV over the ocean. One of the main purposes of the present work is to examine the potential for this. Research is ongoing [17], but the results of this present study suggest caution. The model used here, though it is state of the art, does not appear to get the distinction between the regions correct—compare Figure 2 and Figure 9. It also does not present the same level of seasonality in SFV as we see in the in situ data—compare Figure 3b, Figure 4 and Figure 10.
5. Conclusions
From in situ data, it appears that at the SPURS-1 site, SFV is mainly generated by internal ocean variability since its seasonality is unrelated to that of precipitation in the region. SFV at SPURS-1 is highly seasonal, being largest in May–December and may be related to seasonality of the energy of the mesoscale eddy field. Assuming SFV is produced by the eddy field, it is scaled to the typical size of mesoscale variations, approximately 50–70 km.
At the SPURS-2 site, SFV is likely mostly produced by rainfall, whose scales are less than 20 km (Figure 5). It is also highly seasonal, with maximum values during the rainy (wet) season, June–January. At the scales examined, SFV showed little dependence on scale. The semivariograms examined in Figure 6 suggest that much of that dependence is contained within the shortest (<20 km) scales.
SFV is many times larger at the SPURS-2 site than at SPURS-1 (Figure 2, Figure 3b and Figure 4) at all footprint sizes. This highlights the fact that SFV is highly spatially dependent, and any study of the error associated with SFV needs to take that into account. There are very few areas in the open ocean that have been sampled as intensively for SSS as the SPURS regions. In order to achieve a full understanding of SFV error, we must develop proxies which can stand in for the heavy sampling of the SPURS regions. We have attempted to do that here by examining two ROMS simulations. The one in the SPURS-1 region does a reasonable job of depicting the size and spatial dependence of SFV. In the SPURS-2 region, the simulation is less realistic, likely due to the lack of small-scale rainfall.
Author Contributions
Conceptualization: F.M.B.; methodology, F.M.B. and Z.L.; validation, F.M.B.; formal analysis, F.M.B.; resources, F.M.B.; data curation, F.M.B. and Z.L.; writing—original draft preparation, F.M.B.; writing—review and editing, F.M.B. and Z.L.; visualization, F.M.B.; project administration, F.M.B.; funding acquisition, F.M.B. and Z.L. All authors have read and agreed to the published version of the manuscript.
Funding
This research was funded by NASA under grants 80NSSC18K1322 and NNX15AF72G.
Acknowledgments
Two anonymous reviewers read the manuscript carefully, and their input is greatly appreciated. The authors thank the SPURS-1 and SPURS-2 investigators for the use of their data. Color scale in Figure 6 is from the “cmocean” package [40].
Conflicts of Interest
The authors declare no conflict of interest. The funders had no role in the design of the study; in the collection, analysis, or interpretation of data; in the writing of the manuscript, or in the decision to publish the results.
References
- Reul, N.; Grodsky, S.A.; Arias, M.; Boutin, J.; Catany, R.; Chapron, B.; D’Amico, F.; Dinnat, E.; Donlon, C.; Fore, A.; et al. Sea surface salinity estimates from spaceborne L-band radiometers: An overview of the first decade of observation (2010–2019). Remote Sens. Environ. 2020, 242, 111769. [Google Scholar] [CrossRef]
- Medina-Lopez, E.; Ureña-Fuentes, L. High-Resolution Sea Surface Temperature and Salinity in Coastal Areas Worldwide from Raw Satellite Data. Remote Sens. 2019, 11, 2191. [Google Scholar] [CrossRef]
- Bingham, F.M. Subfootprint Variability of Sea Surface Salinity Observed during the SPURS-1 and SPURS-2 Field Campaigns. Remote Sens. 2019, 11, 2689. [Google Scholar] [CrossRef]
- Boutin, J.; Chao, Y.; Asher, W.E.; Delcroix, T.; Drucker, R.; Drushka, K.; Kolodziejczyk, N.; Lee, T.; Reul, N.; Reverdin, G. Satellite and in situ salinity: Understanding near-surface stratification and subfootprint variability. Bull. Am. Meteorol. Soc. 2016, 97, 1391–1407. [Google Scholar] [CrossRef]
- Drushka, K.; Asher, W.E.; Sprintall, J.; Gille, S.T.; Hoang, C. Global patterns of submesoscale surface salinity variability. J. Phys. Oceanogr. 2019, 49, 1669–1685. [Google Scholar] [CrossRef]
- Lagerloef, G.S.; Colomb, F.R.; Le Vine, D.M.; Wentz, F.; Yueh, S.; Ruf, C.; Lilly, J.; Gunn, J.; Chao, Y.; deCharon, A.; et al. The Aquarius/SAC-D Mission: Designed to Meet the Salinity Remote-sensing Challenge. Oceanography 2008, 20, 68–81. [Google Scholar] [CrossRef]
- Abe, H.; Ebuchi, N. Evaluation of sea-surface salinity observed by Aquarius. J. Geophys. Res. Ocean. 2014, 119, 8109–8121. [Google Scholar] [CrossRef]
- Kao, H.-Y.; Lagerloef, G.S.; Lee, T.; Melnichenko, O.; Meissner, T.; Hacker, P. Assessment of Aquarius Sea Surface Salinity. Remote Sens. 2018, 10, 1341. [Google Scholar] [CrossRef]
- Bao, S.; Wang, H.; Zhang, R.; Yan, H.; Chen, J. Comparison of Satellite-Derived Sea Surface Salinity Products from SMOS, Aquarius, and SMAP. J. Geophys. Res. Ocean. 2019, 124, 1932–1944. [Google Scholar] [CrossRef]
- Fore, A.; Yueh, S.; Tang, W.; Hayashi, A. SMAP Salinity and Wind Speed Users Guide, Version 4.3; California Institute of Technology: Pasadena, CA, USA, 2020; p. 259. [Google Scholar]
- Qin, S.; Wang, H.; Zhu, J.; Wan, L.; Zhang, Y.; Wang, H. Validation and correction of sea surface salinity retrieval from SMAP. Acta Oceanol. Sin. 2020, 39, 148–158. [Google Scholar] [CrossRef]
- Vinogradova, N.T.; Ponte, R.M. Small-scale variability in sea surface salinity and implications for satellite-derived measurements. J. Atmos. Ocean. Technol. 2013, 30, 2689–2694. [Google Scholar] [CrossRef]
- Jacobs, G.A.; Barron, C.N.; Rhodes, R.C. Mesoscale characteristics. J. Geophys. Res. 2001, 106, 19581–19595. [Google Scholar] [CrossRef]
- Kuragano, T.; Kamachi, M. Global statistical space-time scales of oceanic variability estimated from the TOPEX/POSEIDON altimeter data. J. Geophys. Res. 2000, 105, 955–974. [Google Scholar] [CrossRef]
- Meyers, G.; Phillips, H.; Smith, N.; Sprintall, J. Space and time scales for optimal interpolation of temperature—Tropical Pacific Ocean. Prog. Oceanogr. 1991, 28, 189–218. [Google Scholar] [CrossRef]
- Bingham, F.M.; Lee, T. Space and time scales of sea surface salinity and freshwater forcing variability in the global ocean (60°S–60°N). J. Geophys. Res. Ocean. 2017, 122, 2909–2922. [Google Scholar] [CrossRef]
- D’Addezio, J.M.; Bingham, F.M.; Jacobs, G.A. Sea surface salinity subfootprint variability estimates from regional high-resolution model simulations. Remote Sens. Environ. 2019, 233, 111365. [Google Scholar] [CrossRef]
- Lindstrom, E.; Bryan, F.; Schmitt, R. SPURS: Salinity Processes in the Upper-ocean Regional Study. Oceanography 2015, 28, 14. [Google Scholar] [CrossRef]
- Lindstrom, E.J.; Edson, J.B.; Schanze, J.J.; Shcherbina, A.Y. SPURS-2: Salinity Processes in the Upper-Ocean Regional Study 2—The Eastern Equatorial Pacific Experiment. Oceanography 2019, 32. [Google Scholar] [CrossRef]
- Drushka, K.; Asher, W.E.; Jessup, A.T.; Thompson, E.J.; Iyer, S.; Clark, D. Capturing Fresh Layers with the Surface Salinity Profiler. Oceanography 2019, 32. [Google Scholar] [CrossRef]
- Hasson, A.; Farrar, J.T.; Boutin, J.; Bingham, F.; Lee, T. Intraseasonal variability of surface salinity in the eastern tropical Pacific associated with mesoscale eddies. J. Geophys. Res. Ocean. 2019, 124, 2861–2875. [Google Scholar] [CrossRef]
- Yu, L. Sea-surface salinity fronts and associated salinity-minimum zones in the tropical ocean. J. Geophys. Res. Ocean. 2015, 120, 4205–4225. [Google Scholar] [CrossRef]
- Melnichenko, O.; Hacker, P.; Bingham, F.M.; Lee, T. Patterns of SSS Variability in the Eastern Tropical Pacific: Intraseasonal to Interannual Timescales from Seven Years of NASA Satellite Data. Oceanography 2019, 32. [Google Scholar] [CrossRef]
- Bingham, F.M.; Li, P.; Li, Z.; Vu, Q.; Chao, Y. Data management support for the SPURS Atlantic field campaign. Oceanography 2015, 28, 46–55. [Google Scholar] [CrossRef]
- Bingham, F.M.; Tsontos, V.; deCharon, A.; Lauter, C.J.; Taylor, L. The SPURS-2 Eastern Tropical Pacific Field Campaign Data Collection. Oceanography 2019, 32, 142–149. [Google Scholar] [CrossRef]
- Li, Z.; Bingham, F.M.; Li, P.P. Multiscale Simulation, Data Assimilation, and Forecasting in Support of the SPURS-2 Field Campaign. Oceanography 2019, 32. [Google Scholar] [CrossRef]
- Rutledge, S.A.; Chandrasekar, V.; Fuchs, B.; George, J.; Junyent, F.; Dolan, B.; Kennedy, P.C.; Drushka, K. SEA-POL Goes to Sea. Bull. Am. Meteorol. Soc. 2019, 100, 2285–2301. [Google Scholar] [CrossRef]
- Rutledge, S.A.; Chandrasekar, V.; Fuchs, B.; George, J.; Junyent, F.; Kennedy, P.; Dolan, B. Deployment of the SEA-POL C-band Polarimetric Radar to SPURS-2. Oceanography 2019, 32. [Google Scholar] [CrossRef]
- Farrar, J.T.; Rainville, L.; Plueddemann, A.J.; Kessler, W.S.; Lee, C.; Hodges, B.A.; Schmitt, R.W.; Edson, J.B.; Riser, S.C.; Eriksen, C.C.; et al. Salinity and temperature balances at the SPURS central mooring during fall and winter. Oceanography 2015, 28, 56–65. [Google Scholar] [CrossRef]
- Farrar, J.T.; Plueddemann, A.J. On the Factors Driving Upper-Ocean Salinity Variability at the Western Edge of the Eastern Pacific Fresh Pool. Oceanography 2019, 32. [Google Scholar] [CrossRef]
- Yu, L. On sea surface salinity skin effect induced by evaporation and implications for remote sensing of ocean salinity. J. Phys. Oceanogr. 2010, 40, 85–102. [Google Scholar] [CrossRef]
- Centurioni, L.R.; Hormann, V.; Chao, Y.; Reverdin, G.; Font, J.; Lee, D.K. Sea Surface Salinity Observations with Lagrangian Drifters in the Tropical North Atlantic During SPURS: Circulation, Fluxes, and Comparisons with Remotely Sensed Salinity from Aquarius. Oceanography 2015, 28. [Google Scholar] [CrossRef]
- Doney, S.C.; Glover, D.M.; McCue, S.J.; Fuentes, M. Mesoscale Variability of Sea-Viewing Wide Field-of-view Sensor (SeaWiFS) Satellite Ocean Color: Global Patterns and Spatial Scales. J. Geophys. Res. 2003, 108, 3024. [Google Scholar] [CrossRef]
- Clayson, C.A.; Edson, J.B.; Paget, A.; Graham, R.; Greenwood, B. Effects of Rainfall on the Atmosphere and the Ocean During SPURS-2. Oceanography 2019, 32. [Google Scholar] [CrossRef]
- Thompson, E.J.; Asher, W.E.; Jessup, A.T.; Drushka, K. High-Resolution Rain Maps from an X-band Marine Radar and Their Use in Understanding Ocean Freshening. Oceanography 2019, 32. [Google Scholar] [CrossRef]
- Rainville, L.; Centurioni, L.R.; Asher, W.E.; Clayson, C.A.; Drushka, K.; Edson, J.B.; Hodges, B.A.; Hormann, V.; Farrar, J.T.; Schanze, J.J.; et al. Novel and Flexible Approach to Access the Open Ocean: Uses of Sailing Research Vessel Lady Amber During SPURS-2. Oceanography 2019, 32. [Google Scholar] [CrossRef]
- Volkov, D.L.; Dong, S.; Foltz, G.R.; Goni, G.; Lumpkin, R. Observations of Near-Surface Salinity and Temperature Structure with Dual-Sensor Lagrangian Drifters During SPURS-2. Oceanography 2019, 32. [Google Scholar] [CrossRef]
- Asher, W.E.; Drushka, K.; Jessup, A.T.; Thompson, E.J.; Clark, D. Estimating Rain-Generated Turbulence at the Ocean Surface Using the Active Controlled Flux Technique. Oceanography 2019, 32. [Google Scholar] [CrossRef]
- Delcroix, T.; Chaigneau, A.; Soviadan, D.; Boutin, J.; Pegliasco, C. Eddy-Induced Salinity Changes in the Tropical Pacific. J. Geophys. Res. Ocean. 2019, 124, 374–389. [Google Scholar] [CrossRef]
- Thyng, K.M.; Greene, C.A.; Hetland, R.D.; Zimmerle, H.M.; DiMarco, S.F. True Colors of Oceanography: Guidelines for Effective and Accurate Colormap Selection. Oceanography 2016, 29, 9–13. [Google Scholar] [CrossRef]
Publisher’s Note: MDPI stays neutral with regard to jurisdictional claims in published maps and institutional affiliations. |
© 2020 by the authors. Licensee MDPI, Basel, Switzerland. This article is an open access article distributed under the terms and conditions of the Creative Commons Attribution (CC BY) license (http://creativecommons.org/licenses/by/4.0/).