Abstract
Timely mapping, measuring and impact assessment of flood events are crucial for the coordination of flood relief efforts and the elaboration of flood management and risk mitigation plans. However, this task is often challenging and time consuming with traditional land-based techniques. In this study, Sentinel-1 radar and Landsat images were utilized in collaboration with hydraulic modelling to obtain flood characteristics and land use/cover (LULC), and to assess flood impact in agricultural areas. Furthermore, indirect estimation of the recurrence interval of a flood event in a poorly gauged catchment was attempted by combining remote sensing (RS) and hydraulic modelling. To this end, a major flood event that occurred in Sperchios river catchment, in Central Greece, which is characterized by extensive farming activity was used as a case study. The synergistic usage of multitemporal RS products and hydraulic modelling has allowed the estimation of flood characteristics, such as extent, inundation depth, peak discharge, recurrence interval and inundation duration, providing valuable information for flood impact estimation and the future examination of flood hazard in poorly gauged basins. The capabilities of the ESA Sentinel-1 mission, which provides improved spatial and temporal analysis, allowing thus the mapping of the extent and temporal dynamics of flood events more accurately and independently from the weather conditions, were also highlighted. Both radar and optical data processing methods, i.e., thresholding, image differencing and water index calculation, provided similar and satisfactory results. Conclusively, multitemporal RS data and hydraulic modelling, with the selected techniques, can provide timely and useful flood observations during and right after flood disasters, applicable in a large part of the world where instrumental hydrological data are scarce and when an apace survey of the condition and information about temporal dynamics in the influenced region is crucial. However, future missions that will reduce further revisiting times will be valuable in this endeavor.
1. Introduction
Floods are considered to be one of the most common, recurring and catastrophic types of natural hazard [1,2]. Over the last few decades, they have been documented as a significant threat to human life, including a noteworthy number of fatalities as well as extended economic damages [3,4,5,6,7,8,9]. Across the Mediterranean region, most commonly, flooding results from intense rainfall within a short duration of time, constituting a serious risk for human life, infrastructures and agricultural land. Small- to medium-sized catchments are most frequently prone to flooding, often intensified by their intrinsic features, such as geological and geomorphological characteristics (low permeability and steep slopes), drainage network features, watershed texture and geometry, land use/cover, along with extreme meteorological forcing [10,11,12].
Timely mapping, monitoring and impact assessment of flood events are vital for the coordination of flood relief efforts and the elaboration of flood management, risk mitigation plans and many prevention initiatives. This knowledge is usually hard to obtain based on conventional approaches due to flood temporal and spatial characteristics [13].
Conventional observational networks often face difficulties in flood monitoring due to the temporal and spatial scales of flood occurrence in the region [14,15]. Traditional approaches to flood delineation are mostly based on field inspections and ground observations as well as airborne surveillance. However, in incidents that extend over a large area, such methods can be impractical, time-consuming, expensive and sometimes dangerous for the personnel and the equipment involved. Moreover, timely remote sensing (RS) monitoring of flood events can be problematic due to the usual inhibitive cloud cover (cc) [16]. During the last few decades, Earth Observation (EO) passive and active multitemporal satellite systems and RS practices offer timely and efficient tools for examining and delineating flooding over large areas. Their continuous measurements offer valuable information on inundated areas, which is useful for the effective response contributing likewise to damage assessment and hazard management [16,17].
Active microwave radar systems can be useful for such purposes since they can provide high-resolution and frequent day and night observations of the Earth’s surface under practically any weather conditions since they can penetrate clouds and heavy rainfall [18,19].
In the framework of the Copernicus Earth Observation (EO) program, the European Space Agency (ESA) carried out an innovative satellite program named Copernicus, which comprises the constellation of the Sentinel satellites. Each mission of Sentinels aims towards a distinct sector of Earth observation (land, ocean and atmosphere), and its products are utilized in numerous applications. Sentinel-1 (S1) is a Synthetic Aperture Radar (SAR) operation system, that provides a continuous dataset of radar images, independent of the time of day and the weather conditions, enabling flood events monitoring and mapping [20]. The contribution of SAR sensors, having a C band sensor (wavelength ≈ 5.6 cm), rises from the sensibility of the backscatter signal to calm water surfaces, that typically employs the distinct properties of water in the microwave spectrum. Specifically, calm flood water surfaces work as mirrors and reflect incoming radiation away from the sensor, which normally results in low backscatter measurements [21]. Additionally, the S1 SAR mission incorporates improved spatial resolution (10 m), a 12-day repeat cycle using two identical satellites (S1A and S1B) with a 180° orbital phasing difference enhancing repeat cycle to 6-days, and various polarization modes that have enhanced the observing potential, making it ideal for flood monitoring [22,23]. Polarization is a key component in flood detection, as has been shown in numerous former surveys [24]. The suitable selection of horizontal (H) or vertical (V), single (VV or HH) or dual (HH + HV or VH + VV) polarity plays a decisive role in the enhanced distinction of backscatter values between dry and wet areas [24]. VV polarized products are greatly affected by surface roughness conditions, but in many cases, they still deliver adequate results for the mapping of the flooded area, because this specific polarization identifies clearly the partially submerged features, which can be valuable in flood damage estimation [23,25]. The major drawbacks of SAR data are related to a complicated mixture of several surface characteristics, which act negatively on the flood detection, such as the incidence angle, relative water height, vegetation type, density and orientation, and wind consequences, which can cause opposite backscatter responses for similar situations [13].
Passive multispectral instruments record the earth’s surface reflected or emitted energy in the visible and infrared part of the electromagnetic spectrum. The high-resolution sensors can offer good detection of the flooded areas in cases that clouds, floating vegetation and trees do not conceal the water surface [13,18,26]. Satellite datasets recorded by the passive sensors, such as those onboard the Landsat-7 (L7) and Landsat -8 (L8), provide unique data of the land surface, appropriate for land use/cover (LULC) classification and delineation of floods, due to their exceptional spatial, spectral and temporal resolution [27,28]. Numerous studies utilizing EO information with different techniques have been conducted worldwide for the detailed classification of LULC [29,30,31,32] and the mapping of inundated areas [13,17,33,34] along with their impact on agricultural land [20,35,36]. Moreover, utilizing multispectral optical data, several different remotely sensed water indices have been developed for the detection of open surface water [37,38,39]. The modified Normalized Difference Water Index (MNDWI) provided by Xu [37], is an improved form of the simple Normalized Difference Water Index (NDWI) provided by McFeeters [39] and is capable of delineating water surfaces using green and near-infrared (NIR) spectral bands of Landsat [37,40], while at the same time effectively removing the land noise from built-up, vegetation and soil cover [37,38].
Apart from the valuable information on the flood extent, flood depth, discharge and inundation duration are among the most critical issues in flood impact assessment and deliver crucial inputs for land use planning, insurance claims management and a better knowledge of basin hydrological conditions [41]. In contrast to the far-reaching amount of literature regarding the flood extent mapping, only a few surveys emphasize the assessment of flood duration, such as those of O’Hara et al. [20], Bhatt et al. [42], Rahman et al. [43] and Rättich et al. [41]. Nowadays, the availability of a great number of multitemporal satellite data and the very high temporal revisit period ensures the appropriate monitoring and analysis of an affected area [16,41,44]. Moreover, water depth is considered essential for flood impact monitoring and an accurate digital elevation model (DEM) is the most efficient tool for a better assessment of these impacts. Especially, in a flat plain area, the precision of flood assessment directly depends on the analysis of the DEM [13,45]. A high-resolution DEM is crucial to extract the details of the topography, acquire the water surface elevations, and simulate flood inundation and depth [13,46,47].
RS-derived geospatial products, such as Digital Elevation Models (DEM) and Geographical Information System (GIS) analysis, can also deliver valuable input for hydraulic modelling, with high accuracy spatial data of elevation. Numerical hydrodynamic models are an important tool that capitalizes these produces for understanding flood flows and planning flood risk management. Hydrologic Engineering Center’s River Analysis System (HEC-RAS) is considered to be one of the most suitable packages for creating and evaluating flood simulations, due to its improved capability to model natural rivers and canals [48,49,50]. HEC-RAS has the capability of one- and two-dimensional simulations and is used to simulate the floodplain area [48,51]. Especially in the case of 1-D modelling, there are widespread applications that have demonstrated its capability in simulating water flow. In the field of floods, while RS applications are most active in the post-flood period (e.g., flood mapping), and hydraulic modelling is more useful in pre-flood hazard assessment (e.g., simulating flood flows), there has been literature that couples both approaches in certain applications.
In data-poor regions and given the difficulty of instrumental observations in flash flood-prone basins, there is a need to exploit emerging remote sensing technologies to enrich instrumental data and improve the understanding of critical flood metrics (i.e., peak discharge, flood extent and depth, return period) in the course of post-flood investigations.
In this context, the principal objectives of this study are: (a) Examine whether the coupling of RS data (using different methods) and hydraulic modelling (using different flow scenarios) has the potential to delineate inundated areas and contribute to estimating key flood metrics in poorly gauged basins, such as peak discharge and recurrence intervals of the obtained flood extent and depth; (b) Explore the potential to assess the impact on the crops of the affected area through the estimation of the inundation duration of the flood event using multitemporal RS data. This analysis exploited a flood event that took place from 31 January to 1 February 2015, following intense and heavy rainfall that occurred in the Sperchios river basin, in Central Greece.
2. Study Area—Background
The Sperchios River basin lies between 38°44′ and 39°05′N, and 21°50′ and 22°45′E, covering an area of approximately 1823 km2, originating from Mount Timfristos (2327 m) in the Fthiotida Prefecture in central Greece. Having a west to east direction, the river traverses the Sperchios Valley, between Mount Oiti and the western part of Mount Othrys and then outflows into the sea at the Maliakos Gulf [52,53]. The Sperchios river develops a complex meander track about 30 km long, at the coastal part of its floodplain. (Figure 1a).
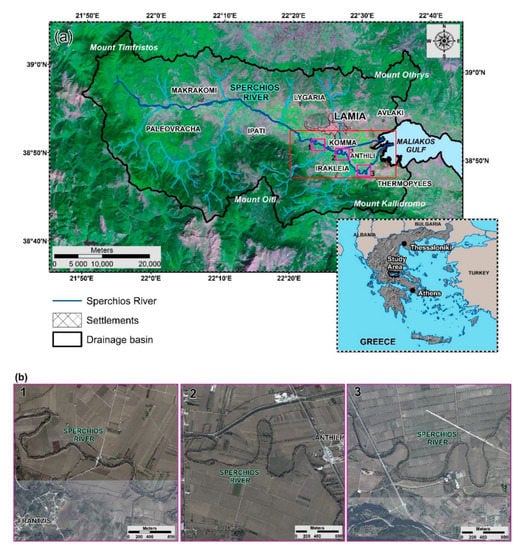
Figure 1.
(a) The location of the Sperchios river catchment in Central Greece (background image: Landsat 8, 457 as RGB), the red rectangular line displays the river’s intense meandering area, (b) Very high resolution frames at the meandering area using orthophoto images (the frames correspond to the pink squares with the same numbers, scale 1:10,000).
The Sperchios floodplain is an area dominated both in terms of land use and local economy by agricultural activities. According to the Hellenic Statistical Authority (ELSTAT 2011), the Prefecture of Fthiotida has a total of 169,542 residents with a large percentage of them lying at the eastern coastal part of the catchment, at the city of Lamia and several other smaller villages. Moreover, the main road and railway network, as well as critical facilities and industrial units, lie in the area (Figure 1b).
The Sperchios river catchment is a graben, controlled by major NW-SE and E-W trending faults [54]. The main lithological formations include flysch (south-southwest and northwest part), dolomites and limestones (south and southeast part), an ophiolitic complex in a shale-chert formation (north and north-eastern part) and Neogene and Quaternary unconsolidated deposits (central plain area) (Figure 2) [52,53,55].
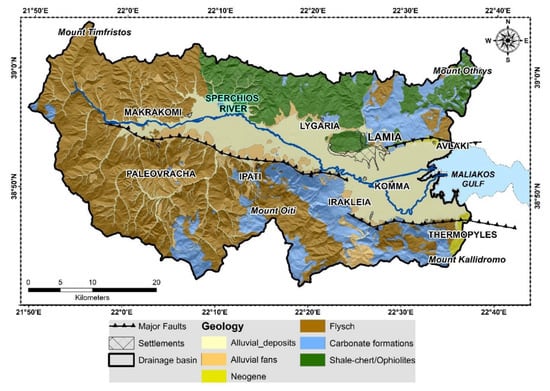
Figure 2.
The simplified geological status of the area, including faults and fracture systems (using as a background the hillshade relief of the basin).
Catchment Characteristics and Flood Susceptibility
Flooding vulnerability in the basin is intensified by its topography, geological background and drainage network characteristics.
The steep slopes, especially in the southern area, where at a relatively small distance, an altitude difference of 300 m can be observed, and the dense drainage network contributes to a very fast hydrological response and short concentration times. Furthermore, the western and southwestern part of the Sperchios catchment is dominated by impermeable rocks (flysch), leading to a dense drainage network and increased runoff volumes.
As is reported in more detail by Psomiadis et al. [54], who presented a comprehensive analysis of the morphometric characteristics of the main sub-catchments of Sperchios watershed and their effect on flow routing, the drainage network follows the tectonic movements, the geology, and the morphometry, and consequently, the stream branches in the south are shorter and denser, while in the north they are longer and sparser. These morphometric characteristics result in very high flow velocities, especially at the southern part of the Sperchios river watershed. The torrential hydrological conditions (rapid flow and high runoff volumes over a short period) during storm events combined with the strong meandering formations of the eastern plain part of the Sperchios riverbed, which significantly slow down water flow results in the inability of the river to effectively drain these vast amounts of water towards its outlet at the Maliakos Gulf, provoking an increase in water level and, ultimately, overtopping, and, by extension, frequent flash-flood events.
Additionally, the intense agricultural activity, the high population concentration, and the huge infrastructure projects, including the main road (National Highway and E65) and railway network constructions that cluster at the eastern coastal area make this area quite vulnerable to flood hazards [11,53,54].
The Sperchios river basin has suffered in the past many intense and catastrophic floods. Based on historical records and the literature, many noteworthy events can be identified, with the most significant being those of 1889, 1939, 1954, 1984, 1987, 1994, 1997, 2001, 2003 and 2012 [10,11,53,56]. The areas frequently flooded are roughly 20,000 to 100,000 ha including mostly cropland and villages located near the Sperchios riverbed. Typically, these areas are covered with water for around four to five days excluding some areas with locally lower altitudes, which can be inundated for eight to ten days.
The studied flood event occurred from January 31 to February 1 of 2015, following high amounts of rainfall, which led to rapid flow (because of the abovementioned morphological and geological characteristics) of large water quantities at a short time into the river, flooding a large area near its outlet.
3. Materials and Methods
3.1. Datasets
The dataset utilized in the present research contains satellite-born images, topographical data, and statistical archives. For the multi-temporal monitoring of the flood event, all the available optical and SAR images of Sentinel-1, Landsat 7 and Landsat 8 were acquired. Unfortunately, Sentinel-2A has been set in orbit since 23 June 2015, four months after the flood occurrence.
Five Sentinel-1 Level-1 Ground Range Detected (GRD) SAR images were acquired for the flood extent and the inundation duration mapping (Table 1, Figure 3a,b). The images have been acquired through the Sentinels Open Access Hub and were processed using the Sentinel’s Application Platform (SNAP) [57], an open-source common architecture software, offered by the ESA. Each image has a coverage range of 250 km with a 10 × 10 m spatial resolution. The data were selected with the Interferometric Wide (IW) swath mode, which supports dual polarization products (VV + VH), using the Terrain Observation with Progressive Scans SAR [58].

Table 1.
The selected Sentinel-1 and Landsat-7/8 satellite datasets.
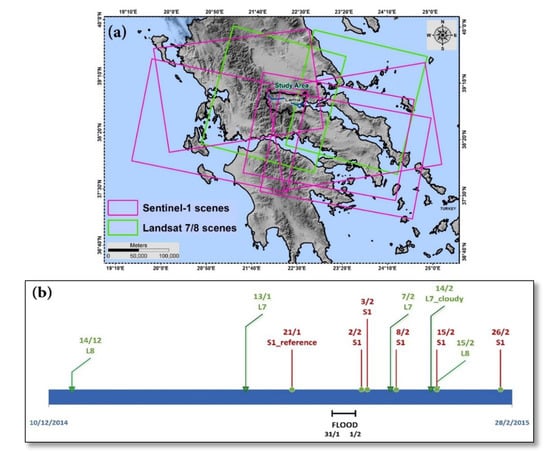
Figure 3.
(a) Spatial and (b) Temporal distribution of the Sentinel-1 (relative orbits 7, 80, 102 and 175) and Landsat 7/8 (path/row 184/033 and 183/033) datasets.
Moreover, regarding the optical data, eight images of L7/8 Level 1 geometrically corrected to the UTM 34N WGS84 ellipsoid with standard terrain correction applied were obtained free of charge (Path/Row: 184/033 and 183/033) through the United States Geological Survey portal [59] (Table 1, Figure 3). The optical data were processed only for permanent water bodies and flood duration mapping, and not for the flood monitoring, since there were no cloud-free images available during the flood event. Additionally, the multispectral images were used for the classification of LULC and the delineation of the existing crops at the winter period where the flood event occurred.
For the cross-checking of the permanent water areas (small lakes, ponds or marshes), the Global Surface Explorer database (https://globalsurface-water.appspot.com/) of the European Commission’s Joint Research Centre (ECJRC) was used. This water dataset was derived from the entire inventory of the Landsat satellites and for this case, we used the maximum water extent product, which concentrates information about the detected water surfaces throughout a period of 32 years.
The land cover classification was supplemented with the farmers’ declarations and Greek Land Parcel Identification System (LPIS) data obtained by the Integrated Administration and Control System of the Greek Payment and Control Agency for Guidance and Guarantee Community Aid (OPEKEPE) (https://www.opekepe.gr/en/).
Furthermore, geomorphological data from the Hellenic Military Geographical Service (HMGS) topographic maps were used to mine different types of info-layers such as rivers, roads, railway tracks, etc., and geological maps of the Geological and Mineral Exploration Institute for the extraction of the geological information. A very detailed DEM (5 m) derived from the stereo pairs of very high accuracy aerial images of the National Cadastre and Mapping Agency S.A., were obtained to be used as an input in the HEC-RAS processing. Finally, statistical data concerning the sub-municipalities, the areas and the kind of crops affected by the flood episode provided by the Greek Agricultural Insurance Organization (ELGA), were processed and compared with the results of this study.
The satellite image processing was accomplished utilizing ENVI (v.5.5) and SNAP (v.7.0) software (L3Harris Geospatial Solutions, Pearl East Circle Boulder Co, Boulder, CO, USA and European Space Agency, respectively), while the GIS-based analysis was made utilizing ArcGIS (version 10.7, Environmental Systems Research Institute-ESRI, Redlands, CA, USA).
3.2. Flood Event—February 2015
The meteorologically unstable period with extreme rainfalls of the studied event concerns the period from 23 January to 15 February 2015. Especially, on 31 January, the meteorological station of Makrakomi, provided the most reliable data, as it is located in the western, upstream part of the basin (Figure 1a). The main storm started at 6:00 a.m. on the 31st of January and finished twenty-two hours later, on February 1st. In this length of time, the total height of rainfall was 59 mm when the average height of rain output for January in the area is about 110 mm. In total, for the entire period under study, the meteorological stations of Makrakomi and Lamia (at the city of Lamia) recorded 101.6 mm and 45.2 mm, respectively [60]. According to the meteorological data analysis of the National Observatory of Athens (NOA), the main rainfall peak took place on 31 January, with a maximum recording of 7.0 mm during 9:00–12:00 a.m. at the meteorological station of Makrakomi (3 h recording, cumulative) and 5.4 mm during 6:00–9:00 a.m. at the station of Lamia (http://www.iersd.noa.gr/GR/services1_gr.html#weather4).
Evaluating the analyzed data and considering the hydrometeorological features of the basin [61], the event is characterized as a storm rain episode with a return period of only 2–5 years, which is in contrast with the observed flood. Nevertheless, it must be noted that there is a considerable level of uncertainty regarding the spatial variability of rainfall due to the lack of meteorological stations at the higher parts of the watershed. For this reason, in this study, indirect estimation of the recurrence interval of the obtained flood extent and depth was attempted by comparing it with different flood flow scenarios simulated through hydraulic modelling.
3.3. Methodology
The basic steps of the methodology applied are presented in the flowchart of Figure 4, and comprehensively analyzed in the following sections.
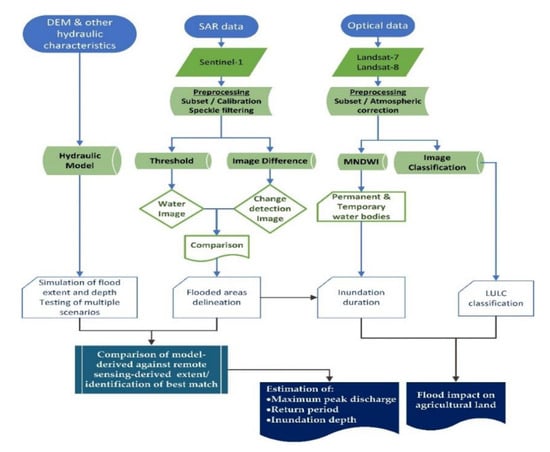
Figure 4.
Methodology flowchart.
3.3.1. Optical Data Processing
Optical data acquired by Landsat satellites (7 and 8) have related sensor observation characteristics, due to their similar technical and orbital characteristics. Nevertheless, some basic pre-processing steps are always necessary for each image to enhance the quality and accuracy of the finally used products. For instance, the interfering atmosphere among the satellite and the Earth’s surface can reduce the quality of the acquired data [13]. As atmospheric conditions can differ both spatially and temporally, standardized atmospheric models—such as that provided by the Quick Atmospheric Model (QUAC) of ENVI—are essential for the atmospheric correction of the images [62]. The final preprocessing phase of the L7 ETM+ image includes the gap-filling that derives from the scan line corrector (SLC) failure. Therefore, the Landsat gap-fill plugin of ENVI was applied to recover the data loss.
3.3.2. LULC Classification
Land cover classification based on Landsat images has been applied for the recognition of different LULC categories using a variety of classification methods applied on EO data [63]. Landsat 8 OLI data, that are primarily characterized by enhanced spectral, spatial, and radiometric resolution, were utilized for LULC mapping [64,65,66,67]. Four cloud-free, geometrically corrected images, of a one-year growing period (2014–2015, one image for every season), were obtained, to distinguish the different crop types of the area. The images were acquired via the United States Geological Survey portal (https://earthexplorer.usgs.gov/) [13,68,69].
Then, the LULC map created from the supervised classification of Landsat 8 scenes, utilizing the Maximum Likelihood classification technique using 440 ground control samples, which were collected from the farmers’ declared parcels (OPEKEPE, Figure 5), field survey and very high-resolution orthophoto maps. This very high accuracy geospatial dataset of the parcels was used to update the accuracy of the classified LULC map in the cultivated area. Then, post-classification filtering was performed to remove high-frequency deviations and misclassified pixels.
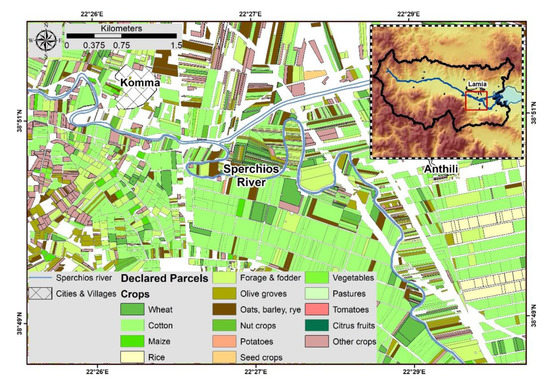
Figure 5.
The farmers’ declared parcels used for the classification of crop types.
The data samples were divided into two datasets, one for training (70%) and one for validation (30%). Utilizing the training dataset, and twelve classes, a two-step classification process was applied. The initial step comprised an initial broad distinction between general land cover types (water, forest, cultivations, built-up classes, etc.). In the second step, the above general land cover types were additionally classified into summer and winter arable crops, and different kinds of forest categories (evergreen, deciduous, etc.) Finally, post-classification filtering was performed to remove high-frequency deviations and misclassified pixels.
3.3.3. Permanent Water Bodies, Flood Delineation and Inundation Duration Detection
The basic processing step for the precise delineation of flood extent concerns the calculation of a water index using the multispectral optical data. The Modified Normalized Difference Water Index (MNDWI) enhances open water characteristics while suppressing noise from built-up land, vegetation, and soil. The calculation of MNDWI and the associated spectral bands is presented in Equation (1).
where pGreen and pSWIR are the reflectance of the green and Short Wave Infrared (SWIR) bands that in case of L8 are band 3 (green) and band 6 (SWIR), while for L7 are band 2 and band 5, respectively.
MNDWI = (pGREEN − pSWIR)/(pGREEN + pSWIR)
The MNDWI was calculated for two images (20/12/14 and 13/01/15) before the flood event in order to distinguish the permanent water bodies (small lakes, ponds or marshes) of the area and exclude them from the detected flooded or post-flood inundated areas afterwards. Likewise, it was applied to four images (6/2, 7/2, 14/2 and 15/2) after the flood to detect the inundation duration period and to estimate the possible impact on the crops οf the affected areas.
For the delineation and isolation of the water surfaces from the surrounding land cover, the establishment of a suitable threshold is needed. The appropriate adjustment of the threshold, which is descriptive of the conditions that temporally exist in the area under study, can improve the extraction results of the water index [70,71]. The mining of the water parts was made utilizing the raster calculator operation of ArcGIS (script: Con (“raster”> = a, “raster”,a); where a is the threshold point that must be selected for the separation of water surfaces), knowing that MNDW index values for water bodies are greater than 0.2 while all the other surface characteristics are <0.2. Thus, a water cover (WC) polygon is acquired showing only the areas of water, either permanent or inundated.
3.3.4. Sentinel-1 SAR Data Processing
Radar systems transmit microwave electromagnetic radiation to the Earth’s surface and a receiver collecting and strengthening at certain frequencies and polarization modes the echoes of the backscattered signal (backscattering coefficient σ0) after interacting with the objects depending on the surface characteristics, such as roughness, moisture, vegetation cover, morphology etc. [23]
One of the most crucial parameters for the suitable delineation of a flooded area is the selection of the most appropriate polarization of the radar waves [16,72].
The available radar images for this study come up with an Intensity VV and VH dual polarization. Noise restricts the use of VH because water has a lower radar cross-section in cross-polarization than in co-polarized channels (VV). Furthermore, generally for water surface mapping, co-polarization (VV) has a 0° phase difference and therefore is preferred over cross-polarization (VH), which has a phase difference evenly distributed between −180° and +180°, and thus the latter does not comprise considerable target-specific information [73]. The implementation of both VH and VV polarization revealed that the VH polarization overestimates the flooded areas, while the VV offers a more reasonable depiction [74]. Moreover, the selection of the same polarization (VV) for all the available images offers better results at the following interpretation procedure [11].
The data preprocessing for the radar images followed specific steps using SNAP. The initial step concerns the subset of the images, which reduces the size of the data [75]. Then, a calibration of the images was carried out, comparing the instrument’s measuring accuracy to a known standard. Subsequently, a speckle filter was applied. The suitable selection of the speckle filter is crucial for the delineation of the flooded area. Speckle shows up as a grainy “salt and pepper” texture in an image [28,76,77], due to the random constructive and destructive interference from the multiple scattering returns (individual reflectors) that take place within each resolution cell. Speckle is a type of noise which reduces the quality of an image and makes interpretation more difficult. Thus, it is commonly necessary to diminish speckle impact before interpretation and analysis. The SNAP program provides several types of filters and window sizes that were applied in the present study, such as Lee (3 × 3, 5 × 5 and 7 × 7), Lee Sigma (5 × 5, 7 × 7), Refined Lee and Gamma Map (3 × 3, 5 × 5 and 7 × 7). The Lee filter using a window of 7 × 7 was finally selected since it was verified as the most appropriate for better delineation of the flooded area, avoiding also the overestimation of the water surface that could provide an unfiltered image [23]. In the literature review, lots of studies have also concluded that the Lee filter provides great results, using statistical parameters, such as the mean and standard deviation with a determined window size considering different factors for smoothing.
Ultimately, the σ0 outputs were terrain corrected by applying the “Range Doppler Terrain Correction” algorithm with the SRTM 1 arc-sec DEM and resampled from 10 to 30 m according to the terrain model resolution and fitting thus to the same resolution of Landsat datasets [11].
Moreover, it must be noted that since the incidence angle variation of the different relative orbits of S1 was small, varying from 34.6 at the near range to 46.1 at the far range, the temporal range of the images was short (1 month) and due to the fact that the study area is relatively flat (plain area), the incidence angle correction was skipped [78].
3.3.5. Flood Monitoring and Inundation Duration Detection
With the goal of detecting the flooded area, two different methods were examined. The first method used was the calibration threshold or binarization technique that uses only the “flood image” and sets a threshold value of radar backscatter signal which is followed by binary band arithmetic to separate whether a given raster pixel is flooded or not [74,79,80]. Thus, in the thresholding technique, the suitable threshold value of the filtered backscatter coefficient was specified manually (ranging from 2.14 × 10⁻² to 2.32 × 10⁻² sigma value for the processed images) by analyzing the logarithmic histogram of the σ0. The histogram demonstrates a peak of different magnitude. Low backscatter values are related to the water, and high backscatter values represent the non-water class. In some spots of the image (especially at the south part), the low backscatter values are associated with terrain shadows in the mountainous area which are not related to the flooded areas and were not taken into account. To make the image binarization, band arithmetic was used, putting the logical value “true” for values less than the chosen threshold and “false” for the higher values, creating thus the final “Water” image.
The change detection method deals with the separation of water from non-water areas by comparing one “reference image” with one “flood image”, making use of a change detection technique. Thus, the pair of S1 SAR images acquired for the flood mapping comprises an image during the flood, and another one before the flood event, which here is called “Flood Image-FI”, and “Reference Image-RI”, respectively. This method compares the same area at two distinct points in time, before (not flooded) and throughout the flood event. The result of this image-to-image difference comparison is a grayscale image composed of single-band continuous data, that reflects the change. Brighter spots correspond to increased reflectance, showing the areas that are not covered by water, while darker areas correspond to decreased reflectance, representing areas covered by water.
3.3.6. Hydraulic Model Analysis
The one-dimensional (1D) model (HEC-RAS model) was applied to simulate the flood extent of different discharge scenarios in the main channel of the Sperchios river in the segment between the Kompotades town and the outlet. The 1D models have been considered effective in predicting the flood extent [48,81], which was the objective in this application where hydraulic modelling is coupled with remote sensing techniques to indirectly approximate the reoccurrence interval of the flood event and to estimate the inundation depth.
The terrain was represented by a DEM (resolution 5 m) from which the model extracted a sequence of cross-sections upon which it simulated flood flow and estimated flood extent and depth. The topographic data upon which the cross-section data were based, were derived by the integration of HEC-GeoRAS in a Geographic Information System (GIS) environment. HEC-RAS determines water surface elevation at cross-sections set by the user at representative locations across the floodplain, by a solution of the energy and energy head loss equations and simulates the depth between the cross-sections using conservation of momentum and friction loss evaluation techniques [82,83]. Then, once the water surface is generated, it subtracts the terrain elevation with the elevation of the water surface to determine water depth across the inundated area. According to the 1D model principles, it was assumed that floodwater flows in the longitudinal direction concerning the main channel. One-dimensional models represent the terrain as a sequence of cross-sections.
The model uses the well-established conservation of mass and conservation of momentum equations for simulating 1-D flow [84]. As input to the model, the channel network and the riverbanks, the cross-section geometry extracted by the DEM, the reach lengths, and hydraulic works and infrastructure data were included. Furthermore, Manning roughness coefficients were selected based on the available literature [85,86,87,88] using the landcover datasets of CORINE. For boundary conditions, we used different discharge scenarios until we identified the one closer to the extent found by the RS techniques described above. In this way, despite the lack of discharge data for this event, by repeated trials, it was possible to indirectly identify the magnitude of the flood by assuming that the real maximum discharge during the event was the one that was in a maximum degree of agreement among the trials, with the flood extent as described by the RS techniques. The model estimated both the extent and the depth of floodwaters under these peak discharge scenarios and was plotted and compared with the remote sensing technique results in a GIS environment.
4. Results
4.1. LULC Classification
In the present study, the final LULC map, attained by the Maximum Likelihood classification method, was reclassified into 7 main classes, i.e., (a) coniferous and sclerophyllous forest, (b) broad-leaved forest, (c) tree crops (orchards and olives), (d) build-up areas, (e) summer arable crops, (f) winter arable crops and (g) grasslands-sparsely vegetated areas (Figure 6).
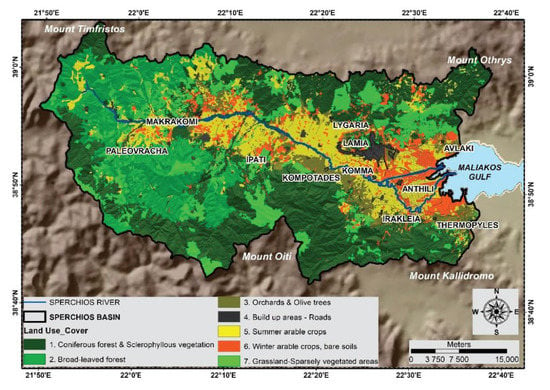
Figure 6.
Land use/cover classified map.
The natural vegetation areas (coniferous-sclerophyllous, broad-leaved forest and grasslands-sparsely vegetated areas) cover the 69.54% (1267.73 km2) of the basin, mainly in the mountainous parts, while the crops occupy primarily the central plain area of the basin. The summer crops occupy the greater part of the plain area covering the 14.35% (261.59 km2) of the basin and 52.97% of the total cultivated land. The rest of the cultivated area is occupied by winter crops-bare soils (24.54%) and olive orchards (22.49%).
The accuracy assessment of the classified LULC map was achieved utilizing the second validation set. The outcomes were evaluated using overall accuracy (OA), and the Kappa coefficient [89,90]. The classification OA and Kappa coefficient were estimated at 89.4% (118 correctly classified parcels out of 132 reference samples) and 0.82, respectively, indicating a highly accurate result, especially in the plain cultivated area, where the OA was calculated at 94.1% (79 correct out of 84 reference samples).
4.2. Flooded Area Detection and Flood Duration Monitoring
4.2.1. Permanent Water Detection
For the delineation of the permanent water bodies or marshes in the area, optical data acquired before the flood event were used. The permanent water areas were estimated at 1.93 km2 (Figure 7a,b). The comparison displays a very high coincide of the two maps, especially at the coastal estuary area, the north branch of the Sperchios river and the small lake situated at the place of the construction of the river proportional divider (rpd) next to the Komma village where the north (new) branch of the Sperchios river initiates. The rpd was created in the first place in 1956 as a flood protection project and rebuilt in 2007 in parallel with the construction of the new National highway and the new National railway that crosses the river close to the village of Anthili (Figure 1).
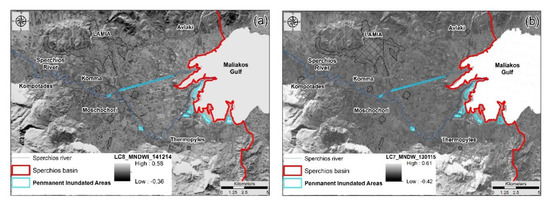
Figure 7.
The permanent water area delineation using the Modified Normalized Difference Water Index derived from Landsat 7 and Landsat 8 images before the flood event (a) L8_20 December 2014, (b) L7_13 January 2015.
4.2.2. Flooded Extent Detection
The flood extent map was extracted by comparing and evaluating the two different methods, threshold calibration and change detection. These methods are two of the most frequently used in active RS to separate flooded area in a radar image [11,17,25,74,91,92,93].
The first method uses a threshold value of radar backscatter (calculated as a function of the incident angle of the sensor and digital number) [25,26], which is set in decibels (dB), and a binary algorithm is followed to define whether an area is flooded. The result is an image where the flooded area appears in white, while all the other images are presented in black. The total flood extent was calculated as 32 km2 (Figure 8).
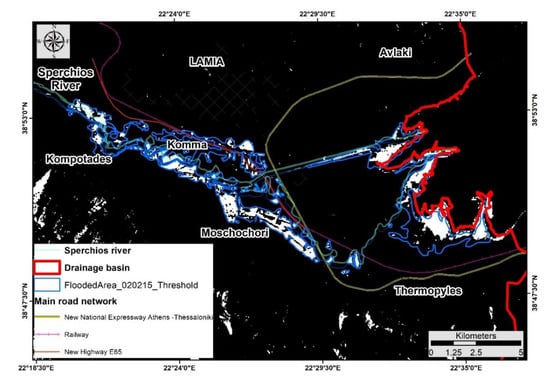
Figure 8.
The flooded area mapping utilizing the first method (using threshold) of Flood Image (FI) processing.
The change detection method that uses the image differencing approach estimates the flooded areas by observing the radar backscatter considerable coefficient decline before and after the flood (Figure 9) [26,93]. It delivers a change detection image where the inundated area appears in the dark grey shade, while all the other image parts appear in light grey shades. The total flood extent was calculated as 33.4 km2 (3340 hectares).
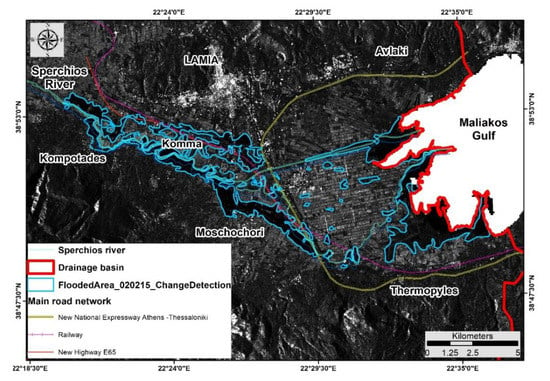
Figure 9.
The flooded area mapping utilizing the second method (image difference) of Reference and Flood Images (FI, RI) processing.
The final flooded area was obtained after a thorough analysis and interpretation of the results derived from the two methods, taking into consideration the estimated flooded areas obtained from the image two days after the flood, on 3rd February and subtracting the permanent areas with water.
4.2.3. Inundation Duration
Through the analysis of Landsat images, it was indicated that those acquired on 6th and 14th of February should be excluded since they do not provide reliable results due to the extensive cloud cover. Besides, the low quality of the image acquired on 7th February restricts the proper interpretation (Figure 10). From the evaluation of the rest of the Landsat and the S1 processed images, the inundated areas were estimated approximately equal to 32.62 km2 on 3rd February (S1), 10.78 km2 on 8th February (S1), 5.70 km2 on 15th February (L8, S1) and 4.75 on 26th February (S1) (Figure 10).
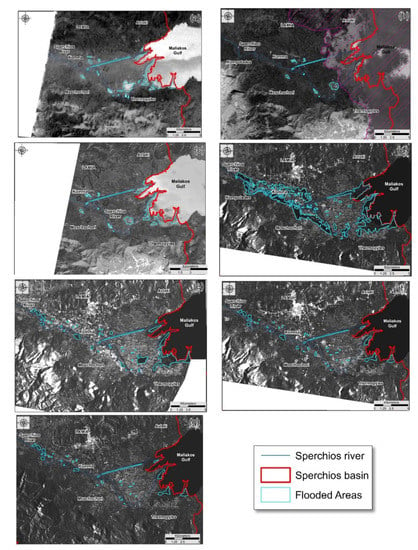
Figure 10.
Inundated duration delineation after the flood event using the Modified Normalized Difference Water Index derived from Landsat 7 and Landsat 8 images: (a) Landsat7_07 February 2015, (b) Landsat7_14 February 2015, (c) Landsat8_15 February 2015, as well as Sentinel-1 images: (d) S1_03 February 2015, (e) S1_08 February 2015, (f) S1_15 February 2015 and (g) S1_26 February 2015.
The fact that the inundated area on 3rd February is larger than the flooded area on 2nd February reveals that large amounts of precipitation or snowmelt likely took place in the mountainous parts, which along with the concentration time of the basin and the prolonged rainfall period led to the continuous water concentration in the coastal zone for an extended period. The long inundation duration can cause suffocating conditions on existing crops, resulting thus in greater damage.
Total inundation duration was computed for each pixel, by intersecting the four final inundation maps of the four selected dates. Consequently, a combined map was extracted showing the duration of the inundated surfaces (Figure 11). A basic prerequisite for the computation process was that the days without satellite observation between two acquired days were assumed that remained flooded [41]. From this map, it was estimated that the inundated areas one (1) day (3/2/15) after the flood event were 34.1 km2, in six (6) days (8/2/15) were 9.33 km2, in thirteen (13) days (15/2/15) were 5.09 km2 and in twenty-four (24) days 4.01 km2.
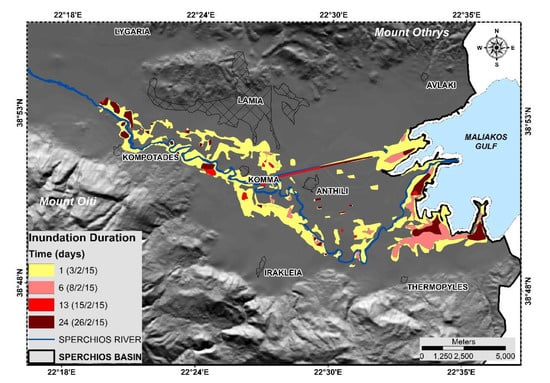
Figure 11.
The inundation duration map, showing the inundated areas in one, six, thirteen and twenty-four days after the flood event.
It must be noted that the accuracy of the estimated inundation duration for the various regions does not only depend on the accuracy of the methodology but is also strongly influenced by the satellite data frequency and distribution [41]. This is worsened by satellite crossings that occasionally do not cover the full extent of the study area, potentially miscalculating the full water surface coverage [74].
4.3. Impact on the Cultivated Areas
Aiming to investigate the spatio-temporal flood impacts at fine spatial scales, the overlapping of the temporal recorded inundated areas on the classified land cover map was accomplished. The results show that 56.61% of the LULC flooded were summer crops, 34.57% winter crops and 1.29% olives-orchards, while 7.37% and 0.16% were built-up areas and riparian forests, respectively.
Considering that the flood took place during winter, the most susceptible cultivations to damage were vegetables, forage crops and cereals, which were present in the fields during the flood. Regarding the 11.55 km2 of the flooded winter crops (mainly cereals, fodder crops and vegetables), 4.09 km2 (35.41%) were inundated for one day, 3.18 km2 (27.45%) for six days, 2.26 km2 (19.57% or 226 ha) for thirteen days and 2.03 km2 (17.58% or 203 ha) for twenty-four days (Figure 12). A very small part of the flooded area was covered by olive groves and fruit trees (0.14 ha).
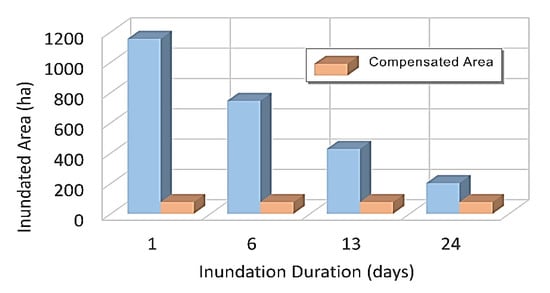
Figure 12.
Affected cultivated areas with winter crops, forage crops and vegetables against inundation duration and the compensated area.
According to the Greek Agricultural Insurance Organization (ELGA) statistical data, a total of 77.3 ha of crops were damaged and were compensated and concerned 74 ha of cereals and forage crops and 3.3 ha of vegetables. It should be noted that ELGA regulations dictate that compensations are only paid under specific circumstances, for example when the total damaged production is greater than 20%, the total annual compensation of each parcel does not exceed 80%, etc.
Crops are mostly affected by water-logged conditions due to lack of oxygen. In these conditions, the amount of oxygen available to plant tissues below the surface of the water level decreases as plants and microorganisms use up what is available. Furthermore, one of the most important factors in oxygen depletion is the temperature, with higher temperatures leading to higher rates of oxygen depletion [94]. Considering that this flood occurred during winter, it is expected that crops can tolerate flood conditions for a more prolonged period. According to Salamin [95], the expected damage for cereals for various inundation durations during February is 5% for 7 days, 10% for 11 days and 20% for 15 days. In the case of forage crops, it is 5% for 11 days and 10% for 15 days. Accordingly, considering the temporal dynamics of the flood (Figure 11 and Figure 12), the inundated area for more than 15 days obtained with the used methodology is comparable to the area calculated and compensated by ELGA based on field surveys and farmers’ declarations. The observed differences are reasonable considering the different sensitivity of each crop to temporal inundation as well as that the expected damage in cereals is near the damage limit covered by ELGO (greater than 20%).
4.4. Hydraulic Model Results and Comparison with Remote Sensing Outcomes
From the testing of different discharge scenarios in the hydraulic model, the discharge value that shows the highest degree of agreement with the satellite-derived flood extent was identified (Figure 13). The discharge value was estimated at 1100 m3/s, although exact matching of the two extents was impossible in any of the discharge scenarios, probably due to small differences in channel and surface geometry and flow conditions between the real and the simulated world. For the above-estimated peak discharge value, the model calculated the flood depth across the inundated area with maximum values of 5.5 m, as presented in Figure 14.
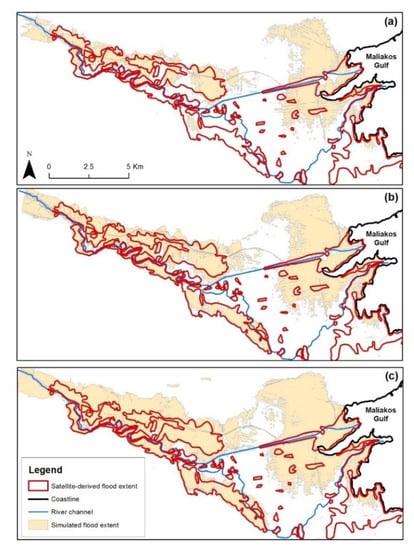
Figure 13.
Maps of the study area comparing the flood extent in different discharge scenarios indicatively of (a) 950 m3/s, (b) 1100 m3/s and (c) 1250 m3/s, as simulated by HEC-RAS and plotted against the satellite-derived flood extent. The red line represents the satellite-derived flood extent.
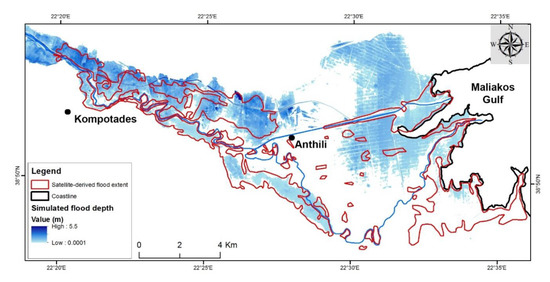
Figure 14.
Map of the study area illustrating the extent of the simulated discharge scenario that agrees to the highest degree with the satellite-derived extent. The grading of blue colors indicates floodwater depth at this discharge value.
Based on the discharge data of the area, the discharge value found to be in agreement with the satellite-derived flood extent is estimated to have a return period of approximately eight years [96]. Moreover, the created flood inundation map of the basin using the HEC-RAS model, as compared with the results of the S1 data, demonstrates that the simulation is currently acceptable regarding the flood extent detection predictive ability, giving adequate results in terms of simulating flood events.
However, as can be seen in Figure 13 and Figure 14, near the outlet of the river (eastern part of the maps), it was found that the model-derived extent was significantly more extended than the satellite-derived one in all scenarios tested. This can be attributed to the fact that these low-lying lands are artificially drained by a complicated system of culverts as they were naturally flooded in wet seasons and remained waterlogged for long time periods. Even if a very high-resolution DEM derived from the stereo pairs of very high accuracy photogrammetric aerial images was used in this study, difficulties can be still encountered in handling man-made hydraulic features such as ditches, canals, farm dams, constructed banks and stormwater infrastructure that can change natural drainage flow paths across the landscape [97]. Specially developed algorithms and manual editing of DEMs to consider these features have been proposed by many researchers [98,99]; however, artificial drainage flows through underground stormwater infrastructure still limit DEM-based hydrological analysis in situations that the topological relations among spatial characteristics are difficult to trace [97].
The huge effort required for the realistic representation of flow paths with hydraulic models in such situations highlights the importance of RS approaches in flood crisis management.
Additionally, the discrepancies that were observed in the southeastern part of the affected area, where the model underestimates the flood extent in comparison to RS results (Figure 13 and Figure 14), could be the result of lateral flows contributed by small torrents in that area, which are not considered by the model.
5. Discussion
In this study, Sentinel-1 radar and Landsat images were utilized in conjunction with hydraulic modelling to obtain flood characteristics and land use/cover (LULC) to assess flood impact in agricultural areas. The findings demonstrate a process that allows accurate flood mapping and contributes to a better understanding of flood metrics, including flood depth, peak discharge, recurrence interval, inundation depth and duration, which are all crucial information in flood risk management in ungauged basins.
Νatural disasters, and especially floods, can cause great damage to agriculture, which is one of the most crucial economic sectors and is also one of the most affected by extreme events [100]. Crop growth necessitates water; nevertheless, excess water occurring during flood events and long duration inundation is sometimes negative or even harmful. Several previous studies have described various adverse effects of flooding on crops, which vary with flood seasonality, crop type, growth stage and environmental conditions, when flooding occurs and according to the inundation duration and severity [100,101]. In the Sperchios plain area, the crop systems mainly include summer crops such as cotton, corn and rice, fewer winter crops such as cereals (wheat, oat etc.), fodders and vegetables, and a small number of olives, orchards and vineyards, and accordingly, flood impact was found to be limited.
The obtained results of this study revealed that the proper estimation of inundation duration is also critical for the evaluation of flood impacts on agriculture. A key issue that is yet to be determined is related to the expansion of RS observation frequency to an extent that would allow us to record and eventually to follow the evolution of accidental flood phenomena. For that purpose, dense acquisitions at a high spatial resolution (20, 10 m or better) are necessary. Although the EO capacity has been constantly increasing over the last two decades, at the moment, unless initiatives like the International Charter are activated, the chances of capturing flood events at their peak with high-resolution EO data are quite low. In this direction, current and near-future SAR, and optical satellite missions are expected to significantly enhance the efficiency by which floods are examined utilizing both systematic and on-demand EO data acquisitions. This would be accomplished through improved repeat cycles, finer spatial resolution, as well as polarimetric and interferometric capabilities.
Multi-seasonal optical data are unique for a detailed LULC classification. The LULC and especially crop type supervised classification deriving from multitemporal L8 data has been proved as a very accurate and reliable way in large cultivated areas from a lot of studies, such as those of Mtibaa and Irie [102], de Oliveira Santos et al. [103], Schultz et al. [104] and Murthy et al. [105]. The above findings are in agreement with the highly accurate LULC classification achieved in the present study. Besides, it must be noted that the present-day availability of the recent open-access Sentinel-2 satellites have already give prospects for the increase of the LULC classification accuracy, due to its highest spatial (10 m), spectral (four red edge bands) and temporal characteristics (5 days) [106,107].
The adaptation of a multi-sensor integration approach increases the likelihood of the imaging flood extent when cloud contamination is low [20]. Multi-source methods and multitemporal data are an encouraging research path worthy of evaluation. The synergistic use of optical and radar data can be crucial for flood mapping and inundation duration detection applications [108]. The MNDWI, which provided adequate results in this study, has also been proven sufficient in several studies in the past, such as those of Psomiadis et al. [13], Conde and Muñoz [23], Kyriou and Nikolakopoulos [109] for flood events occurring in Greece and Clement et al. [74], Singh et al. [110], Baig et al. [111], in other flood events and waterlogged areas. As well as water body detection, it is exceptionally suitable for the delineation and monitoring of water surfaces, since it highlights the strong absorption of SWIR radiation by water bodies. Moreover, the MNDWI is a better index than NDWI for extracting water features mixed with vegetation (depth of standing water varied from 60 to 75 cm) from the satellite image [110,112].
Radar systems are more valuable in providing data and observations during floods, which mostly occur on cloudy days. Cloud cover was found to be an important obstacle in the use of optical RS data for the delineation of the flooded area in this study. With the new opportunities in spatial resolution, polarimetry, wavelength, and other features provided by the new available SAR sensors, new aspects are emerging on space-based flood monitoring. From the evaluation of the results, it can be concluded that from the implementation of the two techniques (threshold and change detection), the flooded areas had nearly the same size and the differences among the two maps are quite insignificant, especially at the western riparian area. Nevertheless, it must be noted that the change detection method better highlighted the small, flooded areas near the river delta.
Two crucial factors for the accurate delineation of a flooded area are the presence of speckle and polarization. A significant drawback of SAR images is the existence of speckle, a signal-dependent granular noise, that visually degrades the image appearance and hinders its interpretation. A firmly increasing number of papers investigating the despeckling filter selection has appeared in the literature over the last two decades, e.g., Conde and Muñoz [23], Rana et al. [77], Argenti et al. [72], Medeiros et al. [113], Xiao et al. [114] and Kushwaha et al. [115]. The speckle filtering implementation does not change the spatial detail and it is ordinarily applied to attain smoothing of the limits of the different forms represented, avoiding the loss of image details. Sentinel-1 SAR data provide VV and VH polarizations in which VV backscatter offer better delineation of water as compared with VH backscatter, an outcome that has been observed from several previous studies, such as those of Clement et al. [74], Agnihotri et al. [116] and Tsyganskaya et al. [117]. As it has resulted from the present study, following the previous ones, the VH polarization overestimates the flooded areas, while the VV offers a more reasonable depiction, especially when Sentinel-1 data are used [74]. Additionally, it is notable that the C-band wavelength is too short to decompose the accurate scattering processes of highly vegetated zones where canopies are dense. Future efforts are required towards the investigation of the multitemporal synergistic studies between Sentinel-2 and X- or L-band SAR EO systems, to explore whether the issue of dense canopy penetration can be overcome [118].
The synergistic use of 1D HEC-RAS hydraulic modelling (based on high-resolution DEM), RS data and GIS analysis provided relevant and valuable results that can contribute to flood detection and to estimate flood metrics including peak discharge and return period, through reverse estimations. Indirect estimation of the flood recurrence interval can also be a valuable aspect for future flood management efforts, particularly in areas with a scarcity of instrumental hydrological data. In this study, we selected intentionally specific RS and hydraulic modelling tools that are available in a large part of the world, to increase the applicability of the approach applied. Numerous previous studies have also reached similar conclusions, adopting RS data and techniques, GIS and DEM to assess the flood characteristics, such as those of Liang and Liu [119], Huang et al. [120], Cian et al. [121] and Psomiadis et al. [13] Besides, Khalfallah and Saidi [122] and Qi and Altinakar [123] used Geographical Information System (GIS)-based tools and HEC-RAS for integrated flood management, while Ezzine et al. [124], Gkouma et al. [125] and Quang et al. [126] utilized mainly Sentinel-1 and other SAR imagery and hydraulic modelling for flood mapping.
Topographic datasets and accurate DEM perform a significant role in hydraulic modelling and the correct prediction of flood inundation areas [127]. Therefore, particularly for local-scale events, the prospect of using in the future more systematically high-resolution elevation data derived from Unmanned Aerial Vehicles (UAV) and/or laser scanning (light detection and ranging (LIDAR)) aerial photogrammetry would provide more accurately DEM products and will improve the estimation of flood extent and depth [20,128]. However, it should be mentioned that artificial drainage flows through underground stormwater infrastructure can still limit DEM-based hydrological analysis in situations that the topological relationships among spatial features are difficult to trace as seems to be the case in specific places of the current study area [97]. It is also essential to be noted the fact that the accuracy of hydraulic modelling predictions can probably be improved by considering other detailed information offered by 2D flood modelling, such as flood velocity and duration, except flood depth.
Besides this, more accurate hydraulic modelling outcomes can be useful for the determination of an optimal threshold of the SAR images, which sometimes it is difficult to be approached.
The hydraulic model estimation of the approximately eight-year flood return period is in agreement with the frequent and continuous flood events at the plain area of the Sperchios basin [54]. The multitemporal and multi-seasonal RS data has proved that it can deliver an integrated monitoring approach of LULC and flood events, necessary for the post-flood inundation duration detection and its impact on crops. These detection results could lead stakeholders and decision-makers to locate the most vulnerable areas and to propose changes in the agricultural management of the area, by utilizing a more reasonable selection of crops and/or more drastic flood prevention structures. A synthesis of existing remote and proximal sensing technologies could provide routine, nationwide flood susceptibility under all conditions [20].
Finally, it is noteworthy that the rainfall amounts between 31/1/15 and 1/2/15 do not constitute a very rare amount of rainfall. Nevertheless, it has to be stressed that due to the size of the catchment, the rainfall measurements through rain gauges are not representative of the entire area of the watershed. This fact shows that a large amount of precipitation probably took place in the mountainous parts of the catchment that was not recorded by the meteorological stations of Makrakomi and Lamia located at lower altitudes. Moreover, due to the large size of the Sperchios drainage basin, the water deriving from precipitation or snow melting from the mountainous part needs a longer time to reach its outflow point [54].
6. Conclusions
The present study highlights the advantages of high-resolution multisource RS imagery and hydraulic modelling for flood extent and depth mapping. Furthermore, it evaluates the ability of multitemporal RS data to support the assessment of flood impact on agricultural areas through the estimation of the inundation duration.
The results confirm that the Sentinel-1 mission is capable of providing adequate spatial and temporal resolution data, from which high accuracy flood maps can be extracted. Thus, S1 data, along with optical data when it is possible according to the weather conditions, are able to enhance the capacity to map the extent and the temporal dynamics of each flood more accurately, supporting improved assessments of flood impact on agricultural areas. However, the current analysis indicated that the chances of capturing a flood event at its peak and to follow its evolution with high spatial and temporal resolution EO data are still quite low. The obtained results reveal that the proper estimation of inundation duration is critical for the evaluation of flood impacts on agriculture. Accordingly, improved repeat cycles and finer spatial resolution RS observations may further improve flood monitoring.
Both processing methods of radar data, thresholding and image differencing, implemented for the inundated area mapping appeared to have adequate and similar results. Furthermore, the multitemporal optical and radar data deliver unique information for permanent water cover, LULC mapping and inundation duration monitoring, which can delineate ideally the flood event impact on the crops of the area. Therefore, the obtained results can provide a better insight into future flood risk reduction planning in the study area and act as an example for similar studies in other similar regions.
HEC-RAS 1D hydraulic modelling was also proved as a useful tool when combined with RS for studying and understanding key flood metrics in a post-flood event environment. The results of this study indicated that the conjunction of hydraulic modelling with multitemporal RS data contributes to a better understanding of flood characteristics, such as flood extent and depth, recurrence interval, peak discharge and inundation duration. The important implication of this synergistic use of the two techniques is that it shows the unique value in poorly gauged basins. Besides, given the wide availability of the required data, the developed approach can be applied in diverse environments around the world where flood monitoring is poorly developed.
The availability of flood observations is of high importance, mainly during a flood disaster, when decision-makers and relief organizations require a quick overview of the condition and comprehensive insights into the affected area to distribute their resources with maximum efficiency.
Author Contributions
Conceptualization, E.P., M.D. and K.X.S.; methodology, E.P., M.D. and K.X.S.; remote sensing, E.P.; hydraulic modelling, M.D. and K.X.S.; validation, E.P., M.D. and K.X.S., resources, E.P.; data curation, E.P., M.D. and K.X.S., writing—original draft preparation, E.P., M.D. and K.X.S.; supervision, E.P.; All authors have read and agreed to the published version of the manuscript.
Funding
This research received no external funding.
Acknowledgments
The authors would like to thank the Greek Agricultural Insurance Organization (ELGA) for providing them with statistical data for flood damage compensations. We would also like to acknowledge the European Space Agency and USGS-NASA for the availability of Sentinel and Landsat data.
Conflicts of Interest
The authors declare no conflict of interest.
References
- Diakakis, M.; Boufidis, N.; Salanova Grau, J.M.; Andreadakis, E.; Stamos, I. A systematic assessment of the effects of extreme flash floods on transportation infrastructure and circulation: The example of the 2017 Mandra flood. Int. J. Disaster Risk Reduct. 2020, 47, 101542. [Google Scholar] [CrossRef]
- Schlaffer, S.; Matgen, P.; Hollaus, M.; Wagner, W. Flood detection from multi-temporal SAR data using harmonic analysis and change detection. Int. J. Appl. Earth Obs. Geoinf. 2015, 38, 15–24. [Google Scholar] [CrossRef]
- Tsakiris, G. Flood risk assessment: Concepts, modelling, applications. Nat. Hazards Earth Syst. Sci. 2014, 14, 1361–1369. [Google Scholar] [CrossRef]
- Barredo, J.I. Major flood disasters in Europe: 1950-2005. Nat. Hazards 2007, 42, 125–148. [Google Scholar] [CrossRef]
- Diakakis, M.; Priskos, G.; Skordoulis, M. Public perception of flood risk in flash flood prone areas of Eastern Mediterranean: The case of Attica Region in Greece. Int. J. Disaster Risk Reduct. 2018, 28, 404–413. [Google Scholar] [CrossRef]
- Salvati, P.; Petrucci, O.; Rossi, M.; Bianchi, C.; Pasqua, A.A.; Guzzetti, F. Gender, age and circumstances analysis of flood and landslide fatalities in Italy. Sci. Total Environ. 2018, 610–611, 867–879. [Google Scholar] [CrossRef]
- Jonkman, S.N.; Kelman, I. An analysis of the causes and circumstances of flood disaster deaths. Disasters 2005, 29, 75–97. [Google Scholar] [CrossRef]
- Douben, K.-J. Characteristics of river floods and flooding: A global overview, 1985–2003. Irrig. Drain. 2006, 55, S9–S21. [Google Scholar] [CrossRef]
- Halgamuge, M.N.; Nirmalathas, A. Analysis of large flood events: Based on flood data during 1985–2016 in Australia and India. Int. J. Disaster Risk Reduct. 2017, 24, 1–11. [Google Scholar] [CrossRef]
- Diakakis, M.; Mavroulis, S.; Deligiannakis, G. Floods in Greece, a statistical and spatial approach. Nat. Hazards 2012, 62, 485–500. [Google Scholar] [CrossRef]
- Psomiadis, E. Flash flood area mapping utilising Sentinel-1 radar data. In Proceedings of the SPIE—The International Society for Optical Engineering; SPIE-Intl Soc Optical Eng: Edinburgh, UK, 2016; Volume 10005. [Google Scholar]
- Abdelkareem, M. Targeting flash flood potential areas using remotely sensed data and GIS techniques. Nat. Hazards 2017, 85, 19–37. [Google Scholar] [CrossRef]
- Psomiadis, E.; Soulis, K.; Zoka, M.; Dercas, N. Synergistic Approach of Remote Sensing and GIS Techniques for Flash-Flood Monitoring and Damage Assessment in Thessaly Plain Area, Greece. Water 2019, 11, 448. [Google Scholar] [CrossRef]
- Borga, M.; Anagnostou, E.N.; Blöschl, G.; Creutin, J.D. Flash floods: Observations and analysis of hydro-meteorological controls. J. Hydrol. 2010, 394, 1–3. [Google Scholar] [CrossRef]
- Diakakis, M.; Andreadakis, E.; Nikolopoulos, E.I.; Spyrou, N.I.; Gogou, M.E.; Deligiannakis, G.; Katsetsiadou, N.K.; Antoniadis, Z.; Melaki, M.; Georgakopoulos, A.; et al. An integrated approach of ground and aerial observations in flash flood disaster investigations. The case of the 2017 Mandra flash flood in Greece. Int. J. Disaster Risk Reduct. 2019, 33, 290–309. [Google Scholar] [CrossRef]
- Klemas, V. Remote Sensing of Floods and Flood-Prone Areas: An Overview. J. Coast. Res. 2015, 314, 1005–1013. [Google Scholar] [CrossRef]
- Brivio, P.A.; Colombo, R.; Maggi, M.; Tomasoni, R. Integration of remote sensing data and GIS for accurate mapping of flooded areas. Int. J. Remote Sens. 2002, 23, 429–441. [Google Scholar] [CrossRef]
- Ramsey, E.; Rangoonwala, A.; Bannister, T. Coastal Flood Inundation Monitoring with Satellite C-band and L-band Synthetic Aperture Radar Data. JAWRA J. Am. Water Resour. Assoc. 2013, 49, 1239–1260. [Google Scholar] [CrossRef]
- Cian, F.; Marconcini, M.; Ceccato, P. Normalized Difference Flood Index for rapid flood mapping: Taking advantage of EO big data. Remote Sens. Environ. 2018, 209, 712–730. [Google Scholar] [CrossRef]
- O’Hara, R.; Green, S.; McCarthy, T. The agricultural impact of the 2015-2016 floods in Ireland as mapped through Sentinel 1 satellite imagery. Irish J. Agric. Food Res. 2019, 58, 44–65. [Google Scholar] [CrossRef]
- Wagner, W.; Freeman, V.; Cao, S.; Matgen, P.; Chini, M.; Salamon, P.; McCormick, N.; Martinis, S.; Bauer-Marschallinger, B.; Navacchi, C.; et al. Data processing architectures for monitoring floods using Sentinel-1. ISPRS Ann. Photogramm. Remote Sens. Spat. Inf. Sci. 2020, V-3, 641–648. [Google Scholar] [CrossRef]
- User Guides—Sentinel-1 SAR—Sentinel Online. Available online: https://sentinel.esa.int/web/sentinel/user-guides/sentinel-1-sar (accessed on 25 August 2020).
- Carreño Conde, F.; De Mata Muñoz, M. Flood Monitoring Based on the Study of Sentinel-1 SAR Images: The Ebro River Case Study. Water 2019, 11, 2454. [Google Scholar] [CrossRef]
- Baghdadi, N.; Bernier, M.; Gauthier, R.; Neeson, I. Evaluation of C-band SAR data for wetlands mapping. Int. J. Remote Sens. 2001, 22, 71–88. [Google Scholar] [CrossRef]
- Manjusree, P.; Prasanna Kumar, L.; Bhatt, C.M.; Rao, G.S.; Bhanumurthy, V. Optimization of threshold ranges for rapid flood inundation mapping by evaluating backscatter profiles of high incidence angle SAR images. Int. J. Disaster Risk Sci. 2012, 3, 113–122. [Google Scholar] [CrossRef]
- Sanyal, J.; Lu, X.X. Application of remote sensing in flood management with special reference to monsoon Asia: A review. Nat. Hazards 2004, 33, 283–301. [Google Scholar] [CrossRef]
- Sun, Z.; Li, X.; Fu, W.; Li, Y.; Tang, D. Long-term effects of land use/land cover change on surface runoff in urban areas of Beijing, China. J. Appl. Remote Sens. 2013, 8, 084596. [Google Scholar] [CrossRef]
- Chatziantoniou, A.; Petropoulos, G.P.; Psomiadis, E. Co-Orbital Sentinel 1 and 2 for LULC mapping with emphasis on wetlands in a mediterranean setting based on machine learning. Remote Sens. 2017, 9. [Google Scholar] [CrossRef]
- Souza, C.M.; Shimbo, J.Z.; Rosa, M.R.; Parente, L.L.; Alencar, A.A.; Rudorff, B.F.T.; Hasenack, H.; Matsumoto, M.; Ferreira, L.G.; Souza-Filho, P.W.M.; et al. Reconstructing Three Decades of Land Use and Land Cover Changes in Brazilian Biomes with Landsat Archive and Earth Engine. Remote Sens. 2020, 12, 2735. [Google Scholar] [CrossRef]
- Mohamed, M.; Anders, J.; Schneider, C. Monitoring of Changes in Land Use/Land Cover in Syria from 2010 to 2018 Using Multitemporal Landsat Imagery and GIS. Land 2020, 9, 226. [Google Scholar] [CrossRef]
- Xu, Y.; Zhang, L.M. Breaching Parameters for Earth and Rockfill Dams. J. Geotech. Geoenvironmental Eng. 2009, 135, 1957–1970. [Google Scholar] [CrossRef]
- Psomiadis, E.; Soulis, K.X.; Efthimiou, N. Using SCS-CN and earth observation for the comparative assessment of the hydrological effect of gradual and abrupt spatiotemporal land cover changes. Water (Switzerland) 2020, 12. [Google Scholar] [CrossRef]
- Qi, S.; Brown, D.G.; Tian, Q.; Jiang, L.; Zhao, T.; Bergen, K.M. Inundation extent and flood frequency mapping using LANDSAT imagery and digital elevation models. GISci. Remote Sens. 2009, 46, 101–127. [Google Scholar] [CrossRef]
- Wang, Y.; Colby, J.D.; Mulcahy, K.A. An efficient method for mapping flood extent in a coastal floodplain using Landsat TM and DEM data. Int. J. Remote Sens. 2002, 23, 3681–3696. [Google Scholar] [CrossRef]
- Yamagata, Y.; Akiyama, T. Flood damage analysis using multitemporal Landsat Thematic Mapper data. Int. J. Remote Sens. 1988, 9, 503–514. [Google Scholar] [CrossRef]
- Pantaleoni, E.; Engel, B.A.; Johannsen, C.J. Identifying agricultural flood damage using Landsat imagery. Precis. Agric. 2007, 8, 27–36. [Google Scholar] [CrossRef]
- Xu, H. Modification of normalised difference water index (NDWI) to enhance open water features in remotely sensed imagery. Int. J. Remote Sens. 2006, 27, 3025–3033. [Google Scholar] [CrossRef]
- Campos, J.C.; Sillero, N.; Brito, J.C. Normalized difference water indexes have dissimilar performances in detecting seasonal and permanent water in the Sahara-Sahel transition zone. J. Hydrol. 2012, 464–465, 438–446. [Google Scholar] [CrossRef]
- McFeeters, S.K. The use of the Normalized Difference Water Index (NDWI) in the delineation of open water features. Int. J. Remote Sens. 1996, 17, 1425–1432. [Google Scholar] [CrossRef]
- Memon, A.A.; Muhammad, S.; Rahman, S.; Haq, M. Flood monitoring and damage assessment using water indices: A case study of Pakistan flood-2012. Egypt. J. Remote Sens. Sp. Sci. 2015, 18, 99–106. [Google Scholar] [CrossRef]
- Rättich, M.; Martinis, S.; Wieland, M. Automatic Flood Duration Estimation Based on Multi-Sensor Satellite Data. Remote Sens. 2020, 12, 643. [Google Scholar] [CrossRef]
- Bhatt, C.M.; Rao, G.S.; Farooq, M.; Manjusree, P.; Shukla, A.; Sharma, S.V.S.P.; Kulkarni, S.S.; Begum, A.; Bhanumurthy, V.; Diwakar, P.G.; et al. Satellite-based assessment of the catastrophic Jhelum floods of September 2014, Jammu & Kashmir, India. Geomat. Nat. Hazards Risk 2017, 8, 309–327. [Google Scholar] [CrossRef]
- Rahman, M.; Ningsheng, C.; Islam, M.M.; Dewan, A.; Iqbal, J.; Washakh, R.M.A.; Shufeng, T. Flood Susceptibility Assessment in Bangladesh Using Machine Learning and Multi-criteria Decision Analysis. Earth Syst. Environ. 2019, 3, 585–601. [Google Scholar] [CrossRef]
- Anusha, N.; Bharathi, B. Flood detection and flood mapping using multi-temporal synthetic aperture radar and optical data. Egypt. J. Remote Sens. Sp. Sci. 2020, 23, 207–219. [Google Scholar] [CrossRef]
- Diakakis, M.; Deligiannakis, G.; Katsetsiadou, K.; Antoniadis, Z.; Melaki, M. Mapping and classification of direct flood impacts in the complex conditions of an urban environment. The case study of the 2014 flood in Athens, Greece. Urban Water J. 2017, 14, 1065–1074. [Google Scholar] [CrossRef]
- Saksena, S.; Merwade, V. Incorporating the effect of DEM resolution and accuracy for improved flood inundation mapping. J. Hydrol. 2015, 530, 180–194. [Google Scholar] [CrossRef]
- Vesakoski, J.-M.; Alho, P.; Hyyppä, J.; Holopainen, M.; Flener, C.; Hyyppä, H. Nationwide Digital Terrain Models for Topographic Depression Modelling in Detection of Flood Detention Areas. Water 2014, 6, 271–300. [Google Scholar] [CrossRef]
- Dasallas, L.; Kim, Y.; An, H. Case Study of HEC-RAS 1D–2D Coupling Simulation: 2002 Baeksan Flood Event in Korea. Water 2019, 11, 2048. [Google Scholar] [CrossRef]
- Hicks, F.E.; Peacock, T. Suitability of HEC-RAS for Flood Forecasting. Can. Water Resour. J. 2005, 30, 159–174. [Google Scholar] [CrossRef]
- Albu, L.-M.; Enea, A.; Iosub, M.; Breabăn, I.-G. Dam Breach Size Comparison for Flood Simulations. A HEC-RAS Based, GIS Approach for Drăcșani Lake, Sitna River, Romania. Water 2020, 12, 1090. [Google Scholar] [CrossRef]
- Anees, M.T.; Abdullah, K.; Nordin, M.N.M.; Rahman, N.N.N.A.; Syakir, M.I.; Kadir, M.O.A. One- and Two-Dimensional Hydrological Modelling and Their Uncertainties. In Flood Risk Management; InTech: London, UK, 2017. [Google Scholar]
- Zamani, A.; Maroukian, H. A morphological study of an old delta of the Sperchios River. In Proceedings of the 6th Colloquium on the Geology of the Aegean Region; Kallergis, G., Ed.; Institute of Geological and Mining Research: Athens, Greece, 1979; pp. 261–282. [Google Scholar]
- Psomiadis, E. Research of Geomorphological and Environmental Changes in the Sperchios’ River Basin Utilizing New Technologies. Ph.D. Thesis, Agricultural University of Athens, Athina, Greece, 2010. [Google Scholar]
- Psomiadis, E.; Charizopoulos, N.; Soulis, K.X.; Efthimiou, N. Investigating the Correlation of Tectonic and Morphometric Characteristics with the Hydrological Response in a Greek River Catchment Using Earth Observation and Geospatial Analysis Techniques. Geosciences 2020, 10, 377. [Google Scholar] [CrossRef]
- Ferrière, J. Recent Developments in the Maliakos Isopic Zone, Eastern Central Greece. In Proceedings of the 6th Colloquium Geology of the Aegean Region; Institute of Geological and Mining Research: Athens, Greece, 1977; pp. 197–210. [Google Scholar]
- Psomiadis, E.; Migiros, G.; Parcharidis, I.; Poulos, S. Short Period Change Detection of Sperchios Lower Delta Area Using Space Radar Images. Bull. Geol. Soc. Greece 2004, 36, 919. [Google Scholar] [CrossRef]
- European Space Agency (ESA) Copernicus Open Access Hub. Available online: https://sentinel.esa.int/web/sentinel (accessed on 23 September 2020).
- Sentinel Online—ESA User Guides and Technical Guides of Sentinel-1 SAR. Available online: https://sentinel.esa.int/web/sentinel (accessed on 23 September 2020).
- United States Geological Survey (USGS) EarthExplorer. Available online: https://earthexplorer.usgs.gov/ (accessed on 23 September 2020).
- Stathopoulos, N.; Kalogeropoulos, K.; Louka, P.; Karymbalis, E.; Papadopoulos, A.G.; Chalkias, C. Flood Impact Assessment via SAR Data Analysis and GIS. Application in Sperchios River Basin, Greece (in Greek). Available online: https://www.researchgate.net/publication/317098438_FLOOD_IMPACT_ASSESSMENT_VIA_SAR_DATA_ANALYSIS_AND_GIS_APPLICATION_IN_SPERCHIOS_RIVER_BASIN_GREECE (accessed on 18 September 2020).
- Tsakalias, G.; Koutsoyiannis, D. Hydrological Characteristics of the Sperchios Basin—ITIA. Available online: https://www.itia.ntua.gr/en/docinfo/98/ (accessed on 18 September 2020).
- Bernstein, L.S.; Adler-Golden, S.M.; Jin, X.; Gregor, B.; Sundberg, R.L. Quick atmospheric correction (QUAC) code for VNIR-SWIR spectral imagery: Algorithm details. In Proceedings of the Workshop on Hyperspectral Image and Signal Processing, Evolution in Remote Sensing, Shanghai, China, 4–7 June 2012. [Google Scholar]
- Psomiadis, E.; Charizopoulos, N.; Efthimiou, N.; Soulis, K.X.; Charalampopoulos, I. Earth Observation and GIS-Based Analysis for Landslide Susceptibility and Risk Assessment. ISPRS Int. J. Geo-Inf. 2020, 9, 552. [Google Scholar] [CrossRef]
- Sonobe, R.; Yamaya, Y.; Tani, H.; Wang, X.; Kobayashi, N.; Mochizuki, K. Mapping crop cover using multi-temporal Landsat 8 OLI imagery. Int. J. Remote Sens. 2017, 38, 4348–4361. [Google Scholar] [CrossRef]
- Asgarian, A.; Soffianian, A.; Pourmanafi, S. Crop type mapping in a highly fragmented and heterogeneous agricultural landscape: A case of central Iran using multi-temporal Landsat 8 imagery. Comput. Electron. Agric. 2016, 127, 531–540. [Google Scholar] [CrossRef]
- Soulis, K.X.; Psomiadis, E.; Londra, P.; Skuras, D. A New Model-Based Approach for the Evaluation of the Net Contribution of the European Union Rural Development Program to the Reduction of Water Abstractions in Agriculture. Sustainability 2020, 12, 7137. [Google Scholar] [CrossRef]
- Psomiadis, E.; Dercas, N.; Dalezios, N.R.; Spyropoulos, N.V. Evaluation and cross-comparison of vegetation indices for crop monitoring from sentinel-2 and worldview-2 images. In Proceedings of the SPIE—The International Society for Optical Engineering, Warsaw, Poland, 2 November 2017; Volume 10421. [Google Scholar]
- Psomiadis, E.; Papazachariou, A.; Soulis, K.X.; Alexiou, D.S.; Charalampopoulos, I. Landslide mapping and susceptibility assessment using geospatial analysis and earth observation data. Land 2020, 9, 133. [Google Scholar] [CrossRef]
- Jia, K.; Wei, X.; Gu, X.; Yao, Y.; Xie, X.; Li, B. Land cover classification using Landsat 8 Operational Land Imager data in Beijing, China. Geocarto Int. 2014, 29, 941–951. [Google Scholar] [CrossRef]
- Worden, J.; de Beurs, K.M. Surface water detection in the Caucasus. Int. J. Appl. Earth Obs. Geoinf. 2020, 91, 102159. [Google Scholar] [CrossRef]
- Ji, L.; Zhang, L.; Wylie, B. Analysis of dynamic thresholds for the normalized difference water index. Photogramm. Eng. Remote Sens. 2009, 75, 1307–1317. [Google Scholar] [CrossRef]
- Argenti, F.; Lapini, A.; Alparone, L.; Bianchi, T. A tutorial on speckle reduction in synthetic aperture radar images. IEEE Geosci. Remote Sens. Mag. 2013, 1, 6–35. [Google Scholar] [CrossRef]
- Gan, T.Y.; Zunic, F.; Kuo, C.C.; Strobl, T. Flood mapping of danube river at romania using single and multi-date ERS2-SAR images. Int. J. Appl. Earth Obs. Geoinf. 2012, 18, 69–81. [Google Scholar] [CrossRef]
- Clement, M.A.; Kilsby, C.G.; Moore, P. Multi-temporal synthetic aperture radar flood mapping using change detection. J. Flood Risk Manag. 2018, 11, 152–168. [Google Scholar] [CrossRef]
- Step by Step: Recommended Practice Flood Mapping | UN-SPIDER Knowledge Portal. Available online: http://www.un-spider.org/advisory-support/recommended-practices/recommended-practice-flood-mapping/step-by-step (accessed on 22 September 2020).
- Filipponi, F. Sentinel-1 GRD Preprocessing Workflow. Proceedings 2019, 18, 11. [Google Scholar] [CrossRef]
- Rana, V.K.; Suryanarayana, T.M.V. Evaluation of SAR speckle filter technique for inundation mapping. Remote Sens. Appl. Soc. Environ. 2019, 16, 100271. [Google Scholar] [CrossRef]
- Lin, Y.N.; Yun, S.-H.; Bhardwaj, -A.; Hill, E.M. Urban Flood Detection with Sentinel-1 Multi-Temporal Synthetic Aperture Radar (SAR) Observations in a Bayesian Framework: A Case Study for Hurricane Matthew. Remote Sens 2019, 11, 1778. [Google Scholar] [CrossRef]
- Henry, J.-B.; Chastanet, P.; Fellah, K.; Desnos, Y.-L. Envisat multi-polarized ASAR data for flood mapping. Int. J. Remote Sens. 2006, 27, 1921–1929. [Google Scholar] [CrossRef]
- Tavus, B.; Kocaman, S.; Gokceoglu, C.; Nefeslioglu, H.A. Considerations on the use of Sentinel-1 data in flood mapping in urban areas: Ankara (Turkey) 2018 floods. ISPRS Int. Arch. Photogramm. Remote Sens. Spat. Inf. Sci. 2018, XLII-5, 575–581. [Google Scholar] [CrossRef]
- Horritt, M.S.; Bates, P.D. Evaluation of 1D and 2D numerical models for predicting river flood inundation. J. Hydrol. 2002, 268, 87–99. [Google Scholar] [CrossRef]
- Kasper, K.E.; Thornton, C.I.; Abt, S.R.; Robeson, M.D.; Watson, C.C. Accuracy of HEC-RAS to Calculate Flow Depths and Total Energy Loss with and without Bedway Weirs in a Meander Bend; Colorado State University: Fort Collins, CO, USA, 2005. [Google Scholar]
- US Army Corps of Engineers. HEC-RAS River Analysis System Hydraulic Reference Manual; USACE: Davis, CA, USA, 2016. [Google Scholar]
- Bates, P.D.; Lane, S.N.; Ferguson, R.I. Computational Fluid Dynamics; Bates, P.D., Lane, S.N., Ferguson, R.I., Eds.; John Wiley & Sons, Ltd.: Chichester, UK, 2005; ISBN 9780470015193. [Google Scholar]
- Vieux, B.E. Distributed Hydrologic Modeling Using GIS; Water Science and Technology Library, Ed.; Springer: Dordrecht, The Netherlands, 2001. [Google Scholar]
- Candela, A.; Noto, L.V.; Aronica, G. Influence of surface roughness in hydrological response of semiarid catchments. J. Hydrol. 2005, 313, 119–131. [Google Scholar] [CrossRef]
- Christofidis, A. Development of a GIS-Based Rainfall-Runoff Model. PhD Thesis, Faculty of Civil Engineering, National Technical University of Athens, Athens, Greece, 2008. [Google Scholar]
- Diakakis, M. A method for flood hazard mapping based on basin morphometry: Application in two catchments in Greece. Nat. Hazards 2011, 56, 803–814. [Google Scholar] [CrossRef]
- Congalton, R.G. A review of assessing the accuracy of classifications of remotely sensed data. Remote Sens. Environ. 1991, 37, 35–46. [Google Scholar] [CrossRef]
- Cohen, J. A Coefficient of Agreement for Nominal Scales. Educ. Psychol. Meas. 1960, 20, 37–46. [Google Scholar] [CrossRef]
- Rahman, M.R.; Thakur, P.K. Detecting, mapping and analysing of flood water propagation using synthetic aperture radar (SAR) satellite data and GIS: A case study from the Kendrapara District of Orissa State of India. Egypt. J. Remote Sens. Sp. Sci. 2018, 21, S37–S41. [Google Scholar] [CrossRef]
- Tiwari, V.; Kumar, V.; Matin, M.A.; Thapa, A.; Ellenburg, W.L.; Gupta, N.; Thapa, S. Flood inundation mapping- Kerala 2018; Harnessing the power of SAR, automatic threshold detection method and Google Earth Engine. PLoS ONE 2020, 15, e0237324. [Google Scholar] [CrossRef]
- Long, S.; Fatoyinbo, T.E.; Policelli, F. Flood extent mapping for Namibia using change detection and thresholding with SAR. Environ. Res. Lett. 2014, 9, 9. [Google Scholar] [CrossRef]
- Mittra, M.K.; Stickler, F.C. Excess Water Effects on Different Crops. Trans. Kansas Acad. Sci. 1961, 64, 275. [Google Scholar] [CrossRef][Green Version]
- Salamin, P. Relations entre les irrigations et l’evacuation de l’eau; International Commission on Irrigation & Drainage (ICID): New Delhi, India, 1957. [Google Scholar]
- Tsakalias, G.; Koutsoyiannis, D. Hydrological characteristics of the Sperchios basin. In Proceedings of the Sperchios 2000+; Sterea Hellas District, National Technical University of Athens: Athens, Greece, 1995; pp. 89–98. [Google Scholar]
- Choi, Y. A new algorithm to calculate weighted flow-accumulation from a DEM by considering surface and underground stormwater infrastructure. Environ. Model. Softw. 2012, 30, 81–91. [Google Scholar] [CrossRef]
- Choi, Y.; Yi, H.; Park, H.D. A new algorithm for grid-based hydrologic analysis by incorporating stormwater infrastructure. Comput. Geosci. 2011, 37, 1035–1044. [Google Scholar] [CrossRef]
- Callow, J.N.; Smettem, K.R.J. The effect of farm dams and constructed banks on hydrologic connectivity and runoff estimation in agricultural landscapes. Environ. Model. Softw. 2009, 24, 959–968. [Google Scholar] [CrossRef]
- Chen, H.; Liang, Q.; Liang, Z.; Liu, Y.; Xie, S. Remote-sensing disturbance detection index to identify spatio-temporal varying flood impact on crop production. Agric. For. Meteorol. 2019, 269–270, 180–191. [Google Scholar] [CrossRef]
- Gould, I.J.; Wright, I.; Collison, M.; Ruto, E.; Bosworth, G.; Pearson, S. The impact of coastal flooding on agriculture: A case-study of Lincolnshire, United Kingdom. L. Degrad. Dev. 2020, 31, 1545–1559. [Google Scholar] [CrossRef]
- Mtibaa, S.; Irie, M. Land cover mapping in cropland dominated area using information on vegetation phenology and multi-seasonal Landsat 8 images. Euro-Mediterranean J. Environ. Integr. 2016, 1, 1–16. [Google Scholar] [CrossRef]
- de Oliveira Santos, C.L.M.; Lamparelli, R.A.C.; Figueiredo, G.; Dupuy, S.; dos Santos Luciano, A.C.; da Silva Torres, R.; le Maire, G.; Boury, J. Classification of Crops, Pastures, and Tree Plantations along the Season with Multi-Sensor Image Time Series in a Subtropical Agricultural Region. Remote Sens. 2019, 11, 334. [Google Scholar] [CrossRef]
- Schultz, B.; Immitzer, M.; Formaggio, A.; Sanches, I.; Luiz, A.; Atzberger, C. Self-Guided Segmentation and Classification of Multi-Temporal Landsat 8 Images for Crop Type Mapping in Southeastern Brazil. Remote Sens. 2015, 7, 14482–14508. [Google Scholar] [CrossRef]
- Murthy, C.S.; Raju, P.V.; Badrinath, K.V.S. Classification of wheat crop with multi-temporal images: Performance of maximum likelihood and artificial neural networks. Int. J. Remote Sens. 2003, 24, 4871–4890. [Google Scholar] [CrossRef]
- Forkuor, G.; Dimobe, K.; Serme, I.; Tondoh, J.E. Landsat-8 vs. Sentinel-2: Examining the added value of sentinel-2′s red-edge bands to land-use and land-cover mapping in Burkina Faso. GISci. Remote Sens. 2018, 55, 331–354. [Google Scholar] [CrossRef]
- Csillik, O.; Belgiu, M.; Asner, G.P.; Kelly, M. Object-Based Time-Constrained Dynamic Time Warping Classification of Crops Using Sentinel-2. Remote Sens. 2019, 11, 1257. [Google Scholar] [CrossRef]
- Volpi, M.; Petropoulos, G.P.; Kanevski, M. Flooding extent cartography with Landsat TM imagery and regularized kernel Fisher’s discriminant analysis. Comput. Geosci. 2013, 57, 24–31. [Google Scholar] [CrossRef]
- Kyriou, A.; Nikolakopoulos, K. Flood mapping from Sentinel-1 and Landsat-8 data: A case study from river Evros, Greece. In Proceedings of the Earth Resources and Environmental Remote Sensing/GIS Applications VI; Michel, U., Schulz, K., Ehlers, M., Nikolakopoulos, K.G., Civco, D., Eds.; SPIE: Toulouse, France, 2015; Volume 9644, p. 964405. [Google Scholar]
- Singh, K.V.; Setia, R.; Sahoo, S.; Prasad, A.; Pateriya, B. Evaluation of NDWI and MNDWI for assessment of waterlogging by integrating digital elevation model and groundwater level. Geocarto Int. 2015, 30, 650–661. [Google Scholar] [CrossRef]
- Baig, M.H.A.; Zhang, L.; Wang, S.; Jiang, G.; Lu, S.; Tong, Q. Comparison of MNDWI and DFI for water mapping in flooding season. In Proceedings of the International Geoscience and Remote Sensing Symposium (IGARSS), Melbourne, Australia, 21–26 July 2013; pp. 2876–2879. [Google Scholar]
- Zhou, W.; Li, Z.; Ji, S.; Hua, C.; Fan, W. A new index model NDVI-MNDWI for water object extraction in hybrid area. In International Conference on Geo-Informatics in Resource Management and Sustainable Ecosystem; Springer: Berlin/Heidelberg, Germany, 2015; Volume 482, pp. 513–519. [Google Scholar]
- Medeiros, F.N.S.; Mascarenhas, N.D.A.; Costa, L.F. Evaluation of speckle noise MAP filtering algorithms applied to SAR images. Int. J. Remote Sens. 2003, 24, 5197–5218. [Google Scholar] [CrossRef]
- Xiao, J.; Li, J.; Moody, A. A detail-preserving and flexible adaptive filter for speckle suppression in SAR imagery. Int. J. Remote Sens. 2003, 24, 2451–2465. [Google Scholar] [CrossRef]
- Kushwaha, S.P.S.; Dwivedi, R.S.; Rao, B.R.M. Evaluation of various digital image processing techniques for detection of coastal wetlands using ERS-1 SAR data. Int. J. Remote Sens. 2000, 21, 143–1161. [Google Scholar] [CrossRef]
- Agnihotri, A.K.; Ohri, A.; Gaur, S.; Shivam; Das, N.; Mishra, S. Flood inundation mapping and monitoring using SAR data and its impact on Ramganga River in Ganga basin. Environ. Monit. Assess. 2019, 191, 1–16. [Google Scholar] [CrossRef] [PubMed]
- Tsyganskaya, V.; Martinis, S.; Marzahn, P.; Ludwig, R. Detection of Temporary Flooded Vegetation Using Sentinel-1 Time Series Data. Remote Sens. 2018, 10, 1286. [Google Scholar] [CrossRef]
- Whyte, A.; Ferentinos, K.P.; Petropoulos, G.P. A new synergistic approach for monitoring wetlands using Sentinels -1 and 2 data with object-based machine learning algorithms. Environ. Model. Softw. 2018, 104, 40–54. [Google Scholar] [CrossRef]
- Liang, J.; Liu, D. Estimating daily inundation probability using remote sensing, riverine flood, and storm surge models: A case of hurricane harvey. Remote Sens. 2020, 12, 1495. [Google Scholar] [CrossRef]
- Huang, C.; Chen, Y.; Wu, J.; Chen, Z.; Li, L.; Liu, R.; Yu, J. Integration of remotely sensed inundation extent and high-precision topographic data for mapping inundation depth. In Proceedings of the 2014 The 3rd International Conference on Agro-Geoinformatics, Agro-Geoinformatics 2014, Beijing, China, 11–14 August 2014; Institute of Electrical and Electronics Engineers Inc.: Beijing, China, 2014. [Google Scholar]
- Cian, F.; Marconcini, M.; Ceccato, P.; Giupponi, C. Flood depth estimation by means of high-resolution SAR images and lidar data. Nat. Hazards Earth Syst. Sci. 2018, 18, 3063–3084. [Google Scholar] [CrossRef]
- Ben Khalfallah, C.; Saidi, S. Spatiotemporal floodplain mapping and prediction using HEC-RAS—GIS tools: Case of the Mejerda river, Tunisia. J. African Earth Sci. 2018, 142, 44–51. [Google Scholar] [CrossRef]
- Qi, H.; Altinakar, M.S. A GIS-based decision support system for integrated flood management under uncertainty with two dimensional numerical simulations. Environ. Model. Softw. 2011, 26, 817–821. [Google Scholar] [CrossRef]
- Ezzine, A.; Saidi, S.; Hermassi, T.; Kammessi, I.; Darragi, F.; Rajhi, H. Flood mapping using hydraulic modeling and Sentinel-1 image: Case study of Medjerda Basin, northern Tunisia. Egypt. J. Remote Sens. Sp. Sci. 2020. [Google Scholar] [CrossRef]
- Gkouma, A.; Zotou, I.; Bellos, V.; Karathanassi, V.; Tsihrintzis, V.A. Evaluating the performance of a hydrodynamic model using SAR images. In Proceedings of the 11th World Congress on Water Resources and Environment (EWRA 2019), Madrid, Spain, 25–29 June 2019; European Water Resources Association: Madrid, Spain, 2019; pp. 425–426. [Google Scholar]
- Hong Quang, N.; Tuan, V.A.; Thi Thu Hang, L.; Manh Hung, N.; Thi The, D.; Thi Dieu, D.; Duc Anh, N.; Hackney, C.R. Hydrological/Hydraulic Modeling-Based Thresholding of Multi SAR Remote Sensing Data for Flood Monitoring in Regions of the Vietnamese Lower Mekong River Basin. Water 2019, 12, 71. [Google Scholar] [CrossRef]
- Schumann, G.J.P.; Bates, P.D.; Neal, J.C.; Andreadis, K.M. Measuring and Mapping Flood Processes. In Hydro-Meteorological Hazards, Risks, and Disasters; John, F., Paron Giuliano, S.P., Baldassarre, D., Eds.; JAI-Elsevier Science Inc.: Boston, MA, USA, 2015; pp. 35–64. ISBN 9780123964700. [Google Scholar]
- Coveney, S.; Roberts, K. Lightweight UAV digital elevation models and orthoimagery for environmental applications: Data accuracy evaluation and potential for river flood risk modelling. Int. J. Remote Sens. 2017, 38, 3159–3180. [Google Scholar] [CrossRef]
Publisher’s Note: MDPI stays neutral with regard to jurisdictional claims in published maps and institutional affiliations. |
© 2020 by the authors. Licensee MDPI, Basel, Switzerland. This article is an open access article distributed under the terms and conditions of the Creative Commons Attribution (CC BY) license (http://creativecommons.org/licenses/by/4.0/).