Mapping the Melatonin Suppression, Star Light and Induced Photosynthesis Indices with the LANcube

 ,
,  ,
,
Abstract

1. Introduction
2. Materials and Methods
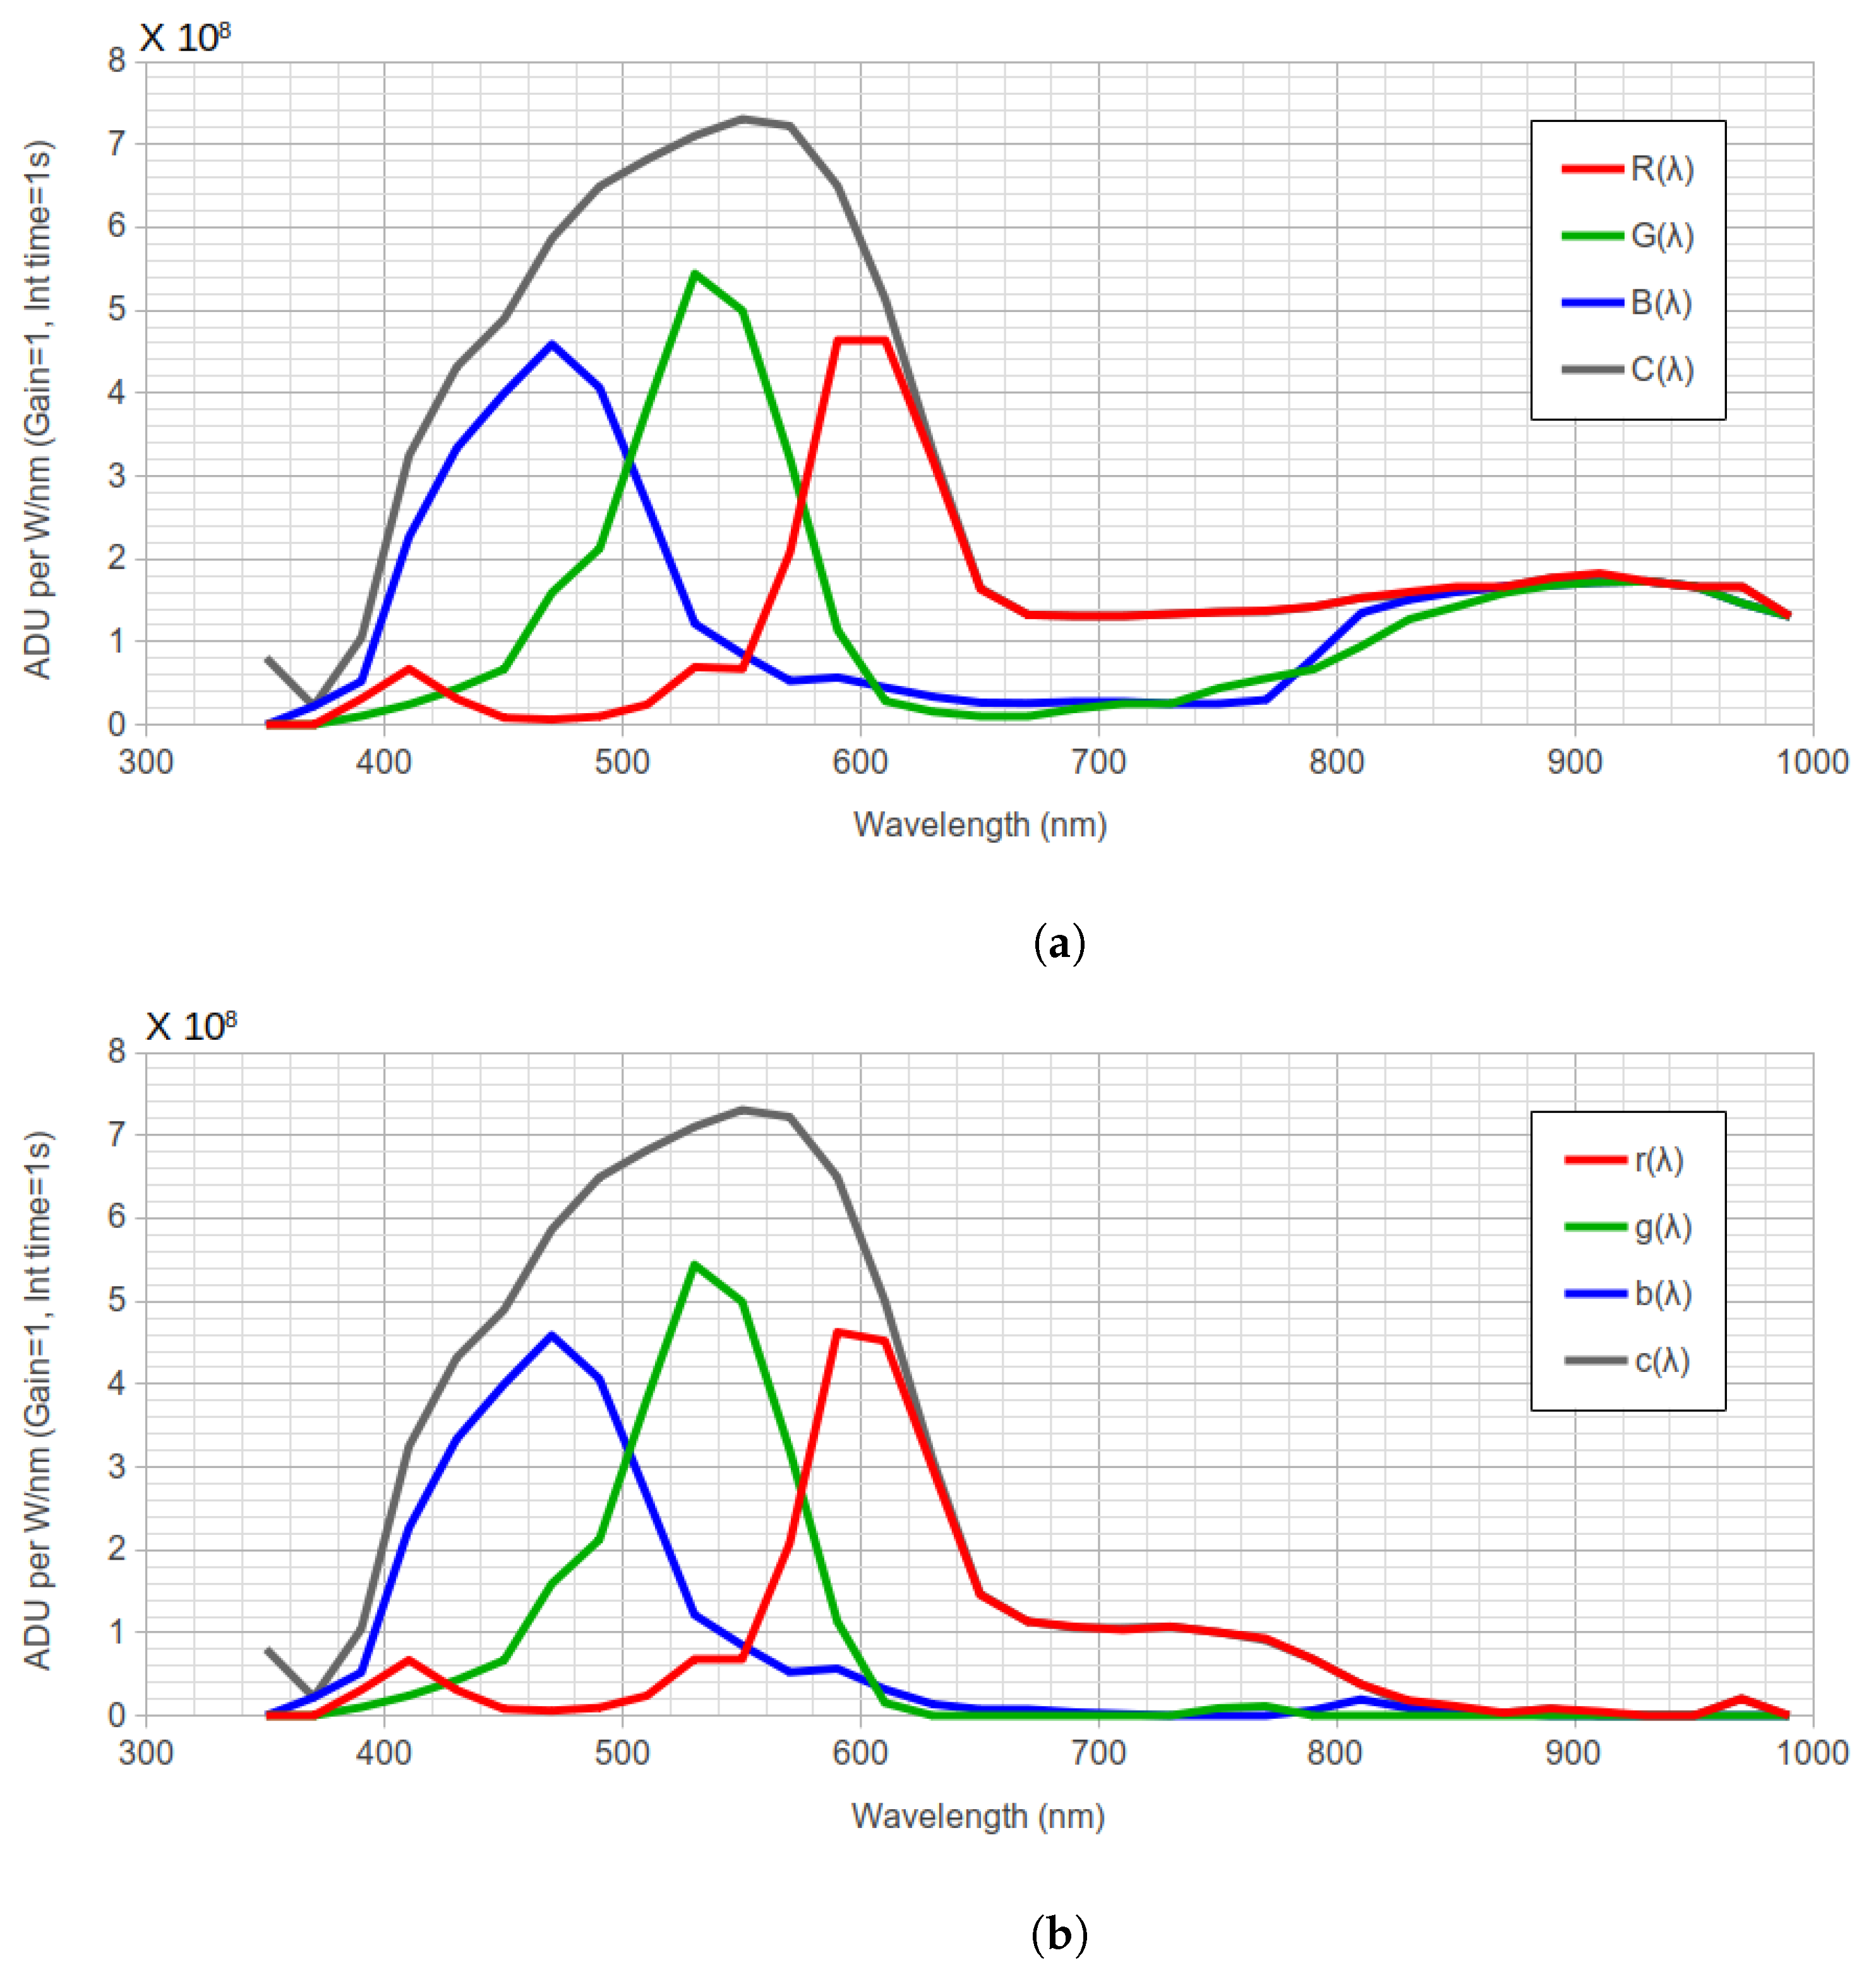
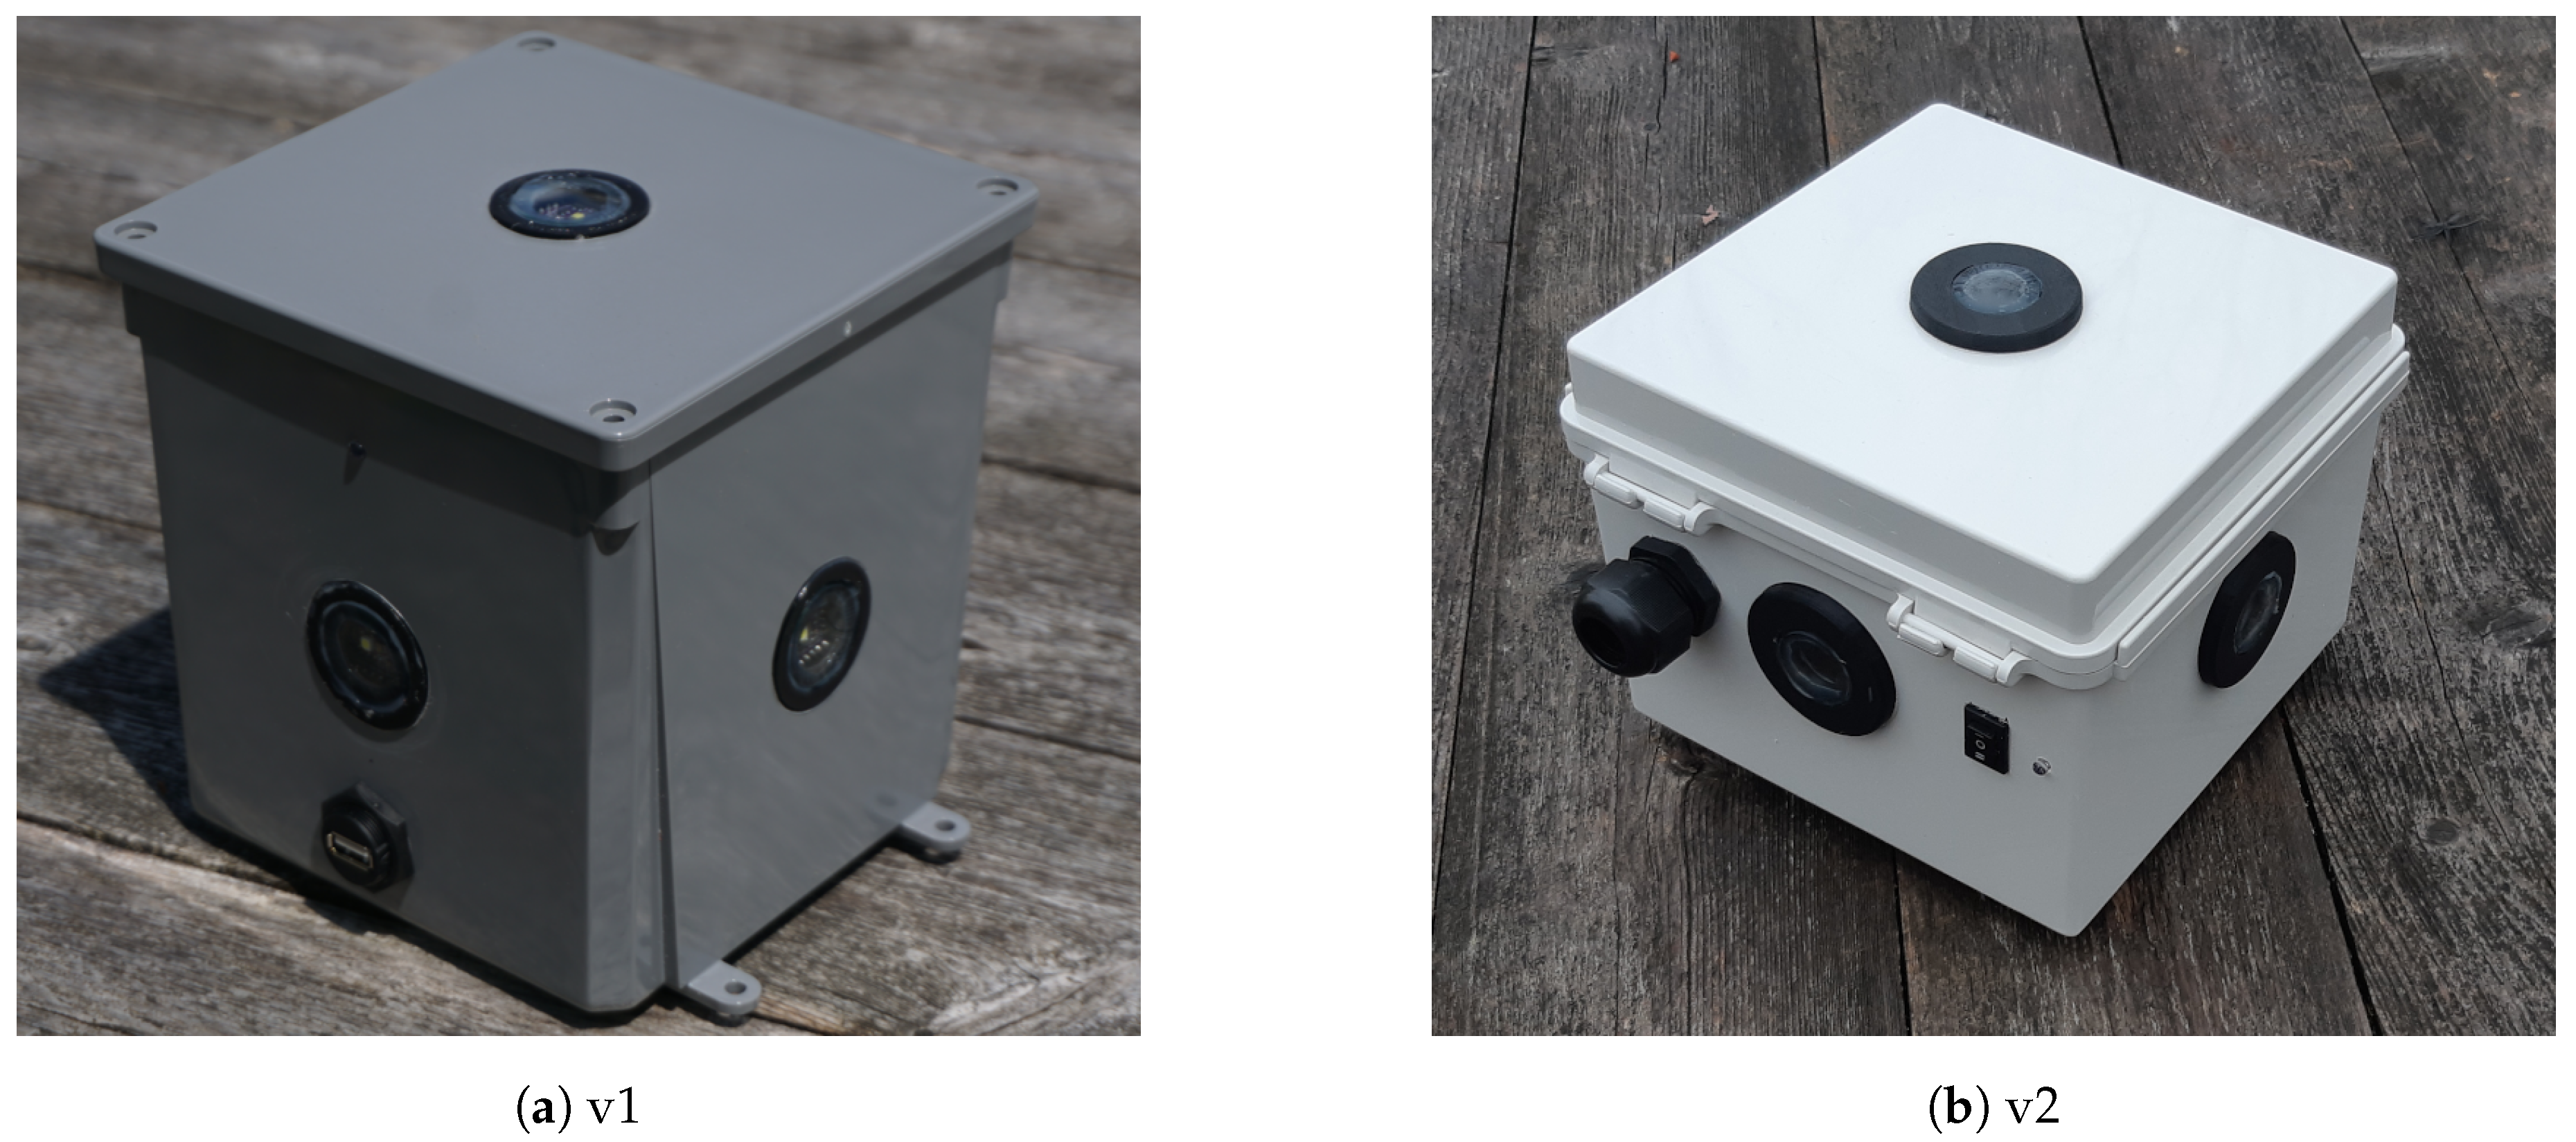
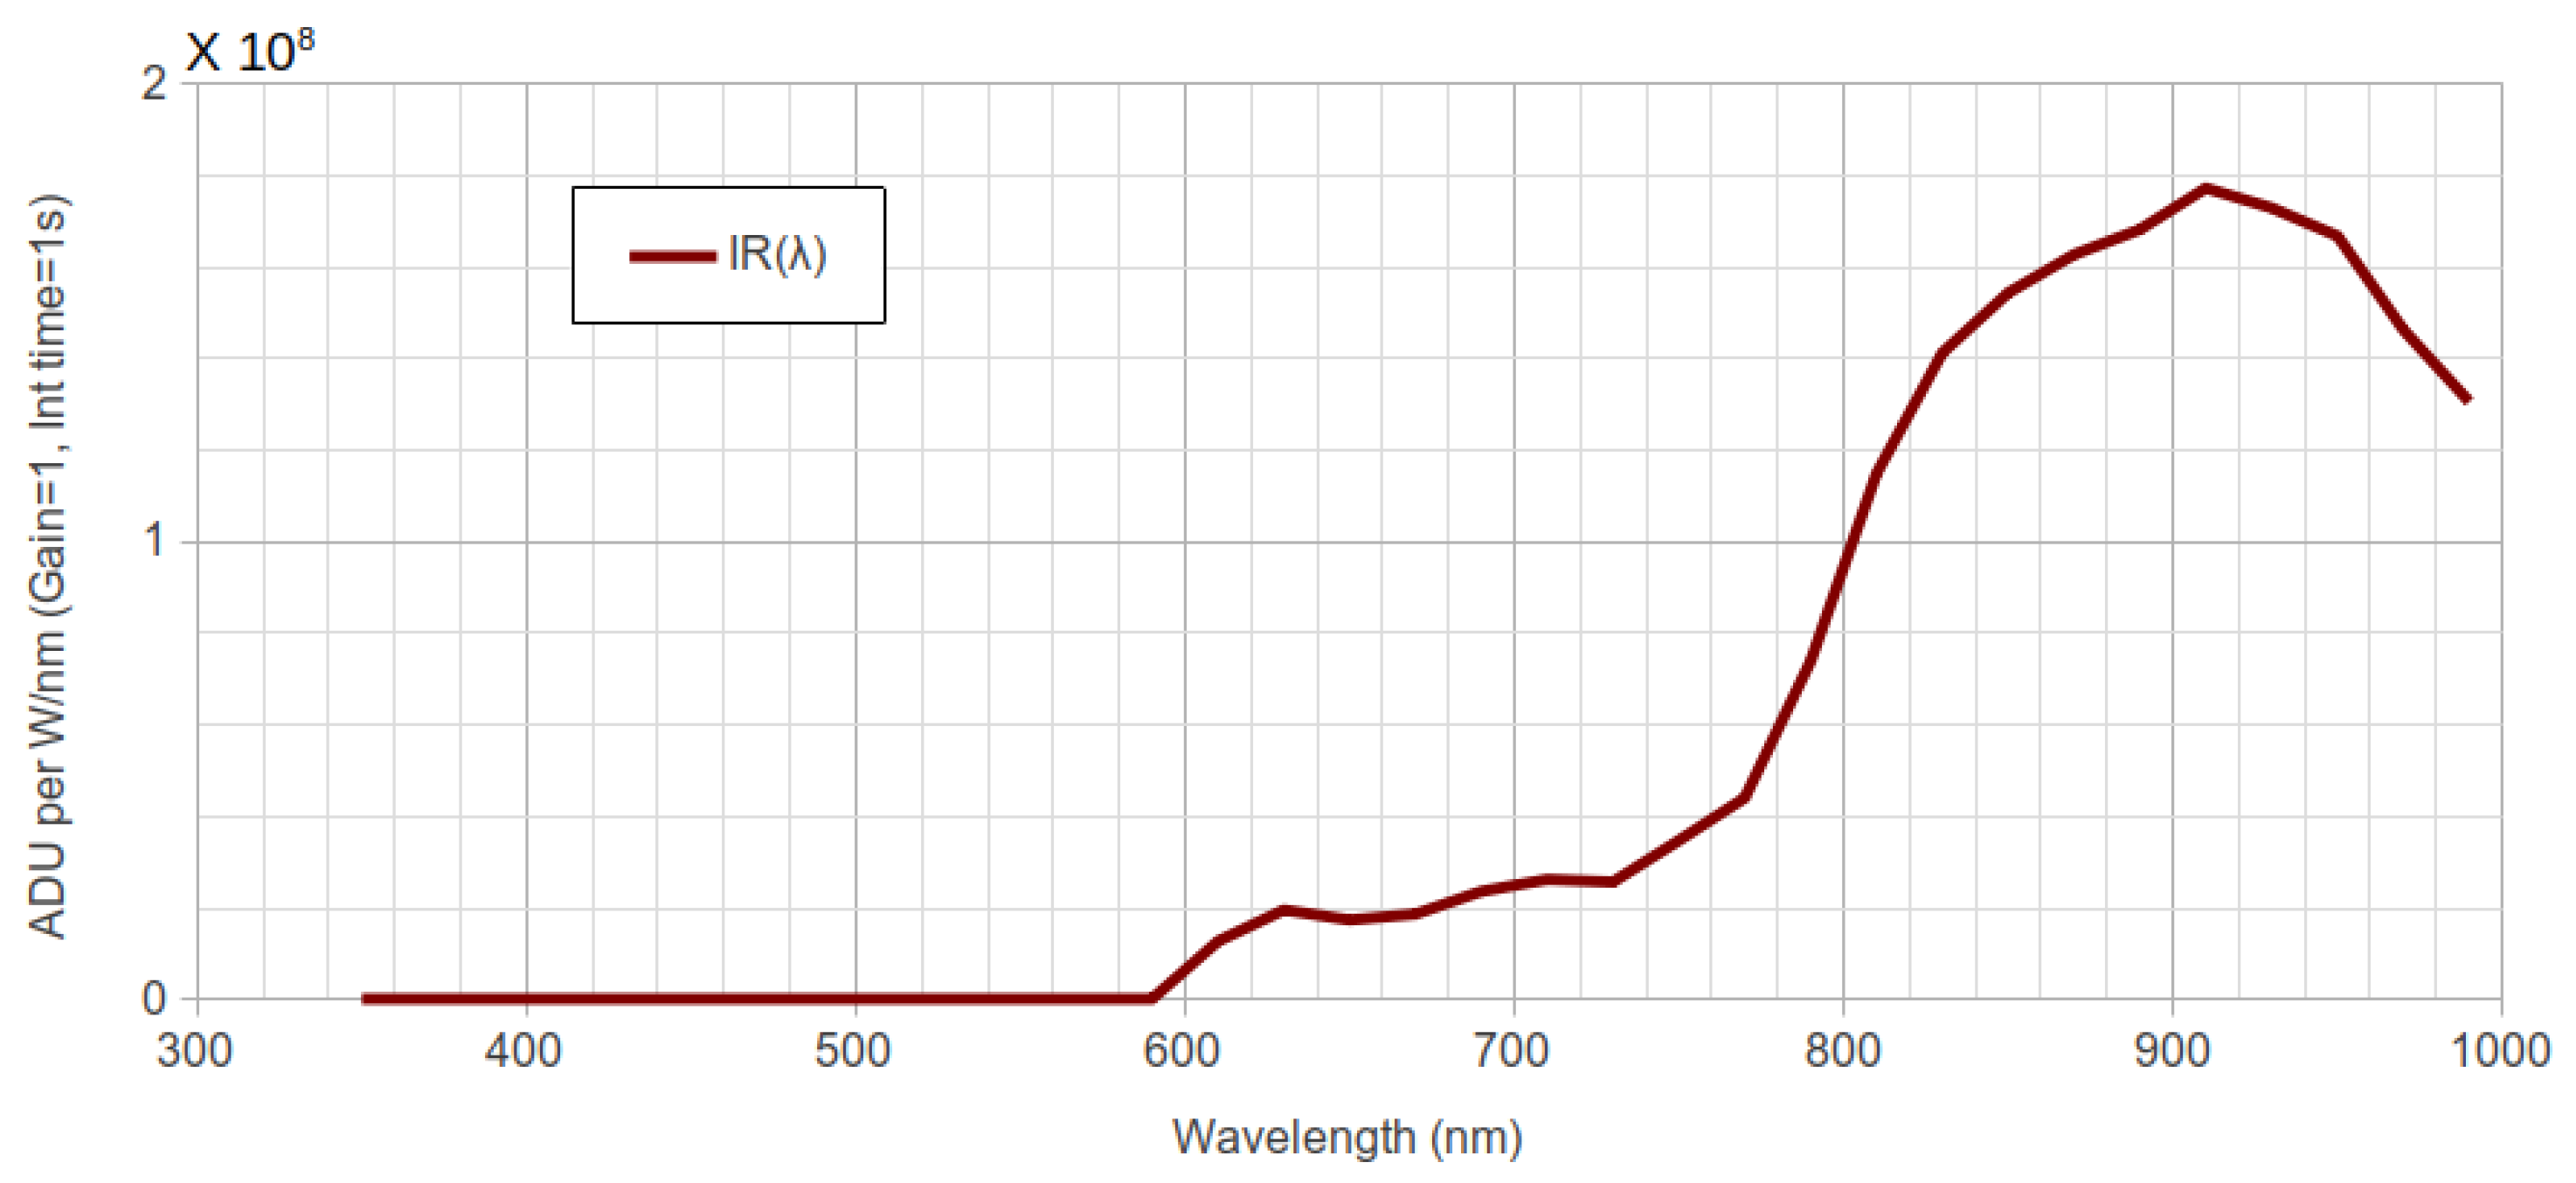
2.1. The LANcube System
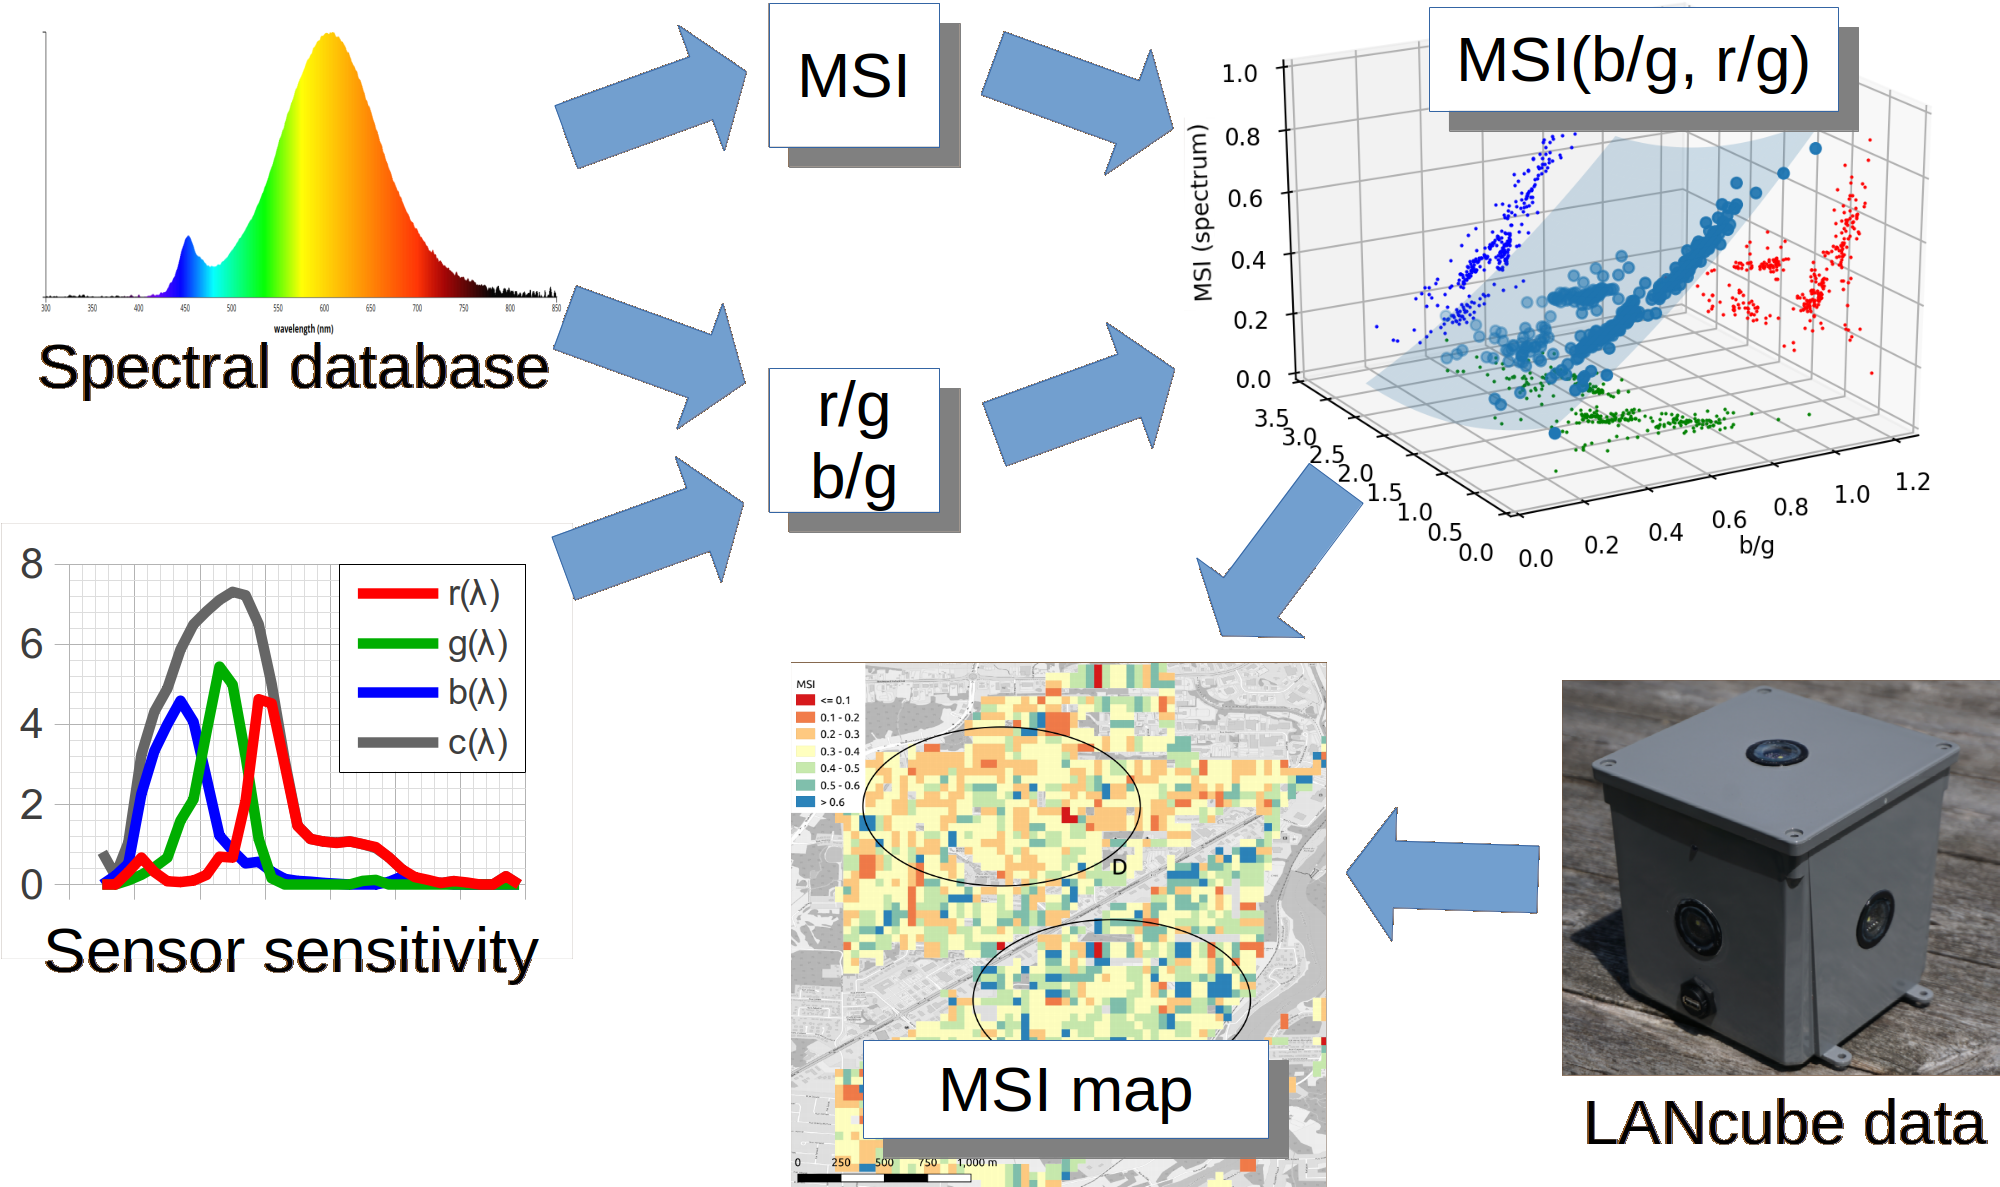
2.2. Synthetic Photometry
2.3. Calculation of the Indices from Spectral Data
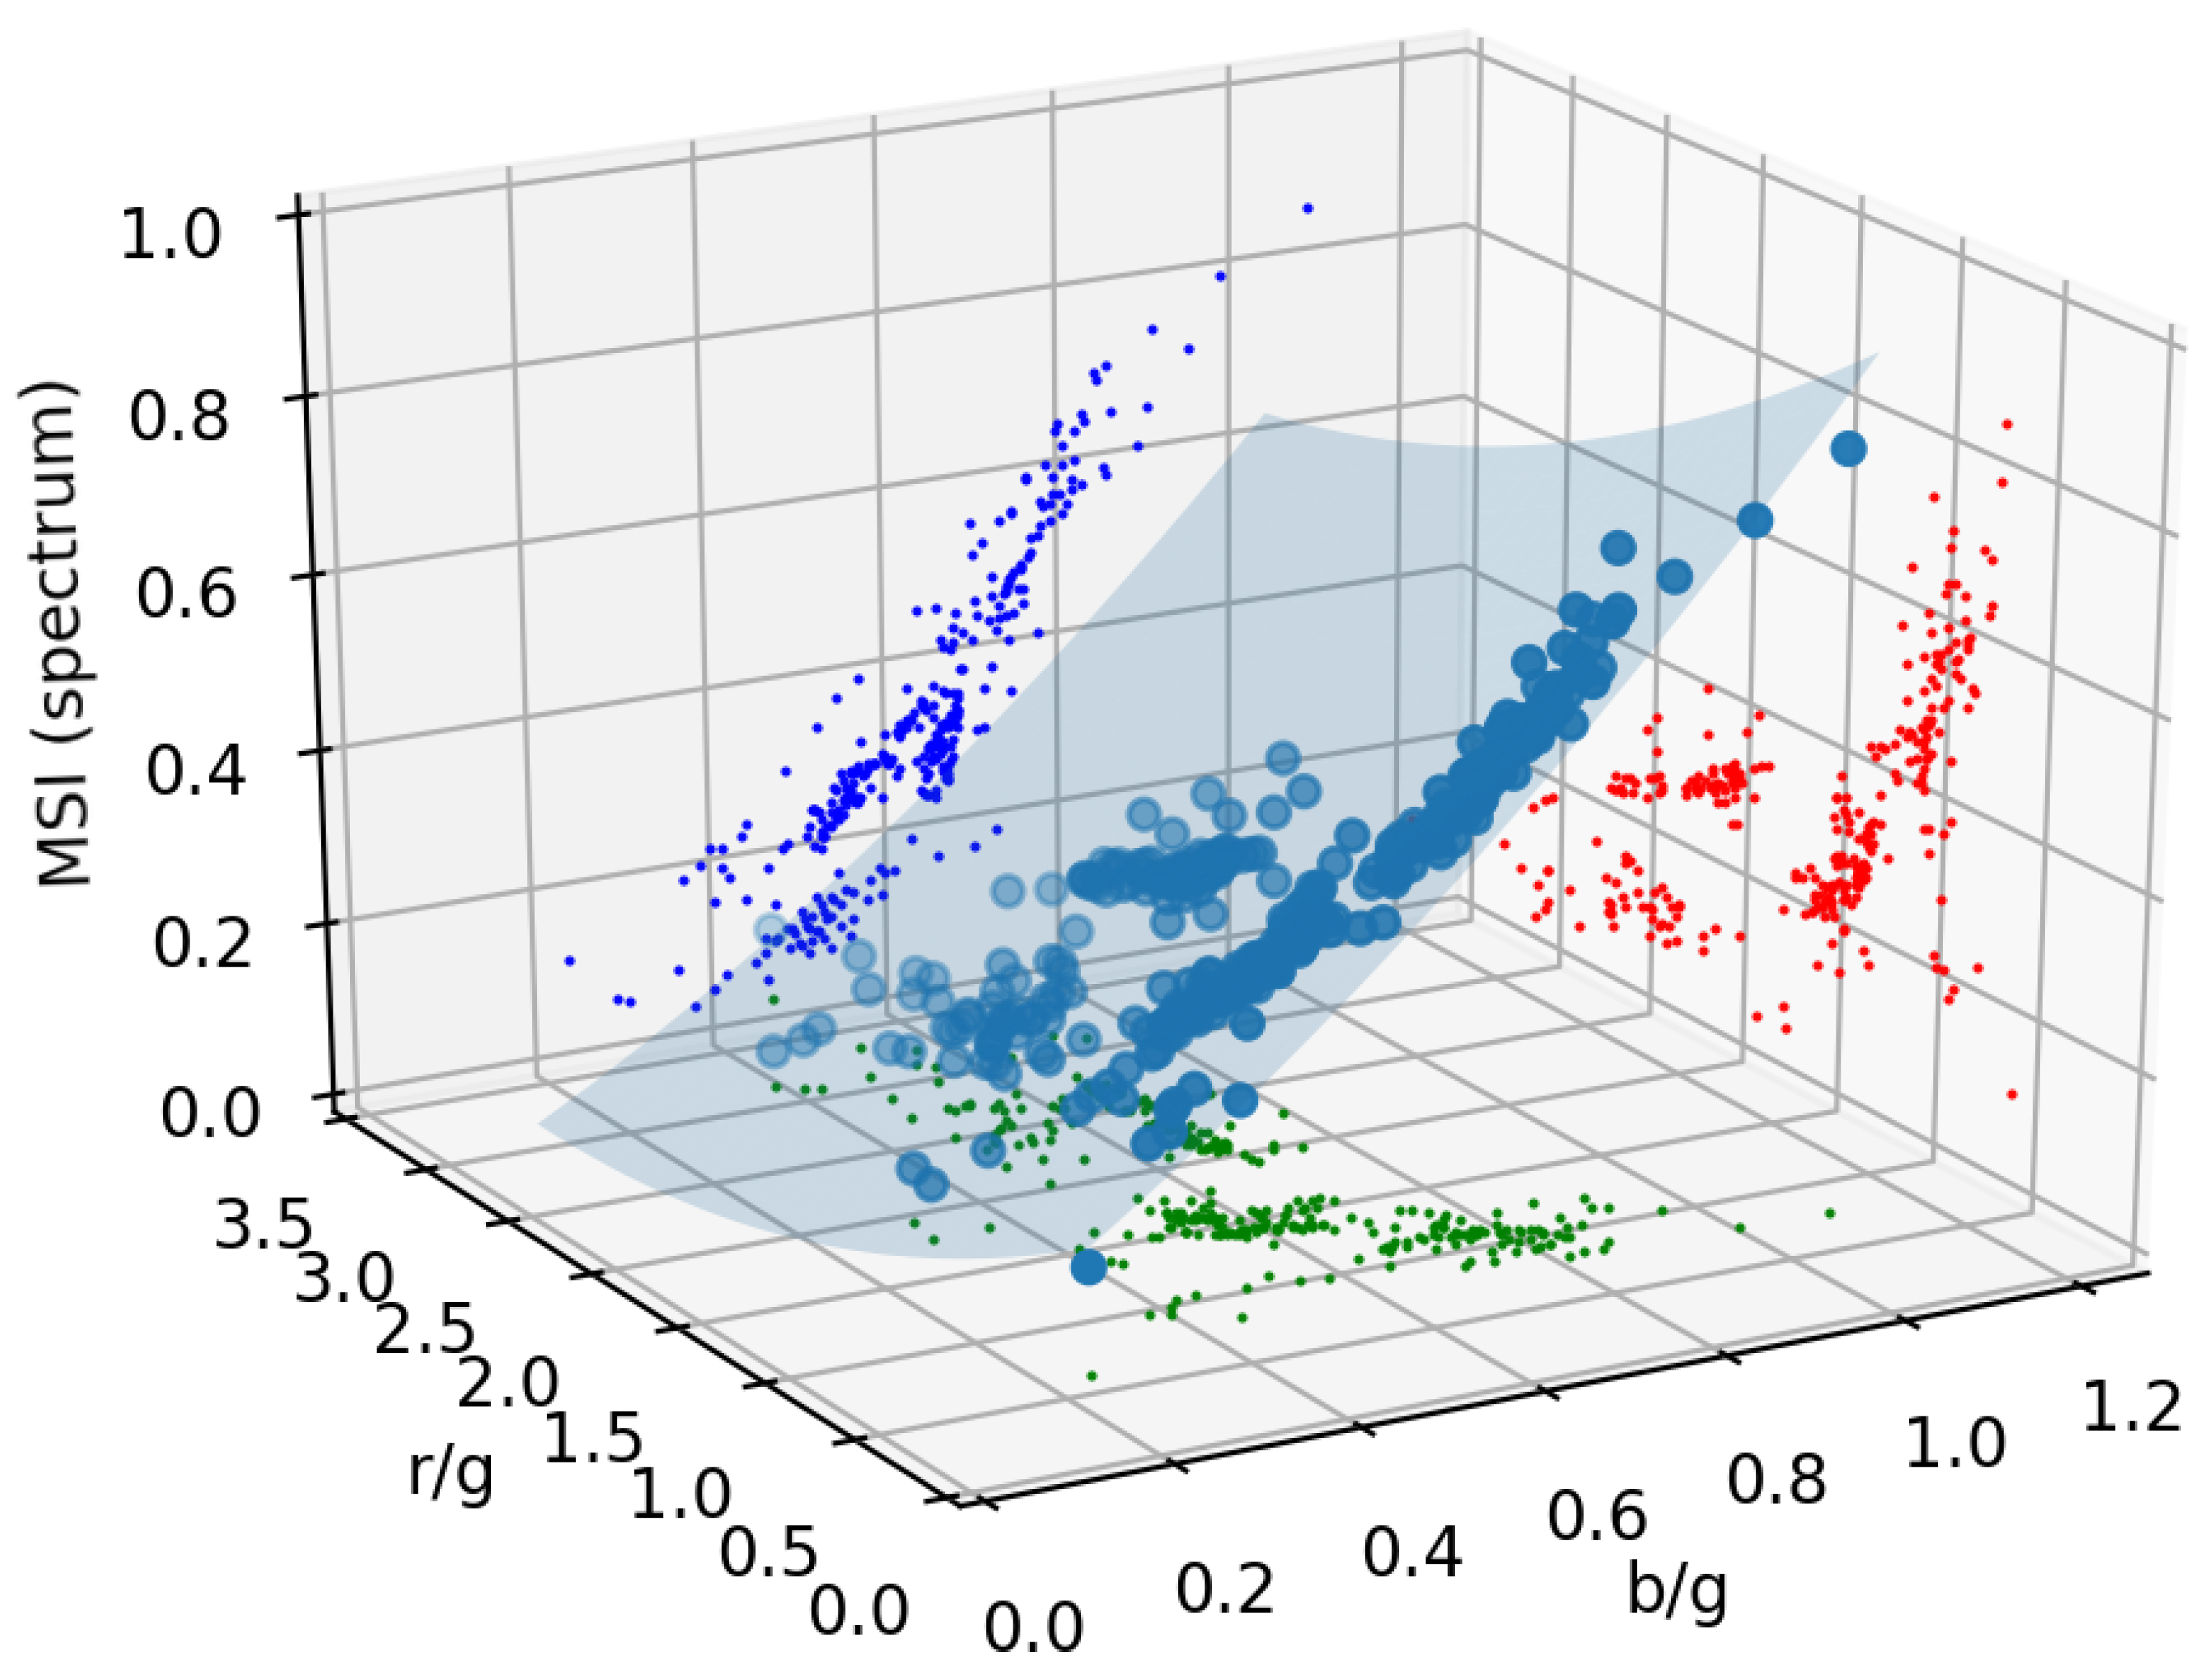
2.4. Fitting the Indices 3D Surface in the Space
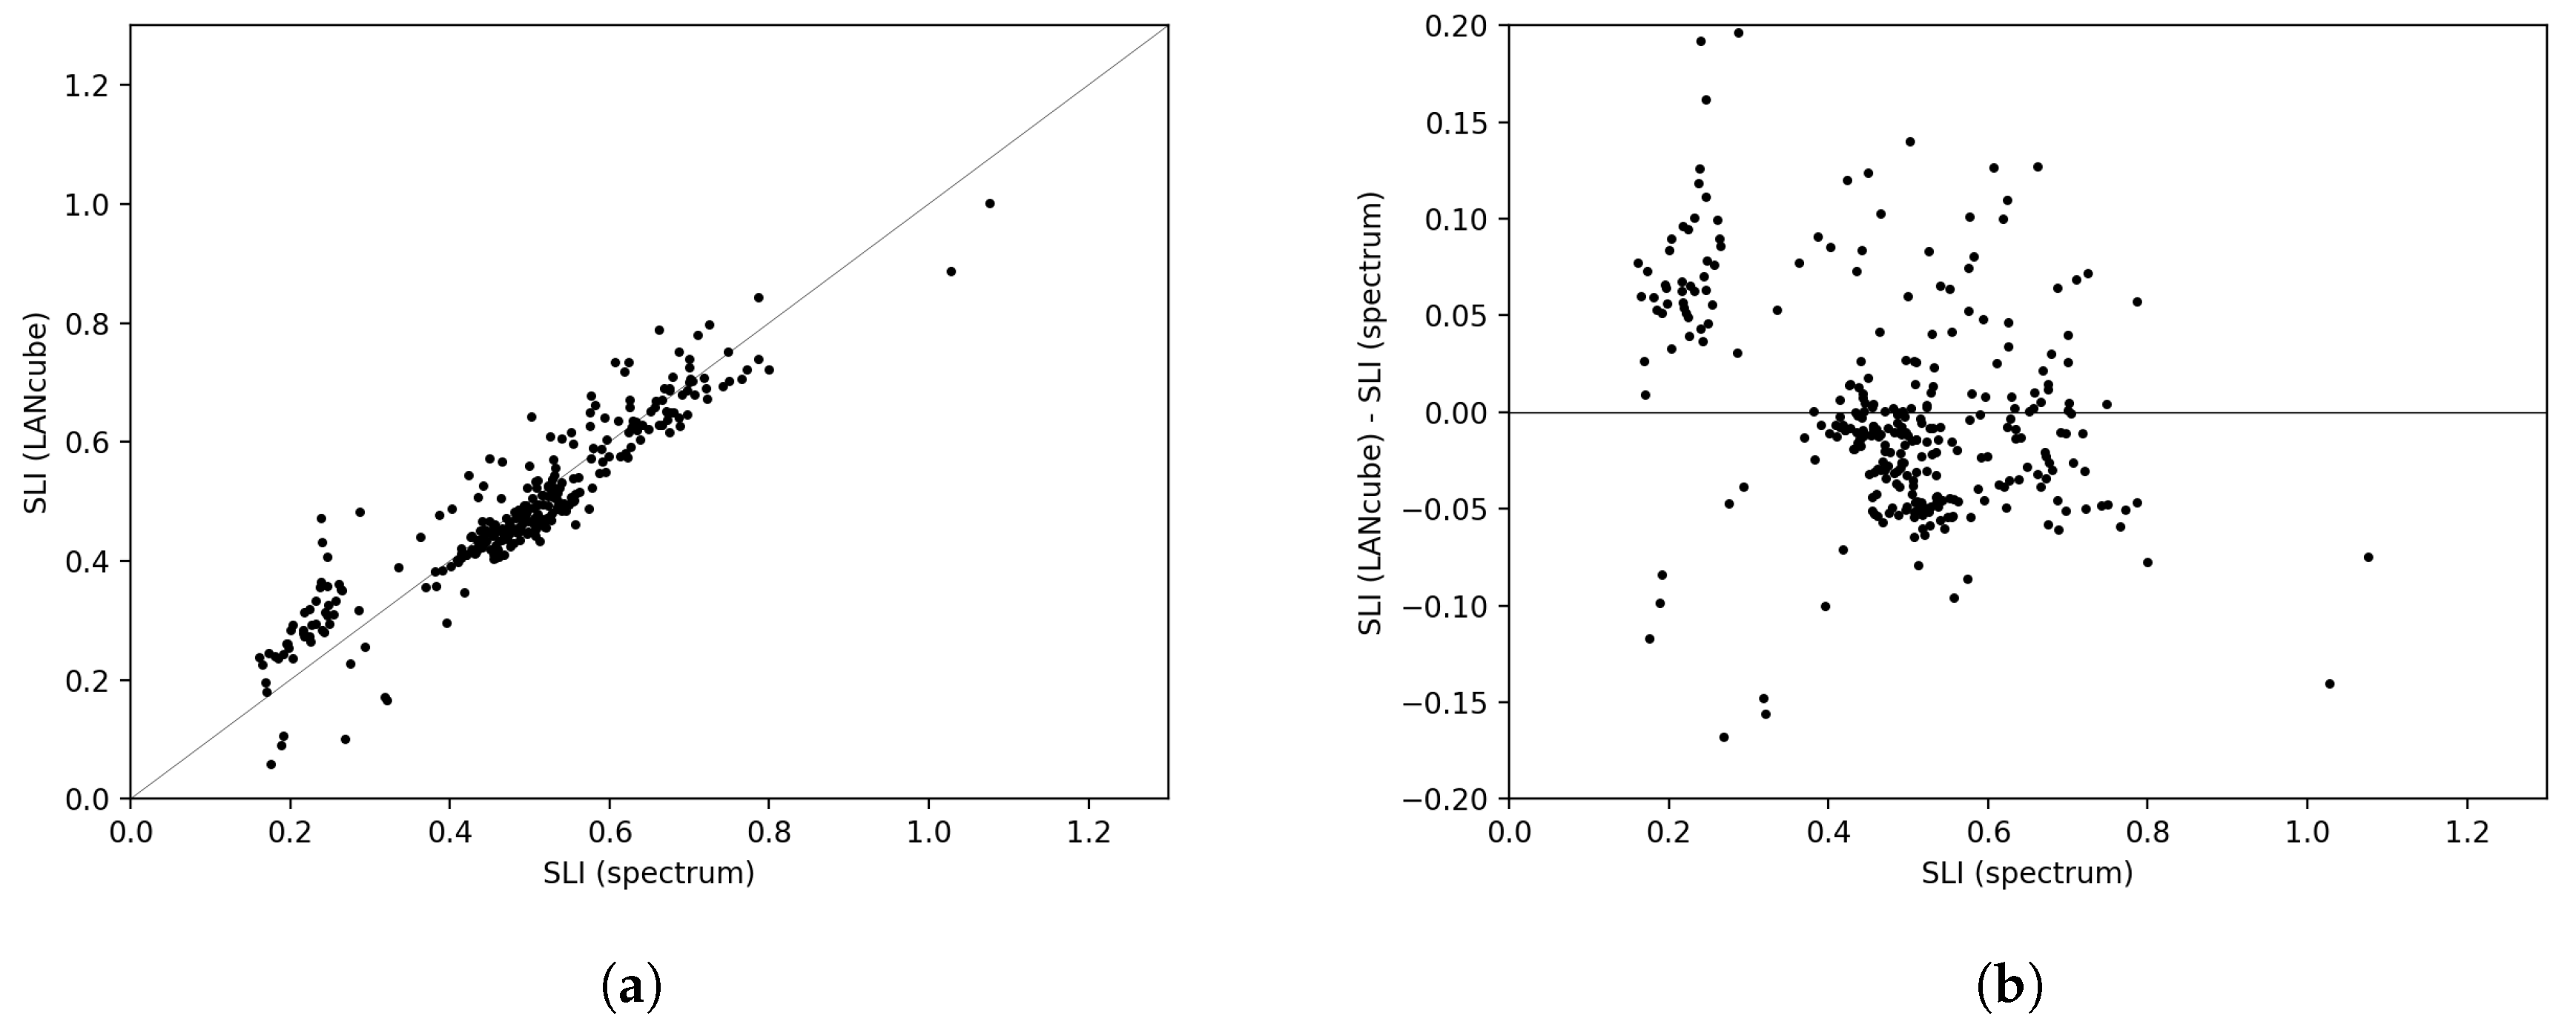
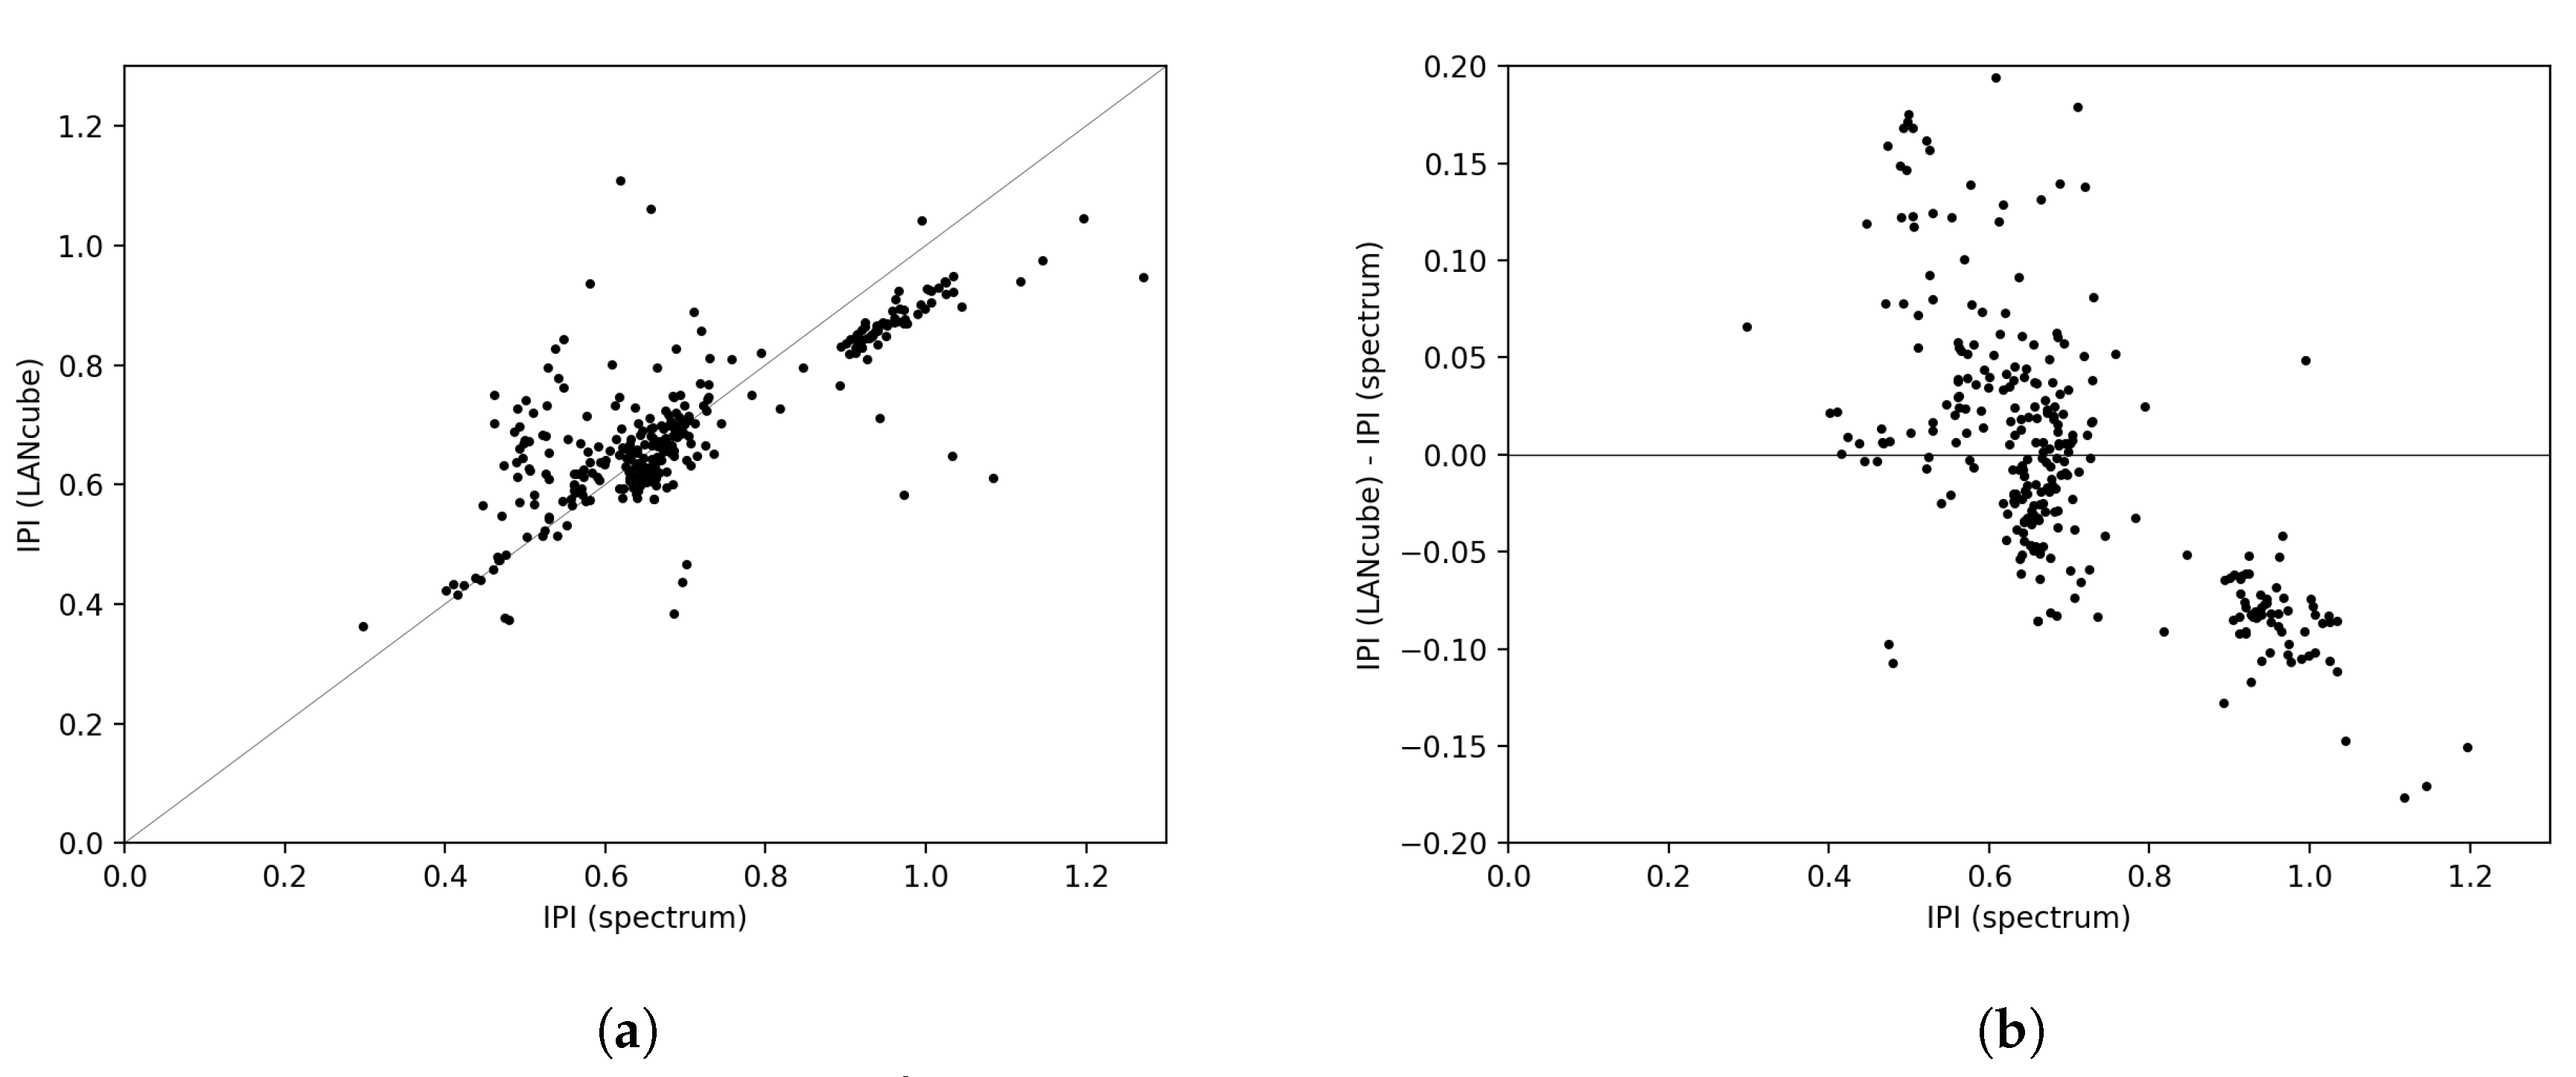
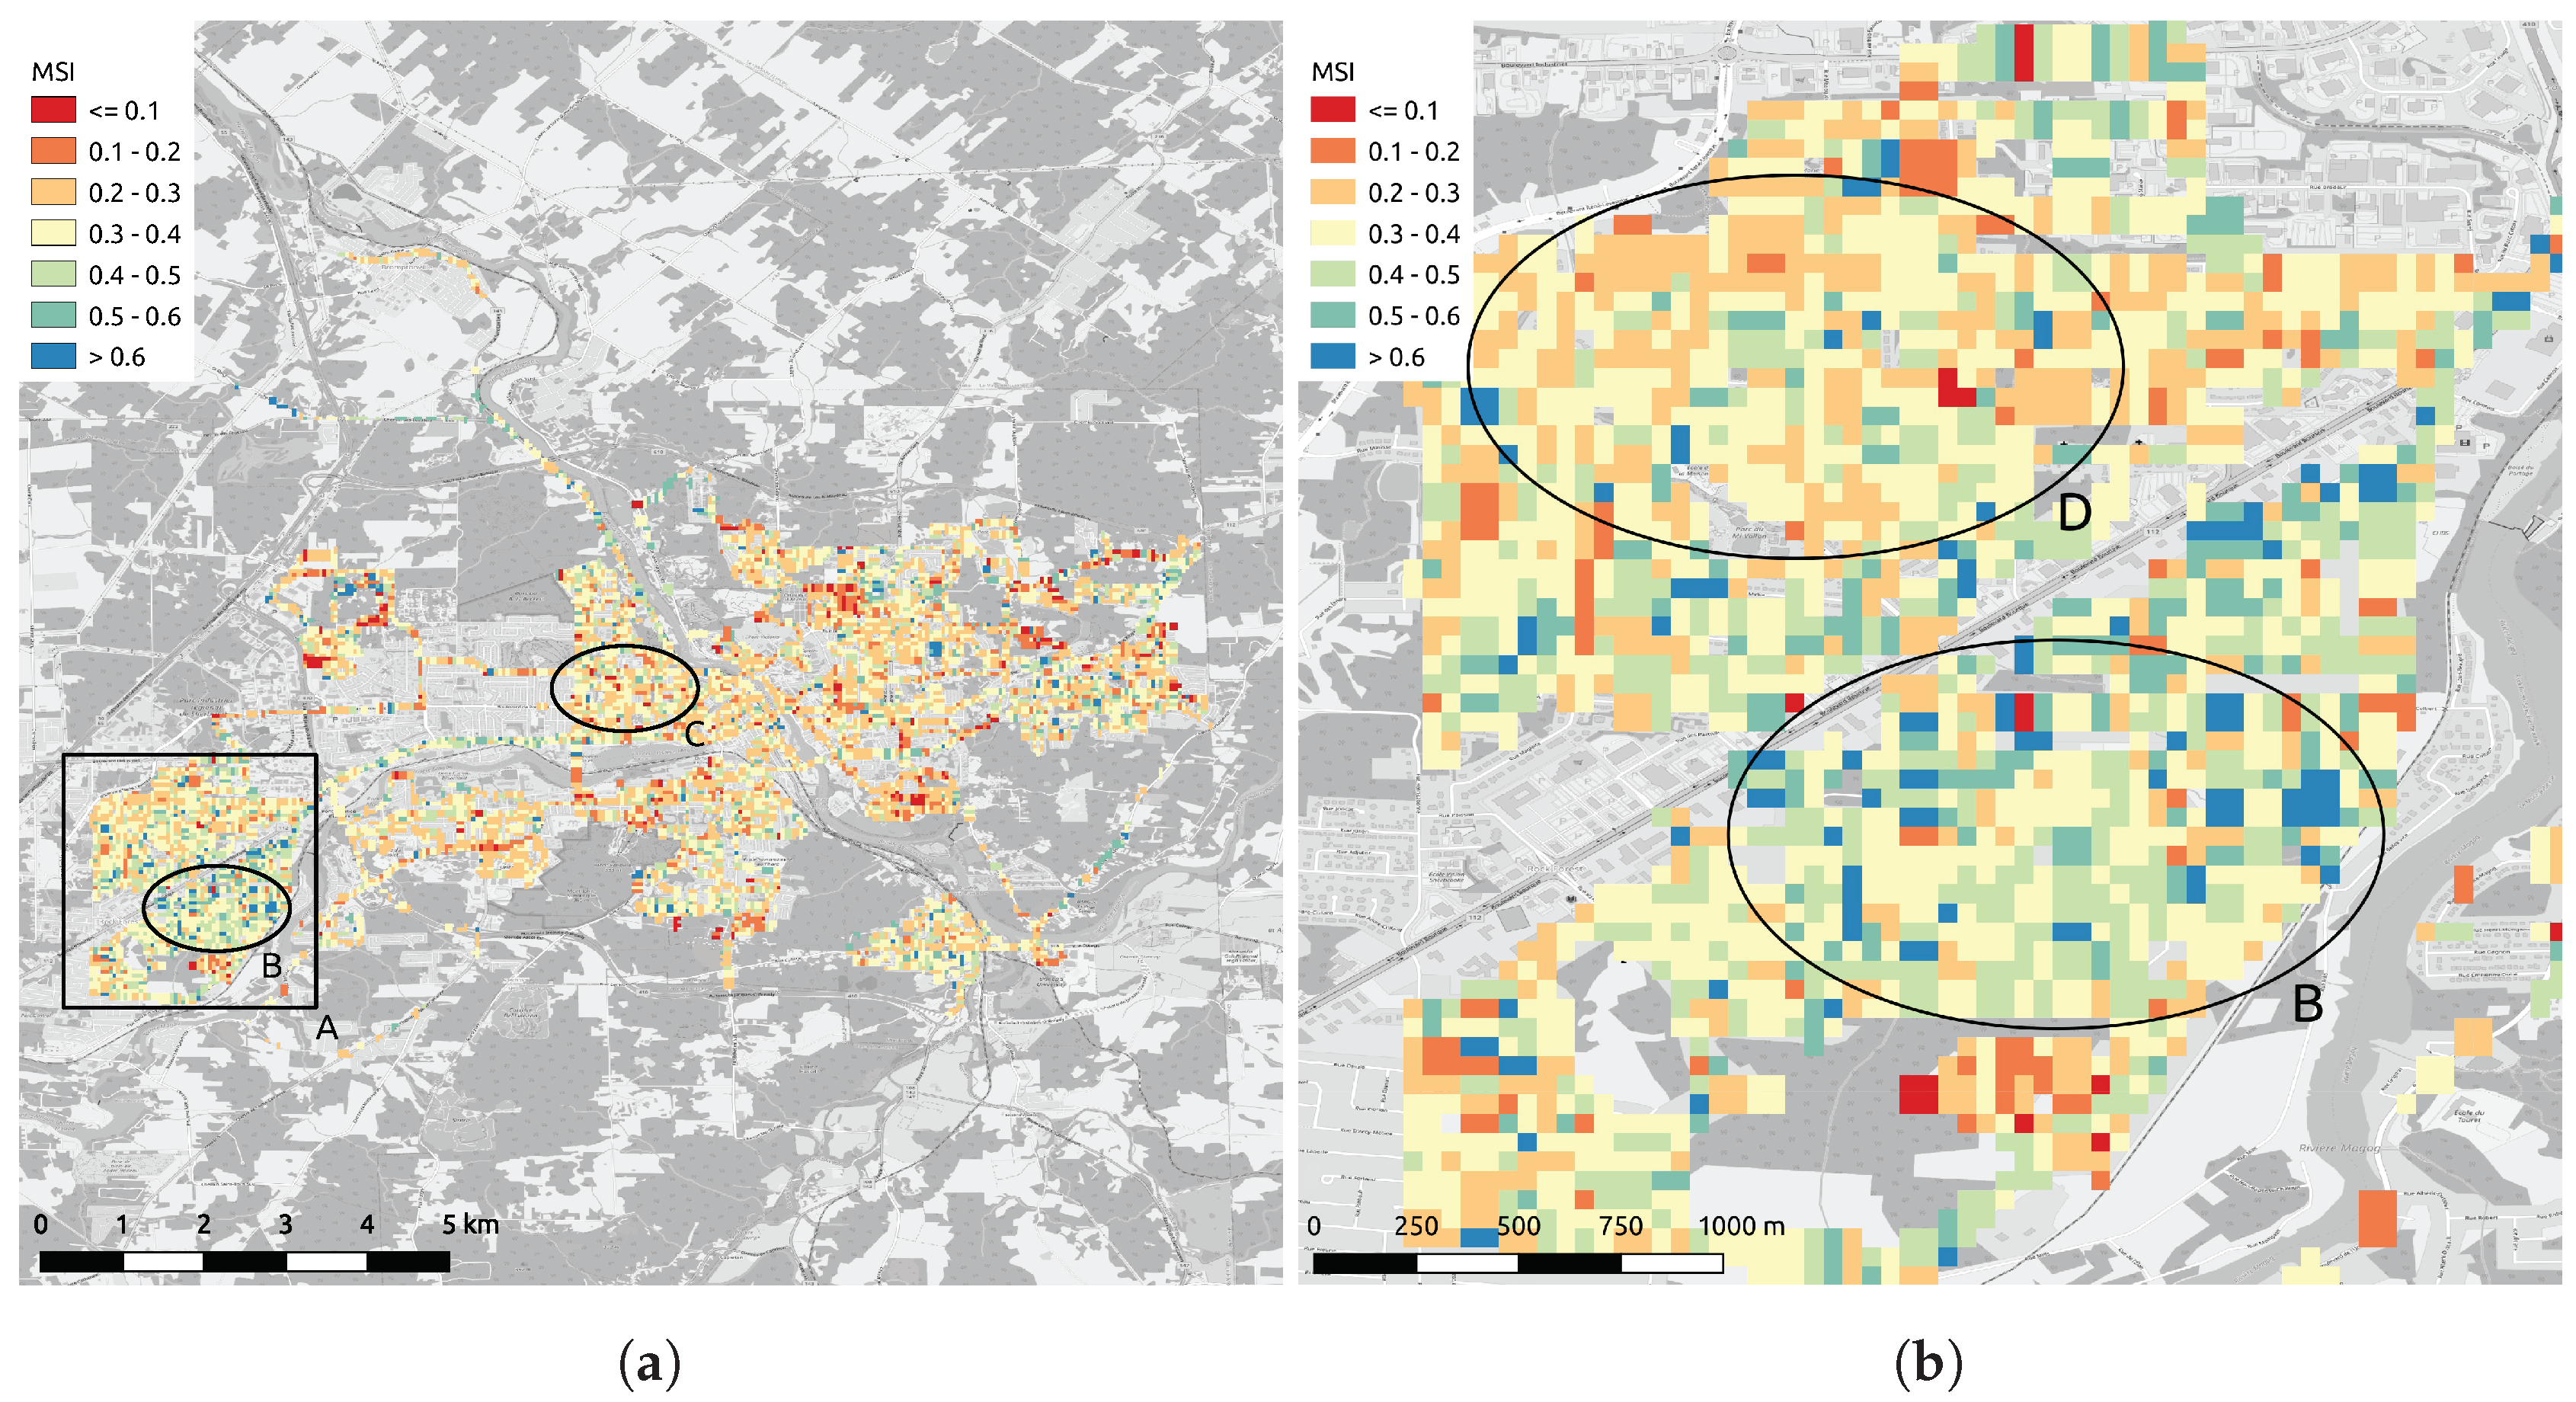
3. Results
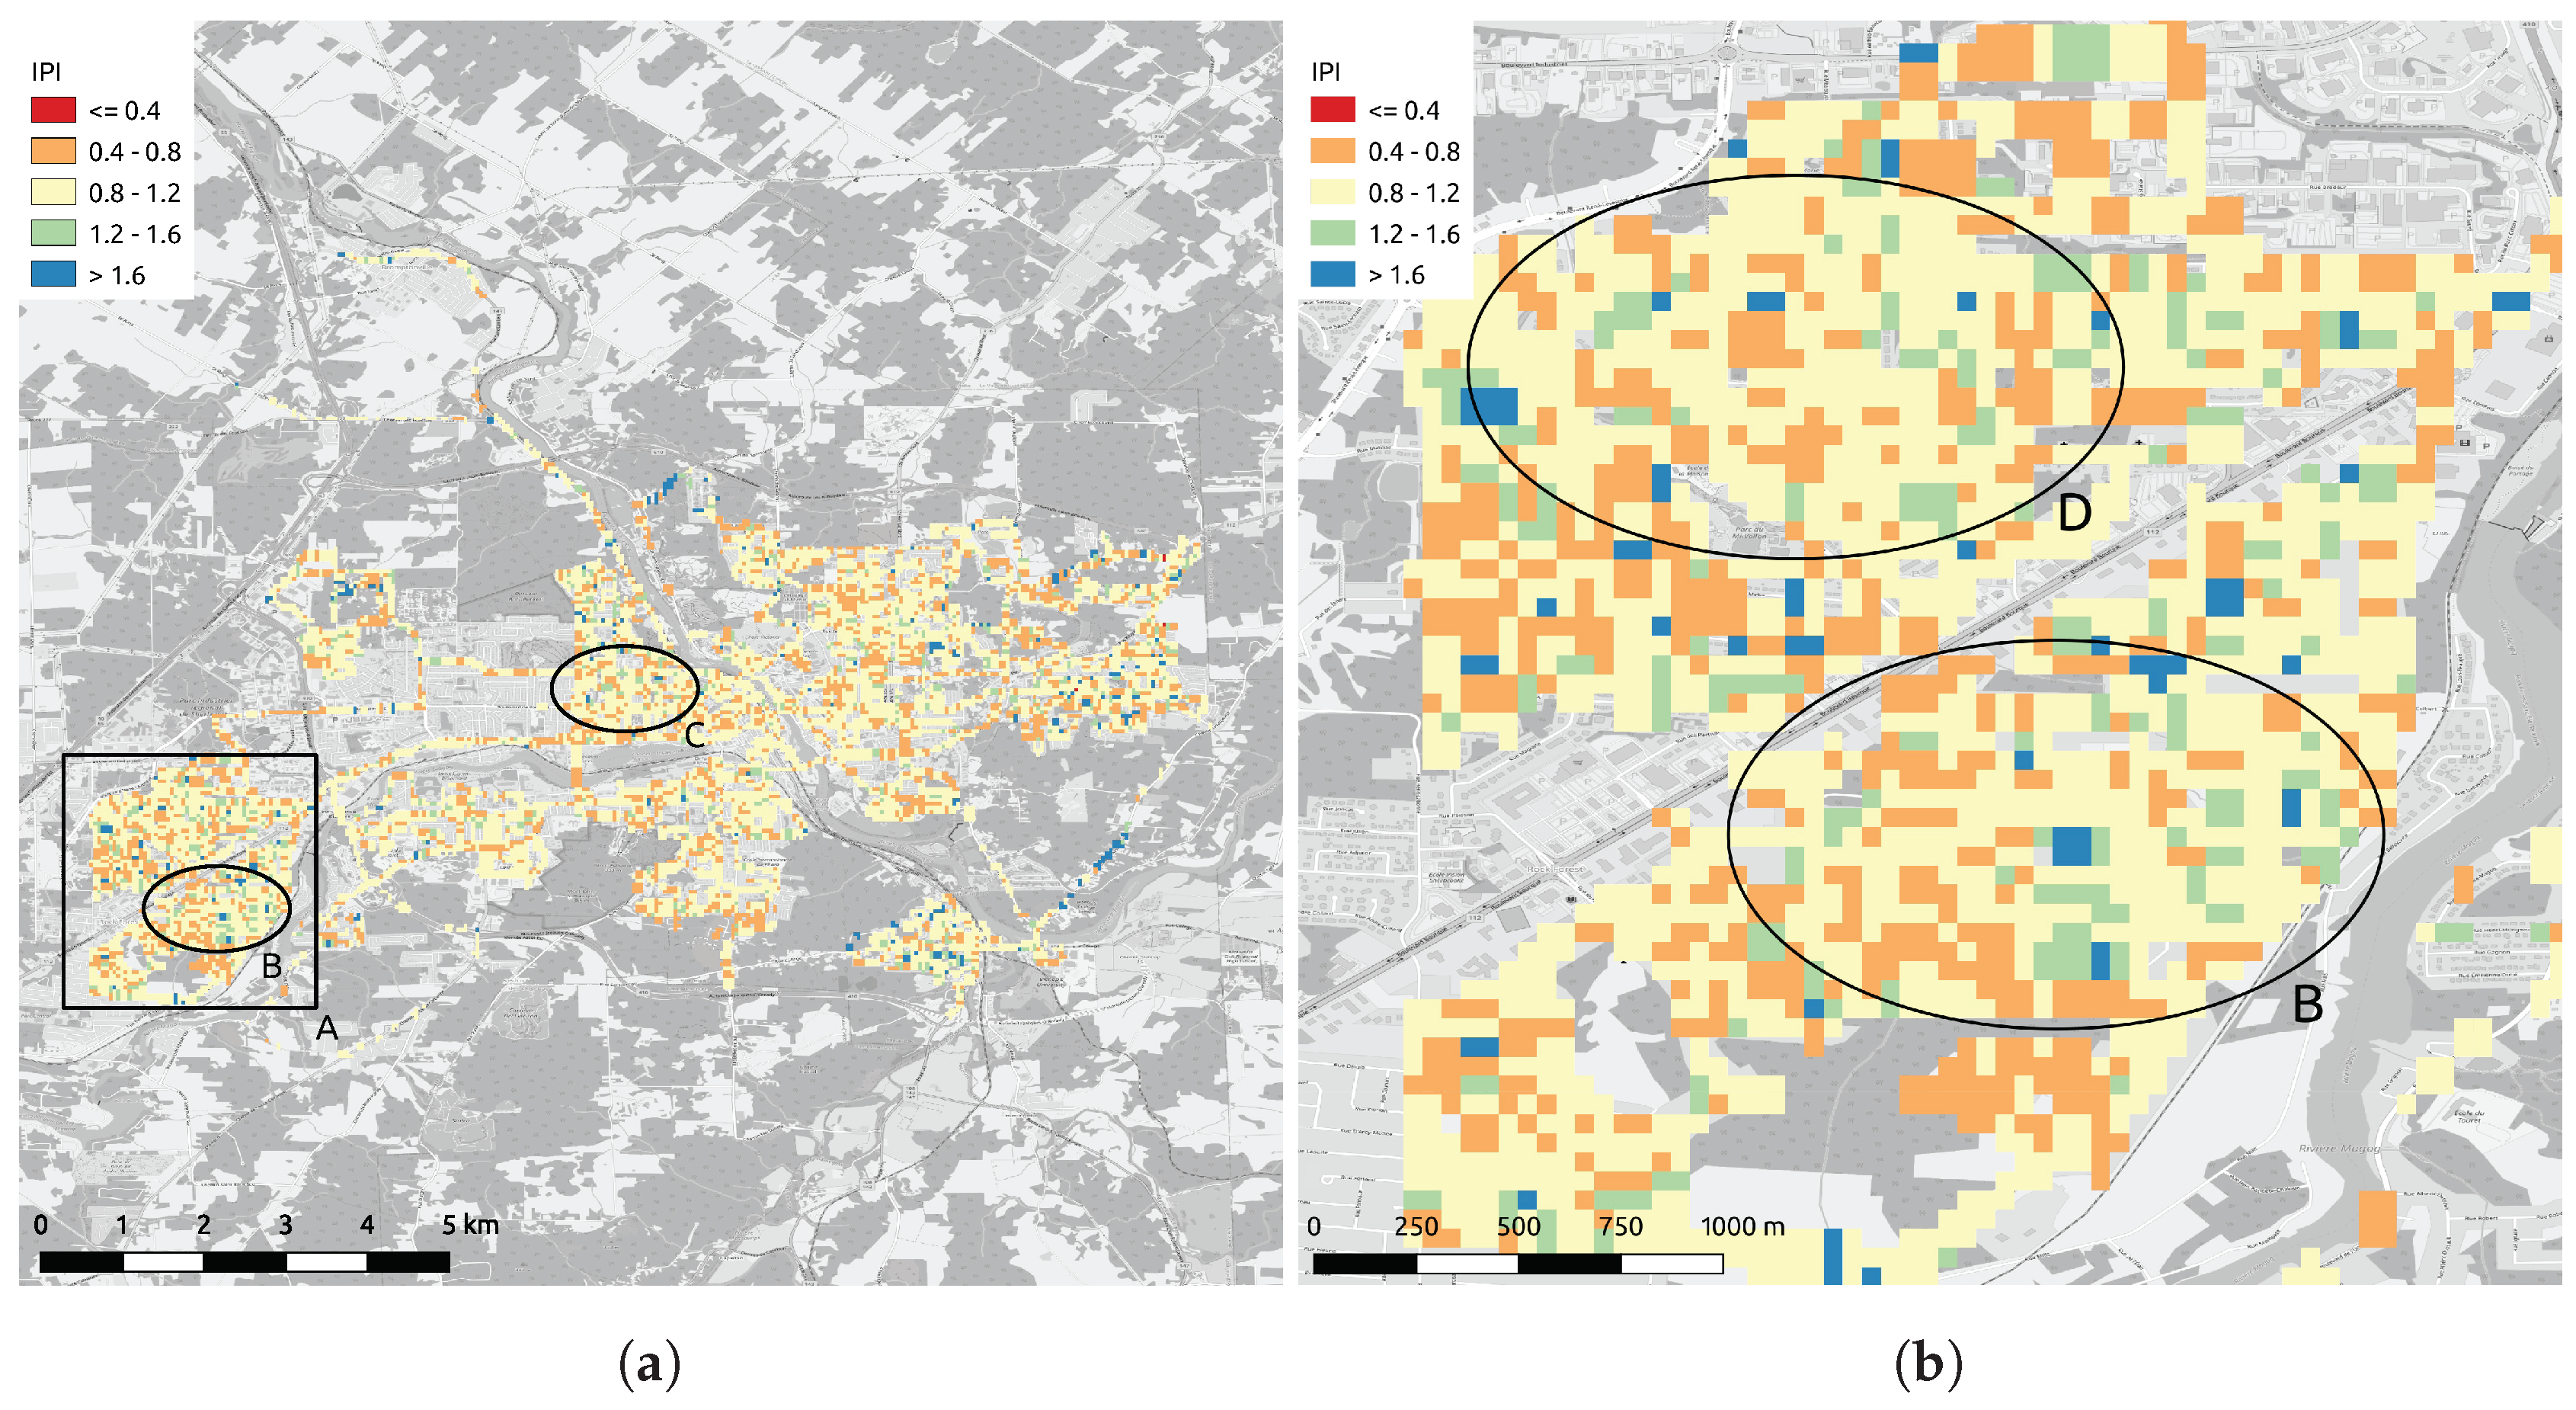
Maps of the MSI and SLI for Sherbrooke, Canada
4. Discussion and Conclusions
Author Contributions
Funding
Acknowledgments
Conflicts of Interest
Abbreviations
| ADU | Analog to Digital Unit |
| ALAN | Artificial Light at Night |
| CFL | Compact fluorescent |
| CIE | Commission Internationale de l’Éclairage |
| DALAN | Direct Artificial Light at Night |
| DSLR | Digital single-lens reflex camera |
| FRQNT | Fonds de recherche du Québec–Nature et technologies |
| GPS | Global Positioning System |
| HPS | High-Pressure Sodium |
| IPI | Induced Photosynthesis Index |
| LED | Light-Emitting Diode |
| LSPDD | Lamp Spectral Power Distribution Database |
| MSAS | Melatonin Suppression Action Spectrum |
| MSI | Melatonin Suppression Index |
| nm | nanometre |
| PAS | Photosynthesis Action Spectrum |
| PC | Phosphor Converted |
| PRESE | Pôle régional en enseignement supérieur de l’Estrie |
| SLI | Star Light Index |
| UPS | Uninterruptible Power Supply |
References
- Gaston, K.J.; Visser, M.E.; Hölker, F. The biological impacts of artificial light at night: The research challenge. Philos. Trans. R. Soc. B 2015, 370, 20140133. [Google Scholar] [CrossRef] [PubMed]
- Russart, K.L.G.; Nelson, R.J. Artificial light at night alters behavior in laboratory and wild animals. J. Exp. Zool. Part A Ecol. Integr. Physiol. 2018, 329, 401–408. [Google Scholar] [CrossRef] [PubMed]
- Briggs, W.R. Physiology of plant responses to artificial lighting. In Ecological Consequences of Artificial Night Lighting; Island Press: Washington, DC, USA, 2006; pp. 389–411. [Google Scholar]
- Riegel, K.W. Light pollution: Outdoor lighting is a growing threat to astronomy. Science 1973, 179, 1285–1291. [Google Scholar] [CrossRef] [PubMed]
- Cho, Y.; Ryu, S.H.; Lee, B.R.; Kim, K.H.; Lee, E.; Choi, J. Effects of artificial light at night on human health: A literature review of observational and experimental studies applied to exposure assessment. Chronobiol. Int. 2015, 39, 1294–1310. [Google Scholar] [CrossRef]
- Duffy, J.F.; Wright, K.P., Jr. Entrainment of the human circadian system by light. J. Biol. Rhythm. 2005, 20, 326–338. [Google Scholar] [CrossRef]
- Evans, J.A.; Davidson, A.J. Health consequences of circadian disruption in humans and animal models. Prog. Mol. Biol. Transl. Sci. 2013, 119, 283–323. [Google Scholar]
- Lockley, S.W.; Brainard, G.C.; Czeisler, C.A. High sensitivity of the human circadian melatonin rhythm to resetting by short wavelength light. J. Clin. Endocrinol. Metab. 2003, 88, 4502–4505. [Google Scholar] [CrossRef]
- Brainard, G.C.; Hanifin, J.P.; Greeson, J.M.; Byrne, B.; Glickman, G.; Gerner, E.; Rollag, M.D. Action spectrum for melatonin regulation in humans: Evidence for a novel circadian photoreceptor. J. Neurosci. 2001, 21, 6405–6412. [Google Scholar] [CrossRef]
- Garcia-Saenz, A.; Sánchez de Miguel, A.; Espinosa, A.; Costas, L.; Aragonés, N.; Tonne, C.; Moreno, V.; Pérez-Gómez, B.; Valentin, A.; Pollán, M.; et al. Association Between Outdoor Light-at-night Exposure and Colorectal Cancer in Spain. Epidemiology 2020, 31, 718–727. [Google Scholar] [CrossRef]
- Garcia-Saenz, A.; Sánchez de Miguel, A.; Espinosa, A.; Valentin, A.; Aragonés, N.; Llorca, J.; Amiano, P.; Sánchez, M.; Vicente, G.; Marcela, C.; et al. Evaluating the association between artificial light-at-night exposure and breast and prostate cancer risk in Spain (MCC-Spain study). Environ. Health Perspect. 2018, 126, 047011. [Google Scholar] [CrossRef]
- Rybnikova, N.; Portnov, B.A. Population-level study links short-wavelength nighttime illumination with breast cancer incidence in a major metropolitan area. Chronobiol. Int. 2018, 35, 1198–1208. [Google Scholar] [CrossRef] [PubMed]
- De Almeida, E.A.; Di Mascio, P.; Harumi, T.; Spence, D.W.; Moscovitch, A.; Hardeland, R.; Cardinali, D.P.; Brown, G.M.; Pandi-Perumal, S. Measurement of melatonin in body fluids: Standards, protocols and procedures. Child’s Nerv. Syst. 2011, 27, 879–891. [Google Scholar] [CrossRef] [PubMed]
- Aubé, M.; Roby, J.; Kocifaj, M. Evaluating potential spectral impacts of various artificial lights on melatonin suppression, photosynthesis, and star visibility. PLoS ONE 2013, 8, e67798. [Google Scholar] [CrossRef] [PubMed]
- Colorimetry, C. CIE Publication No. 15.2; Commission Internationale de I’éclairage: Vienna, Austria, 1986; pp. 19–20. [Google Scholar]
- Thapan, K.; Arendt, J.; Skene, D.J. An action spectrum for melatonin suppression: Evidence for a novel non-rod, non-cone photoreceptor system in humans. J. Physiol. 2001, 535, 261–267. [Google Scholar] [CrossRef]
- Brown, R.L.; Robinson, P.R. Melanopsin—Shedding light on the elusive circadian photopigment. Chronobiol. Int. 2004, 21, 189–204. [Google Scholar] [CrossRef]
- DIN5031–10. Optical Radiation Physics and Illuminating Engineering—Part 10: Photobiologically Effective Radiation, Quantities, Symbols and Action Spectra. 2002. Available online: https://www.beuth.de/en/standard/din-5031-10/276889937 (accessed on 1 December 2020).
- Sánchez de Miguel, A.; Bará, S.; Aubé, M.; Cardiel, N.; Tapia, C.E.; Zamorano, J.; Gaston, K.J. Evaluating human photoreceptoral inputs from night-time lights using RGB imaging photometry. J. Imaging 2019, 5, 49. [Google Scholar] [CrossRef]
- de Miguel, A.S.; Kyba, C.C.; Aubé, M.; Zamorano, J.; Cardiel, N.; Tapia, C.; Bennie, J.; Gaston, K.J. Colour remote sensing of the impact of artificial light at night (I): The potential of the International Space Station and other DSLR-based platforms. Remote Sens. Environ. 2019, 224, 92–103. [Google Scholar] [CrossRef]
- Hänel, A.; Posch, T.; Ribas, S.J.; Aubé, M.; Duriscoe, D.; Jechow, A.; Kollath, Z.; Lolkema, D.E.; Moore, C.; Schmidt, N.; et al. Measuring night sky brightness: Methods and challenges. J. Quant. Spectrosc. Radiat. Transf. 2018, 205, 278–290. [Google Scholar] [CrossRef]
- Walczak, K.J.; Gyuk, G.; Hammergren, M.; Tarr, C. NITELite: A High-Altitude Balloon Light Pollution Research Mission. In Academic High Altitude Conference; Iowa State University Digital Press: Ames, IA, USA, 2020. [Google Scholar]
- Aubé, M. High Altitude Balloon Light at Night Experiment Webpage. 2020. Available online: https://lx02.cegepsherbrooke.qc.ca/~aubema/index.php/Prof/HABLAN (accessed on 1 December 2020).
- Bouroussis, C.A.; Topalis, F.V. Assessment of outdoor lighting installations and their impact on light pollution using unmanned aircraft systems-The concept of the drone-gonio-photometer. J. Quant. Spectrosc. Radiat. Transf. 2020, 253, 107155. [Google Scholar] [CrossRef]
- Fiorentin, P.; Bettanini, C.; Bogoni, D. Calibration of an Autonomous Instrument for Monitoring Light Pollution from Drones. Sensors 2019, 19, 5091. [Google Scholar] [CrossRef]
- Aubé, M. LANcube Webpage. 2020. Available online: https://lx02.cegepsherbrooke.qc.ca/~aubema/index.php/Prof/LANcube (accessed on 1 December 2020).
- Roby, J.; Aubé, M.; Morin Paulhus, A. LSPDD: Lamp Spectral Power Distribution Database. 2017. Available online: http://lspdd.com (accessed on 1 December 2020).
- Vos, J.J. Colorimetric and photometric properties of a 2∘ fundamental observer. Color Res. Appl. 1978, 3, 125–128. [Google Scholar] [CrossRef]
- Wyszecki, G.; Stiles, W.S. Color Science; Wiley: New York, NY, USA, 1982; Volume 8. [Google Scholar]
- Aubé, M. Data File Containing Colour Ratios and Indices from the LANcube Poject Github Repository. 2020. Available online: https://github.com/aubema/lancube/blob/master/RemoteSensing2020/ (accessed on 1 December 2020).
- Tscharntke, T.; Hochberg, M.E.; Rand, T.A.; Resh, V.H.; Krauss, J. Author sequence and credit for contributions in multiauthored publications. PLoS Biol. 2007, 5, e18. [Google Scholar] [CrossRef] [PubMed]


| Feature | v1 | v2 |
|---|---|---|
| Sensors | TCS 34725 | TCS 34725 |
| Number of sensors | 6 | 5 |
| Minimum acquisition time | 7 s | 1 s |
| Maximum acquisition time | 11 s | 2 s |
| Processing unit | Arduino atMega 2560 | Raspberry Pi 4b computer |
| Access to data | Removal of the microSD card | Download from wifi |
| System state indicator | RGB LED | RGB LED + wifi web server |
| Environment sensor | DTH22 (temp. and Hum.) | Onboard Raspberry pi temp. sensor |
| Power source | 5 V—USB/A | 5 V—USB/C |
| Power protection | Nothing | Integrated UPS |
| Positioning | GPS | GPS |
| Real time clock | DS 3231 | DS 3231 |
| Index | ||||||
|---|---|---|---|---|---|---|
| MSI | 0.0769 | 0.6023 | −0.1736 | −0.0489 | 0.3098 | 0.0257 |
| SLI | 0.6624 | −0.4308 | −0.2891 | 0.2913 | 0.6801 | 0.0015 |
| IPI | −0.4118 | −0.3824 | −0.0955 | 0.7048 | 0.3305 | −0.0463 |
| MSI Range | Lamp Spectra |
|---|---|
| LED PCamber, Yellow CFL, Red CFL | |
| LED 2500 K, Incandescent, HPS | |
| LED 2700 K, LED 3000 K, Incandescent, WW CFL | |
| LED 3000 K, Incandescent, Halogene, WW CFL | |
| LED 4000 K, NW CFL, NW FL | |
| LED 5000 K, NW CFL, MH | |
| LED 5000 K, NW CFL, CW CFL, MH | |
| LED 6000 K, CW CFL | |
| - | |
| Blue CFL, Blue LED |
| SLI Range | Lamp Spectra |
|---|---|
| Red CFL | |
| PC amber LED | |
| HPS, Yellow CFL | |
| WW CFL, LED 2500 K | |
| LED 2700 K, LED 3000 K, WW CFL Inc | |
| LED 4000 K, Halogene, Incandescent | |
| LED 4000 K, LED 5000 K, NW CFL, NW FL, Halogene, MH | |
| LED 5000 K, LED 6000 K, CW CFL | |
| CW CFL | |
| Blue CFL, LED 6500 K |
| IPI Range | Lamp Spectra |
|---|---|
| - | |
| - | |
| - | |
| - | |
| Yellow CFL | |
| HPS, WW CFL, PC amber LED | |
| WW CFL, NW CFL, LED 2700 K, LED 3000 K, LED 4000 K | |
| NW CFL, CW CFL, LED 3000 K, LED 4000 K | |
| Halogene | |
| Halogene, Incandescent, Blue CFL, Red CFL |
Publisher’s Note: MDPI stays neutral with regard to jurisdictional claims in published maps and institutional affiliations. |
© 2020 by the authors. Licensee MDPI, Basel, Switzerland. This article is an open access article distributed under the terms and conditions of the Creative Commons Attribution (CC BY) license (http://creativecommons.org/licenses/by/4.0/).
Share and Cite
Aubé, M.; Marseille, C.; Farkouh, A.; Dufour, A.; Simoneau, A.; Zamorano, J.; Roby, J.; Tapia, C. Mapping the Melatonin Suppression, Star Light and Induced Photosynthesis Indices with the LANcube. Remote Sens. 2020, 12, 3954. https://doi.org/10.3390/rs12233954
Aubé M, Marseille C, Farkouh A, Dufour A, Simoneau A, Zamorano J, Roby J, Tapia C. Mapping the Melatonin Suppression, Star Light and Induced Photosynthesis Indices with the LANcube. Remote Sensing. 2020; 12(23):3954. https://doi.org/10.3390/rs12233954
Chicago/Turabian StyleAubé, Martin, Charles Marseille, Amar Farkouh, Adam Dufour, Alexandre Simoneau, Jaime Zamorano, Johanne Roby, and Carlos Tapia. 2020. "Mapping the Melatonin Suppression, Star Light and Induced Photosynthesis Indices with the LANcube" Remote Sensing 12, no. 23: 3954. https://doi.org/10.3390/rs12233954
APA StyleAubé, M., Marseille, C., Farkouh, A., Dufour, A., Simoneau, A., Zamorano, J., Roby, J., & Tapia, C. (2020). Mapping the Melatonin Suppression, Star Light and Induced Photosynthesis Indices with the LANcube. Remote Sensing, 12(23), 3954. https://doi.org/10.3390/rs12233954