Review

A Decade of Modern Bridge Monitoring Using Terrestrial Laser Scanning: Review and Future Directions

by
Maria Rashidi
1,
Masoud Mohammadi
1,
Saba Sadeghlou Kivi
2,
Mohammad Mehdi Abdolvand
3,
Linh Truong-Hong
4 and
Bijan Samali
1,*
1
Centre for Infrastructure Engineering, Western Sydney University, Penrith, NSW 2751, Australia
2
Faculty of Engineering, University of Mohaghegh Ardabili, Ardabil 5619, Iran
3
School of Civil Engineering, The University of Sydney, Sydney, NSW 2006, Australia
4
Department of Geoscience and Remote Sensing, Delft University of Technology, 2600 Delft, The Netherlands
*
Author to whom correspondence should be addressed.
Remote Sens. 2020, 12(22), 3796; https://doi.org/10.3390/rs12223796
Submission received: 9 October 2020 / Revised: 9 November 2020 / Accepted: 17 November 2020 / Published: 19 November 2020
(This article belongs to the Special Issue Lidar Remote Sensing in 3D Object Modelling)

Abstract

:
Over the last decade, particular interest in using state-of-the-art emerging technologies for inspection, assessment, and management of civil infrastructures has remarkably increased. Advanced technologies, such as laser scanners, have become a suitable alternative for labor intensive, expensive, and unsafe traditional inspection and maintenance methods, which encourage the increasing use of this technology in construction industry, especially in bridges. This paper aims to provide a thorough mixed scientometric and state-of-the-art review on the application of terrestrial laser scanners (TLS) in bridge engineering and explore investigations and recommendations of researchers in this area. Following the review, more than 1500 research publications were collected, investigated and analyzed through a two-fold literature search published within the last decade from 2010 to 2020. Research trends, consisting of dominated sub-fields, co-occurrence of keywords, network of researchers and their institutions, along with the interaction of research networks, were quantitatively analyzed. Moreover, based on the collected papers, application of TLS in bridge engineering and asset management was reviewed according to four categories including (1) generation of 3D model, (2) quality inspection, (3) structural assessment, and (4) bridge information modeling (BrIM). Finally, the paper identifies the current research gaps, future directions obtained from the quantitative analysis, and in-depth discussions of the collected papers in this area.

1. Introduction

Within the past decade, the need for inspection, assessment, and management in the construction industry has been significantly increased. A large number of civil infrastructures, particularly bridges, were constructed after the Second World War in the late 1940s, over 50 years ago while still being in operation [1]. Most of these bridges were designed and constructed based on old standards and needed to be rehabilitated during their lifetime. In a recent infrastructure report of the American Society of Civil Engineering (ASCE), more than 40% of the American bridges are older than 50 years and more than 13.6% are functionally defective [2]. A similar figure is also found in the United Kingdom, where these types of bridges have been constructed since late 1950s [3,4]. Similar trends were also found in other countries such as Australia, Japan, and European nations [5,6,7]. Apart from some pre-existing parameters such as design and construction, there are several post existing factors impacting the structural efficiency and overall condition of bridges. These include the environmental effects, structure age, quality of inspection and maintenance strategies [8].
Maintenance strategies mainly depend on adopted monitoring and inspection methods. Employing traditional methods based on physical inspectors on site for regular inspection and condition assessment is quite laborious, expensive, time-consuming and potentially unsafe. Moreover, any maintenance negligence or delayed actions may result in significant future costs. This can be of more significance when the structure is of especial usage or importance. The vital components of the road network system, especially bridges, are among the most susceptible and yet important structures, which need to be accurately inspected and well-maintained. These important structures are often located in rugged terrains and built in difficult accessible places. Therefore, implementing an effective inspection method and periodic maintenance/rehabilitation strategy is essentially required. Furthermore, the adoption of a cost-effective method is another important factor. Based on the most recent report of Roads and Maritime Service (RMS) of New South Wales (NSW) of Australia, currently known as Transport for NSW (TfNSW), [9] more than 28% of the NSW government budget is spent on managing and maintaining infrastructure assets, particularly roads and bridges. Therefore, employing a cost-effective and proactive inspection and monitoring methods, and asset management can significantly reduce these excessive costs.
Three-dimensional (3D) laser scanning is an emerging non-contact measurement technology for rapid and precise capturing topographic data points of objects’ surfaces. The acquired data points are generally defined based on x, y, z coordinates associated with attributions such as the intensity of the laser beam reflected from the observed object. Laser scanning units can be classified based on the position of the laser sensors during the data capture; these classifications are aerial, mobile and terrestrial laser scanning corresponding to air (e.g., helicopter, plane, or drone), mobile equipment (e.g., vehicle, train or boat) and the ground. Although each of these methods has its own advantages, using terrestrial laser scanners (TLS) is more common and popular. Recently, TLS offers wide applications in construction industry and maintenance strategies. TLS has also great potential to be utilized for inspection processes due to its ability to capture objects in high speed with accuracy up to sub-millimeter and is low cost in comparison to other traditional inspection methods.
Due to common applications of TLS, several review papers have already been published to present the state-of-the-art in this area. In an effort, Son et al. [10] reviewed the emerging methods to extract and analyze BIM models from the acquired data points with the aims of facility management (FM) and production monitoring (PM). Pătrăucean et al. [11] provided a general overview of automatic 3D model creation for existing facilities, as-built BIM model, from the laser scanner data. Lu and Lee [12] presented a general outline for image-based creation of 3D models from point cloud data captured from an existing building. Wang and Kim [13] explored the applications of TLS in the construction industry, and the authors discussed data acquisition parameters and quality of laser scanning data to fulfil the needs for construction applications. Kim et al. [14] reviewed recent studies on the geometry quality inspection of civil structures based on using a laser scanner in different project phases. In another effort, Spencer et al. [15] provided an overview of existing advanced computer vision techniques of monitoring for condition assessment of civil infrastructures. Recently, Czerniawski and Leite [16] summarized the efforts of ten years of research work on digitizing the existing structures in an automatic manner. Although all the above-mentioned review papers expressed the demands of utilizing TLS, none of them specifically summarized the extensive applications of TLS in bridge engineering, inspection and maintenance.
To give an overview of using laser scanning for bridge engineering, this research attempts to explore the applications of TLS in bridge engineering by means of a mixed scientometric and state-of-the-art review methods. The aim of this paper is to investigate the applications of TLS in different phases of bridge construction, operation and maintenance to uncover the experiences and identify the current research gaps and future directions. Following the review, over 1500 research publications were collected through a two-fold literature search published from 2010 to 2020. Based on the quantitative analysis and in-depth discussion on the published papers, research gaps are identified, and future directions are further proposed.

2. Scientometric Review

The scientometric review is defined as a quantitative investigation of the current research on the forming of science, which considers the impact of journals, institutions, and the network of countries in a specific area of research. This reviewing method can provide a deeper understanding, including a comprehensive summary of the currently published papers and measures the impact of research regarding the citation processes [17,18].
In the current study, a quantitative analysis is proposed for assessing the published papers related to the applications of laser scanning in bridge engineering and asset management. Bibliometric techniques are applied to published literature by this methodology and are used to map the structure and development of various concerns and objectives based on the collected large-scale academic data sets [18]. In the following, analyzing the intellectual landscape of the current research area and perceiving relevant questions that researchers may try to respond with are comprehensively presented by a network modelling and visualization [19]. Visualizing the whole field of laser scanning in bridges will facilitate readers to gain a comprehensive view of research trends and patterns in this field of study.
The identification of prominent researchers that mainly affect the structure of this field of study is obtained by analyzing keywords and abstracts which describe the research contents. Moreover, research patterns are obtained by the following methodologies: the co-occurrence of keywords analysis and co-author analysis that considers the countries of origin [20,21]. Subsequently, VOSviewer and CiteSpace [22], as two practical computer programs, were employed for bibliometric mapping.

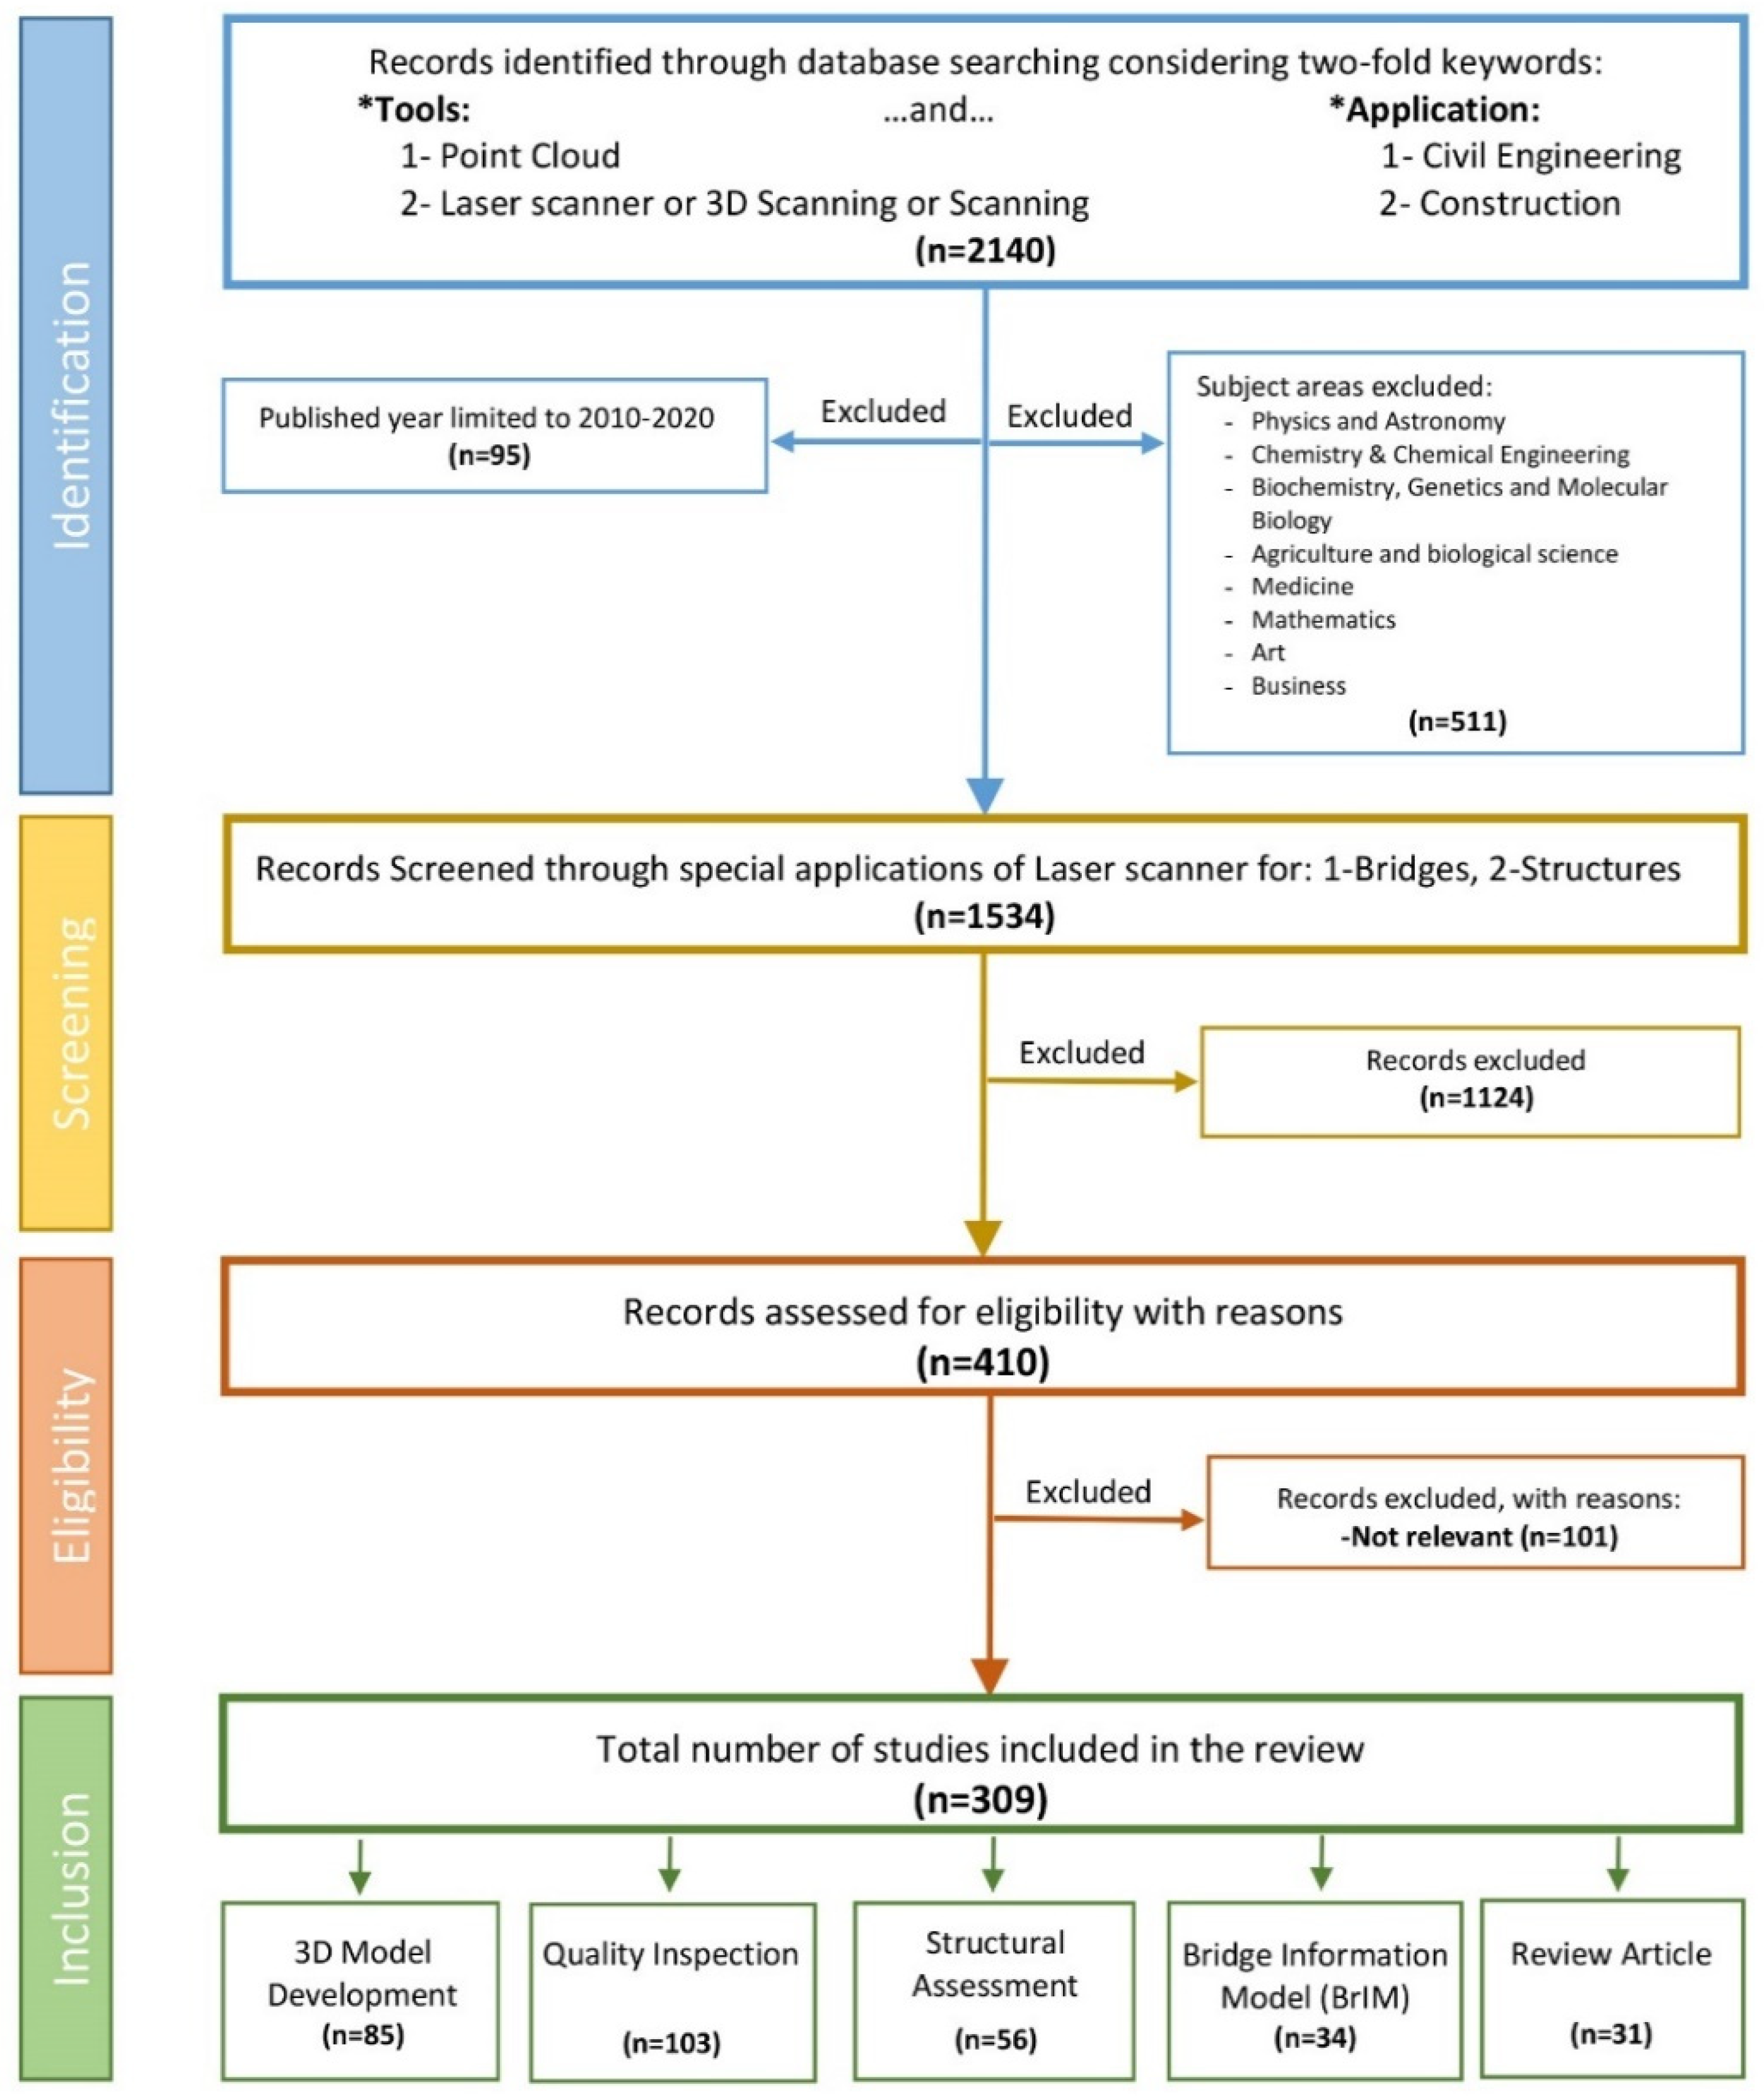
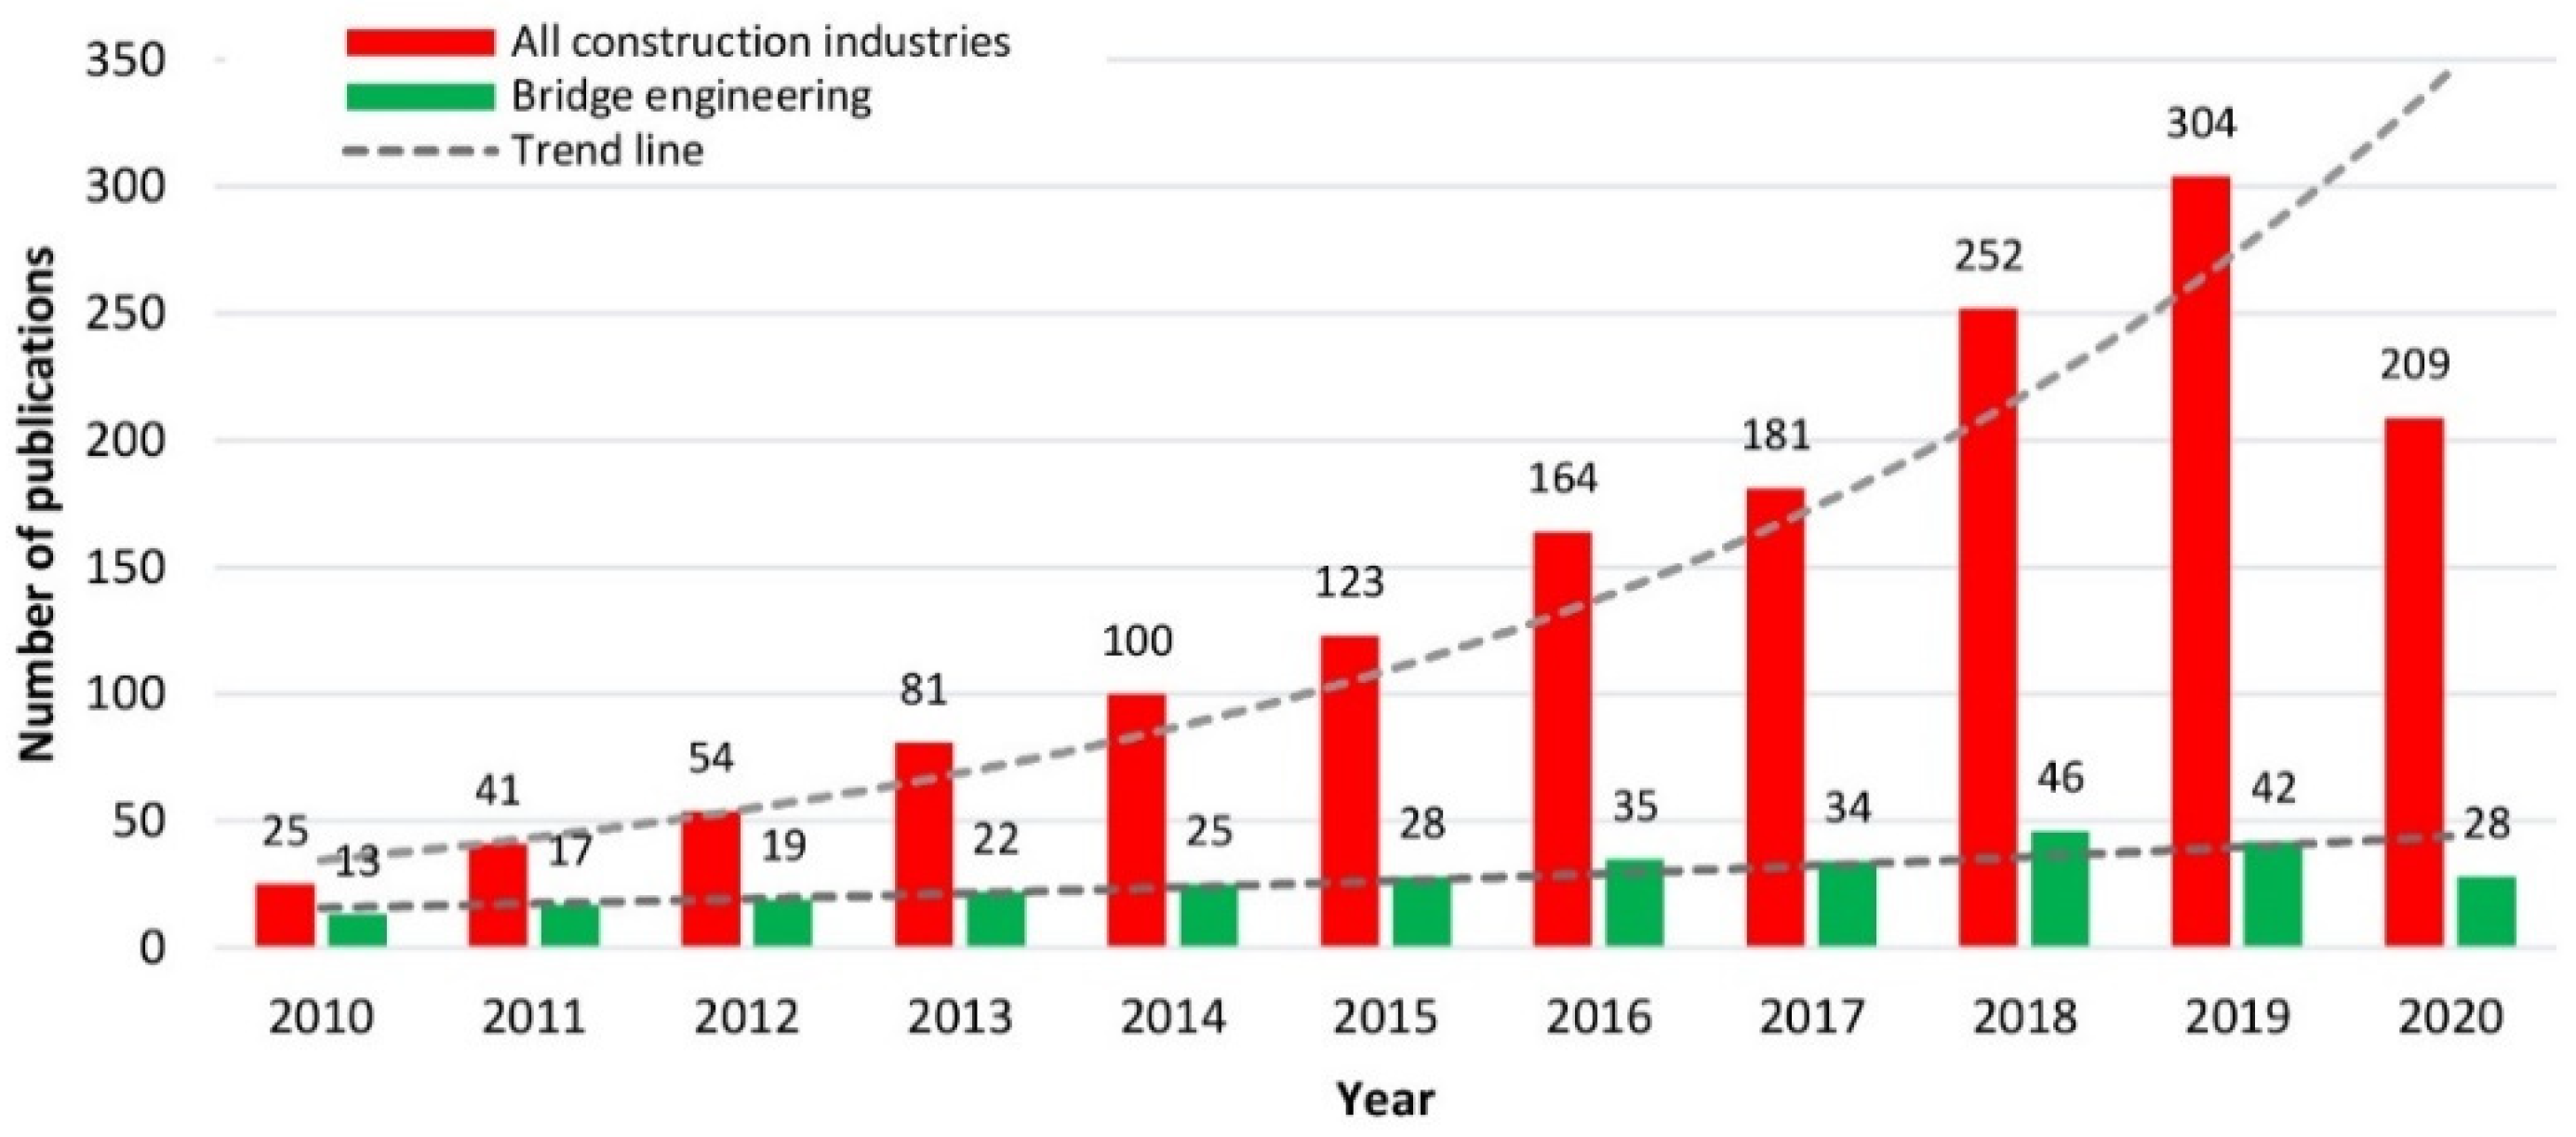
2.1. Literature Search Methodology

During the past decade, a massive amount of research outputs has been published in both conference proceedings and scientific journals; however, the literature search has mainly relied on high-ranked journals and reputed conferences in the area of civil engineering, construction management, and structural health monitoring. For the literature search, the main source of information was considered to be Scopus launched in 2004, which contains more than 75 million records of articles and books [23]. Moreover, a supplementary literature search was also conducted in Google Scholar, PubMed, and Web of Science. Figure 1 shows an overview of the literature search methodology. At the beginning stage of the literature search, a two-fold general keywords including the capturing tool (3D point cloud, Laser scanner or Laser scanning or 3D scanning or scanning) and the application area (Construction and Civil engineering) were used. A total of 2140 papers were identified at the beginning stage. Some of the papers were from other subject areas such as physics, astronomy, medicine, and mathematics and not related to the research topic. Therefore, two types of criteria were applied during this stage. At first, a subject area exclusion was considered for the chosen papers and then the year of publication was restricted to 2010 to 2020. The first criterion led to the removal of 511 papers, while the next one eliminated 95 papers. Overall, 606 papers were eliminated, leaving 1534 papers. Figure 2 depicts the number per year of the collected papers in this stage which shows an increasing rate of publication in this area during the last ten years.
In the next stage, the remaining 1534 papers were screened by more specific keywords. Again, the remaining papers were reduced due to specific keywords related to the specific applications of the laser scanning for bridge inspection. At this stage, considering two other keywords of “bridge” and “structure”, 1152 papers were removed. Next, during the eligibility stage, the remaining 410 papers were assessed by looking at the title, leading to the exclusion of 71 papers again. At this stage, the relevance of the remaining 339 papers was skimmed by reading the abstract of the papers. Due to irrelevant focus of the subject matter, 30 more papers were excluded. In the inclusion stage, the full texts of all 309 remaining papers were given a quick perusal and the objectives were identified. Figure 2 reveals the historical trend of published studies in this area and demonstrates the low rate of publications specifically focused on bridge engineering; thereby this topic can be considered as a promising subject area to be investigated. During the last decade, publication numbers kept rising, reaching about 42 publications in 2019, confirming the growing interest in the field of bridge engineering. Considering the multiple objectives of the papers in this field, documents were divided into five subdivisions related to the specific application of 3D laser scanners in bridge engineering.
This methodology is continued by identifying the topmost reputable journals and conferences, as presented in Table 1. As shown in Table 1, Automation in Construction and Remote Sensing contain the most published papers related to the application of TLS in bridge engineering and assessment.

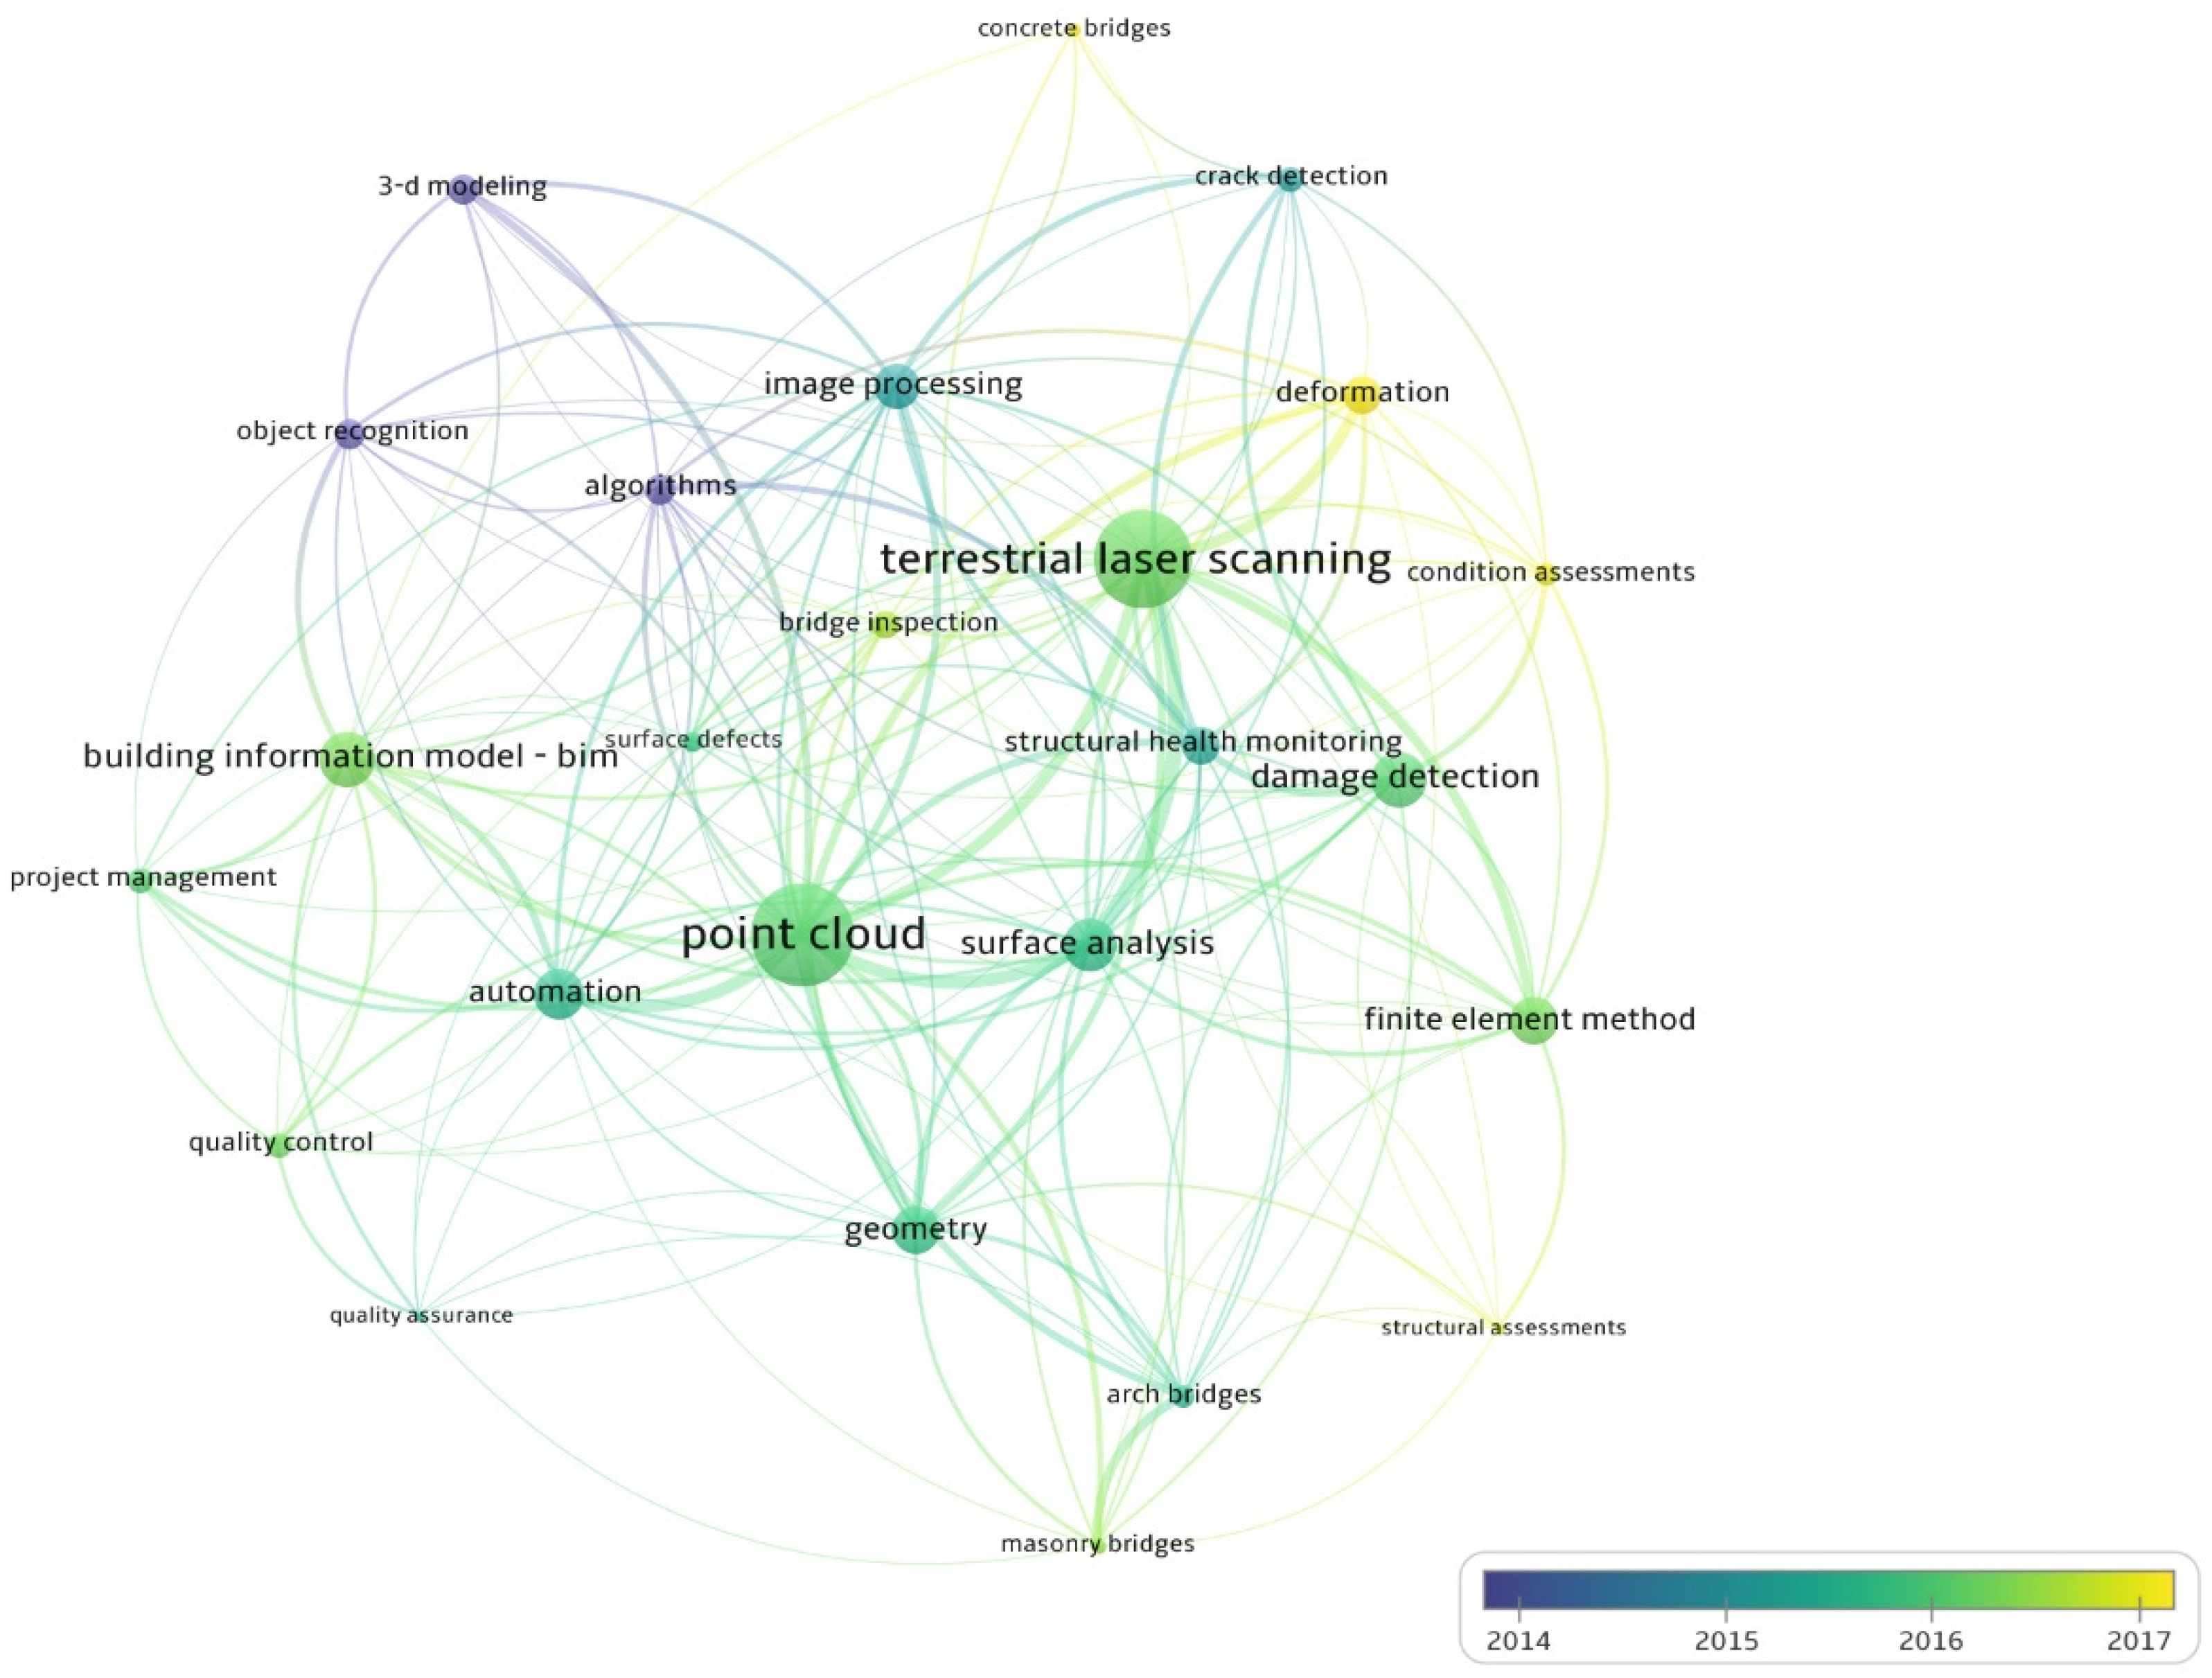
2.2. Co-Occurrence of Keywords Analysis

Keywords are important to present the fundamental concepts/concerns and subject areas of the published work, and demonstrate a quick overview of the research horizons [24]. In order to construct and investigate the map of the existing knowledge domain in bridge engineering and assessment, the co-occurrence of keywords was evaluated using VOSviewer. The VOSviewer presents the keywords network in a distance-based diagram. Considering the keywords network, the results of the literature search were analyzed and visualized, as presented in Figure 3. This network contains 25 nodes and 172 links, and Table 2 presents details such as the number of occurrences, average year published, number of links, and total link strength. Each keyword in this network is defined as a node and the relationship between each node is considered as a link. The distance between two nodes determines the relationship weakness or strength. The far distance between two keywords/nodes shows a weaker relationship, while a closer distance indicates a stronger connection [25]. The sum of the strength of the links related to a specific node is defined as total link strength. Moreover, the size of the presented nodes indicates the number of documentations in which the keyword was established and several colors indicate diverse years of study [26].
The frequency of each keyword is presented by the number of occurrences in Table 2. So, based on this table, “point cloud” and “terrestrial laser scanning” are the two main keywords that emerge frequently, showing extensive studies in this area. Additionally, the average year published presents the period that studies are more concentrated on research works/keywords. As an instance, terrestrial laser scanning is a keyword with high frequency during the period 2015–2016. Based on the presented information, the occurrence number of some keywords such as bridge inspection, crack detection, and surface defects reveal that the research undertakings related to bridge inspection and assessment are limited; hence, there is an obvious and essential need for further studies in this field.

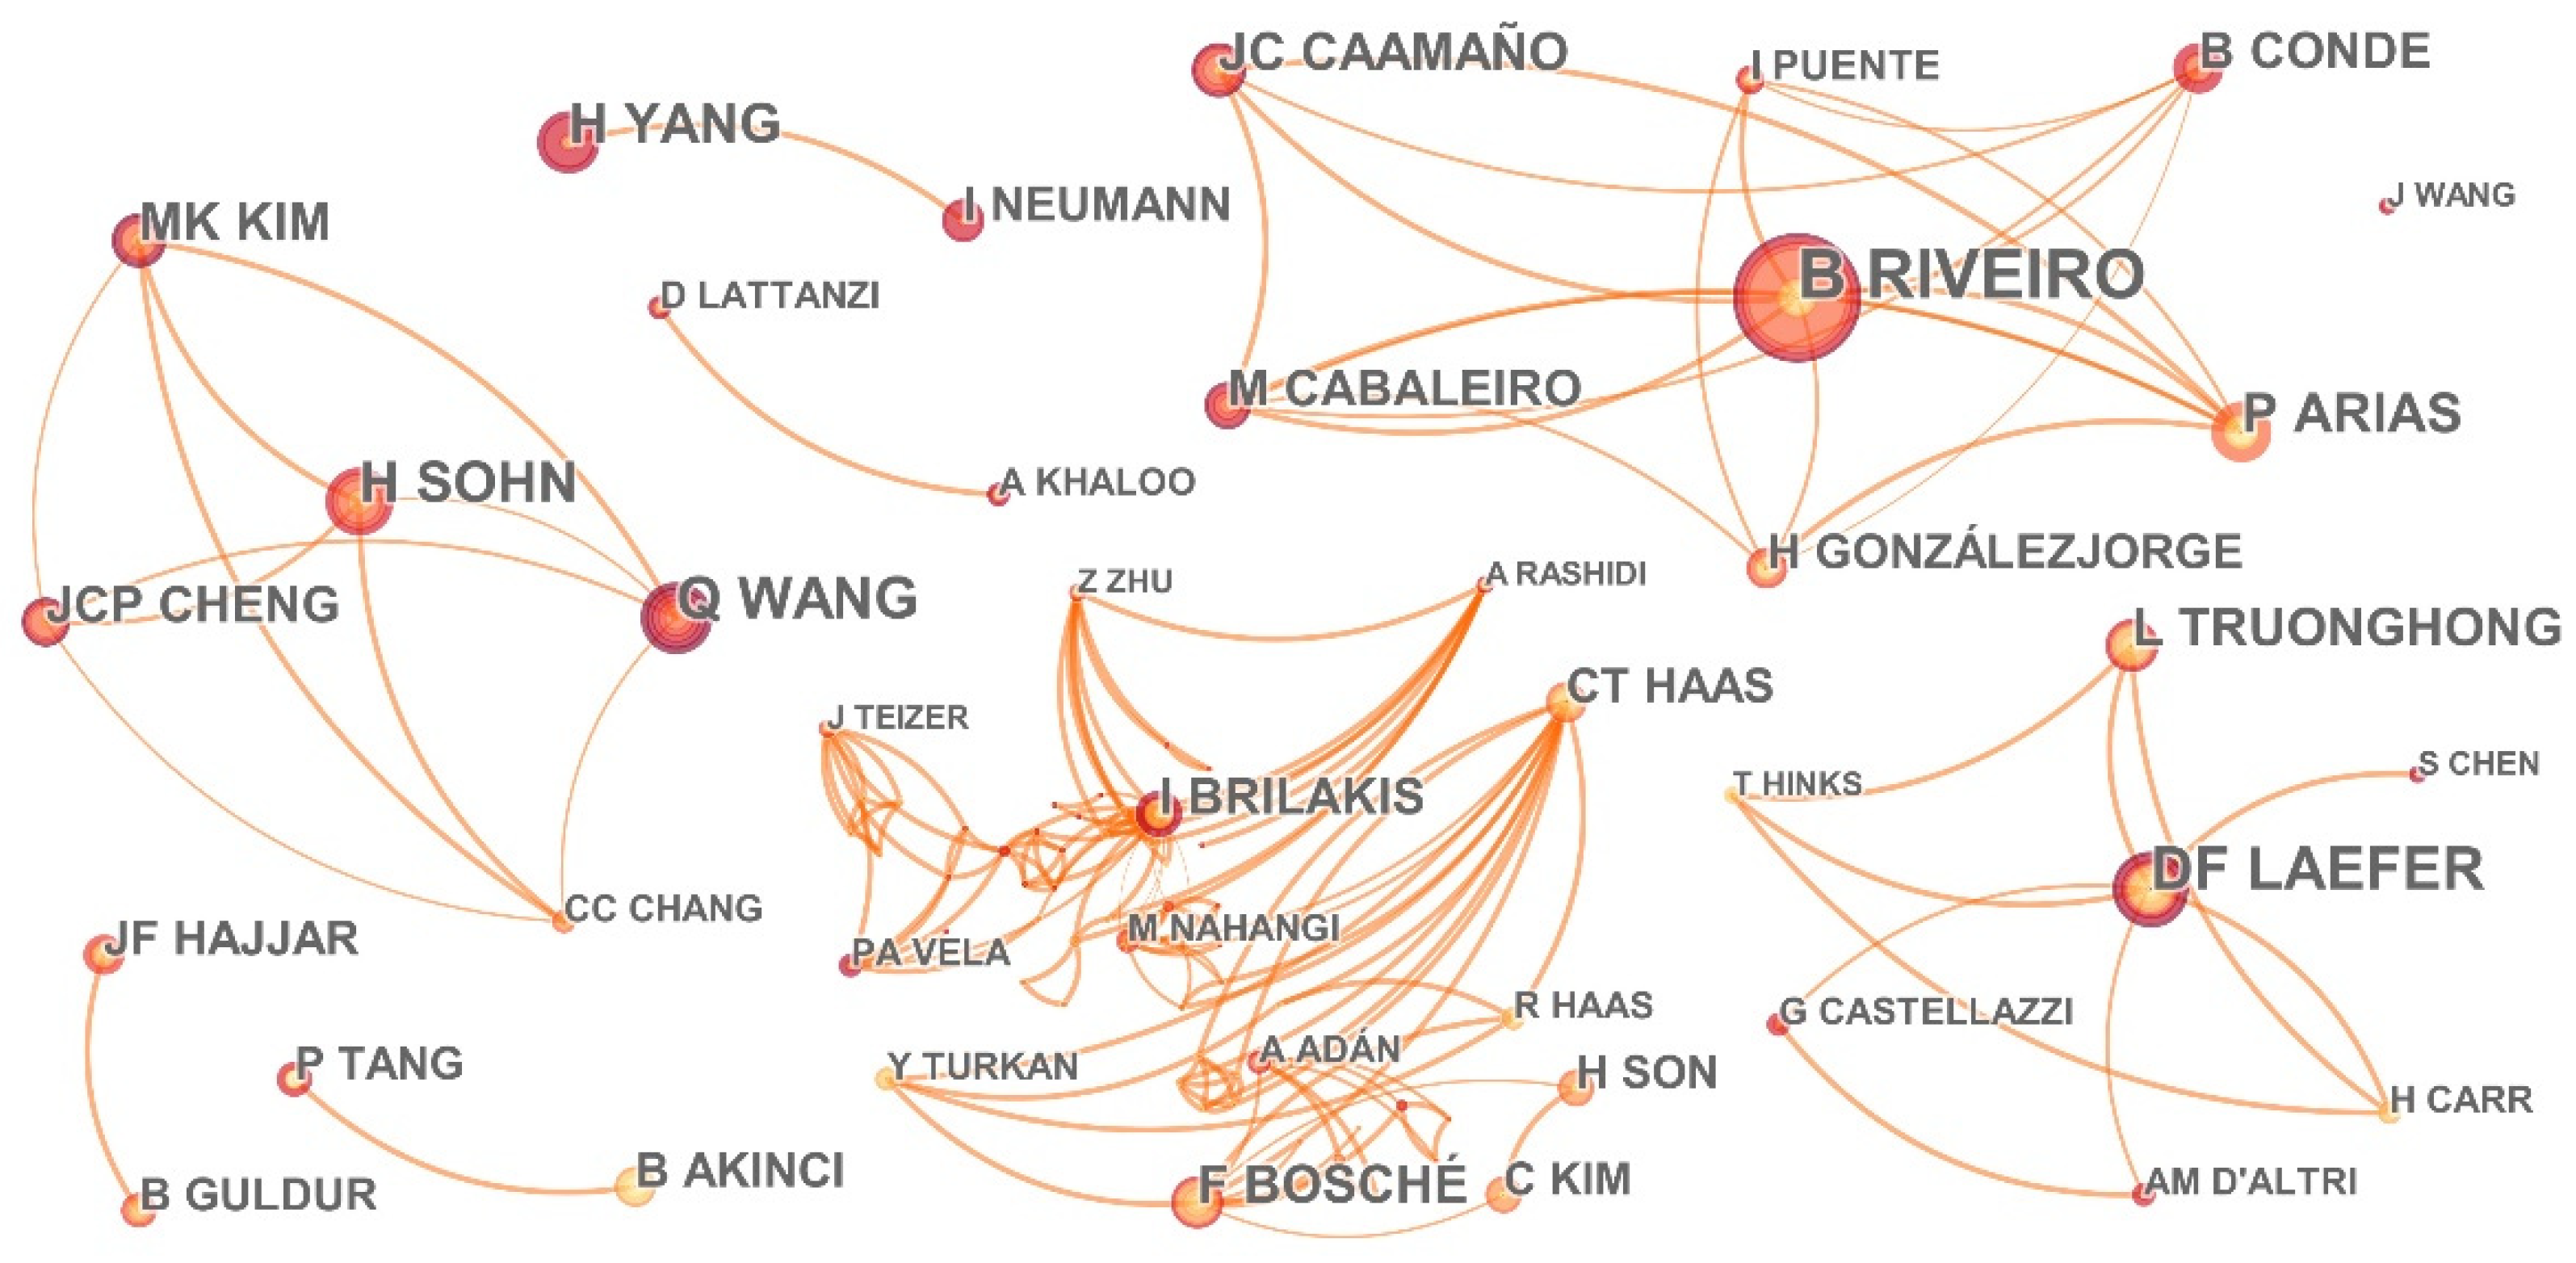
2.3. Co-Authorship Analysis

The co-authorship network was obtained based on the bibliometric technique, showing the research work of the major authors and co-operation between them in the presented field. This network was created by CiteSpase software which includes nodes and links. The number of publications produced by a researcher determines the node size, and the thickness of the link indicates the level of the author’s co-operation. Figure 4 includes 521 nodes and 1012 links. Obtained modularity Q and mean silhouette scores for this network equaled 0.9567 and 0.9136, respectively, as shown in Table 3. According to the presented information in CiteSpase, manual overall structural properties of the network proved to be reasonable [22]. Based on the given information, the list of the most productive authors who have the most published papers is presented in Table 4. According to this table, the top three positions were occupied by Riveiro, B. (University of Vigo), Laefer, D.F. (New York University), and Wang, Q. (National University of Singapore). This figure would be useful for new researchers who become interested in the area of bridge inspection and monitoring, and in particular, use of terrestrial laser scanners.

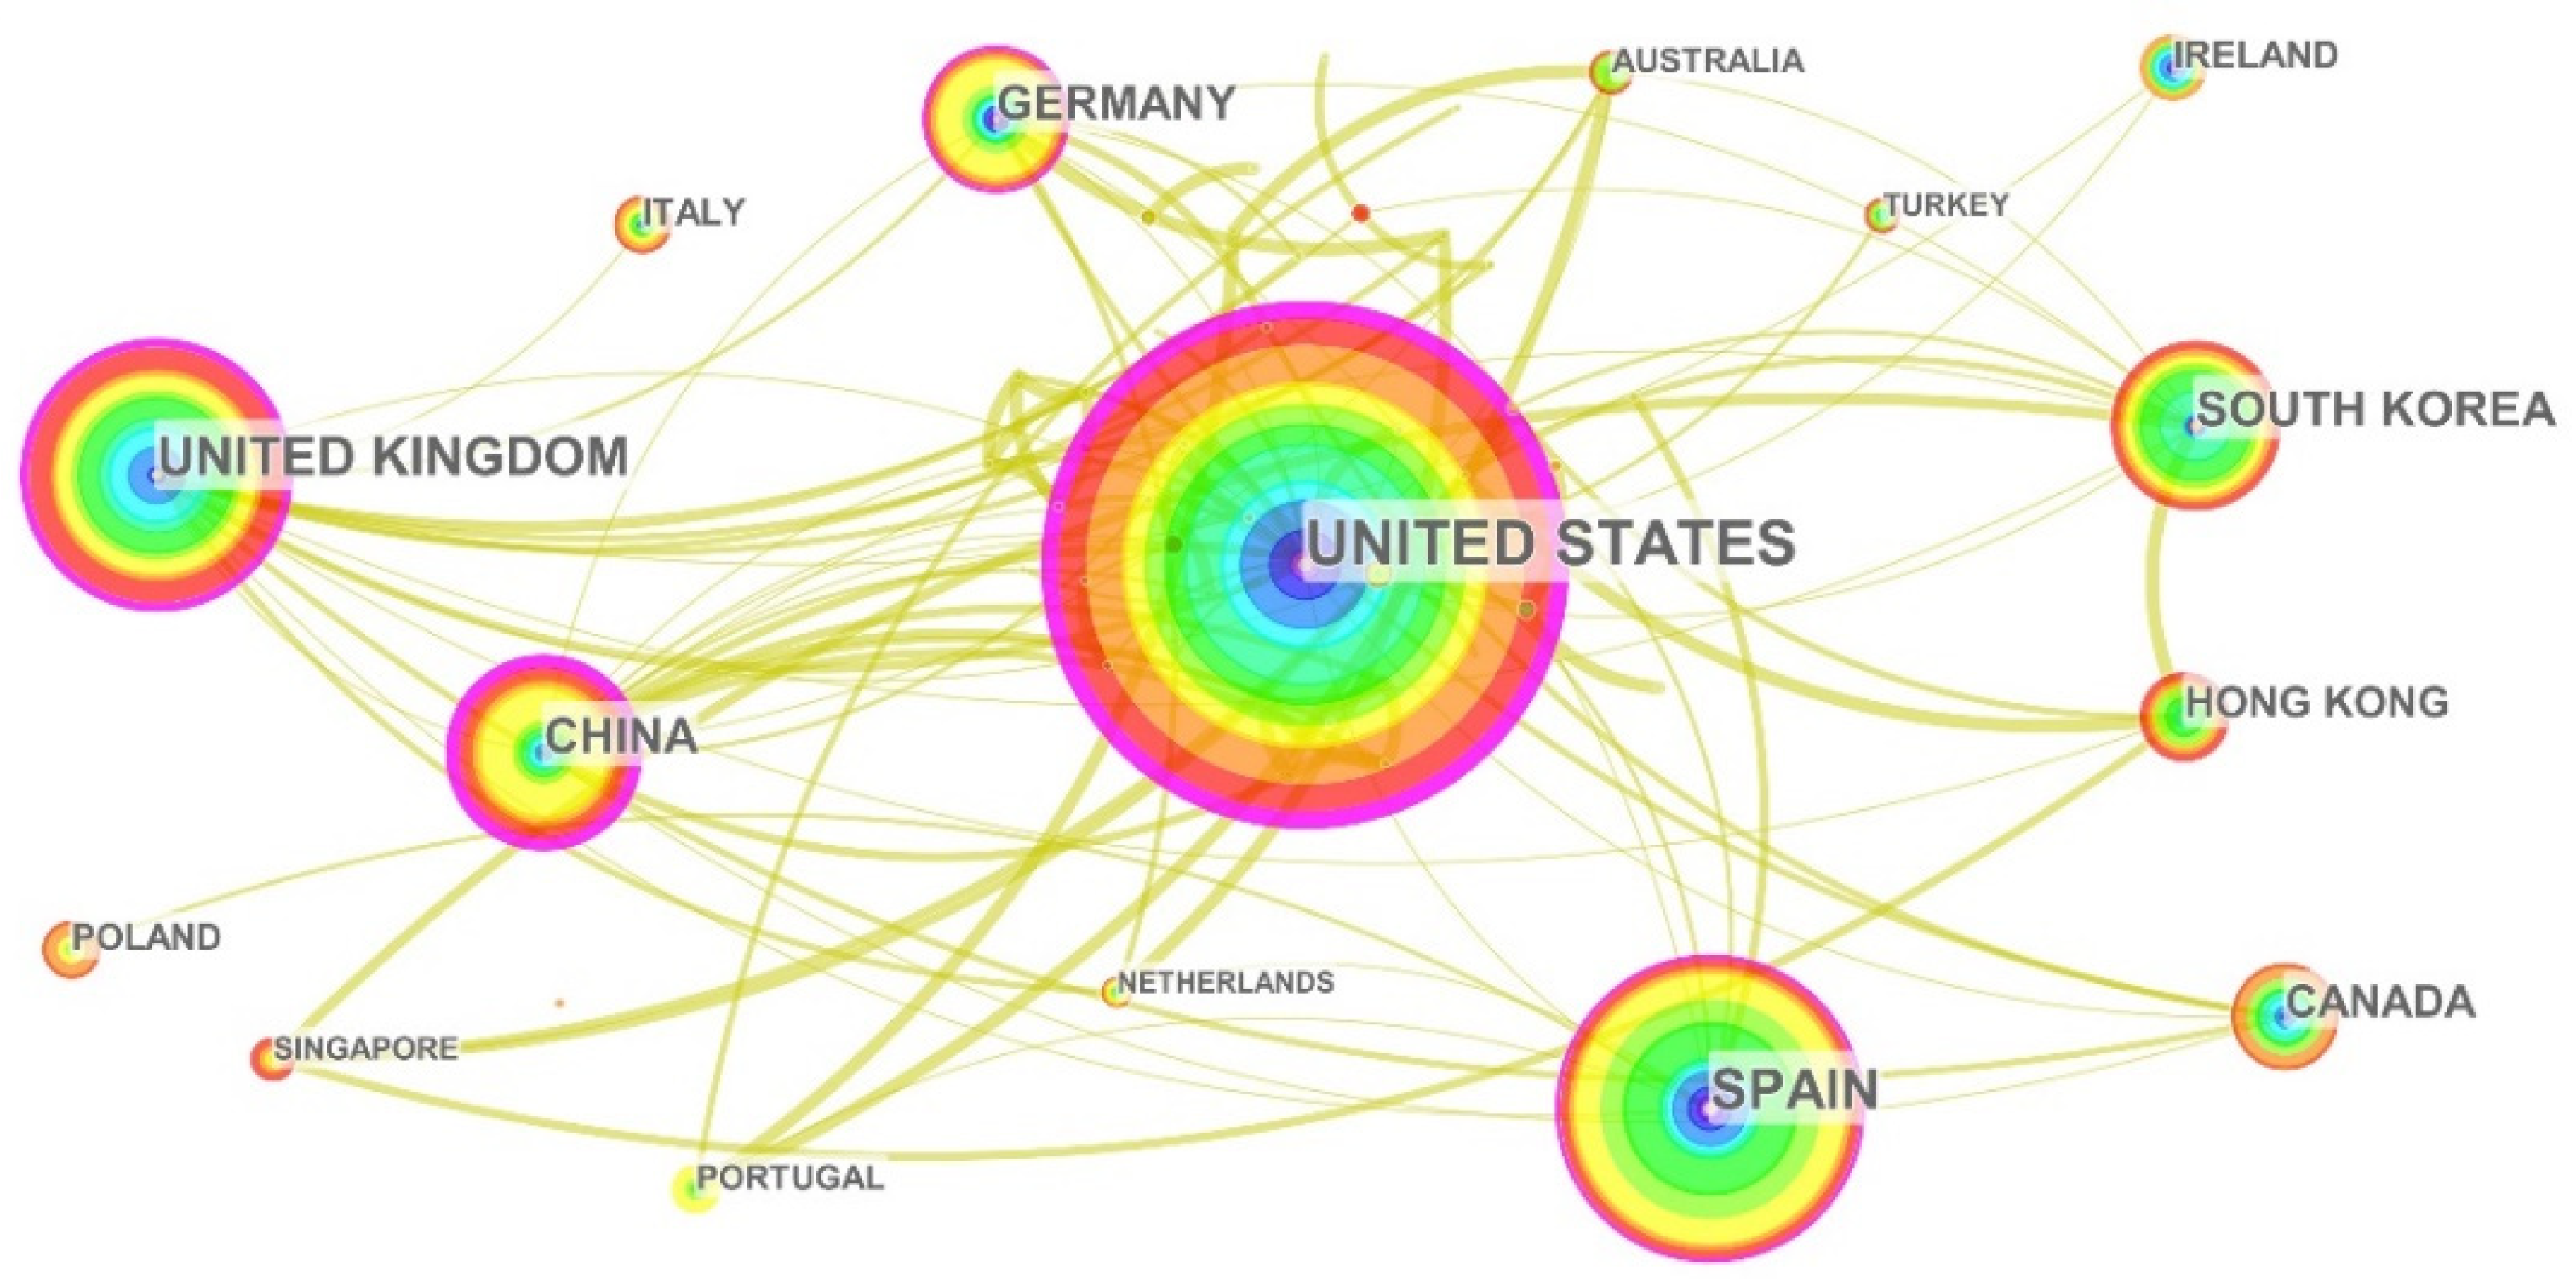
2.4. Network of Countries/Regions and Institutions

In order to demonstrate the contributions of countries/regions in the presented field, a network was created by CiteSpase software, showing the distribution of research publications. Sixty-eight nodes and 164 links were included in this network. As shown in Figure 5, the main contributions to the publications in this field of research belonged to the following countries, respectively; the United States (77 papers), Spain (48 papers), United Kingdom (40 papers), South Korea (28 papers), and China (28 papers).

3. State-of-the-Art Review

Following the review and considering the multiple objectives of the collected papers mentioned in the Scientometric Review section, the methodology of this research was extended to a state-of-the-art review on applications of TLS in bridge engineering and asset management according to four major categories including (1) generation of 3D geometric model, (2) quality inspection, (3) structural assessment, and (4) Bridge Information Modelling (BrIM).

3.1. Generation of 3D Geometric Model

Raw topographic point cloud data generally appear in a form of x-, y-, z-coordinates associated with attribution such as intensity value and color, which cannot interpret information of the objects’ surfaces. The primary and most challenging task is to convert these raw data to meaningful information for subsequent applications, which includes data acquisition and 3D model reconstruction. The output of this task as a solid 3D representation is often the preferred form of embodiment for engineers. The generated 3D model in this task for a civil infrastructure, such as a bridge, could not only provide a better understanding of as-is conditions but also could benefit engineers in making better decisions either in bridge management or assessment.
Based on the aforementioned information to investigate the common approaches/projects in application of a point cloud for bridge engineering, the process can be roughly classified into two phases: (1) data acquisition and (2) 3D model creation. The first phase refers to the onsite data acquisition strategies to maximize the data coverage and optimize the number of scan stations, while the second phase pertains to the process and methods of obtaining a 3D geometric model from the raw captured points. Bridges often face major challenges due to the shape and orientation of the structures in the data acquisition phase, and also contain complex structural components that make difficulties for the second phase. In the following, the two-phases toward 3D model creation of bridges are reviewed.

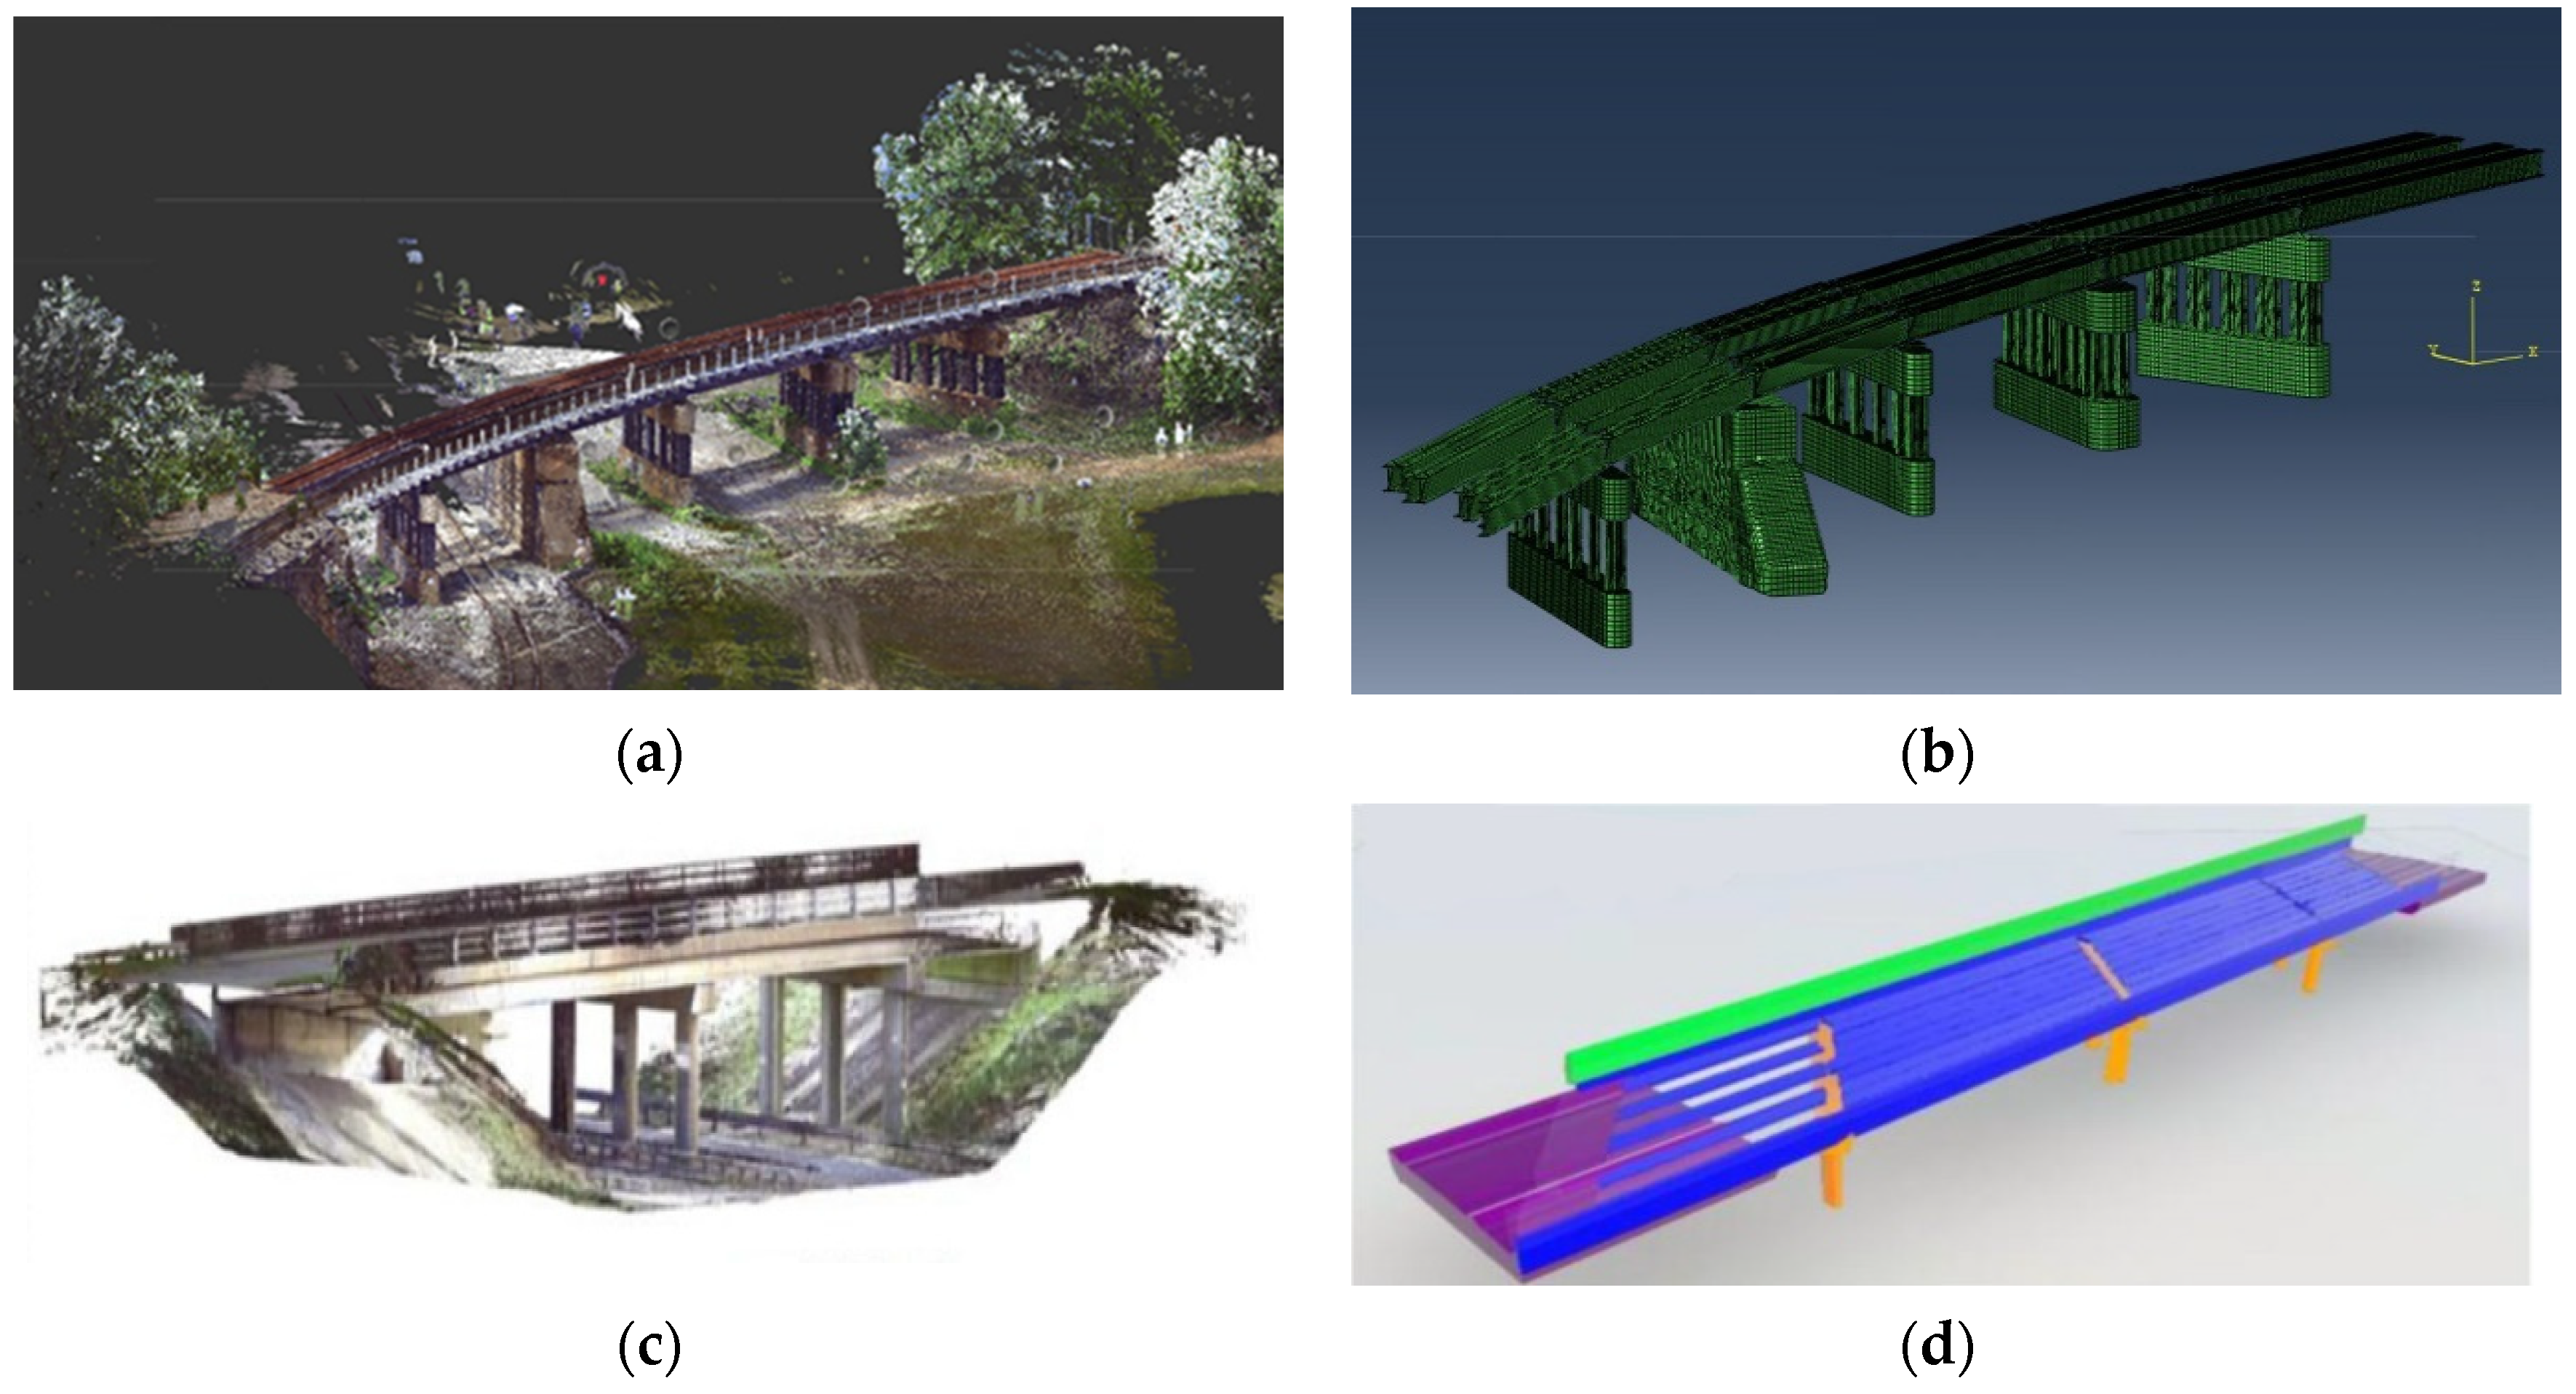
3.1.1. Data Acquisition

Data acquisition is the most crucial and challenging phase to provide sufficient quality and quantity of data point clouds and plays an important role in deploying the point cloud for bridge engineering applications. This phase is closely aligned with the second phase, where errors in scanning or identifying unsuitable scan stations could provide insufficient quality and quantity data points. Besides that, infrastructures, such as bridges, are more diverse and complex in terms of type, orientation, shape, dimensions and surrounding scene, which result in significant challenges in data acquisition. Therefore, preparing a scanning strategy plan to minimize the time on site and maximize the data quality and quantity needs to be carefully considered [1,27,28,29,30,31].
In practice, scanning strategies are usually planned by engineering surveyors after identifying the purpose of data acquisition, site surveying to roughly identify a scanning station network as well as scanning parameters [32,33,34]. Jia and Lichti [35] developed a hierarchical scanning strategy based on an optimization method to figure out the TLS viewpoint planning problems. In another effort, Lu and Brilakis [36] presented a top-down scan strategy and tested on more than ten highway bridges. The results showed that the average required scanning time of these bridges is 2.8 h across 17 scans. Hinks et al. [37] presented a flight planning strategy of collecting data sets that guarantee the complete coverage with minimal data redundancy of the object structure, but the method was applied to a city building model. Biswas et al. [38] proposed a novel scientific scanning strategy plan, which could be utilized in construction sectors. Zhang et al. [39] proposed a practical scanning plan method named “divide-and-conquer” to optimize onsite scans.
Point cloud data are usually acquired based on two parameters: data quality and resolution, which need to be adjusted manually based on the smallest targeted object. Negligence in selecting appropriate parameters can cause low-quality or redundant data production, which could negatively affect the scanning time and post-processing procedures. Rebolj et al. [40] in 2017 presented the results of research on these parameters to define an acceptable metric for evaluation of the laser scanning data quality for 3D model reconstruction. These parameters have also been discussed in some other research works and guidelines [41,42,43].
Data quality setting has a great impact on the data acquisition rate (measured pixel/second), i.e., scanning time and, in turn, the amount of redundant data and the range of noise. On the other hand, the resolution setting refers to defining the smallest recognizable object dimension, which is generally in centimeter order for concrete parts of a structure, and in millimeter order for steel components [1]. Steel structural components are usually made of low thickness segments with edges (e.g., I section) causing a serious challenge for TLS to detect sufficient data points in order to describe edges [44,45]. Moreover, fine resolutions also need to be considered for damage detection proposals to investigate moderate (at least) damages such as visible cracks, spalling, and scaling [46,47,48,49]. Cabaleiro et al. [48] experimentally investigated the cracks of a timber beam using this technology. Results showed that the TLS could detect cracks with the widths of above 3 mm considering an average resolution of 1 mm.
In general, four main factors could considerably affect the quality of data points, including weather conditions, surface smoothness and reflectivity properties, scanning geometry, and laser scanner specifications [13,50]. The first factor relates to the atmospheric conditions such as humidity, temperature, and light, while the second factor is mainly relevant to the surface texture of the exposed object. Surface smoothness, roughness, and color could effectively disturb the laser beam traverse and return with regard to the surface material. Geometry scanning particularly concerns the TLS position and incident angle of the laser beams [13]. Soudarissanane et al. [50] demonstrate a level of noise less than 2 mm by changing the location of the TLS to less than 30 m from the object while considering less than a 40-degree incident angle. Moreover, Laefer, Truong-Hong, Carr and Singh [46] state that the results of crack width detection can highly be affected by the orthogonal distance greater than 12.5 m and 30 degrees of incident angle. In this research, results show the absolute error of 1.37 mm occurring at 5.0–7.0 m orthogonal distance. The last factor refers to the scanner device mechanism, which includes hardware properties and general settings.
Although all the aforementioned factors may be significant for capturing the high quality data points, for a large monitoring project, such as a bridge inspection, selecting appropriate surveying equipment, such as a high-tech laser scanner, tripod with stabilizer and having a detailed scanning plan, could certainly reduce the impact of capturing redundant data.

3.1.2. Three-Dimensional Model Generation

The objective of this phase is to create a 3D model of the bridge structures from the captured raw data points to be utilized for either bridge information modelling (BrIM), bridge assessment and maintenance. The generated virtual 3D model could be used throughout the bridge’s lifespan, from the design stage (also known as as-design) to practical purposes of the existing structure (called “as-built” or “as-is”). During the bridge’s lifespan, the bridge conditions may undergo changes due to variations in construction and operation phases, which cause a different status compared to the design documents or the initial status. In such circumstances, only an accurate as-built 3D model derived from a detailed survey can illustrate the actual modifications of the structure [51,52].
The 3D model generation phase contains three steps of pre-processing, segmentation, and computer-aided design (CAD) model creation [53]. Pre-processing refers to data clean up and registration of the raw data points. Generally, raw data points acquired by TLS contain noise, which affects the construction of the 3D model. This noise can be reduced using various filters such as Angle, Median, and Chordal [54,55] in the data clean-up stage. Besides that, considering multiple scan locations, acquired data point clouds need to be aligned using target points and alignment methods known as the registration stage [56]. Recently, pre-processing stages have become a considerable capability for TLS instrument and software, containing intelligent systems to accelerate this phase and reduce the office works [57,58]. Segmentation is the other step of defining logical divisions for the acquired data points to become interpretable as a geometric shape presenting the detected object’s surface [53,59]. Since the number of acquired data points is usually very large, presenting an accurate automatic segmentation method has become a challenge during recent years. To overcome this, constructive solid geometry (CSG) and boundary representation (B-rep) methods have been adopted [60,61]. The CSG method generates 3D solid models based on the combination of volumetric primitives using Boolean operations while the B-rep method provides a way to trigger a collection of surfaces as a 3D object. In CSG, the solid models are described as a series of bounded simple primitives including cone, cylinder, sphere and cuboid in a particular process known as the CSG hierarchical tree to generate a solid model [60]. However, the B-rep method tries to extract boundaries from the raw data points representing edges, vertices and surfaces, as the skeleton of the solid model [62]. Employing the CSG method, all detected components of the bridge structure are divided into a number of simple subsets/primitives extracted from the raw data points. In recent years, many studies have been focused on utilizing the combination of B-rep in CSG method [59,60].
In extracting point clouds of individual surfaces for generating 3D models, researchers tried to develop segmentation algorithms that automatically classify captured data points, meeting the same features into the same subset known as “Feature-based segmentation” or segments based on data points satisfying mathematical models named “Model-based segmentation”. Both identification of the surface’s curvature based on captured data points [63,64] and comparison of neighboring point features, such as the angle of normal and unit vectors [65], are some of the features developed in algorithms such as region growing [66], ray-tracing [67], cluttering and voxel/cell-based algorithms [68] in the feature-based segmentation. However, in the model-based segmentation, algorithms such as Hough transform [69,70,71] and RANSAC [72,73] are often used.
The creation of the 3D CAD model is the last step of generating an integrated geometric model using the segmented data points. There are several approaches, fitting and sweeping are two frequent techniques used in this regard. The former technique refers to fitting simple primitives extracted from the segmented points while the latter indicates a technique of extruding a segmented shape along a path to obtain the 3D CAD model visualization. Examples of these techniques have been developed in existing research works conducted by Walsh, Borello, Guldur and Hajjar [66], Barazzetti [51], Xiong, Adan, Akinci and Huber [67], Stull and Earls [74],Laefer [75], and Yang et al. [76]. In these research works, efforts have been made to develop a high-level algorithm or introduce a detailed scanning plan to auto-identify specific sections of a structure, especially bridge structures.
In an effort to develop a fitting technique, Walsh, Borello, Guldur and Hajjar [66] utilized the region-growing algorithm to segment data points belonging to each surface of a reinforced concrete bridge pier cap. After that, a planar surface was fitted to each segment, and then the completed 3D model was made based on the interactions and orientations of the fitted surfaces. In another effort, Barazzetti [51] presented a semi-automated method containing NURUBS as a mathematical function for direct geometric modelling of an object with complex surfaces. Xiong, Adan, Akinci and Huber [67] proposed an automatic method of converting raw data points into an as-is BIM using a ray-tracing algorithm to identify occluding objects with block visibility. Cabaleiro et al. [77] developed a line detecting method using the Hough transform algorithm to obtain an accurate boundary representation of a steel frame component.
So far, more studies have been conducted and targeted on the latter technique, sweeping. In an initiative, Laefer and Truong-Hong [45] proposed an automatic method identifying the cross-section of a steel structural component and exploiting the 3D model by sweeping the detected profile along its longitudinal direction. In continuing research in this area, Laefer [75] elaborated on another method which involves identifying multiple cross-section cuts along the principal direction of a steel component. In this method, more reliable 3D models with an actual representation including longitudinal changes were created [75]. Similarly, Yan et al. [78] developed a voxel-based mesh generation method consisting of three actions to create a computational 3D model of a structure. This method starts with the extraction of cross-sectional cuts using the voxel-based algorithm and then exploits the correct map of the components by extruding the detected cuts along their principal axes. In order to test the proposed method, a full-scale bridge was scanned, and its geometric 3D model was made, as shown in Figure 6a,b. In a similar strategy, Lu et al. [79] proposed a top-down segmentation process for detecting major bridge components such as slab, pier, and girder relying on boundary extraction algorithms to estimate the shape of the structural components by merging multiple sliced models. This method was tested on 10 sets of concrete bridge data in London and one of the slab bridges is shown in Figure 6c,d [79,80].

3.2. Quality Inspection

In the last few years, TLS has proven its potential benefits in conducting geometry inspection of damaged infrastructures, such as bridges. This section summarizes the research efforts on identifying the most probable bridge surface damages such as cracks, mass loss and corrosion of structural members.

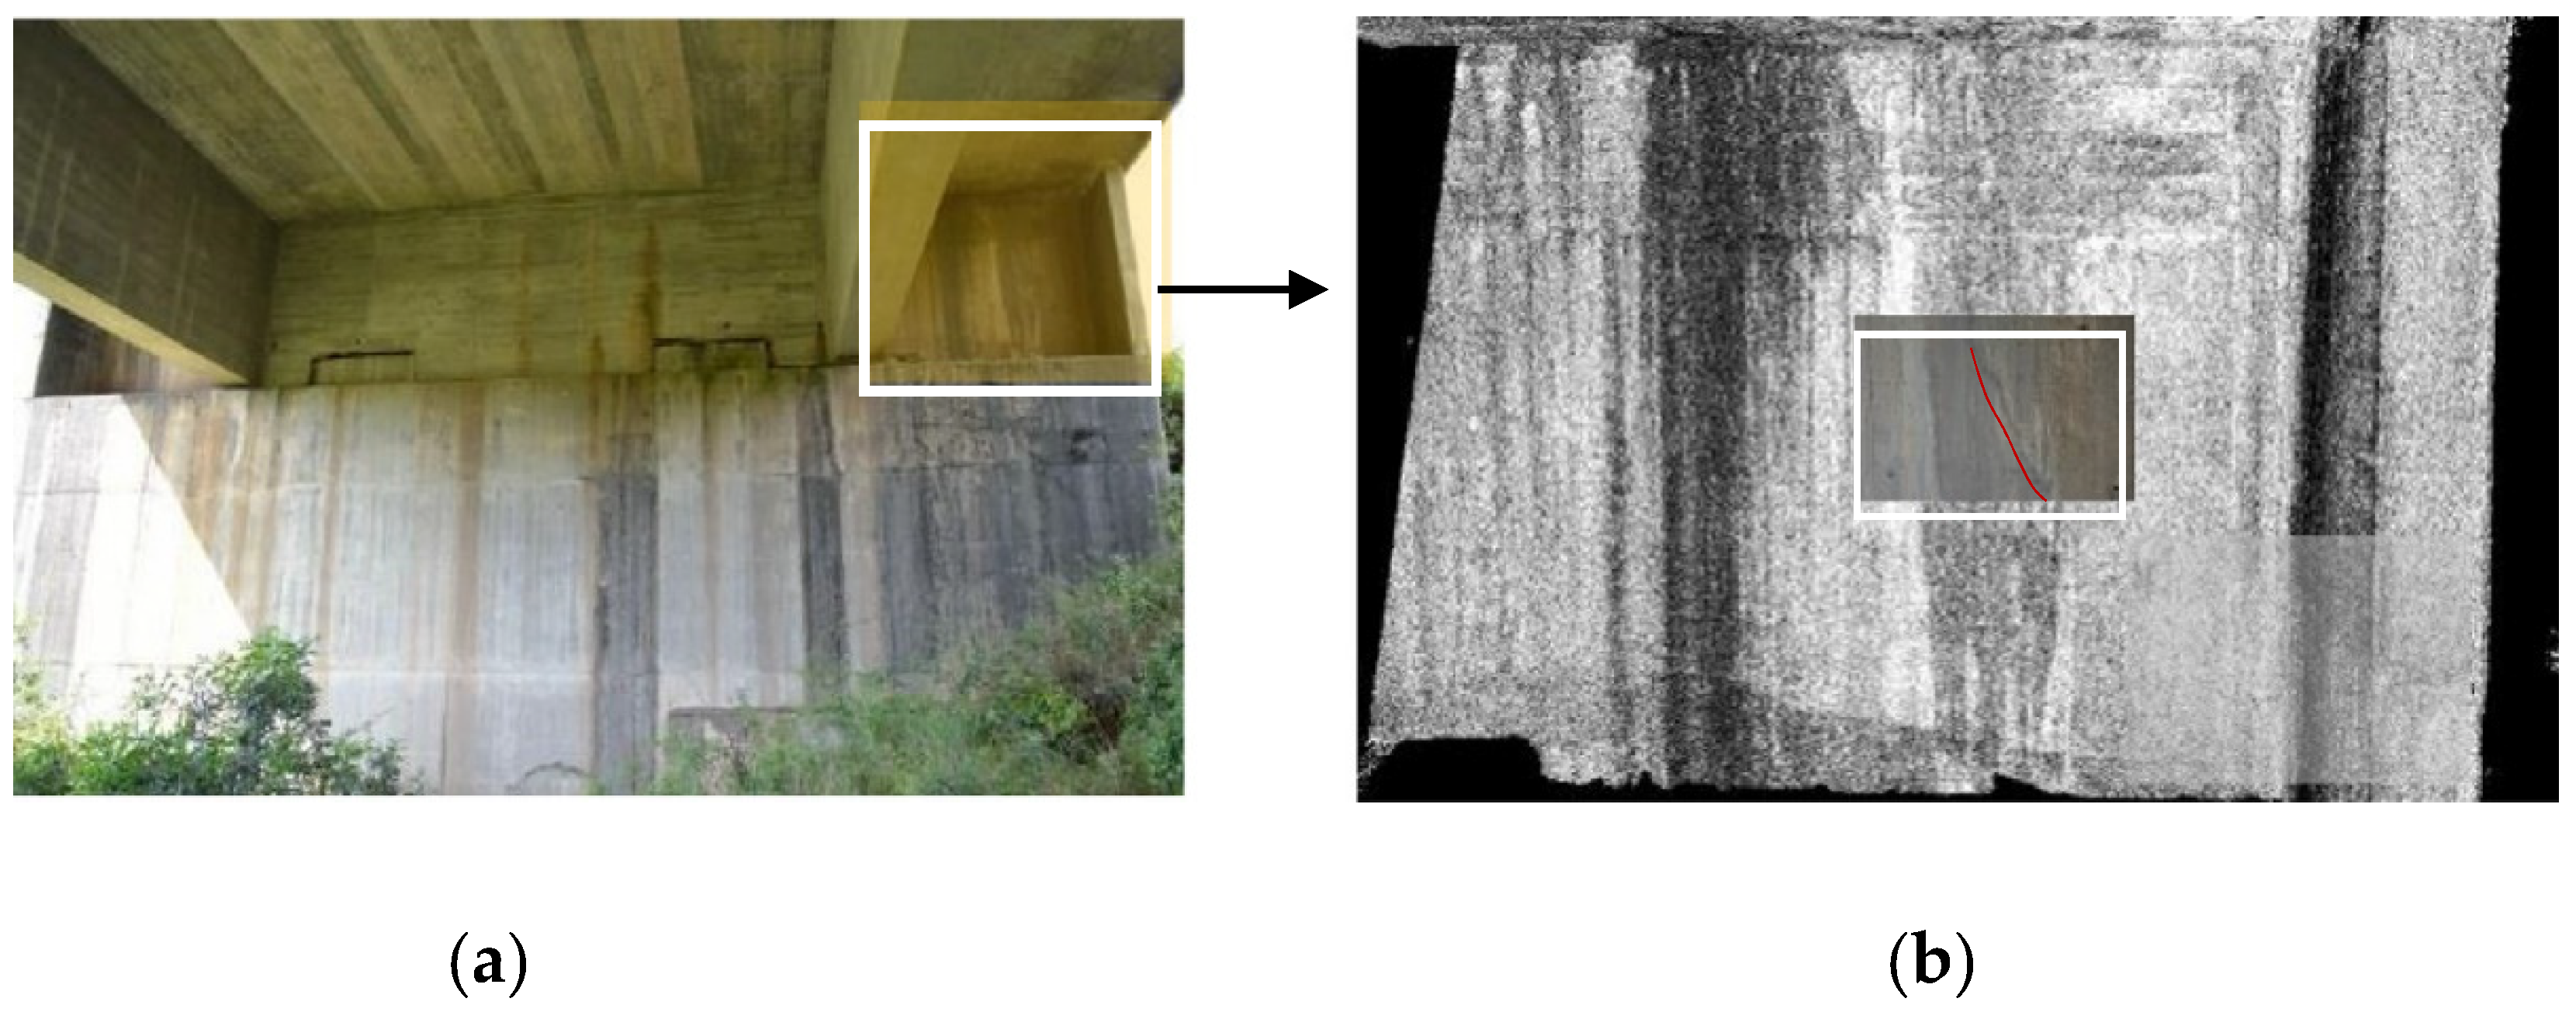
3.2.1. Crack Detection

Traditionally, the optical evaluation was considered as a reliable method for crack inspection of bridges, which was performed using a hand-held measuring magnifier or a crack width ruler [47]. These evaluations could assess only a few accessible areas of the structures, were quite labor intensive, time-consuming and subjected to human error [8,81,82]. Mechanical probes and electronic sensors were the next generation. They were more developed than the previous method and able to measure crack features such as length and width [83,84,85,86]. Although those instruments provided high accuracy for crack detection, they suffered from significant limitations, such as limited measurement range, physical access requirements, and considerable costs [87]. Alternatively, TLS known as a non-contact method and an efficient tool was able to accurately capture details of structures, which is emerging an alternative unit to overcome the shortcomings of direct visual inspections [88,89]. Nowadays, various types of laser scanners are available with a wide range of data acquisition speed (generally 2000–120,000 points per second) and resolution (generally 0.8–100 mm at 10–300 m) [88].
On the other hand, with TLS having some limitations relating to resolution and noise level of the point cloud, unique challenges in crack detection appear. Particularly, for small cracks, the problems such as noisy data or mixed pixels may result in inaccurate information [90]. The RGB color model is effectively utilized as an additional attribute for crack detection to solve these problems [91], but it requires high accuracy of mapping RGB colors from images to the point cloud. The dependency of data quality and accuracy on the scan position and scan range are the other drawbacks to be considered while using TLS for crack detection [47]. In this regard, Anil et al. [92] characterized the performance of laser scanners for identifying even the thin cracks (visible cracks as small as 1 mm) in reinforced concrete frames using an automatic method presented by Tang et al. [90]. In this effort, the effects of parameters such as the sampling interval of the scanner and the range of the laser beam from the surface on the detection of the minimum crack size were investigated.
Considering the significance of regular bridge inspection, crack detection as part of structural assessment plays an important role in planning maintenance strategies and optimizing time-consuming interventions [47]. In this regard, a fundamental mathematical approach was proposed by Laefer et al. [46] to measure the minimum detectable crack width using terrestrial laser scanner in unit-based masonry. In this study, it was indicated that the minimum detectable crack width depends on the technical specification of the scanner and the scan range. Therefore, at ranges less than 10 m, TLS can detect vertical cracks of at least 5 mm. In addition, it was presented that the orthogonal distance played a key role in the accuracy of the obtained information—e.g., at distances between 5 to 7.5 m, the results contained small errors. In another effort, Truong-Hong et al. [89] suggested using RGB color model to identify crack characteristics (e.g., length and width) by measuring the distance between data points on the crack edges. Similarly, Valenca et al. [47] presented an integrated method of laser scanning and image processing considering color RGB values for automatically measuring the width, length, and orientation of cracks occurred in a concrete bridge in Portugal as shown in Figure 7 [47]. In a similar method, considering an average resolution of 1 mm for TLS, Cabaleiro et al. [48] identified the timber beam cracks with widths above 3 mm. Table 5 summarizes different examples of crack detection/mapping for components made of different materials.

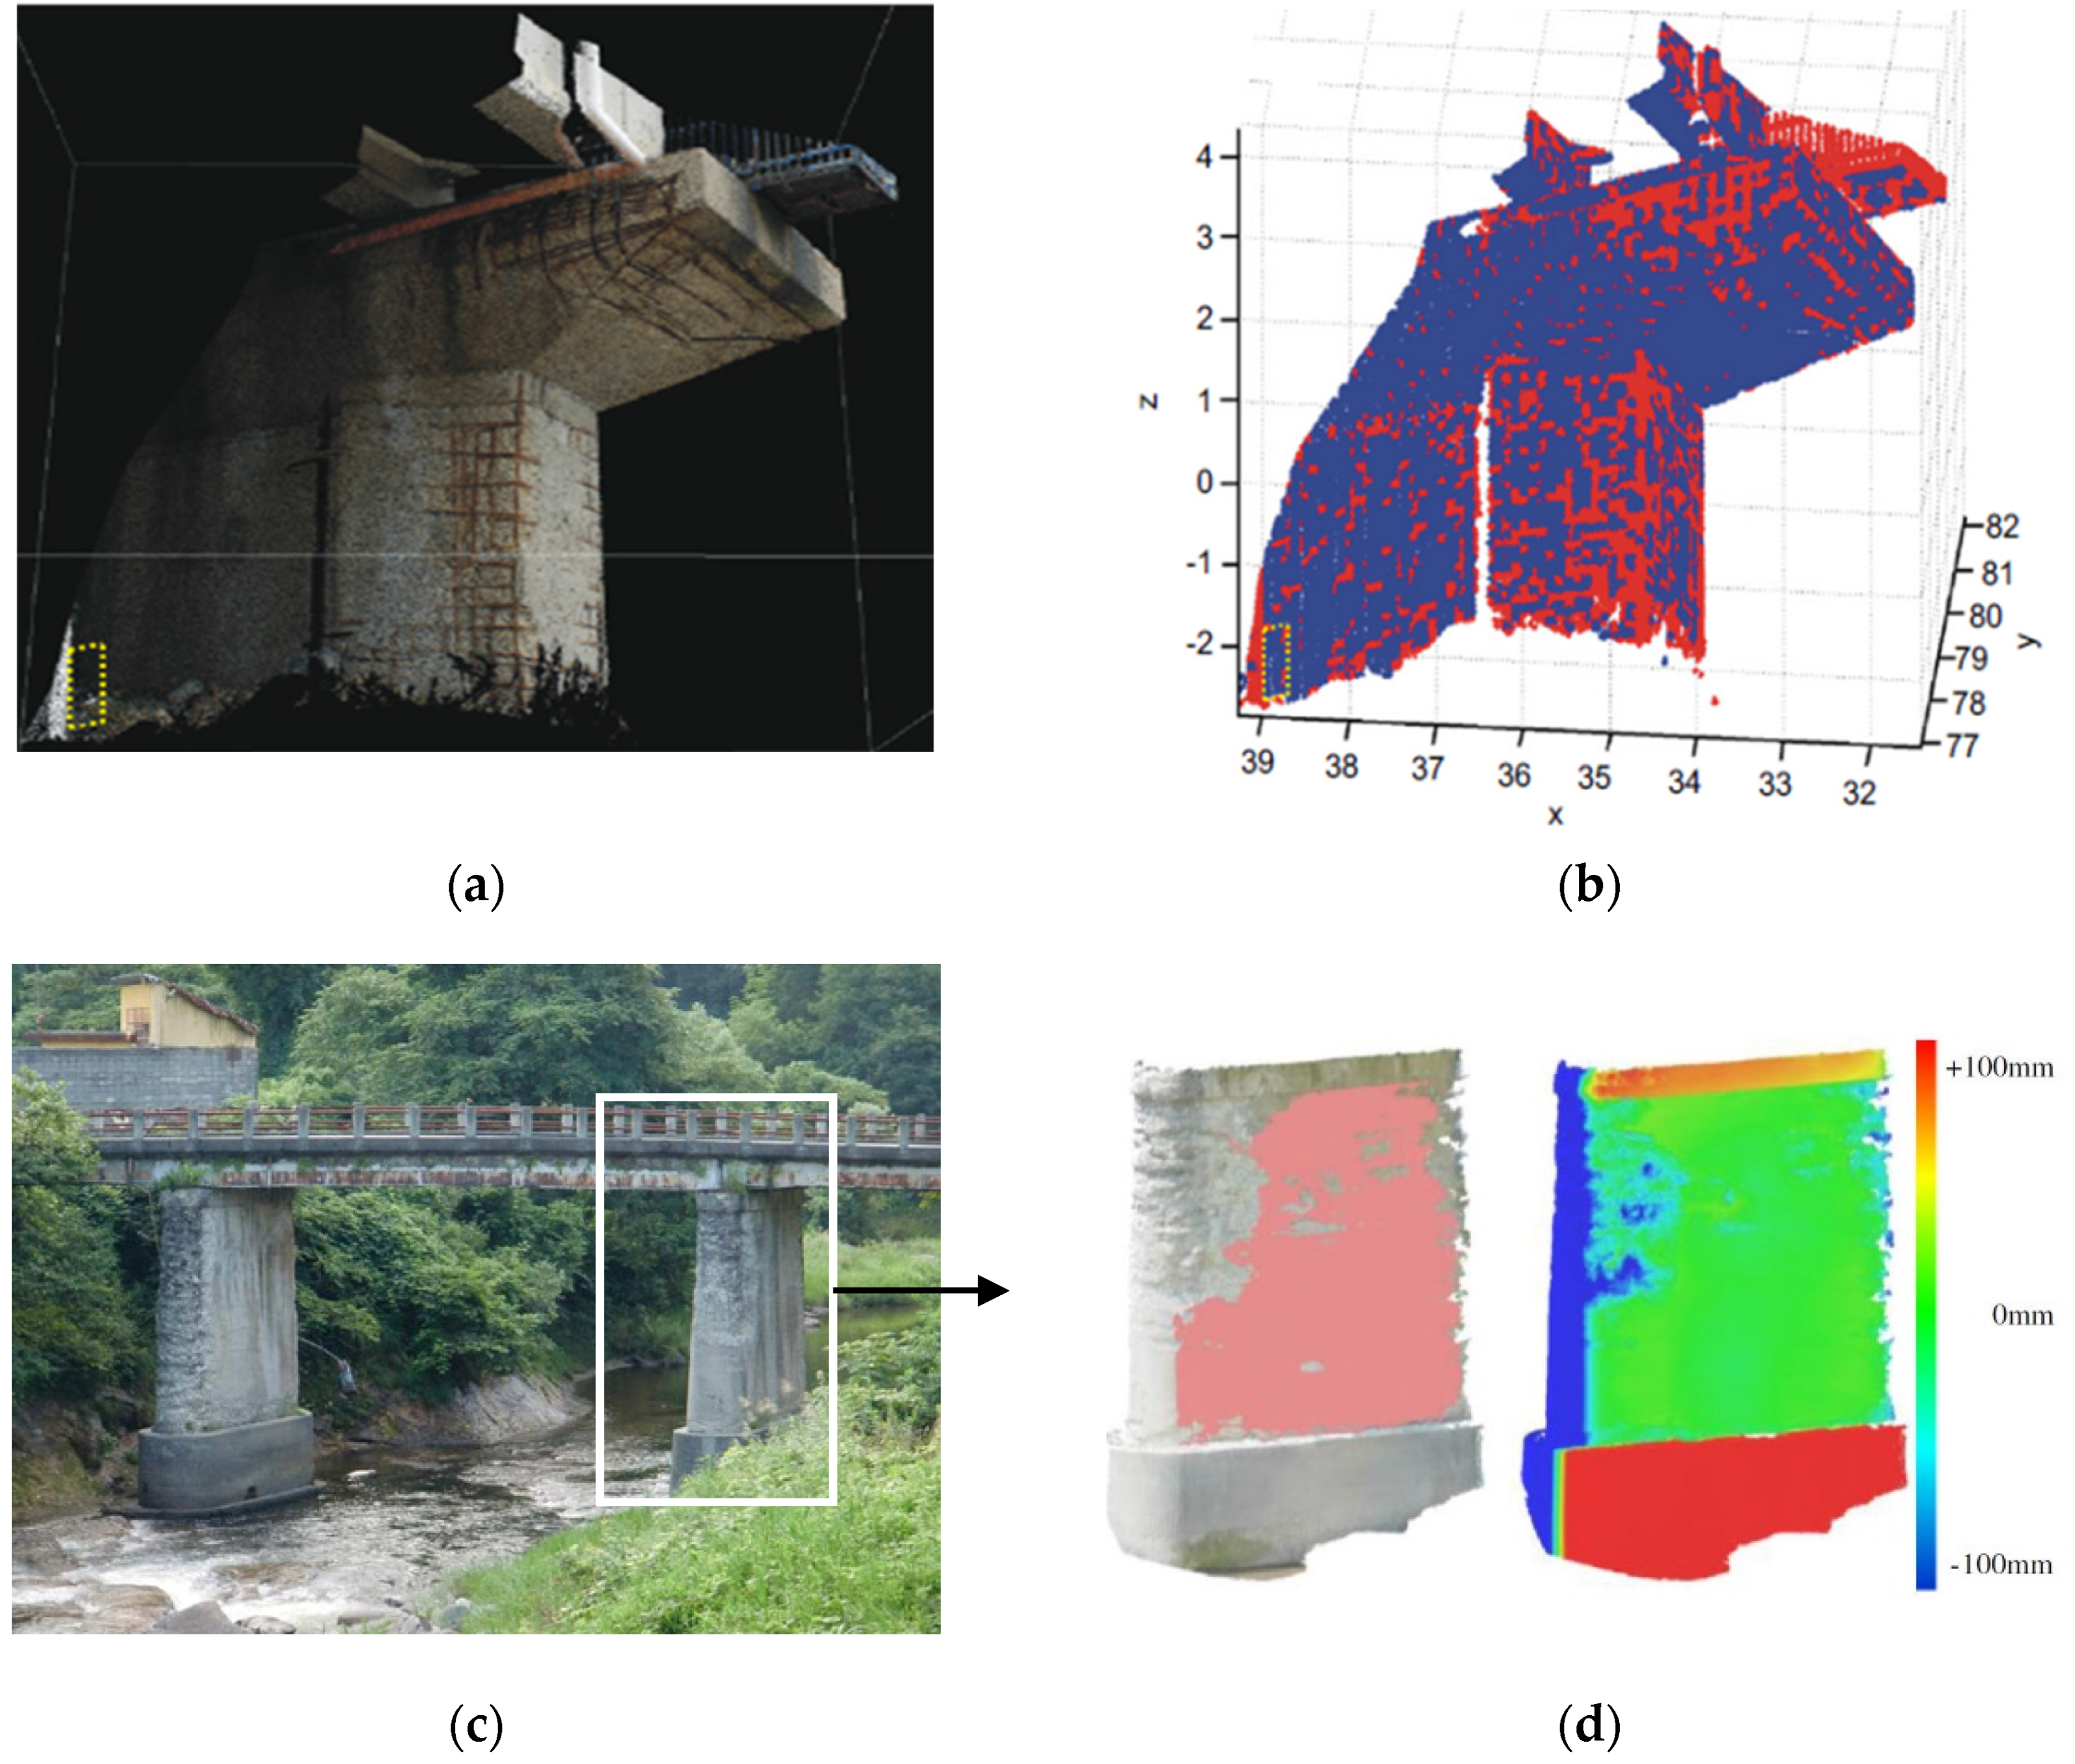
3.2.2. Mass Loss, Scaling and Spalling

Vibration due to dynamic loading conditions caused by traffic and high winds, and/or impact of harsh environmental conditions, can generate damages such as mass loss, which can be significant over time [106]. Therefore, inspection and monitoring the health status of bridge structures at certain time intervals can play a significant role in detecting signs of deterioration and planning proper counter measures or restoration [107]. Teza, Galgaro and Moro [106] were among the first researchers who proposed an automatic method of recognizing surface damaged areas using TLS observations/information. This method was based on the calculation of some properties of selected surfaces such as Gaussian and mean curvatures. In this study, piers and T-shaped beams of a concrete bridge in Italy were selected as a case study, and the obtained data were compared to the onsite visual observations. Figure 8a,b demonstrates surface damages caused by weather conditions in the concrete pier captured by TLS with RGB values. As shown in Figure 8b, the point cloud was subdivided into small sub-areas and the provided algorithm applied on each sub-area, separately. The findings of this research showed acceptable agreement between the selected damage areas, shown by red color, and inspected damage areas using Gaussian curvature computation. In another effort, Liu et al. [108] applied a damage quantification method on the acquired TLS data to detect the defective areas. In this study, a combination of distance and gradient-based damage quantification methods was used for mass loss detection of the pile caps of a bridge substructure. The result of this research showed realistic quantification, which encouraged the bridge engineers to better quantify bridge damages using TLS.
Mass loss damage can also be generated due to spalling and scaling in concrete surfaces [109,110,111]. In this regard, Mizoguchi et al. [109] proposed an effective method based on region growing algorithm for quantitative analysis of the scaling on damaged surfaces of concrete structures using laser scanning data. The results of this research showed the effectiveness of the proposed method on bridge case studies shown in Figure 8c,d. Similarly, a recent technique for detecting such damages presented by Kim et al. [112] allows engineers to specify the location of surface damages and quantify the spalling defects. The results of this research indicated that the proposed technique is applicable for detecting surface damages larger than 3 mm in both length and depth.
Flatness defect detection is another approach that can be conducted using TLS [113,114]. In this regard, a series of experiments was carried out by Tang, Huber and Akinci [113] to investigate the performance of different proposed algorithms and compare the results to obtain the best outcome. In this study, various parameters, including varying types of laser scanners were utilized, and varying scan locations and distance, size and thickness of defect were analyzed. The findings of this research indicated that the flatness defects as small as 30 mm across are detectable from a distance of 20 m. Table 6 summarizes different examples of mass loss, scaling and spalling damages detected by TLS.

3.2.3. Corrosion, Water Bleeding, and Efflorescence

The presence of water and its ingress into structural members are the main causes of some types of damage such as corrosion, crust, water bleeding, and efflorescence, which needed to be considered during the inspection process [115,116,117,118,119]. Kalenjuk and Lienhart [120] proposed a practical solution to generate ortho-images from a high-density point cloud of the surface. Subsequently, the damaged areas could be identified using integrated image processing and laser scanning methods. In a similar study, González-Jorge et al. [121] used unsupervised classification applied to ortho-images of a bridge in Spain to detect efflorescence and biological crusts. Similarly, Shen et al. [122] investigated the existence of rust in images of a bridge using Fourier transform method and color image processing, simultaneously.
In the case of water bleeding and efflorescence, Truong-Hong and Laefer [123] used a support vector machine (SVM) to detect damaged surfaces of a bridge in Ireland. In this study, the proposed algorithm showed an acceptable agreement of more than 80% between the classified and the manually extracted areas. In another effort, González-Jorge et al. [124] used a three-stage algorithm to automatically classify and detect efflorescence using mobile laser scanning for a bridge in Spain. Moreover, Kushwaha et al. [125] utilized integrated laser scanning and close-range photogrammetry techniques to analysis the surface defects of three existing bridges for features such as corrosion, water bleeding, vegetation and crust. Table 7 summarizes different examples of corrosion, water bleeding, and efflorescence damages detected using various algorithms and methods.

3.3. Structural Assessment

The successful application of laser scanning technology in providing accurate and reliable information about the state of the health of structures in a short time has significantly impressed and attracted civil engineers’ attention. The possibility of extracting detailed geometric information as the basis of creating a precise computational model has made TLS a high-potential instrument for structural analysis. This model not only provides a detailed vision of the existing structure, but also allows one to obtain resulted simulations close to real behavior of the structure. As such, in recent years, structural engineers have taken advantage of the constructed geometric models as a basis for assessing structural performance [126,127,128,129,130,131,132,133,134,135]. That allows one to improve a decision system for possible actions of the maintenance timely, especially for large-scale complex structures such as bridges [136,137,138,139]. On some occasions, the extracted 3D models were also used as a basis to obtain a calibration for unknown parameters of the structure or components known as inverse engineering [127,140].

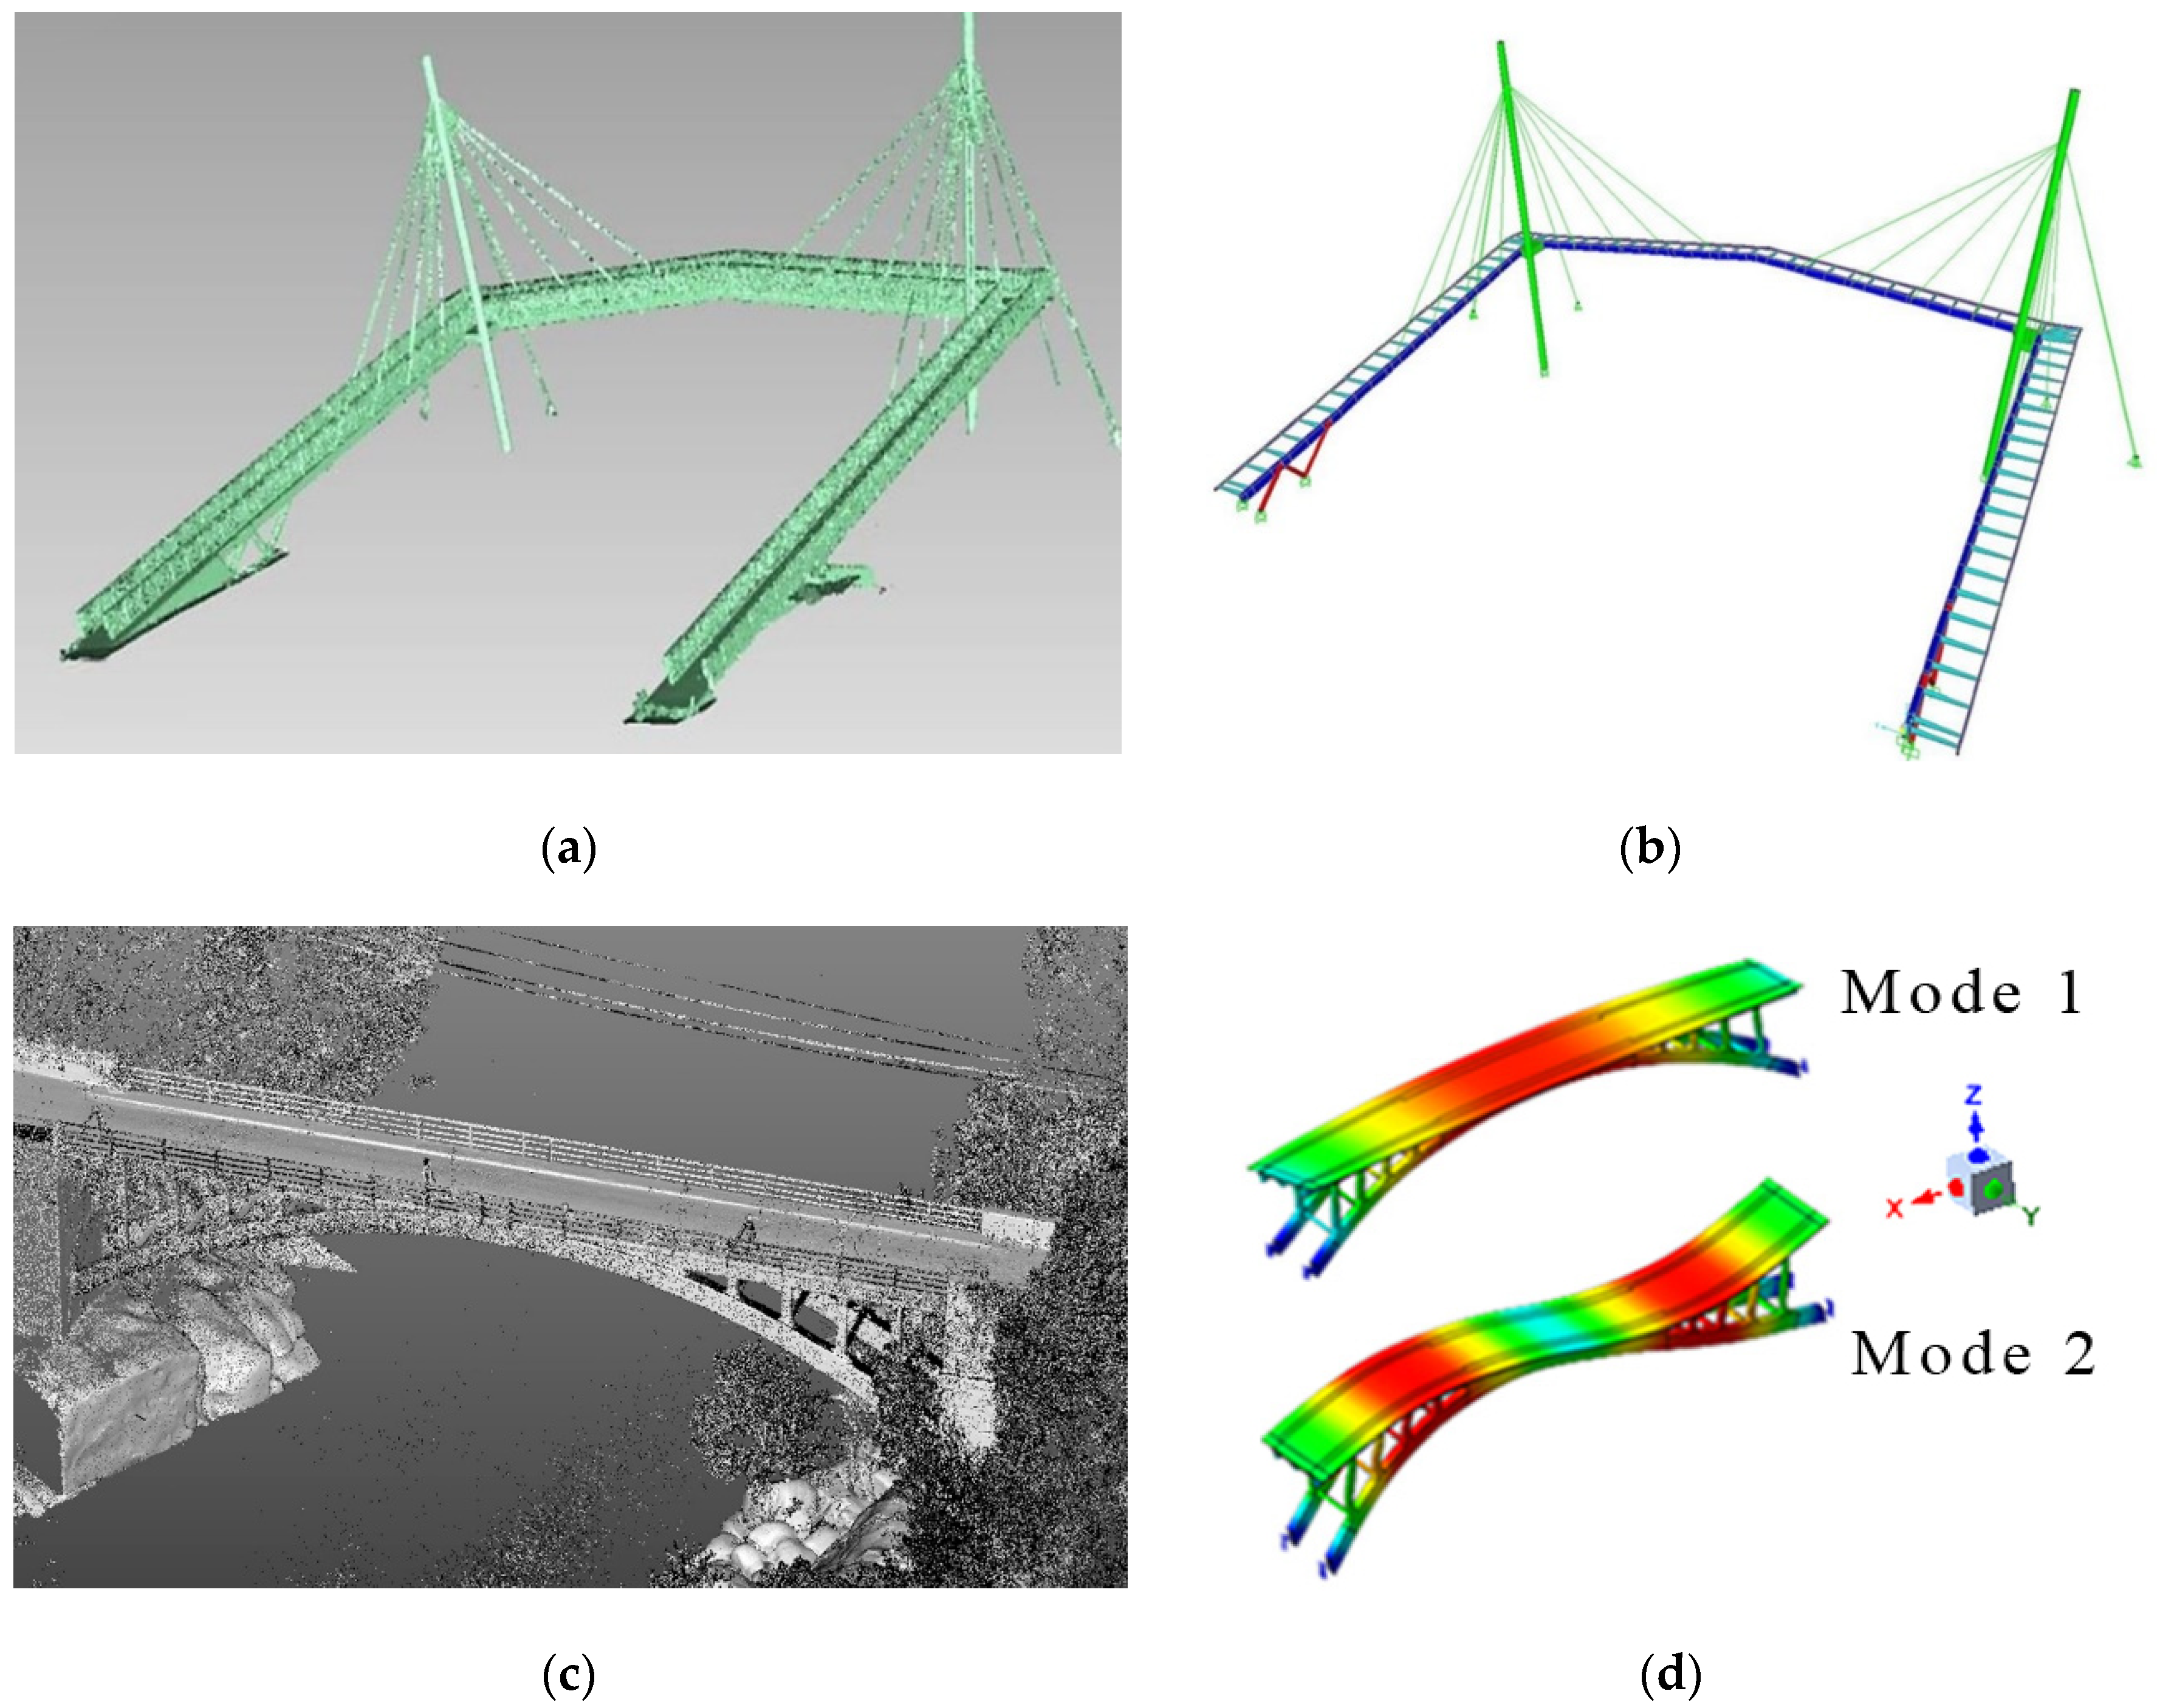
3.3.1. Geometric Modelling

Over the past decade, the methodology of utilizing the data point clouds as a basis for extracting suitable solid 3D models, with the purpose of structural assessment, has been widely established. During this period, researchers have mainly focused on the development of semi- and/or fully automatic methods, discussed in Section 3.1.2, to convert raw data points into a 3D solid model [52,141,142,143,144,145,146], since discrete points cannot directly be used for structural analysis. Creation of 3D models using these methods can considerably assist structural engineers to carry out the structural analysis using the finite element method (FEM). It can also benefit them in having a precise 3D model and accurate analysis even for large-scale, complex structures such as bridges.
One of the first applications of laser scanning technology in bridge assessment was presented by Stull and Earls [74]. In this study, a damaged composite bridge was modelled based on TLS information and the reserve capacity of the bridge structure was estimated reaching that of the extracted finite element model (FEM). In another effort, Lubowiecka et al. [147] evaluated an ancient masonry bridge with complex geometry based on finite element analysis. The captured information from TLS was used for defining the updated geometry of the aforementioned bridge. Similarly, Armesto et al. [148] presented a dimensional and structural analysis of an ancient arch bridge to control its deflection arising from material aging. Moreover, Ming et al. [149] employed TLS to capture 3D spatial data of a large steel structure. The captured data were then utilized for reconstruction of the 3D model and deformation analysis. Moreover, Sánchez-Aparicio et al. [150] proposed a workflow to improve the calibration of finite element models converted from the acquired data points. In this study, experimental modal identification was utilized as a non-intrusive system to identify the global properties of the structural system. Similarly, Khaloo and Lattanzi [151] used such workflow for extracting information from TLS to create a finite element model of a timber bridge. In another effort, Bitelli et al. [152] developed a semi-automated voxel-based mesh generation method for converting data points directly into the finite element model. In this study, the proposed method was tested on a cultural heritage with the aim of structural analysis. This was an initial concept for other studies in which Castellazzi et al. [153], Korumaz et al. [154], and D’Altri et al. [155] presented a semi-automated strategy that enables the transformation of data point into finite element mesh with the aim of health assessment of historical structures. In another research, Conde-Carnero et al. [156] proposed another automated approach for direct conversion of data points into a suitable finite element model with regard to structural analysis. In this effort, the presented approach was utilized for the structural assessment of an existing footbridge, shown in Figure 9a,b, under design loads. Concerning the structural assessment of another historical bridge in Portugal, laser scanning, and some other non-destructive tests were conducted by Bautista-De Castro et al. [157]. The results of these tests were used to calibrate the finite element model suitable for numerical evaluations and bridge condition assessment. Moreover, regarding the importance of assessing safety conditions, static and modal analysis were conducted on the constructed model under conditions of traffic load and vibration, Figure 9c,d. This study concluded the existence of sufficient bearing capacity, and safety factors were determined based on the current state of this historical bridge [158].

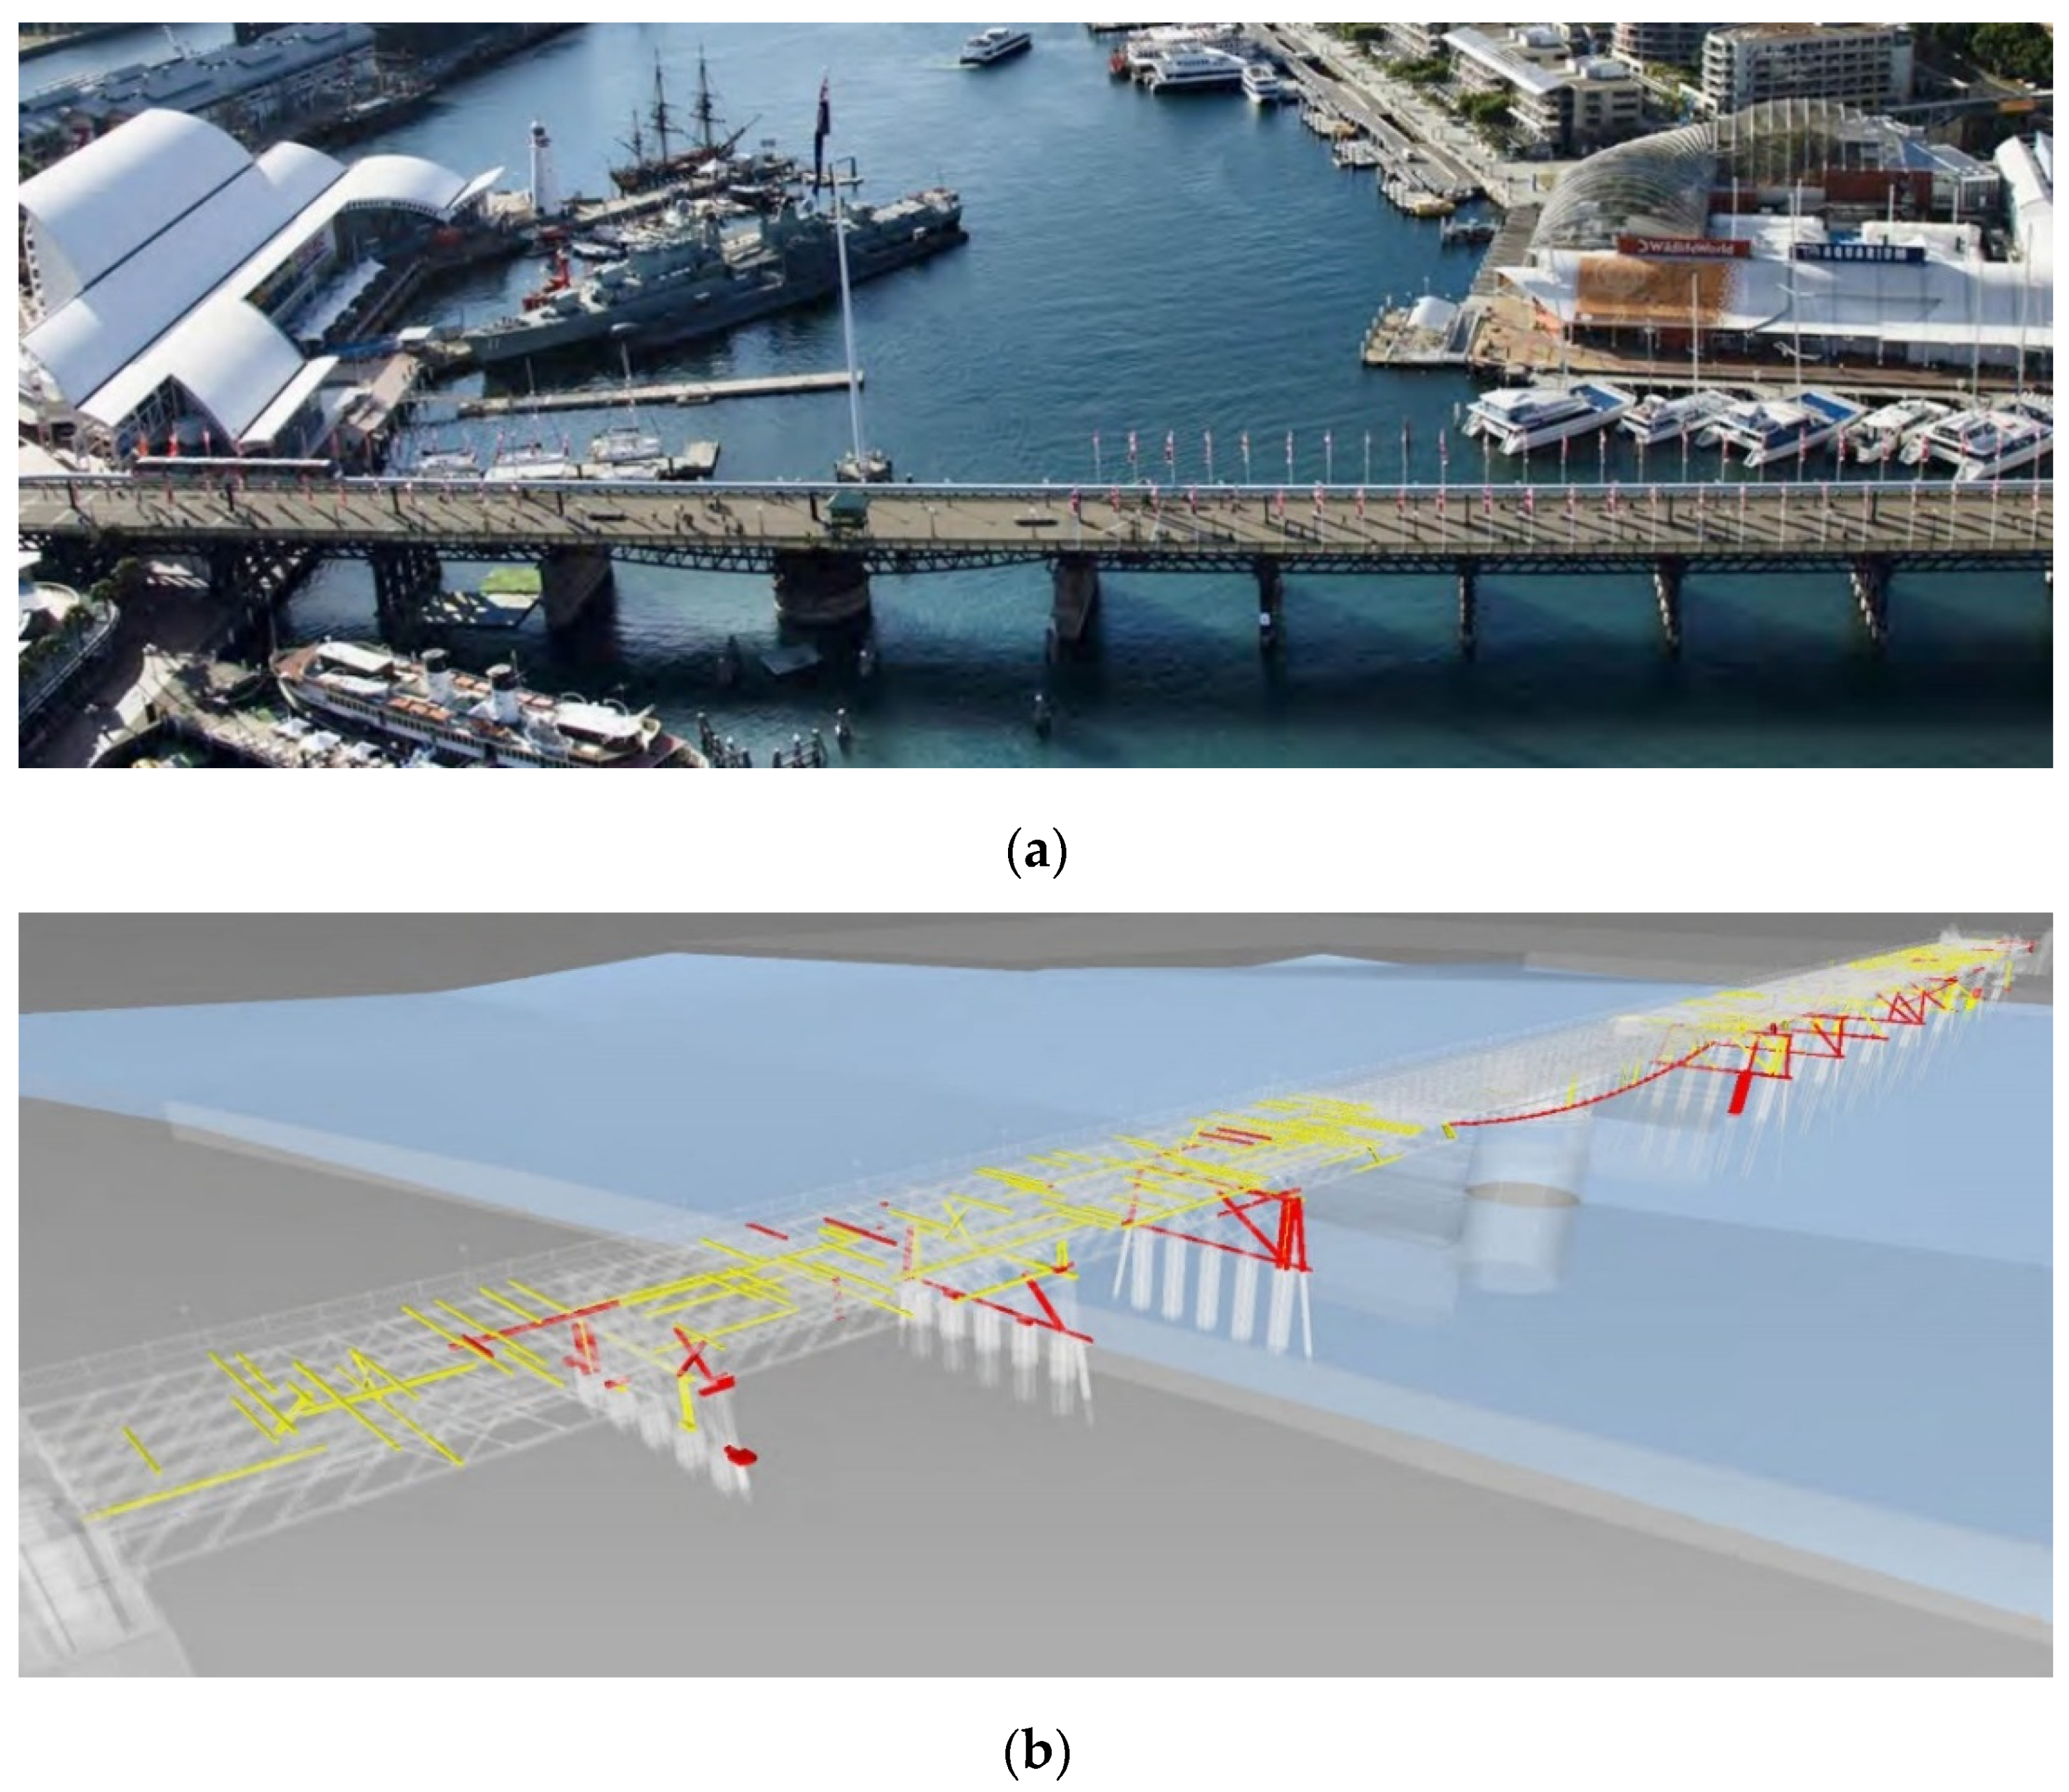
3.3.2. Deformation Measurement

In addition to the aforementioned studies, TLS has also made notable contributions in assessing bridge structures with the aim of capturing vertical deformations. Zogg and Ingensand [159] were, perhaps, pioneers of utilizing TLS to measure the accurate vertical deflection of a bridge under load. They proposed three different loading scenarios to investigate the application of TLS in evaluation of surface deflection. Similarly, Lovas et al. [160] also described the advantage of using TLS for deformation monitoring of bridges in comparison to other traditional surveying methods. In another effort, Minehane et al. [161] evaluated the settlement of two bridge case studies based on their constructed FE model. In this study, the deformation was monitored and assessed according to the BD21/01 guidelines using TLS data points [162]. Similarly, Mill et al. [163] tested the applicability of TLS for identifying the spatial distribution of bridge deformation. Considering this concern, in another effort, Gyetvai et al. [164] presented a workflow to generate the geometric models for conducting a finite-element-based structural assessment. In this research, the FE model of a wrought-iron bridge was created and assessed under different loading scenarios based on the AASHTO guideline [165]. In a recent practical study, Cha, Park and Oh [136] presented an efficient shape information model to be utilized in deflection monitoring of bridge structures. This study described two practical tests performed on real cases, considering loading scenarios mentioned in the Korean highway bridge design standard [166], as shown in Figure 10a. In this study, the average vertical deflections from the data points were calculated and compared with LVDT measurement for verification. The results showed a reasonable difference of less than ±1 mm in calculations. In a similar strategy, Gawronek and Makuch [137] compared the vertical deflection values of an ancient railway bridge using TLS with conventional surveying methods under static loads. In this study, the loading scenario was defined, considering the railway technician consultation, as shown in Figure 10b. The results indicated a maximum and average deviation of ±3 mm and ±0.3 mm in measurements. However, the available TLS devices on the market offer the possibility to collect high-accuracy data of less than a millimeter. More accurate TLS devices with lower deviations can be a valid alternative for electrical and mechanical measuring equipments generally used in the field of bridge engineering [167]. Table 8 summarizes different examples of using TLS for deflection measurement of bridges.

3.3.3. Inverse Engineering and Model Updating

The possibility of extracting high detailed geometric information of structures from TLS point clouds has made TLS an alternative unit in providing a valuable source of data to be used for quantitative research approaches. Utilization of laser scanning for geometric identification purposes, as well as a combination of this technology with 3D printing, has led to the development of a novel process for reproducing historical or key components of structures, called inverse engineering [168,169]. Laser scanning technology can simply bring the 3D geometric information of an object into a 3D virtual workplace.
From the engineer’s perspective, this source of information can be utilized for calibration of FE models [170,171] discussed in Section 3.3.1 for bridge structures or similar problems containing uncertainties supposed to be estimated through inverse analytical procedures named model updating [127,140,172]. In an effort, Conde et al. [173] proposed an inverse analytical procedure for masonry arch bridges to be investigated for damage conditions. In this effort, an optimization method, using the genetic algorithm, was utilized to obtain a satisfactory convergence between the predictions of numerical modelling and actual deformation measured under different loading scenarios. In a recent study, Yang, Xu and Neumann [127] experimentally investigated the application of data points acquired by TLS for estimating the uncertain elastic parameters of a small-scale composite arch bridge specimen. In this study, the composite arch specimen was subjected to a monotonic load, and then point clouds of the specimen’s deformed shape were captured at each loading step. A finite element simulation considering similar geometric and loading conditions was developed. By presenting a model updating workflow for optimizing the difference between the surface deformation obtained from the real measurement and the simulation, the calibration of parameters was achieved. In this regard, similar strategies were carried out by Lee and Park [174], Xu, et al. [175,176] and Yang et al. [177,178]. Although available TLS devices have the potential to provide data with less than a millimeter accuracy, such accuracy should still be improved to achieve more reasonable results in terms of the reverse engineering and model updating.

3.4. Bridge Information Modeling (BrIM)

Although several management methods have been considered in traditional frameworks, employing a conservative management method for bridge health monitoring and maintenance has been well developed by the use of BrIM during the last decade [179,180,181]. In recent years, applications of bridge information modeling have provided faster solutions and processes for integrated bridge information in a shared platform. In this regard, Chen and Shirolé [182] critically compared the valuable benefits of using BrIM as an advanced technology with traditional 2D drafting techniques [183]. BrIM pertains to the specific form of building information modeling (BIM) application in terms of bridge engineering, referring to the creation of 3D CAD model associated with integrated additional information of time and cost estimation, energy consumption, etc. [184]. Three-dimensional CAD models are linked to other related tools allowing evaluation of time as the fourth dimension (4D), cost as the fifth dimension (5D), and energy as the sixth dimension (6D) during the different phases of bridge design, fabrication/construction, operation and maintenance. BrIM technology can improve, support, and facilitate simultaneous works by multiple process disciplines, while reducing the time-consuming project controls and possible errors in terms of design, construction, and assessment [185]. The bridge model can provide a wide range of information, including the 3D graphic presentation and all used specifications in the bridge project such as previous analysis, assessments, equipment, control systems, and other related decisions provided in different phases of the project. An accurate and reliable source of data is required for bridge monitoring that can offer a useful starting point for development of bridge management systems [186,187,188]. BrIM, as an integrated platform, can support real-time monitoring/inspection of bridges by providing an interface for “as-is” conditions and remote operating management of the system. Although BrIM provides an ideal platform for various developments, many of these capabilities have not been well-established in this area [184]. During the last decade, the utilization of highly accurate laser scanning data, as an emerging technology for capturing the “as-is” geometry conditions of the bridge as a BrIM input, has meaningfully increased. In this regard, Tang et al. [186] were among the first researchers who investigated the utilization of laser scanning for bridge inspection and management. In this study, a laser scanning approach for geometric bridge inspection was presented using a bridge case study. In another effort, Tang et al. [189] comprehensively reviewed the significance of using laser scanner raw data for creation of “as-is” BIM in civil engineering projects, commonly called Scan-to-BIM, and surveys developed methods in this regard. However, creation of “as-is” BIM using TLS data is generally a manual time-consuming process. Researchers were mainly focused on development of automatic, or semi-automatic approaches to extract the 3D BIM in a short time with high level of accuracy from the laser scanned data points with aims of condition assessment and management [79,80,190,191,192,193,194]. As an instance, Zhao and Vela [190] took an efficient machine learning approach to automate/facilitate the process from a laser scan point cloud to BrIM. In this effort, components of two concrete bridges were segmented, using proposed algorithm, and 3D solid models in Industry Foundation Class (IFC) format were provided. Table 9 summarizes various examples of using TLS-based BrIM for bridge modeling, assessment and management.
The related research works in this area can be summarized into three main categories of 3D model development, progress tracking, and quality control and management. The 3D model development refers to the construction of 3D solid model, as discussed in Section 3.1, while other categories indicate the application of constructed 3D model in project management engineering.

3.4.1. Progress Tracking

Choosing an accurate and efficient progress tracking method for construction projects is always a vital consideration for successful management of the projects, as it allows the right decisions to be made in a short time. Using conventional progress tracking methods requires manual data collection by daily reports, which is a time-consuming and error-prone procedure. It also can distract project managers from their important task to make in-time and appropriate decisions. In recent decades, researchers tried to employ emerging technologies to improve the output of progress tracking methods using 3D imaging tools and TLS [71,195,196,197,198,199]. In a recent study, Puri and Turkan [195] proposed a semi-automated methodology for monitoring bridge construction projects, comparing “as-built” and “as-is” data. In this method, the project status was calculated based on the analysis of regularly collected data, using laser scanning technology in a four-dimensional BIM model (3D geometric model and project schedule). Findings of this research were further investigated by application to a bridge replacement case study in Albany. The results showed the benefits of using this method over manual methods of progress tracking. In another effort, Bosche and Haas [200] proposed an automatic retrieval for 3D CAD objects from the TLS scans to be used for assessing construction progress. In this process, construction progress was tracked, comparing deviations between constructed BIMs during different phases of construction. The authors named the proposed process as Scan-vs-BIM. The results of this research showed the proof of concept, however, further field experiments and other application areas, such as bridge construction, were suggested. In another effort, Turkan et al. [197] presented another object recognition framework for tracking the secondary and temporary objects, such as formwork, scaffolding and shoring in different phases of construction works. This framework was further developed to analyze/manage other dimensions of the construction project (time and cost) for concrete structures such as bridges [199,201]. Similar attempts on automated construction progress measurement approaches, utilizing TLS for capturing the state of construction, have been developed in existing research conducted by Zhang and Aridit [202], and Kim et al. [203].

3.4.2. Quality Control, Management and Operation

Application of BIM technology as an integrated platform facilitates simultaneous works by multiple disciplines in different phases of design, fabrication/construction and operation. Integration of this technology with TLS for rapid and intelligent survey, can be an innovative solution for efficiently managing and controlling different phases of mega projects, such as a complex bridge. In this regard, Ying et al. [204] described the advantage of using TLS as a valuable tool in conducting quality control of bridge components before assembling. In this research, the virtual pre-splicing of two steel beams using TLS was carried out for Fujiang Bridge in Tongnan, China. Similarly, Arashpour et al. [205] developed a framework for quality control of off-site constructions of structural components, in order to reduce on-site assembly discrepancy. In this effort, the point cloud of the prefabricated components was captured using TLS, and the results were compared with the as-designed geometry condition provided in BIM. In this regard, similar efforts have been conducted by Kim et al. [206], Wang et al. [207], and Maalek et al. [208] on integrated BIM and laser scanning for real-time dimensional quality assurance [209,210] and decision making systems [211,212,213,214].
Generation of BIM data can be a valuable source of information for managing, assessing, and forecasting the state of the structure. In this regard, Sacks et al. [215] presented an integrated bridge inspection system named SeeBridge. In the SeeBridge system, a bridge model is automatically generated and assessed using TLS point cloud data. As a result, this system was validated assessing a girder bridge in the USA; a two slab bridge in the UK; a girder bridge in Israel [193]. Similarly, Ngocson et al. [216] presented an updatable BrIM with the aim of bridge management and maintenance, including the digital representation of the bridge components linked to their damage records. In this study, the proposed BrIM system was tested on a highway concrete bridge as a case study. Finally, the initial results showed the acceptable implementation of this system for bridge monitoring and maintenance. In a recent research study, Bolourian and Hammad [217] presented an automatic approach with the aim of bridge condition assessment, providing the level of criticality based on the point cloud data. This approach was effectively validated by inspecting a concrete bridge in Canada. In a recent project, Sydney Harbour Foreshore Authority of NSW, Australia, developed a BrIM for the historical Pyrmont Bridge in Sydney, to facilitate the managing and operating of this built asset [218]. Figure 11 shows the current form of this bridge and its maintenance report. However, drawings of this bridge were in particular paper-based, and many changes over the years were not accurately recorded. Having BrIM not only has provided an accurate 3D representation of this bridge, but also has taken a three-month reporting process to less than a day that is now automated and instantaneous.

4. Discussion and Future Directions

4.1. Overview of the Scientometric Review

Research studies on using TLS as an emerging quantitative tool, providing precise information, dates back to almost ten years ago for bridge engineering. During the last decade, the historical trends show that the number of publications kept rising from an average of 15 papers/year in 2010 and 2011 to 44 papers/year in 2018 and 2019, which confirm the growing interest in using TLS in the field of bridge engineering as shown in Figure 2. This growing interest demonstrates the publication rates specifically on bridge engineering; however, a higher growing rate is observed in the whole construction industry which includes the use of TLS in health monitoring of bridges, buildings, roads, tunnels, etc. However, the publications are spread over more than 100 different journals and conference proceedings. It is true that the research studies presented in the conferences include 22.6% of the total number of publications. Although journal publications are equally dispersed, Automation in Construction and Remote Sensing journals seem to have published the highest number of research papers in this area, listed in Table 1. This table can also guide new researchers, working on point clouds of bridges, deciding where to publish and present their works. In addition, Figure 2 reveals a low rate of publication specifically focused on the bridge engineering.
In this study, the co-occurrence of keywords, by means of presenting fundamental themes of published papers, was investigated. The results of keyword mapping, performed in Section 2.2, highlighted the frequency of keyword presence, indicating concerns and limitations in this field of study. In this regard, 3D model generation and quality inspection are shown to be the more investigated research topics by possessing 48% and 27% of the total keyword occurrences, while structural assessment and construction management are unique and opportune topics that need to be investigated. Moreover, this study considered the relationship between the key individual researchers, institutions, and the countries of research origin by means of co-authorship analysis. The results of co-authorship network mapping, performed in Section 2.3 and Section 2.4, emphasized the global interaction of the internationally recognized experts and most renowned institutions in this area around the world. Although Riveiro, B. from Vigo University, Spain, is recognized as the most productive researcher in this field, the United States of America is shown to be the leading country in terms of being the main contributor in research undertakings. In particular, the USA maintains strong research links with United Kingdom and Spain, however, weaker research links are reported with countries such as Australia and Germany.

4.2. Future Directions

In the last decade, the terms of digital twin and smart manufacturing have been introduced to define the promising trends of automation process and digitization in the construction industry, especially bridge engineering. During this period, introducing new technologies, such as TLS, offers the chance to improve upon the traditional methods of bridge assessment, and management, using the generated 3D model from the acquired data.
Currently, data acquisition, as the most crucial phase of generating a 3D solid model, is heavily performed in a manual way based on surveyors’ experiences. Collecting sufficient data with complete coverage for a large and complex structure, such as bridge, is an important consideration and where research is still lacking to identify the required optimum scan locations and parameters. Future research needs to be conducted on the optimization of scan locations and TLS parameters, ensuring the completeness of scan data, thereby minimizing the scan time and avoiding collecting redundant data. Although scan planning procedures have been proposed for buildings in previous studies [38,39], there are some key challenges for complex structures, such as bridges, which need to be addressed. In this regard, occlusion of bridge components and range of access for bridges located in rugged terrains are some of the challenges where research is still lacking and needs to be considered.
The possibility of extracting detailed geometric information, with the aim of structural assessment, is another demand for using TLS as a reliable alternative for electromechanical measuring equipment. Although the available TLS instruments in the market offer the possibility of collecting high-precision data with sub-millimeter accuracy, future research should be conducted to investigate the required data resolution and quality, as the two main parameters for each specific application. However, a lower level of detail (LOD) is enough for some inspection purposes. Utilizing TLS in model updating and reverse engineering approaches may need a higher LOD.
Generation of 3D solid models from the acquired TLS data points is an important consideration for various applications. Although some studies presented segmentation algorithms and proposed methodologies to extract 3D solid models from laser scan data [77,78], these studies are not directly focused on the complex components of structures with various orientations. Most of the existing research works are focused on point cloud clustering, while these methods are not robust with regard to occlusion. Future research is needed to improve the object detection of complex structural components of bridges in occlusion. Moreover, to date, no commercial software, nor a robust automatic method for direct transformation of raw acquired data into valid geometric model exists. Therefore, further research is suggested to be conducted on practical methodologies that allow conversion of raw point cloud into a valid 3D model.
Identifying the type of construction material, thereby estimating the construction material volume is another demand that can facilitate the maintenance and repair procedures of bridges, which is not robustly addressed in the current research works. However, a limited number of publications have investigated the potential benefits of TLS for visual material classification [219,220]. Localizing and classifying the structural damages along with quantifying the detected deficiencies are other aspects that can be facilitated using TLS, individually or in integration with photogrammetry. Although new generations of TLS instruments support high-resolution images, a few publications investigate the integration of acquired point data and image processing with the aim of quality inspection [106,109]. Future research works on this topic can potentially provide an efficient way for extracting necessary information for a complex structure such as a bridge, thereby time- and cost-saving.
Successful application of BIM in asset management of structures has made this platform an advanced alternative for traditional paper-based processes. BrIM as the specific form of this platform for bridge engineering, has great potential to develop rapidly. However, few publications have investigated the application of BrIM [193,215,221,222]. The research is still lacking in developing automated methodologies, using artificial intelligence (AI) to inspect and control the design, assembly, and operational processes based on the code conformances and disciplines in case of a bridge. Future research is also suggested for the development of the real-time onsite controlling methods and progress tracking approaches for construction and operation phases of a bridge, as well as to provide decision-making algorithms for arisen or anticipated problems.

5. Conclusions

This study investigated the application of laser scanning as an emerging technology in modern bridge surveying, based on a combined scientometric and state-of-the-art review, not only to evaluate the existing documentation data set, but also to provide a deeper understanding for new researchers in this field. A scientometric analysis was conducted based on the collected total number of 1534 publications to explore the status and global research trends of using TLS in the area of bridge engineering. In this regard, the state of the research field and the most productive researchers, as well as reputable journals, conferences, and institutions, were identified. Moreover, based on the selected relevant papers, the four major applications of TLS in bridge engineering were reviewed and categorized. The first category is the generation of 3D models, which refers to the data acquisition phase and reconstruction of the geometry model from the acquired point cloud data. The second is the quality inspection, mainly focused on the most probable bridge surface damages. In addition, the application of TLS in structural assessment, and bridge information modeling—as the other two categories—were discussed. Moreover, each category was investigated based on the current landscape of the research, relevant improvements, significant results and recommendations in this area.
Besides an extensive literature review study, this paper is concluded with a fundamental discussion on the scientometric analysis, ongoing research gaps, and future directions in this research field. Based on the keyword analysis, research topics related to 3D model development and quality inspection, are identified to be trendy subjects, while further investigations are suggested for TLS-based structural assessment and management in the field of bridge engineering. Scan location optimization should be further developed considering the minimum occlusion in data acquisition for bridge components. Further research is also suggested on practical methodologies that allow the direct transformation of raw data points into a valid 3D model. Localizing, classifying, and quantifying the structural deficiencies are other aspects of using TLS that can be further investigated with the aim of bridge quality inspection. Future research is also suggested to be investigated for real-time inspection methods and potential integration with AI techniques.

Author Contributions

Conceptualization, M.R. and M.M.; methodology, M.M., M.R.; software, S.S.K.; validation, M.M., M.R., B.S. and L.T.-H.; resources, S.S.K., M.M., M.M.A.; writing—original draft preparation, M.M., S.S.K., M.M.A.; writing—review and editing, M.R., B.S., L.T.-H.; visualization, M.M.; supervision, B.S., M.M.; funding acquisition, L.T.-H. All authors have read and agreed to the published version of the manuscript.

Funding

The research received no external funding.

Conflicts of Interest

The authors declare no conflict of interest.

References

  1. Riveiro, B.; Lindenbergh, R. Laser Scanning: An Emerging Technology in Structural Engineering; CRC Press: Boca Raton, FL, USA, 2019; p. 270. [Google Scholar]
  2. American Society of Civil Engineering (ASCE). Infrastructure Report Card; ASCE: Reston, VA, USA, 2017.
  3. Iles, D.C. Design Guide for Steel Railway Bridges; Steel Construction Institute: Ascot, UK, 2004. [Google Scholar]
  4. Rashidi, M.; Gibson, P. A methodology for bridge condition evaluation. J. Civ. Eng. Arch. 2012, 6, 1149–1157. [Google Scholar]
  5. Rashidi, M.; Samali, B.; Sharafi, P. A new model for bridge management: Part a: Condition assessment and priority ranking of bridges. Aust. J. Civ. Eng. 2016, 14, 35–45. [Google Scholar] [CrossRef] [Green Version]
  6. Žnidarič, A.; Pakrashi, V.; O’Brien, E.; O’Connor, A. A review of road structure data in six european countries. Proc. Inst. Civ. Eng. Urban Des. Plan. 2011, 164, 225–232. [Google Scholar] [CrossRef] [Green Version]
  7. Fujino, Y.; Siringoringo, D.M. Structural health monitoring of bridges in japan: An overview of the current trend. In Proceedings of the Fourth International Conference on FRP Composites in Civil Engineering, CICE, Zurich, Switzerland, 20–25 July 2008. [Google Scholar]
  8. Rashidi, M.; Hoshyar, A.N.; Smith, L.; Bijan, S.; Siddique, R. A comprehensive taxonomy for structure and material deficiencies, preventions and remedies of timber bridges. J. Build. Eng. 2020, 101624. [Google Scholar] [CrossRef]
  9. Transport for NSW Office. Roads and Maritime Services’ Annual Report; TfNSW: Sydney, NSW, Australia, 2019.
  10. Son, H.; Bosché, F.; Kim, C. As-built data acquisition and its use in production monitoring and automated layout of civil infrastructure: A survey. Adv. Eng. Inf. 2015, 29, 172–183. [Google Scholar] [CrossRef]
  11. Pătrăucean, V.; Armeni, I.; Nahangi, M.; Yeung, J.; Brilakis, I.; Haas, C. State of research in automatic as-built modelling. Adv. Eng. Inf. 2015, 29, 162–171. [Google Scholar] [CrossRef] [Green Version]
  12. Lu, Q.; Lee, S. Image-based technologies for constructing as-is building information models for existing buildings. J. Comput. Civ. Eng. 2017, 31, 04017005. [Google Scholar] [CrossRef]
  13. Wang, Q.; Kim, M.K. Applications of 3d point cloud data in the construction industry: A fifteen-year review from 2004 to 2018. Adv. Eng. Inf. 2019, 39, 306–319. [Google Scholar] [CrossRef]
  14. Kim, M.K.; Wang, Q.; Li, H. Non-contact sensing based geometric quality assessment of buildings and civil structures: A review. Autom. Constr. 2019, 100, 163–179. [Google Scholar] [CrossRef]
  15. Spencer, B.F.; Hoskere, V.; Narazaki, Y. Advances in computer vision-based civil infrastructure inspection and monitoring. Engineering 2019, 5, 199–222. [Google Scholar] [CrossRef]
  16. Czerniawski, T.; Leite, F. Automated digital modeling of existing buildings: A review of visual object recognition methods. Autom. Constr. 2020, 113, 103131. [Google Scholar] [CrossRef]
  17. Pollack, J.; Adler, D. Emergent trends and passing fads in project management research: A scientometric analysis of changes in the field. Int. J. Proj. Manag. 2015, 33, 236–248. [Google Scholar] [CrossRef]
  18. Chen, C. Citespace ii: Detecting and visualizing emerging trends and transient patterns in scientific literature. J. Am. Soc. Inf. Sci. Technol. 2006, 57, 359–377. [Google Scholar] [CrossRef] [Green Version]
  19. Su, H.-N.; Lee, P.-C. Mapping knowledge structure by keyword co-occurrence: A first look at journal papers in technology foresight. Scientometrics 2010, 85, 65–79. [Google Scholar] [CrossRef]
  20. Song, J.; Zhang, H.; Dong, W. A review of emerging trends in global ppp research: Analysis and visualization. Scientometrics 2016, 107, 1111–1147. [Google Scholar] [CrossRef]
  21. Cobo, M.J.; López-Herrera, A.G.; Herrera-Viedma, E.; Herrera, F. Science mapping software tools: Review, analysis, and cooperative study among tools. J. Am. Soc. Inf. Sci. Technol. 2011, 62, 1382–1402. [Google Scholar] [CrossRef]
  22. Chen, C.; Ibekwe-SanJuan, F.; Hou, J. The structure and dynamics of cocitation clusters: A multiple-perspective cocitation analysis. J. Am. Soc. Inf. Sci. Technol. 2010, 61, 1386–1409. [Google Scholar] [CrossRef] [Green Version]
  23. Elsevier. Scopus Global Research Factsheet. Available online: https://www.elsevier.com/solutions/scopus (accessed on 18 November 2020).
  24. Van Eck, N.J.; Waltman, L. Software survey: Vosviewer, a computer program for bibliometric mapping. Scientometrics 2010, 84, 523–538. [Google Scholar] [CrossRef] [Green Version]
  25. Perianes-Rodriguez, A.; Waltman, L.; van Eck, N.J. Constructing bibliometric networks: A comparison between full and fractional counting. J. Informetr. 2016, 10, 1178–1195. [Google Scholar] [CrossRef] [Green Version]
  26. Oraee, M.; Hosseini, M.R.; Papadonikolaki, E.; Palliyaguru, R.; Arashpour, M. Collaboration in bim-based construction networks: A bibliometric-qualitative literature review. Int. J. Proj. Manag. 2017, 35, 1288–1301. [Google Scholar] [CrossRef]
  27. León-Robles, C.A.; Reinoso-Gordo, J.F.; González-Quiñones, J.J. Heritage building information modeling (h-bim) applied to a stone bridge. ISPRS Int. J. Geo-Inf. 2019, 8, 121. [Google Scholar] [CrossRef] [Green Version]
  28. Cabo, C.; Ordóñez, C.; Argüelles-Fraga, R. An algorithm for optimizing terrestrial laser scanning in tunnels. Autom. Constr. 2017, 83, 163–168. [Google Scholar] [CrossRef]
  29. Argüelles-Fraga, R.; Ordóñez, C.; García-Cortés, S.; Roca-Pardiñas, J. Measurement planning for circular cross-section tunnels using terrestrial laser scanning. Autom. Constr. 2013, 31, 1–9. [Google Scholar] [CrossRef]
  30. Popescu, C.; Täljsten, B.; Blanksvärd, T.; Elfgren, L. 3d reconstruction of existing concrete bridges using optical methods. Struct. Infrastruct. Eng. 2019, 15, 912–924. [Google Scholar] [CrossRef] [Green Version]
  31. Frías, E.; Díaz-Vilariño, L.; Balado, J.; Lorenzo, H. From bim to scan planning and optimization for construction control. Remote Sens. 2019, 11, 1963. [Google Scholar] [CrossRef] [Green Version]
  32. Mahmood, S.; Majid, Z.; Idris, K.M. Terrestrial lidar sensor modeling towards optimal scan location and spatial density planning for 3d surveying. Appl. Geomat. 2020, 12, 467–480. [Google Scholar] [CrossRef]
  33. Lichti, D.D.; Glennie, C.L.; Jahraus, A.; Hartzell, P. New approach for low-cost tls target measurement. J. Surv. Eng. 2019, 145, 04019008. [Google Scholar] [CrossRef]
  34. Laefer, D.F.; Fitzgerald, M.; Maloney, E.M.; Coyne, D.; Lennon, D.; Morrish, S.W. Lateral image degradation in terrestrial laser scanning. Struct. Eng. Int. 2009, 19, 184–189. [Google Scholar] [CrossRef]
  35. Jia, F.; Lichti, D.D. A model-based design system for terrestrial laser scanning networks in complex sites. Remote Sens. 2019, 11, 1749. [Google Scholar] [CrossRef] [Green Version]
  36. Lu, R.; Brilakis, I. Recursive segmentation for as-is bridge information modelling. In Proceedings of the Joist Conference on Computing in Construction (JC3), Heraklion, Greece, 4–7 July 2017. [Google Scholar]
  37. Hinks, T.; Carr, H.; Gharibi, H.; Laefer, D.F. Visualisation of urban airborne laser scanning data with occlusion images. ISPRS J. Photogramm. Remote Sens. 2015, 104, 77–87. [Google Scholar] [CrossRef] [Green Version]
  38. Biswas, H.K.; Bosché, F.; Suna, M. Planning for scanning using building information models: A novel approach with occlusion handling. In Proceedings of the International Symposium on Automation and Robotics in Construction (ISARC), Oulu, Finland, 15–18 June 2015. [Google Scholar]
  39. Zhang, C.; Kalasapudi, V.S.; Tang, P. Rapid data quality oriented laser scan planning for dynamic construction environments. Adv. Eng. Inf. 2016, 30, 218–232. [Google Scholar] [CrossRef] [Green Version]
  40. Rebolj, D.; Pučko, Z.; Babič, N.Č.; Bizjak, M.; Mongus, D. Point cloud quality requirements for scan-vs-bim based automated construction progress monitoring. Autom. Constr. 2017, 84, 323–334. [Google Scholar] [CrossRef]
  41. G.S.A. Building Information Modeling Guide Series: 03—Gsa Bim Guide for 3D Imaging; G.S.A.: Washington, DC, USA, 2009. [Google Scholar]
  42. Dai, F.; Rashidi, A.; Brilakis, I.; Vela, P. Comparison of image-based and time-of-flight-based technologies for three-dimensional reconstruction of infrastructure. J. Constr. Eng. Manag. 2013, 139, 69–79. [Google Scholar] [CrossRef]
  43. Gröger, G.; Kolbe, T.H.; Nagel, C.; Häfele, K.-H. Ogc City Geography Markup Language (Citygml) En-Coding Standard; Open Geospatial Consortium: Wayland, MA, USA, 2012. [Google Scholar]
  44. Anil, E.; Sunnam, R.; Akinci, B. Challenges of identifying steel sections for the generation of as-is bims from laser scan data. In Proceedings of the 29th ISARC, Eindhoven, The Netherlands, 26–29 June 2012. [Google Scholar]
  45. Laefer, D.F.; Truong-Hong, L. Toward automatic generation of 3d steel structures for building information modelling. Autom. Constr. 2017, 74, 66–77. [Google Scholar] [CrossRef]
  46. Laefer, D.F.; Truong-Hong, L.; Carr, H.; Singh, M. Crack detection limits in unit based masonry with terrestrial laser scanning. NDT E Int. 2014, 62, 66–76. [Google Scholar] [CrossRef] [Green Version]
  47. Valença, J.; Puente, I.; Júlio, E.; González-Jorge, H.; Arias-Sánchez, P. Assessment of cracks on concrete bridges using image processing supported by laser scanning survey. Constr. Build. Mater. 2017, 146, 668–678. [Google Scholar] [CrossRef]
  48. Cabaleiro, M.; Lindenbergh, R.; Gard, W.F.; Arias, P.; van de Kuilen, J.W.G. Algorithm for automatic detection and analysis of cracks in timber beams from lidar data. Constr. Build. Mater. 2017, 130, 41–53. [Google Scholar] [CrossRef] [Green Version]
  49. Suchocki, C.; Błaszczak-Bąk, W. Down-sampling of point clouds for the technical diagnostics of buildings and structures. Geosciences 2019, 9, 70. [Google Scholar] [CrossRef] [Green Version]
  50. Soudarissanane, S.; Lindenbergh, R.; Menenti, M.; Teunissen, P. Scanning geometry: Influencing factor on the quality of terrestrial laser scanning points. ISPRS J. Photogramm. Remote Sens. 2011, 66, 389–399. [Google Scholar] [CrossRef]
  51. Barazzetti, L. Parametric as-built model generation of complex shapes from point clouds. Adv. Eng. Inf. 2016, 30, 298–311. [Google Scholar] [CrossRef]
  52. Brilakis, I.; Lourakis, M.; Sacks, R.; Savarese, S.; Christodoulou, S.; Teizer, J.; Makhmalbaf, A. Toward automated generation of parametric bims based on hybrid video and laser scanning data. Adv. Eng. Inf. 2010, 24, 456–465. [Google Scholar] [CrossRef]
  53. Intwala, A.M.; Magikar, A. A review on process of 3d model reconstruction. In Proceedings of the International Conference on Electrical, Electronics, and Optimization Techniques (ICEEOT), Chennai, India, 3–5 March 2016. [Google Scholar]
  54. Karbacher, S.; Häusler, G. New approach for the modeling and smoothing of scattered 3d data. In Proceedings of the SPIE—The International Society for Optical Engineering, San Jose, CA, USA, 6 March 1998; pp. 168–177. [Google Scholar]
  55. Budak, I.; Hodolic, J.; Sokovic, M. Development of a programme system for data-point pre-processing in reverse engineering. J. Mater. Process. Technol. 2005, 162–163, 730–735. [Google Scholar] [CrossRef]
  56. Cheng, L.; Chen, S.; Liu, X.; Xu, H.; Wu, Y.; Li, M.; Chen, Y. Registration of laser scanning point clouds: A review. Sensors 2018, 18, 1641. [Google Scholar] [CrossRef] [PubMed] [Green Version]
  57. Gómez-García-Bermejo, J.; Zalama, E.; Feliz, R. Automated registration of 3d scans using geometric features and normalized color data. Comput.-Aided Civ. Infrastruct. Eng. 2013, 28, 98–111. [Google Scholar] [CrossRef]
  58. Zheng, L.; Yu, M.; Song, M.; Stefanidis, A.; Ji, Z.; Yang, C. Registration of long-strip terrestrial laser scanning point clouds using ransac and closed constraint adjustment. Remote Sens. 2016, 8, 278. [Google Scholar] [CrossRef] [Green Version]
  59. Ma, Z.; Liu, S. A review of 3d reconstruction techniques in civil engineering and their applications. Adv. Eng. Inf. 2018, 37, 163–174. [Google Scholar] [CrossRef]
  60. Wu, Q.; Xu, K.; Wang, J. Constructing 3d csg models from 3d raw point clouds. Comput. Graph. Forum 2018, 37, 221–232. [Google Scholar] [CrossRef]
  61. Wyvill, G.; Kunii, T.L. A functional model for constructive solid geometry. Vis. Comput. 2005, 1, 3–14. [Google Scholar] [CrossRef]
  62. Valero, E.; Adán, A.; Cerrada, C. Automatic method for building indoor boundary models from dense point clouds collected by laser scanners. Sensors 2012, 12, 16099–16115. [Google Scholar] [CrossRef]
  63. Son, H.; Kim, C.; Kim, C. Fully automated as-built 3d pipeline extraction method from laser-scanned data based on curvature computation. J. Comput. Civ. Eng. 2015, 29, B4014003. [Google Scholar] [CrossRef]
  64. Son, H.; Kim, C.; Kim, C. 3d reconstruction of as-built industrial instrumentation models from laser-scan data and a 3d cad database based on prior knowledge. Autom. Constr. 2015, 49, 193–200. [Google Scholar] [CrossRef]
  65. Wang, S.; Gou, Q.; Sun, M. Simple building reconstruction from lidar data and aerial imagery. In Proceedings of the Remote Sensing, Environment and Transportation Engineering (RSETE), Nanjing, China, 1–3 June 2012; pp. 1–5. [Google Scholar]
  66. Walsh, S.B.; Borello, D.J.; Guldur, B.; Hajjar, J.F. Data processing of point clouds for object detection for structural engineering applications. Comput.-Aided Civ. Infrastruct. Eng. 2013, 28, 495–508. [Google Scholar] [CrossRef]
  67. Xiong, X.; Adan, A.; Akinci, B.; Huber, D. Automatic creation of semantically rich 3d building models from laser scanner data. Autom. Constr. 2013, 31, 325–337. [Google Scholar] [CrossRef] [Green Version]
  68. Hinks, T.; Carr, H.; Truong-Hong, L.; Laefer, D.F. Point cloud data conversion into solid models via point-based voxelization. J. Surv. Eng. 2013, 139, 72–83. [Google Scholar] [CrossRef] [Green Version]
  69. Vosselman, G.; Dijkman, S. 3d building model reconstruction from point clouds and ground plans. Int. Arch. Photogramm. Remote Sens. Spat. Inf. Sci. 2001, 34, 37–44. [Google Scholar]
  70. Patil, A.K.; Holi, P.; Lee, S.K.; Chai, Y.H. An adaptive approach for the reconstruction and modeling of as-built 3d pipelines from point clouds. Autom. Constr. 2017, 75, 65–78. [Google Scholar] [CrossRef]
  71. Bosché, F.; Ahmed, M.; Turkan, Y.; Haas, C.T.; Haas, R. The value of integrating scan-to-bim and scan-vs-bim techniques for construction monitoring using laser scanning and bim: The case of cylindrical mep components. Autom. Constr. 2015, 49, 201–213. [Google Scholar] [CrossRef]
  72. Liu, Y.-F.; Cho, S.; Spencer, B.F.; Fan, J.-S. Concrete crack assessment using digital image processing and 3d scene reconstruction. J. Comput. Civ. Eng. 2016, 30, 04014124. [Google Scholar] [CrossRef]
  73. Sanchez, V.; Zakhor, A. Planar 3d modeling of building interiors from point cloud data. In Proceedings of the 19th IEEE International Conference on Image Processing, Orlando, FL, USA, 30 September–3 October 2012; pp. 1777–1780. [Google Scholar]
  74. Stull, C.J.; Earls, C. A rapid assessment methodology for bridges damaged by truck strikes. Steel Compos. Struct. 2009, 9, 223–237. [Google Scholar] [CrossRef]
  75. Laefer, D.F. Harnessing remote sensing for civil engineering: Then, now, and tomorrow. In Lecture Notes in Civil Engineering; Springer: Singapore, 2020; Volume 33, pp. 3–30. [Google Scholar]
  76. Yang, L.; Cheng, J.C.P.; Wang, Q. Semi-automated generation of parametric bim for steel structures based on terrestrial laser scanning data. Autom. Constr. 2020, 112, 103037. [Google Scholar] [CrossRef]
  77. Cabaleiro, M.; Riveiro, B.; Arias, P.; Caamaño, J.C.; Vilán, J.A. Automatic 3d modelling of metal frame connections from lidar data for structural engineering purposes. ISPRS J. Photogramm. Remote Sens. 2014, 96, 47–56. [Google Scholar] [CrossRef]
  78. Yan, Y.; Guldur, B.; Hajjar, J.F. Automated structural modelling of bridges from laser scanning. In Proceedings of the Structures Congress 2017: Bridges and Transportation Structures—Selected Papers from the Structures Congress 2017, Denver, CO, USA, 6–8 April 2017; pp. 457–468. [Google Scholar]
  79. Lu, R.; Brilakis, I.; Middleton, C.R. Detection of structural components in point clouds of existing rc bridges. Comput.-Aided Civ. Infrastruct. Eng. 2019, 34, 191–212. [Google Scholar] [CrossRef] [Green Version]
  80. Zhao, Y.P.; Wu, H.; Vela, P.A. Top-down partitioning of reinforced concrete bridge components. In Proceedings of the ASCE International Conference on Computing in Civil Engineering: Smart Cities, Sustainability, and Resilience, Reston, VA, USA, 13 June 2019; pp. 275–283. [Google Scholar]
  81. Gastineau, A.; Johnson, T.; Schultz, A. Bridge Health Monitoring and Inspections–A Survey of Methods; Minnesota Department of Transportation: Saint Paul, MI, USA, 2009. [Google Scholar]
  82. Valença, J.; Dias-da-Costa, D.; Gonçalves, L.; Júlio, E.; Araújo, H. Automatic concrete health monitoring: Assessment and monitoring of concrete surfaces. Struct. Infrastruct. Eng. 2014, 10, 1547–1554. [Google Scholar] [CrossRef]
  83. Marazzi, F.; Tagliabue, P.; Corbani, F.M. Traditional vs innovative structural health monitoring of monumental structures: A case study. Struct. Control Health Monit. 2011, 18, 430–449. [Google Scholar] [CrossRef]
  84. Laflamme, S.; Kollosche, M.; Connor, J.J.; Kofod, G. Soft capacitive sensor for structural health monitoring of large-scale systems. Struct. Control Health Monit. 2012, 19, 70–81. [Google Scholar] [CrossRef]
  85. Patricio, M.; Maravall, D. A novel generalization of the gray-scale histogram and its application to the automated visual measurement and inspection of wooden pallets. Image Vis. Comput. 2007, 25, 805–816. [Google Scholar] [CrossRef]
  86. Koch, C.; Paal, S.; Rashidi, A.; Zhu, Z.; König, M.; Brilakis, I. Achievements and challenges in machine vision-based inspection of large concrete structures. Adv. Struct. Eng. 2014, 17, 303–318. [Google Scholar] [CrossRef]
  87. Gordon, S.; Lichti, D.; Franke, J.; Stewart, M. Measurement of structural deformation using terrestrial laser scanners. In Proceedings of the 1st FIG International Symposium on Engineering Surveys for Construction Works and Structural Engineering, Nottingham, UK, 28 June 2004. [Google Scholar]
  88. Olsen, M.J.; Kuester, F.; Chang, B.J.; Hutchinson, T.C. Terrestrial laser scanning-based structural damage assessment. J. Comput. Civ. Eng. 2010, 24, 264–272. [Google Scholar] [CrossRef]
  89. Truong-Hong, L.; Falter, H.; Lennon, D.; Laefer, D.F. Framework for bridge inspection with laser scanning. In Proceedings of the EASEC-14 Structural Engineering and Construction, Ho Chi Minh City, Vietnam, 6–8 January 2016. [Google Scholar]
  90. Tang, P.; Akinci, B.; Huber, D. Quantification of edge loss of laser scanned data at spatial discontinuities. Autom. Constr. 2009, 18, 1070–1083. [Google Scholar] [CrossRef]
  91. Guldur, B.; Yan, Y.; Hajjar, J.F. Condition assessment of bridges using terrestrial laser scanners. In Proceedings of the Structures Congress 2015, Portland, OR, USA, 23–25 April 2015; ASCE: Reston, VA, USA, 2015; pp. 355–366. [Google Scholar]
  92. Anil, E.B.; Akinci, B.; Garrett, J.H.; Kurc, O. Characterization of laser scanners for detecting cracks for post-earthquake damage inspection. In Proceedings of the International Symposium on Automation and Robotics in Construction (ISARC), Montreal, QC, Canada, 6–9 June 2013. [Google Scholar] [CrossRef] [Green Version]
  93. Xu, X.; Yang, H. Intelligent crack extraction and analysis for tunnel structures with terrestrial laser scanning measurement. Adv. Mech. Eng. 2019, 11, 1687814019872650. [Google Scholar] [CrossRef]
  94. Bayar, G.; Bilir, T. A novel study for the estimation of crack propagation in concrete using machine learning algorithms. Constr. Build. Mater. 2019, 215, 670–685. [Google Scholar] [CrossRef]
  95. Sarker, M.M.; Ali, T.A.; Abdelfatah, A.; Yehia, S.; Elaksher, A. A cost-effective method for crack detection and measurement on concrete surface. In Proceedings of the International Archives of the Photogrammetry, Remote Sensing and Spatial Information Sciences—ISPRS Archives, Hamburg, Germany, 28–29 November 2017; pp. 237–241. [Google Scholar]
  96. Valença, J.; Jalio, E.; Puente, I.; González-Jorge, H. The mcrack-tls method for assessing cracks on concrete bridges based on image processing and laser scanning. In Proceedings of the IABSE, Challenges in Design and Construction of an Innovative and Sustainable Built Environment, Stockholm, Sweden, 21–23 September 2016; pp. 1485–1492. [Google Scholar]
  97. Giri, P.; Kharkovsky, S. Detection of surface crack in concrete using measurement technique with laser displacement sensor. IEEE Trans. Instrum. Meas. 2016, 65, 1951–1953. [Google Scholar] [CrossRef]
  98. Rabah, M.; Elhattab, A.; Fayad, A. Automatic concrete cracks detection and mapping of terrestrial laser scan data. NRIAG J. Astron. Geophys. 2013, 2, 250–255. [Google Scholar] [CrossRef] [Green Version]
  99. Cho, S.C.; Park, S.; Cha, G.; Oh, T. Development of image processing for crack detection on concrete structures through terrestrial laser scanning associated with the octree structure. Appl. Sci. 2018, 8, 2373. [Google Scholar] [CrossRef] [Green Version]
  100. Laefer, D.F.; Gannon, J.; Deely, E. Reliability of crack detection methods for baseline condition assessments. J. Infrastruct. Syst. 2010, 16, 129–137. [Google Scholar] [CrossRef]
  101. Guldur Erkal, B.; Hajjar, J.F. Laser-based surface damage detection and quantification using predicted surface properties. Autom. Constr. 2017, 83, 285–302. [Google Scholar] [CrossRef]
  102. Yang, S.; Zhang, Y.; Kaya, O.; Ceylan, H.; Kim, S. Investigation of longitudinal cracking in widened concrete pavements. Balt. J. Road Bridge Eng. 2020, 15, 211. [Google Scholar] [CrossRef]
  103. Yu, Y.; Li, J.; Guan, H.; Wang, C. 3d crack skeleton extraction from mobile lidar point clouds. In Proceedings of the International Geoscience and Remote Sensing Symposium (IGARSS), Quebec City, QC, Canada, 13–18 July 2014; pp. 914–917. [Google Scholar]
  104. Turkan, Y.; Hong, J.; Laflamme, S.; Puri, N. Adaptive wavelet neural network for terrestrial laser scanner-based crack detection. Autom. Constr. 2018, 94, 191–202. [Google Scholar] [CrossRef] [Green Version]
  105. Giri, P.; Kharkovsky, S.; Samali, B. Inspection of metal and concrete specimens using imaging system with laser displacement sensor. Electronics (Switzerland) 2017, 6, 36. [Google Scholar] [CrossRef] [Green Version]
  106. Teza, G.; Galgaro, A.; Moro, F. Contactless recognition of concrete surface damage from laser scanning and curvature computation. NDT E Int. 2009, 42, 240–249. [Google Scholar] [CrossRef]
  107. Aktan, A.; Catbas, F.; Grimmelsman, K.; Tsikos, C. Issues in infrastructure health monitoring for management. J. Eng. Mech. 2000, 126, 711–724. [Google Scholar] [CrossRef]
  108. Liu, W.; Chen, S.; Hauser, E. Lidar-based bridge structure defect detection. Exp. Tech. 2011, 35, 27–34. [Google Scholar] [CrossRef]
  109. Mizoguchi, T.; Koda, Y.; Iwaki, I.; Wakabayashi, H.; Kobayashi, Y.; Shirai, K.; Hara, Y.; Lee, H.-S. Quantitative scaling evaluation of concrete structures based on terrestrial laser scanning. Autom. Constr. 2013, 35, 263–274. [Google Scholar] [CrossRef]
  110. Jana, D. Concrete scaling—A critical review. In Proceedings of the 29th Conference on Cement Microscopy, Quebec, QC, Canada, 20 May 2007. [Google Scholar]
  111. Makuch, M.; Gawronek, P. 3D point cloud analysis for damage detection on hyperboloid cooling tower shells. Remote Sens. 2020, 12, 1542. [Google Scholar] [CrossRef]
  112. Kim, M.-K.; Sohn, H.; Chang, C.-C. Localization and quantification of concrete spalling defects using terrestrial laser scanning. J. Comput. Civ. Eng. 2015, 29, 04014086. [Google Scholar] [CrossRef] [Green Version]
  113. Tang, P.; Huber, D.; Akinci, B. Characterization of laser scanners and algorithms for detecting flatness defects on concrete surfaces. J. Comput. Civ. Eng. 2011, 25, 31–42. [Google Scholar] [CrossRef]
  114. Bosché, F.; Guenet, E. Automating surface flatness control using terrestrial laser scanning and building information models. Autom. Constr. 2014, 44, 212–226. [Google Scholar] [CrossRef]
  115. Yoo, J.-H.; Lee, H.-S.; Ismail, M.A. An analytical study on the water penetration and diffusion into concrete under water pressure. Constr. Build. Mater. 2011, 25, 99–108. [Google Scholar] [CrossRef]
  116. Afshar, A.; Jahandari, S.; Rasekh, H.; Shariati, M.; Afshar, A.; Shokrgozar, A. Corrosion resistance evaluation of rebars with various primers and coatings in concrete modified with different additives. Constr. Build. Mater. 2020, 262, 120034. [Google Scholar] [CrossRef]
  117. Jahandari, S.; Saberian, M.; Tao, Z.; Mojtahedi, S.F.; Li, J.; Ghasemi, M.; Rezvani, S.S.; Li, W. Effects of saturation degrees, freezing-thawing, and curing on geotechnical properties of lime and lime-cement concretes. Cold Reg. Sci. Technol. 2019, 160, 242–251. [Google Scholar] [CrossRef]
  118. Sadeghian, F.; Haddad, A.; Jahandari, S.; Rasekh, H.; Ozbakkaloglu, T. Effects of electrokinetic phenomena on the load-bearing capacity of different steel and concrete piles: A small-scale experimental study. Can. Geotech. J. 2020. [Google Scholar] [CrossRef]
  119. Saberian, M.; Jahandari, S.; Li, J.; Zivari, F. Effect of curing, capillary action, and groundwater level increment on geotechnical properties of lime concrete: Experimental and prediction studies. J. Rock Mech. Geotech. Eng. 2017, 9, 638–647. [Google Scholar] [CrossRef]
  120. Kalenjuk, S.; Lienhart, W. Automated surface documentation of large water dams using image and scan data of modern total stations. In Proceedings of the Surveying the World of Tomorrow, Helsinki, Finland, 29 May–2 June 2017. [Google Scholar]
  121. González-Jorge, H.; Gonzalez-Aguilera, D.; Rodriguez-Gonzalvez, P.; Arias, P. Monitoring biological crusts in civil engineering structures using intensity data from terrestrial laser scanners. Constr. Build. Mater. 2012, 31, 119–128. [Google Scholar] [CrossRef]
  122. Shen, H.-K.; Chen, P.-H.; Chang, L.-M. Automated steel bridge coating rust defect recognition method based on color and texture feature. Autom. Constr. 2013, 31, 338–356. [Google Scholar] [CrossRef]
  123. Truong-Hong, L.; Laefer, D.F. Laser scanning for bridge inspection. In Laser Scanning: An Emerging Technology in Structural Engineering; CRC Press: Boca Raton, FL, USA, 2019; pp. 189–214. [Google Scholar]
  124. González-Jorge, H.; Puente, I.; Riveiro, B.; Martínez-Sánchez, J.; Arias, P. Automatic segmentation of road overpasses and detection of mortar efflorescence using mobile lidar data. Opt. Laser Technol. 2013, 54, 353–361. [Google Scholar] [CrossRef]
  125. Kushwaha, S.K.P.; Raghavendra, S.; Pande, H.; Agrawal, S. Analysis and integration of surface and subsurface information of different bridges. J. Indian Soc. Remote Sens. 2019, 48, 315–331. [Google Scholar] [CrossRef]
  126. Hermida, J.; Cabaleiro, M.; Riveiro, B.; Caamaño, J.C. Two-dimensional models of variable inertia from lidar data for structural analysis of timber trusses. Constr. Build. Mater. 2020, 231, 117072. [Google Scholar] [CrossRef]
  127. Yang, H.; Xu, X.; Neumann, I. An automatic finite element modelling for deformation analysis of composite structures. Compos. Struct. 2019, 212, 434–438. [Google Scholar] [CrossRef]
  128. Miśkiewicz, M.; Bruski, D.; Chróścielewski, J.; Wilde, K. Safety assessment of a concrete viaduct damaged by vehicle impact and an evaluation of the repair. Eng. Fail. Anal. 2019, 106, 104147. [Google Scholar] [CrossRef]
  129. Bassier, M.; Hardy, G.; Bejarano-Urrego, L.; Drougkas, A.; Verstrynge, E.; Van Balen, K.; Vergauwen, M. Semi-automated creation of accurate fe meshes of heritage masonry walls from point cloud data. In RILEM Bookseries; Springer: Berlin, Germany, 2019; Volume 18, pp. 305–314. [Google Scholar] [CrossRef]
  130. Pérez, J.P.C.; De Sanjosé Blasco, J.J.; Atkinson, A.D.J.; Del Río Pérez, L.M. Assessment of the structural integrity of the roman bridge of alcántara (spain) using tls and gpr. Remote Sens. 2018, 10, 387. [Google Scholar] [CrossRef] [Green Version]
  131. Mohammadi, M.; Kafi, M.A.; Kheyroddin, A.; Ronagh, H. Performance of innovative composite buckling-restrained fuse for concentrically braced frames under cyclic loading. Steel Compos. Struct. Int. J. 2020, 36, 163–177. [Google Scholar]
  132. Mohammadi, M.; Kafi, M.A.; Kheyroddin, A.; Ronagh, H.R. Experimental and numerical investigation of an innovative buckling-restrained fuse under cyclic loading. Structures 2019, 22, 186–199. [Google Scholar] [CrossRef]
  133. Usefi, N.; Ronagh, H.; Mohammadi, M. Finite Element Analysis of Hybrid Cold-Formed Steel Shear Wall Panels; ASEA-SEC04; ISEC Press: Brisbane, QLD, Australia, 2018. [Google Scholar]
  134. Mohammadi, M.; Kafi, M.A.; Kheyroddin, A.; Ronagh, H.R.; Rashidi, M. Experimental and Numerical Investigation of Innovative Composite Buckling-Restrained Fuse; ACMSM25; Springer: Berlin, Germany, 2018. [Google Scholar]
  135. Kazemi, M.; Hajforoush, M.; Talebi, P.K.; Daneshfar, M.; Shokrgozar, A.; Jahandari, S.; Saberian, M.; Li, J. In-situ strength estimation of polypropylene fibre reinforced recycled aggregate concrete using schmidt rebound hammer and point load test. J. Sustain. Cem. Based Mater. 2020, 1–18. [Google Scholar] [CrossRef]
  136. Cha, G.; Park, S.; Oh, T. A terrestrial lidar-based detection of shape deformation for maintenance of bridge structures. J. Constr. Eng. Manag. 2019, 145, 04019075. [Google Scholar] [CrossRef]
  137. Gawronek, P.; Makuch, M. Tls measurement during static load testing of a railway bridge. ISPRS Int. J. Geo-Inf. 2019, 8, 44. [Google Scholar] [CrossRef] [Green Version]
  138. Liu, X.; Wang, P.; Lu, Z.; Gao, K.; Wang, H.; Jiao, C.; Zhang, X. Damage detection and analysis of urban bridges using terrestrial laser scanning (tls), ground-based microwave interferometry, and permanent scatterer interferometry synthetic aperture radar (ps-insar). Remote Sens. 2019, 11, 580. [Google Scholar] [CrossRef] [Green Version]
  139. Gorji Azandariani, M.; Abdolmaleki, H.; Gorji Azandariani, A. Numerical and analytical investigation of cyclic behavior of steel ring dampers (srds). Thin-Walled Struct. 2020, 151, 106751. [Google Scholar] [CrossRef]
  140. Yang, H.; Xu, X.; Neumann, I. Optimal finite element model with response surface methodology for concrete structures based on terrestrial laser scanning technology. Compos. Struct. 2018, 183, 2–6. [Google Scholar] [CrossRef]
  141. Bosché, F. Automated recognition of 3d cad model objects in laser scans and calculation of as-built dimensions for dimensional compliance control in construction. Adv. Eng. Inf. 2010, 24, 107–118. [Google Scholar] [CrossRef]
  142. Laefer, D.F.; Truong-Hong, L.; Fitzgerald, M. Processing of terrestrial laser scanning point cloud data for computational modelling of building facades. Recent Pat. Comput. Sci. 2011, 4, 16–29. [Google Scholar]
  143. Xu, W.; Neumann, I. Finite element analysis based on a parametric model by approximating point clouds. Remote Sens. 2020, 12, 518. [Google Scholar] [CrossRef] [Green Version]
  144. Usefi, N.; Ronagh, H.; Sharafi, P. Numerical modelling and design of hybrid cold-formed steel wall panels. Thin-Walled Struct. 2020, 157, 107084. [Google Scholar] [CrossRef]
  145. Javidan, M.M.; Kang, H.; Isobe, D.; Kim, J. Computationally efficient framework for probabilistic collapse analysis of structures under extreme actions. Eng. Struct. 2018, 172, 440–452. [Google Scholar] [CrossRef]
  146. Usefi, N.; Sharafi, P.; Mortazavi, M.; Ronagh, H.; Samali, B. Structural performance and sustainability assessment of hybrid-cold formed modular steel frame. J. Build. Eng. 2020, 101895. [Google Scholar] [CrossRef]
  147. Lubowiecka, I.; Armesto, J.; Arias, P.; Lorenzo, H. Historic bridge modelling using laser scanning, ground penetrating radar and finite element methods in the context of structural dynamics. Eng. Struct. 2009, 31, 2667–2676. [Google Scholar] [CrossRef]
  148. Armesto, J.; Roca-Pardiñas, J.; Lorenzo, H.; Arias, P. Modelling masonry arches shape using terrestrial laser scanning data and nonparametric methods. Eng. Struct. 2010, 32, 607–615. [Google Scholar] [CrossRef]
  149. Ming, G.; Zhao, Y.; Deng, P.; Guoli, W. Key technology of overall structure monitoring of super-huge and profiled steel structure based on fea simulation and lidar. Inf. Technol. J. 2013, 12, 4576–4581. [Google Scholar] [CrossRef] [Green Version]
  150. Sánchez-Aparicio, L.J.; Riveiro, B.; González-Aguilera, D.; Ramos, L.F. The combination of geomatic approaches and operational modal analysis to improve calibration of finite element models: A case of study in saint torcato church (guimarães, portugal). Constr. Build. Mater. 2014, 70, 118–129. [Google Scholar] [CrossRef] [Green Version]
  151. Khaloo, A.; Lattanzi, D. Extracting structural models through computer vision. In Proceedings of the 2015 Structures Congress, Portland, OR, USA, 23–25 April 2015; pp. 538–548. [Google Scholar]
  152. Bitelli, G.; Castellazzi, G.; D’Altri, A.M.; De Miranda, S.; Lambertini, A.; Selvaggi, I. Automated voxel model from point clouds for structural analysis of cultural heritage. In Proceedings of the International Archives of the Photogrammetry, Remote Sensing and Spatial Information Sciences—ISPRS Archives, Prague, Czech Republic, 12–19 July 2016; pp. 191–197. [Google Scholar]
  153. Castellazzi, G.; D’Altri, A.M.; de Miranda, S.; Ubertini, F. An innovative numerical modeling strategy for the structural analysis of historical monumental buildings. Eng. Struct. 2017, 132, 229–248. [Google Scholar] [CrossRef]
  154. Korumaz, M.; Betti, M.; Conti, A.; Tucci, G.; Bartoli, G.; Bonora, V.; Korumaz, A.G.; Fiorini, L. An integrated terrestrial laser scanner (tls), deviation analysis (da) and finite element (fe) approach for health assessment of historical structures. A minaret case study. Eng. Struct. 2017, 153, 224–238. [Google Scholar] [CrossRef]
  155. D’Altri, A.M.; Milani, G.; de Miranda, S.; Castellazzi, G.; Sarhosis, V. Stability analysis of leaning historic masonry structures. Autom. Constr. 2018, 92, 199–213. [Google Scholar] [CrossRef] [Green Version]
  156. Conde-Carnero, B.; Riveiro, B.; Arias, P.; Caamaño, J.C. Exploitation of geometric data provided by laser scanning to create fem structural models of bridges. J. Perform. Constr. Facil. 2016, 30, 04015053. [Google Scholar] [CrossRef]
  157. Bautista-De Castro, Á.; Sánchez-Aparicio, L.J.; Ramos, L.F.; Sena-Cruz, J.; González-Aguilera, D. Integrating geomatic approaches, operational modal analysis, advanced numerical and updating methods to evaluate the current safety conditions of the historical bôco bridge. Constr. Build. Mater. 2018, 158, 961–984. [Google Scholar] [CrossRef]
  158. Sánchez-Aparicio, L.J.; Bautista-De Castro, Á.; Ramos, L.F.; Sena-Cruz, J. On the use minor and non-destructive methods for the safety evaluation of an historic rc bridge: The bôco bridge. In Proceedings of the IABSE Conference: Engineering the Future—Report, Vancouver, BC, Canada, 19–23 September 2017; pp. 1058–1065. [Google Scholar]
  159. Zogg, H.M.; Ingensand, H. Terrestrial laser scanning for deformation monitoring-load tests on the felsenau viaduct (ch). In Proceedings of the The International Archives of the Photogrammetry, Remote Sensing and Spatial Information Sciences, Beijing, China, 3–11 July 2008; pp. 555–562. [Google Scholar]
  160. Lovas, T.; Barsi, A.; Detrekoi, A.; Dunai, L.; Csak, Z.; Polgar, A.; Berényi, A.; Kibedy, Z.; Szocs, K. Terrestrial laserscanning in deformation measurements of structures. In Proceedings of the International Archives of Photogrammetry and Remote Sensing, Beijing, China, 1 January 2008. [Google Scholar]
  161. Minehane, M.J.; O’Donovan, R.; Ruane, K.D.; O’Keeffe, B. The use of 3d laser scanning technology for bridge inspection and assessment. In Proceedings of the Civil Engineering Research in Ireland, CERI, Belfast, UK, 28–29 August 2014. [Google Scholar]
  162. BD 21/01: The Assessment of Highway Bridges and Structures; Government Department in Northern Ireland: London, UK, 2001.
  163. Mill, T.; Ellmann, A.; Kiisa, M.; Idnurm, J.; Idnurm, S.; Horemuž, M.; Aavik, A. Geodetic monitoring of bridge deformations occurring during static load testing. Balt. J. Road Bridge Eng. 2015, 10, 17–27. [Google Scholar] [CrossRef] [Green Version]
  164. Gyetvai, N.; Truong-Hong, L.; Laefer, D.F. Laser scan-based structural assessment of wrought iron bridges: Guinness bridge, ireland. Proc. Inst. Civ. Eng. Eng. Hist. Herit. 2018, 171, 76–89. [Google Scholar] [CrossRef] [Green Version]
  165. Aashto Lrfd, Bridge Design Specifications; American Association of State Highway and Transportation Officials, AASHTO: Washington, DC, USA, 2012.
  166. Korean Highway Bridge Design Code; Korea Road & Transportation Association: Seoul, Korea, 2010.
  167. Kermarrec, G.; Kargoll, B.; Alkhatib, H. Deformation analysis using b-spline surface with correlated terrestrial laser scanner observations—A bridge under load. Remote Sens. 2020, 12, 829. [Google Scholar] [CrossRef] [Green Version]
  168. Xu, J.; Ding, L.; Love, P.E.D. Digital reproduction of historical building ornamental components: From 3d scanning to 3d printing. Autom. Constr. 2017, 76, 85–96. [Google Scholar] [CrossRef]
  169. Armesto-González, J.; Riveiro-Rodríguez, B.; González-Aguilera, D.; Rivas-Brea, M.T. Terrestrial laser scanning intensity data applied to damage detection for historical buildings. J. Archaeol. Sci. 2010, 37, 3037–3047. [Google Scholar] [CrossRef]
  170. Riveiro, B.; Cubreiro, G.; Conde, B.; Cabaleiro, M.; Lindenbergh, R.; Soilán, M.; Caamaño, J.C. Automated calibration of fem models using lidar point clouds. In Proceedings of the International Archives of the Photogrammetry, Remote Sensing and Spatial Information Sciences—ISPRS Archives, Guangzhou, China, 30 May 2018; pp. 969–974. [Google Scholar]
  171. Xu, X.; Yang, H.; Neumann, I. Deformation monitoring of typical composite structures based on terrestrial laser scanning technology. Compos. Struct. 2018, 202, 77–81. [Google Scholar] [CrossRef]
  172. Mistretta, F.; Sanna, G.; Stochino, F.; Vacca, G. Structure from motion point clouds for structural monitoring. Remote Sens. 2019, 11, 1940. [Google Scholar] [CrossRef] [Green Version]
  173. Conde, B.; Drosopoulos, G.A.; Stavroulakis, G.E.; Riveiro, B.; Stavroulaki, M.E. Inverse analysis of masonry arch bridges for damaged condition investigation: Application on kakodiki bridge. Eng. Struct. 2016, 127, 388–401. [Google Scholar] [CrossRef]
  174. Lee, H.; Park, H. Gage-free stress estimation of a beam-like structure based on terrestrial laser scanning. Comput.-Aided Civ. Infrastruct. Eng. 2011, 26, 647–658. [Google Scholar] [CrossRef]
  175. Xu, X.; Zhao, X.; Yang, H.; Neumann, I. Tls-based feature extraction and 3d modeling for arch structures. J. Sens. 2017, 2017, 9124254. [Google Scholar] [CrossRef]
  176. Xu, X.; Yang, H.; Neumann, I. Monotonic loads experiment for investigation of composite structure based on terrestrial laser scanner measurement. Compos. Struct. 2018, 183, 563–567. [Google Scholar] [CrossRef]
  177. Yang, H.; Xu, X.; Neumann, I. Deformation behavior analysis of composite structures under monotonic loads based on terrestrial laser scanning technology. Compos. Struct. 2018, 183, 594–599. [Google Scholar] [CrossRef]
  178. Yang, H.; Xu, X.; Neumann, I. The benefit of 3d laser scanning technology in the generation and calibration of fem models for health assessment of concrete structures. Sensors (Basel) 2014, 14, 21889–21904. [Google Scholar] [CrossRef] [Green Version]
  179. Kaewunruen, S.; Sresakoolchai, J.; Zhou, Z. Sustainability-based lifecycle management for bridge infrastructure using 6d bim. Sustainability 2020, 12, 2436. [Google Scholar] [CrossRef] [Green Version]
  180. Andriasyan, M.; Moyano, J.; Nieto-Julián, J.E.; Antón, D. From point cloud data to building information modelling: An automatic parametric workflow for heritage. Remote Sens. 2020, 12, 1094. [Google Scholar] [CrossRef] [Green Version]
  181. Woetzel, J.; Garemo, N.; Mischke, J.; Kamra, P.; Palter, R. Bridging Infrastructure Gaps: Has the World Made Progress; McKinsey & Company: New York, NY, USA, 2017; Volume 5. [Google Scholar]
  182. Chen, S.S.; Shirolé, A.M. Integration of information and automation technologies in bridge engineering and management:Extending the state of the art. Transp. Res. Rec. 2006, 1976, 2–12. [Google Scholar] [CrossRef]
  183. Davidson, I.N.; Skibniewski, M.J. Simulation of automated data collection in buildings. J. Comput. Civ. Eng. 1995, 9, 9–20. [Google Scholar] [CrossRef]
  184. Eastman, C.M.; Eastman, C.; Teicholz, P.; Sacks, R.; Liston, K. Bim Handbook: A Guide to Building Information Modeling for Owners, Managers, Designers, Engineers and Contractors, 3rd ed.; Wiley: Hoboken, NJ, USA, 2018. [Google Scholar]
  185. Azhar, S. Building information modeling (bim): Trends, benefits, risks, and challenges for the aec industry. Leadersh. Manag. Eng. 2011, 11, 241–252. [Google Scholar] [CrossRef]
  186. Tang, P.; Akinci, B.; Garrett, J. Laser Scanning for Bridge Inspection and Management; IABSE Symposium Report; Taylor & Francis: Weimar, Germany, 2007; pp. 17–24. [Google Scholar]
  187. Weseman, W. Recording and Coding Guide for the Structure Inventory and Appraisal of the Nation’s Bridges; United States Department of Transportation, Ed.; Federal Highway Administration: Washington, DC, USA, 1995; Volume 119. [Google Scholar]
  188. Javidan, M.M.; Kim, J. Variance-based global sensitivity analysis for fuzzy random structural systems. Comput.-Aided Civ. Infrastruct. Eng. 2019, 34, 602–615. [Google Scholar] [CrossRef]
  189. Tang, P.; Huber, D.; Akinci, B.; Lipman, R.; Lytle, A. Automatic reconstruction of as-built building information models from laser-scanned point clouds: A review of related techniques. Autom. Constr. 2010, 19, 829–843. [Google Scholar] [CrossRef]
  190. Zhao, Y.P.; Vela, P.A. Scan2brim: Ifc model generation of concrete bridges from point clouds. In Proceedings of the Computing in Civil Engineering 2019: Visualization, Information Modeling, and Simulation—Selected Papers from the ASCE International Conference on Computing in Civil Engineering 2019, Atlanta, GA, USA, 17–19 June 2019; pp. 455–463. [Google Scholar]
  191. Panushev, I.; Brandt, J. 3D Imaging Pilot Projects: Three Case Studies; Harvard Design School: Boston, MA, USA, 2007. [Google Scholar]
  192. Pu, S.; Vosselman, G. Knowledge based reconstruction of building models from terrestrial laser scanning data. ISPRS J. Photogramm. Remote Sens. 2009, 64, 575–584. [Google Scholar] [CrossRef]
  193. Sacks, R.; Kedar, A.; Borrmann, A.; Ma, L.; Brilakis, I.; Hüthwohl, P.; Daum, S.; Kattel, U.; Yosef, R.; Liebich, T.; et al. Seebridge as next generation bridge inspection: Overview, information delivery manual and model view definition. Autom. Constr. 2018, 90, 134–145. [Google Scholar] [CrossRef] [Green Version]
  194. Kwiatkowski, J.; Anigacz, W.; Beben, D. A case study on the noncontact inventory of the oldest european cast-iron bridge using terrestrial laser scanning and photogrammetric techniques. Remote Sens. 2020, 12, 2745. [Google Scholar] [CrossRef]
  195. Puri, N.; Turkan, Y. Bridge construction progress monitoring using lidar and 4d design models. Autom. Constr. 2020, 109, 102961. [Google Scholar] [CrossRef]
  196. Turkan, Y.; Bosche, F.; Haas, C.T.; Haas, R. Automated progress tracking using 4d schedule and 3d sensing technologies. Autom. Constr. 2012, 22, 414–421. [Google Scholar] [CrossRef]
  197. Turkan, Y.; Bosché, F.; Haas, C.T.; Haas, R. Tracking secondary and temporary concrete construction objects using 3d imaging technologies. In Proceedings of the ASCE International Workshop on Computing in Civil Engineering, Los Angeles, CA, USA, 23–25 June 2013; pp. 749–756. [Google Scholar]
  198. Turkan, Y.; Bosché, F.; Carl, T.H.; Haas, R. Toward automated earned value tracking using 3d imaging tools. J. Constr. Eng. Manag. 2013, 139, 423–433. [Google Scholar] [CrossRef] [Green Version]
  199. Turkan, Y.; Bosché, F.; Haas, C.T.; Haas, R. Tracking of secondary and temporary objects in structural concrete work. Constr. Innov. 2014, 14, 145–167. [Google Scholar] [CrossRef]
  200. Bosche, F.; Haas, C.T. Automated retrieval of 3d cad model objects in construction range images. Autom. Constr. 2008, 17, 499–512. [Google Scholar] [CrossRef]
  201. Bosché, F. Plane-based registration of construction laser scans with 3d/4d building models. Adv. Eng. Inf. 2012, 26, 90–102. [Google Scholar] [CrossRef]
  202. Zhang, C.; Arditi, D. Automated progress control using laser scanning technology. Autom. Constr. 2013, 36, 108–116. [Google Scholar] [CrossRef]
  203. Kim, C.; Son, H.; Kim, C. Automated construction progress measurement using a 4d building information model and 3d data. Autom. Constr. 2013, 31, 75–82. [Google Scholar] [CrossRef]
  204. Ying, C.; Zhou, Y.; Han, D.; Qin, G.; Hu, K.; Guo, J.; Guo, T. Applying bim and 3d laser scanning technology on virtual pre-assembly for complex steel structure in construction. In Proceedings of the IOP Conference Series: Earth and Environmental Science, Beijing, China, 20–22 September 2019; Volume 371. [Google Scholar]
  205. Arashpour, M.; Heidarpour, A.; Akbar Nezhad, A.; Hosseinifard, Z.; Chileshe, N.; Hosseini, R. Performance-based control of variability and tolerance in off-site manufacture and assembly: Optimization of penalty on poor production quality. Constr. Manag. Econ. 2019, 38, 502–514. [Google Scholar] [CrossRef]
  206. Kim, M.-K.; Wang, Q.; Park, J.-W.; Cheng, J.C.P.; Sohn, H.; Chang, C.-C. Automated dimensional quality assurance of full-scale precast concrete elements using laser scanning and bim. Autom. Constr. 2016, 72, 102–114. [Google Scholar] [CrossRef]
  207. Wang, Q.; Kim, M.K.; Cheng, J.C.P.; Sohn, H. Automated quality assessment of precast concrete elements with geometry irregularities using terrestrial laser scanning. Autom. Constr. 2016, 68, 170–182. [Google Scholar] [CrossRef]
  208. Maalek, R.; Lichti, D.D.; Ruwanpura, J.Y. Automatic recognition of common structural elements from point clouds for automated progress monitoring and dimensional quality control in reinforced concrete construction. Remote Sens. 2019, 11, 1102. [Google Scholar] [CrossRef] [Green Version]
  209. Liu, J.; Li, D.; Feng, L.; Liu, P.; Wu, W. Towards automatic segmentation and recognition of multiple precast concrete elements in outdoor laser scan data. Remote Sens. 2019, 11, 1383. [Google Scholar] [CrossRef] [Green Version]
  210. Wang, J.; Sun, W.; Shou, W.; Wang, X.; Wu, C.; Chong, H.Y.; Liu, Y.; Sun, C. Integrating bim and lidar for real-time construction quality control. J. Intell. Robot. Syst. Theory Appl. 2015, 79, 417–432. [Google Scholar] [CrossRef]
  211. Rashidi, M.; Lemass, B.; Gibson, P. A decision support system for concrete bridge maintenance. AIP Conf. Proc. 2010, 1233, 1372–1377. [Google Scholar]
  212. Rashidi, M.; Ghodrat, M.; Samali, B.; Mohammadi, M. Decision support systems. In Management of Information Systems; IntechOpen: London, UK, 2018. [Google Scholar]
  213. Rashidi, M.; Ghodrat, M.; Samali, B.; Kendall, B.; Zhang, C. Remedial modelling of steel bridges through application of analytical hierarchy process (ahp). Appl. Sci. 2017, 7, 168. [Google Scholar] [CrossRef] [Green Version]
  214. Rashidi, M.; Zhang, C.; Ghodrat, M.; Kempton, S.; Samali, B.; Akbarnezhad, A.; Zhu, L. Bridge abutment movement and approach settlement—A case study and scenario analysis. Int. J. Struct. Stab. Dyn. 2018, 18, 1840011. [Google Scholar] [CrossRef]
  215. Sacks, R.; Kedar, A.; Borrmann, A.; Ma, L.; Singer, D.; Kattel, U. Seebridge information delivery manual (idm) for next generation bridge inspection. In Proceedings of the ISARC 2016—33rd International Symposium on Automation and Robotics in Construction, Auburn, AL, USA, 18–21 July 2016; pp. 826–834. [Google Scholar] [CrossRef] [Green Version]
  216. Dang, S.; Kang, H.; Lon, S.; Shim, C. 3d digital twin models for bridge maintenance. In Proceedings of the 10th International Conference on Short and Medium Span Bridges, Quebec City, QC, Canada, 31 July 2018. [Google Scholar]
  217. Bolourian, N.; Hammad, A. Lidar-equipped uav path planning considering potential locations of defects for bridge inspection. Autom. Constr. 2020, 117, 103250. [Google Scholar] [CrossRef]
  218. Sahlman, W. Best Practice Asset Management Bim—Pyrmont Bridge Case Study; Sydney Harbour Foreshore Authority (SHFA): Sydney, Australia, 2018. [Google Scholar]
  219. Hassan, M.U.; Akcamete-Gungor, A.; Meral, C. Investigation of terrestrial laser scanning reflectance intensity and rgb distributions to assist construction material identification. In Proceedings of the Joint Conference on Computing in Construction (JC3), Heraklion, Greece, 4–7 July 2017; pp. 4–7. [Google Scholar]
  220. Valero, E.; Bosché, F.; Forster, A. Automatic segmentation of 3d point clouds of rubble masonry walls, and its application to building surveying, repair and maintenance. Autom. Constr. 2018, 96, 29–39. [Google Scholar] [CrossRef]
  221. Hu, F.; Zhao, J.; Huang, Y.; Li, H. Structure-aware 3d reconstruction for cable-stayed bridges: A learning-based method. Comput.-Aided Civ. Infrastruct. Eng. 2020, 1–20. [Google Scholar] [CrossRef]
  222. Kim, H.; Yoon, J.; Sim, S.-H. Automated bridge component recognition from point clouds using deep learning. Struct. Control Health Monit. 2020, 27, e2591. [Google Scholar] [CrossRef]
Figure 1. Flowchart of the scientometric review process.
Remotesensing 12 03796 g001
Figure 2. Historical trend of published papers using terrestrial laser scanners (TLS) in all construction industries and bridge engineering (2010–2020).
Remotesensing 12 03796 g002
Figure 3. Network of co-occurring keywords.
Remotesensing 12 03796 g003
Figure 4. Network of co-authorship.
Remotesensing 12 03796 g004
Figure 5. Network of countries/regions.
Remotesensing 12 03796 g005
Figure 6. Generation of 3D models from the point data sets: (a) Robot City bridge point cloud, Pennsylvania [80]; (b) 3D finite element model of the Robot City bridge [80]; (c) Dunsley corner bridge point cloud, Cambridge [79,80]; (d) 3D solid model of Dunsley corner bridge [80].
Remotesensing 12 03796 g006
Figure 7. Crack characterization using integrated laser scanning and image processing: (a) identified critical region; (b) 3D model of critical region [47].
Remotesensing 12 03796 g007
Figure 8. Surface damage detection of concrete pier: (a) point cloud with RGB values; (b) results of using curvature computation [106]; (c) concrete pier with scaling; (d) evaluated scaling depth [109].
Remotesensing 12 03796 g008
Figure 9. Generation of finite element model from data points for subsequent numerical evaluation: (a) optimized acquired point cloud of the footbridge [156]; (b) structural finite element model of the footbridge [156]; (c) optimized acquired point cloud of the Boco bridge [157]; (d) structural modal analysis of the Boco bridge [157].
Remotesensing 12 03796 g009
Figure 10. Static loading scenarios for deflection assessment: (a) static loading scenarios for girder bridge [136]; (b) static loading scenario for railway bridge [137].
Remotesensing 12 03796 g010
Figure 11. Development of BrIM for Pyrmont Bridge, Sydney: (a) current form; (b) original/non-original fabrics over time as a BrIM output [218].
Remotesensing 12 03796 g011
Table 1. Top journals and conferences with relevant published papers (2010–2020).
Journal TitleNumber of Relevant Articles% of Total Included Publications
Automation in Construction5618%
Remote Sensing155%
Advanced Engineering Informatics134%
Journal of Computing in Civil Engineering114%
Structural Control and Health Monitoring114%
Construction and Building Materials103%
Conference TitleNumber of Relevant Articles% of Total Included Publications
ISPRS, International Archives of the Photogrammetry, Remote Sensing and Spatial Information Sciences103%
ISARC, International Symposium on Automation and Robotics in Construction31%
Congress on Computing in Civil Engineering31%
Table 2. List of keywords and related network data.
KeywordOccurrenceAverage Year PublishedLinksTotal link Strength% of Total Occurrence
3D Model Development
Point cloud5820162210512%48%
Terrestrial laser scanning552016217811%
Image processing24201521565%
Structural health monitoring20201517524%
Automation26201517495%
Finite element method25201615365%
Algorithms16201318363%
3D modeling1520138203%
Quality Inspection
Damage detection30201617426%27%
Geometry25201516435%
Object recognition15201312253%
Bridge inspection14201611243%
Crack detection13201511263%
Arch bridge11201514362%
Surface defects10201513212%
Concrete bridges62018881%
Masonry bridges8201611282%
Structural Assessment
Surface analysis28201519706%13%
Deformation19201711364%
Condition assessments11201611212%
Structural assessment520169121%
Construction Management
Building information model- BIM30201615456%12%
Project management13201610213%
Quality control12201411222%
Quality assurance520159131%
Table 3. General features of the co-authorship network.
NetworkNodesLinksDensityModularity, QMean Silhouette Score
Co-authorship52110120.00750.95670.9136
Table 4. List of the top 8 most productive authors (2010–2020).
AuthorInstitutionCountryCountPercentage
Riveiro, B.University of VigoSpain227%
Laefer, D.F.New York UniversityUSA134%
Wang, Q.National University of SingaporeSingapore124%
Sohn, H.Korea Advanced Institute of Science and TechnologySouth Korea114%
Arias, P.University of VigoSpain103%
Yang, H.Jiangsu University of Science and TechnologyChina103%
Truong-Hong, L.Delft University of TechnologyNetherlands93%
Bosché, FUniversity of EdinburghUnited Kingdom93%
Table 5. Examples of crack detections in different components.
MaterialsComponentsDetected CrackTLSReferences
Width (mm)Length (mm)Scan Range (m)Resolution
ConcreteWall and Slab [47,91,92,93,94,95,96,97,98,99]
2.7~206202.56 mm @ 50 m[47]
Façade
>1.13>8820~355 mm @ 100 m[100]
Beam [101]
Pavement [102,103]
Cylindrical specimen [104,105]
BrickWall
1~7_5~12.50.4 mm @ 11 m[46]
Façade
>0.85>9020~355 mm @ 100 m[100]
TimberBeam
3~13 30~590<7.5<1 mm @ 10 m[48]
Table 6. Examples of mass loss, scaling and spalling in different components.
Damage TypeComponentsDetected DamageTLSReferences
AreaDepthScan Range (m)Resolution
Mass loss [91,101,106,108]
Concrete pier>50% of surface_805 mm @ 50 m[106]
Concrete girder8% of surface_205 mm @ 50 m[106]
Steel girder>50% of surface_<202 mm @ 10 m[91,101]
Timber pier>30% of surface_<202 mm @ 10 m[91]
Scaling [109,113]
Concrete pier_<100 mm10~305 mm @ 600 m[109]
Concrete surface>30 mm across>1 mm3~200.014°~0.036°[113]
Spalling [91,101,111,112]
Concrete deck>10% of surface_<202 mm @ 10 m[91,101]
Concrete panel<180 mm × 180 mm<30 mm4~122 mm @ 20 m[112]
Table 7. Examples of corrosion, water bleeding, and efflorescence detection with various methods.
Damage TypeComponentsDetection MethodTLSReferences
Scan Range (m)Resolution
Corrosion [91,101,125]
Steel truss elementPoint cloud classification<105 mm @ 100 m[125]
Steel girderSurface normal based<202 mm @ 10 m[91,101]
Water bleeding [121,123]
Concrete pierK-means and fuzzy C-means9~176 mm @ 50 m[121]
Concrete pierSupport vector machine631.6 mm @ 10 m[123]
Efflorescence [120,123,124]
Concrete wallReal-time <2001 mm @ 100 m[120]
Table 8. Examples of deflection measurement using TLS for different types of bridges.
Bridge TypeSpan (m)Measured Deflection, Maximum (mm)TLS ResolutionLoad TypeReferences
Steel girder1004.8235 mm @ 300 mStatic load by trucks [136]
Steel truss52.718.21.5 mm @ 10 mStatic load by train[137]
Concrete viaduct156142 mm @ 25 mStatic load by tanks[159]
Cable-stayed307350 5 mm @ 100 mStatic load[160]
Concrete cantilever17.5356 mm @ 50 mStatic load by blocks[163]
Table 9. Examples of TLS based bridge information modeling (BrIM) for different types of bridges.
BRIDGE TYPESpan (m)TLSBrIM ApplicationLocationReferences
ScansResolution
Concrete slab5182 mm @ 10 mManagementCambridge, UK[79,80]
Concrete viaduct24_3 mm @ 10 mCondition assessmentKoszalin, Poland[128]
Stone arch29122 mm @ 10 mCondition assessmentAlcántara, Spain[130]
Stone arch11.5102 mm @ 10 m3D model and assessmentMondariz, Spain[147]
Cable-stayed27_6 mm @ 50 m3D model and assessmentVigo, Spain[156]
Concrete arch35182 mm @ 25 m3D model and assessmentAmares, portugal[157]
Masonry arch15.566 mm @ 50 mCondition assessmentKillorglin, Ireland[161]
Iron truss5225 mm @ 50 mCondition assessmentDublin, Irland[164]
Concrete girder25123 mm @ 10 mCondition assessment_[186]
Concrete girder5.2142 mm @ 10 mManagementAcworth, USA[190,193]
Cast iron cable21.2102 mm @ 10 mCondition assessmentOzimek, Poland[194]
Publisher’s Note: MDPI stays neutral with regard to jurisdictional claims in published maps and institutional affiliations.

