Article

Ground Deformation of Wuhan, China, Revealed by Multi-Temporal InSAR Analysis

1
School of Geodesy and Geomatics, Wuhan University, Wuhan 430079, China
2
Roy M. Huffington Department of Earth Sciences, Southern Methodist University, Dallas, TX 75205, USA
3
Guangxi Key Laboratory of Spatial Information and Geomatics, Guilin University of Technology, Guilin 541004, China
4
School of Geology Engineering and Geomatics, Chang’an University, Xi’an 710054, China
5
Wuhan Geomatics Institute, Wuhan 430022, China
*
Author to whom correspondence should be addressed.
Remote Sens. 2020, 12(22), 3788; https://doi.org/10.3390/rs12223788
Submission received: 13 October 2020 / Revised: 12 November 2020 / Accepted: 16 November 2020 / Published: 18 November 2020

Abstract

:
Wuhan, the largest city in central China, has experienced rapid urban development leading to land subsidence as well as environmental concerns in recent years. Although a few studies have analyzed the land subsidence of Wuhan based on ALOS-1, Envisat, and Sentinel-1 datasets, the research on long-term land subsidence is still lacking. In this study, we employed multi-temporal InSAR to investigate and reveal the spatiotemporal evolution of land subsidence over Wuhan with ALOS-1, Envisat, and Sentinel-1 images from 2007–2010, 2008–2010, 2015–2019, respectively. The results detected by InSAR were cross-validated by two independent SAR datasets, and leveling observations were applied to the calibration of InSAR-derived measurements. The correlation coefficient between the leveling and InSAR has reached 0.89. The study detected six main land subsidence zones during the monitoring period, with the maximum land subsidence velocity of −46 mm/a during the 2015–2019 analysis. Both the magnitude and the extent of the land subsidence have reduced since 2017. The causes of land subsidence are discussed in terms of urban construction, Yangtze river water level changes, and subsurface water level changes. Our results provide insight for understanding the causes of land subsidence in Wuhan and serve as reference for city management for reducing the land subsidence in Wuhan and mitigating the potential hazards.

Graphical Abstract

1. Introduction

Because of highly compressible soils and significant human activity, land subsidence has been a problem for many cities [1,2,3]. The geological environment has seen rapid change over the past few decades, because of rapid economic development and urban expansion, as well as human-induced subsurface changes such as groundwater extraction and overloading [3,4,5]. Wuhan, one of the largest cities in China, has experienced multiple geological hazards in recent years because of the complex geological setting and anthropogenic activities. The main geohazards include surface sinking, landslides, collapse of unstable rock masses, debris flows, and land subsidence. The human casualties and property damage caused by these geo-hazards necessitates urban subsidence monitoring to preserve the safety and integrity of infrastructure, and to responsibly manage urban planning [6]. At least 29 geo-hazards associated with surface sinking have been recorded in Wuhan from 1977 to 2014 [7]. Previous studies show that Wuhan’s land subsidence resulted from: (1) over-extraction of groundwater, (2) large area consolidation of mucky soil layers, (3) karst geomorphologic setting, and (4) urban construction and infrastructure [8,9,10,11]. In recent years, owing to groundwater over-exploitation, metro construction, mining, and industry development, multiple subsidence areas have formed in Wuhan, especially in those areas underlaid by mucky soft clay layers. The density of the urban concentration presents larger opportunity for disaster, should structures fail. By 2019, Wuhan had more than 147 skyscrapers with heights exceeding 200 m, most of which were built on the north bank of the Yangtze river (https://wh.leju.com/news/2019-08-27/07076571890750215470666.shtml). For the purpose of disaster prevention and warning, it is necessary to obtain the latest spatiotemporal characteristics of land subsidence in Wuhan. Although in situ observation including leveling, GPS, and sediment borehole measurements have been employed [12], the low spatial (and sometimes temporal) resolution of these techniques limits their application for large-scale monitoring. InSAR (Interferometric Synthetic Aperture Radar), with its high spatial-temporal resolution and large-scale coverage, has successfully been used for monitoring land subsidence, landslides, tunnel stability, sinkholes, and earthquakes since the 1990s [13,14,15,16,17].
InSAR is a differential method; all of the measurements produced are “relative” rather than “absolute,” both in space and time [18]. Each measurement is referred temporally and spatially to a unique reference image and to a reference point presumed to be stationary. The selected reference scene is chosen by its ability to maximize the total coherence of the interferometric stack and to keep the dispersion of the normal baseline values as low as possible. A limitation of InSAR is that it cannot recognize constant movements involving the selected ground reference points, such as crustal movements that occur over large areas, and the accuracies of low wavenumber components of the velocity field decrease with increasing distance from them [19]. When studying a large area experiencing subsidence or uplift, InSAR is most effective when paired with additional information; Global Navigation Satellite Systems (GNSS) such as GPS, provide the necessary comparison and calibration. Because the accuracy of conventional differential InSAR (D-InSAR) is limited by decorrelation, atmospheric artifacts, and orbit errors [20,21], newer multi-temporal InSAR (MT-InSAR) techniques such as PS-InSAR (Persistent Scatterers InSAR), SBAS-InSAR (Small Baseline Subset InSAR), TCP-InSAR (Temporarily Coherent Point InSAR), QPS (Quasi Persistent Scatterers), and SqueeSAR, have been developed to overcome these limitations. These MT-InSAR techniques have been widely used to measure and map the urban land subsidence on a large scale with millimeter-level accuracy from space [21,22,23,24,25,26,27,28,29,30].
Wuhan is the capital city of Hubei province and comprises seven main urban zones and six different suburban areas. The seven main urban zones are Jianghan (JH), Jiangan (JA), Qiaokou (QK), Hanyang (HY), Wuchang (WC), Honhshan (HS), and Qingshan (QS) (Figure 1a). Geographically, it is located on the eastern part of the Jianghan Plain in central China, 113°41′–115°05′ E, 29°58′–31°22′ N, covering an area of about 8494 square kilometers. The city is located to the south of the Ta-pieh Mountains, at the confluence of the middle reaches of the Yangtze and Han rivers. Wuhan is divided into three areas by the Yangtze and Han rivers: Hankou, Wuchang, and Hanyang (Figure 1b). Surrounded by hills and ridges to the north and the south, Wuhan’s terrain is flat, with an average altitude of about 23.3 m above sea level. There are more than 200 lakes of various sizes, and the water bodies make up one-quarter of its entire territory. The climate in this area is humid subtropical monsoon with abundant rainfall. According to the records available from Wuhan governmental agencies, the temperature varies from −18 ℃ to 41 ℃ and the average annual precipitation ranges from 1150 to 1450 mm/a, primarily concentrated in the rainy season from June to August. Mucky soft soils and seven carbonate rock belts are widely distributed in Wuhan (Figure 1b). Along the banks of the Yangtze river, the mucky soft soil layers are thicker than in other areas (Wuhan Regulation on the Prevention and Control of Geologic Disasters, 2016).
Several studies have identified subsidence in Wuhan using various methods as well as different sources of data (Table 1) [31,32,33,34]. There is a good understanding of spatial locations of land subsidence and the physical processes causing the subsidence in Wuhan. Table 1 shows a summary of the relevant studies about land subsidence in the Wuhan metropolitan area. However, there is a lack of comprehensive understanding about the spatial extension, magnitude, and temporal evolution of ground deformation in Wuhan from 2007 to 2013. The analysis of subsidence over Wuhan in the past has been constrained to use of just one SAR sensor in each publication. In addition, a few studies have been carried out using the L-band SAR satellites in 2007–2010; this is relevant because L-band InSAR can render higher coherence and therefore more details about deformation in vegetated areas [35].
In this article, we combine the L-band with C-band InSAR for estimating the land subsidence in Wuhan. We conduct a comprehensive analysis with multi-band SAR data and map the spatial and temporal evolution of land subsidence in Wuhan. We exploited three different SAR sensors: Envisat, ALOS-1, and Sentinel-1 to perform a long-term study in Wuhan. More than 100 SAR images, including Envisat, ALOS-1, and Sentinel-1 datasets, are included to analyze the characteristics of ground deformation from 2008–2010, 2007–2010, and 2015–2019 by using stacking, PS, and SBAS methods respectively. First, we estimate the long-term deformation velocity during 2007–2010 and 2015–2019, by PS and SBAS method to unveil the spatial distribution of land subsidence areas. Second, the InSAR results are validated by 125 leveling benchmarks. Finally, the possible causes of land subsidence are discussed according to the results of InSAR.

2. Datasets and Methodology

2.1. Datasets

2.1.1. SAR Datasets

This study utilizes 126 available SAR scenes composed of 19 ascending L-band ALOS-1 scenes acquired from January 2007 to October 2010, 3 ascending C-band Envisat scenes acquired from December 2008 to May 2010, and after a four-year gap, 104 ascending C-band Sentinel-1A scenes acquired from April 2015 to June 2019. More detailed information on the SAR datasets is summarized in Table 2. The spatial coverage of the three SAR datasets used in this study is shown in Figure 1a. The topographic phase of interferograms was removed by 1-arc-second (30 m) SRTM DEM released by NASA [36].

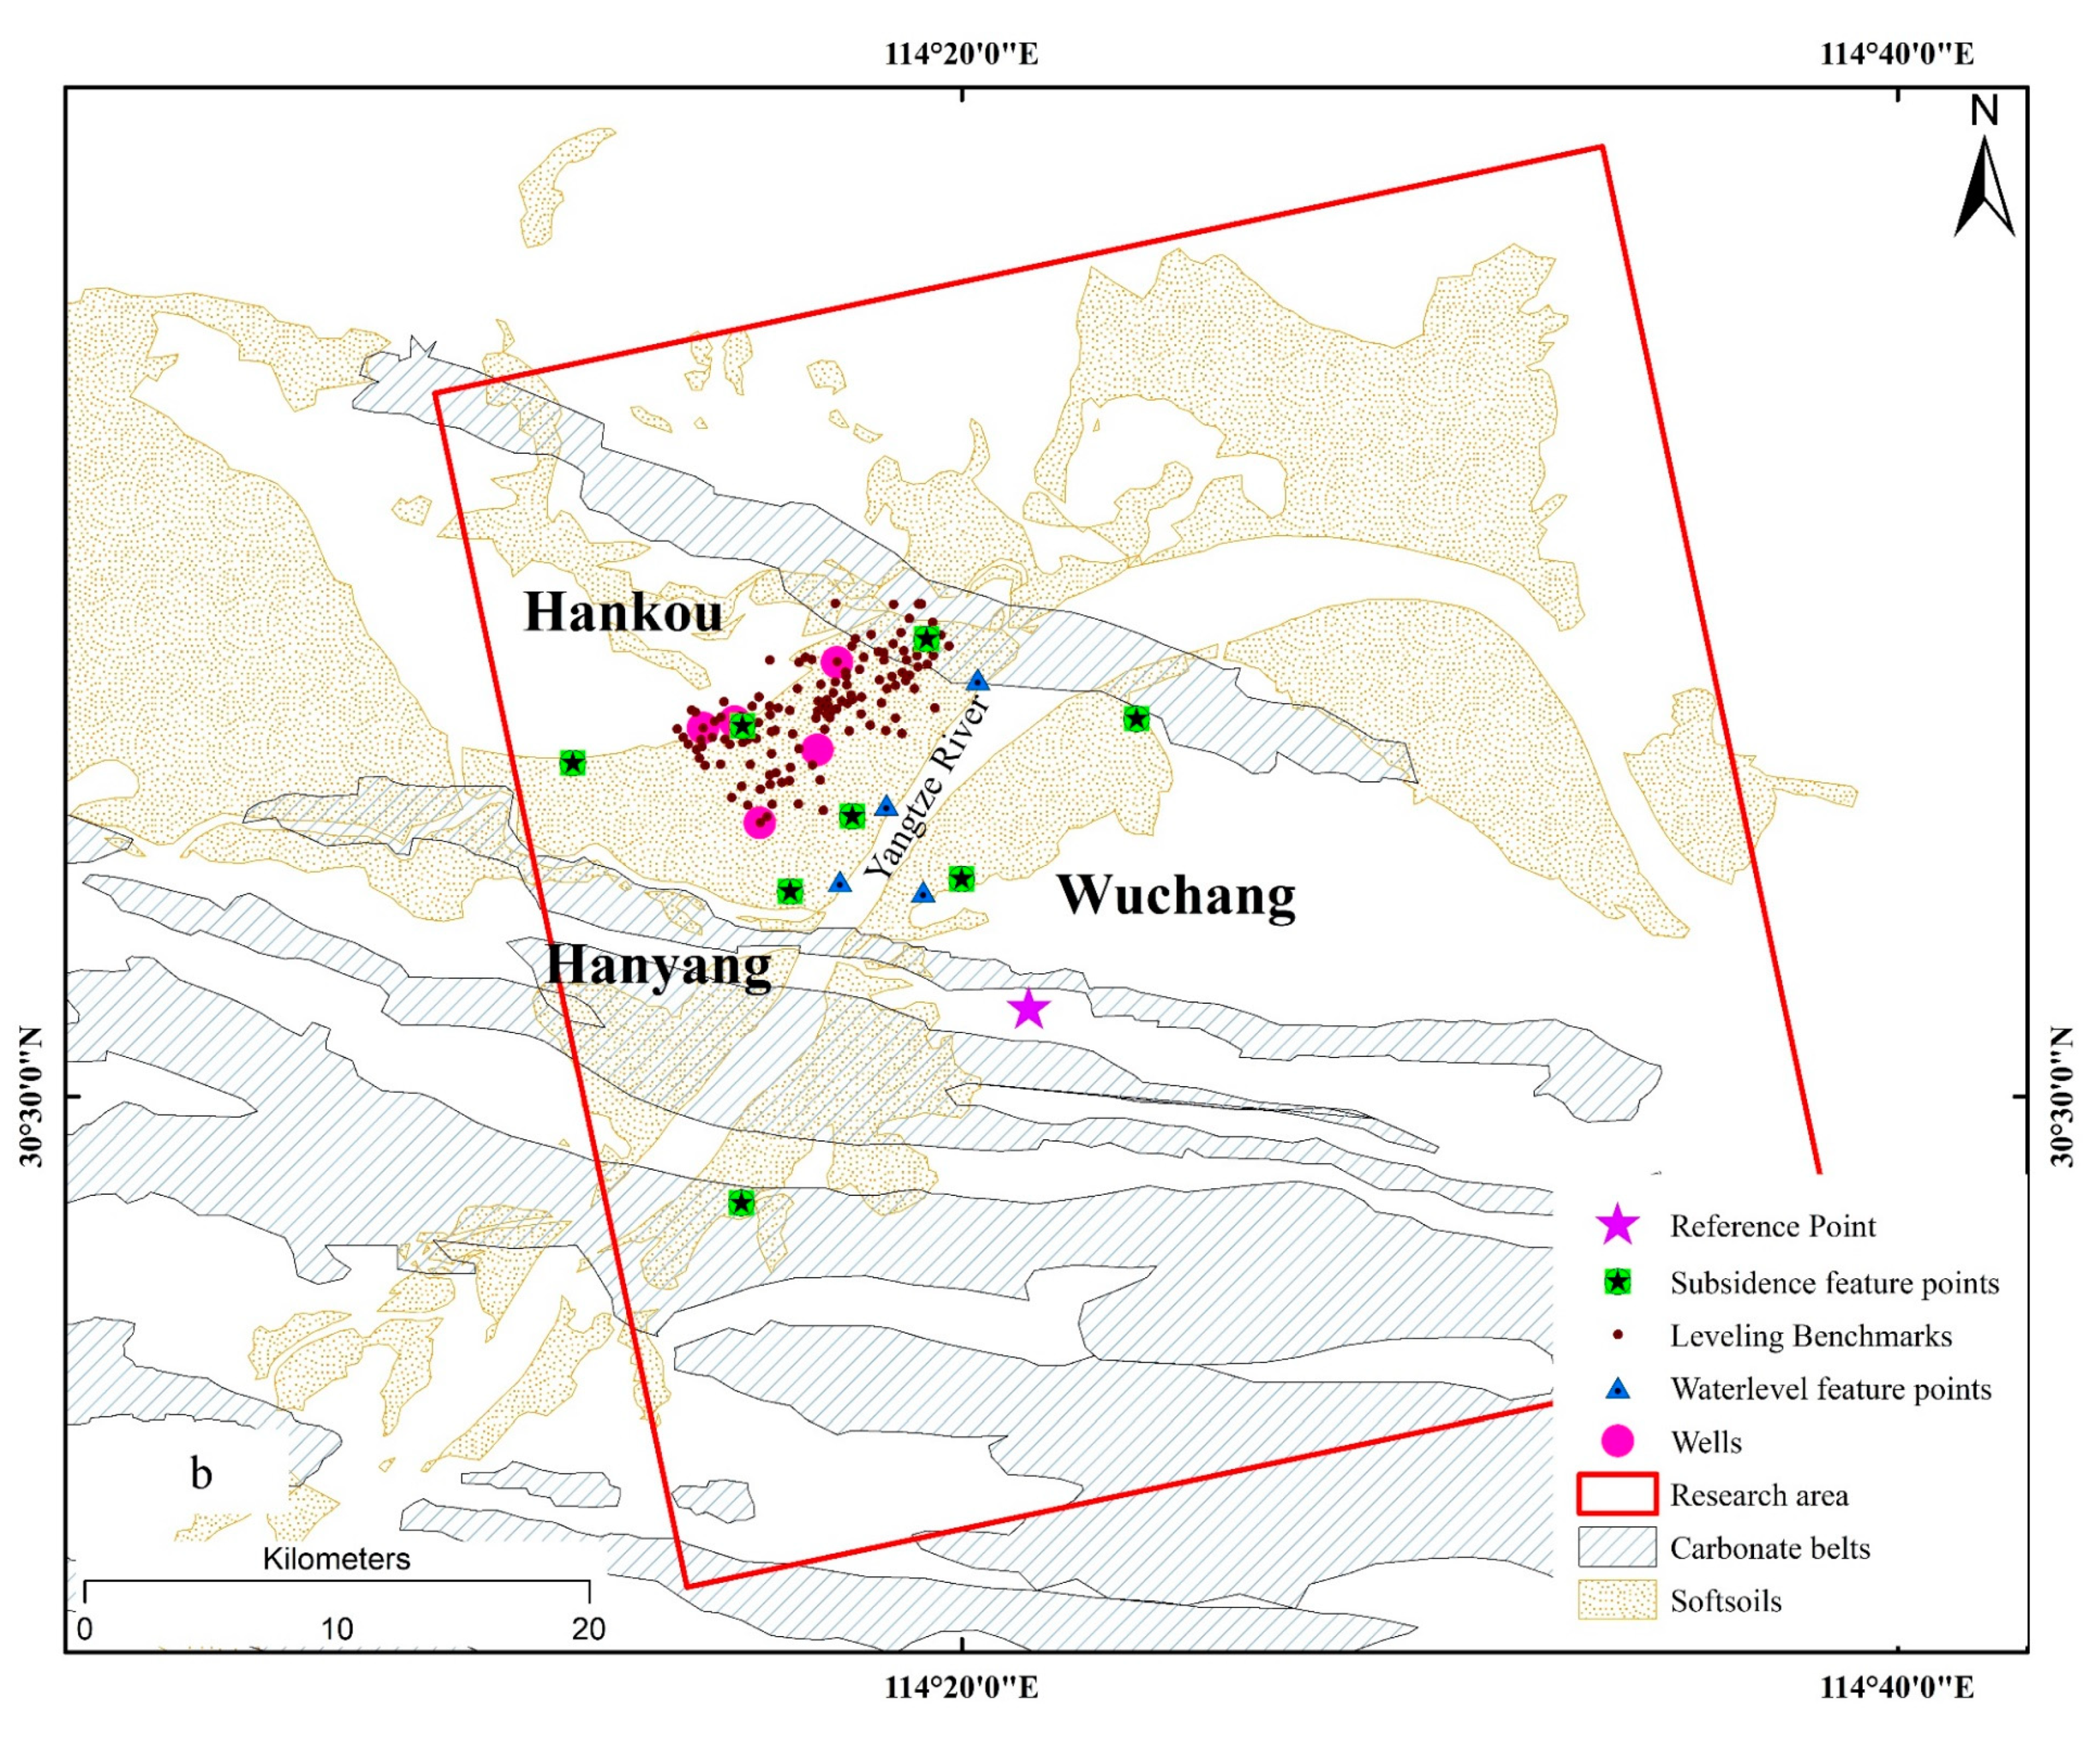
2.1.2. Leveling Observations, Groundwater Level, Yangtze River Water Levels Datasets

Total of 125 leveling observations (dark brown dots in Figure 1b) were measured by the Wuhan Geomatics Institute in 2016 and 217 in the Jiangan (JA) urban zone with about 2 mm of precision. These leveling benchmarks were applied to validate the InSAR-derived results. The daily groundwater levels of five water wells were collected from September 2017 to June 2019 (bright pink dots in Figure 1b) and the daily water levels of the Yangtze River in Hankou hydrological station were acquired from April 2015 to June 2019 (blue triangles in Figure 1b), which coincided with the acquisition of the Sentinel-1 data. Thus, the water levels of the Yangtze River and the groundwater levels can be used to investigate their effects on land subsidence measured by InSAR in Wuhan. The leveling benchmarks and ground water levels of aquifer wells were provided by the Wuhan Geomatics Institute and the water levels of the Yangtze River in Hankou were acquired from Changjiang Maritime Safety Administration website.

2.2. Methodology

Many studies utilize Persistent Scatterers InSAR (PS-InSAR) and Small Baseline Subset InSAR (SBAS-InSAR) to generate deformation time series [21,22,23,24]. In this study, time-series deformation is derived from the StaMPS technique. The StaMPS software includes PS-InSAR and SBAS-InSAR algorithms [27,28,37]. The PS-InSAR algorithm selects the prime image based on temporal and spatial baselines, determines the difference in Doppler centroid, then generates interferograms between the prime image and the other images. The PS pixels will be identified from interferograms optimized for PS analysis. The SBAS-InSAR algorithm maximizes the interferogram correlation through short temporal and spatial baselines interferograms, while ensuring no isolated clusters of the interferograms. StaMPS identifies slowly decorrelating filtered phase (SDFP) pixels whose phases decorrelate little over short time intervals on single-look images [27,28,37].

2.2.1. PS-InSAR Processing

StaMPS uses both amplitude and phase analyses to determine the probability of PSCs (persistent scatterer candidate points) at individual pixels. An initial selection based on amplitude analysis is performed first [21,37]. The amplitude dispersion index is defined as:
D A = σ A μ A
where DA is the threshold value for selecting PSCs, μ A is the mean, and σ A is the standard deviation of a series of amplitudes values. Then the phase analysis is used to refine the PS probability by an iterative process. We derive the estimate of decorrelation noise γ χ after the spatially correlated term and spatially uncorrelated term are subtracted from the interferograms. Then, γ χ represents the variation of residual phase for PSCs, and is an indicator of whether the PSC is a PS pixel,
γ χ = 1 N | i = 1 N exp { 1 ( ψ x , i ψ x , i Δ ψ θ , x , i u ) } |
where N is the number of interferograms, Ψ x , i is the wrapped phase of the pixel χ in the ith interferogram, Ψ ˜ x , i is the estimated spatially correlated terms (i.e., land displacement, orbital inaccuracies, atmosphere delay in different passes, look angle error, the noise caused by thermal effect, co-registration error and the uncertainty of azimuth phase center) and Δ Ψ θ , x , i μ is the spatially uncorrelated look angle error term. We obtain the root-mean-square change of γ χ after each iteration, with the iterations continuing until γ χ is converged. Then, the PS pixels are selected [27,37].
Once the PS pixels are selected, the 3-D (three-dimensional, two in space and one in time) phase unwrapping algorithm [38] is applied to the sets of PS pixels to recover the unambiguous phase. Then spatially correlated errors are estimated by high-pass filtering in temporal and low-pass filtering in spatial. Finally, the unwrapped phases are inverted in least-squares method to derive the time series of PS points.

2.2.2. SBAS-InSAR Processing

The StaMPS SBAS method can identify the single-look SDFP pixels on single-look images directly. The SDFP pixels are identified among the candidate pixels in the same method and algorithm as with PS pixels [27,37]. However, SDFP pixels are selected based on multiple prime small-baselines interferograms with spectral filtering, whereas PS pixels are chosen based on single-prime interferograms without spectra filtering. The phase of SDFP pixels is corrected by the estimate of spatially uncorrected look angle error calculated in the selection processing. When selecting the SDFP pixels, the 3-D unwrap method is applied to all of the SBAS interferograms; the high-pass filter and low-pass filter are then applied to remove the spatially correlated errors. Finally, time-series deformations of all the SDFP pixels are derived by least-squares inversion [28,39].

3. Results and Accuracy Assessment

3.1. Velocity of Land Subsidence

The PS-InSAR method was applied to the 19 images acquired by ALOS-1 and the SBAS-InSAR method was used for the 104 images acquired by Sentinel-1 over Wuhan. From this, we constructed a total of 556 interferograms including 538 for SBAS processing and 18 for PS processing based on the above criteria [40,41,42]. To minimize the variances of Doppler, perpendicular, and temporal baselines, the 23 October 2009 scene was selected as the prime image for ALOS-1 data in PS processing. From the Sentinel-1 dataset, we selected 498 interferograms for SBAS processing based on the average coherence of interferograms, and the coherence threshold was set to 0.3. Then the two datasets were processed using StaMPS PS and SBAS methods, respectively. The subsidence results derived from Envisat were obtained using the stacking method, as there are only three images during 2008–2010.
We generated line-of-sight (LOS) deformation velocity maps over Wuhan for three periods: 2007–2010 (ALOS-1), 2008–2010 (Envisat), 2015–2019 (Sentinel-1). As the InSAR results are along the LOS directions, assuming that deformation occurs primarily in the vertical direction, all of the results are converted from line-of-sight ( d l o s ) into vertical ( d v ) with respect to the corresponding incidence angles ( θ ): d v = d l o s / cos θ [43,44]. Figure 2a highlights the vertical velocity map from 2007 to 2010 calculated with L-band ALOS-1 data, Figure 2b shows the vertical velocity over a part of the study area from 2008 to 2010 with Envisat data because of the limited coverage of Envisat images (coverage outline of Envisat shown in Figure 2a). The vertical velocity maps from 2015 to 2019 with Sentinel-1 data are shown in Figure 2c. All results were calibrated to a stable reference point (the purple star in Figure 1b and Figure 2c), which is the WUHN International GNSS Service (IGS) station located at Wuhan University. The time series of the vertical motion at the reference point during 2007–2019 obtained from Nevada Geodetic Laboratory is shown in Figure 2d, indicating the vertical velocity vector of the WHUN station had not changed significantly during the monitoring period of this study (http://geodesy.unr.edu/NGLStationPages/stations/WUHN.sta).
During the whole monitoring period, the land subsidence zones are mainly distributed in major urban areas of Wuhan, and along the Yangtze River. Most of the subsidence zones are located at Jianghan (JH), Qiaokou (QK), Houhu (HH) of JA, Shanhu (SH) of WC, Qingshan (QS), and Baishazhou (BSZ) of HS (marked by purple ellipses in Figure 2c). The subsidence of Hankou (including JH, HH, and QK) is more serious than that of Wuchang (including SH, QS, BSZ). The subsidence areas in Hankou are larger than Wuchang both in terms of maximum vertical velocity (−54 mm/a in Hankou and −49 mm/a in Wuchang) and in the extent of surface area coverage. It can be seen that the spatial distribution of subsidence center changed significantly after 2010. The areas of subsidence expanded during 2015–2019, especially in Wuchang. JA has the largest subsidence, and it occurred at HH, with a maximum vertical velocity of about −46 mm/a during 2015–2019.

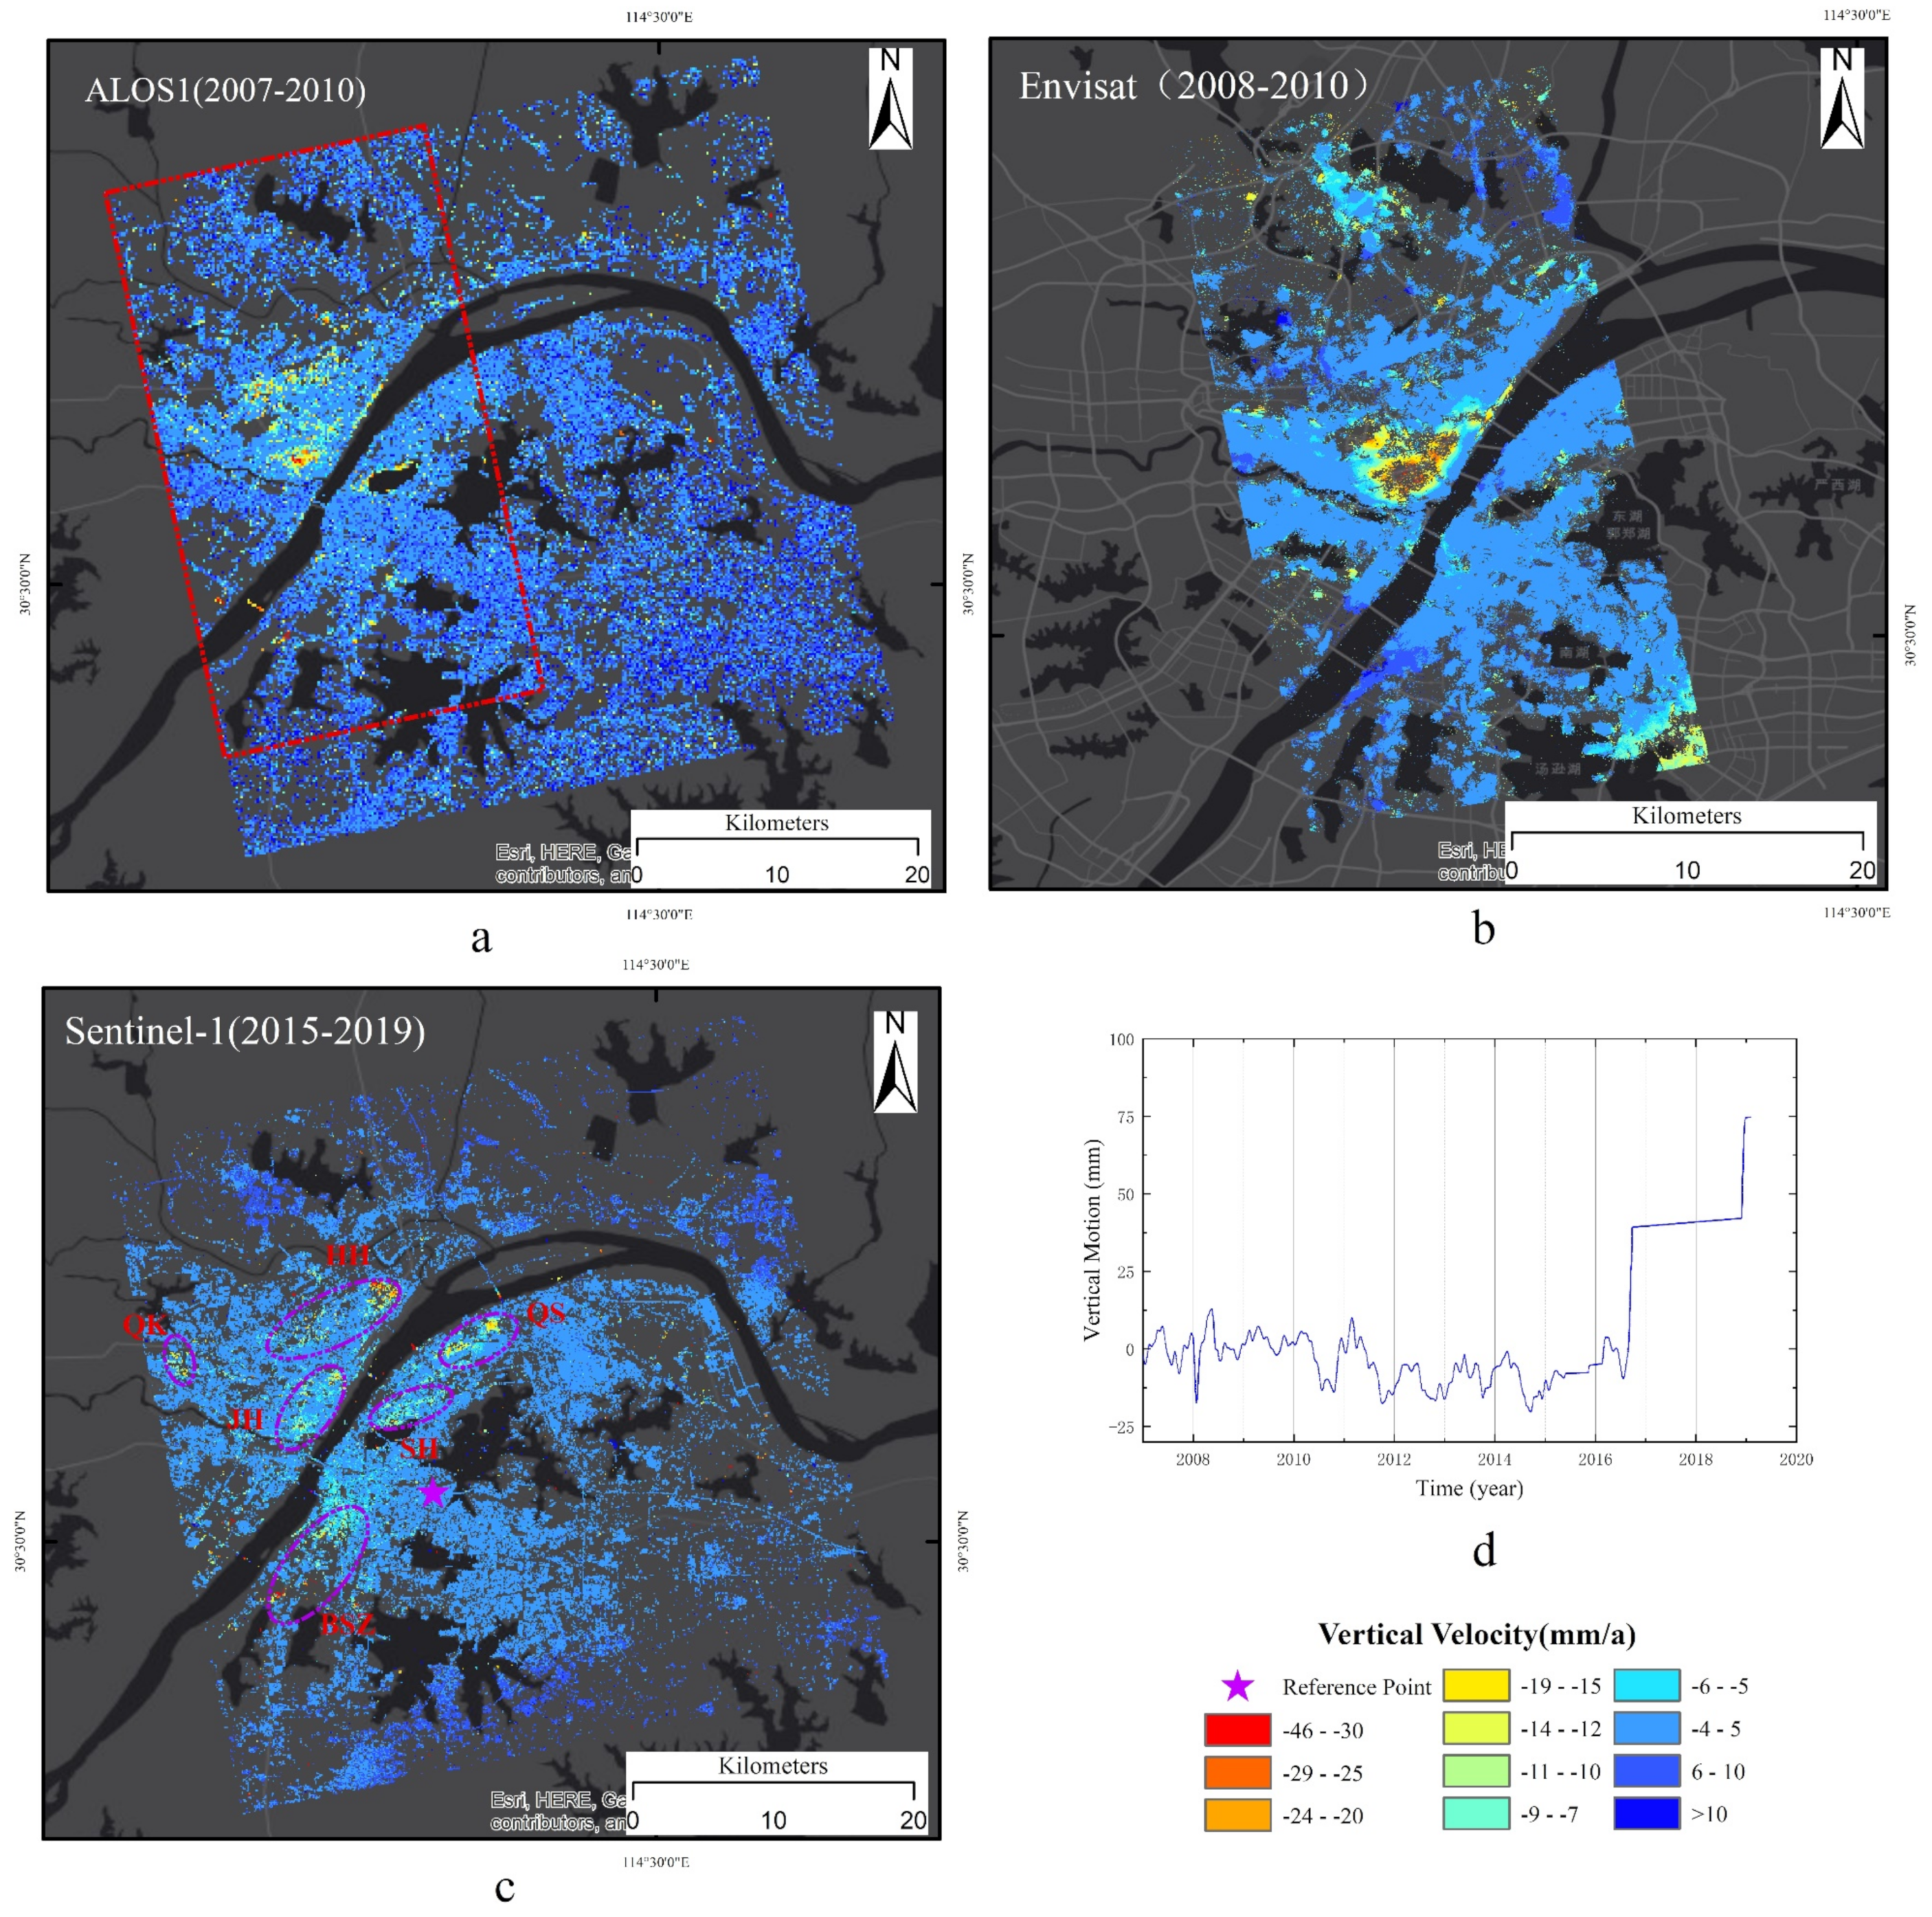
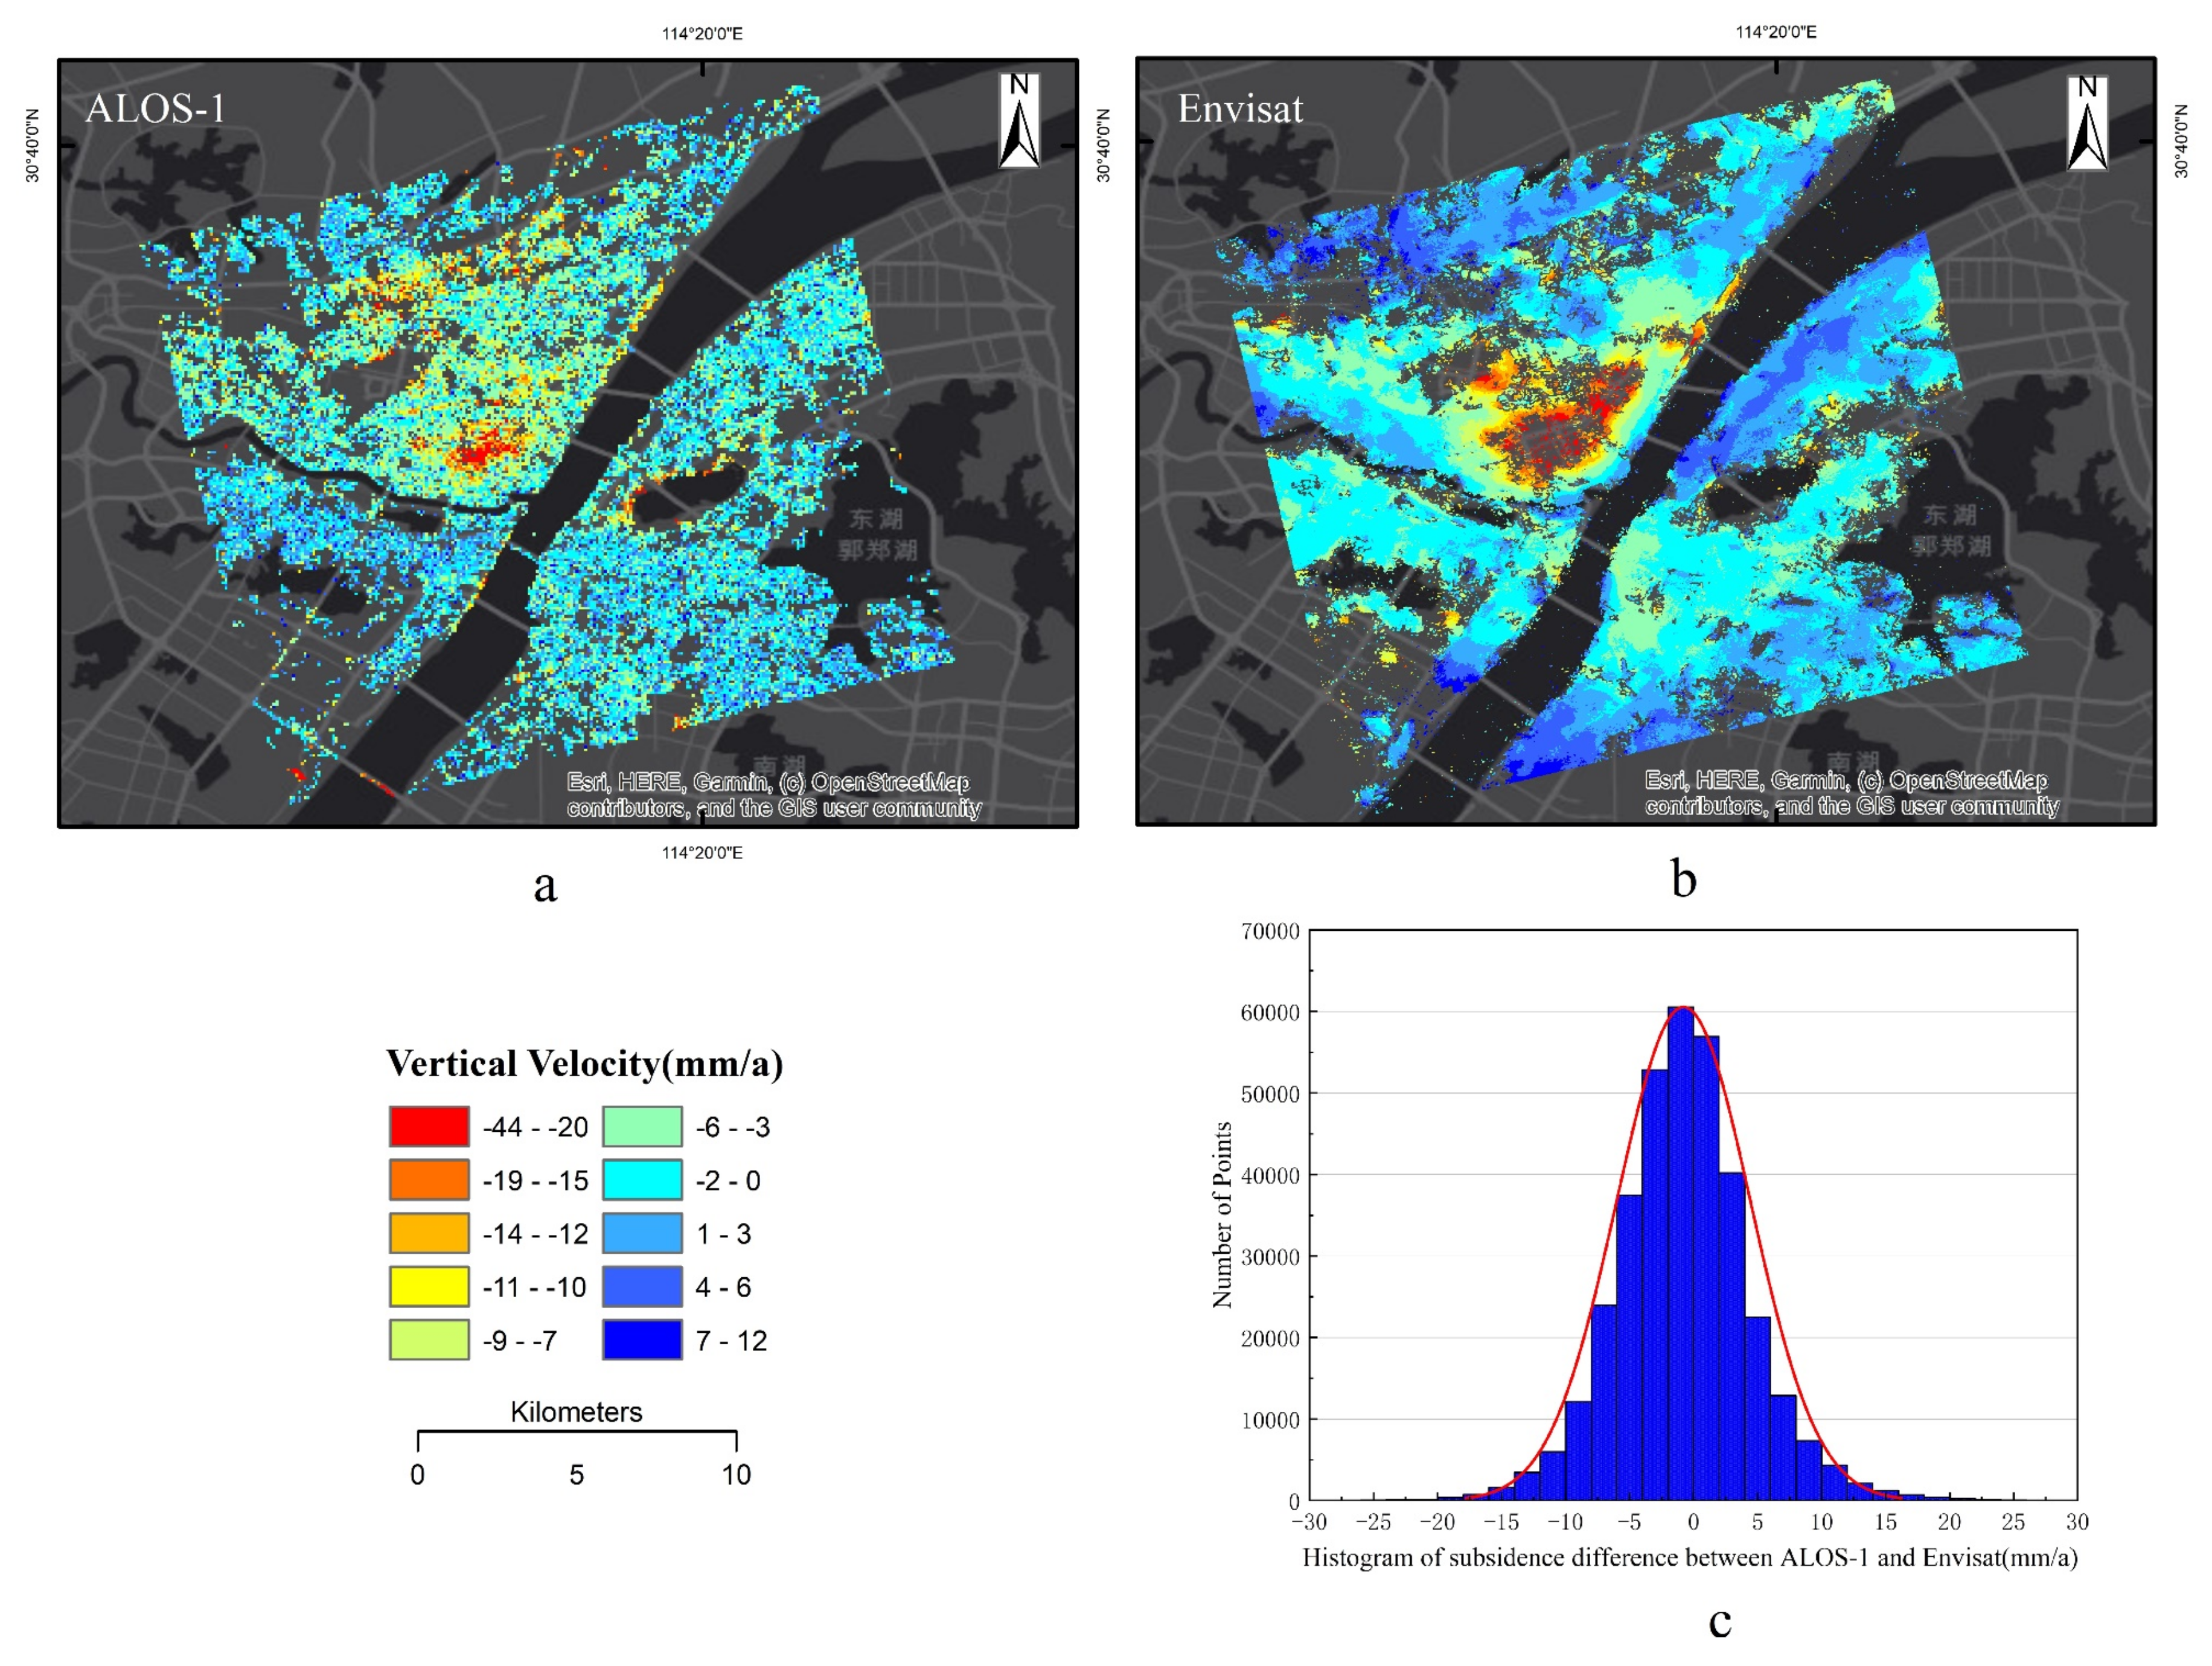
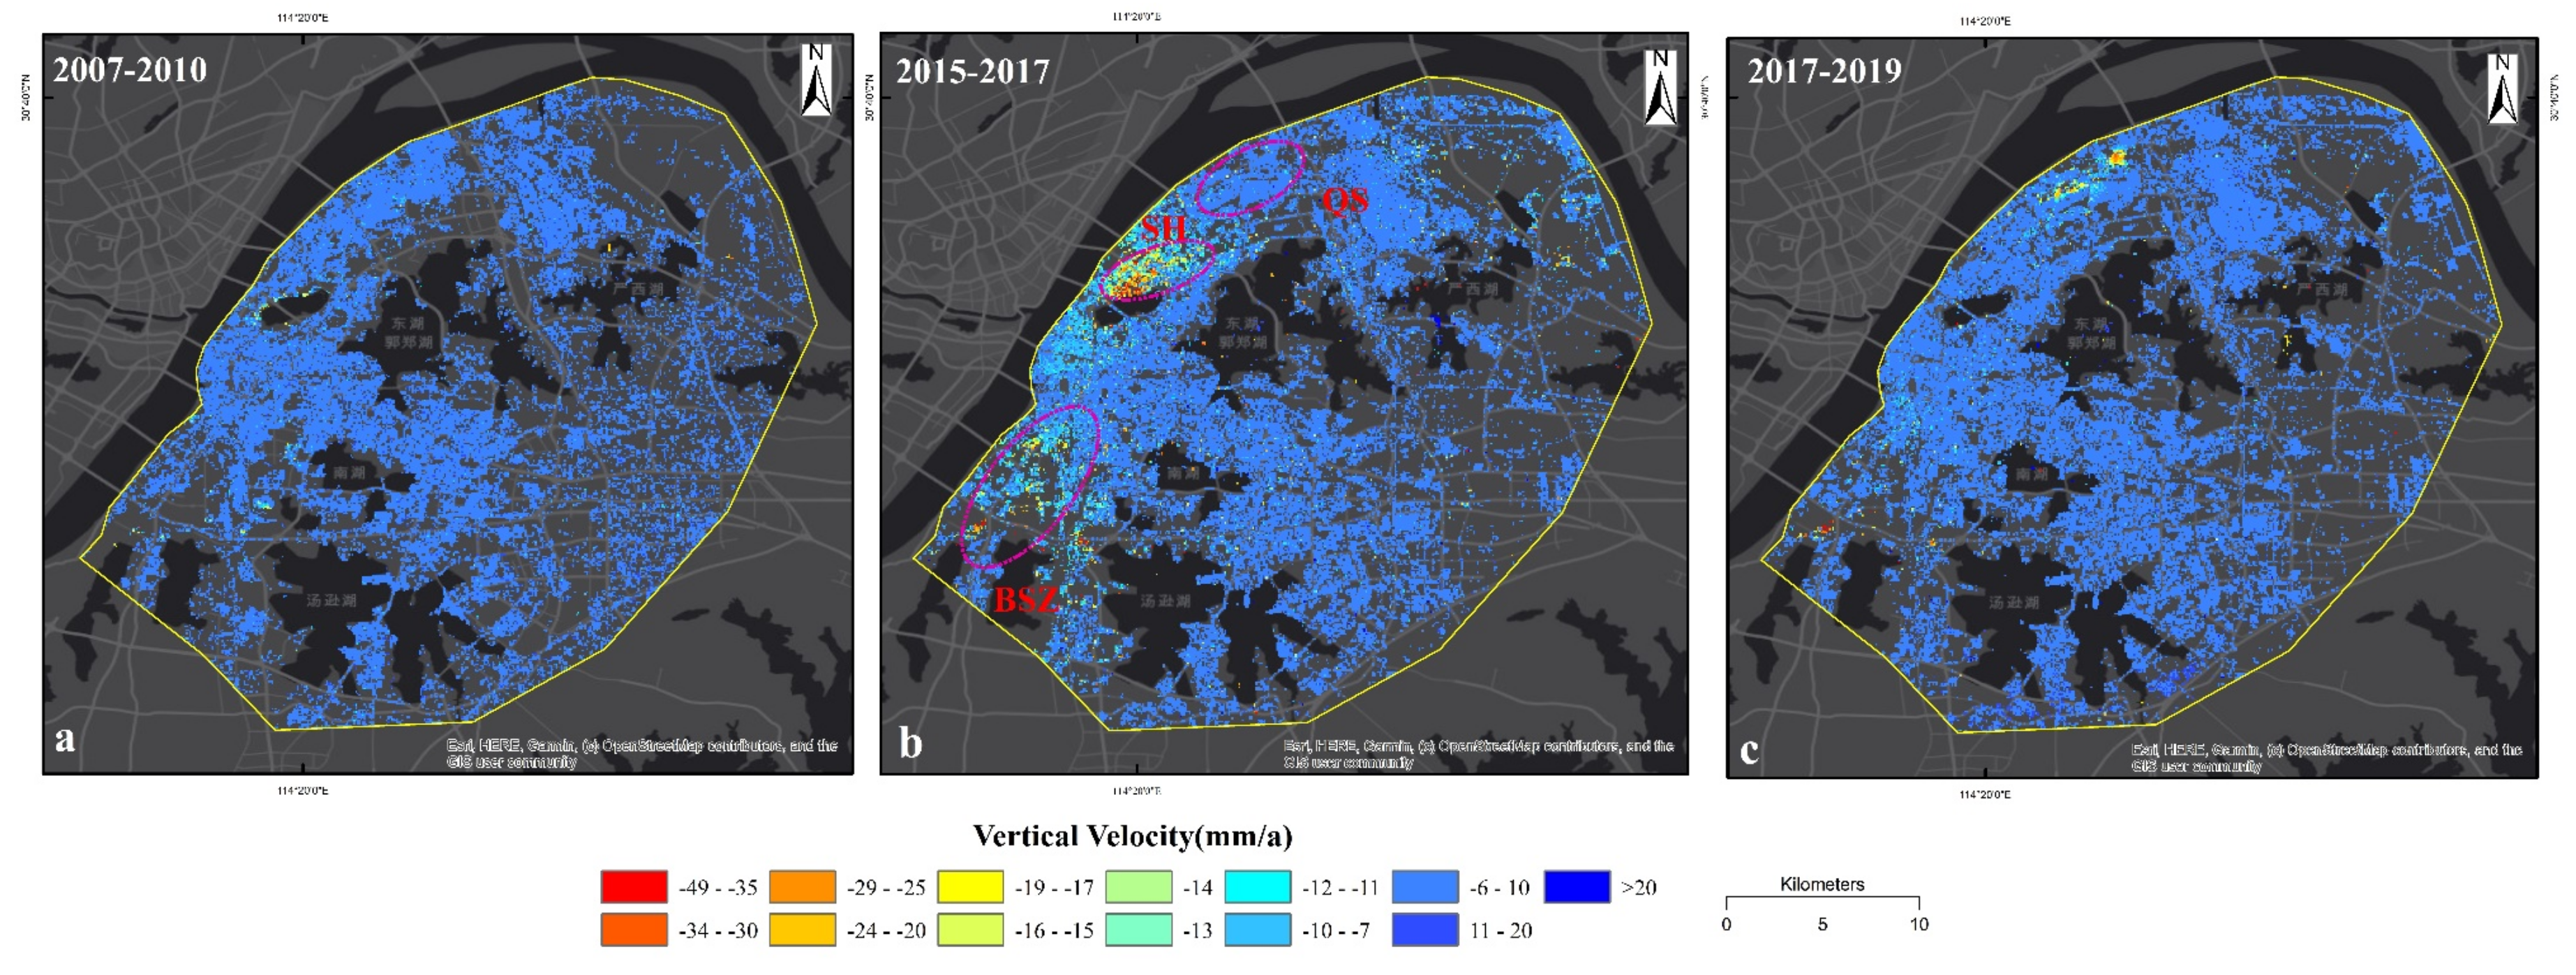
3.1.1. Land Subsidence Velocity with ALOS-1 and Envisat SAR Datasets from 2007 to 2010

The main subsidence zones were located in the central urban area of Hankou during the time span from 2007 to 2010, especially in JH and HH (Figure 2a,b). The subsidence areas in Wuchang are mainly distributed in SH, QS, BSZ. The maximum vertical velocity reaches up to −44 mm/a from 2007 to 2010 based on ALOS-1. We can compare our results with earlier research conducted by Bai et al. [32], who obtained the annual vertical velocity from −67 mm/a to 17 mm/a based on TerraSAR-X dataset (October 2009 to August 2010) with SBAS-InSAR method. Consistent spatial patterns of subsidence revealed by observations from C-, L-, and X-band data [32], but the subsidence rate achieved by our L-band and C-band is lower than that from Bai et al [32]. Discrepancies in subsidence rate are likely due to several factors. First, subsidence might occur over a short time and the velocity of long-term monitoring would be lower. Second, the spatial resolution of ALOS-1 and Envisat is lower than TerraSAR-X. In addition, ALOS-1 and Envisat have a longer wavelength (23 cm and 5.6 cm), hence, they are less sensitive to the small deformation than TerraSAR-X [35]. Third, the vertical velocity derived from Envisat is not as accurate, because of the limited images.

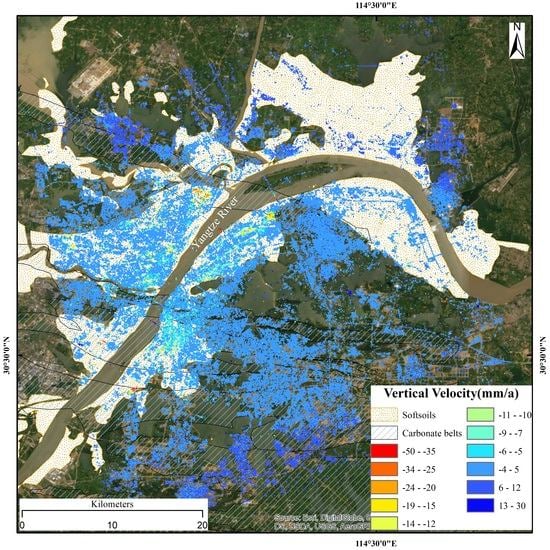
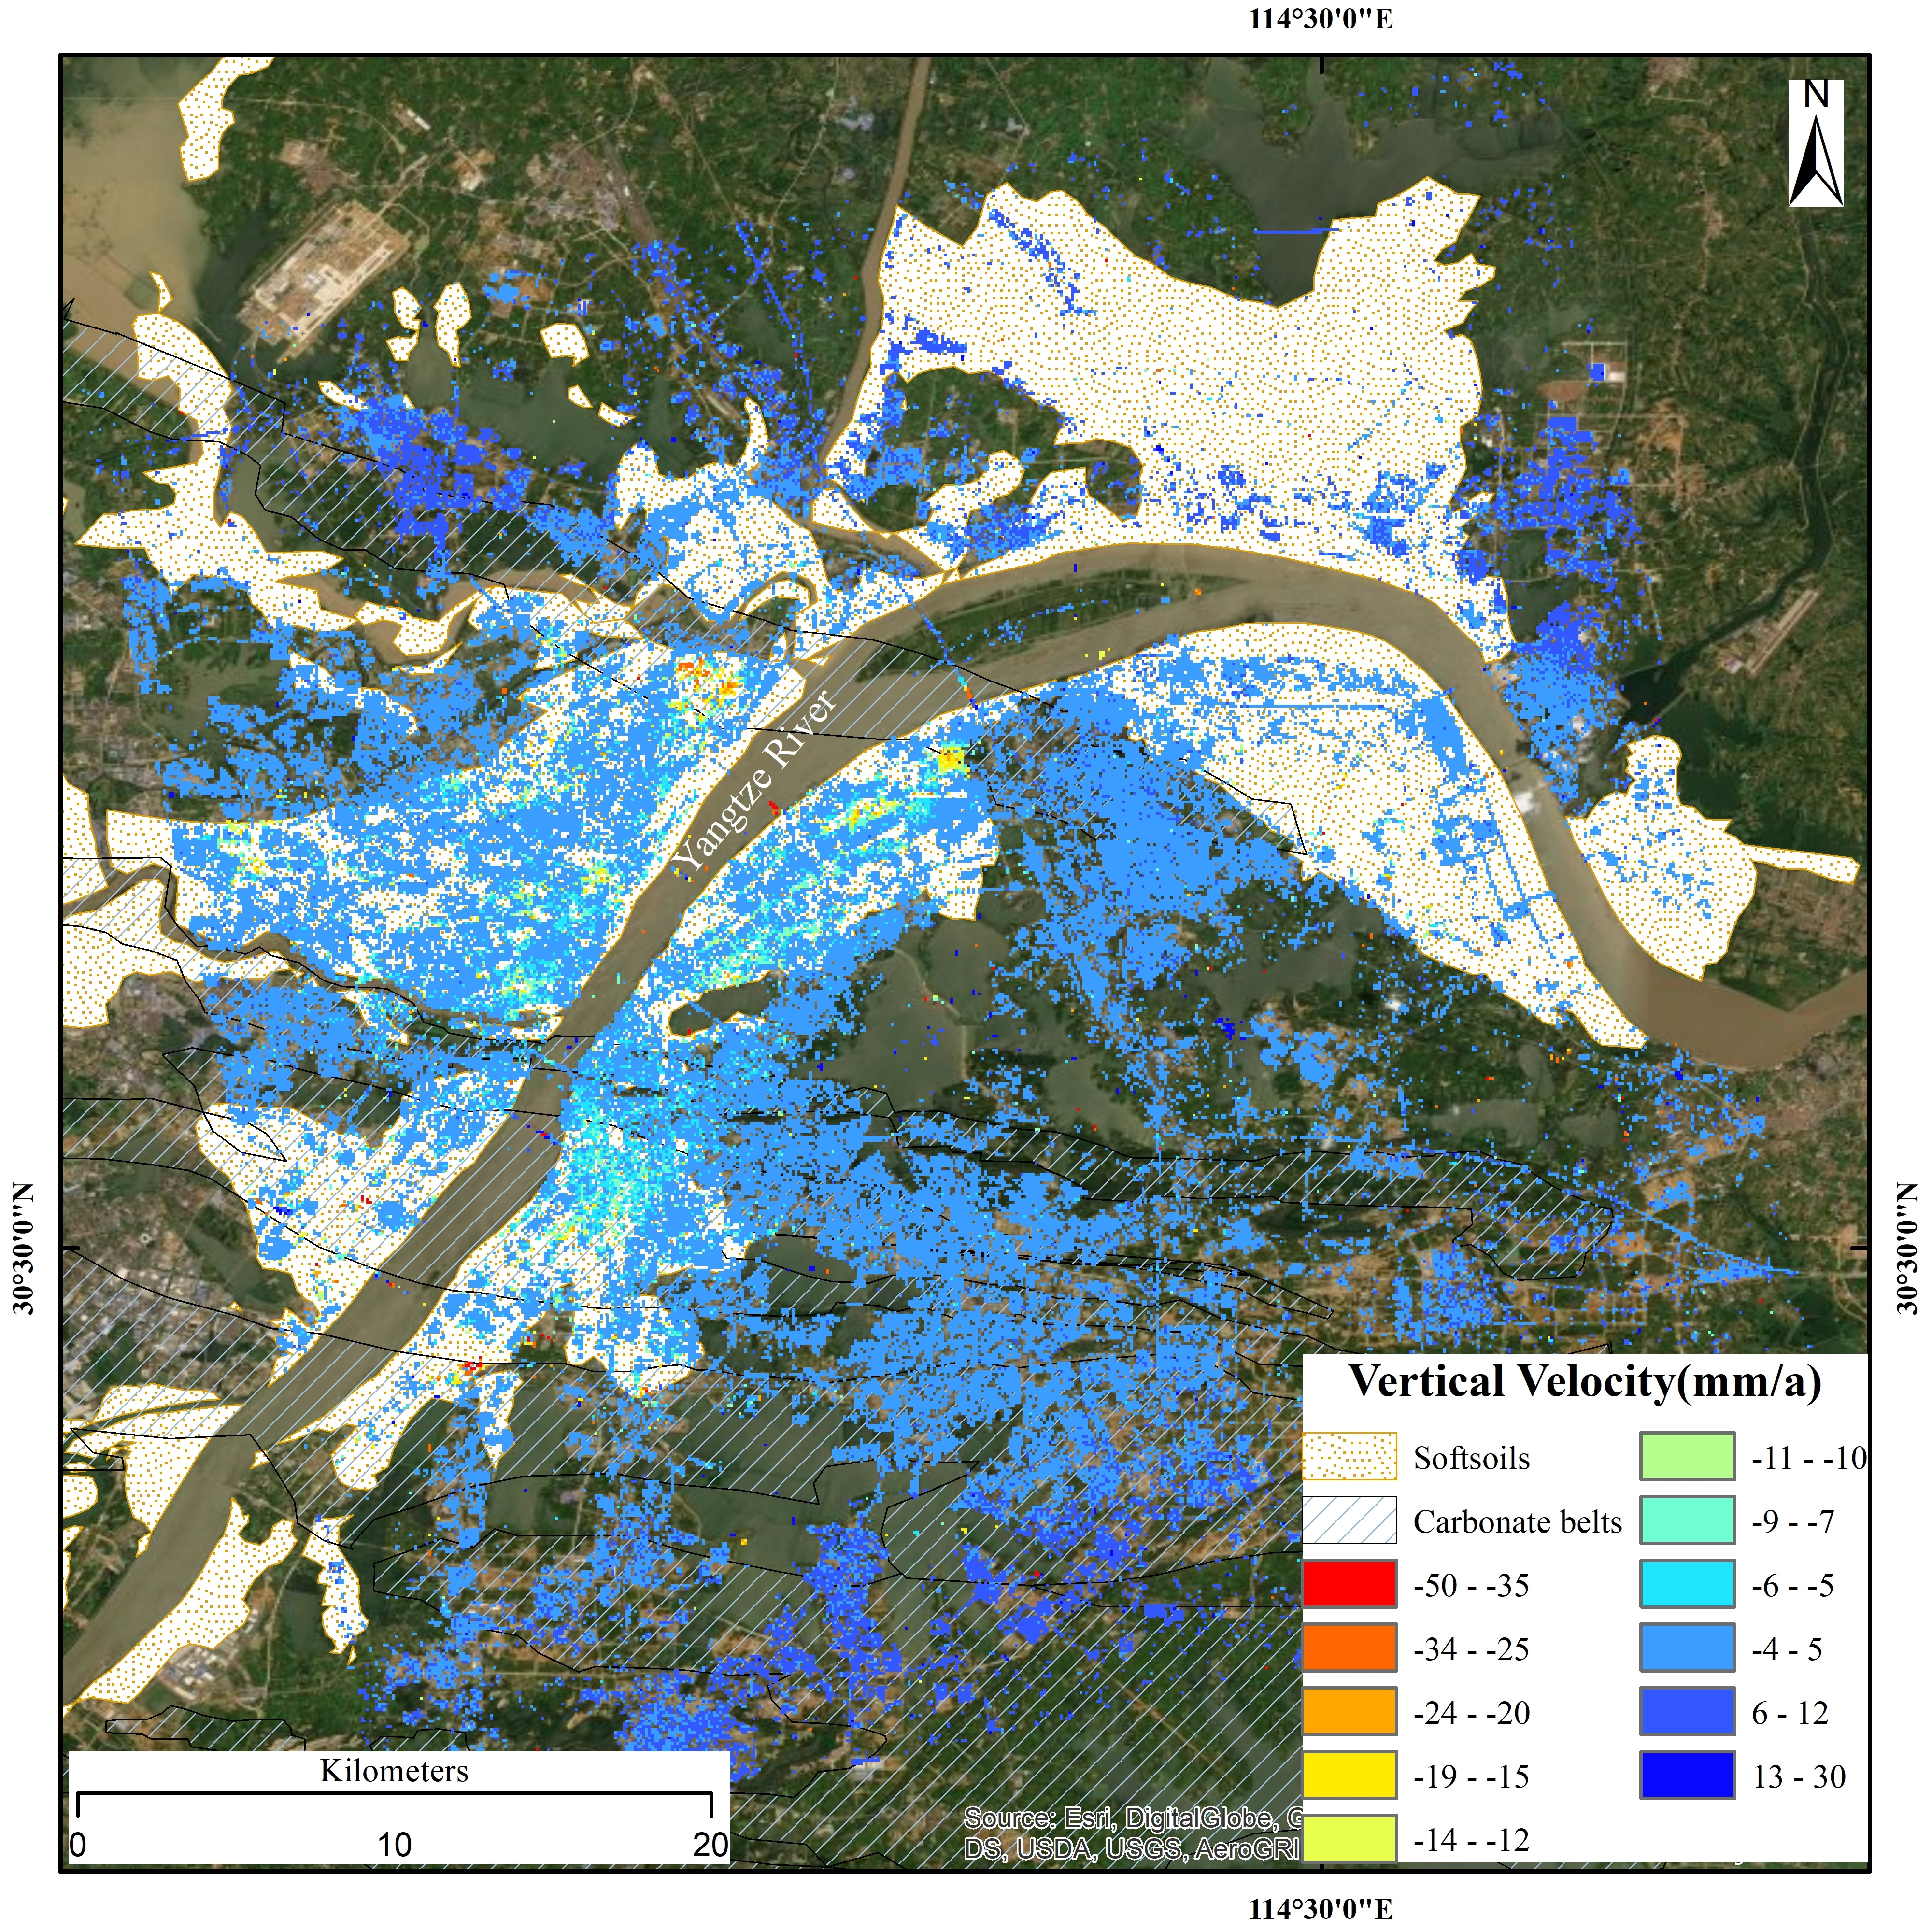
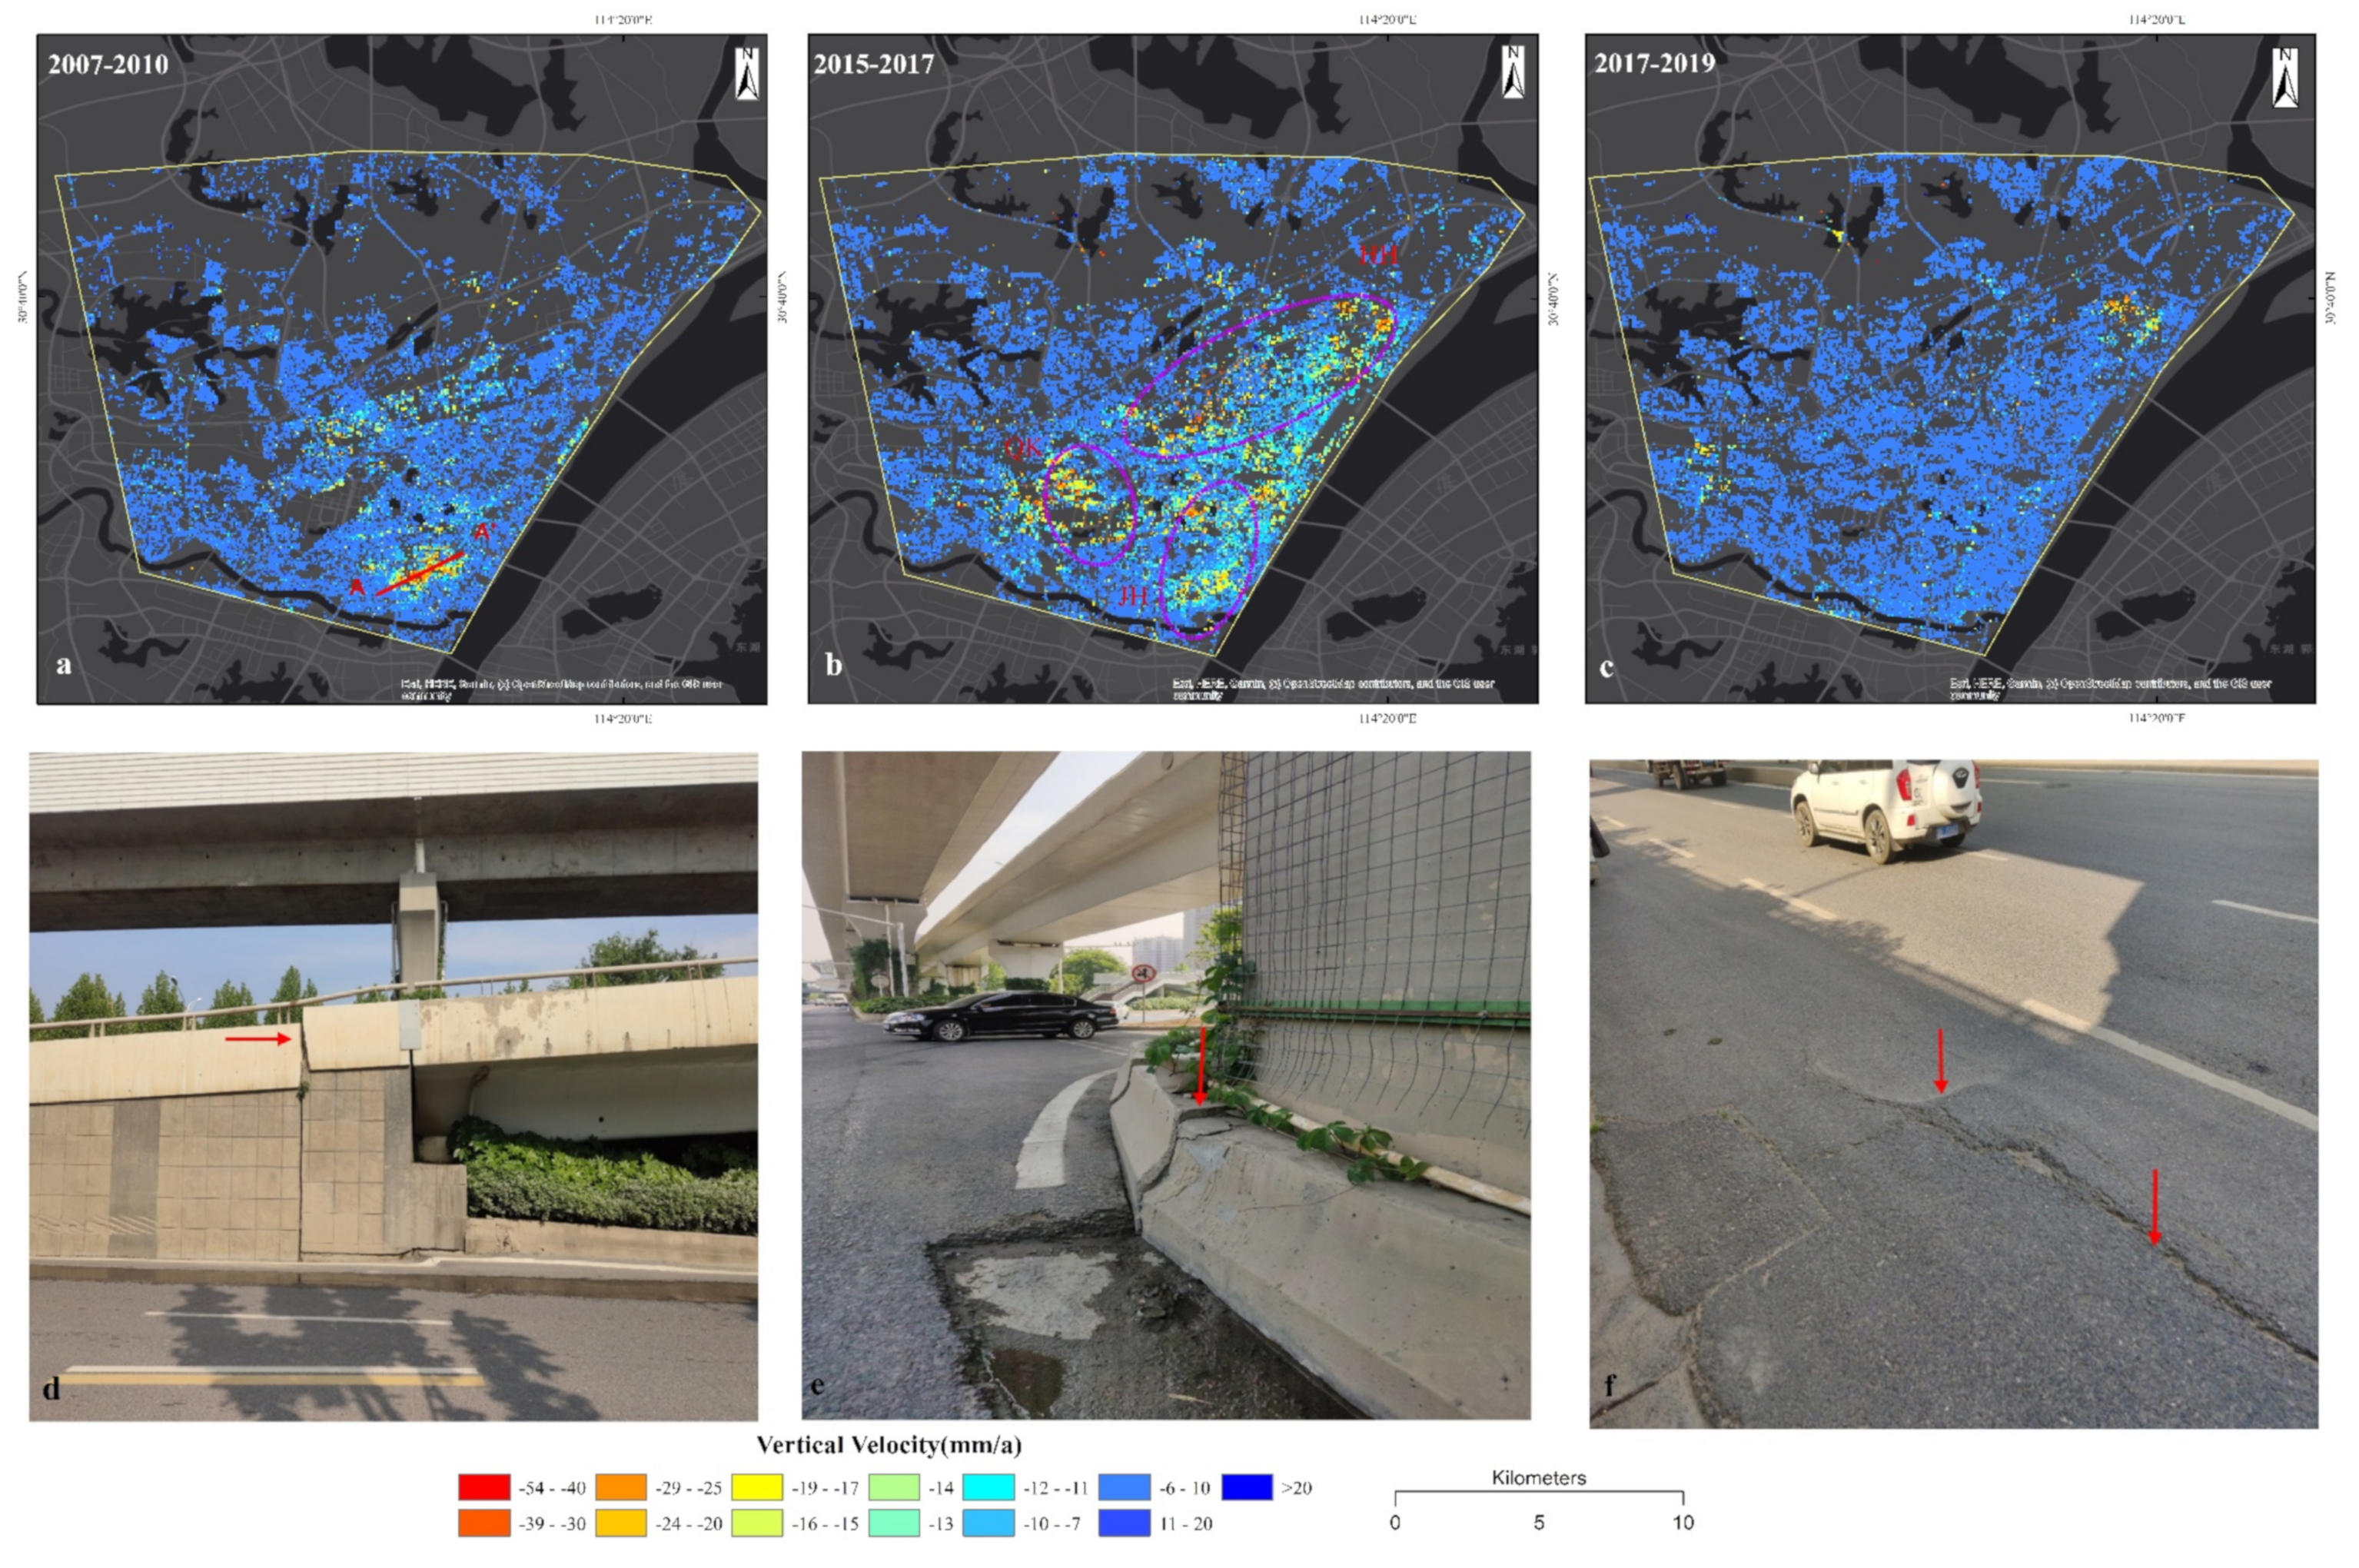
3.1.2. Land Subsidence Velocity with Sentinel-1 Dataset from 2015 to 2019

Figure 2c shows the annual vertical velocity from April 2015 to April 2019 based on Sentinel-1 measurements over the Wuhan area. It can be seen that land subsidence is widely found in most areas of urban Wuhan, and the area of intense subsidence expanded after 2010 (comparing Figure 2a,c). While the spatial distribution of subsidence area is significantly different from those during 2007–2010, the magnitude of vertical velocity is similar with the results derived from ALOS-1 and Envisat datasets. The most severe subsidence zones are distributed in Hankou. HH, JH, QK, and QS are the main subsidence zones during this period. Houhu (HH) of JA had become the zone of the largest subsidence, where vertical velocity reaches up to −46 mm/a. The extents of the BSZ and QS subsidence zones are smaller than the other subsidence zones, but they increased gradually since 2010, with the maximum vertical velocity around −44 mm/a at BSZ and −28 mm/a at QS, consistent with the results by Zhang et al. [34], who obtained the annual vertical velocity from −52 mm/a to 28 mm/a based on Radarsat-2 dataset (October 2015 to June 2018) using the SBAS-InSAR method. The vertical velocity of other land subsidence zones (around −10 mm/a) is much lower than those at the six main subsidence zones.

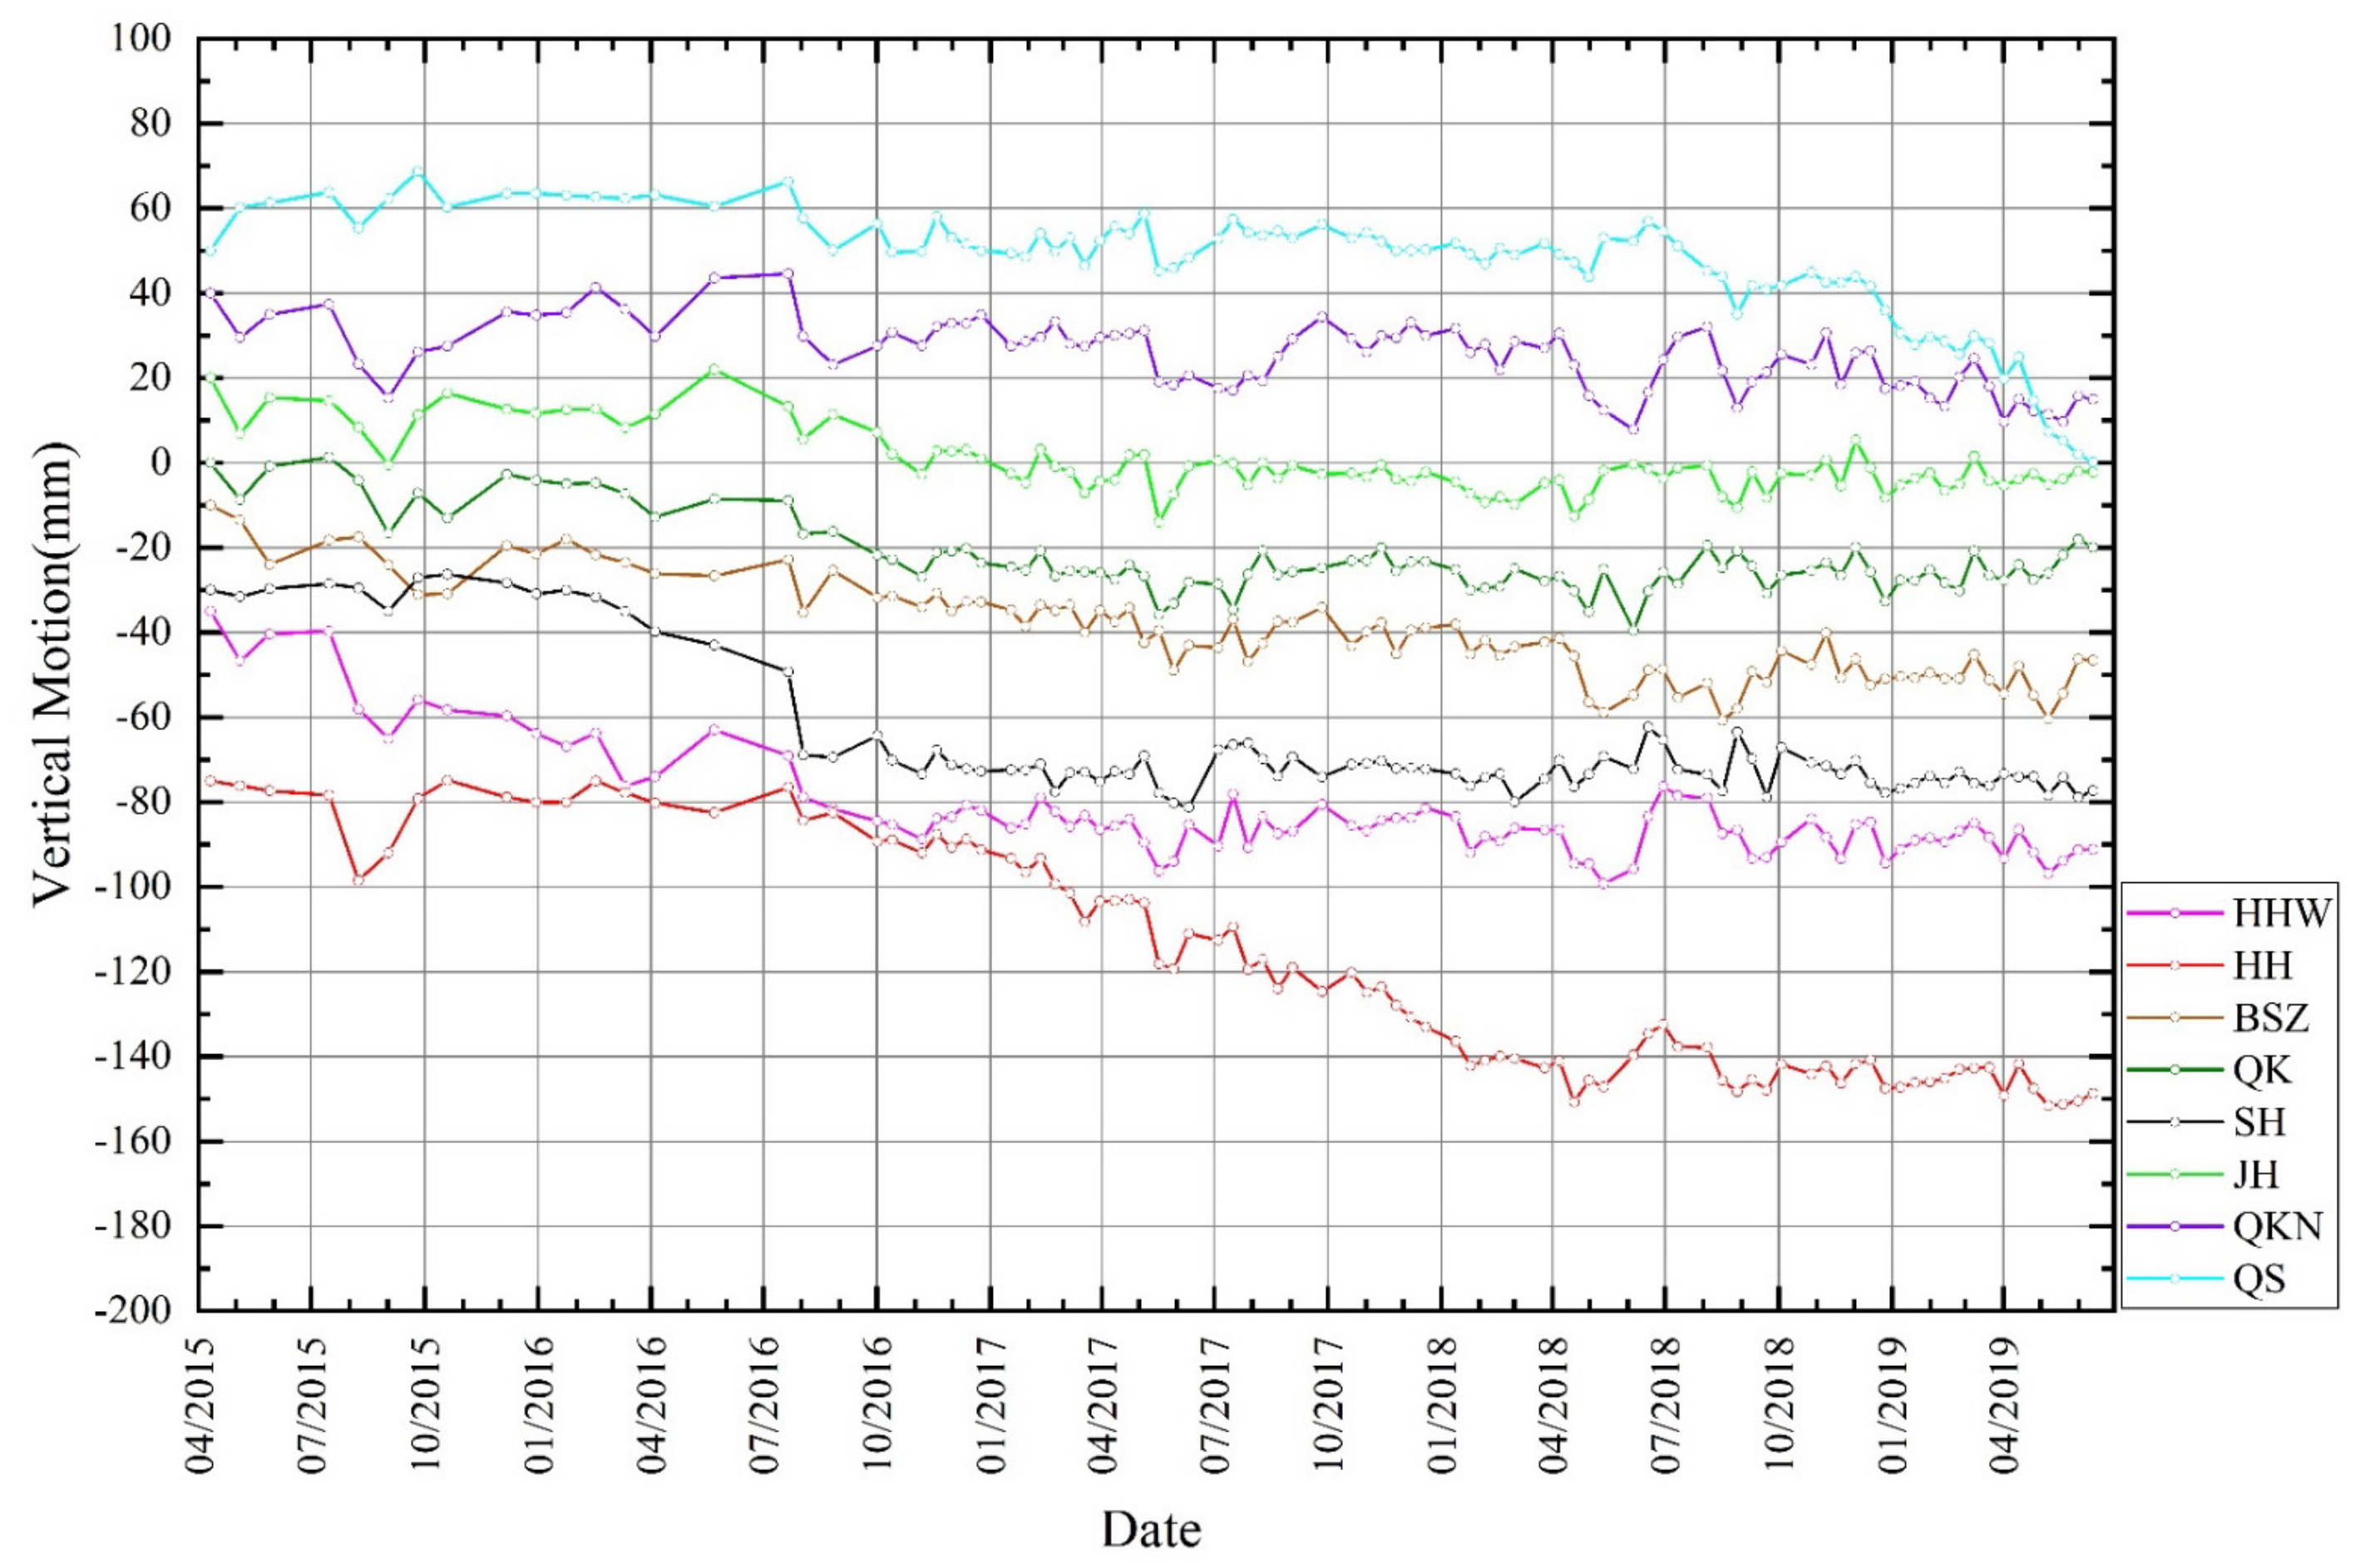
3.1.3. Time Series of Land Subsidence

The time-series deformations of eight typical SDFPs points (marked with green squares in Figure 1a) distributed across six main subsidence zones (purple ellipses in Figure 2c) (HHW, HH, BSZ, QK, SH, JH, QKN, and QS) were selected to quantitatively analyze Wuhan subsidence characteristics, because of the rich datasets available from 2015 to 2019. The results from these eight points, HHW, HH, BSZ, QK, SH, JH, QKN, and QS, are shown in Figure 3. There is no obvious relationship between the characteristics of the subsidence in temporal and spatial distribution for the eight SDFPs points. JH, QK, HHW, and SH show obvious time-varying deformation from 2015 to 2017 and the ground deformation remains relatively steady after 2017. While the ground deformation is relatively stable over QS and QKN from 2015 to 2018, it does exhibit time-varying subsidence since June 2018. HH and BSZ exhibit significant time-varying deformation from 2016 to 2019.

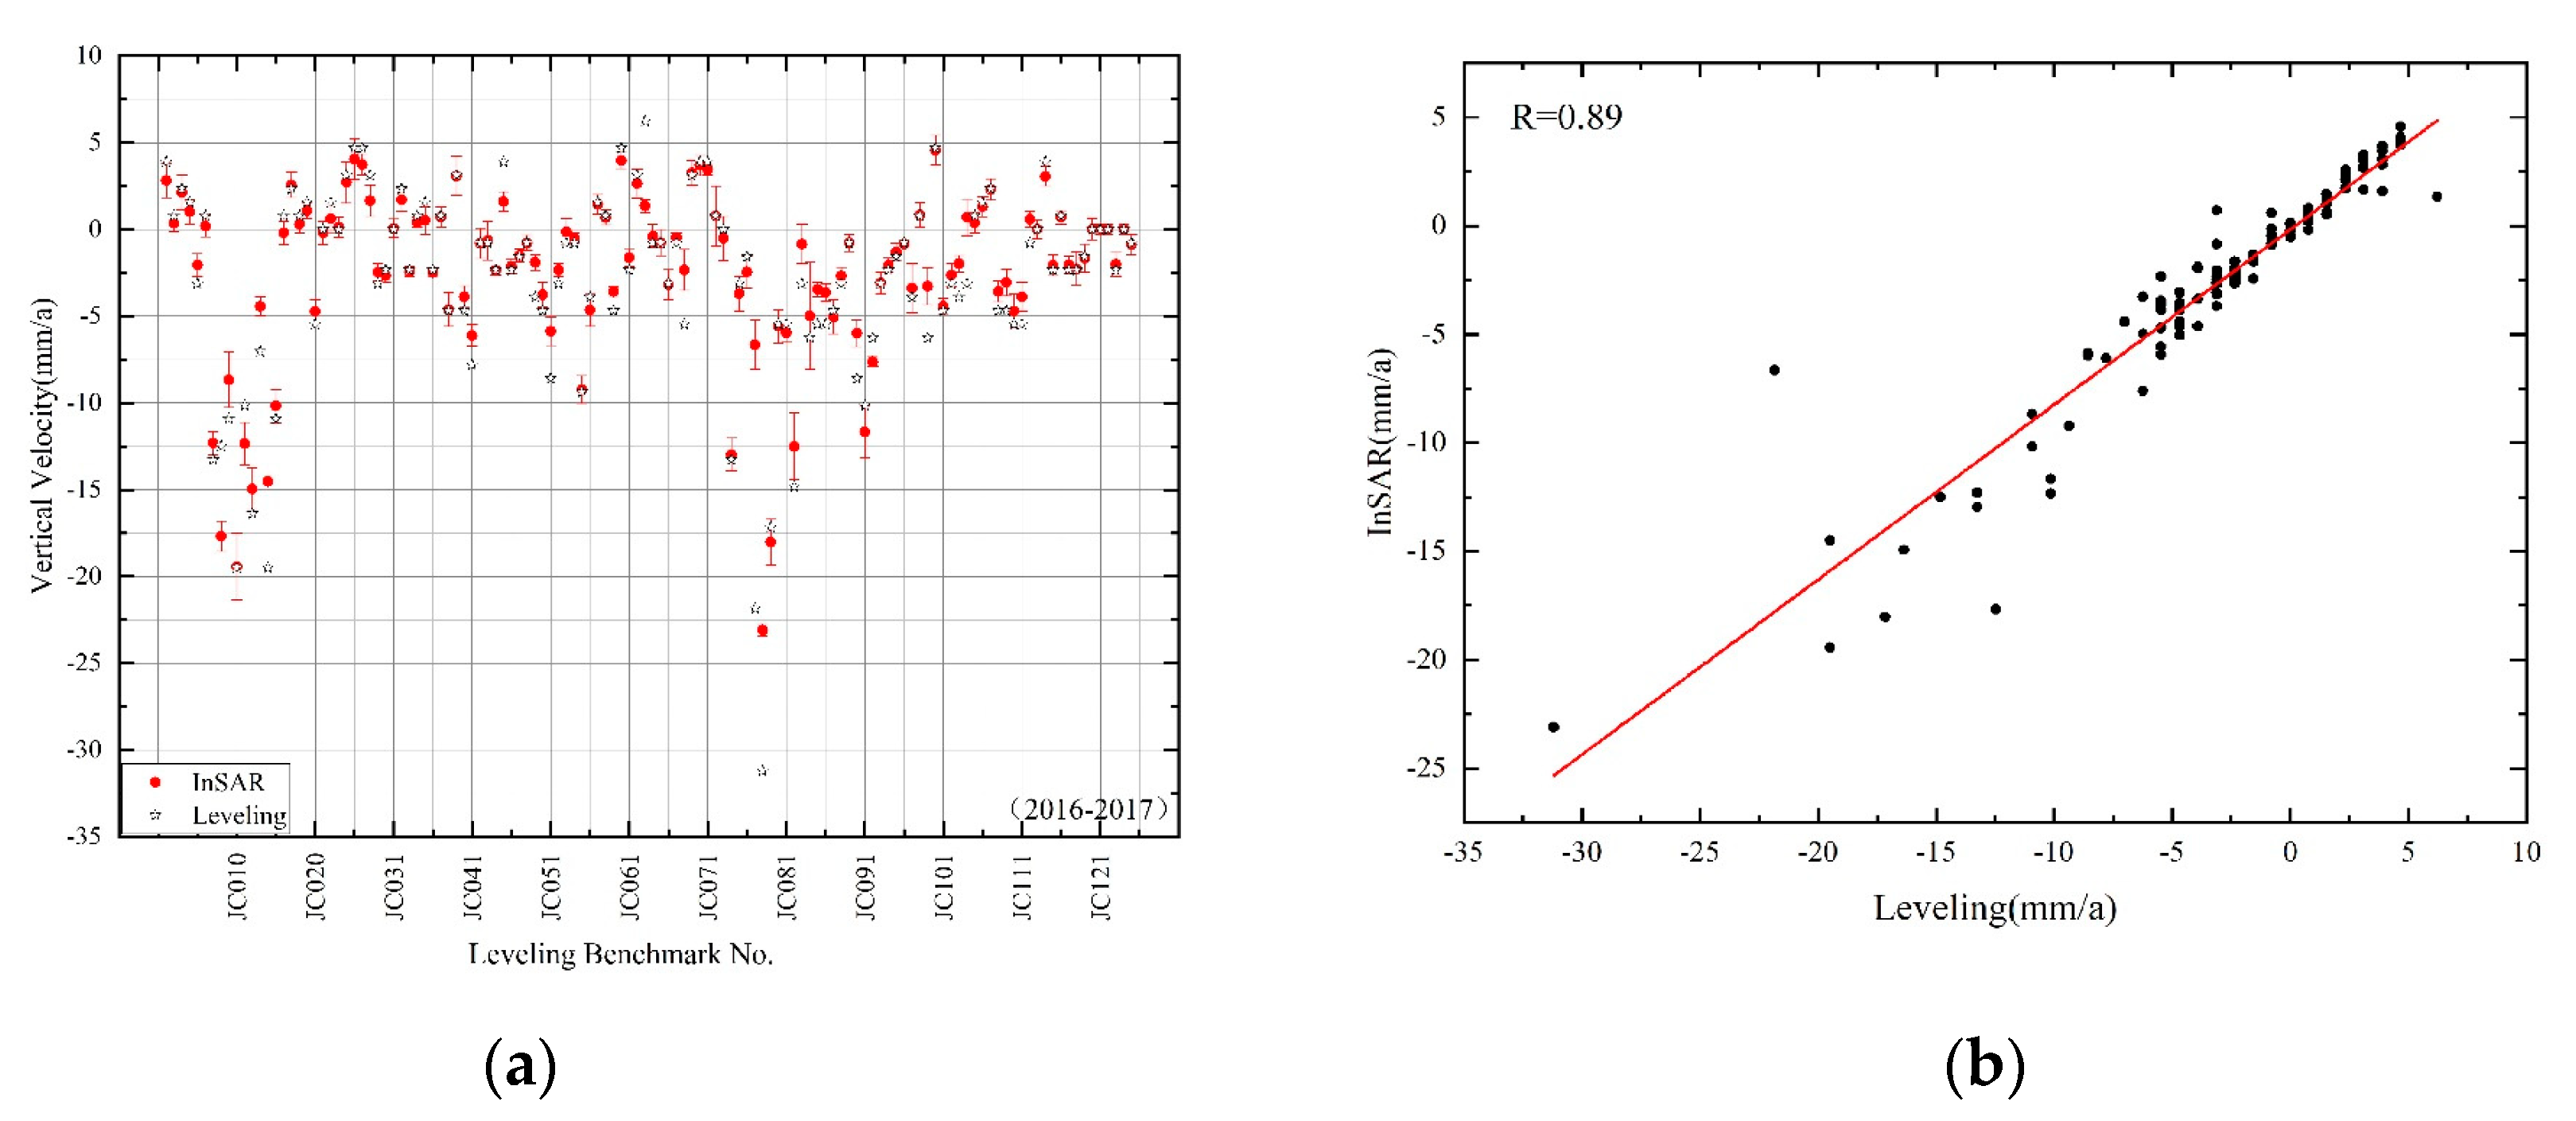
3.2. InSAR Accuracy Assessment

Since Envisat and ALOS-1 datasets cover the same area from 2008 to 2010, we are able to compare the InSAR results derived from the two datasets in the common part of deformation maps for this period. Figure 4a,b shows that the deformation areas are generally consistent in terms of vertical velocity between the ALOS-1 and Envisat datasets, ranging from −44 mm/a to 12 mm/a. The largest subsidence zone is the JH zone in the Hankou area, which is detected successfully by both datasets. Figure 4c is the histogram of the subsidence difference between ALOS-1 and Envisat datasets; the standard deviation between the two datasets is 5.2 mm/a.
Next, we derived the vertical velocity of InSAR results in Wuhan from June 2016 to June 2017, and calibrated the InSAR-derived vertical velocity and leveling observations into the WGS84 coordinate system. We were then able to compare the InSAR-derived deformation velocity with the leveling observations.
There are 125 leveling benchmarks used for InSAR results validation in JA from June 2016 to June 2017 (dark brown dots in Figure 1b). Because the leveling benchmarks and the corresponding SDFPs are often not co-located, we selected SDFPs that lie within 100 m of the leveling benchmarks to calculate the average deformation rates during 2016–2017 around the leveling benchmarks. The comparison results indicate high consistency between the two measurements, with a correlation coefficient of 0.89 (Figure 5). However, certain errors between the two measurements are inevitable, and their discrepancies in a few leveling benchmarks are up to 15 mm, which might have been caused by several factors. First, the positions of the SDFP point targets do not exactly coincide with the leveling benchmarks. Second, the results of InSAR represent the average annual rates calculated from multi-temporal interferograms within the monitoring period, and the results of leveling represent the deformation between the two epochs (June 2016, June 2017). For example, the difference between InSAR and the measurement at benchmark JC77 is about 15 mm, and JC77 is closest to the SDFP point HHW (in Figure 3). As seen in Figure 3, the HHW shows the obvious seasonal variations of ground deformation from June 2016 to June 2017. Hence, there can be a large difference between InSAR and leveling results over the areas with a strong seasonality in ground deformation variation. Thus, the InSAR results will be different from the leveling results over areas that experienced time-varying displacements.

4. Analysis

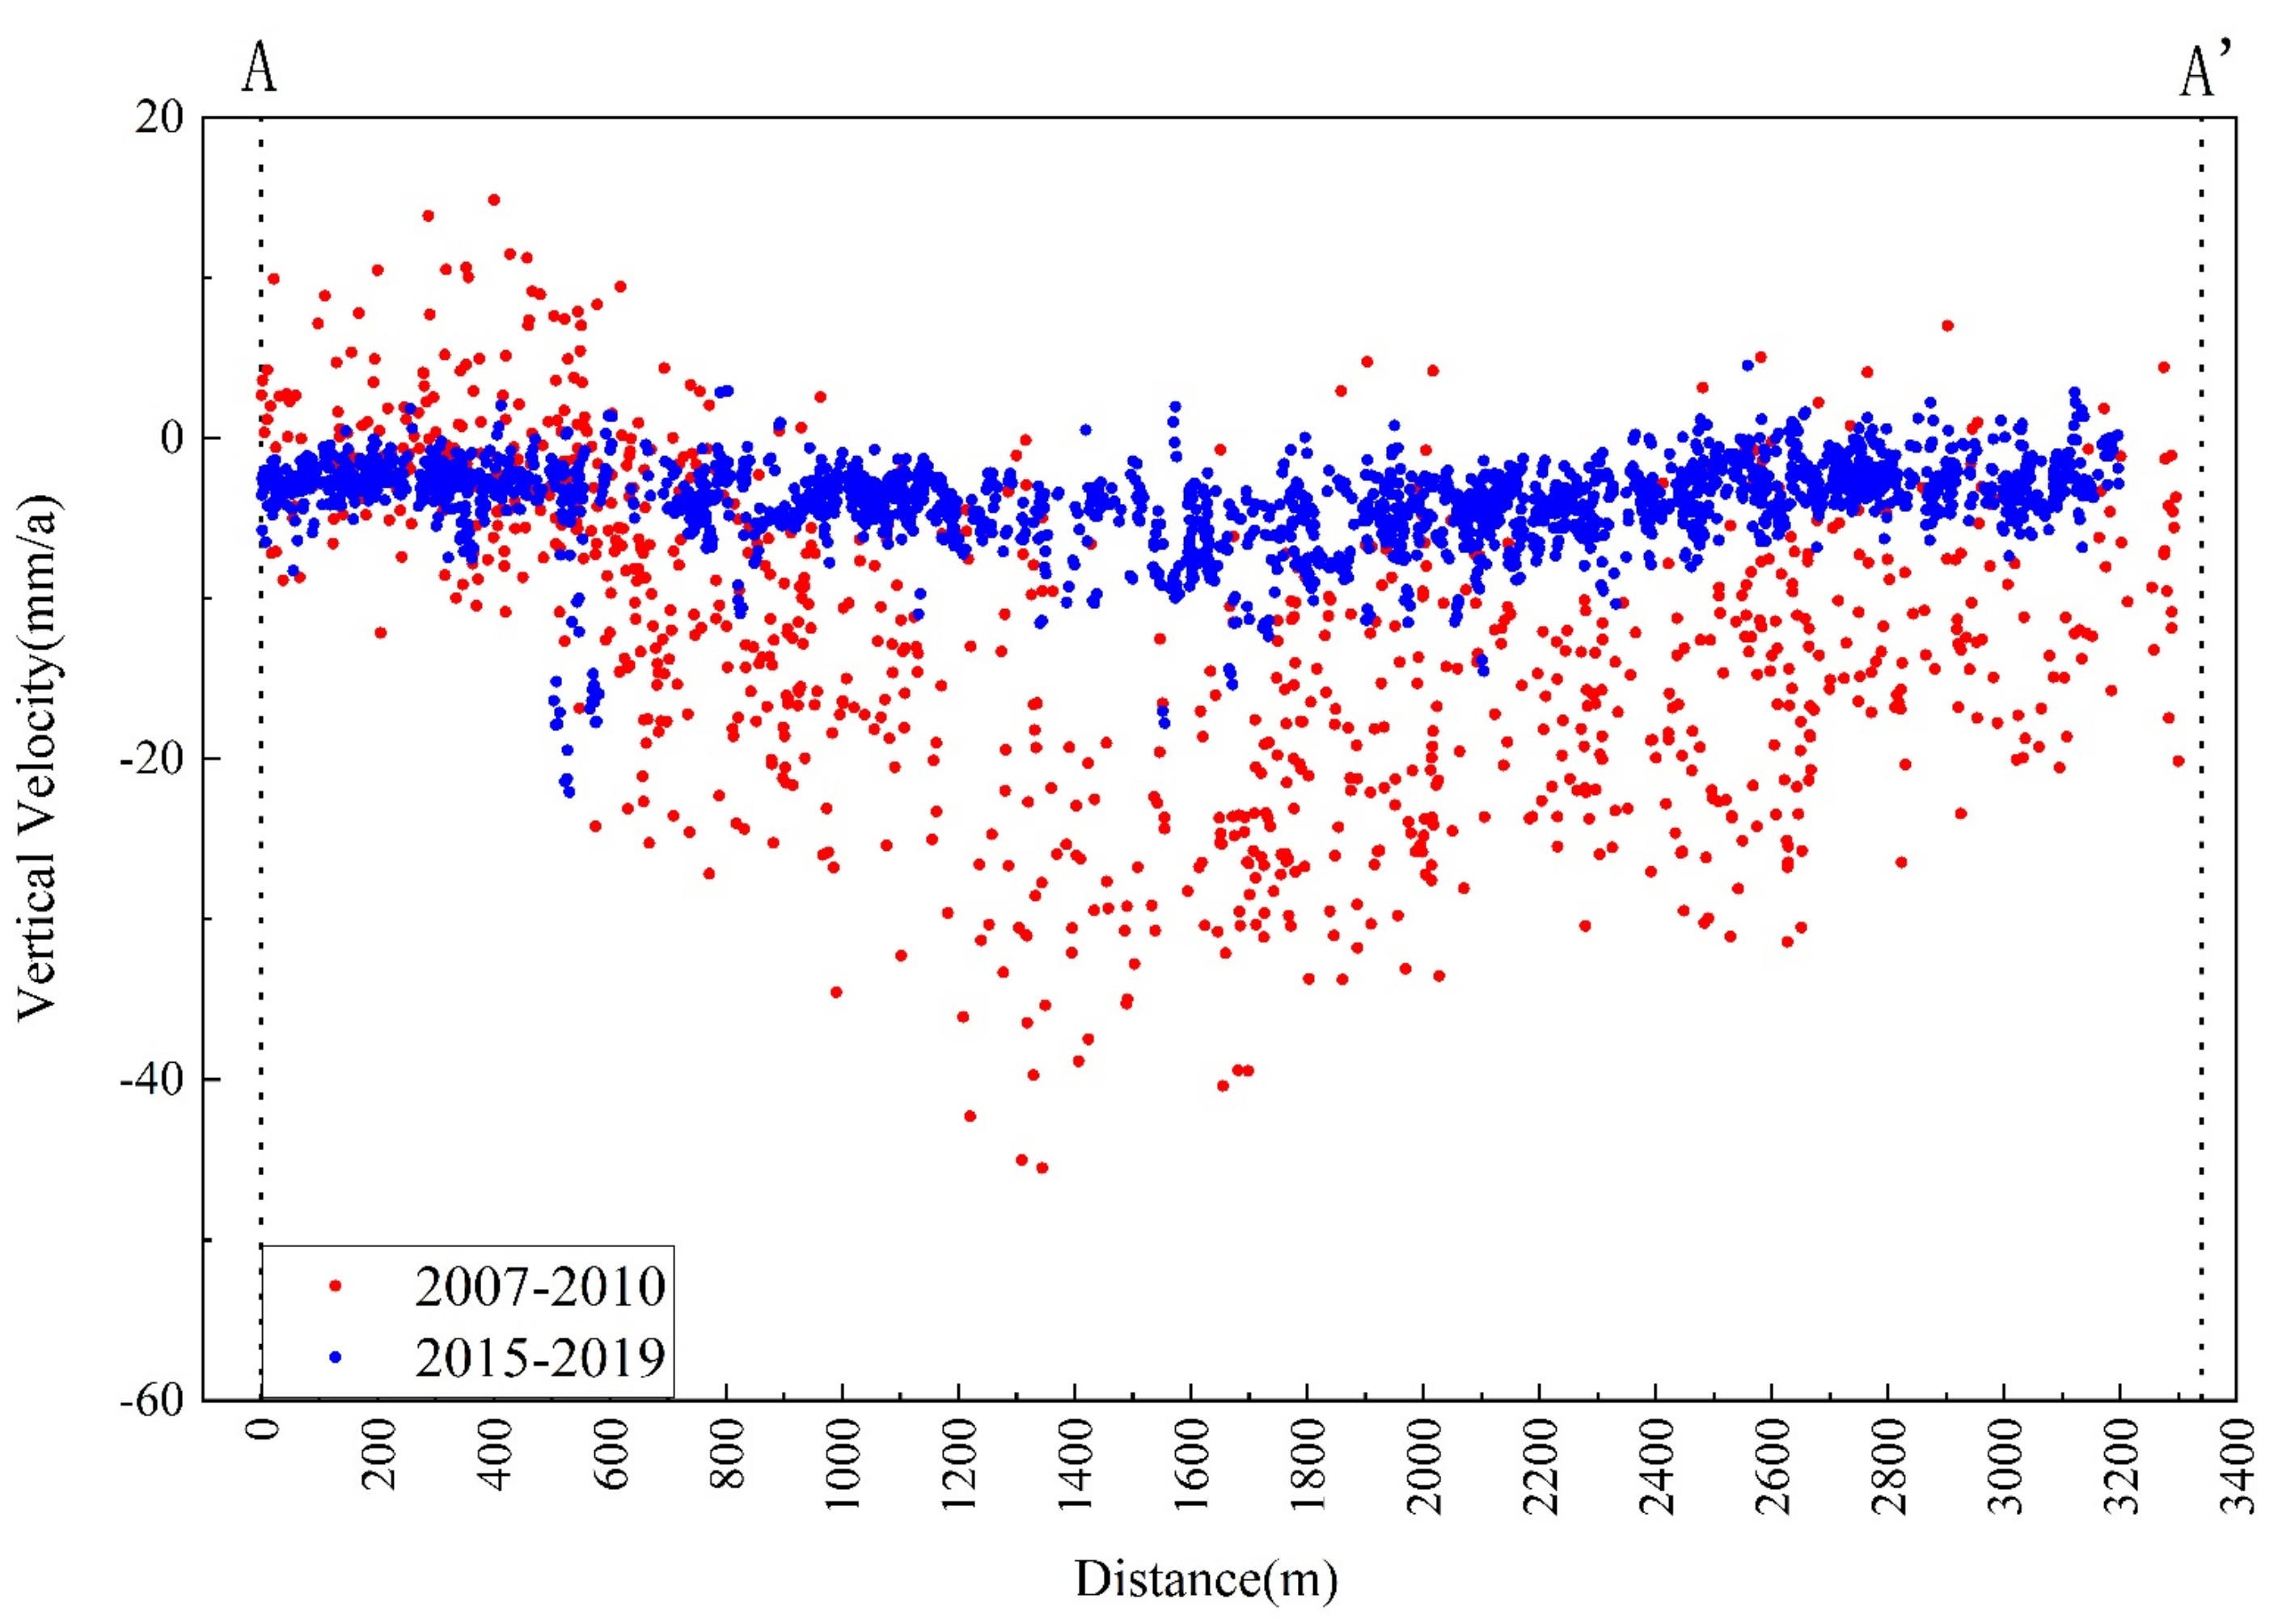
4.1. Temporal and Spatial Variations of Land Subsidence in Wuhan

Although the land subsidence patterns are heterogeneous in Wuhan, most of the deformation areas are distributed along the Yangtze River. By comparing the deformation velocity over two different time spans, we have found that the spatial distribution of subsidence cones changed significantly during the monitoring period. Because the main subsidence cones are located at Hankou and Wuchang, the spatiotemporal evolutions of Hankou and Wuchang were further analyzed.

4.1.1. The Land Subsidence in Hankou

From 2007 to 2010, there were only two obvious subsidence areas in Hankou (yellow/orange areas of Figure 6a), mainly located in the JH, but some in HH as well. These areas are the commercial zones in Hankou. The vertical velocity ranged from −40 mm/a to 12 mm/a, with the maximum vertical velocity about −44 mm/a. After 2010, the land subsidence center moved to HH and QK, with the maximum vertical velocity about −54 mm/a located west of HH (line HHW on Figure 3). A notable change is that QK had become the new subsidence area, with a maximum vertical velocity of −52 mm/a. The extents and magnitudes of previously detected subsidence in JH and HH increased significantly during 2015–2017: the subsidence areas covered more than 50 km2 in Hankou until 2017. Of note, and all of the subsidence areas decreased since May 2017 (Figure 6b,c). The vertical subsidence velocities in other parts of Hankou were relatively slower than those at HH and QK during 2015–2019. During the period from May 2017 to June 2019 (Figure 6c), the area east of HH had become the largest subsidence zone, with a vertical velocity of more than −40 mm/a. The land subsidence has damaged highways, bridges, and utility infrastructure in Hankou. Field investigations identified cracks along the roadside and dislocation on the ramp of an overpass bridge in the eastern subsidence zone near HH (Figure 6d–f). The length of dislocation on the ramp was around 10 cm, which was also reported on the Chutian Metropolis Daily website (https://xw.qq.com/housewh/20190131001860/HWH2019013100186000).
In summary, eastern HH and northern QK areas are still suffering the most serious subsidence because of urban construction. The land subsidence in JH has been serious since 2007 with the vertical velocity reaching −44 mm/a in 2007–2010 and −38 mm/a in 2015–2017; since 2017 it has waned, with the vertical velocity around −18 mm/a in 2017–2019. Figure 7 shows the average annual vertical velocity along the profile AA’ (marked by red line in Figure 6a) during the time span 2007–2010 and 2015–2019 and reveals the temporal evolution of land subsidence in JH over a major commercial zone in Hankou. The subsidence is most likely caused by over-exploitation of groundwater, owing to many large-scale buildings and Metro lines 2 and 6 that were under construction from 2007 to 2016, as well as soil compaction due to building loads (see Discussions).

4.1.2. The Land Subsidence in Wuchang

The subsidence zones are scattered across Wuchang. There are three main subsidence zones (SH, BSZ, QS) in Wuchang. Figure 8 shows land vertical velocity rates derived from ALOS-1 and Sentinel-1 datasets over Wuchang in three different time spans. There were only two small-scale subsidence zones in SH and BSZ during 2007 to 2010. The amount of subsidence coverage and magnitude increased notably from 2007–2010 to 2015–2017 in SH and BSZ. Compared to the measurements in 2007–2010, the two subsidence zones experienced a significant increase in vertical velocity (Figure 8a,b). The vertical velocity and subsidence areas are larger in 2015–2017 than 2017–2019 for both SH and BSZ. The maximum vertical velocity reached about −42 mm/a and −47 mm/a in SH and BSZ, respectively during 2015–2017. However, by 2017–2019, the vertical velocity reduced significantly to −11 mm/a in SH. The coverage subsidence zone of BSZ also narrowed substantially. QS has become the main subsidence zone in Wuchang, where the maximum vertical velocity was about −35 mm/a during 2017–2019 (Figure 8c).

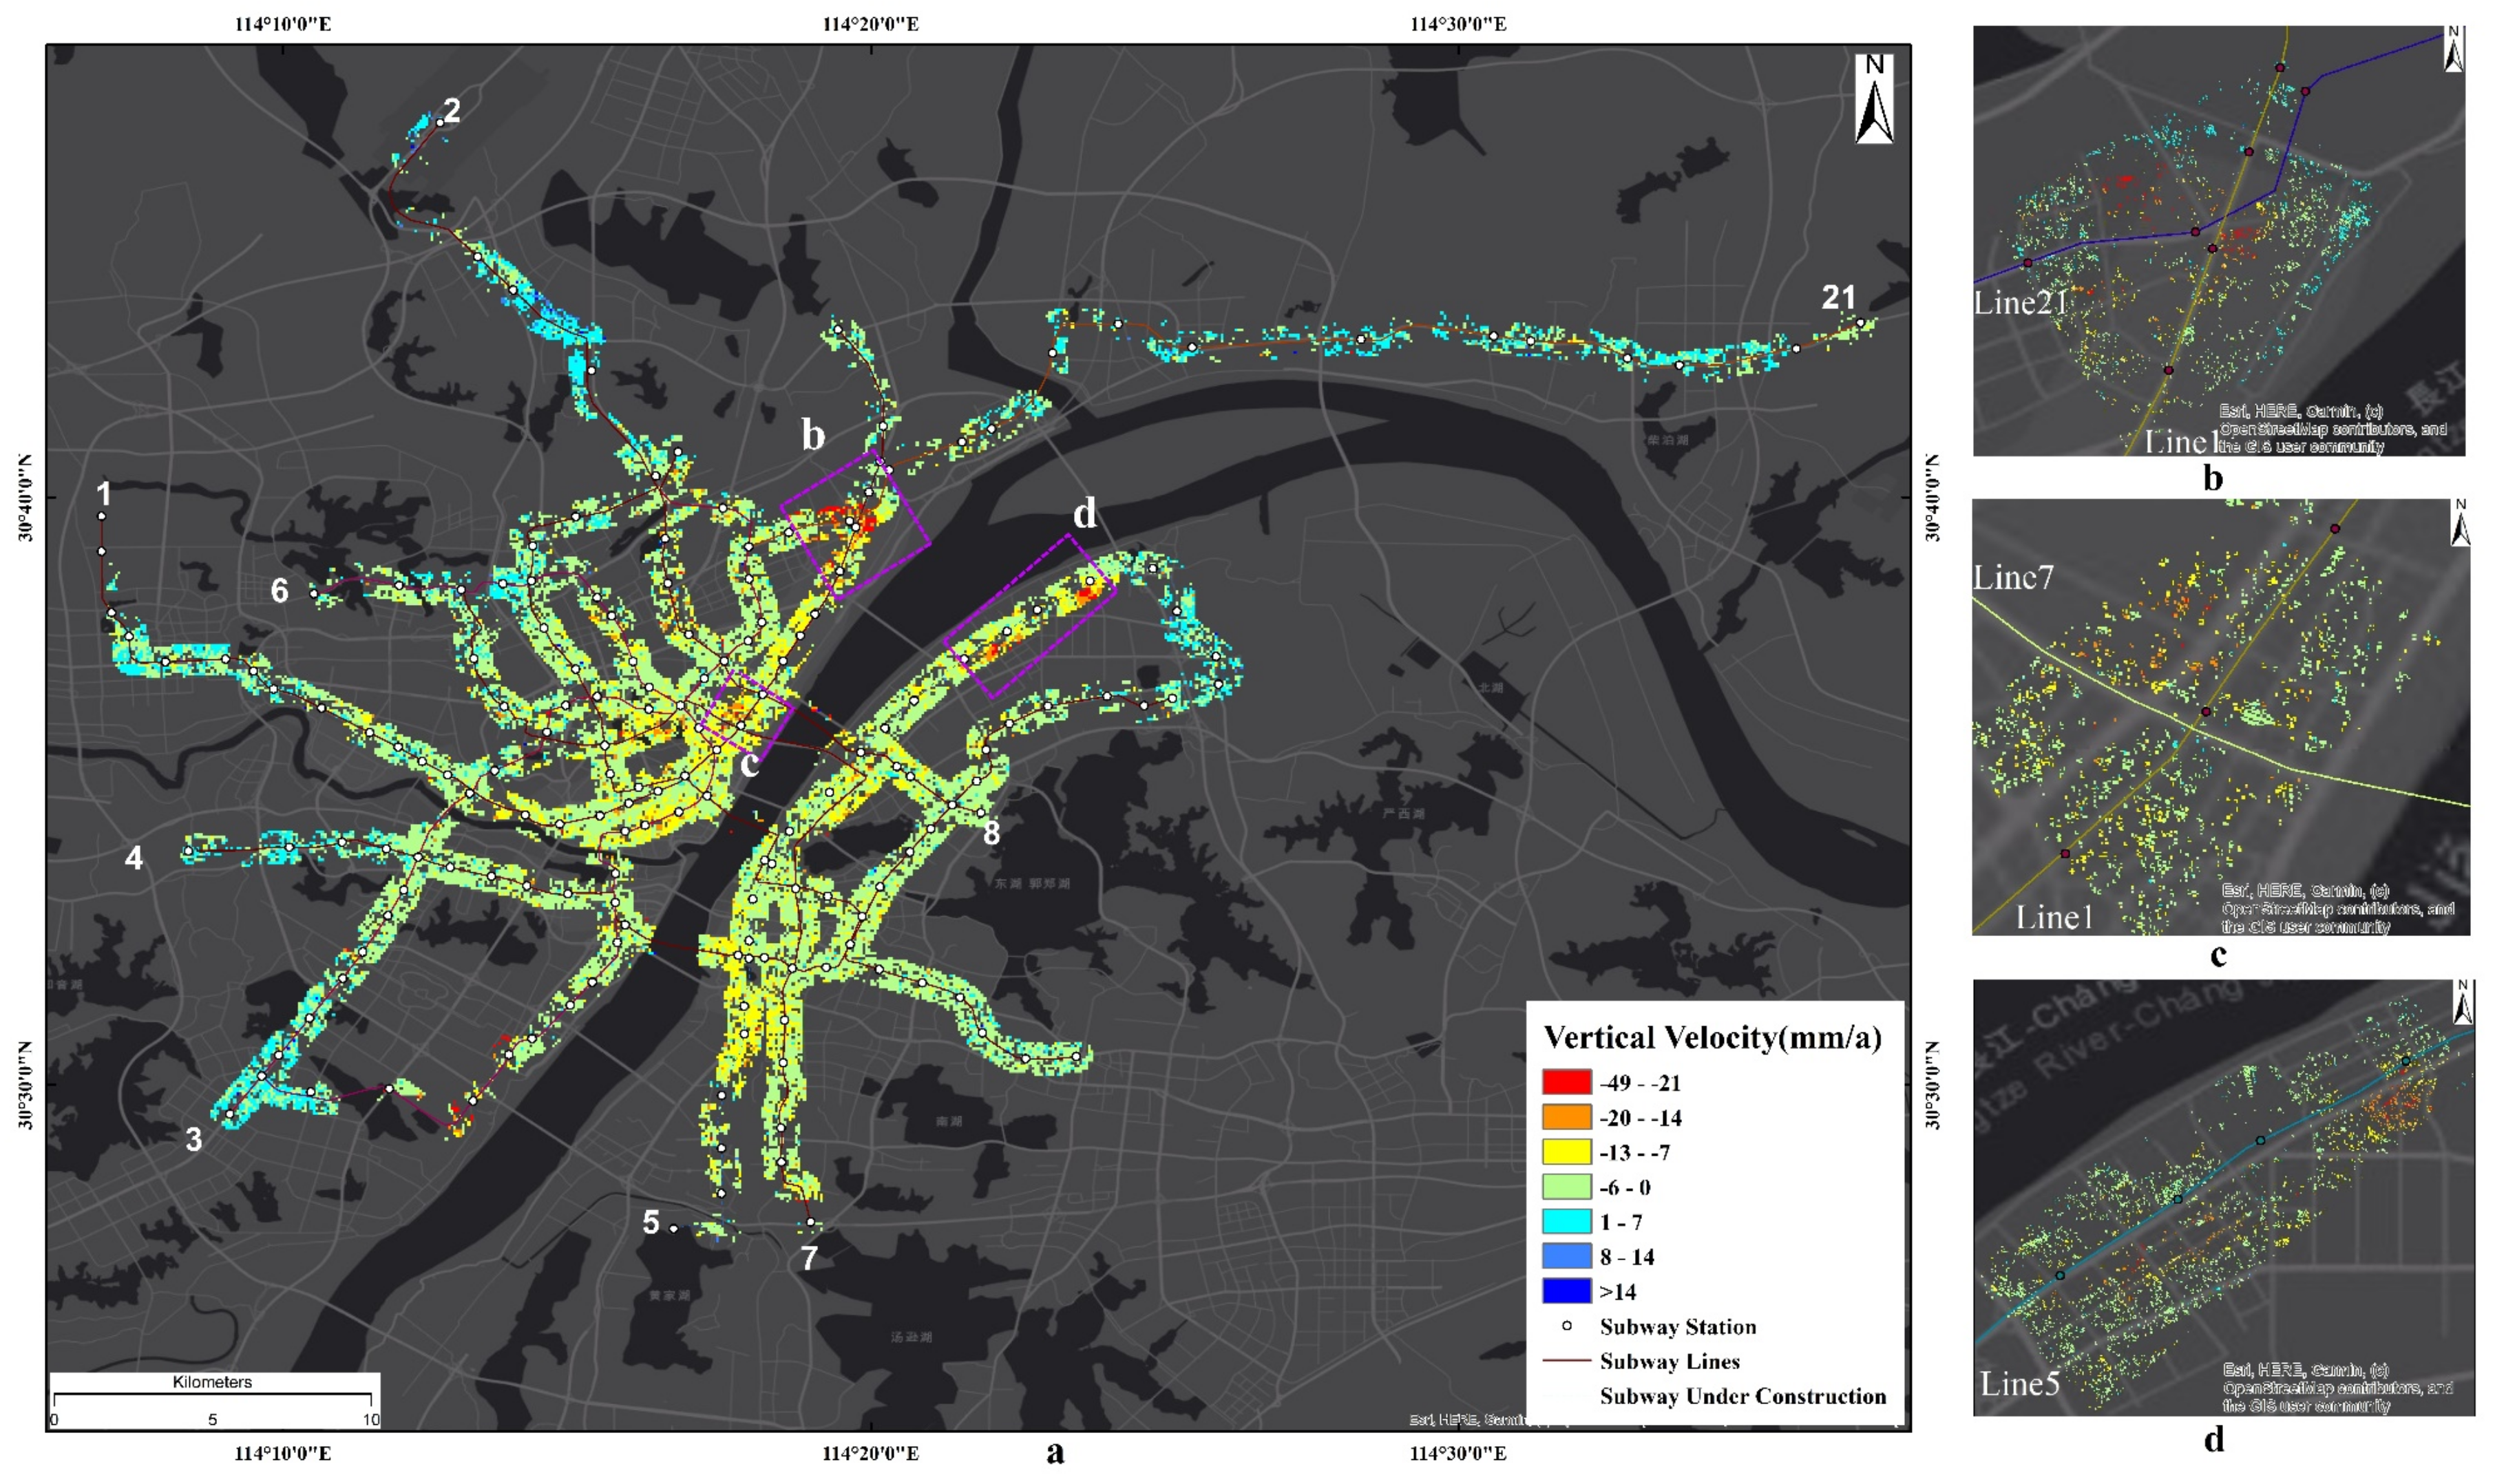
4.2. Land Subsidence Along Metro Lines

The construction, operation, and maintenance of mass transit systems can be negatively affected by land subsidence. Land subsidence may pose potential safety risks to metro lines. Wuhan had eight metro lines in operation by the end of 2018, and another eight metro lines were under construction during 2015–2019. Figure 9a presents the subsidence along the metro lines and their vicinity during 2015–2019. Some of these operational and under-construction lines passed through the subsidence zones, especially in Hankou’s HH and JH zones and Wuchang’s QS zone. Metro line 21 was under construction from 2015 to 2017; during this time, land subsidence was concentrated at the intersection of line 21 and line 1 (Figure 9b) as indicated by a purple dashed rectangle in HH (“b” in Figure 9a), when the maximum vertical velocity reached −49 mm/a. Metro line 7 is the newest operational metro line during the monitoring period; land subsidence occurred at the intersection of line 7 and line 1 (Figure 9c) as indicated by a purple dashed rectangle in JH (“c” in Figure 9a). The excavation of Metro line 5 started in 2017 and it is still under construction. It passed through BSZ, SH, and QS subsidence zones; two obvious subsidence areas can be seen along line 5 in QS (Figure 9d) with a vertical velocity of up to −30 mm/a (“d” in Figure 9a).

5. Discussion

The construction associated with Wuhan’s rapid urban development, the related groundwater over-exploitation, and increasing building load are the dominant factors of the observed land subsidence in Wuhan [45,46,47]. If large quantities of groundwater pumping from one region continue, the groundwater levels will drop. This leads to a shift in the subsurface support structure for any overlaying material (soil layers as well as the building load), from the pressurized fluid filling the pore space, to the granular skeleton of the aquifer system, resulting in ground subsidence. In addition, land subsidence can also occur along with high compression of mucky soft soils layers and dissolution of carbonate rocks due to the change of groundwater levels. A discussion of the causes of land subsidence in Wuhan follows.

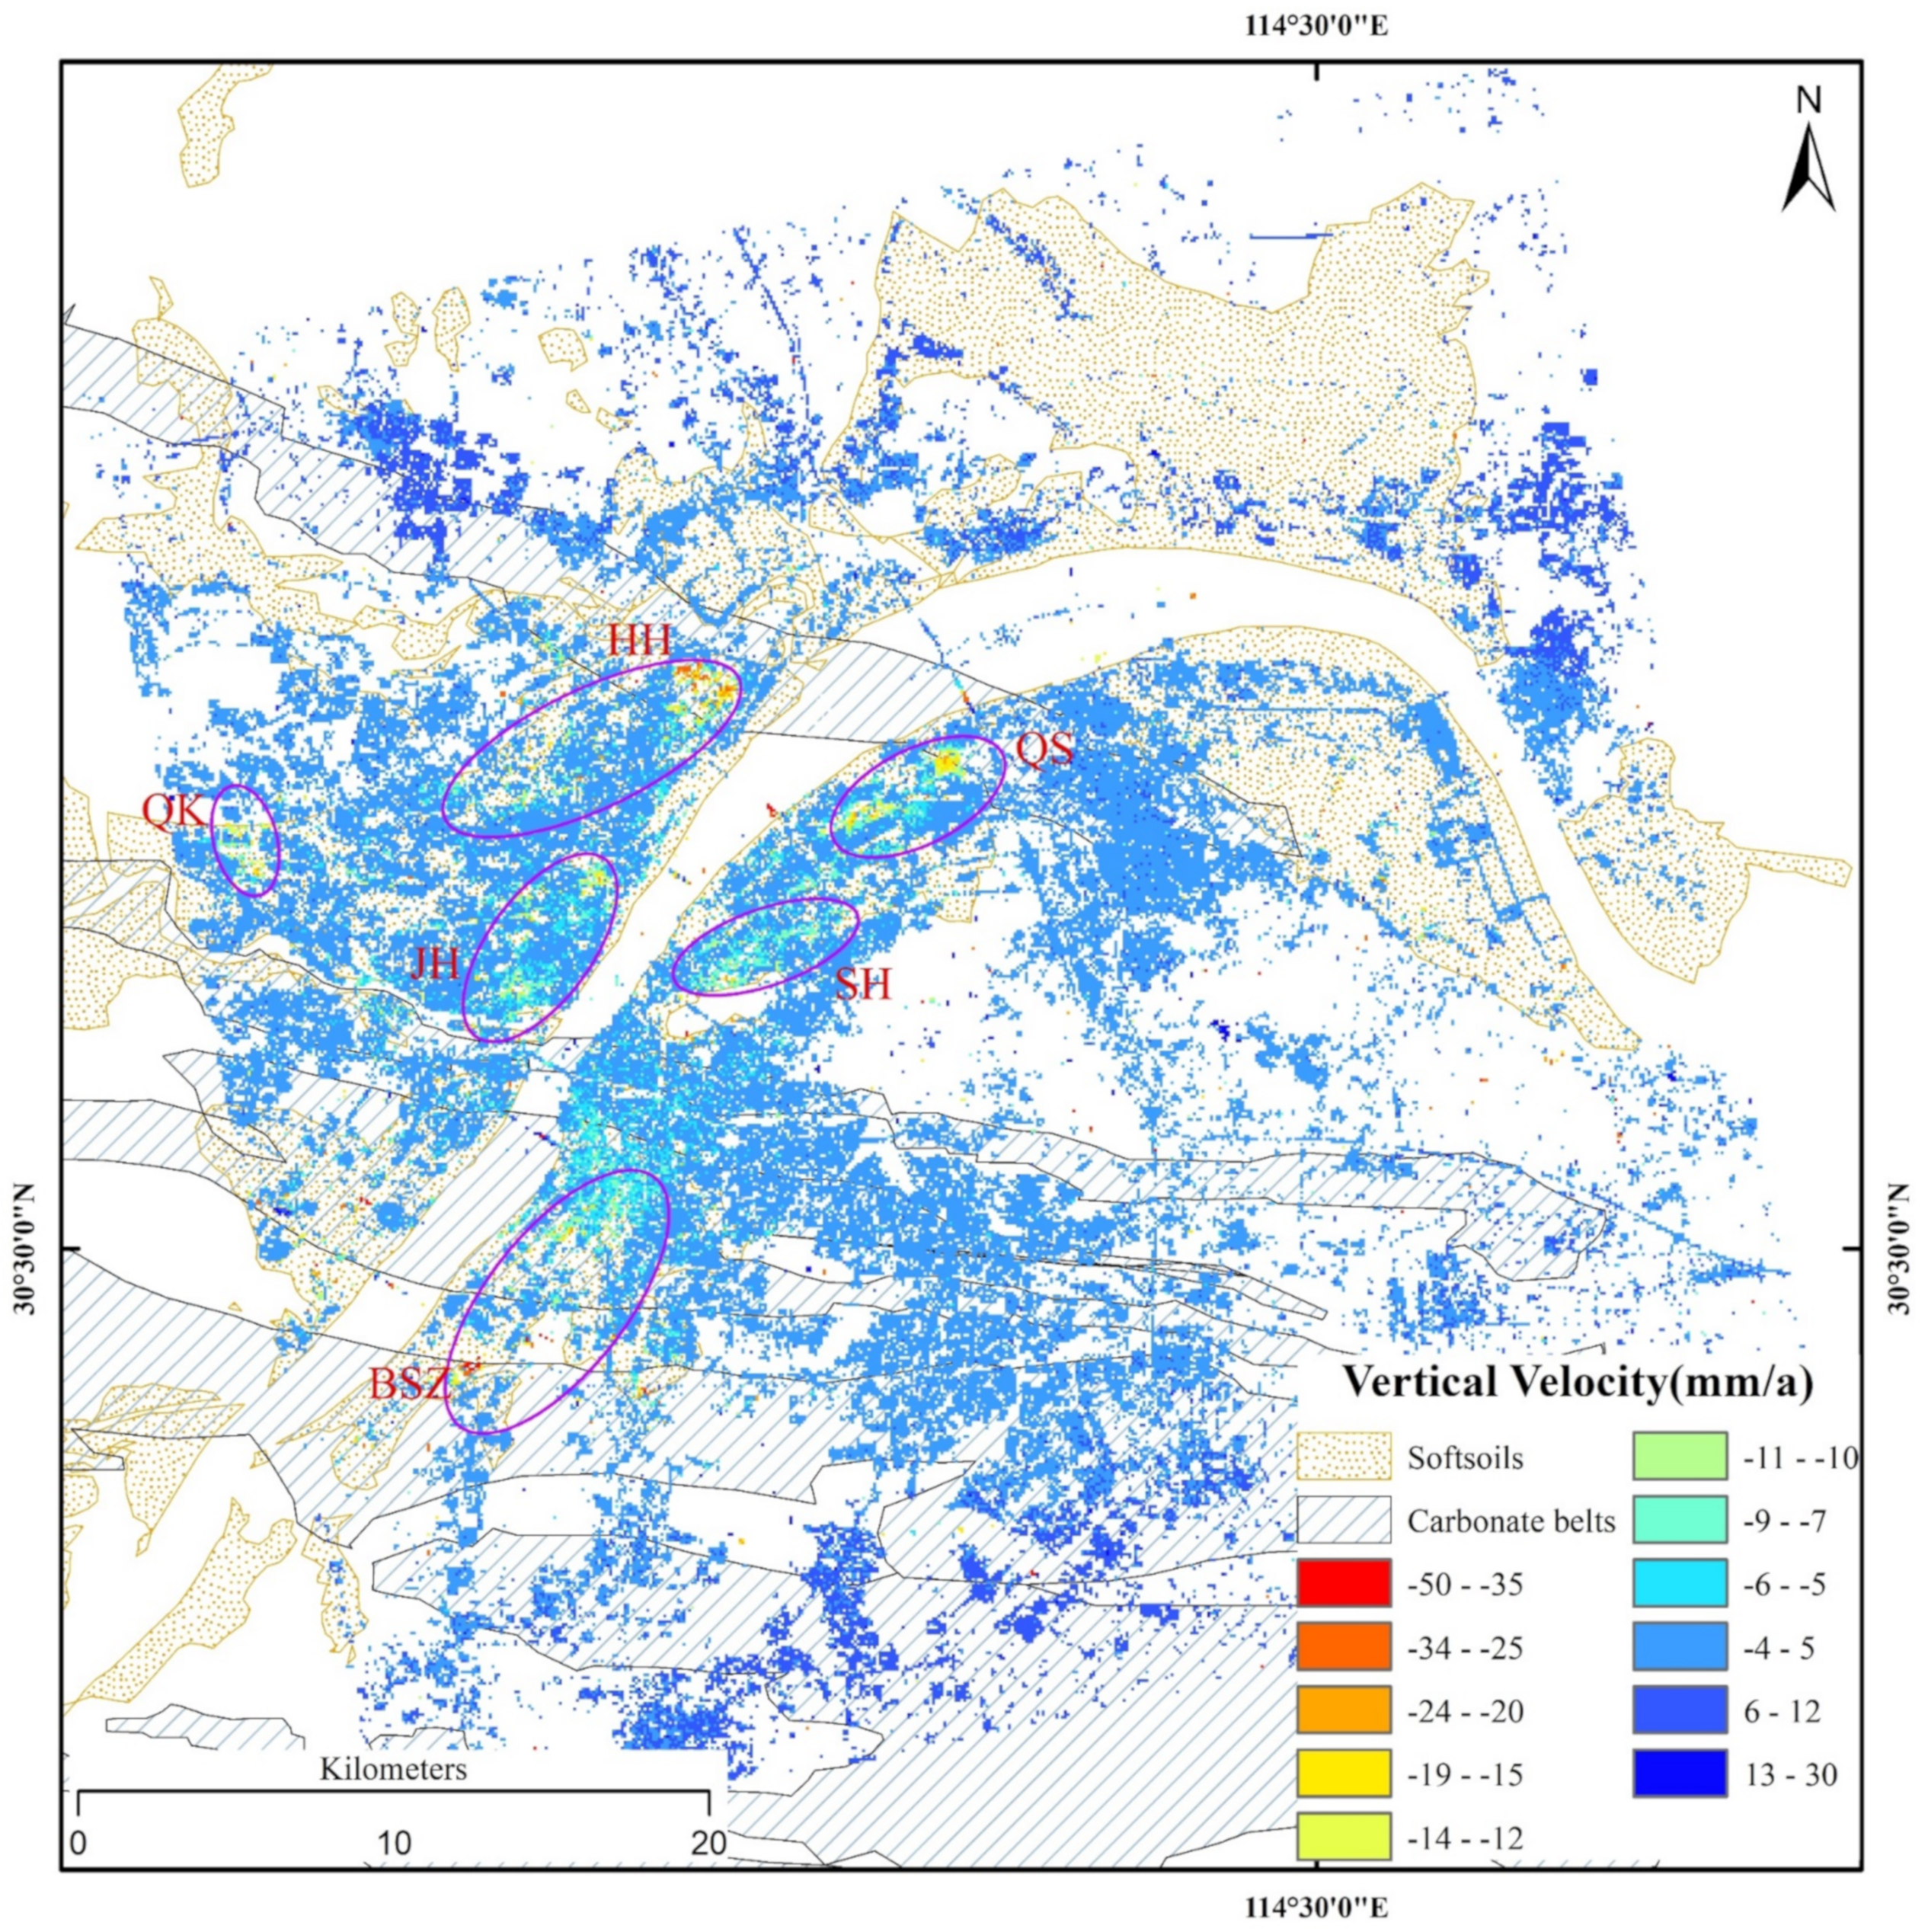
5.1. Correlation between Land Subsidence and Surface Geology

The land subsidence zones in Wuhan show strong spatial variations during two different monitoring periods. The subsidence zones are normally located in the mucky soft layers and carbonate rock belts in Wuhan (Figure 10). West of HH(HHW), JH, QK, and SH are located on the mucky soft soil layers, BSZ and central of QS are located on the carbon rock belts. The areas of HH, JH, and SH belong to the first alluvial terrace with mucky soft soil layers in excess of 5 m thick. The deeper soft soil can cause subsidence easily in Wuhan, because pore water pressure would be reduced with over-exploitation of groundwater in thick soft soil layer [34]. Generally, the soft soil has the following features in Wuhan: high water content, low bearing capacity, and huge compression index. Massive urban construction exacerbated by over-extraction of groundwater may lead to uneven degradation of mucky soft soil. Much of the BSZ subsidence zone and parts of the QS subsidence zone are located on the carbonate rock belts close to the Yangtze River (Figure 10). This indicates that a spatial correlation might exist between carbon rock belts and land subsidence in BSZ and QS. Because the Yangtze River and the aquifer are connected in this area, there is an abnormal variation of groundwater level caused by the river’s water level fluctuations and karst pile foundation construction [47]. Groundwater percolates through rock and soil into carbonate rocks, promoting further erosion and dissolution of carbonate rocks to induce additional land subsidence or collapses. The distribution of InSAR-derived subsidence on mucky soft soil and carbonate rock belts suggests a correlation between the geological condition of alluvial zones along the Yangtze River and the subsidence obtained by InSAR.

5.2. Correlation between Land Subsidence and Human Activity

According to the report of the Wuhan Bureau of Statistics in 2019 (http://tjj.wuhan.gov.cn/tjfw/tjfx/202001/t20200115_840961.shtml), the population of Wuhan was about 11.08 million in 2018, nearly double the population of 1978 and up from about 9.78 million in 2010. Urban construction of Wuhan has continued to increase sharply since 2011, with more than 10,000 constructions and building sites in 2014. The exploitation of groundwater demanded by the intense construction activity may have caused damage to the aquifer system. This in turn leads to land subsidence caused by building loads on the ground surface and pumping groundwater.
JH and QK are the business centers in Hankou. Nearly 40 skyscrapers with heights exceeding 200 m have been constructed in JH and QK since 2006 [7]. The detected maximum vertical velocity reached up to −44 mm/a during 2007–2010. The most serious subsidence zones were located at HH during 2015–2019 where many multi-story residential buildings have been built in recent decades. During a large building’s construction, multiple, perhaps even dozens, of foundation pits are created, each pumping out upwards of 50 to 70 cubic meters of groundwater per hour for up to six months [48]. As HH was designed for the eco-residential city in Wuhan, the groundwater whose temperature was around 12–35 ℃ and about 20–30 m deep was pumped to keep the room warm in winter and cool in summer in some parts of HH. However, few areas were recharged, thus the groundwater levels dropped gradually in HH. SH has undergone a similar subsidence pattern to HH. There are many office buildings, schools, and multi-story residential communities constructed in the north of SH in the past few decades. As shown in Figure 3 and Figure 6, a notable change is that eastern HH has become the new and largest subsidence zone in Wuhan since 2017. Based on the difference in intensity maps of SAR images and optical images (Figure 11), the multi-story building construction could explain the subsidence. The SAR backscattering intensity over eastern HH has changed greatly because of urban construction (Figure 11e,f), indicating that the spatial distribution of land subsidence in HH, QK, JH, and SH was controlled by urban construction to a certain extent. Construction of thousands of high-rise buildings, combined with pumping of groundwater, intensified the land subsidence with the increase of urbanization loads. QS is one of the main large industrial parks in Wuhan; the Wuhan iron and steel company, Qingshan thermal power plant, and Sinopec Wuhan company are all located in this area. A possible cause of land subsidence there is that groundwater has been exploited excessively for industrial production in QS.
Because of the fact that InSAR will lose coherence during the building construction, the observed subsidence may reflect the building construction and the changes in groundwater levels that occurred a few years prior. The previous building construction would have a “delayed” effect on land subsidence; that is, the subsidence continues for a period after the building has been completed and construction has ceased [49]. With an increase in load applied to the ground surface, there is a tendency for volumetric compression of the underlying soils. As the mucky soft soils have a much lower hydraulic conductivity, the consolidation requires a far longer time to complete [50,51].

5.3. Correlation between Land Subsidence and Yangtze River Water Level

With the increase of construction of large hydraulic projects on the Yangtze river, the Yangtze river maintained low levels at Wuhan in recent years. There is insufficient groundwater supply along the Yangtze River, and the water tables decreased significantly in the Hankou area, which could lead to land subsidence. There is a complementary effect between the Yangtze River itself and groundwater along the river bank in dry and rainy seasons. The groundwater level rises with the increase in supply to the Yangtze River in rainy seasons, and the groundwater is discharged into the Yangtze River in dry seasons. As shown in Figure 12, the water level of the Yangtze River fluctuated yearly in Wuhan during the 2015–2019 timespan. To study the correlation between land subsidence on the bank of the Yangtze River and water level changes of the river itself, we compare the InSAR time series results with Yangtze river water level changes from 2015 to 2019 based on selected SDFP points (W1–W4) which are distributed along both sides of Yangtze river (marked by blue triangles in Figure 1b). As seen in Figure 12, there is a temporal correlation between obvious seasonal variations of InSAR-derived subsidence and water level changes of Yangtze river. The water level is high in rainy seasons (June to August), and low in dry seasons (October to March). The changes of land subsidence near the bank of the Yangtze River are generally consistent with the variations in the river’s water level over most of the monitoring period; the subsidence is obvious while the water level dropped significantly (light blue shaded columns in Figure 12). For example, the water level dropped 9.5 m from August 2017 to March 2018, which corresponded to an average accumulated subsidence of about −11.1 mm at four SDFP points. Thus, the seasonal fluctuations of water levels might affect the land subsidence variation along the Yangtze River in Wuhan. However, it is perplexing that sometimes the land uplift was subtle during some periods of high river water level increases. Therefore, more research is needed to study the phenomenon. In addition, the subsidence detected by InSAR had a time delay with respect to the time of water level changes, suggesting the complexity of and variation in the hydrogeological condition along the Yangtze river in Wuhan.

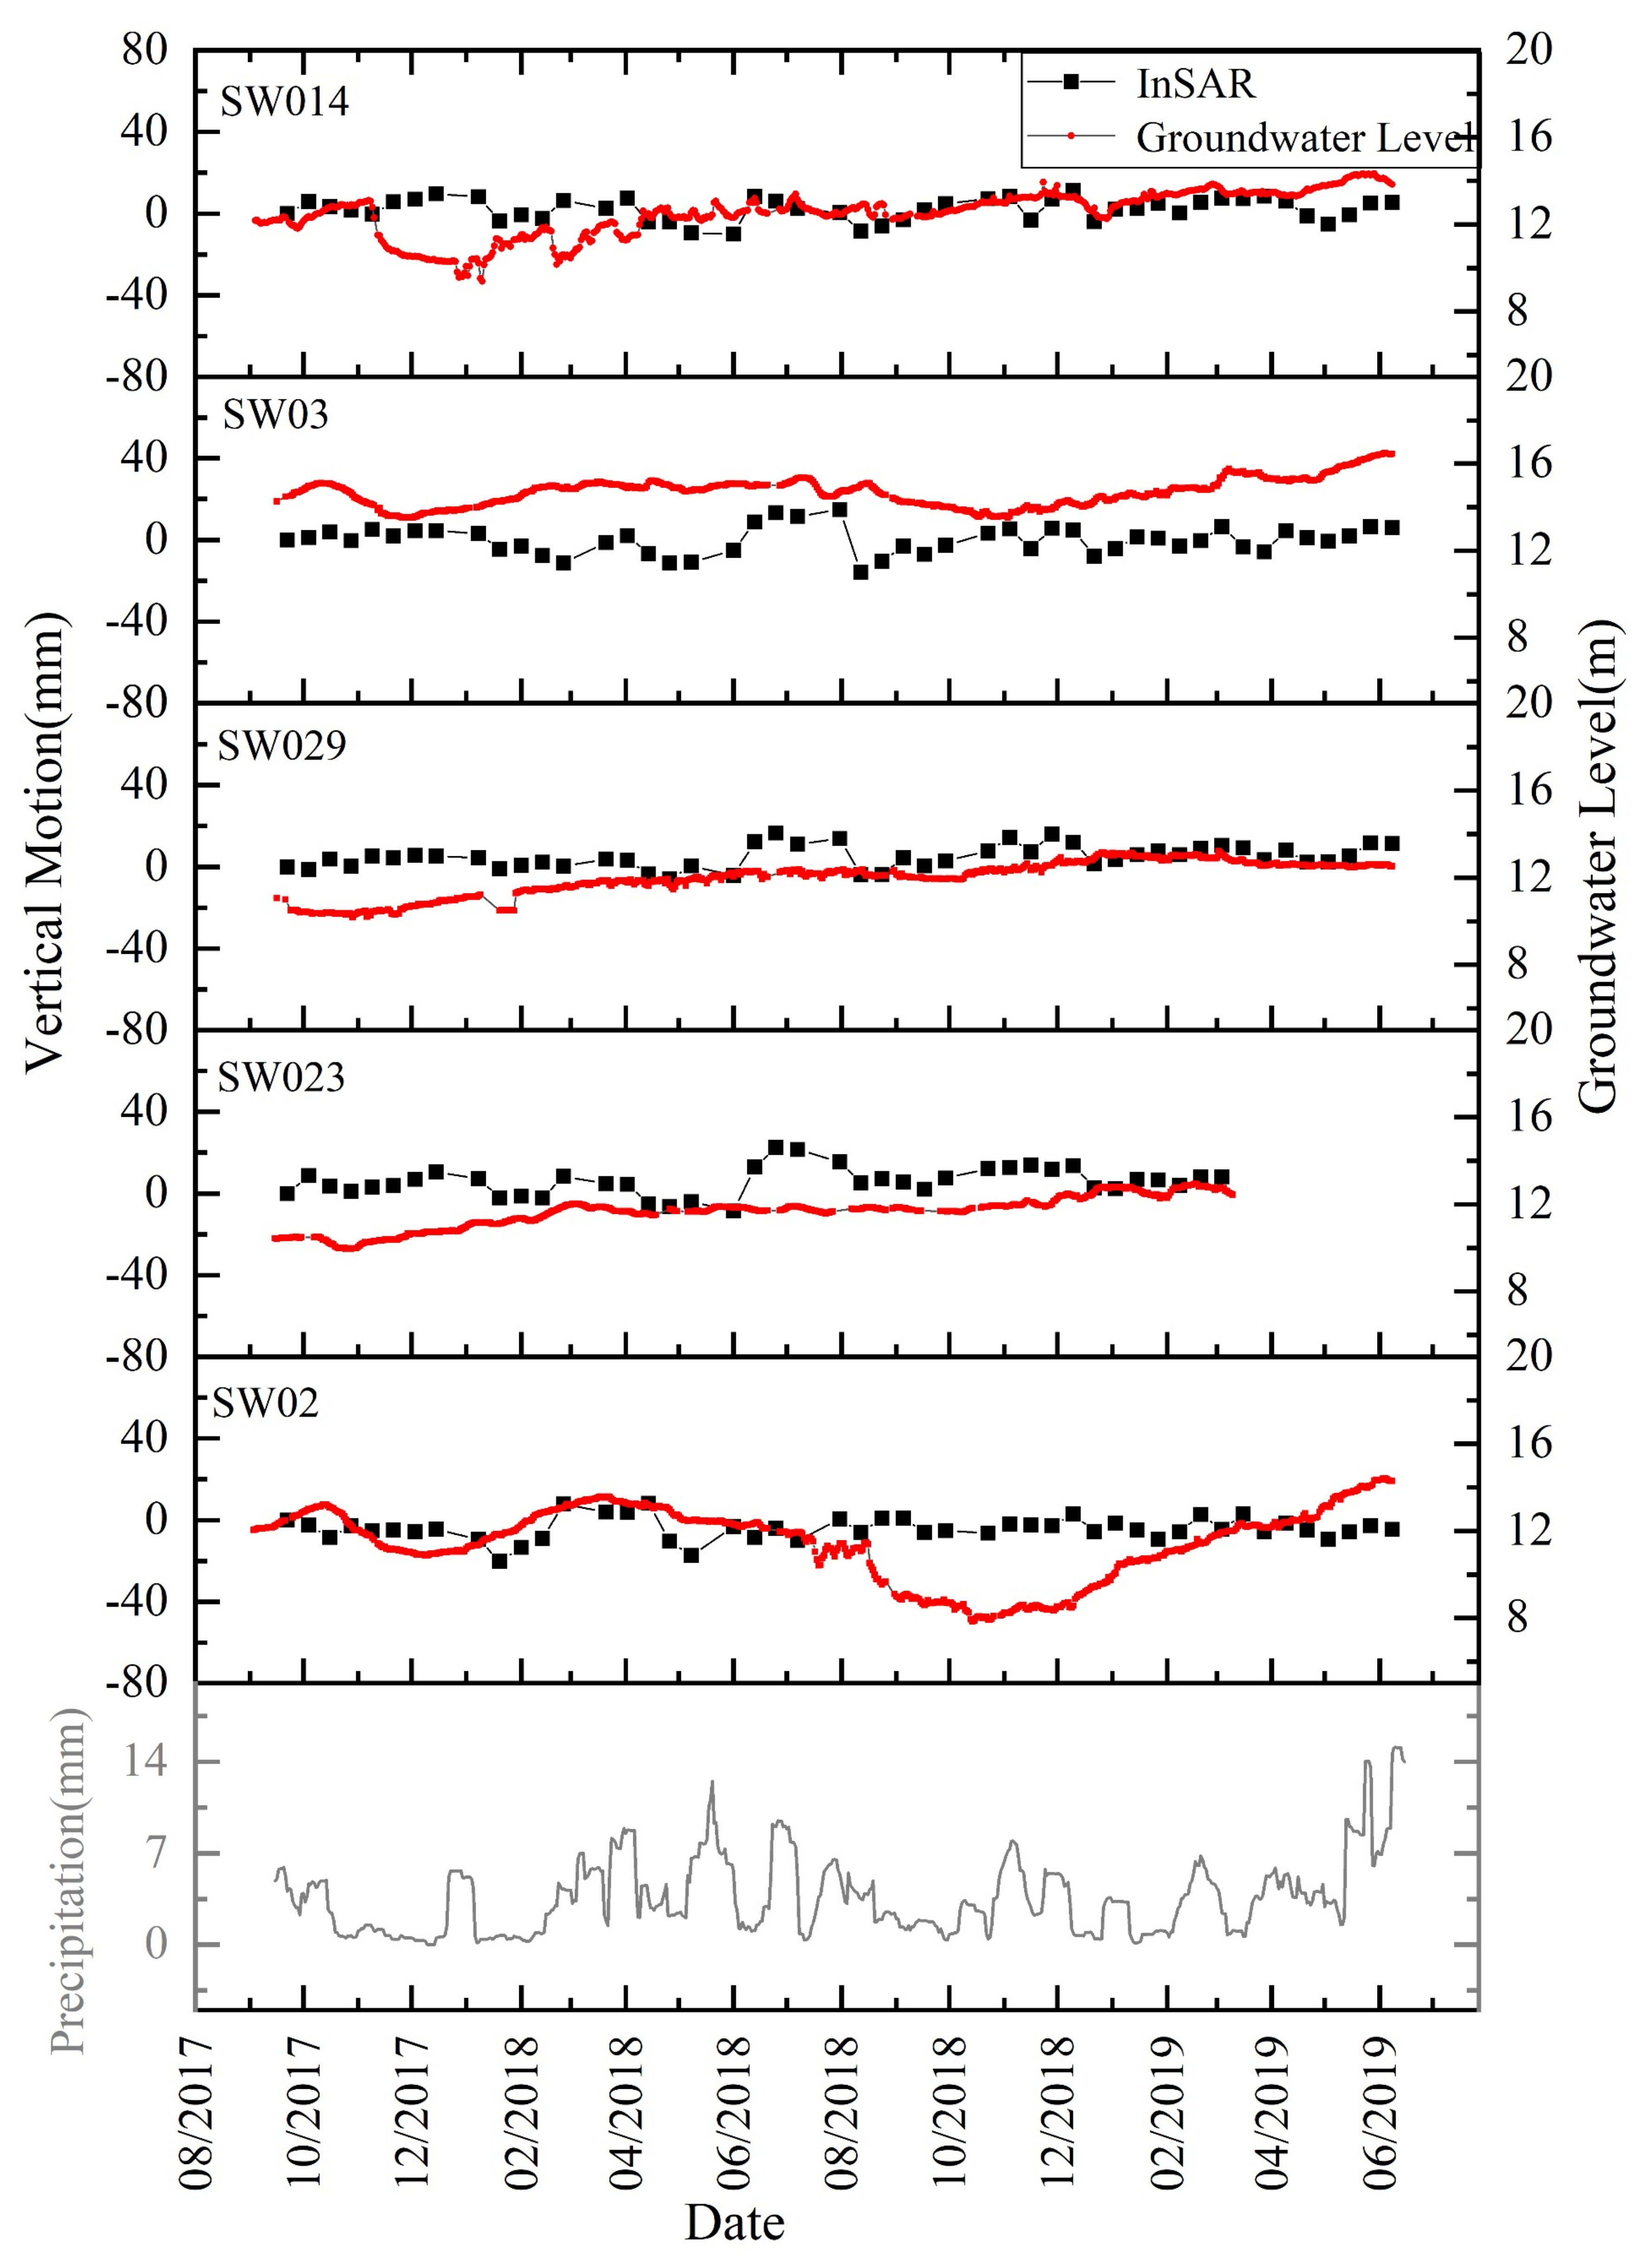
5.4. Correlation between Land Subsidence and Groundwater Levels

In order to evaluate the correlation between land subsidence and groundwater levels, we compared the InSAR results with groundwater level changes based on the available aquifer wells. We obtained the groundwater levels of five aquifer wells located in Hankou (marked by pink dots in Figure 1b), and compared the land subsidence detected by InSAR with groundwater level changes from 2017 to 2019. The relationship between groundwater levels and land subsidence can be seen in Figure 13. Because the deformation variation was not obvious near these groundwater wells and the groundwater levels have not shown remarkable variations during the 2017–2019 period, we could not deduce a firm correlation of significance. This is due to the complexity of Wuhan’s aquifer system [52] and to the short observation period precluding a reasonable correlation analysis. However, there is a correlation between groundwater levels and precipitation in Wuhan from September 2017 to June 2019. The groundwater level rises gradually after April owing to the increase of precipitation in rainy seasons, when rains constitute around 41% of Wuhan’s annual rainfall. Slight rebounds in subsidence could be observed from May to August. Overall, the effect of the variation in groundwater level in 2017–2019 on the long-term subsidence phenomena in Wuhan is not fully understood, and more research is needed to study this matter further.

6. Conclusions

This study presents an InSAR time series investigation of land subsidence for the periods 2007–2010 and 2015–2019 in Wuhan. Multi-sensor SAR datasets were used for InSAR time series interpretation over 8 years to unveil the pattern of land subsidence in Wuhan. The land deformation maps based on 19 ALOS-1 images (2007–2010), 3 Envisat images (2008–2010), and 104 Sentinel-1 images (2015–2019) reveal the temporal and spatial variations of land subsidence in Wuhan. In order to assess the InSAR results and identify the cause(s) of land subsidence, leveling observations, Yangtze River water level measurements, and groundwater table measurements were analyzed in conjunction with InSAR-derived land subsidence. First, ALOS-1 and Envisat images acquired from 2008 to 2010 were cross-validated. The standard deviation of difference between the two datasets is 5.2 mm/a. The InSAR-derived vertical velocity was compared with leveling observations in 2017, and there is a good consistency (correlation coefficient of 0.089) between leveling observations and InSAR results. Second, six main land subsidence zones are detected at JH, QK, SH, QS, BSZ, and HH with the maximum vertical velocity of over −50 mm/a during 2015–2017. Comparing the results in different time spans, we found that the subsidence centers changed significantly with varying spatiotemporal characteristics. Finally, analyses of the causes of land subsidence in Wuhan suggest that human activities, such as intensive urban construction and groundwater pumping, are the main causes of these phenomena. In addition, the land subsidence along the Yangtze River may be influenced by the river water level changes, given that the vertical velocity is related to seasonal fluctuations in water level. The correlation analysis between land subsidence and the groundwater level of aquifer wells are not significant because the deformation in aquifer wells areas was not obvious during the short observation period (2017–2019). Our results provide insights on understanding the cause of land subsidence in Wuhan. Continuous monitoring of ground deformation from InSAR and other geodetic means will be important for managing future land subsidence in Wuhan and mitigating the potential hazards in this densely urban area.

Author Contributions

All of the authors participated in editing and reviewing the manuscript. Conceptualization, Z.L., Y.H., and J.Z.; methodology, Y.H. and Z.L.; software, Y.H. and Y.K.; data analysis, Y.H., Y.K. and F.Q.; validation, J.Z. and J.L. All authors have read and agreed to the published version of the manuscript.

Funding

This work is jointly supported by the National Natural Science Foundation of China NSFC (Grant No. 41871373), Guangxi Key Laboratory of Spatial Information and Geomatics (No. 17-259-16-01) and the fundamental Research Foundation of the Central Universities (No. 300102268704), China Scholarship Council (201806270181), Natural Science Foundation of Guangxi (2018GXNSFBA050006), Ministry of Natural Resources of the People’s Republic of China (dks2020-04).

Acknowledgments

We are grateful to Jinwoo Kim and Yuankun Xu from Southern Methodist University for their help in data processing and analyzing the InSAR results. We also would like to thank the European Space Agency for providing the Sentinel-1A data and Envisat data for free. ALOS/PALSAR data are copyrighted by the Japan Aerospace Exploration Agency (JAXA). Global Precipitation Measurement (GPM) was downloaded for free from https://pmm.nasa.gov/data-access/downloads/gpm. One-arc-second SRTM DEM was downloaded for free from the website https://e4ftl01.cr.usgs.gov/MEASURES/SRTMGL1.003/2000.02.11/

Conflicts of Interest

The authors declare no conflict of interest.

References

  1. Chen, C.; Pei, S.; Jiao, J. Land subsidence caused by groundwater exploitation in Suzhou City, China. Hydrogeol. J. 2003, 11, 275–287. [Google Scholar] [CrossRef]
  2. Galloway, D.L.; Burbey, T.J. Regional land subsidence accompanying groundwater extraction. Hydrogeol. J. 2011, 19, 1459–1486. [Google Scholar] [CrossRef]
  3. Qu, F.; Zhang, Q.; Lu, Z.; Zhao, C.; Yang, C.; Zhang, J. Land subsidence and ground fissures in Xi’an, China 2005–2012 revealed by multi-band InSAR time-series analysis. Remote Sens. Environ. 2014, 155, 366–376. [Google Scholar] [CrossRef]
  4. Conacher, A.; Conacher, J.; Dragovich, D.; Maude, A. Rural Land Degradation in Australia; Oxford University Press: Melbourne, AUS, 1995. [Google Scholar]
  5. Qu, F.; Lu, Z.; Zhang, Q.; Bawden, G.W.; Kim, J.-W.; Zhao, C.; Qu, W. Mapping ground deformation over Houston–Galveston, Texas using multi-temporal InSAR. Remote Sens. Environ. 2015, 169, 290–306. [Google Scholar] [CrossRef]
  6. Haghighi, M.H.; Motagh, M. Ground surface response to continuous compaction of aquifer system in Tehran, Iran: Results from a long-term multi-sensor InSAR analysis. Remote Sens. Environ. 2019, 221, 534–550. [Google Scholar] [CrossRef]
  7. Xu, G. Mechanism Study and Hazard Assessment of Cover Karst Sinkholes in Wuhan City. Ph.D. Thesis, China University of Geosciences, Wuhan, China, 2016. [Google Scholar]
  8. Li, Y.; He, Z.Z.; Yan, G.H.; Han, F.Y. Foundation pit dewatering and ground subsidence in binary structural stratum of Wuhan. Adv. Mater. Res. 2013, 639, 694–699. [Google Scholar] [CrossRef]
  9. Yang, Y.; Luo, Y.; Liu, M.; Wang, R.; Wang, H. Research of features related to land subsidence and ground fissure disasters in the Beijing Plain. Proc. Int. Assoc. Hydrol. Sci. 2015, 372, 239. [Google Scholar] [CrossRef] [Green Version]
  10. Li, X.; Xiao, S.; Tang, H.; Peng, J. A GIS-based monitoring and early warning system for cover-collapse sinkholes in karst terrane in Wuhan, China. Nat. Hazards Earth Syst. Sci. Discuss. 2017. [Google Scholar] [CrossRef]
  11. Zhang, Y.; Gong, H.; Gu, Z.; Wang, R.; Li, X.; Zhao, W. Characterization of land subsidence induced by groundwater withdrawals in the plain of Beijing city, China. Hydrogeol. J. 2014, 22, 397–409. [Google Scholar] [CrossRef]
  12. Huang, B.; Zheng, F.; Bai, J.; Wang, Y. Feasibility of land surface deformation monitoring by regional CORS. J. Geomat. Sci. Technol. 2011, 28, 169–172. [Google Scholar]
  13. Lu, Z.; Fielding, E.; Patrick, M.R.; Trautwein, C.M. Estimating lava volume by precision combination of multiple baseline spaceborne and airborne interferometric synthetic aperture radar: The 1997 eruption of Okmok volcano, Alaska. IEEE Trans. Geosci. Remote Sens. 2003, 41, 1428–1436. [Google Scholar]
  14. Galve, J.P.; Pérez-Peña, J.V.; Azañón, J.M.; Closson, D.; Caló, F.; Reyes-Carmona, C.; Jabaloy, A.; Ruano, P.; Mateos, R.M.; Notti, D.; et al. Evaluation of the SBAS InSAR service of the European space Agency’s Geohazard Exploitation Platform (GEP). Remote Sens. 2017, 9, 1291. [Google Scholar] [CrossRef] [Green Version]
  15. Lundgren, P.; Nikkhoo, M.; Samsonov, S.V.; Milillo, P.; Gil-Cruz, F.; Lazo, J. Source model for the Copahue volcano magma plumbing system constrained by InSAR surface deformation observations. J. Geophys. Res. Solid Earth 2017, 122, 5729–5747. [Google Scholar] [CrossRef] [Green Version]
  16. Giardina, G.; Milillo, P.; DeJong, M.J.; Perissin, D.; Milillo, G. Evaluation of InSAR monitoring data for post-tunnelling settlement damage assessment. Struct. Control Health Monit. 2019, 26, e2285. [Google Scholar] [CrossRef] [Green Version]
  17. Baer, G.; Magen, Y.; Nof, R.; Raz, E.; Lyakhovsky, V.; Shalev, E. InSAR measurements and viscoelastic modeling of sinkhole precursory subsidence: Implications for sinkhole formation, early warning, and sediment properties. J. Geophys. Res. Earth Surf. 2018, 123, 678–693. [Google Scholar] [CrossRef]
  18. Farolfi, G.; Del Soldato, M.; Bianchini, S.; Casagli, N. A procedure to use GNSS data to calibrate satellite PSI data for the study of subsidence: An example from the north-western Adriatic coast (Italy). Eur. J. Remote Sens. 2019, 52, 54–63. [Google Scholar] [CrossRef] [Green Version]
  19. Colesanti, C.; Ferretti, A.; Prati, C.; Rocca, F. Monitoring landslides and tectonic motions with the Permanent Scatterers Technique. Eng. Geol. 2003, 68, 3–14. [Google Scholar] [CrossRef]
  20. Zebker, H.A.; Villasenor, J. Decorrelation in interferometric radar echoes. IEEE Trans. Geosci. Remote Sens. 1992, 30, 950–959. [Google Scholar] [CrossRef] [Green Version]
  21. Ferretti, A.; Prati, C.; Rocca, F. Permanent scatterers in SAR interferometry. IEEE Trans. Geosci. Remote Sens. 2001, 39, 8–20. [Google Scholar] [CrossRef]
  22. Lin, H.; Ma, P.; Wang, W. Urban infrastructure health monitoring with space multi-temporal synthetic aperture radar interferometry. Acta Geod. Et Cartogr. Sin. 2017, 10, 1421–1433. [Google Scholar]
  23. Ferretti, A.; Fumagalli, A.; Novali, F.; Prati, C.; Rocca, F.; Rucci, A. A new algorithm for processing interferometric data-stacks: SqueeSAR. IEEE Trans. Geosci. Remote Sens. 2011, 49, 3460–3470. [Google Scholar] [CrossRef]
  24. Berardino, P.; Fornaro, G.; Lanari, R.; Sansosti, E. A new algorithm for surface deformation monitoring based on small baseline differential SAR interferograms. IEEE Trans. Geosci. Remote Sens. 2002, 40, 2375–2383. [Google Scholar] [CrossRef] [Green Version]
  25. Werner, C.; Wegmuller, U.; Strozzi, T.; Wiesmann, A. Interferometric point target analysis for deformation mapping. In Proceedings of the IGARSS 2003. 2003 IEEE International Geoscience and Remote Sensing Symposium. Proceedings (IEEE Cat. No. 03CH37477), Toulouse, France, 21–25 July 2003; Volume 7, pp. 4362–4364. [Google Scholar]
  26. Liu, Y.; Zhao, C.; Zhang, Q.; Yang, C.; Zhang, J. Land subsidence in Taiyuan, China, monitored by InSAR technique with multisensor SAR datasets from 1992 to 2015. IEEE J. Sel. Top. Appl. Earth Obs. Remote Sens. 2018, 11, 1509–1519. [Google Scholar] [CrossRef]
  27. Hooper, A.; Segall, P.; Zebker, H. Persistent scatterer InSAR for crustal deformation analysis, with application to Volcán Alcedo, Galápagos. J. Geophys. Res. 2007, 112, 19. [Google Scholar]
  28. Hooper, A. A multi-temporal InSAR method incorporating both persistent scatterer and small baseline approaches. Geophys. Res. Lett. 2008, 35. [Google Scholar] [CrossRef] [Green Version]
  29. Kim, J.-W.; Lu, Z.; Kaufmann, J. Evolution of sinkholes over Wink, Texas, observed by high-resolution optical and SAR imagery. Remote Sens. Environ. 2019, 222, 119–132. [Google Scholar] [CrossRef]
  30. Perissin, D.; Wang, T. Repeat-pass SAR interferometry with partially coherent targets. IEEE Trans. Geosci. Remote Sens. 2011, 50, 271–280. [Google Scholar] [CrossRef]
  31. Costantini, M.; Bai, J.; Malvarosa, F.; Minati, F.; Vecchioli, F.; Wang, R.; Hu, Q.; Xiao, J.; Li, J. Ground deformations and building stability monitoring by COSMO-SkyMed PSP SAR interferometry: Results and validation with field measurements and surveys. In Proceedings of the 2016 IEEE International Geoscience and Remote Sensing Symposium (IGARSS), Beijing, China, 10–15 July 2016; pp. 6847–6850. [Google Scholar]
  32. Bai, L.; Jiang, L.; Wang, H.; Sun, Q. Spatiotemporal characterization of land subsidence and uplift (2009–2010) over wuhan in central china revealed by terrasar-X insar analysis. Remote Sens. 2016, 8, 350. [Google Scholar] [CrossRef] [Green Version]
  33. Zhou, L.; Guo, J.; Hu, J.; Li, J.; Xu, Y.; Pan, Y.; Shi, M. Wuhan surface subsidence analysis in 2015–2016 based on sentinel-1a data by SBAS-inSAR. Remote Sens. 2017, 9, 982. [Google Scholar] [CrossRef] [Green Version]
  34. Zhang, Y.; Liu, Y.; Jin, M.; Jing, Y.; Liu, Y.; Liu, Y.; Sun, W.; Wei, J.; Chen, Y. Monitoring land subsidence in Wuhan city (China) using the SBAS-InSAR method with radarsat-2 imagery data. Sensors 2019, 19, 743. [Google Scholar] [CrossRef] [Green Version]
  35. Luo, Q.; Perissin, D.; Zhang, Y.; Jia, Y. L-and X-band multi-temporal InSAR analysis of Tianjin subsidence. Remote Sens. 2014, 6, 7933–7951. [Google Scholar] [CrossRef] [Green Version]
  36. Farr, T.G.; Rosen, P.A.; Caro, E.; Crippen, R.; Duren, R.; Hensley, S.; Kobrick, M.; Paller, M.; Rodriguez, E.; Roth, L.; et al. The shuttle radar topography mission. Rev. Geophys. 2007, 45. [Google Scholar] [CrossRef] [Green Version]
  37. Hooper, A.; Zebker, H.; Segall, P.; Kampes, B. A new method for measuring deformation on volcanoes and other natural terrains using InSAR persistent scatterers. Geophys. Res. Lett. 2004, 31. [Google Scholar] [CrossRef]
  38. Hooper, A.; Zebker, H.A. Phase unwrapping in three dimensions with application to InSAR time series. JOSA A 2007, 24, 2737–2747. [Google Scholar] [CrossRef] [PubMed] [Green Version]
  39. Qu, F.; Lu, Z.; Kim, J.-W.; Zheng, W. Identify and monitor growth faulting using InSAR over northern Greater Houston, Texas, USA. Remote Sens. 2019, 11, 1498. [Google Scholar] [CrossRef] [Green Version]
  40. Rosen, P.A.; Hensley, S.; Peltzer, G.; Simons, M. Updated repeat orbit interferometry package released. Eos Trans. Am. Geophys. Union 2004, 85, 47. [Google Scholar] [CrossRef]
  41. Kampes, B.M.; Hanssen, R.F.; Perski, Z. Radar interferometry with public domain tools. In Proceedings of the FRINGE, Frascati, Italy, 1–5 December 2003; Volume 3. [Google Scholar]
  42. Wegnüller, U.; Werner, C.; Strozzi, T.; Wiesmann, A.; Frey, O.; Santoro, M. Sentinel-1 support in the GAMMA software. Procedia Comput. Sci. 2016, 100, 1305–1312. [Google Scholar] [CrossRef] [Green Version]
  43. Chaussard, E.; Wdowinski, S.; Cabral-Cano, E.; Amelung, F. Land subsidence in central Mexico detected by ALOS InSAR time-series. Remote Sens. Environ. 2014, 140, 94–106. [Google Scholar] [CrossRef]
  44. Du, Z.; Ge, L.; Ng, A.H.-M.; Zhu, Q.; Horgan, F.G.; Zhang, Q. Risk assessment for tailings dams in Brumadinho of Brazil using InSAR time series approach. Sci. Total Environ. 2020, 717, 137125. [Google Scholar] [CrossRef]
  45. Plan on Prevention and Control of Geologic Disasters in Wuhan City. Wuhan Natural Resources and Planning Bureau. 2018. Available online: http://gtghj.wuhan.gov.cn/showjyh.asp?id=147594 (accessed on 16 November 2020).
  46. Abidin, H.Z.; Andreas, H.; Gumilar, I.; Fukuda, Y.; Pohan, Y.E.; Deguchi, T. Land subsidence of Jakarta (Indonesia) and its relation with urban development. Nat. Hazards 2011, 59, 1753. [Google Scholar] [CrossRef]
  47. Tu, J.; Wei, R.; Yang, G.; Liu, C.; Jin, X.; Li, H. Analysis on spatial and temporal distribution characteristics of karst collapse and its influence factors in Wuhan City of Hubei Province. Chin. J. Geol. Hazard Control 2019, 30, 68–73. [Google Scholar]
  48. Chunwu, R.; Guangzheng, L. CCTV Focus on the Settlement of the Building in Houhu of Wuhan. Available online: http://hb.ifeng.com/news/focus/detail_2013_10/14/1325441_0.shtml (accessed on 14 October 2013).
  49. Lambe, T.W.; Whitman, R.V. Soil Mechanics; John Wiley & Sons: Hoboken, NJ, USA, 1969. [Google Scholar]
  50. Fox, P.J. Consolidation and Settlement Analysis. In The Civil Engineering Handbook; CRC press: Boca Raton, USA, 2003; Volume 2. [Google Scholar]
  51. Gibson, R.E. The progress of consolidation in a clay layer increasing in thickness with time. Geotechnique 1958, 8, 171–182. [Google Scholar] [CrossRef]
  52. Cai, J.; Feng, X.; Li, T.; Liang, M. Research on groundwater level variation and ground subsidence caused by foundation pit dewatering at the Wuhan first terrace. Hydrogeol. Eng. Geol. 2018, 45, 90–95. [Google Scholar]
Figure 1. (a) Imagery map of Wuhan, where the coverage of three SAR datasets used in this study and district boundaries of Wuhan are outlined. The research area is outlined by a red rectangle which includes seven main urban zones: Jianghan (JH), Jiangan (JA), Qiaokou (QK), Hanyang (HY), Wuchang (WC), Hongshan (HS), and Qingshan (QS). The inset map indicates the geographic location of Wuhan. (b) Imagery map of Wuhan, where carbonate rock belts, mucky soft soil, reference point (purple star), leveling benchmarks (dark brown dots), aquifer wells (pink dots) are marked. Hankou area includes JH, QK, and JA, Wuchang area includes WC, HS, and QS. HY is affiliated with Hanyang area.
Remotesensing 12 03788 g001aRemotesensing 12 03788 g001b
Figure 2. Average annual vertical deformation velocity maps of Wuhan in (a) 2007–2010, (b) 2008–2010, (c) 2015–2019. Positive values (dark blue) represent uplift and negative values (warm colors) represent subsidence. The red rectangle in (a) outlines the extent of the Envisat coverage. (d) The time-series variations of the vertical motion at the reference point (IGS station–WUHN) during 2007–2019. Note the abrupt changes around September 2016 and the end of 2019 might reflect antenna or other unknown changes; the station was rarely in operation since late 2016.
Remotesensing 12 03788 g002
Figure 3. Time-series land subsidence of eight typical slowly decorrelating filtered phase (SDFPs) points (marked by green rectangles in Figure 1b in six main subsidence zones (purple ellipses in Figure 2c) including HHW, HH, BSZ, QK, SH, JH, QKN, and QS from 2015 to 2019.
Remotesensing 12 03788 g003
Figure 4. Annual vertical deformation velocity maps of ALOS-1 (a) and Envisat (b) from 2008 to 2010. Histogram of differences in vertical velocity derived from ALOS-1 and Envisat (c).
Remotesensing 12 03788 g004
Figure 5. (a) Comparison of leveling observations with InSAR results from 2016 to 2017. The locations of leveling benchmarks are marked by dark brown dots in Figure 1b. (b) Scatter diagram between leveling observations and InSAR results (correlation coefficient R = 0.89), the standard deviation between the two observations is 2 mm.
Remotesensing 12 03788 g005
Figure 6. Annual vertical deformation velocity maps of Hankou (highlighted in yellow polyline) in 2007–2010 (a), 2015–2017 (b), and 2017–2019 (c) derived from ALOS-1 (a) and Sentinel-1 (b,c) respectively. Three main large subsidence zones are marked by purple ellipses in (b): JH, HH, and QK. Negative values (warm colors) represent the subsidence and positive values (dark blue) represent the uplift. Panels (d), (e), and (f) show the road and bridge damage located in the eastern part of HH.
Remotesensing 12 03788 g006
Figure 7. Annual deformation velocity along the profile AA’ from 2007 to 2010, 2015 to 2019. The location of profile is indicated by a red line (AA’) in Figure 6a.
Remotesensing 12 03788 g007
Figure 8. Annual vertical deformation velocity maps of Wuchang (highlighted in yellow polyline) in 2007–2010 (a), 2015–2017 (b), and 2017–2019 (c) derived from ALOS-1 (a) and Sentinel-1 (b,c). Three main large subsidence zones are marked by purple ellipses in (b): BSZ, SH, and QS. Negative values (warm colors) represent the subsidence and positive values (dark blue) represent the uplift.
Remotesensing 12 03788 g008
Figure 9. (a) Deformation velocity map along 9 metro lines derived from Sentinel-1 datasets during 2015–2019. Regions (b), (c), (d) marked by purple dashed rectangles are HH, JH, QS subsidence zones along metro lines correlating to images in panels (b), (c), and (d), respectively.
Remotesensing 12 03788 g009
Figure 10. Imagery map of Wuhan, where carbonate rock belts and mucky soft soil are outlined and annual vertical deformation velocity of 2015–2019 are shown. Negative values (warm colors) represent the subsidence and positive values (dark blue) represent the uplift.
Remotesensing 12 03788 g010
Figure 11. (a) and (d) are the optical images from Google Earth in 2016 and 2019 whose location is in eastern HH; (b) and (e) are the vertical velocity maps from 2015 to 2016 and 2016 to 2019 respectively; (c) and (f) are the difference of SAR intensity maps of eastern HH during 2015–2016 and 2016–2019.
Remotesensing 12 03788 g011
Figure 12. Comparison of InSAR deformation time series with respect to four SDFP points (W1–W4) marked by dark blue triangles in Figure 1b with water level changes of Yangtze river (pink dotted line) from 2015 to 2019, daily precipitation marked by grey line, referring to the right y axis.
Remotesensing 12 03788 g012
Figure 13. Comparison of groundwater level variations about the five observation wells (red dot lines) with InSAR results (black dot lines) from 2017 to 2019. The groundwater wells are marked by pink dots in Figure 1b, daily precipitation marked by grey line.
Remotesensing 12 03788 g013
Table 1. Previous studies of Wuhan land subsidence.
StudyMethodDatasetKey Results
Bai et al. (2016)SBAS-InSAR12 TerraSAR images (200910–201004)(1) Cross-validation between InSAR and water level records of the Yangtze River.
(2) Intensive municipal construction and industrial production are the main factors to land subsidence.
(3) The subsidence areas associated with carbonate karst geology.
Xu (2016)The fuzzy closeness degree and analytic hierarchy processGeophysical survey, Well, Drilling (2009, 2014, 2015)(1) The distribution of sinkhole in Wuhan.
(2) The main factors of the sinkhole in Wuhan are natural factors and anthropogenic influence.
Costantini et al. (2016)InSAR PSP approach45 Cosmo-SkyMed images (201306–201406)(1) The standard deviation of the differences between the leveling and InSAR measurements is about 5 mm.
(2) The average velocity of urban area from −80 mm/a to 40 mm/a.
Zhou et al. (2017)SBAS-InSAR15 Sentinel-1 Images
(201504–201604)
(1) The maximum subsidence has shifted from Wuguang to Houhu area.
Zhang et al. (2019)SBAS-InSAR20 Radarsat-2 images (201510–201806)(1) SBAS-based results conclude urban construction is a driving factor causing subsidence.
Table 2. SAR data and their imaging parameters.
SensorALOS-1Sentinel-1Envisat
BandLCC
Heading−12.7−12.7−11.7
Incidence angle38.7539.2522.8
Track455113483
Wavelength23.6 cm5.55 cm5.66 cm
PolarizationHH, HVVV, VHVV
Number of Scenes191043
Time range
(yyyy-mm-dd)
20070115–2010102620150411–2019062520081221, 20090125, 20100530
Publisher’s Note: MDPI stays neutral with regard to jurisdictional claims in published maps and institutional affiliations.

