1. Introduction
KOMPSAT (Korea Multi-Purpose Satellite)-3A is a very high-resolution optical satellite launched in March 2015 that provides panchromatic (PAN) images, Multi-Spectral (MS) images and Medium wave Infrared (MIR) images. In particular, KOMPSAT-3A MIR images have few counterparts of similar quality around the world. Therefore, KOMPSAT-3A MIR images are highly likely to be used in various fields such as the study of the thermal island phenomenon, drought monitoring, and analysis of unusual objects in urban areas where they are difficult to visually identify.
On the other hand, researchers in the field of remote sensing are currently studying opportunities and possibilities to mathematically combine thermal or MIR images with visible images. Such data fusion research is conducted to expand the utilization of thermal or MIR images taken from satellites or to provide various information simultaneously by combining two images that provide different information. For satellites that only record PAN images, such as EROS-A, EROS-B, and Worldview-1, or satellites that do not take PAN images, such as Rapid-Eye, data fusion technology can be applied to expand the scope of their utilization [
1]. Other lines of research study replacing PAN images with high-resolution SAR images [
1,
2,
3], for instance for classification tasks in urban areas [
4] or to identify Antarctic ice [
5]. In the case of infrared images that provide radiant energy information from the earth’s surface, the amount of radiation energy is less than that of visible wavelengths by the Planck function and Stefan-Boltzmann law. The ground sample distance (GSD) ratio between the PAN channel of Lansat-8 OLI/TIRS and the infrared channel is 1:6.7, but for KOMPSAT-3A it is 1:10. Therefore, studies have been conducted to provide both spatial details provided by PAN and surface temperature information provided by infrared channels through data fusion technology. In [
6] an optimization method for fusion coefficients to improve spatial resolution of LANDSAT 8 TIR (Thermal Infrared) is proposed. A Thermal sharpening (TsHARP) algorithm using normalized difference vegetation index (NDVI) of multispectral channels was studied in [
7,
8]. Other studies have been carried out for injecting spatially detailed information of PAN into an infrared channel image mathematically [
2] or for producing a fusion image using the technique of sparse representation [
9,
10]. Other authors worked on adjusting the injection ratio by applying the moving window technique to take into account the characteristics of features (urban, agricultural, forest) present in the images [
11]. Recently, machine learning-based fusion methods have been studied in order to improve the resolution of infrared channel images by learning the relationship between multi-spectral based index maps (ex. NDVI, Enhanced Vegetation Index (EVI), normalized difference water index (NDWI), normalized difference moisture index (NDMI), and infrared channel images [
12].
As such, various studies are continuously being conducted to improve the spatial resolution of TIR images. However, no research has been yet conducted on high-resolution optical images such as KOMPSAT-3A. In addition, existing methods have been applied to TIR images with wavelength band 10 μm or higher, and it is difficult to apply them directly to MIR images with a wavelength band between 3.3 to 5.2 μm.
In this paper, novel spatial sharpening techniques are proposed that is specifically designed to suit KOMPSAT-3A MIR images with the aim of fully exploiting the merging capabilities in KOMPSAT-3A. The proposed methods are similar to the Multi Sensor Fusion (MSF) [
6] and Guide Filter Based Fusion (GF) [
13] methods in that the high frequency component related mostly to spatial information is used for merging KOMPSAT-3A MIR images. It differs from the previous methods as optimal scaling factor parameters and the moment matching method are used. These methods adopt the extraction of the tactics of appropriately controlling the balance between spatial and spectral resolutions. The superior quality of the newly introduced methods in comparison with the currently known ones is proven by both visual analysis and several standard tests.
The remainder of the paper is organized as follows.
Section 2 describes in detail the mathematical formulae for the new methods of merging KOMPSAT-3A MIR and PAN images and their derivation. In
Section 3, the fusion results of the proposed methods using KOMPSAT-3A MIR and PAN images are presented and they are compared in
Section 4 with those obtained using previous methods. Finally, conclusions are provided in
Section 5.
2. Methods
The purpose of this study is to improve the resolution of KOMPSAT-3A MIR images to the resolution of PAN images through mathematical methods. To this end, this study aims to improve convergence performance by modifying existing techniques to suit KOMPSAT 3A MIR.
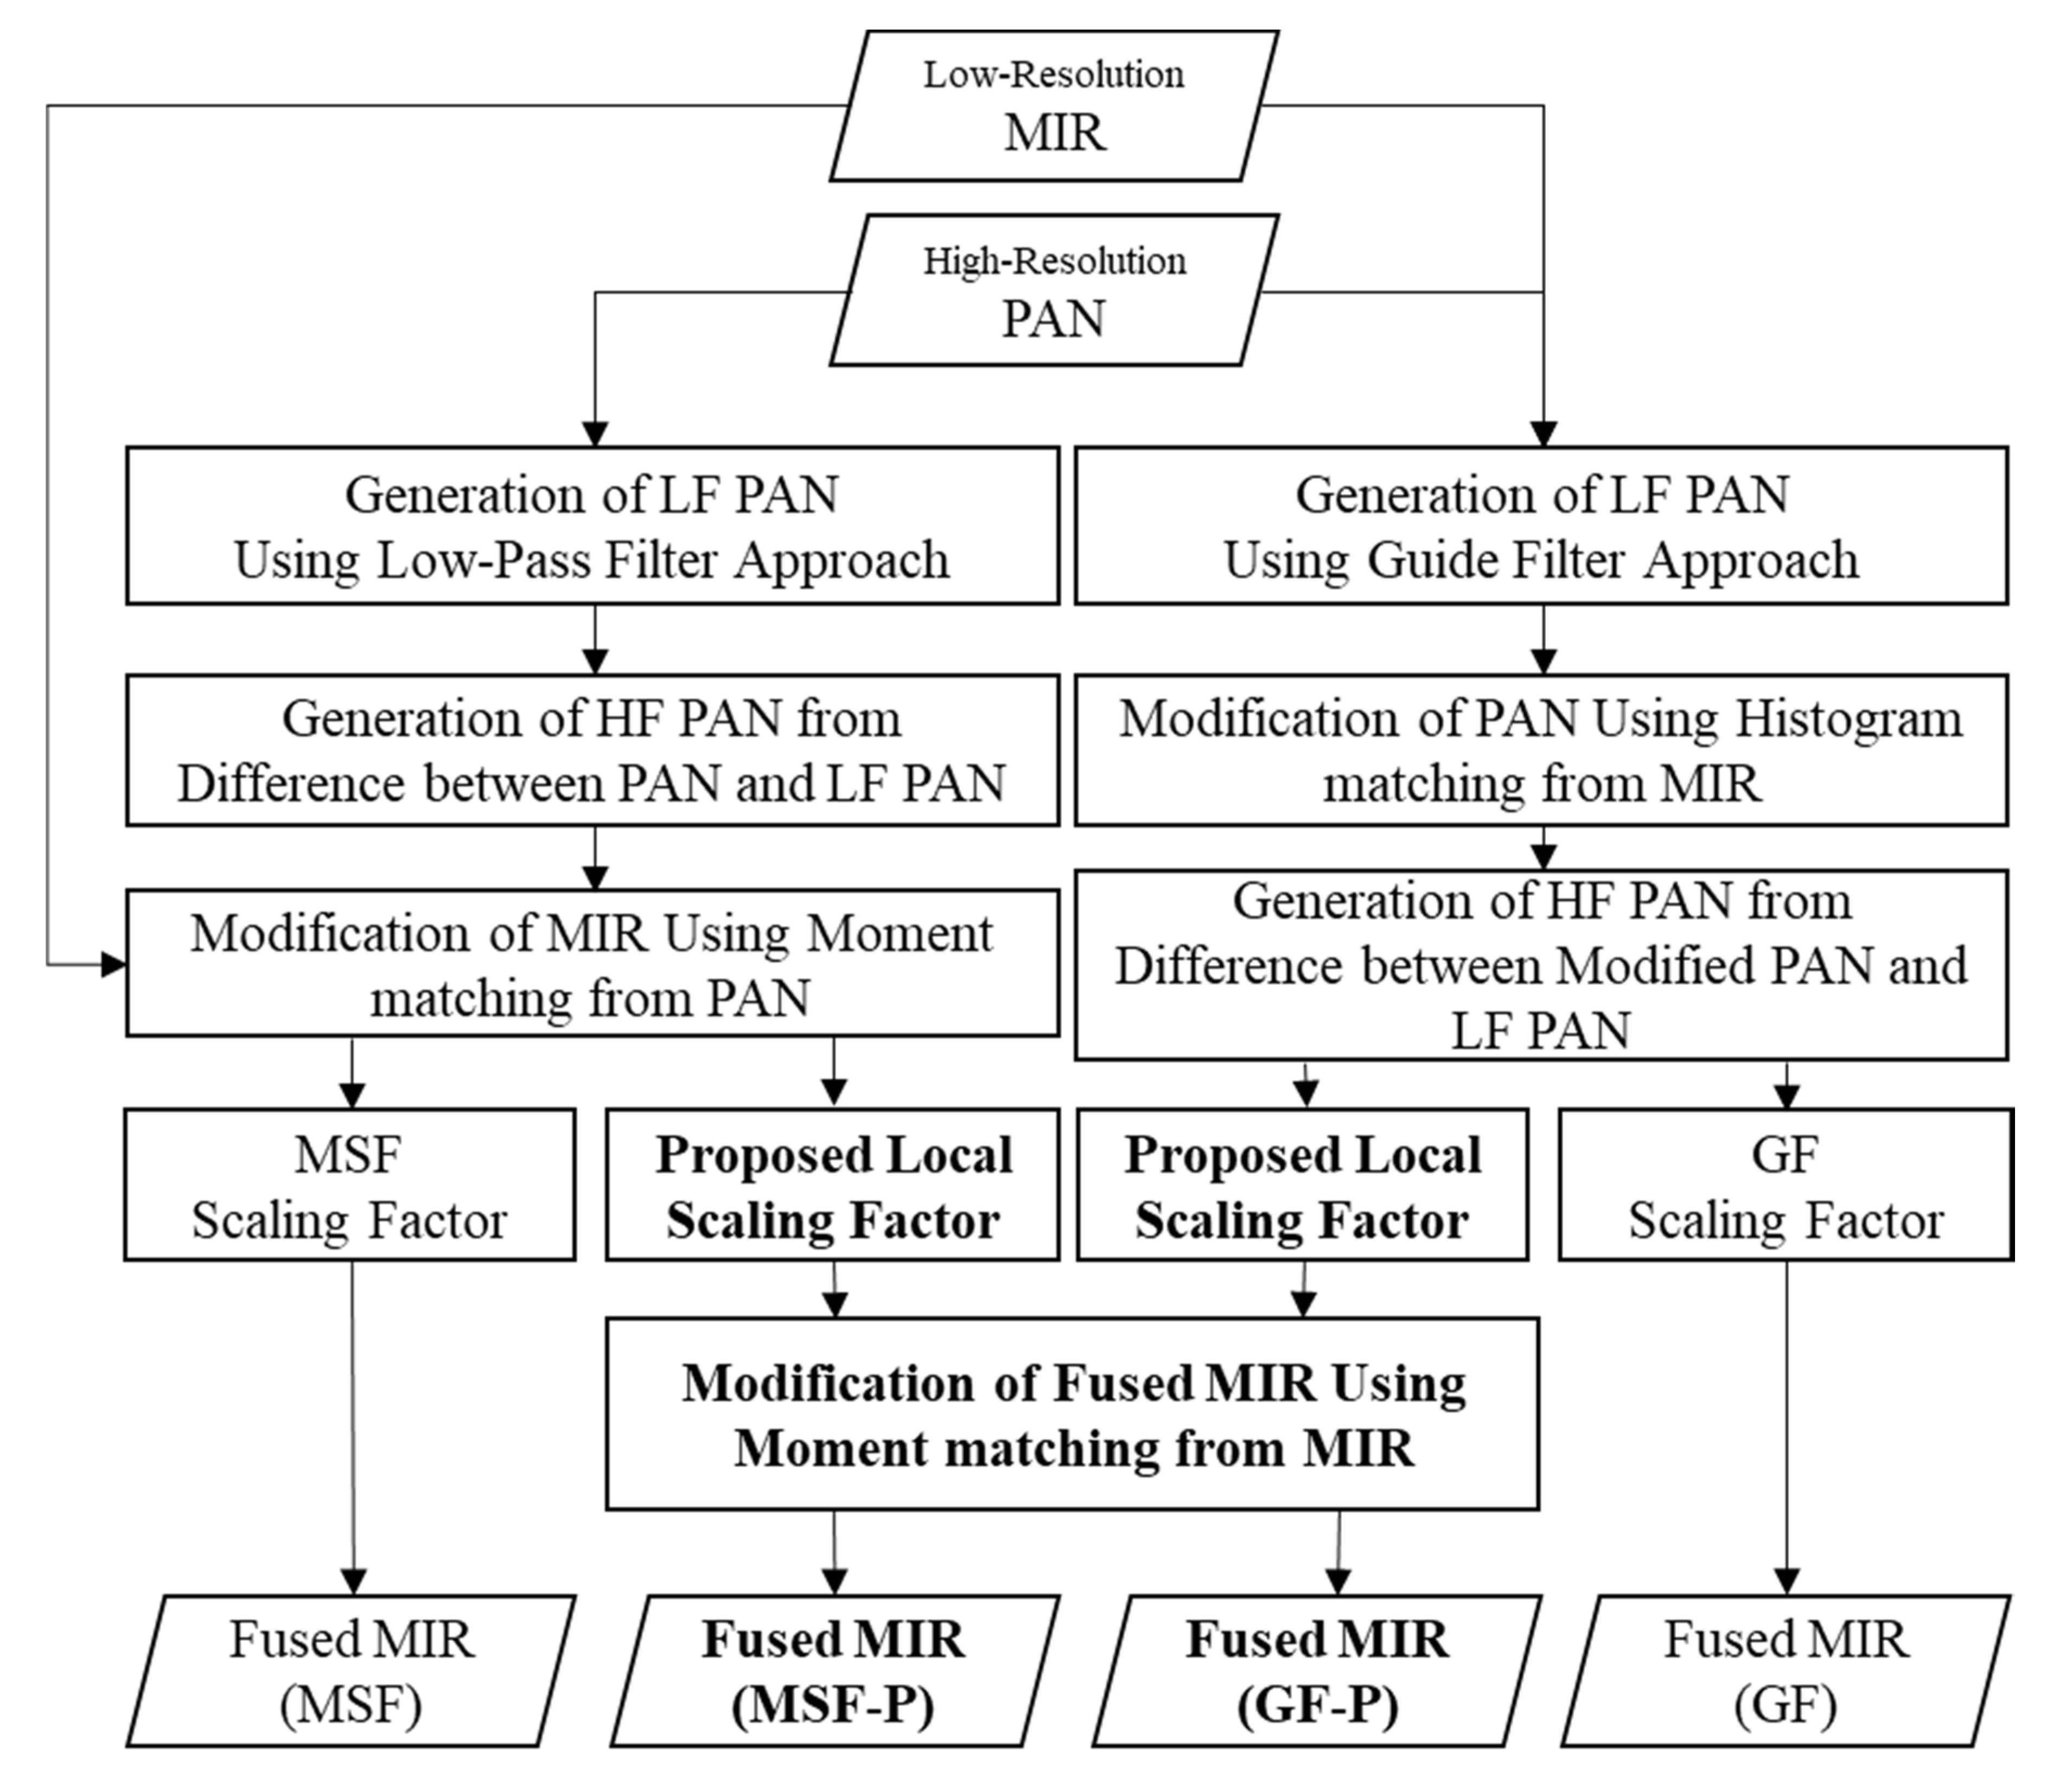
Figure 1 summarizes the characteristics of proposed and previous methods.
Previous methods used in similar studies are MSF method [
6] and GF method [
13]. The difference between the methods proposed in this study and the previously used ones lies in the application of the moment matching and local scaling factor optimized for KOMPSAT 3A. The proposed methods in this paper are named MSF-P(Proposed) and GF-P, respectively.
The fused MIR image (
can be defined by adding the high frequency component (
) of a PAN image to the interpolated MIR image (
as follows:
where
is the scaling factor to appropriately control the balance between the spatial and spectral resolutions. In addition, this parameter controls the amplitude of the high frequency(HF) PAN image applied to fused MIR image. On the other hand,
can be also defined using the low frequency(LF) PAN image as
Various fusion methods can be classified according to the extraction method of the HF PAN image () and the scaling factor (α) applied.
2.1. Multi Sensor Fusion (MSF) Approach
In the MSF method [
6] is developed for improving the spatial resolution of LANDSAT 8 TIR images. In particular, it was intended to estimate the optimal scaling factor by assessing the quality of the fused image with changes in the fusion coefficient. The following equation is a modified scaling factor for this study [
6].
where N and M are the numbers of lines and pixels in the corresponding TIR image, W is the half of moving-window size and
and
are standard deviations of the samples extracted using moving-window in the HF PAN image and TIR image (
). Another feature of the MSF method is the use of modified MIR images in the fusion process. In the MSF method, the moment matching technique is applied to make the mean and standard deviation of MIR images similar to PAN. The proposed moment matching technique can be modified and expressed as follows [
6]:
The purpose of MSF method is not simply to improve the spatial resolution of TIR images, but to derive new information through the effective fusion of PAN and TIR. Thus, if the MSF method is applied to KOMPSAT-3A MIR images, the fused image may exhibit characteristics closer to the PAN images than to the MIR ones.
2.2. Guided Fiter Based Fusion (GF) Approach
In one can find a fusion technique using guided filters to improve the spatial resolution of LANDSAT 8 TIR images [
13]. If a fusion technique that improves the spatial resolution of a TIR image is applied using NDVI produced by visible near infrared (VNIR) bands, spectral distortion may occur significantly. Therefore, this study proposed a fusion technique that reduced spectral distortion by using shortwave infrared (SWIR) bands. The scaling factor proposed in the GF method can be modified and expressed as follows:
In this study, HF PAN images (
) are extracted using a guide filter [
13]. The guide filter generates a LF PAN image by using a pan image as an input image and an MIR image as a guide image. Meanwhile, in the GF method, a histogram matching technique is applied in order to change the statistics of the PAN image similarly to the TIR image. Therefore, when this technique is applied to KOMPAT-3A MIR, the fused image can exhibit characteristics closer to low-resolution MIR than to PAN.
2.3. Proposed Method
In this study, the scaling factor optimized for KOMPSAT-3A is proposed. The proposed scaling factor can effectively control the fusion of spatial information in the PAN image and spectral information in the MIR image. To determine the best scaling factor between spectral and spatial quality of the fused MIR image, the energy function can be written in the following form:
where
is the control parameter for controlling the spectral and spatial resolution of the fused MIR image, N and N are the total number of pixels and lines on PAN image coordinates, respectively,
is the image obtained by adjusting the mean and the standard deviation of the PAN image to the MIR images. In (6), the first term corresponds to the spectral ERGAS index [
14], and the second term corresponds to the spatial ERGAS index [
15]. The large
value reduces the spectral distortion of the fused MIR images, while the spatial resolution of the fused MIR images decreases. Otherwise, the small
value enlarges the spectral distortion, but it improves the spatial resolution. The energy function (6) can be rewritten using (1) as
The function
reaches its global minimum when the first partial derivative
is equal to zero, as given by
The optimal parameter
can be determined from the following equation:
This can be rewritten using (2), as given by
where Cov(X, Y) refers to the covariance of X and Y, and Var(X) indicates the variance of X. Consequently, the optimal parameter
depends on the statistical properties of the high frequency component of the PAN image and the difference between the PAN and MIR images. On the other hand, when Equation (10) is applied to GSF-P,
is modified to
and
is modified to
. If the regional characteristics in the test image are similar, it is not relevant to use the global scaling factor of Equation (10). However, if regions of different characteristics such as sea, tree, and urban areas are mixed, regional non-relationships in the images can cause color or spatial distortion in the fused image. Therefore, in this study, we tried to minimize regional distortion by extending the global scaling factor of Equation (10) to a window-based regional variable. When the local scaling factor corresponding to image coordinates
is denoted by
, its value is obtained through a
sized window operation centered on
within the image. If Equation (10) is applied to all image coordinates
, a local scaling factor image of the same size as the PAN image can be obtained. Because the local scaling factor image by using Equation (10) is calculated as the value obtained from a window patch of size
, unstable distortion can occur if the window size is too small or the luminance value is very uniform, which happens for instance in case of a river or a forest. In this study, a regional fusion coefficient was derived by applying a 15 × 15 window by an empirical method. On the other hand, the initial fused image produced by the proposed method applies the steps to adjust the mean and standard deviation similarly to the low-resolution MIR images (see
Figure 1). These moment matching techniques can be applied by modifying expression (4).
2.4. Quality Assessment
A qualitative assessment of the proposed methods were achieved using the image quality index (Q4), the cross correlation index (CC), and the relative global dimensional synthesis error (ERGAS). The Q4 index was proposed in [
16] for a quality measurement of the fused image. This index is a generalized version of the Q index based upon structural similarity [
17] using the theory of quaternions [
18]. The Q4 index takes real values in the range 0–1, where 1 indicates the ideal value of Q4. If the value of the Q4 index is close to 1, then the spectral quality of the fused image is high. The CC index is defined by the cross correlation between fused image and its reference image. It reflects the similarity of spectral information. If the two images are correlated, the CC is close to 1, which implies that the spectral character of the original image was preserved well.
The ERGAS index was proposed in [
14] to evaluate the spectral quality of the fused image. This index is calculated from the root mean square errors (RMSE) between the original and the fused images. The lower the spectral distortion of the fused image, the lower is the ERGAS index. If the ERGAS is zero, it means that the original and the fused images are the same. Since this index can measure only the spectral distortion of the fused image, it is called spectral ERGAS. The spatial ERGAS was proposed in [
15] to evaluate the spatial quality of the fused image. It is calculated from the RMSE between the histogram-adjusted PAN image and the fused image. If the spatial ERGAS index is low, it indicates that the fused image carries the detailed spatial information of the original PAN image.
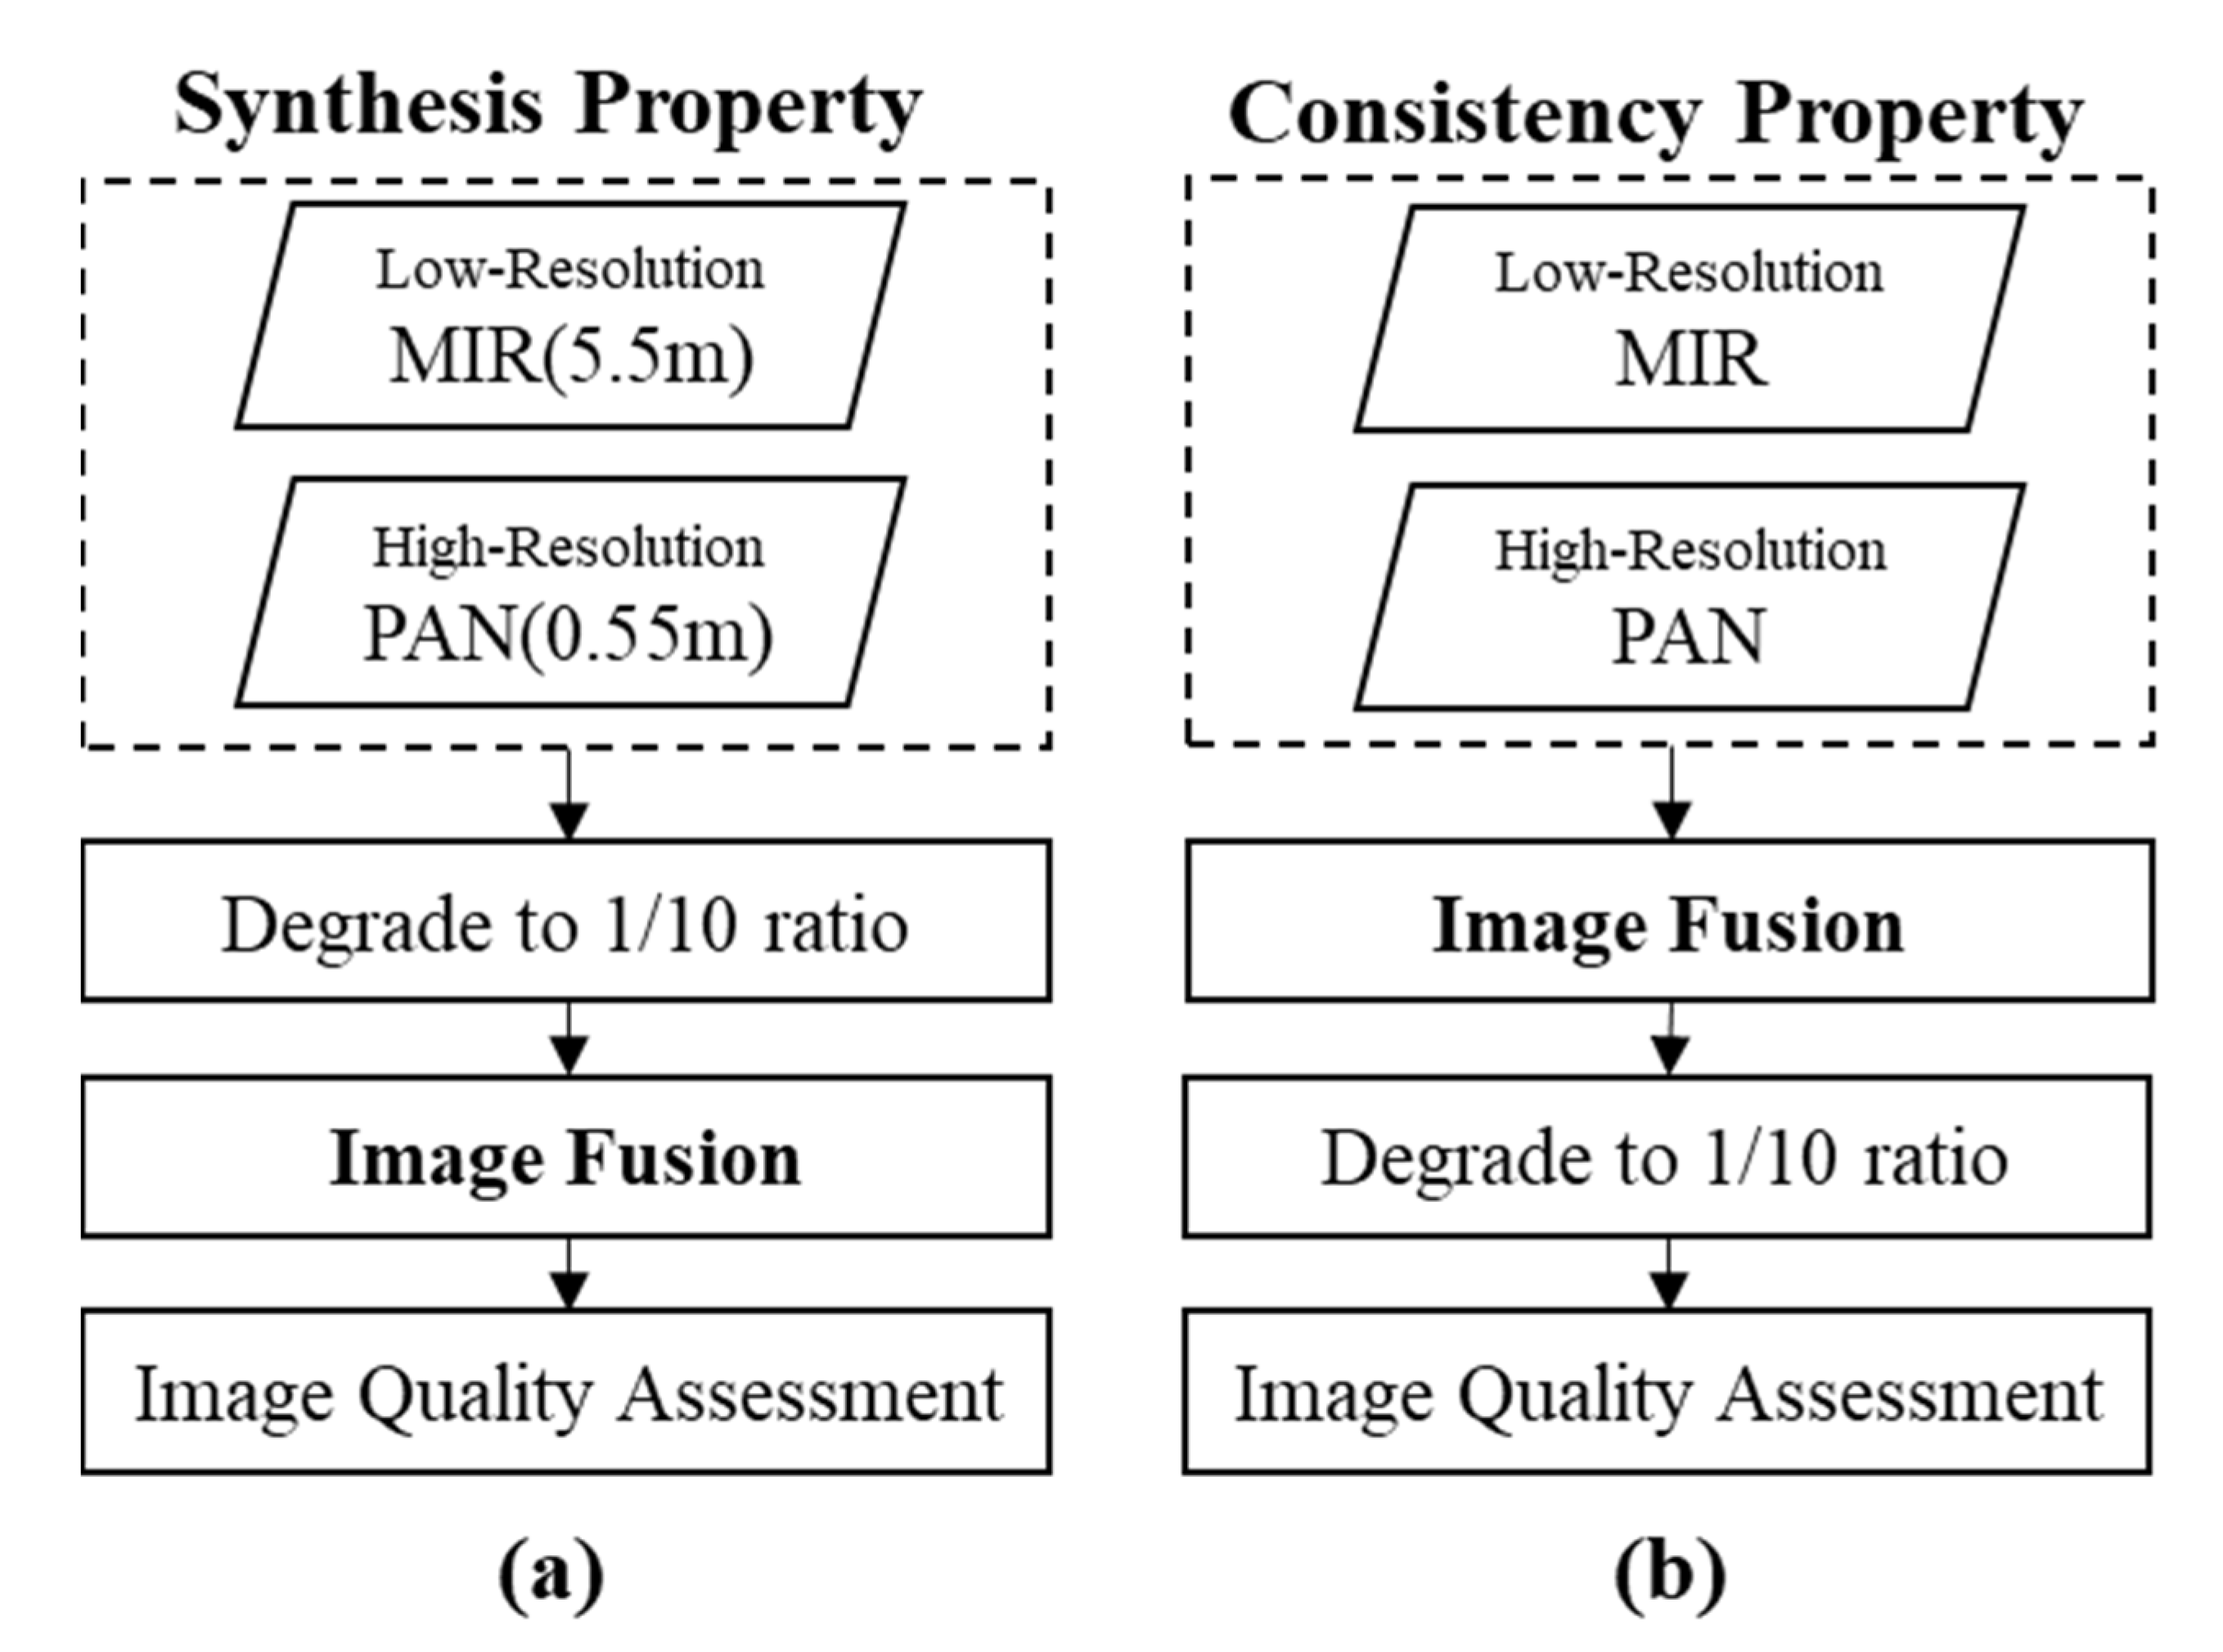
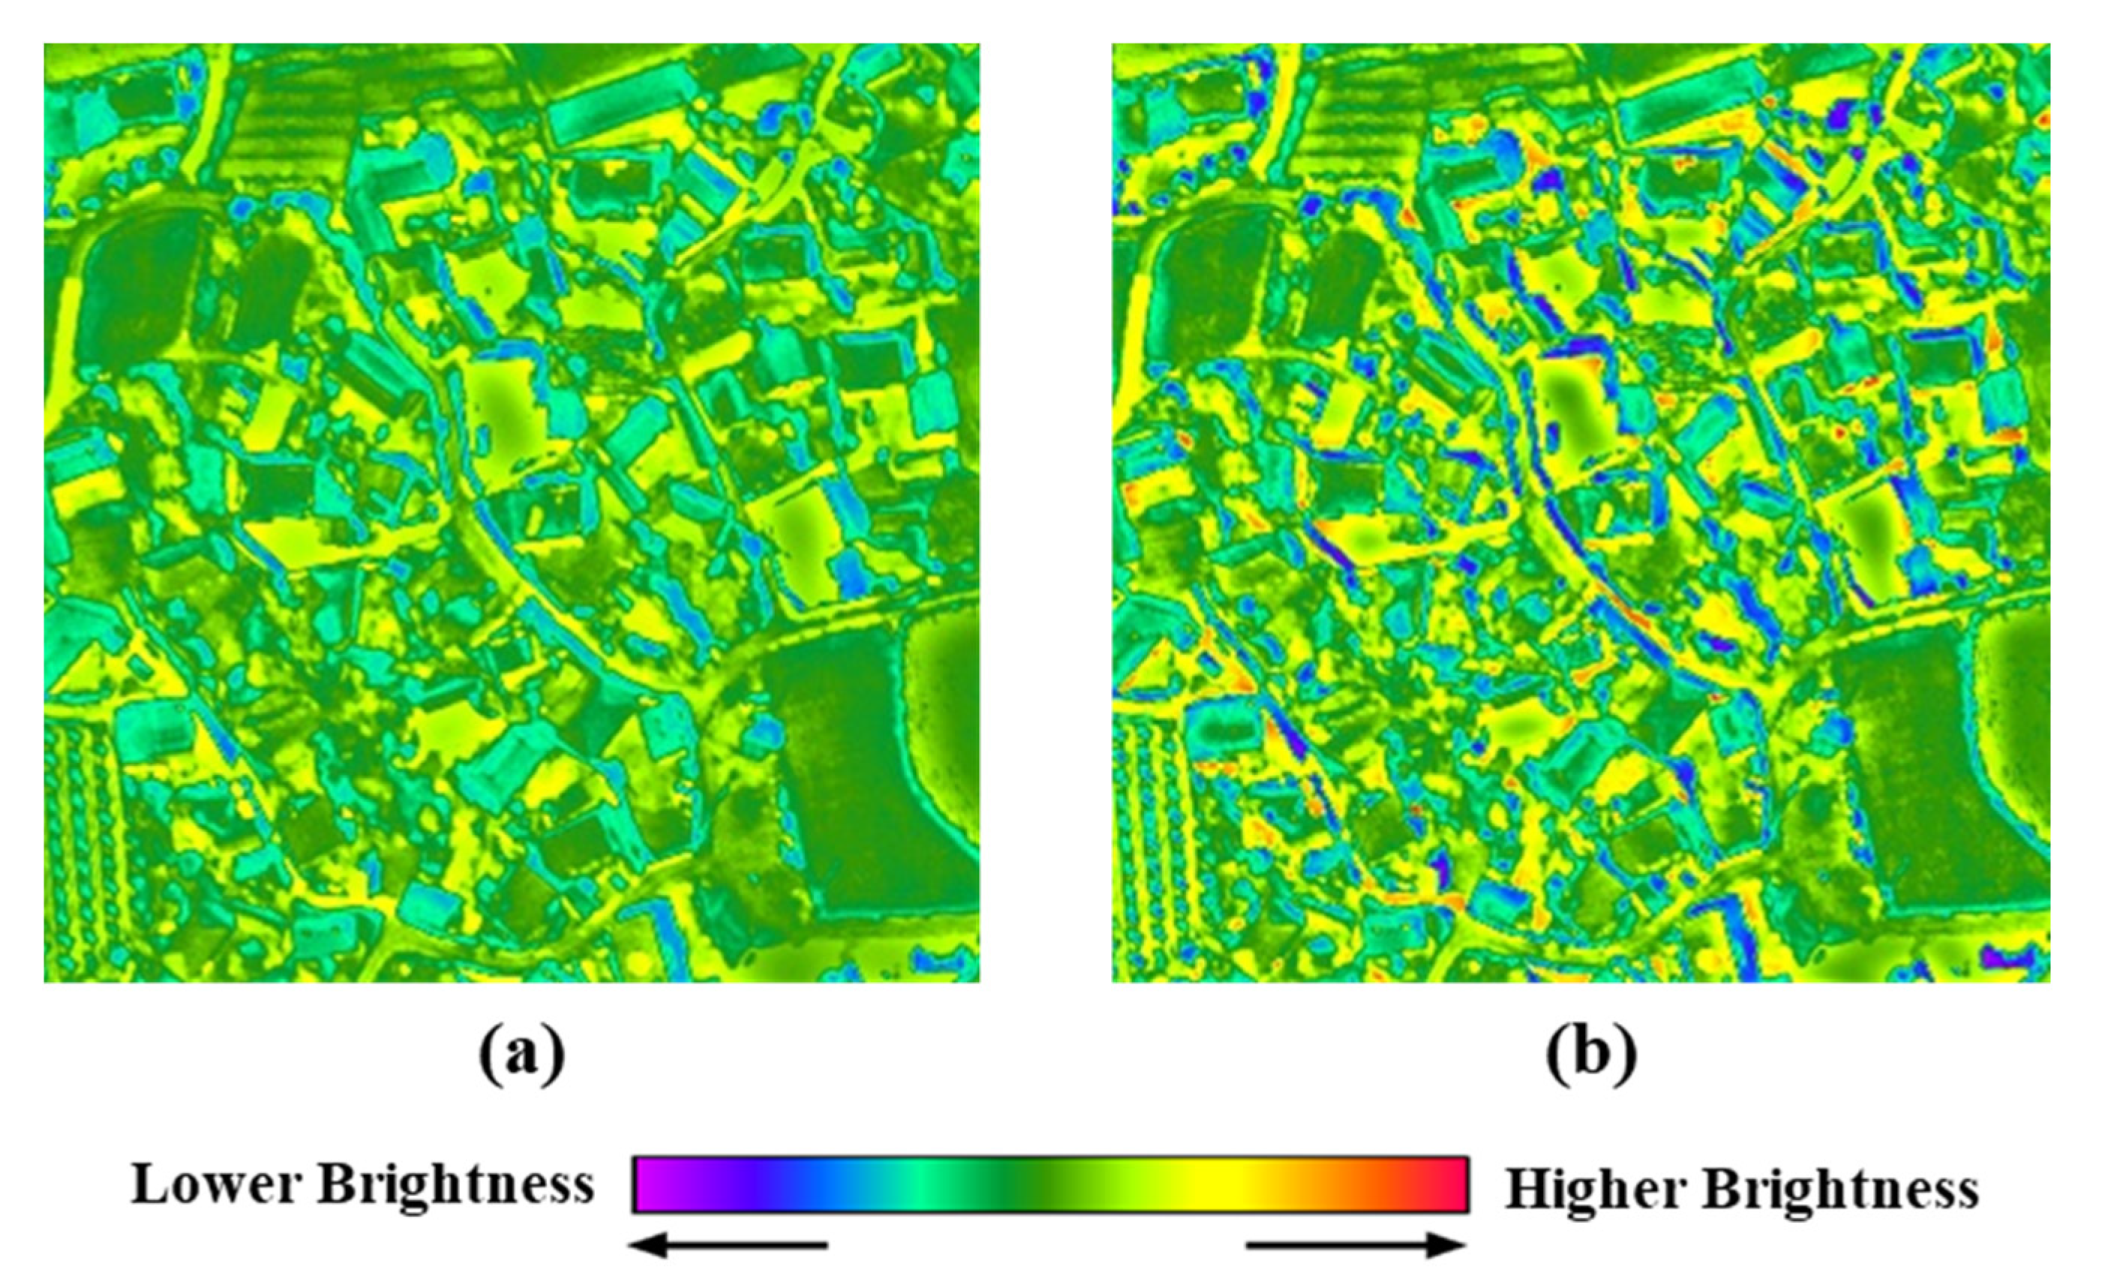
There are other two validation methods, the synthesis property and consistency property, that are mainly used to evaluate the quality of the fused image (see
Figure 2) [
19,
20]. The synthesis property considers that the fused image should be as close to the reference image as possible. However, at the full scale, the synthesis property can’t measure the differences between them, so the tested images need to be degraded by the scale ratio between the pixel sizes of the PAN and MIR images. By using degraded images, the degraded fused image is compared with the original observed MIR image as a reference. Next, the consistency property shows the degree to which the spatial degraded fused image is identical to the original observed MIR. MTF-filter method [
21] and spline interpolation were applied for image degradation.
4. Discussion
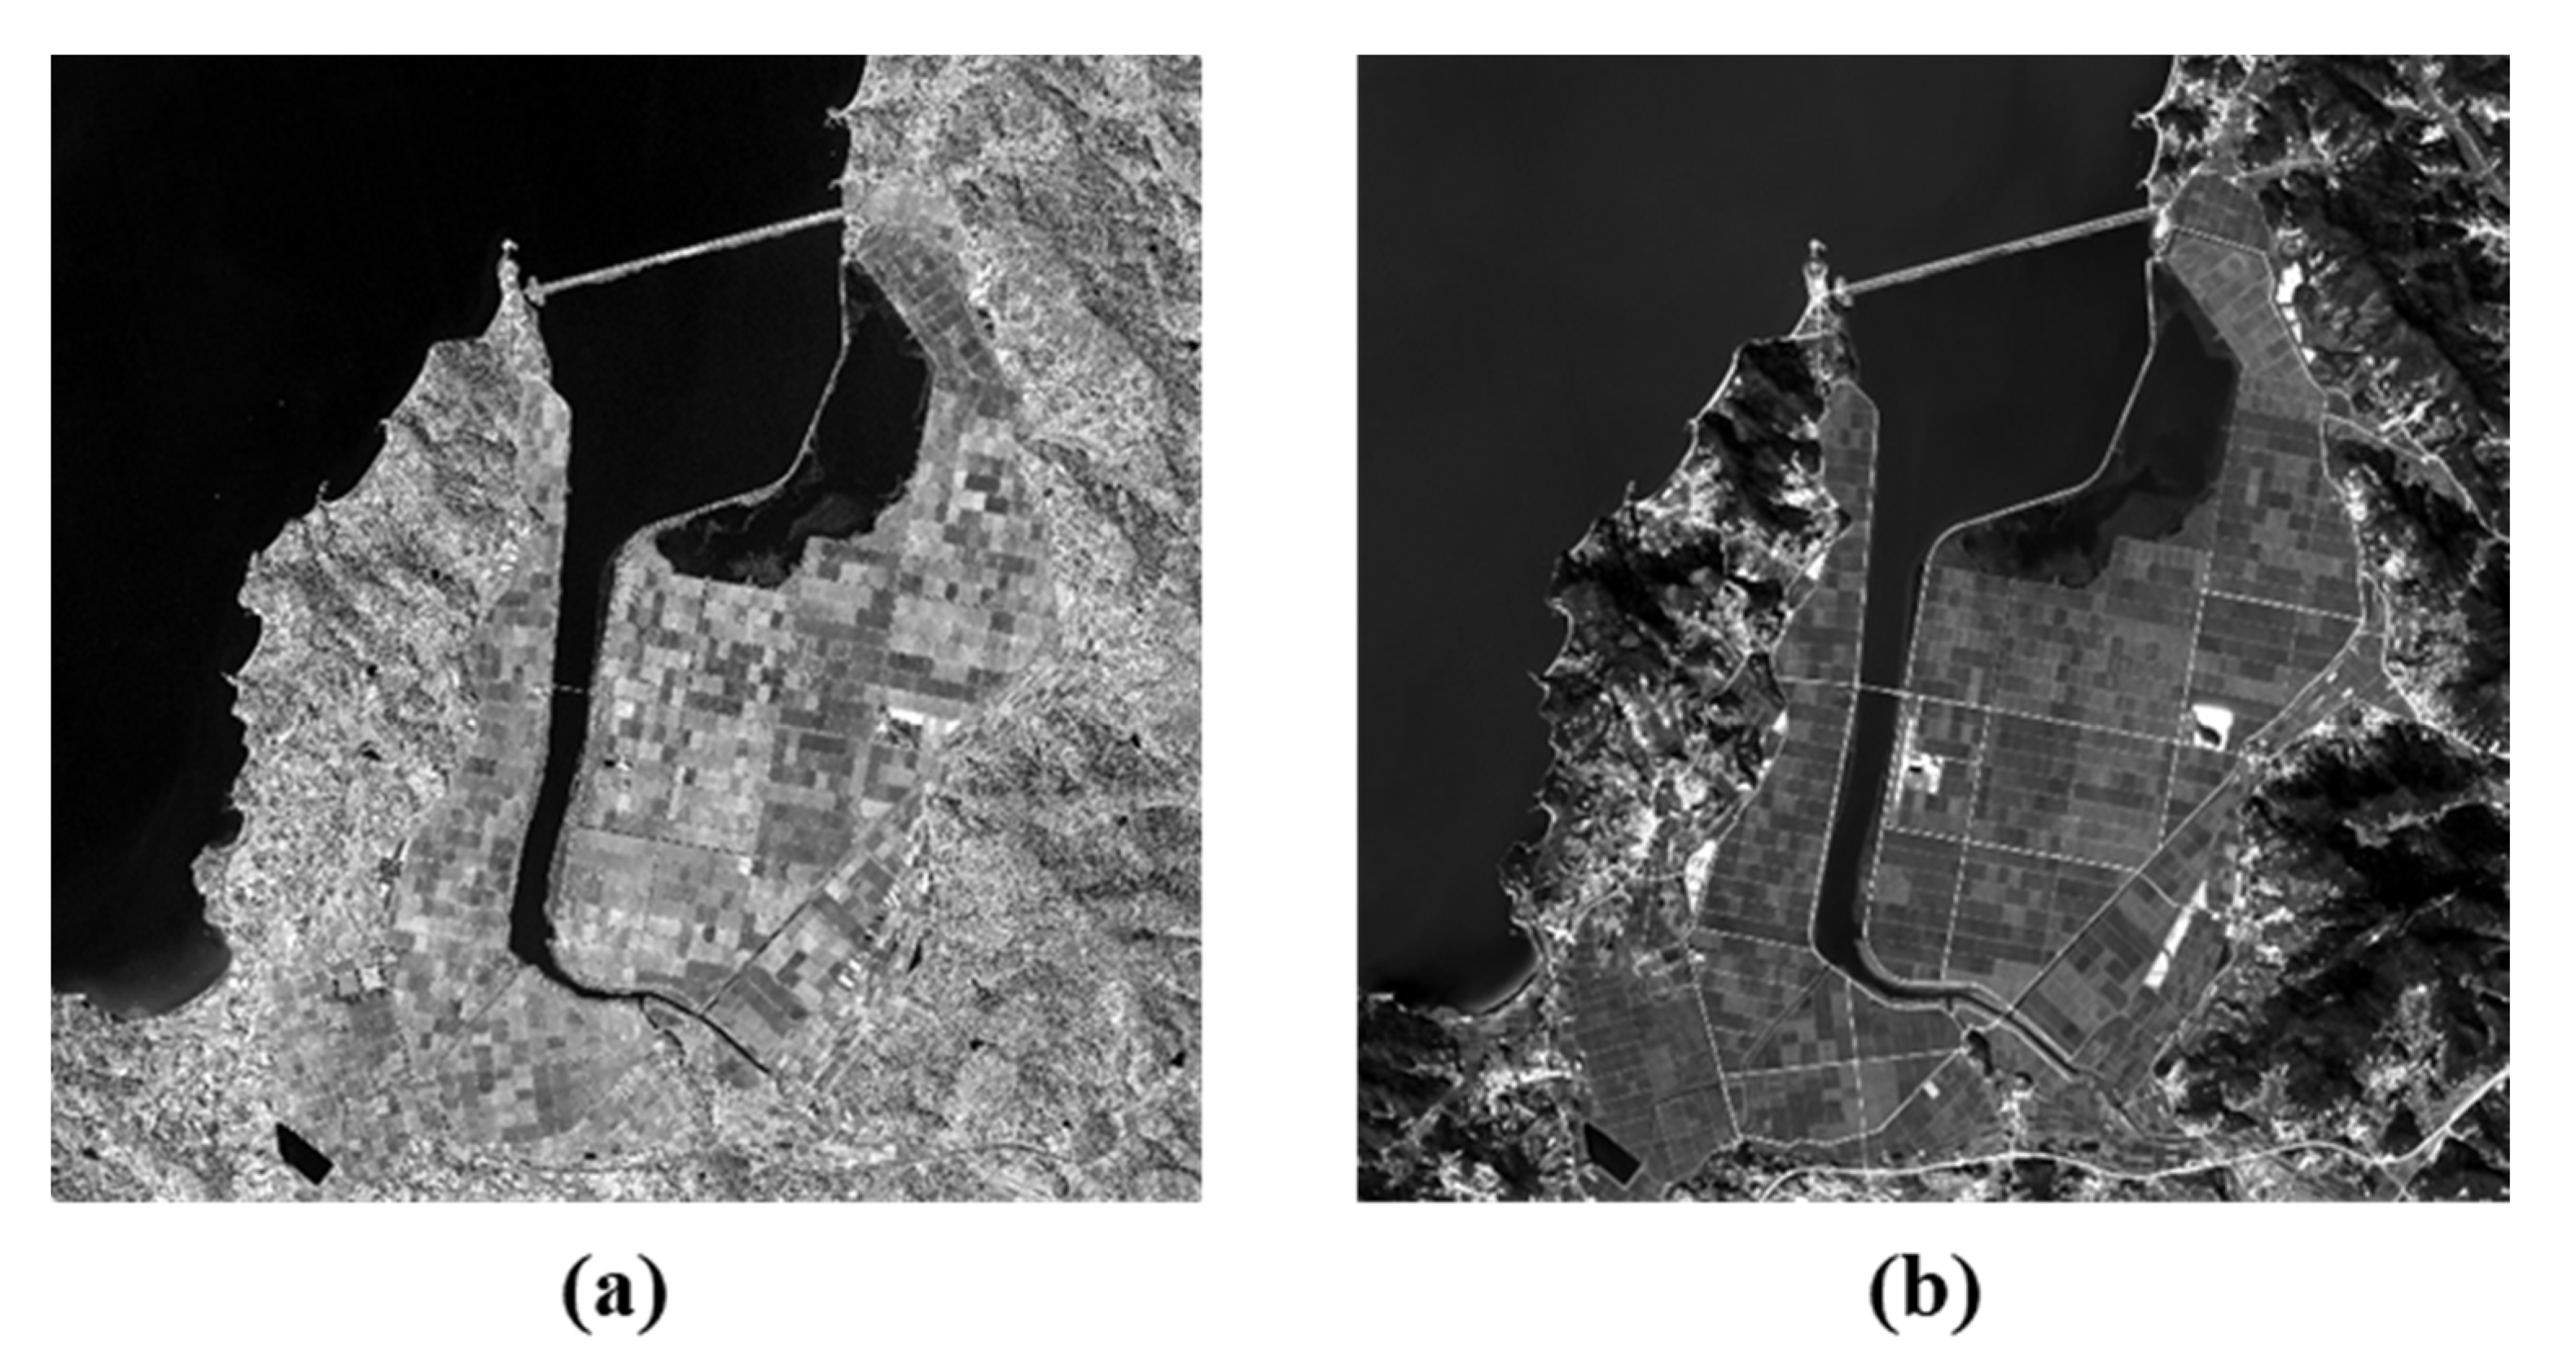
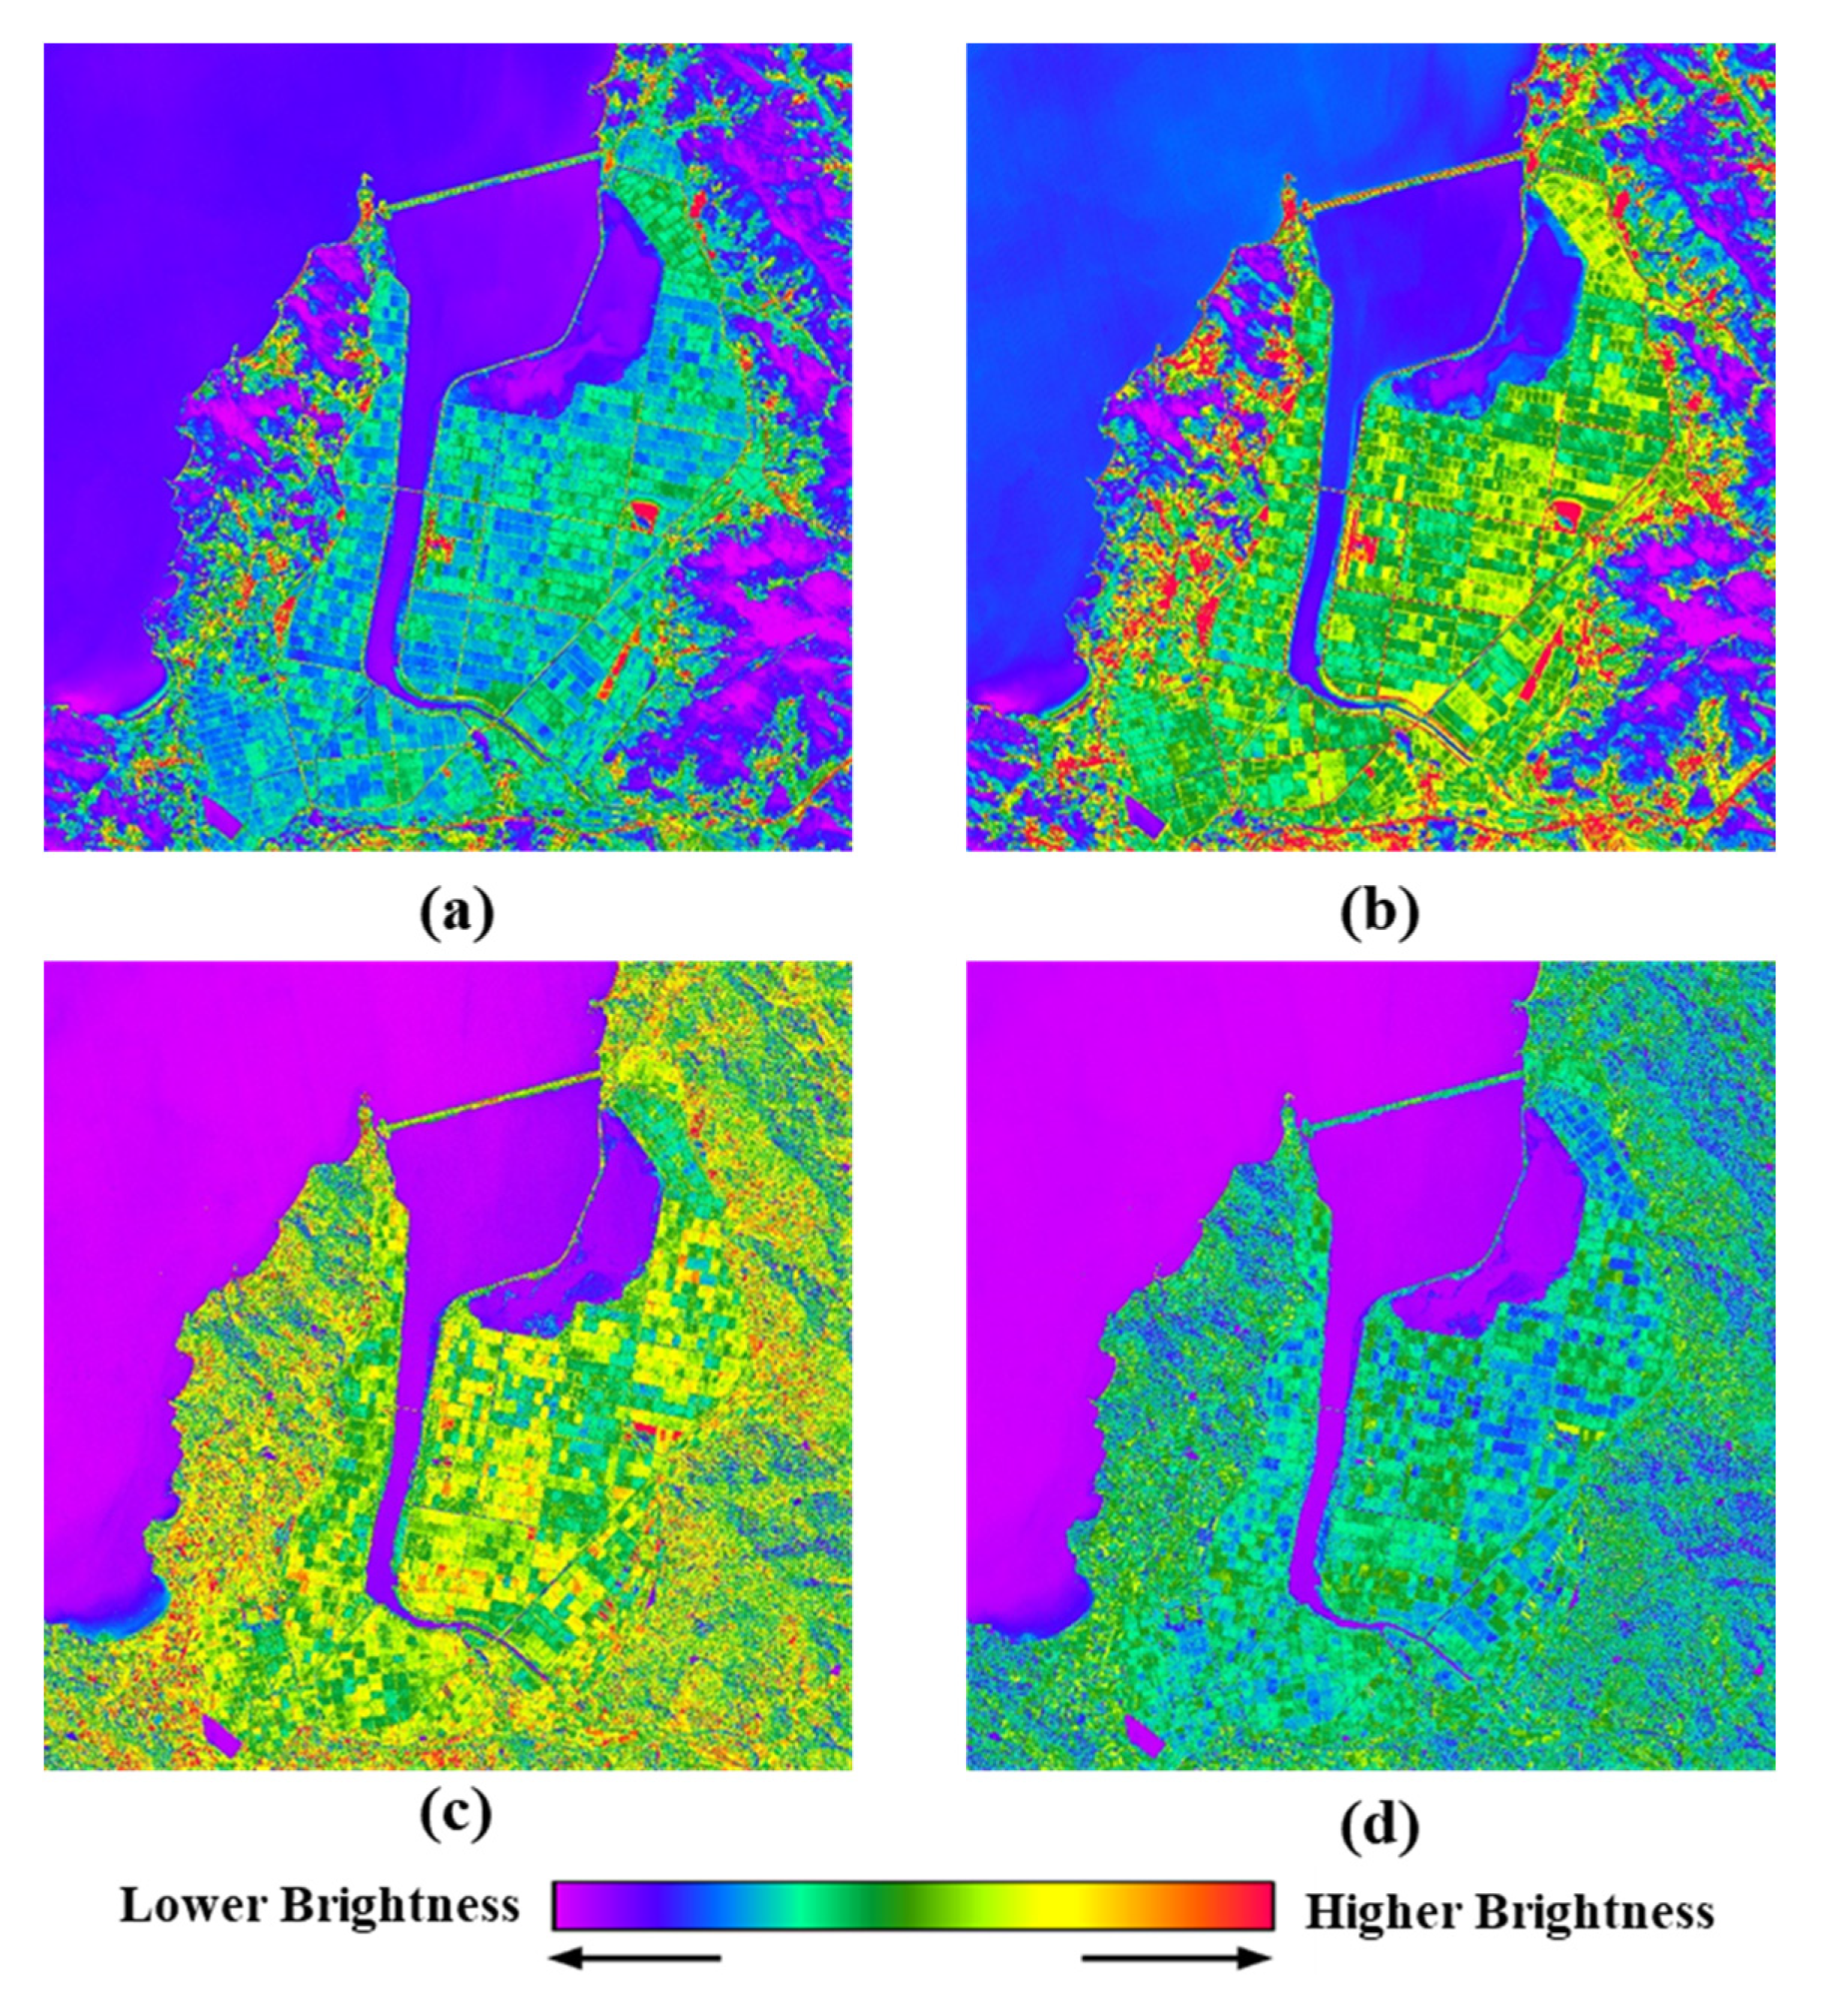
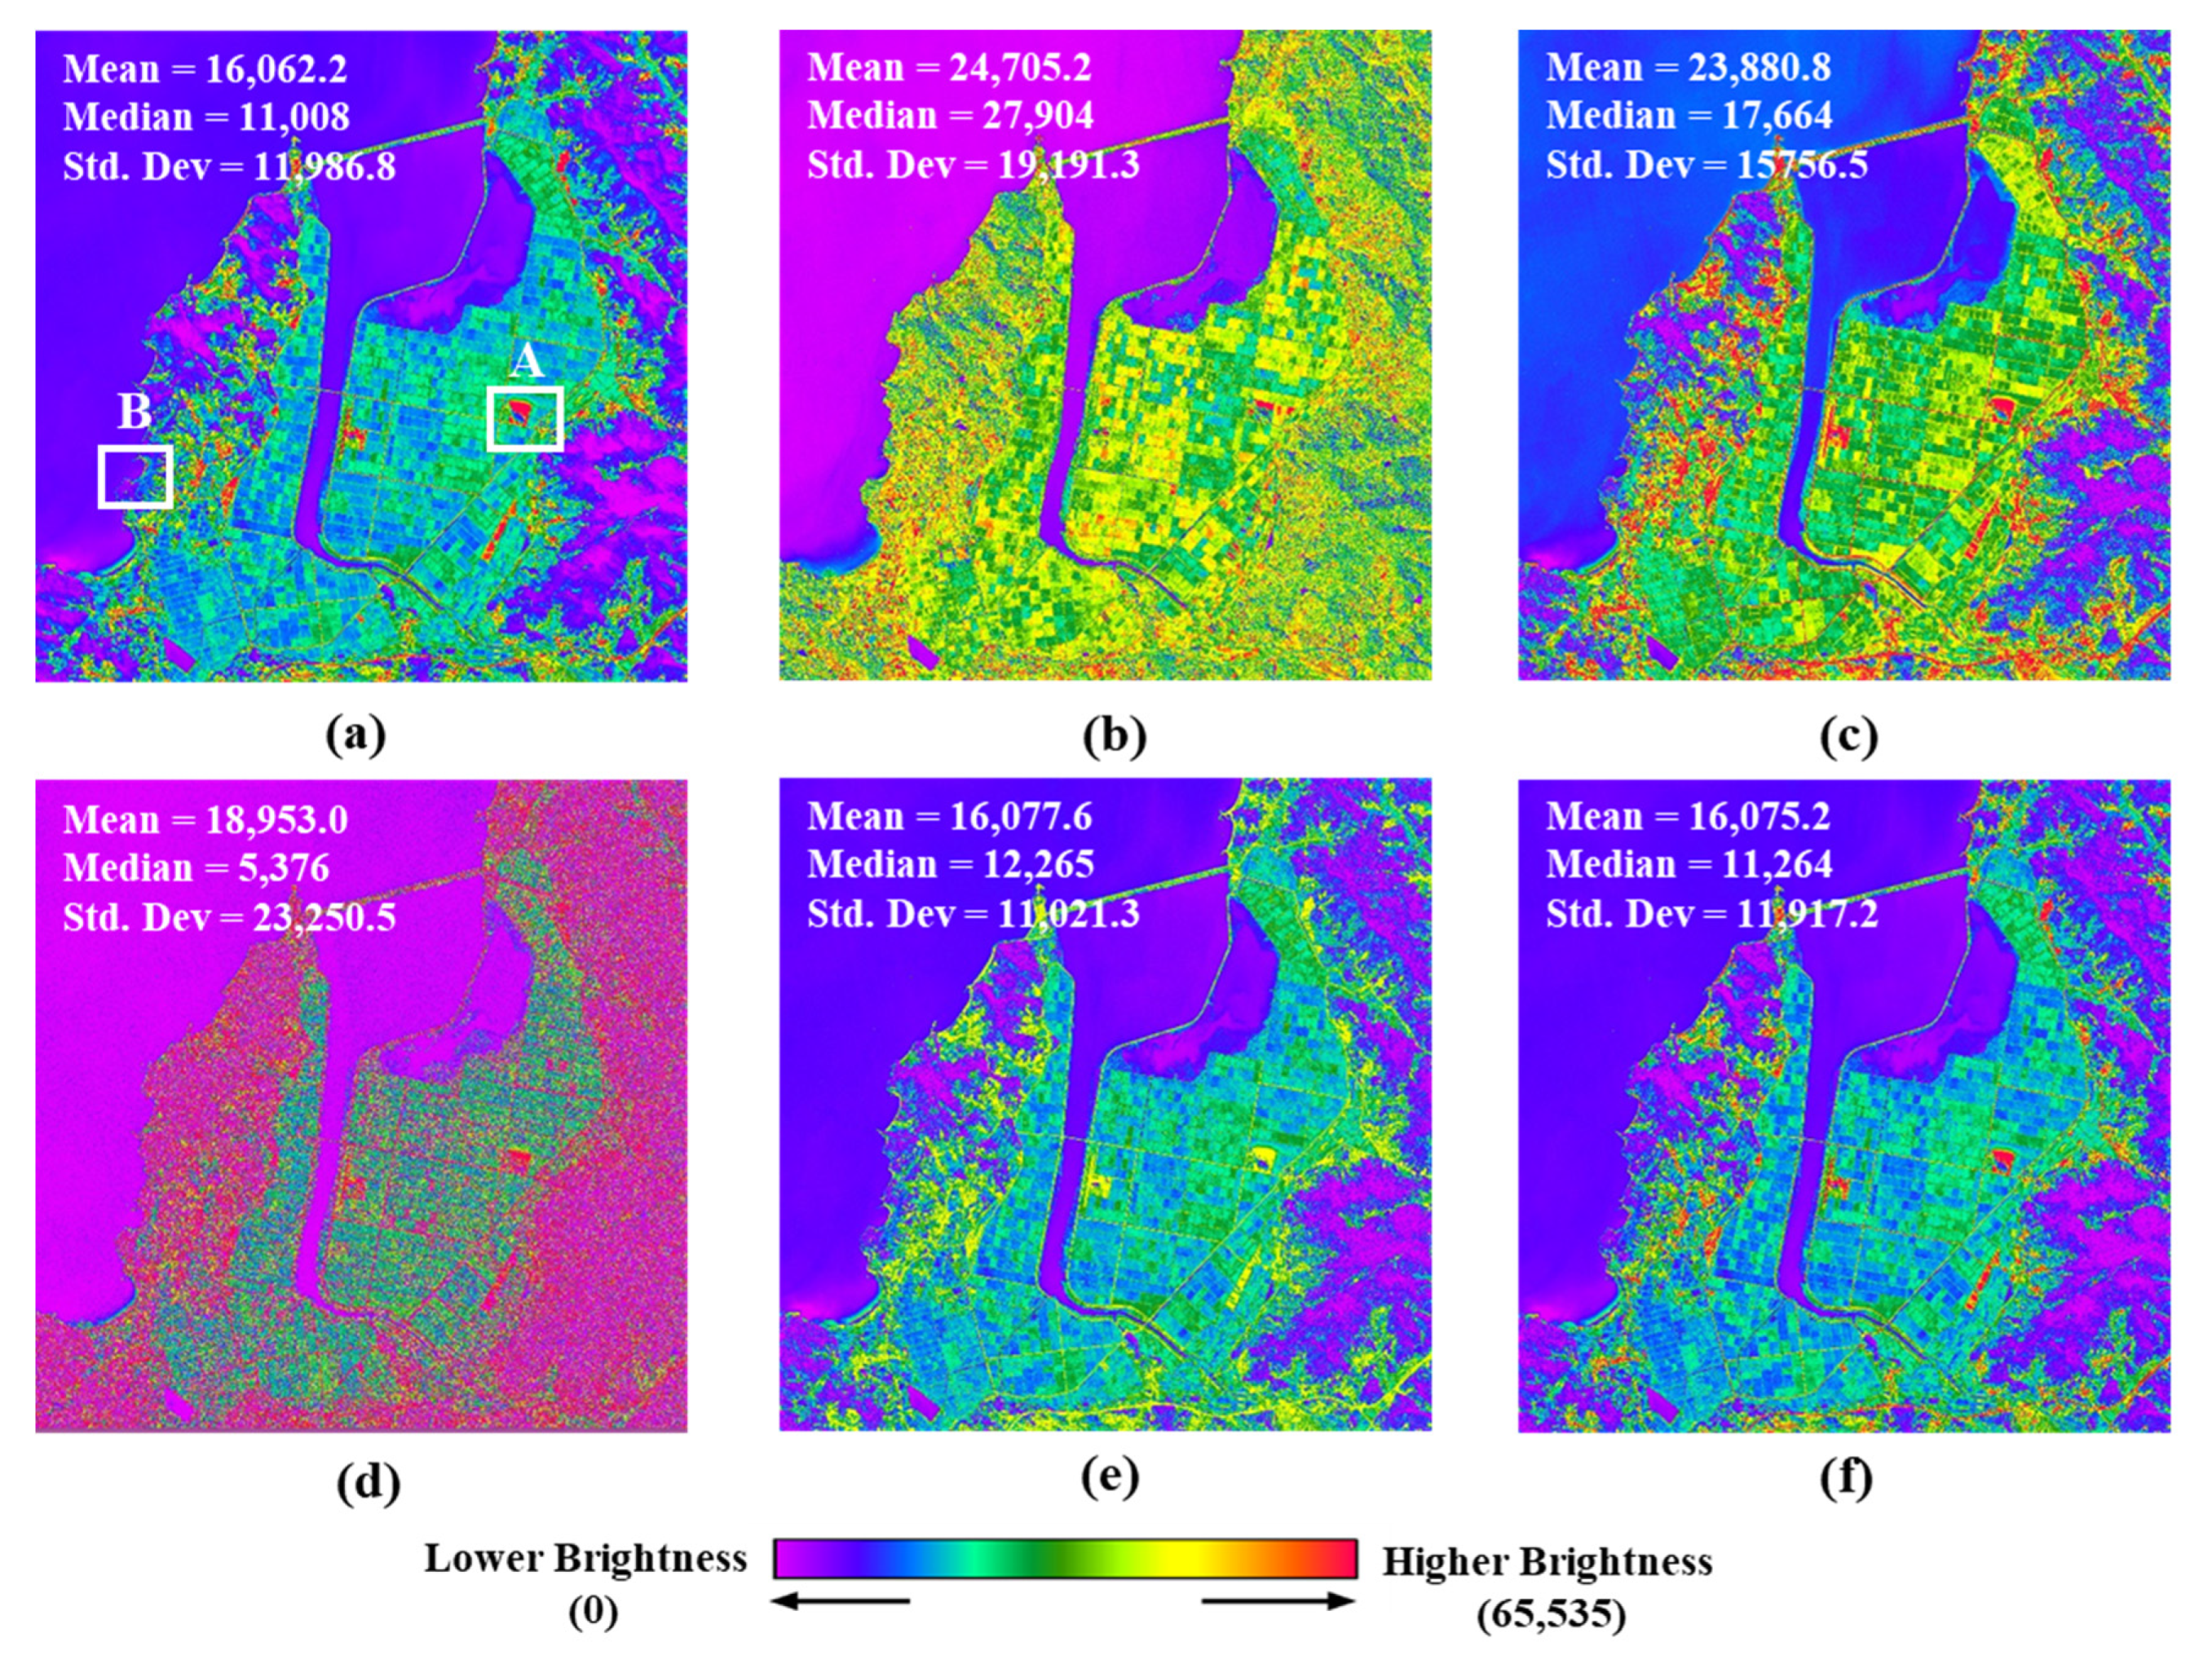
In
Figure 7, (a) and (b) represent images of the original MIR and Pan respectively.
Figure 7c–f presents fused images produced by both the previous and the proposed methods. The upper left-hand corner of
Figure 7 represents the mean, median, and standard deviation for the DN values of each image. The color scale of each image was expressed in the same range from 0 to 65,535. As mentioned earlier, the fused image with MSF method (see
Figure 7c) shows spectral characteristics very similar to the modified MIR image (see
Figure 7a). The image in
Figure 7d is fused into GF method and shows a very large spectral distortion. This is the result of injection of inverted high frequency information due to underestimated scaling factor. Meanwhile,
Figure 7e,f show patterns similar to those of low-resolution MIR images (see
Figure 7a). However, they also highlight some differences in artificial regions such as buildings, paved roads, and solar panels. The reason for this is probably due to differences in the extraction method of high frequency components. This means that the guide filtering technique may be more effective if the purpose is to improve the resolution of MIR images.
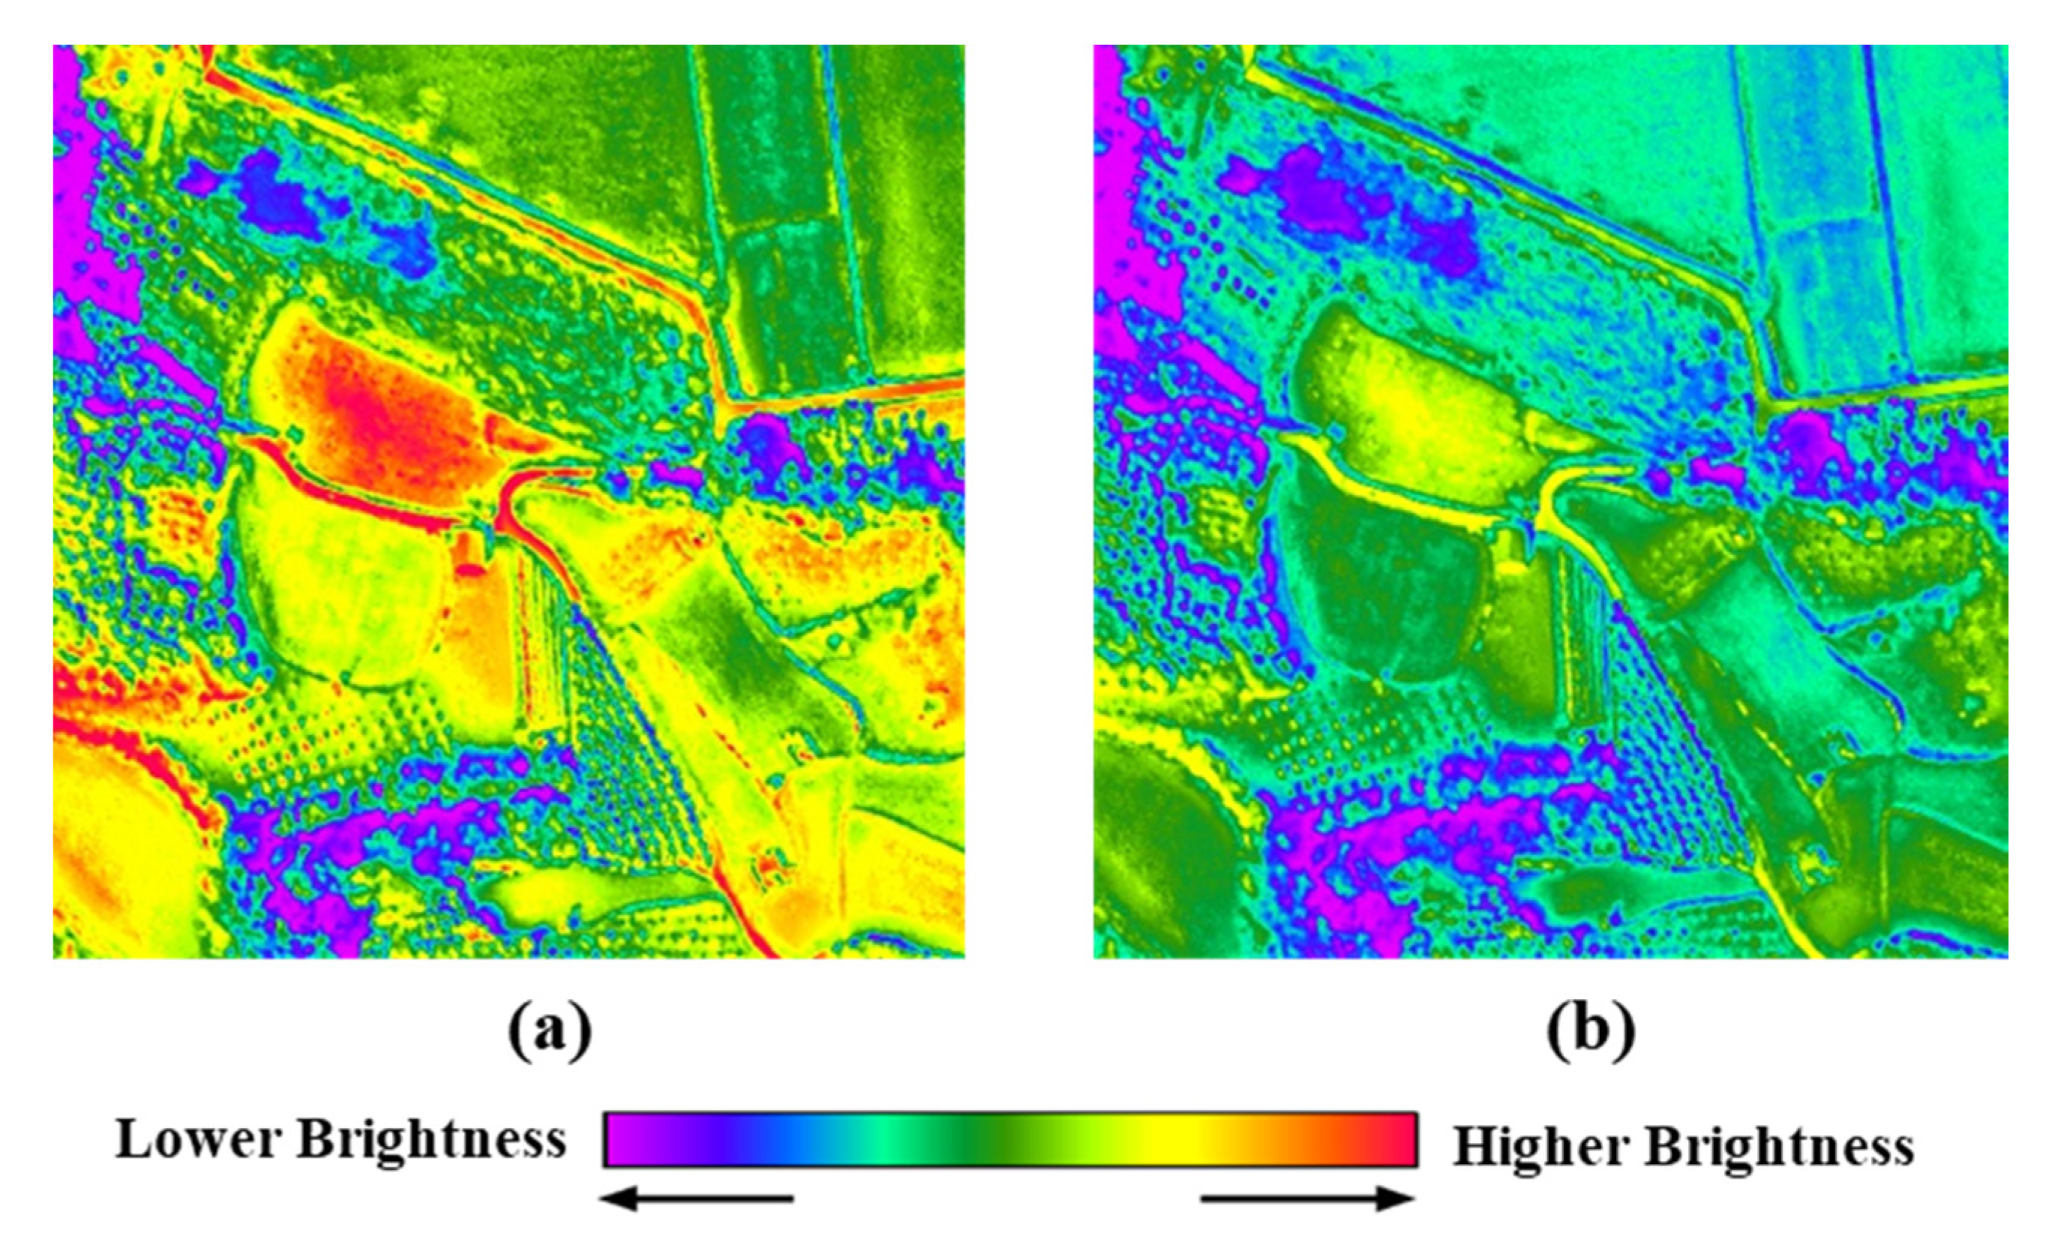
Figure 8 is an enlarged image of area A in
Figure 7. In
Figure 8, (a) and (b) represent images of the original MIR and Pan respectively. And (c–f) of
Figure 8 represent images fused by MSF, GF, MSF_P and GF-P methods respectively.
In the image of
Figure 8a, the area marked in red is the one where the solar panel is installed. On the other hand, in
Figure 8b the upper part of the location where the solar panel is installed is displayed in red, but the lower part is expressed in a color close to green. That is, since the upper part is installed in front of the sun, the radiated solar energy is high, and thus, the brightness value is relatively high. On the other hand,
Figure 8a did not show this difference because of the high radiation energy emitted by the earth. In other words, this phenomenon occurs because the MIR image detects both solar radiation energy and Earth radiation energy.
Figure 8c–f represent fused images with the previous methods and the proposed methods. Among them, fused images by the proposed GF-P method (
Figure 8f) showed spectral characteristics most similar to the original MIR image (
Figure 8a). On the other hand,
Figure 8c,e,f, excluding the
Figure 8d image, showed significant improvements in spatial resolution. Compared with the other two methods,
Figure 8c,f are judged to have a good degree of improvement in spatial resolution and preservation of spectral characteristics. However,
Figure 8c was expressed relatively more similarly to the spectral characteristics of the original PAN image. This is because, as mentioned earlier, the fusion process involves the modification of the original MIR image similarly to the original PAN image (see
Figure 4b.
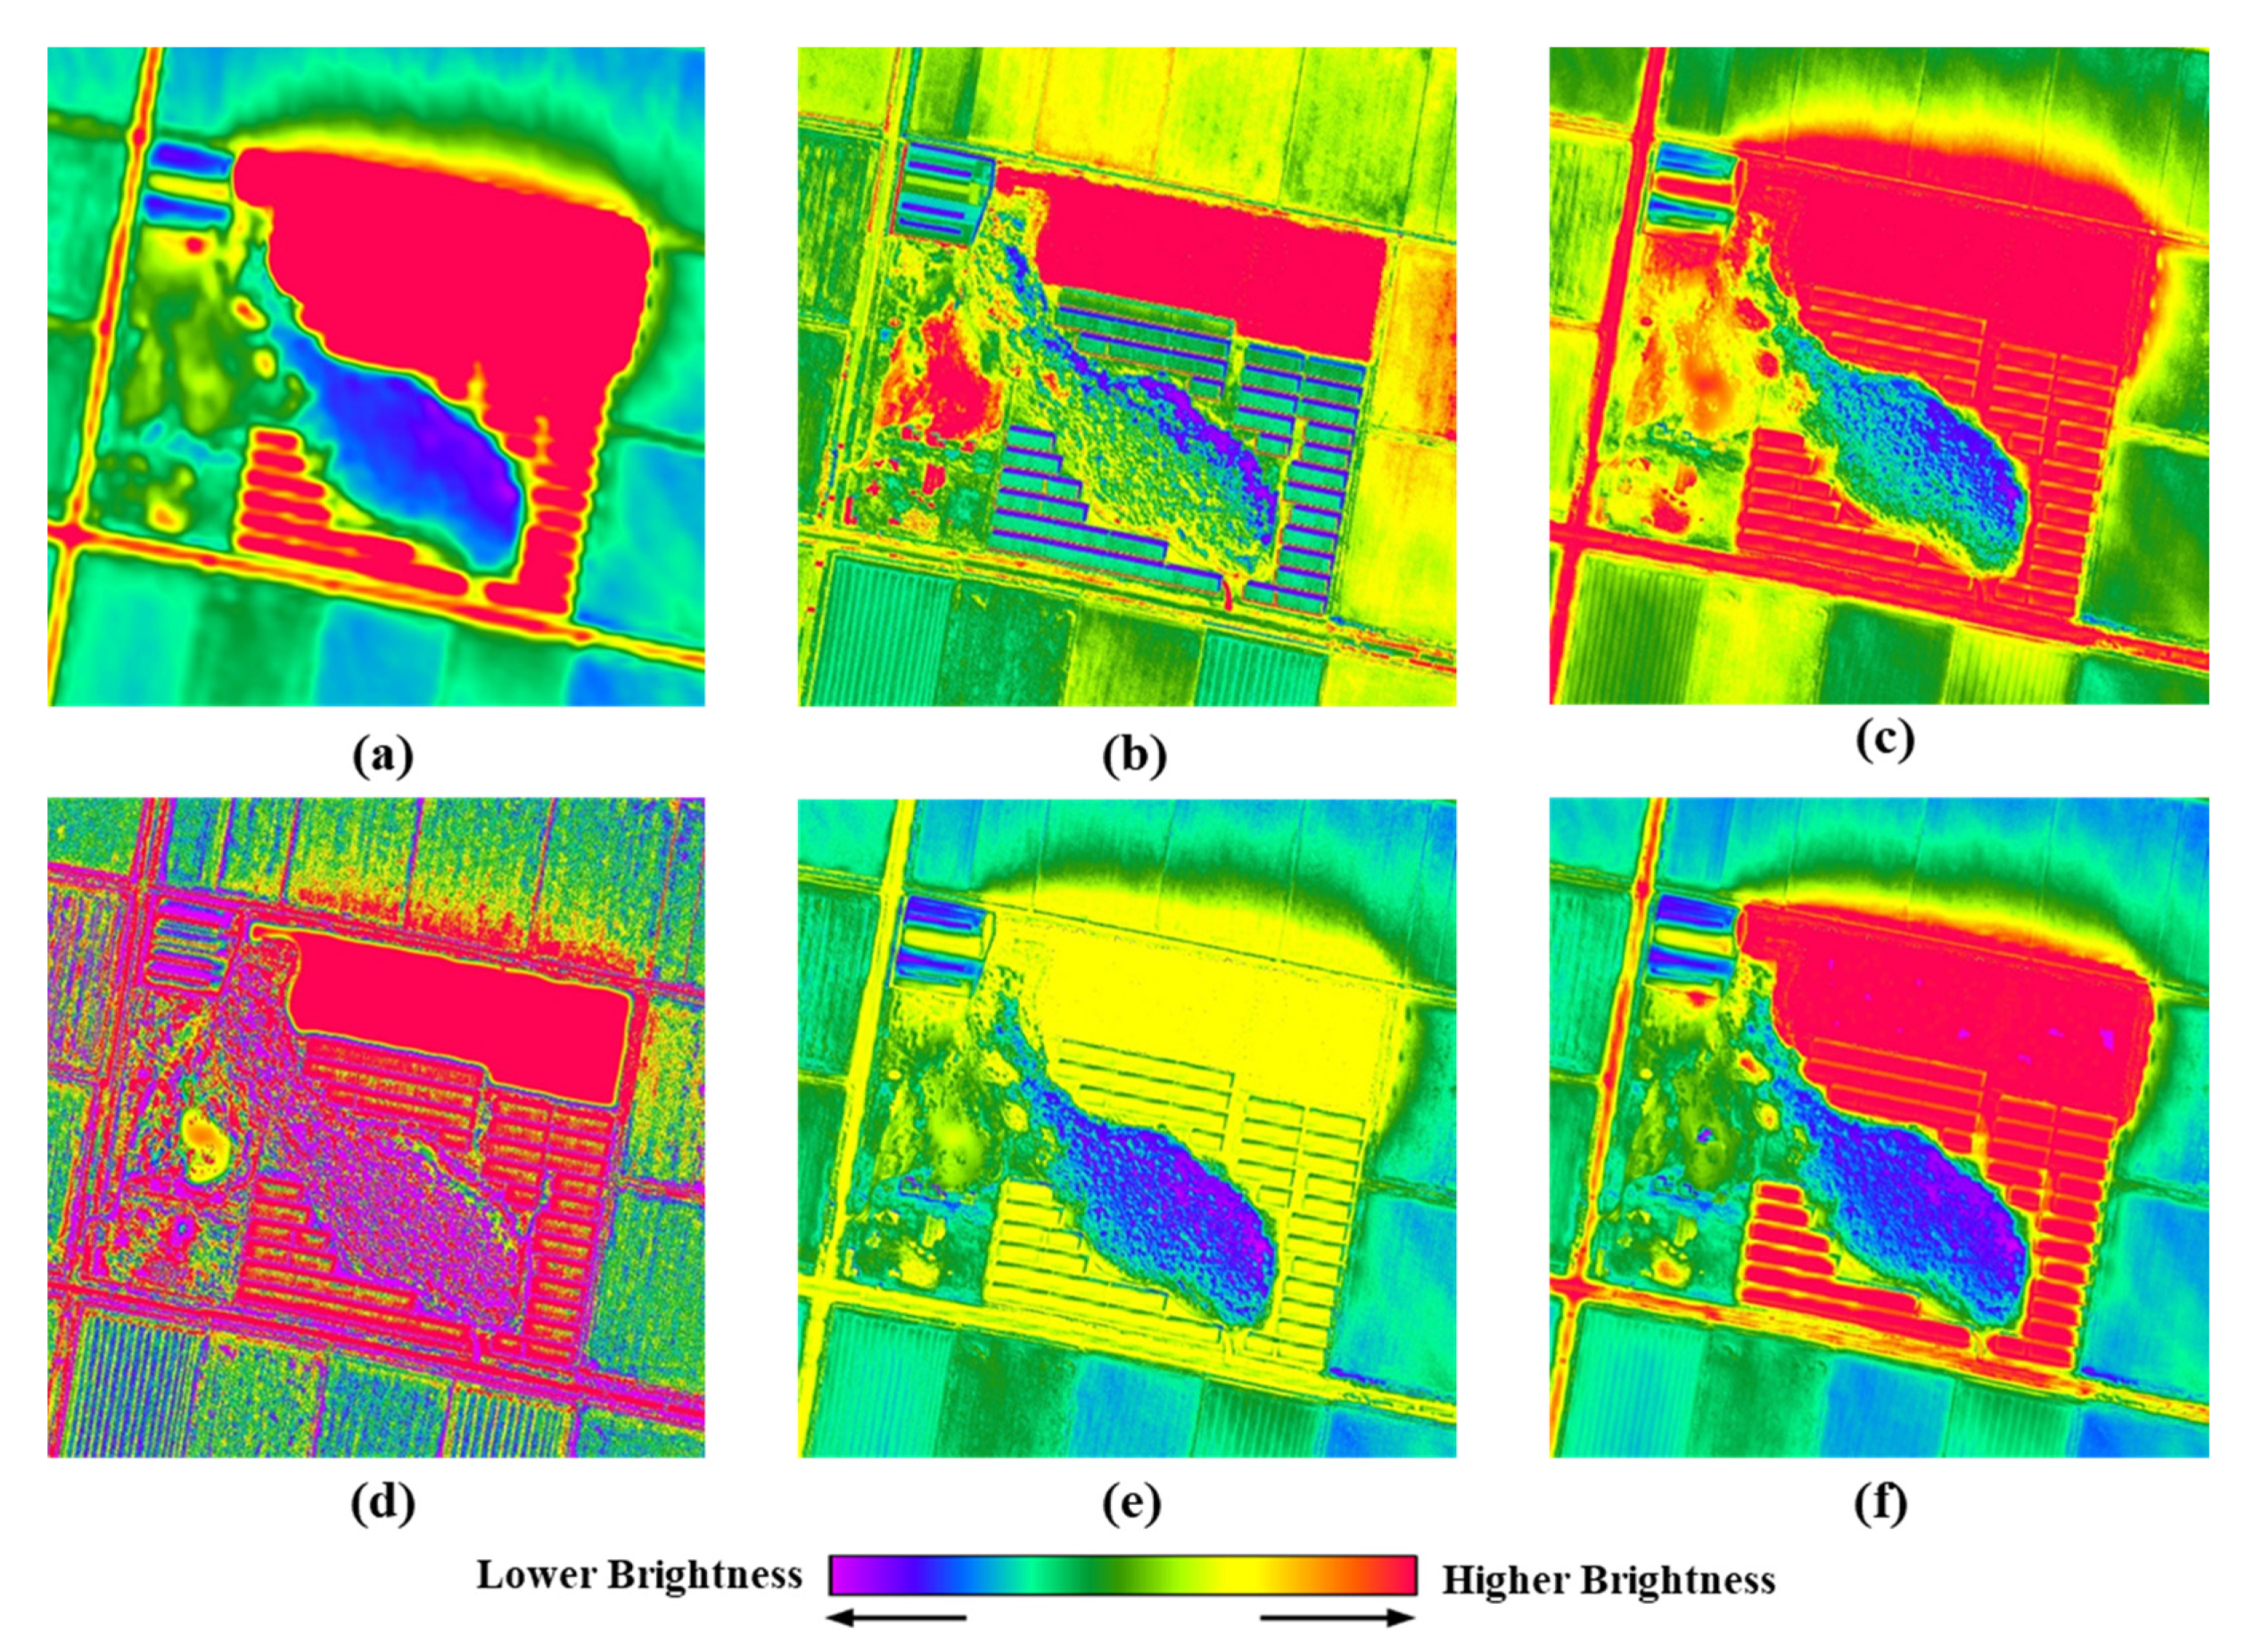
Figure 9 is an enlarged representation of
Figure 8 in Area B. Area B has a dock adjacent to the sea. The differences in each fusion methods are similar to
Figure 8. In other words, it can be judged that the fused image by the proposed GF-P method (
Figure 8f) are most appropriately satisfied with the improvement of spatial resolution and the preservation of spectral characteristics. The white circle in
Figure 9a indicates the area where a ship is at anchor or in operation. Note that in
Figure 9, the size of the ship is very small, so it is impossible to determine whether the ship is operating or not solely by the temperature of the ship. However, if the size of the ship is larger than the resolution of the MIR image, it will be possible to effectively determine through the fusion image the presence or absence of the ship and whether it is running or not.
In addition to the visual evaluation, qualitative assessments were conducted using four indices (
Table 3). There are a total of four evaluation indices used: Q4, CC, Spectral ERGAS, and Spatial ERGAS. Q4, CC, and Spectral ERGAS indicate the degree of preservation of spectral information, and the ideal values are 1, 1, and 0, respectively [
15,
16]. Spatial ERGAS represents the degree of conservation of spatial information, with an ideal value of zero [
14]. Reference images used in Q4, CC, and Spectral ERGAS are MIR images. On the other hand, the reference image for the Spatial ERGAS is a PAN image. The evaluation methodology was divided into Synthesis Property and Consistency Property (see
Figure 2). The experiments show consistent results in both evaluation methodologies and the proposed GF-P method, like in the visual evaluation results, was rated as having the best performance. On the other hand, the MSF method assigns the best performance to Spatial ERGAS. This is due to the differences in the reference images used by each evaluation index. In other words, Spatial ERGAS evaluates spatial resolution based on the PAN image. Thus, this is the result of not only improving spatial resolution but also due to the fact that similar to PAN images are evaluated together.
5. Conclusions
A novel efficient methods for the fusion of KOMPSAT-3A (which is the Korea Multi-Purpose Satellite) MIR and PAN images are presented. This method applies a strategy to improve spatial resolution, while preserving the spectral characteristics of MIR images. KOMPSAT-3A PAN and MIR images were used to validate the fusion performance of the proposed methods, which addresses various features such as mountains, plain, sea, and rural areas. The fused images were produced using some existing methods and the newly proposed ones, and visual and qualitative analyses were conducted, the latter by means of four evaluation indices, namely Q4, CC, Spectral ERGAS, and Spatial ERGAS. Evaluation methodologies for the qualitative analysis were divided into Synthesis Property and Consistency Property. Visual and qualitative evaluation results show that the best results were achieved via the proposed GF-P method. In future studies, it is necessary to more closely evaluate the usability of the proposed methodology by utilizing images with more diverse local characteristics.


