Article

Spatial-Temporal Evolution of Land Subsidence and Rebound over Xi’an in Western China Revealed by SBAS-InSAR Analysis

1
MOE Key Laboratory of Western China’s Environmental Systems, School of Earth Sciences, Lanzhou University, Lanzhou 730000, China
2
Technology & Innovation Centre for Environmental Geology and Geohazards Prevention, Lanzhou University, Lanzhou 730000, China
3
College of Earth and Environmental Sciences, Lanzhou University, Lanzhou 730000, China
4
Xi’an Center of China Geological Survey, Xi’an 710054, China
5
School of Human Settlements and Civil Engineering, Xi’an Jiaotong University, Xi’an 710054, China
*
Author to whom correspondence should be addressed.
Remote Sens. 2020, 12(22), 3756; https://doi.org/10.3390/rs12223756
Submission received: 26 October 2020 / Revised: 12 November 2020 / Accepted: 13 November 2020 / Published: 16 November 2020

Abstract

:
Land subsidence is one of the major urban geological hazards, which seriously restricts the development of many cities in the world. As one of the major cities in China, Xi’an has also been experiencing a large area of land subsidence due to excessive exploitation of groundwater. Since the Heihe Water Transfer Project (HWTP) became fully operational in late 2003, the problem of subsidence has been restrained, but other issues, such as ground rebounds, have appeared, and the effect of the underground space utilization on land subsidence remains unsolved. The spatial-temporal pattern of land subsidence and rebound in Xi’an after HWTP and their possible cause have so far not been well understood. In this study, the evolutionary characteristics of land subsidence and rebound in Xi’an city from 2007–2019 was investigated using Small Baseline Subset Interferometric Synthetic Aperture Radar (SBAS-SAR) technology to process the Advanced Land Observing Satellite (ALOS) and Sentinel-1A SAR datasets, and their cause and the correlation with groundwater level changes and the underground space utilization were discussed. We found that the land subsidence rate in the study area slowed from 2007–2019, and the subsidence area shrank and gradually developed into three relatively independent and isolated subsidence areas primarily. Significant local rebound deformation up to 22 mm/y commenced in the groundwater recharge region during 2015–2019. The magnitude of local rebound was dominated by the rise in groundwater level due to HWTP, whereas tectonic faults and ground fissures control the range of subsidence and the uplift area. The influence of building load on surface deformation became increasingly evident and primarily manifested by slowing the subsidence reduction trend. Additionally, land subsidence caused by the disturbances during the subway construction period was stronger than that in the operational stage. Future land subsidence in Xi’an is predicted to be alleviated overall, and the areas of rebound deformation will continue increasing for a limited time. However, uneven settlement range may extend to the Qujiang and Xixian New District due to the rapid urban construction. Our results could provide a scientific basis for land subsidence hazard mitigation, underground space planning, and groundwater management in Xi’an or similar regions where severe ground subsidence was induced by rapid urbanization.

Graphical Abstract

1. Introduction

Urban land subsidence is a major geohazard affecting several countries worldwide, including Mexico, Italy, Iran, Vietnam, USA, and China; the causes of land subsidence, primarily natural and man-made, include neotectonics, exploitation of underground resources (e.g., groundwater and gas), and underground engineering construction [1,2,3,4,5]. Xi’an is one of the most representative cities for the over-exploitation of groundwater-induced land subsidence. The continuous and massive exploitation of groundwater in urban construction has caused land subsidence to develop continually and to gradually form several serious subsidence centers that pose a serious threat to the sustainable development of Xi’an [6,7,8]. The earliest land subsidence (together with ground fissures) in the region was found in the 1960s. By the 1990s, areas with subsidence of more than 100 mm reached over 150 km2, and the maximum subsidence exceeded 2 m [9]. Since 2003, when the Heihe Water Transfer Project (HWTP) became fully operational, the downward trend of groundwater has been gradually curbed, the subsidence rate has been significantly slowed, and the subsidence area has been gradually reduced. However, the continuous recovery of groundwater after HWTP and the rapid development and modernization of Xi’an make the impact of multi-factor coupling on land subsidence and future changes uncertain. Therefore, analyzing the present characteristics of land subsidence and the driving mechanisms and studying future development trends are particularly necessary.
Land subsidence investigated in Xi’an was initially performed with a ground-based technique, such as fracture meter, leveling, stratification standard, and GPS [10,11]. Even though ground-based monitoring techniques provide high-accuracy surface subsidence measurements at selected locations, they have difficulties providing a more detailed map of the ground deformation at a regional scale because of low spatial resolution and high cost. In recent years, Synthetic Aperture Radar Interferometry (InSAR) has gradually become widely used in the monitoring of land subsidence related to human activities, such as groundwater exploitation and urbanization, in many regions worldwide, e.g., California in the USA, Betic Cordillera in Spain, central Mexico, Tuscany in Italy, and some regions in China [12,13,14,15,16,17,18]. With respect to the traditional ground-based monitoring, InSAR is an active remote sensing technique that can detect and monitor regional-scale surface subsidence at low cost with millimeter-scale accuracy for long periods [19]. However, problems accompany InSAR due to scatterer changes with time, which could result in temporal and spatial decorrelation, and make InSAR less robust [20,21]. Accordingly, advanced multi-temporal InSAR techniques, such as Persistent Scatterers InSAR (PSInSAR) and Small Baseline Subset (SBAS) InSAR, have been developed to map time-series land surface displacements at a regional or national scale. It has been determined that PSInSAR enables the precise characterization of linear deformation (slow or very slow-moving) where the ‘persistent scatters’ (e.g., buildings, metallic structures, or rock outcrops) are abundant with adequate quantity SAR images. The small baseline subset (SBAS) technology is an extension of InSAR technology, which has the advantages of overcoming decorrelation in areas with high deformation rates and reducing the number of SAR images required for processing compared with the PSInSAR method. During the past decade, more scholars have chosen to use SBAS-InSAR technology to obtain long-term series subsidence deformation in many regions, included Xi’an. Researchers using Envisat, ALOS, TerrSAR-X, and Sentinel-1A data found four major subsidence areas in Xi’an and a 200% increase in the land subsidence rate from 2005–2007 to 2008–2010 [22]. Based on multi-source data from 2012–2018, Yuhuazhai (YHZ) was found to be the largest subsidence area with a maximum rate of 136 mm/yr [9]. Data analysis from 2003–2017 found five subsidence areas that are identical to the structural depression. In 2012, the rebound area was 6.6 km2 [23]. However, the aforementioned studies primarily focus on the analysis of subsidence characteristics in a specific period and lack a detailed comparative analysis of different periods, especially regarding the evolving characteristics of land subsidence and rebound after HWTP. Additionally, relevant research to predict future changes in the context of groundwater recovery and rapid urbanization is lacking.
Studies have found that the consolidation and compaction of soil layers (which lead to land subsidence) are caused by a complex geological environment background and the joint action of anthropogenic activities, such as over-exploitation of confined aquifers [24]. Additionally, scholars use dislocation theory, a finite element model, a 2D pumping subsidence calculation model, the aquifer mass conservation principle, the permeability coefficient, the micro-structural change coupling method, and other methods to study the influencing mechanism of groundwater extraction, geological structure, ground load, and other factors affecting land subsidence in Xi’an [25,26,27,28]. Studies in recent years have shown that land subsidence is affected by groundwater exploitation and urban construction, and the surface rebound phenomenon is caused by elastic and viscoelastic deformation due to groundwater recharge [8,22,23]. However, most of the research is site-specific or emphasizes the linkage between land subsidence and groundwater level reduction caused by over-exploitation at the regional scale. The effect of groundwater rising due to HWTP in combination with the rapid urbanization on land subsidence was poorly understood. Studying the driving mechanisms of land subsidence and rebound evolution in Xi’an with a background of groundwater recovery due to HWTP and rapid urban development is urgently needed for disaster prevention, mitigation, and warning.
In this study, the evolutionary characteristics and future trends of land subsidence and rebound in Xi’an were analyzed by SBAS-InSAR technology. We initially analyzed the spatial-temporal patterns of land subsidence and rebound in the study area after HWTP (2007–2019). The influence of groundwater and high-rise buildings and subway lines on ground subsidence and rebound deformation is discussed. Finally, based on InSAR monitoring results and historical data, we predicted the future development trends of land subsidence and rebound in Xi’an under the background of rapid urban sprawl. This study could provide a scientific basis for urban land subsidence risk mitigation, underground space planning, and groundwater management in Xi’an or similar regions where serious subsidence was caused by rapid urbanization, such as groundwater over-exploitation, subway construction, and new district development.

2. Study Area

Xi’an, located in the southcentral part of the Guanzhong Basin, above the secondary and tertiary grade terraces of the Weihe River alluvial plain, is an important core city in western China and the starting point of the ‘Silk Road’. Multiple faults, primarily the Lintong–Chang’an (LT–CA) Fault (Figure 1), formed in this region under the influence of tectonic activities [29]; strong faulting leads to the development of ground fissures and provides the tectonic conditions for the occurrence of land subsidence. Xi’an is located in the southeastern Loess Plateau region and has a warm temperate semi-humid continental monsoon climate with four distinct seasons and an annual rainfall of 522.4–719.5 mm.
Since the Eocene epoch, very thick Cenozoic strata have been deposited in the region. Except for scattered Tertiary deposits on the loess tableland in the southeast of the study area, Quaternary materials are dominant in the other areas and primarily include aeolian loess and water deposited boulders, sand, and clay (Figure 1). The loess is more than 114.9 m thick, and the flow accumulation layer is 400–1000 m thick, providing favorable conditions for the occurrence and migration of groundwater. Under the control of distinct tectonic activity and hydrological conditions, landforms, such as loess ridges, loess depressions, alluvial–diluvial terraces, and loess tablelands developed in the region provided an important site for the development of land subsidence. The groundwater in Xi’an City can be divided into upper (phreatic aquifer and shallow confined aquifer) and deep (confined aquifer) groundwater. The formation of land subsidence is primarily affected by the deep confined aquifer. Since the exploitation of deep confined aquifer in the late 1950s, underground water level changes in Xi’an have experienced five stages. In the first stage (1951–1970), the confined water level at the initial stage of mining decreased slowly, and no unified cone of depression appeared. In the second stage (1971–1990), the cone of depression began to form and rapidly expanded and deepened as mining intensified, and the central decline rate was greater than 5 m/yr. Despite strengthening mining management, the funnel area continued to grow, and the confined water head in the central zone decreased by 60–90 m. In the third stage (1991–2002), with the initial implementation of HWTP in Xi’an, the exploitation amount of confined water decreased to 30 million m3/yr. However, from 1996–2002, the groundwater exploitation amount for the entire city still accounted for more than 70% of the total water supply [29]. At this time, the buried depth of the confined water level reached a historical maximum of 157 m [30]. In the fourth stage (2003–2017), with the completion of the HWTP, the daily water supply of surface water reached 1.1 × 10⁶ m3, and the annual surface water supply exceeded 4 × 10⁸ m3. The exploitation of deep confined water decreased significantly, and the water level rose gradually. However, because of rapid scale urban expansion, some urban villages continued exploiting confined water. In the fifth stage (2018–present), the closure of pumping wells and the implementation of groundwater recharge projects during urban village reconstruction allows for zero exploitation of deep confined water and further strengthens groundwater recharge [28]. A growing population and economy fuel the rapid urban expansion of Xi’an. In the past 70 years, the built-up area expanded from 14 to 729 km2, increasing by 52 times; high-rise buildings in the city gradually covered an area of approximately 113 km2, 15% of the built-up area. Additionally, the pace of development and the utilization of underground space in Xi’an was gradually accelerating. Since the construction of the first subway in 2006, Xi’an has built four subway lines with a total length of 126 km, and six subway lines are planned and under construction with a total length of approximately 150 km.

3. Materials and Methods

The SBAS-InSAR technique, proposed by [31], is an analysis method for the multi-master-image InSAR time series that uses interferometric pairs of small baselines to obtain the surface deformation. Compared with PSInSAR, the SBAS-InSAR could overcome the low coherence of some interferograms induced by a single master image and reduces the number of SAR images required for processing. This method increases the time sampling rate and enhances the ability to provide spatially dense deformation sequences, and retrieves deformation rate and time series [32,33,34].
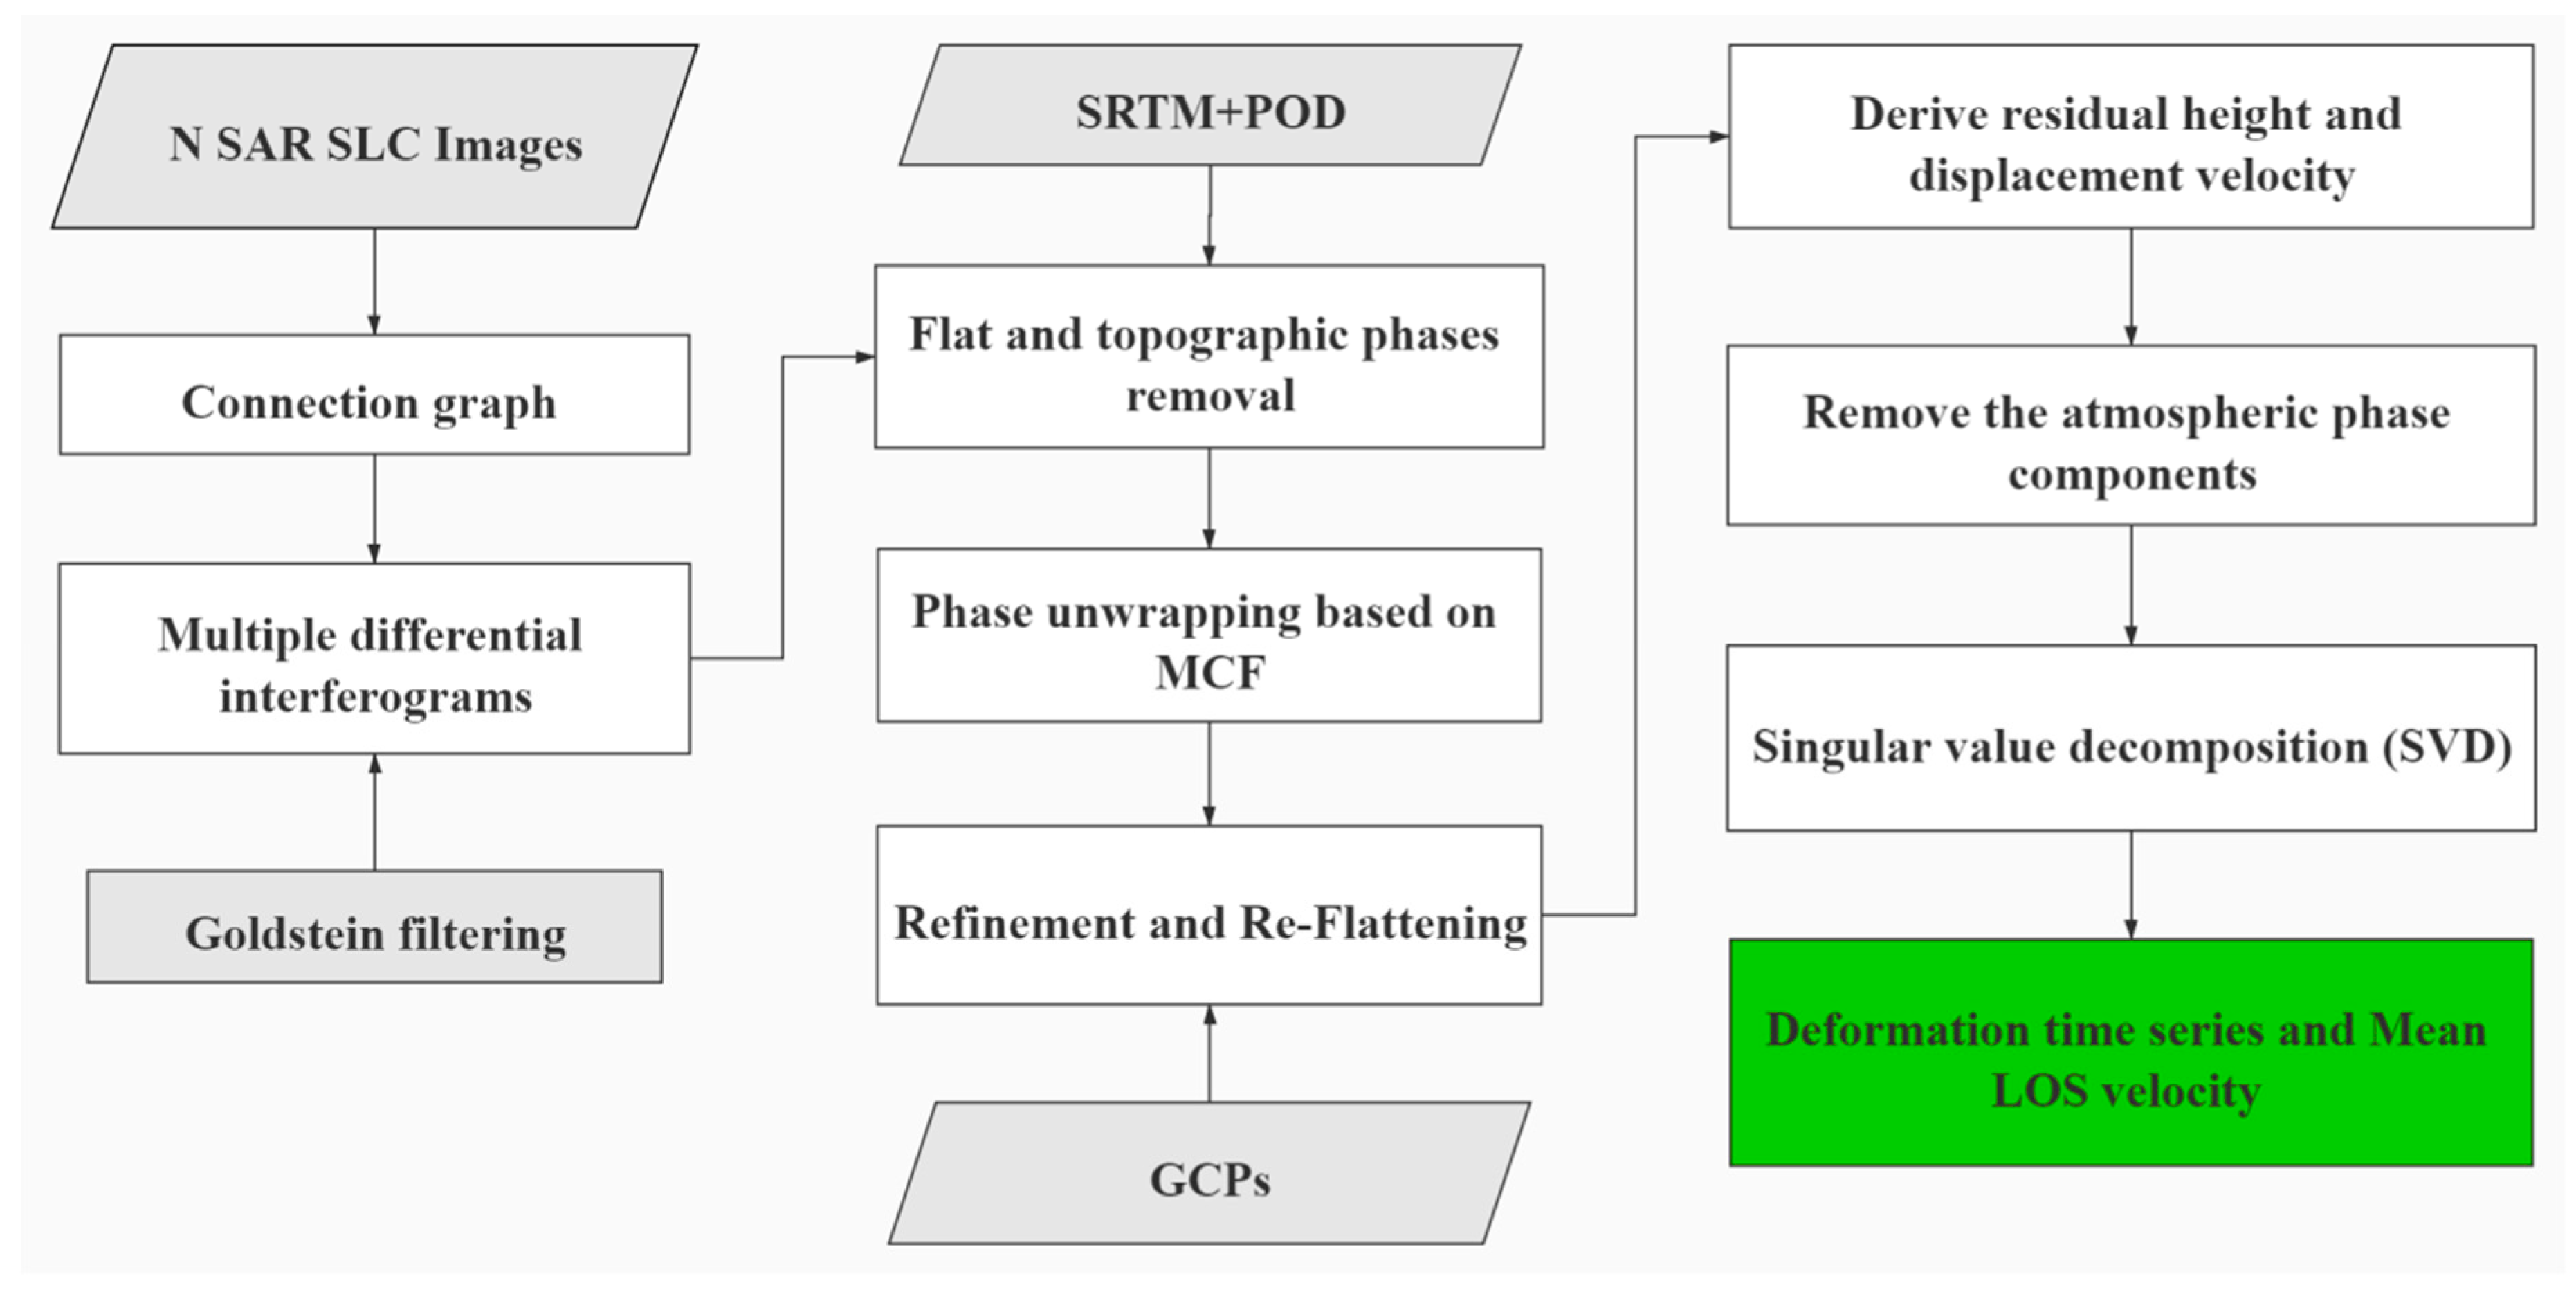
In this research, to obtain surface subsidence rate and time series in the Xi’an region, the SBAS-InSAR technology based on SARscape software was used to process the ALOS SAR datasets from 2007–2010 and Sentinel-1A images from 2015–2019, respectively. Four main steps, including multiple differential interferograms generation, flat-earth and topographic phases removal, orbital refinement and phase re-flattening, and time-series deformation retrieval, were involved for SBAS processing. First, the generation of multiple differential interferograms began with a selection of SAR image pairs with spatial and temporal constraints (smaller than 230 m and less than 120 days) which are represented in a ‘connection graph’ to form interferograms, and the signal-to-noise ratio of interferograms was improved by the Goldstein Filtering method. The next step was to remove the flat earth and topographic phases using Precise Orbit Determination (POD) data and external Digital Elevation Model (DEM), respectively. Then, based on the phase unwrapped by performing the Minimum Cost Flow approach (MCF) [34,35], the residual phase content and phase ramps were calculated to correct the unwrapped phase by selecting and refining stable Ground Control Points (GCPs). In this research, GCPs were selected based on the following criteria: (1) temporal coherence value over 0.80, (2) the location is far from the area with no residual topography fringes, large displacements, and field surveys, (3) deformation close to zero confirmed by interpretation of unwrapped phase and field survey. As a consequence, we used 65 GCPs in both orbital refinement and displacement conversion steps. Finally, a linear model was used to derive the residual height and preliminary displacements, and the Singular Value Decomposition method was applied to search the least-squares solution for each coherent pixel as well as to estimate the nonlinear deformation. The ultimate time-series deformation was retrieved after subtracting the estimated atmospheric artifacts and orbital ramps. The logical workflow is shown in Figure 2.
In this study, 16 scenes of L-band radar data from 2007–2010 were obtained by the PLSAR sensor of the Advanced Land Observing Satellite-1 (ALOS-1), and 186 scenes of C-band radar data from 2015–2019 were obtained by the Sentinel-1A satellite and used to calculate the surface deformation results of the Xi’an region from 2007–2019 (Table 1). External DEM data provided by NASA from Shuttle Radar Topography Mission-1 (SRTM) with a resolution of 30 m was applied to remove the topographic phase. We quoted existing GPS monitoring data for verification, including six reference point data (XJA1-XJA6) and 25 monitoring point data (XJ01-XJ25), to verify the accuracy and reliability of InSAR data analysis results [9,22]. Additionally, to reveal the influence of building changes on land subsidence in recent years, we obtained the change data of high-rise buildings in Xi’an by combining Google Earth multi-phase remote sensing image interpretation with field surveys. The long-term monitoring data of the groundwater level from 180 wells in the study area were also used, which was provided by the Xi’an Center of China Geological Survey.

4. Results

4.1. Spatial-Temporal Pattern of Land Subsidence from 2007–2019

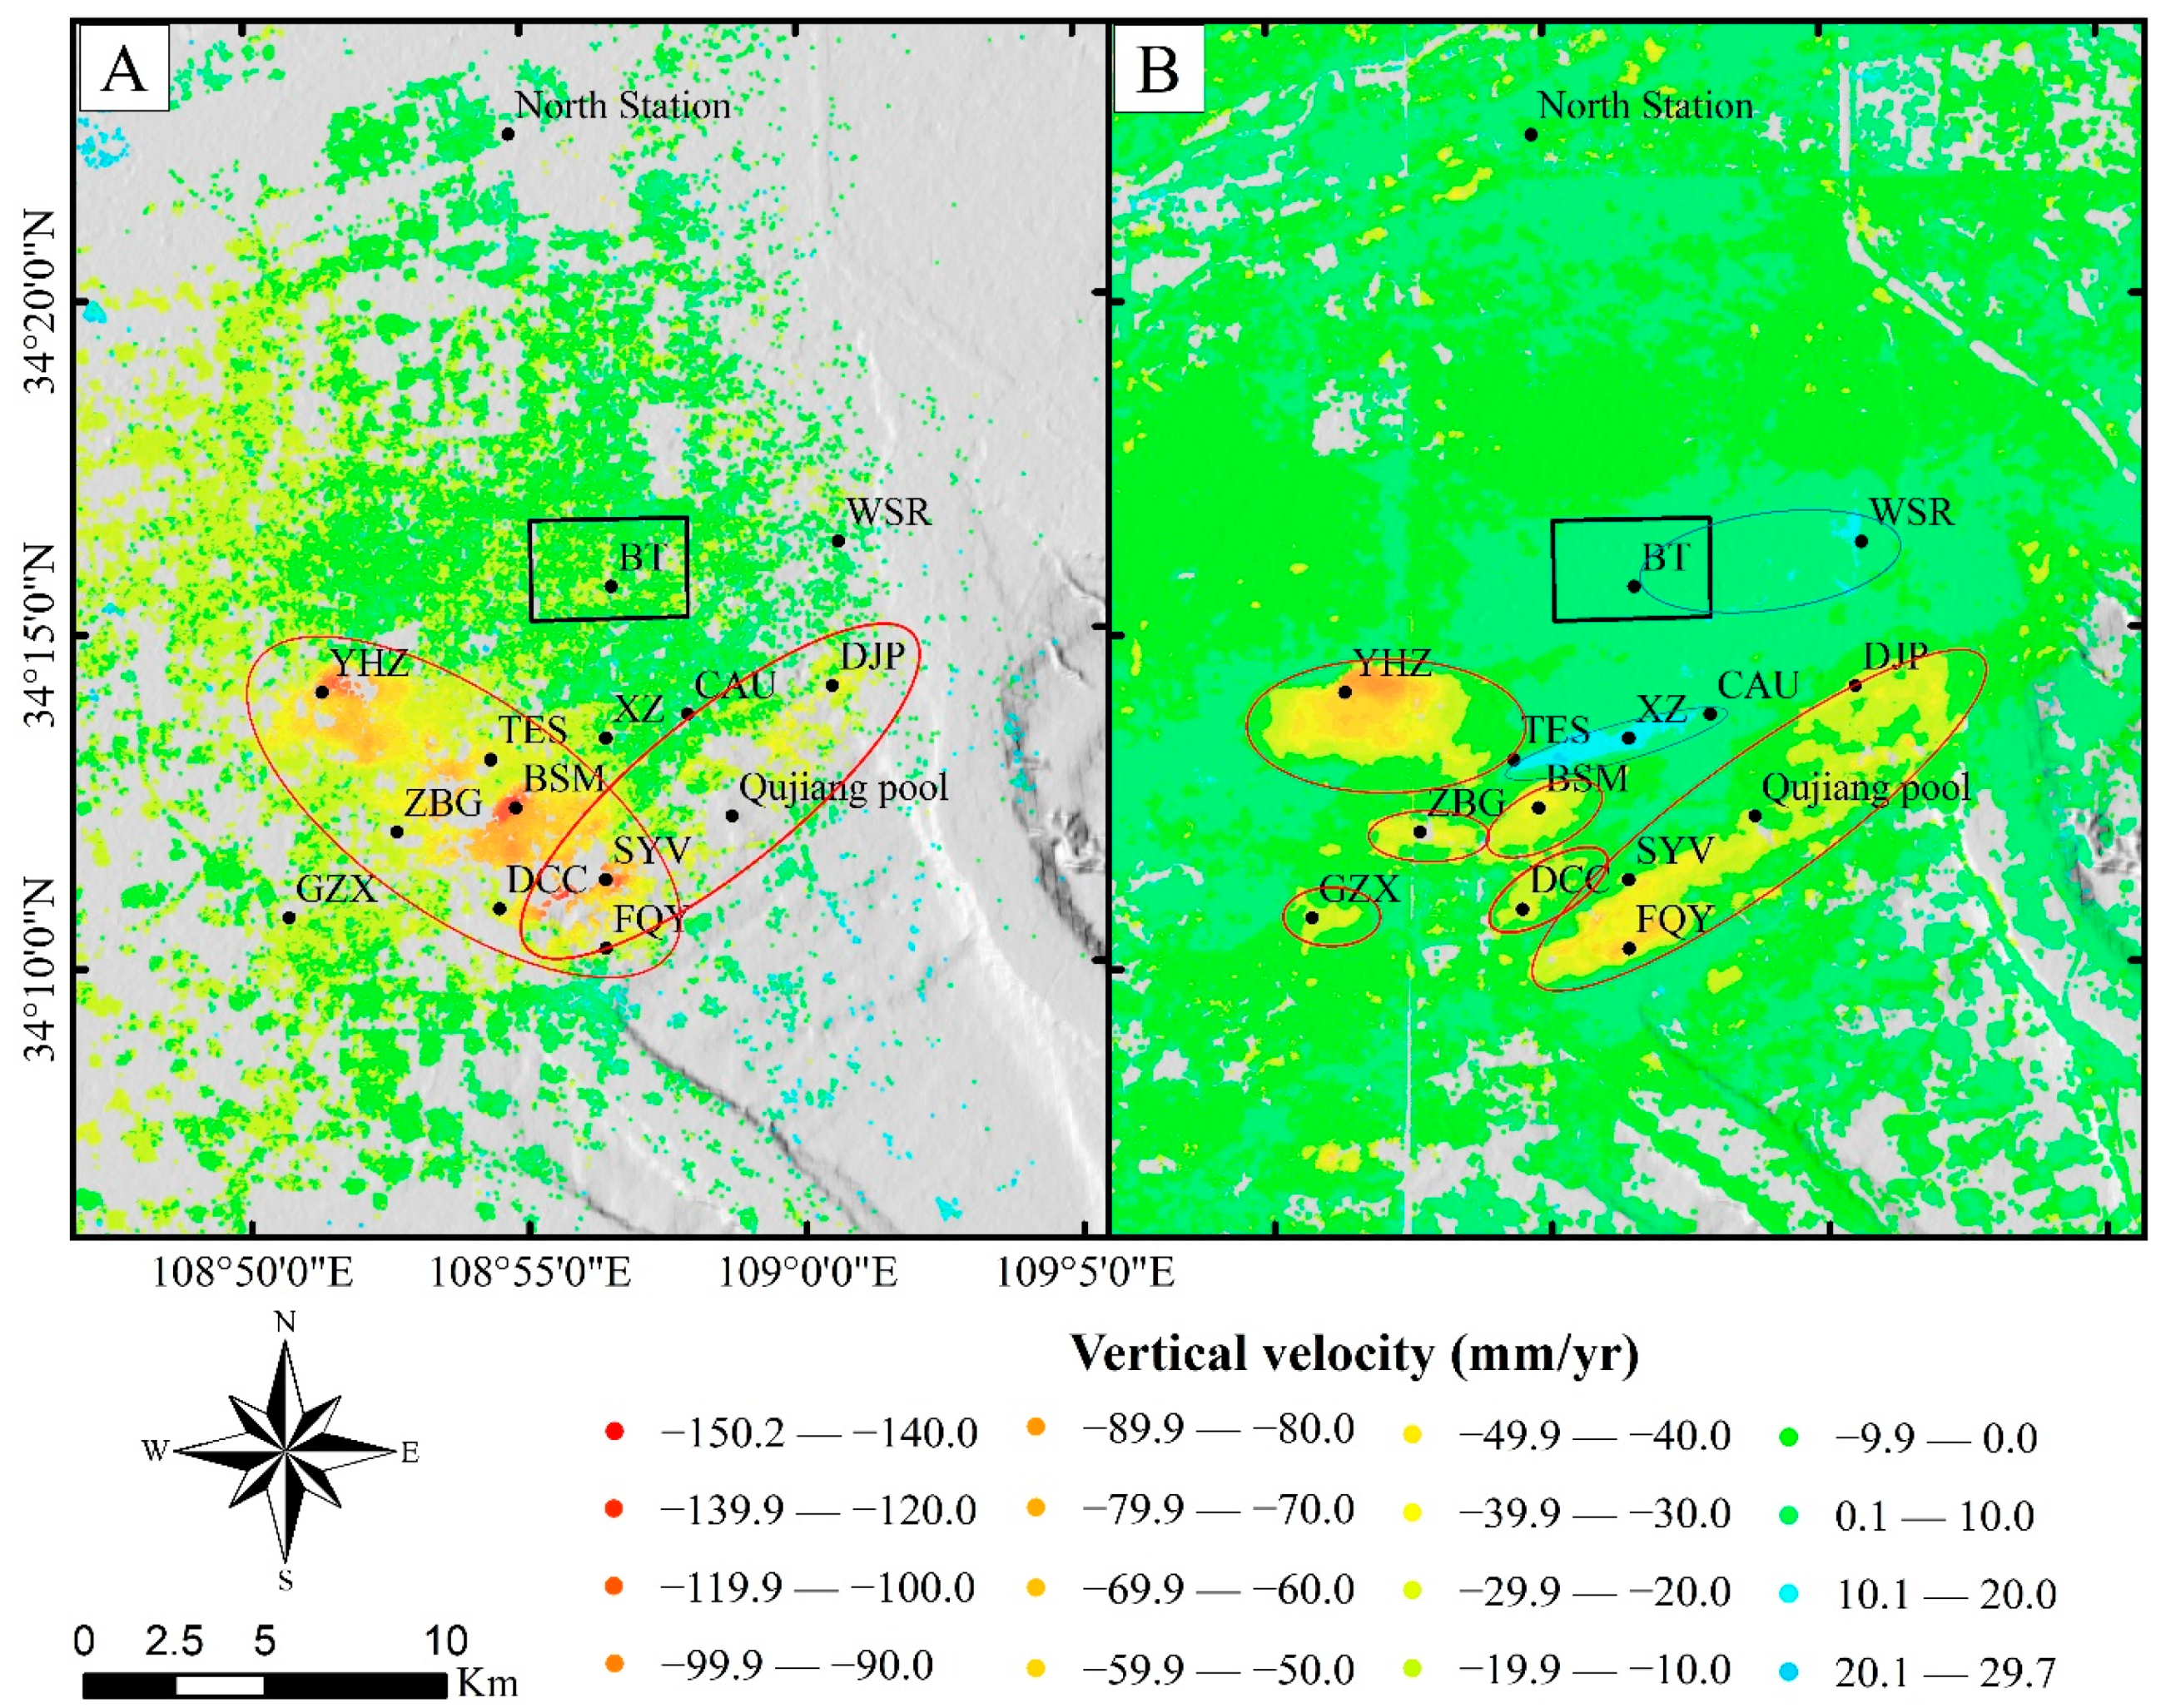
Through the processing of ALOS-1 and Sentinel-1A data with the SBAS-InSAR technique, we obtained the surface deformation rates in line-of-sight (LOS) of the study area from 2007–2019. Considering that the displacement component of the polar SAR satellite along the N-S direction on the azimuth plane is difficult to estimate, we assumed that it is 0 [35]. Then, based on the incidence angles of ALOS and Sentinel-1A, the deformations along the LOS (dLOS) was transformed into the vertical direction (dV) using the following equation: dV = dLOS/cosθ [36,37]. Combined with the existing studies, the paper performed a comparative analysis based on considering natural subsidence and the mean square deviation of surface deformation [37]. Our reference point was chosen in the stable region of the black pentacle (Figure 3B), which had been proved by previous studies [8,9,23].
The results showed that from 2007–2019, land subsidence in the study area was gradually separated and differentiated from a ‘V’ shaped whole into several independent subsidence areas, and the maximum subsidence rate was reduced from 150.2 to 91 mm/yr (Figure 3). Among them, the typical independent subsidence areas were: YHZ, Beishanmen (BSM), and Fengqiyuan–Dengjiapo (FQY–DJP). In addition, the surface rebound phenomenon appeared in the Electronic Square to Chang’an University (TES-CAU) and the Bell Tower to Wanshou Road (BT–WSR), and the maximum rebound rate of 22 mm/yr was located in TES-CAU (Figure 3B). The surface deformation presented a significantly different trend from that of previous studies in Xi’an. The subsidence area shrank, subsidence rate slowed, and surface rebound phenomenon appeared. We specifically analyze typical areas in the following section.
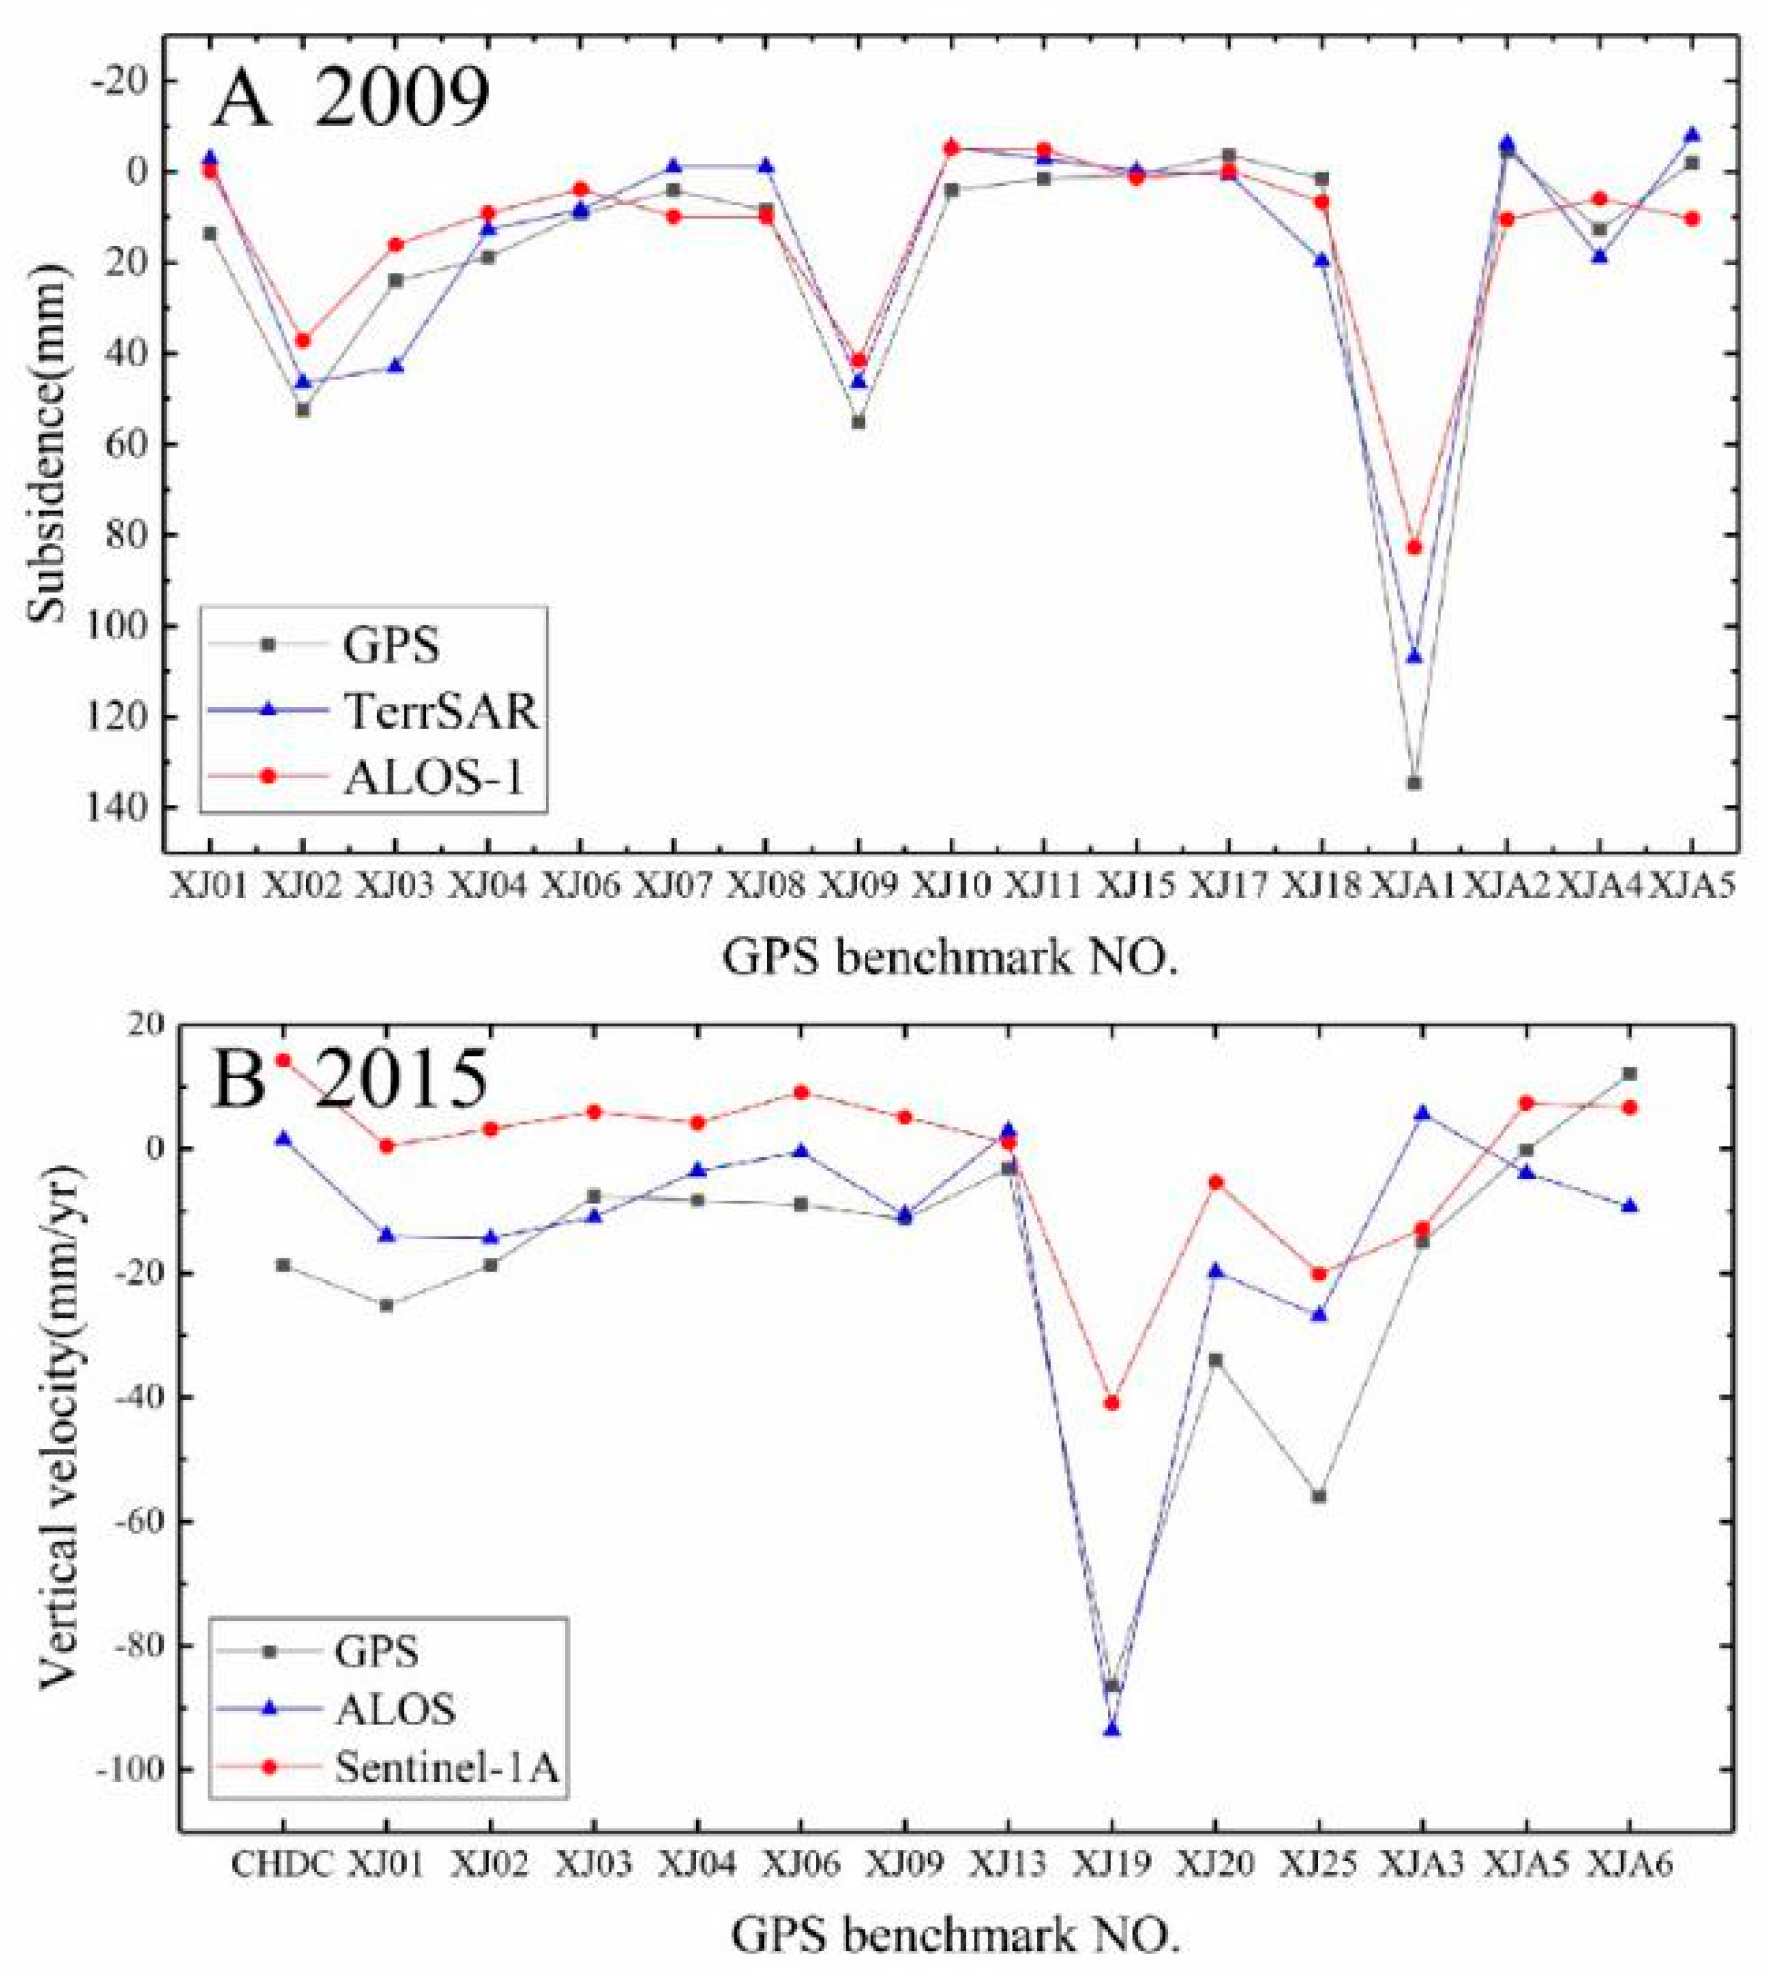
To verify the reliability of the SBAS-InSAR analysis results, we made a comparative analysis with existing GPS reference points data, which is shown in Figure 1A, and surface deformation results obtained by relevant scholars [9,22]. The results showed that the cumulative and annual deformation rates of the analysis are in good agreement with the GPS leveling data and the historical research results (Figure 4) and that the data processing results have high reliability and can be used in the research and analysis.

4.2. Evolution of Land Subsidence and Rebound from 2007–2019

According to the spatial-temporal pattern of land subsidence and rebound, the three major land subsidence areas now in Xi’an are YHZ district, BSM district, and FQY-DJP district, whereas the most significant rebound area is TES-CAU. The evolution characteristic of the subsidence and rebound in these regions are analyzed in detail.

4.2.1. Land Subsidence in YHZ District

This district was once the largest “villages within cities” in Xi’an with a high-density population and intense groundwater exploitation. With the implementation of urban village renewal, high-rise buildings increased rapidly in recent years. Between 2007–2019, the maximum subsidence rate decreased from 127 to 85 mm/yr. The area of the larger subsidence rate zone was reduced, and its southern boundary migrated from f6 ground fissure to f5 (Figure 5A,B). The subsidence center in the region migrated eastward from Yuhua Village to Tianlanglanhushu Community by approximately 800 m, and the average subsidence rate near it decreased from 89 to 68 mm/yr. In addition, there was a significant rebound phenomenon that occurred in early October 2018 (Figure 5C). The field investigation found many deformation signs at the boundary of the subsidence area; for example, obvious ground cracking and building subsidence can be observed on the north boundary of YHZ, where the f4 ground fissure pass-through (Figure 5D,E).
The land subsidence in this area was mainly related to groundwater exploitation, ground fissures, and building load. Due to the high population density, the amount of groundwater exploitation and surface load in this area is much higher than those in adjacent areas, so there is a greater rate and persistent land subsidence phenomenon. In addition, the obvious rebound phenomenon will be discussed in detail in Section 5.

4.2.2. Land Subsidence in Beishanmen District

This subsidence area is located in the core of the Xi’an High-tech Industries Development Zone and is covered by high-density buildings. From 2007–2019, the area was gradually separated from other subsidence zones and formed an area of approximately 5.2 km2, and the maximum subsidence rate decreased from 150 to 35 mm/yr. And the subsidence area existed between the ground fissure of f8 and f9 (Figure 6A,B). The land subsidence center in this area moved to BSM village from the near of f8 ground fissure, and at this time, with the gradual recovery of groundwater, the average rate of the subsidence center decreased from 107 to 27 mm/yr (Figure 6C). The field investigation revealed that the wall cracked and toppled (Figure 6D), and the hardened road showed several parallel cracks (Figure 6E) at the southern and western boundary of the subsidence area. The spatial range of land subsidence in this area is primarily controlled by active ground fissures, and the size of the area will change because of the activity of the cracks. Dense urban construction, living and industrial groundwater extraction have combined to influence the subsidence in the area.

4.2.3. Land Subsidence in Fengqiyuan-Dengjiapo District

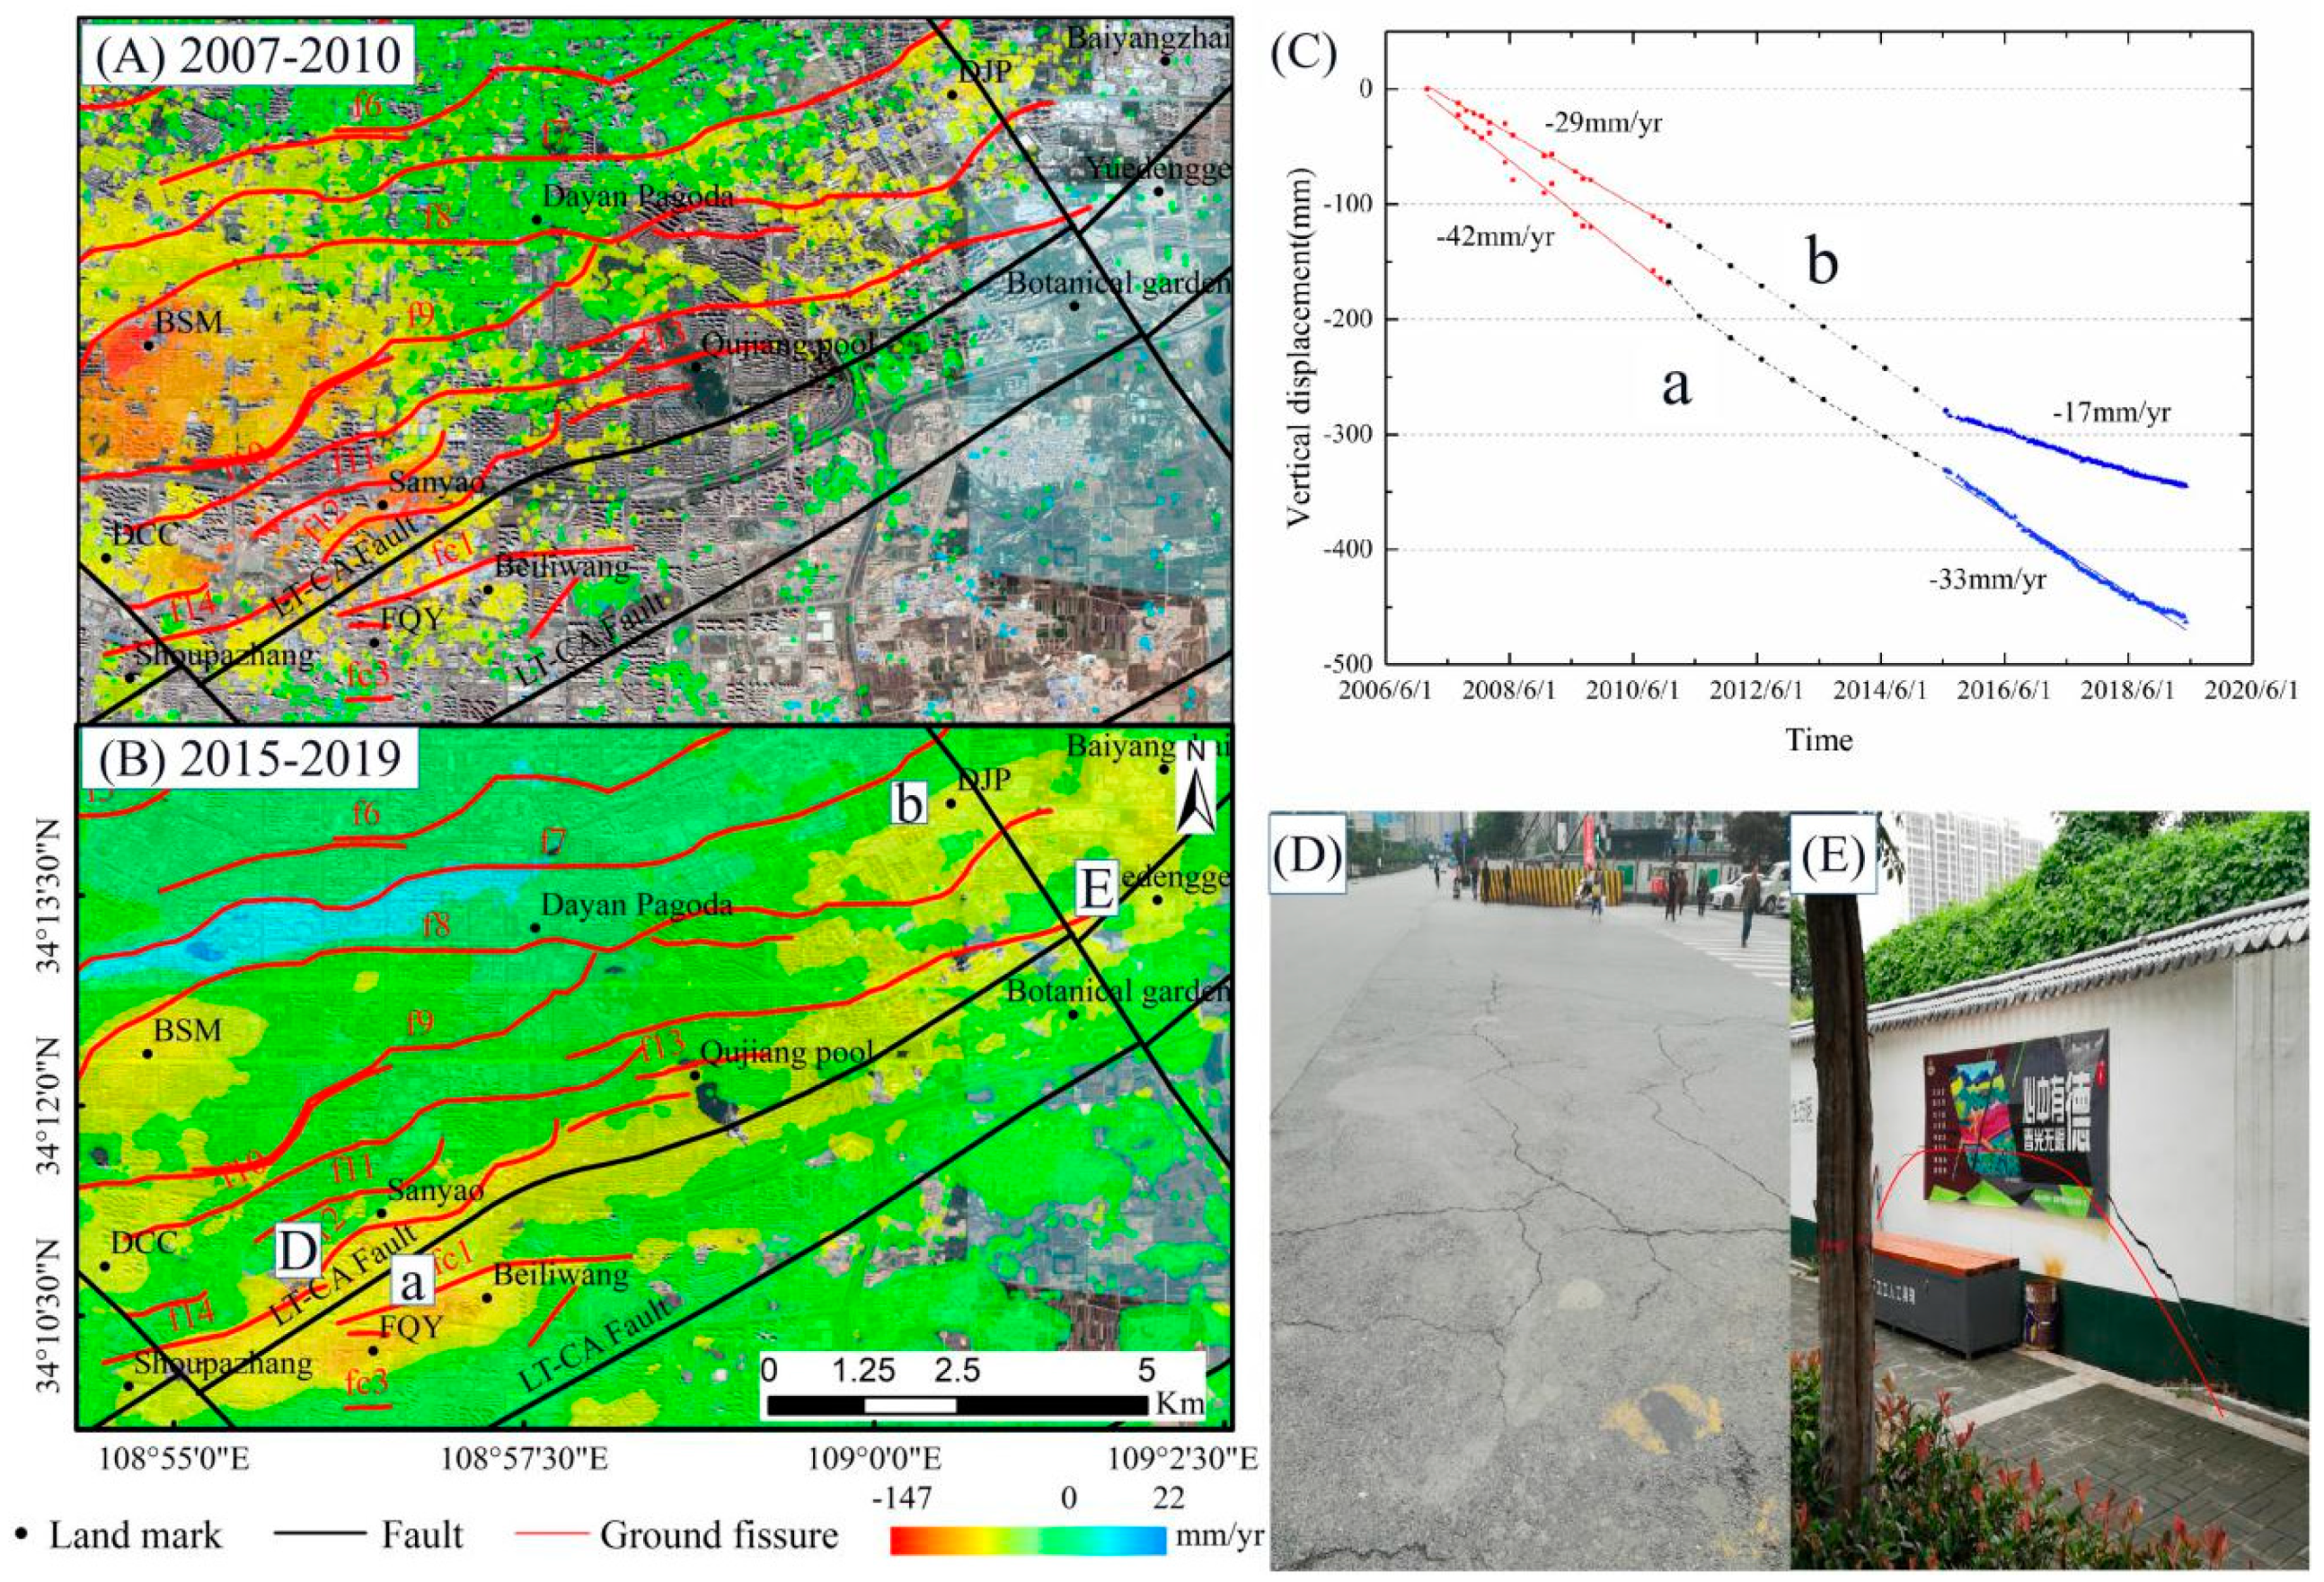
This region consists of mainly suburban areas and is the major expanding area of urban construction. The eastern section (Qujiangchi–Baiyang Village) is located in Qujiang New District with a large number of high-rise buildings under construction. The land subsidence area of FQY–DJP starts from Shoupazhang Village to Baiyang Village and is distributed in a long strip on both sides of the Lintong–Chang’an (LT–CA) Fault, with an area of approximately 27.2 km2. From 2007–2019, the land subsidence in the western section of this region was relatively concentrated, while the eastern section was relatively dispersed, and the maximum subsidence rate decreased from 147 to 70 mm/yr. In the western section, both the northern boundary and the settlement center of the subsidence zone moved southward, and the area and rate decreased. The area where SYV was located evolved from the subsidence center to the boundary of the region, and FQY is now the subsidence center, with an average rate changed from 42 to 33 mm/yr (Figure 7A,B). In the eastern section, the subsidence area expanded to the southeast and crossed the LT–CA fault, showing the coexistence of multiple subsidence centers. And most of the centers in the region coincide with high-rise buildings, and the maximum subsidence rate was between 28–32 mm/yr. In the vicinity of DJP village, where one of the subsidence centers is located, the rate decreased from 29 to 17 mm/yr.
The main influencing factors on land subsidence in this area were groundwater exploitation and building load. The western section is greatly affected by the groundwater exploitation in the urban village, and the eastern section by the ground load of the new district construction. However, different from the YHZ district, there is a more prominent geological tectonic background dominated by LT–CA fault in this region. Through the field investigation, most deformation marks, such as fissures and cracks, were found on the hard pavement in the western section (Figure 7D), whereas these marks in the eastern section were mostly on the walls (Figure 7E).

4.2.4. Land Rebound in The Electronic Square–Chang’an University District

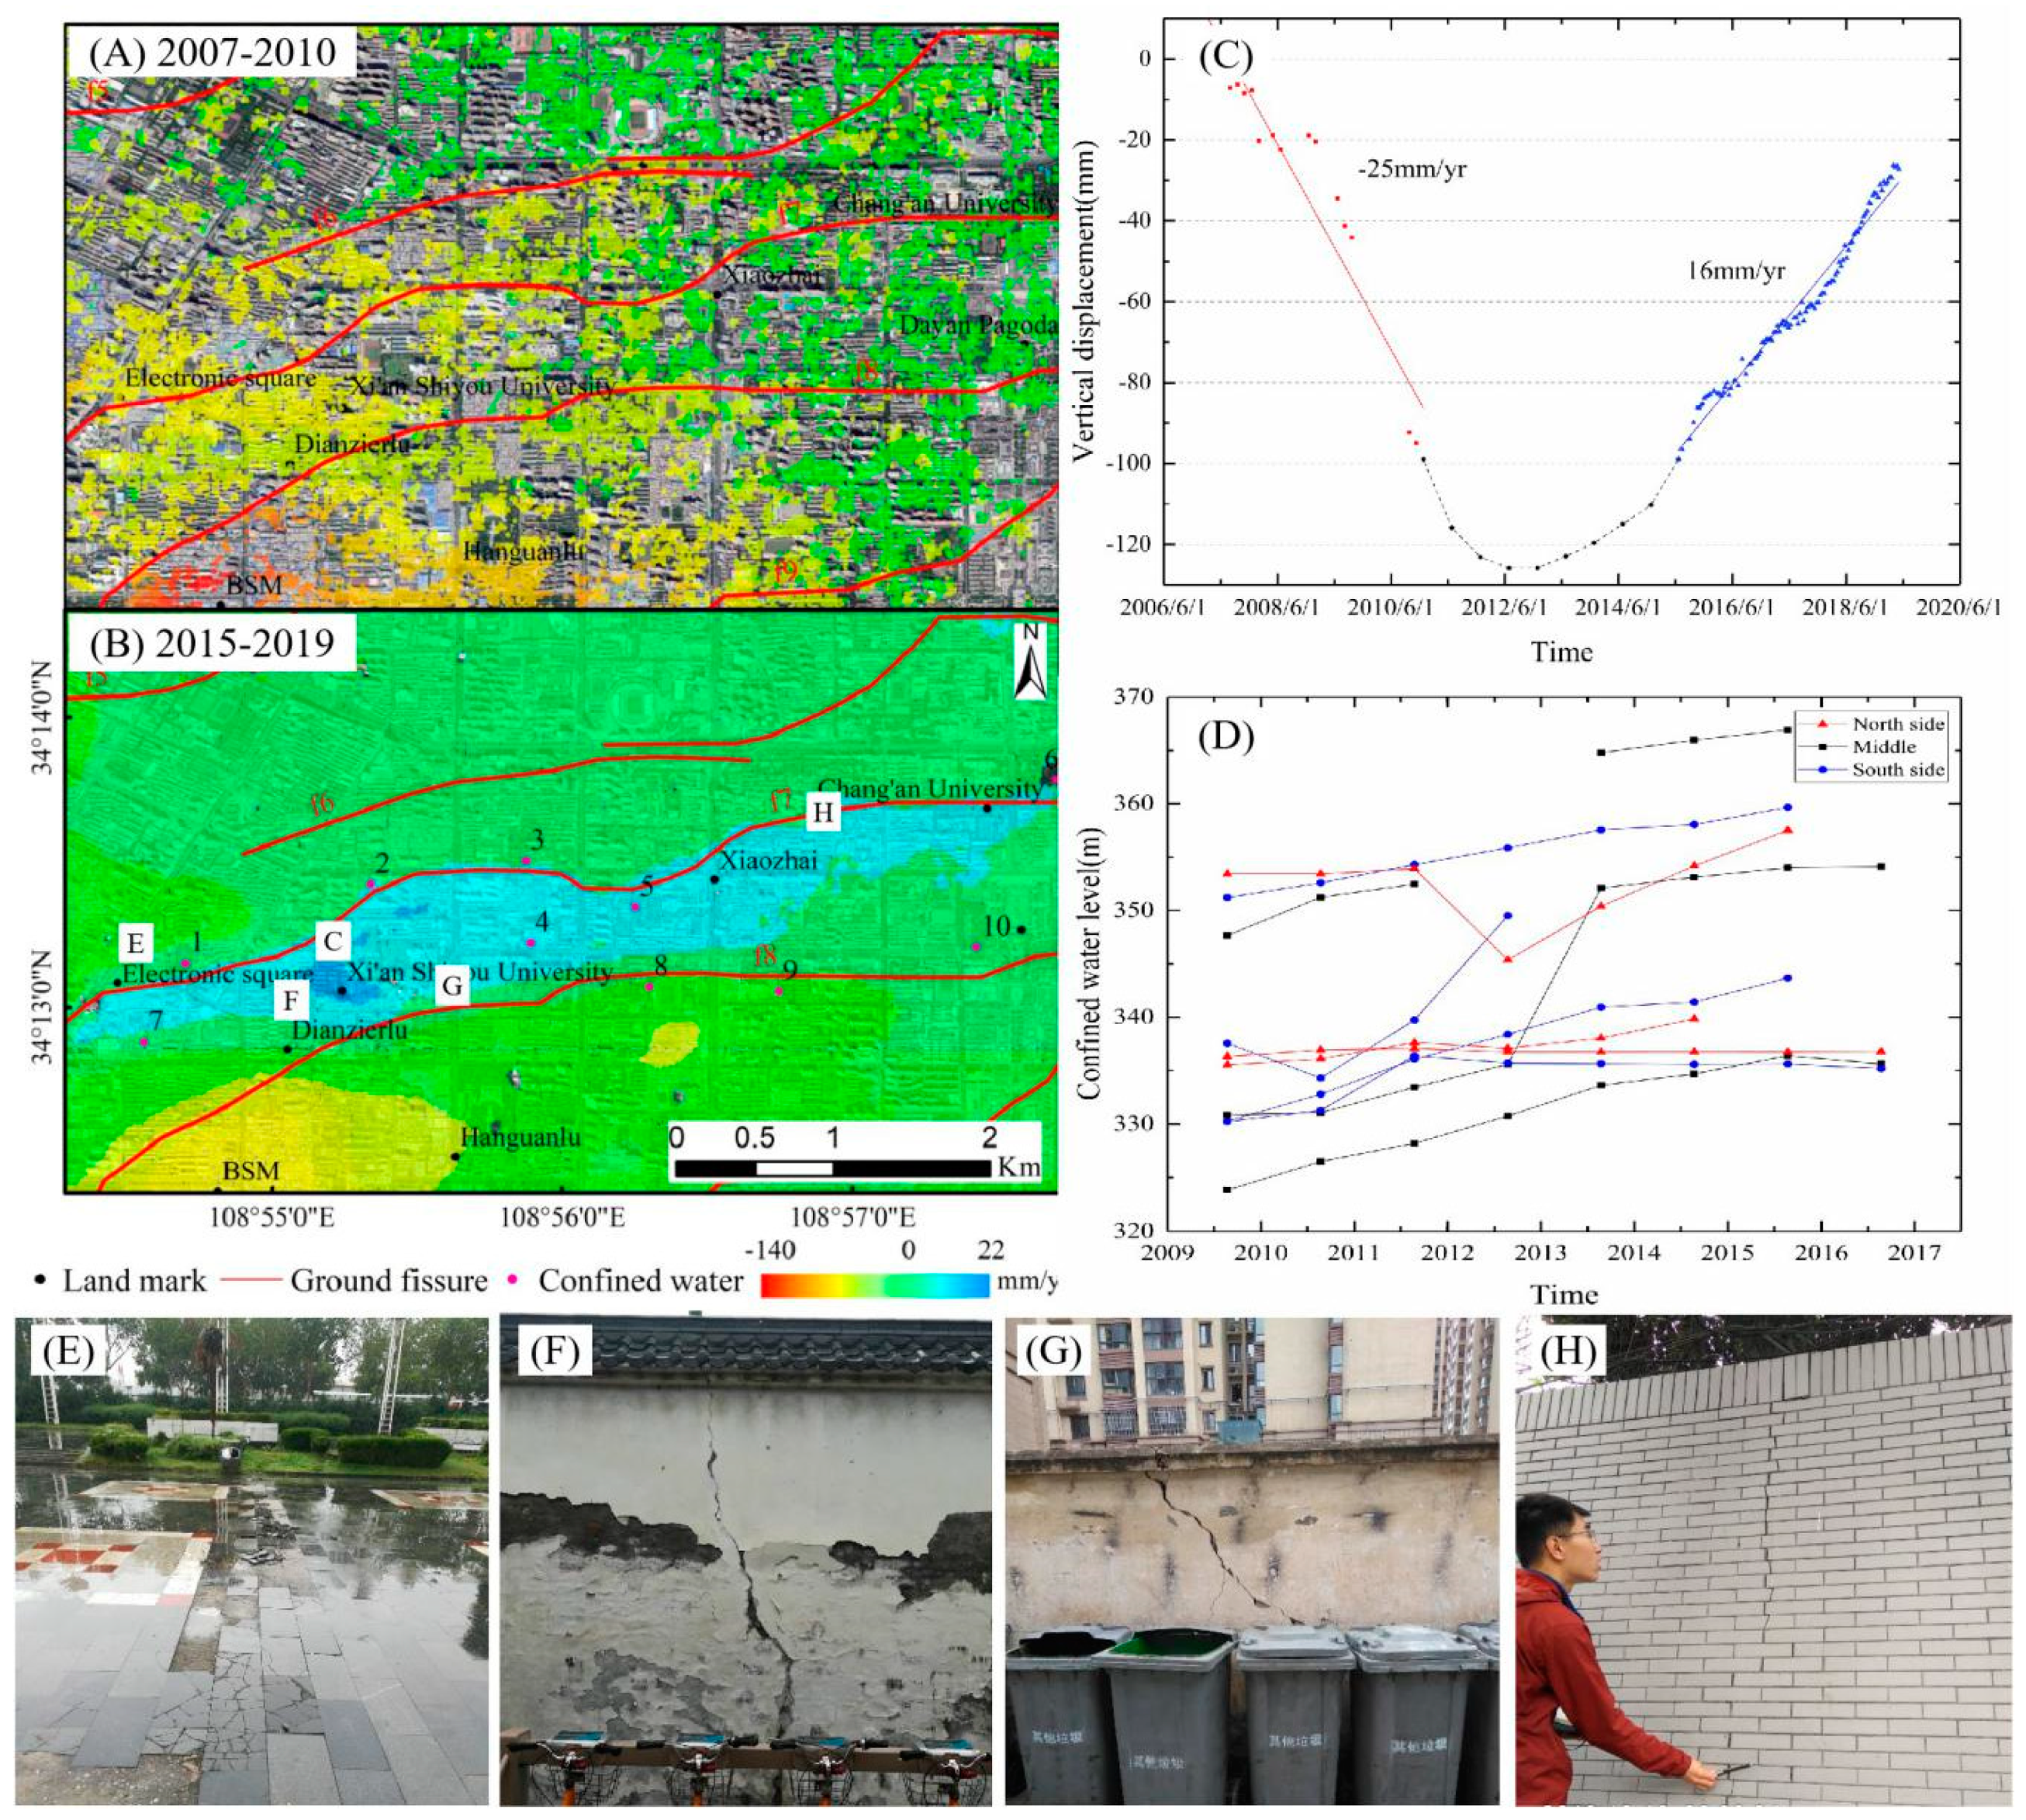
Several rebound deformation areas appeared in the study area from 2015–2019, and the most representative of which was TES-CAU located to the north of BSM District. The government has built several recharge wells around the area since 2009. From 2015–2019, this rebound region started from the southern of Electronic Square to the CAU, with an area of approximately 2.5 km2. And its boundary was controlled by f6 and f7 ground fissures (Figure 8B). The most prominent rebound position with a rate of 22 mm/yr was located near Xi’an Shiyou University, which was in the west section of the rebound area. However, there was a continuous subsidence state with a maximum rate of 32 mm/yr and no obvious regional boundary in this area between 2007–2010 (Figure 8A). It can be observed that with the change in time, the surface deformation in the region gradually evolved from continuous subsidence to rebound with volatility, and the average subsidence and rebound rate were 25 mm/yr and 16 mm/yr, respectively. It was found by monitoring that the groundwater near the rebound area showed a continuous upward trend from 2009–2017, and the trend was as follows: south > north > middle (Figure 8D). The field investigation revealed the signs of deformation in the rebound area, such as bulging and broken ground in Electronic Square (Figure 8E), cracked and damaged walls near Xi’an Shiyou University (Figure 8F,G), and cracked walls of buildings near CAU (Figure 8H). The dominant factor of rebound deformation in this area is the recovery of groundwater, which is caused by artificial replenishment under the background of the HWTP, and the existence of two ground fissures in the north and south control its area.

5. Discussion

5.1. Driving Mechanism Analysis for Land Subsidence and Rebound Deformation

Many studies on the formation mechanism of Xi’an land subsidence concluded that tectonic activity, groundwater, and other factors act together. As the groundwater rises, the magnitude of subsidence in Xi’an has slowed significantly, and some local rebound has appeared. However, relatively few studies address the driving mechanism of land subsidence and the rebound process simultaneously. To explore the driving mechanism of land subsidence and rebound deformation in typical areas of Xi’an, we analyzed the YHZ area, where was characterized by both subsidence and rebound.
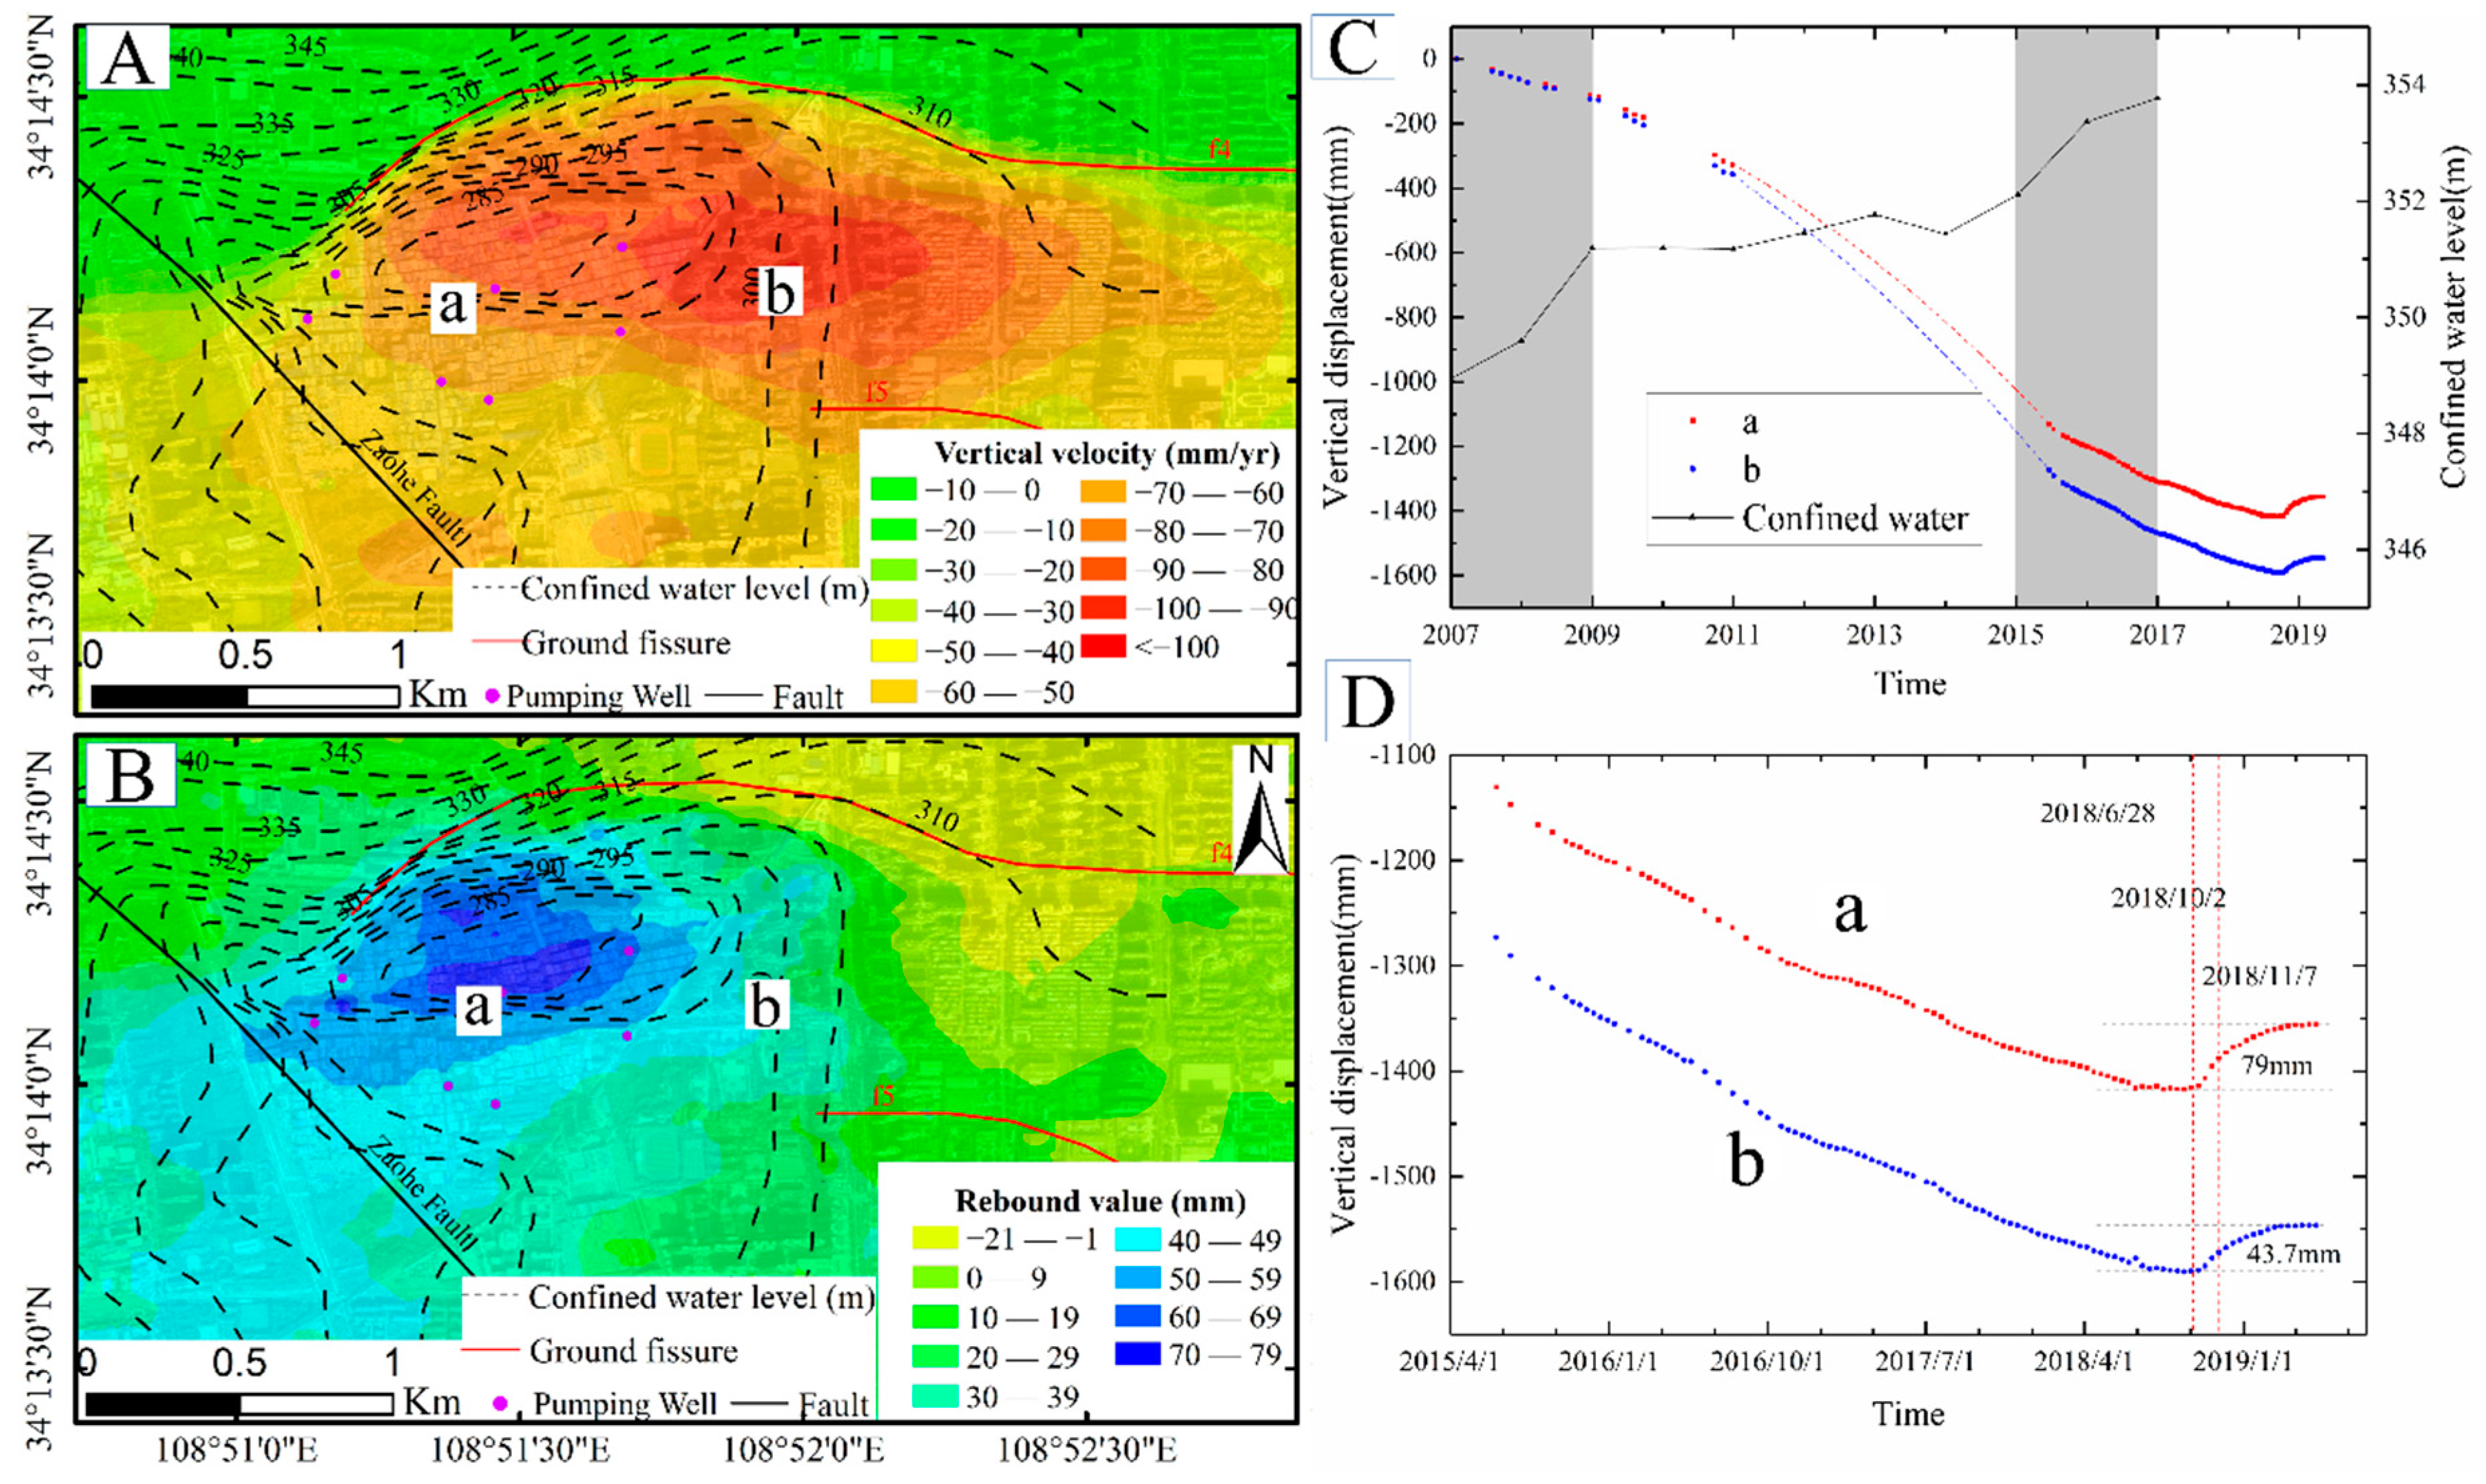
In this study, we compared and analyzed the results of the SBAS-InSAR interference analysis with the isoline of confined water [38] and the cumulative rebound amount. It is interesting to find that positions with high subsidence rates are located in the area of low hydraulic gradient, significant spatial distribution deviation occurs between the existing subsidence center and the center of the groundwater depression cone (Figure 9A). From 2015–2019, the land subsidence center was located in the Tianlanglanhushu Community with a high ground load (Figure 9A), and the maximum subsidence rate was 101 mm/yr. The center of the groundwater funnel was located in the Urban Village (Yuhua Village) on the western side (Figure 9A), and the maximum subsidence rate nearby was between 75–85 mm/yr, which was approximately 900 m from the existing subsidence center. The spatial locations of the subsidence center and the rebound center differed significantly (Figure 9B). The rebound center and the land subsidence center showed significant differences in spatial location but basically overlapped with the groundwater funnel. Seven pumping wells are located within 360 m of the rebound center, with the nearest one located in the rebound center. We extracted the cumulative deformation curves from the subsidence and rebound centers, respectively, and compared them with the monitoring data of confined water (Figure 9C). The confined water level showed a gradual upward trend over time, whereas the growth rate of cumulative variables slowed, and the difference of cumulative variables between ‘a’ and ‘b’ increased annually. From 2007–2009, the growth rate of cumulative deformation changed from fast to slow, as the confined water level increased from slow to fast. From 2015–2017, the growth rate of cumulative deformation changed from slow to fast, as the confined water level increased from fast to slow. Cumulative subsidence in the study area stopped growing in early July 2018, began to rebound in early October 2018, and reached a maximum rebound rate in early November 2018, before slowing. By May 2019, the maximum cumulative rebounds in the rebound and subsidence centers were approximately 79 and 43.7 mm, respectively (Figure 9D).
According to the analysis, the occurrence of land subsidence in the YHZ area is primarily controlled by groundwater, and long-term groundwater exploitation leads to water-level decline, which causes compaction and gaps in aquifers and consolidates and compresses stratum to form land subsidence. With the reconstruction and construction of urban villages and the closure of pumping wells, the recovery of elastic and viscoelastic deformation of the rock–soil mass is induced by the rise in groundwater, which triggers the rebound phenomenon [8]. The influence of building load on surface deformation (increase subsidence or inhibits rebound) is gradually highlighted, with the rise in confined water. Specifically, in the same geological conditions, the depression cone center overlaps with the rebound center in space instead of the subsidence center. The accumulated subsidence amount at positions with higher confined water levels is larger, whereas the rebound amount is smaller. Additionally, active ground fissures and tectonic activity control the range of land subsidence or rebound (Figure 9A,B). During 2018–2019, the groundwater recharge project in the YHZ area was not implemented [39,40], and the recovery of the confined water level was primarily due to lateral and leaking recharge caused by the influence of the hydraulic gradient and water level differences after the reduction in groundwater extraction. With the continuous rise in the confined water level after HWTP and the rapid development of urban construction in Xi’an, land subsidence is continually affected by the joint action of tectonic activity, ground fissures, and anthropogenic activities. The aggravating effect of confined water over-exploitation on land subsidence gradually weakens, and the aggravating effect of building load on land subsidence is gradually highlighted. The development of the surface rebound trend is primarily controlled by the rise in confined water levels; however, the development of this trend may be restrained by building load. Tectonic activities and ground fissures principally control the range of subsidence or the rebound zone.

5.2. Analysis of Land Subsidence Along the Subway Line

Some studies indicate that cyclic loading and vibration during subway operation can induce land subsidence along the subway line and consequently cause serious threatens to subway operations [41,42,43]. The construction of the subway in Xi’an began in 2006 after the HWTP and entered its peak period of rapid construction after 2015. Based on the InSAR analysis results from 2015 to 2019, the study obtained surface deformation data within 300 m range along the subway line under construction and operation, taking into account the limitation of vibration influence. This paper discusses the influence of subway construction and operation on land subsidence and reveals the characteristics of land subsidence along the Xi’an subway line.
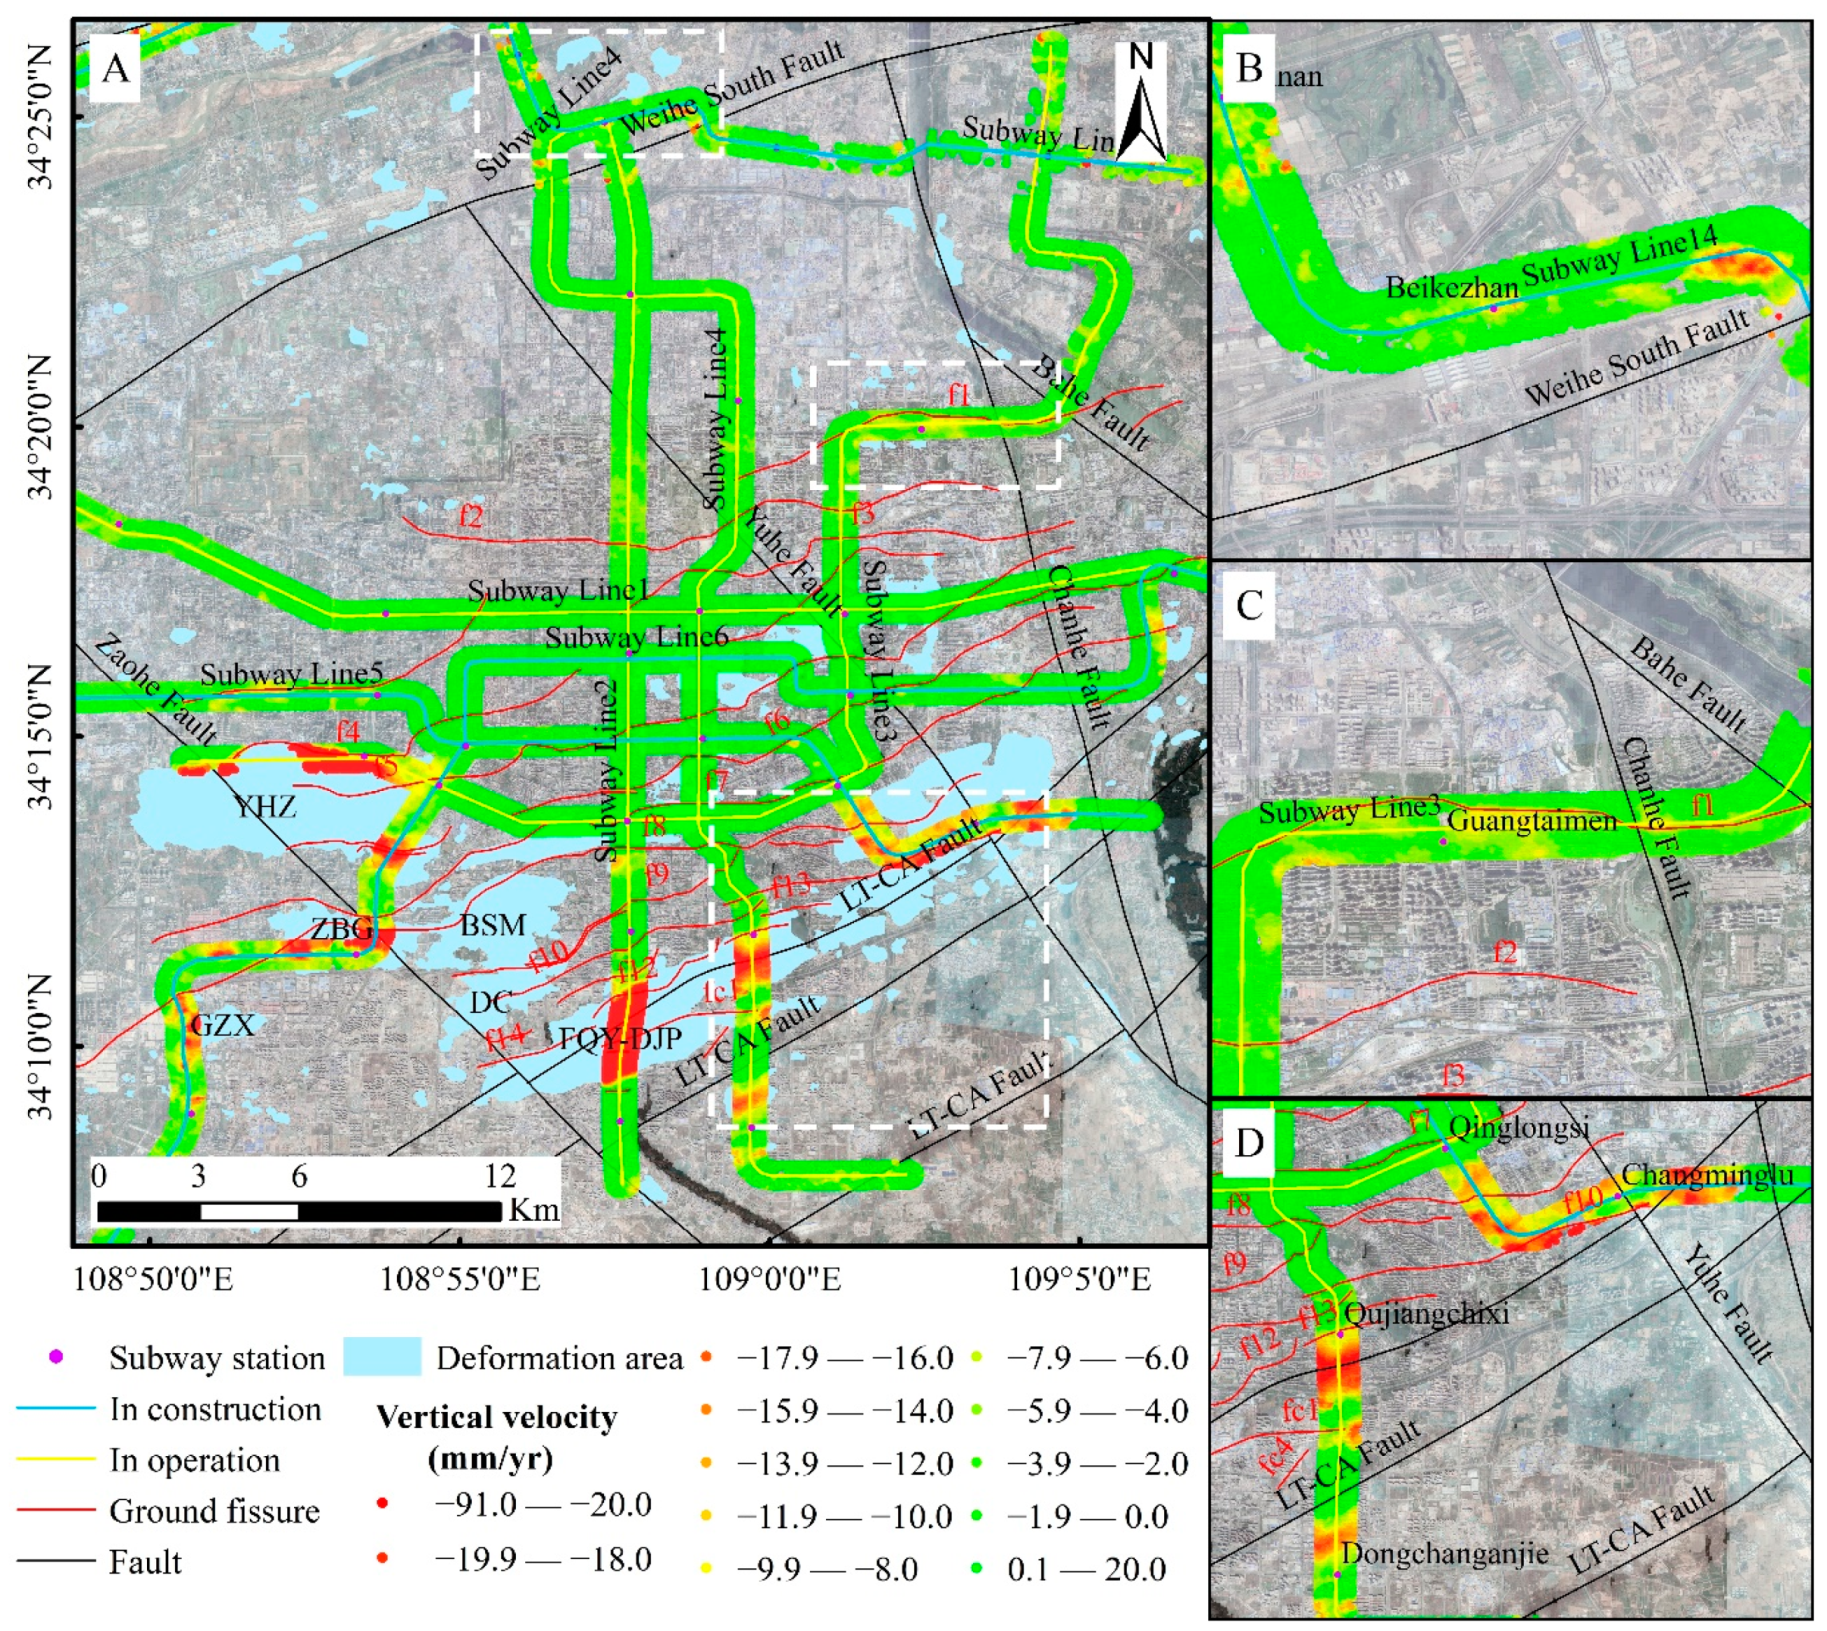
There are four subway lines in operation (1, 2, 3, and 4), and four under construction (Lines 5, 6, 9, and 14) in Xi’an (Figure 10A). All the subway lines have the local small uneven subsidence, and some subway lines have the local serious subsidence phenomenon when passing through the known subsidence areas or the active ground fissures. To compare the land subsidence phenomena along the subway lines under different conditions, 5-km sections of metro lines 3, 4, 5, and 14 were selected for specific analysis. Because of construction, Weihe South Station to Shangxian Road Station of Line 14 has multiple relatively severe and uneven land subsidence phenomena, with a deformation rate from −21 to 6 mm/yr (Figure 10B). The land subsidence of Line 3 from Xinjiamiao Station to Chanba Central Station was slow with inactive ground fissures nearby. The deformation rate of this section was from −10 to 0 mm/yr (Figure 10C). Line 4 was in operation from Qujiangchi West Station to Feitian Road Station, passing through fissures f10, f13, the FQY–DJP land subsidence zone, and the LT–CA Fault zone simultaneously. The surface deformation rate was between −22 and 6 mm/yr. Line 5, which is under construction from Xingqing Road Station to Changming Road Station, passes through the FQY–DJP subsidence zone and f8 and f10 ground fissures from west to east and had a deformation rate between −27 and 3 mm/yr (Figure 10D).
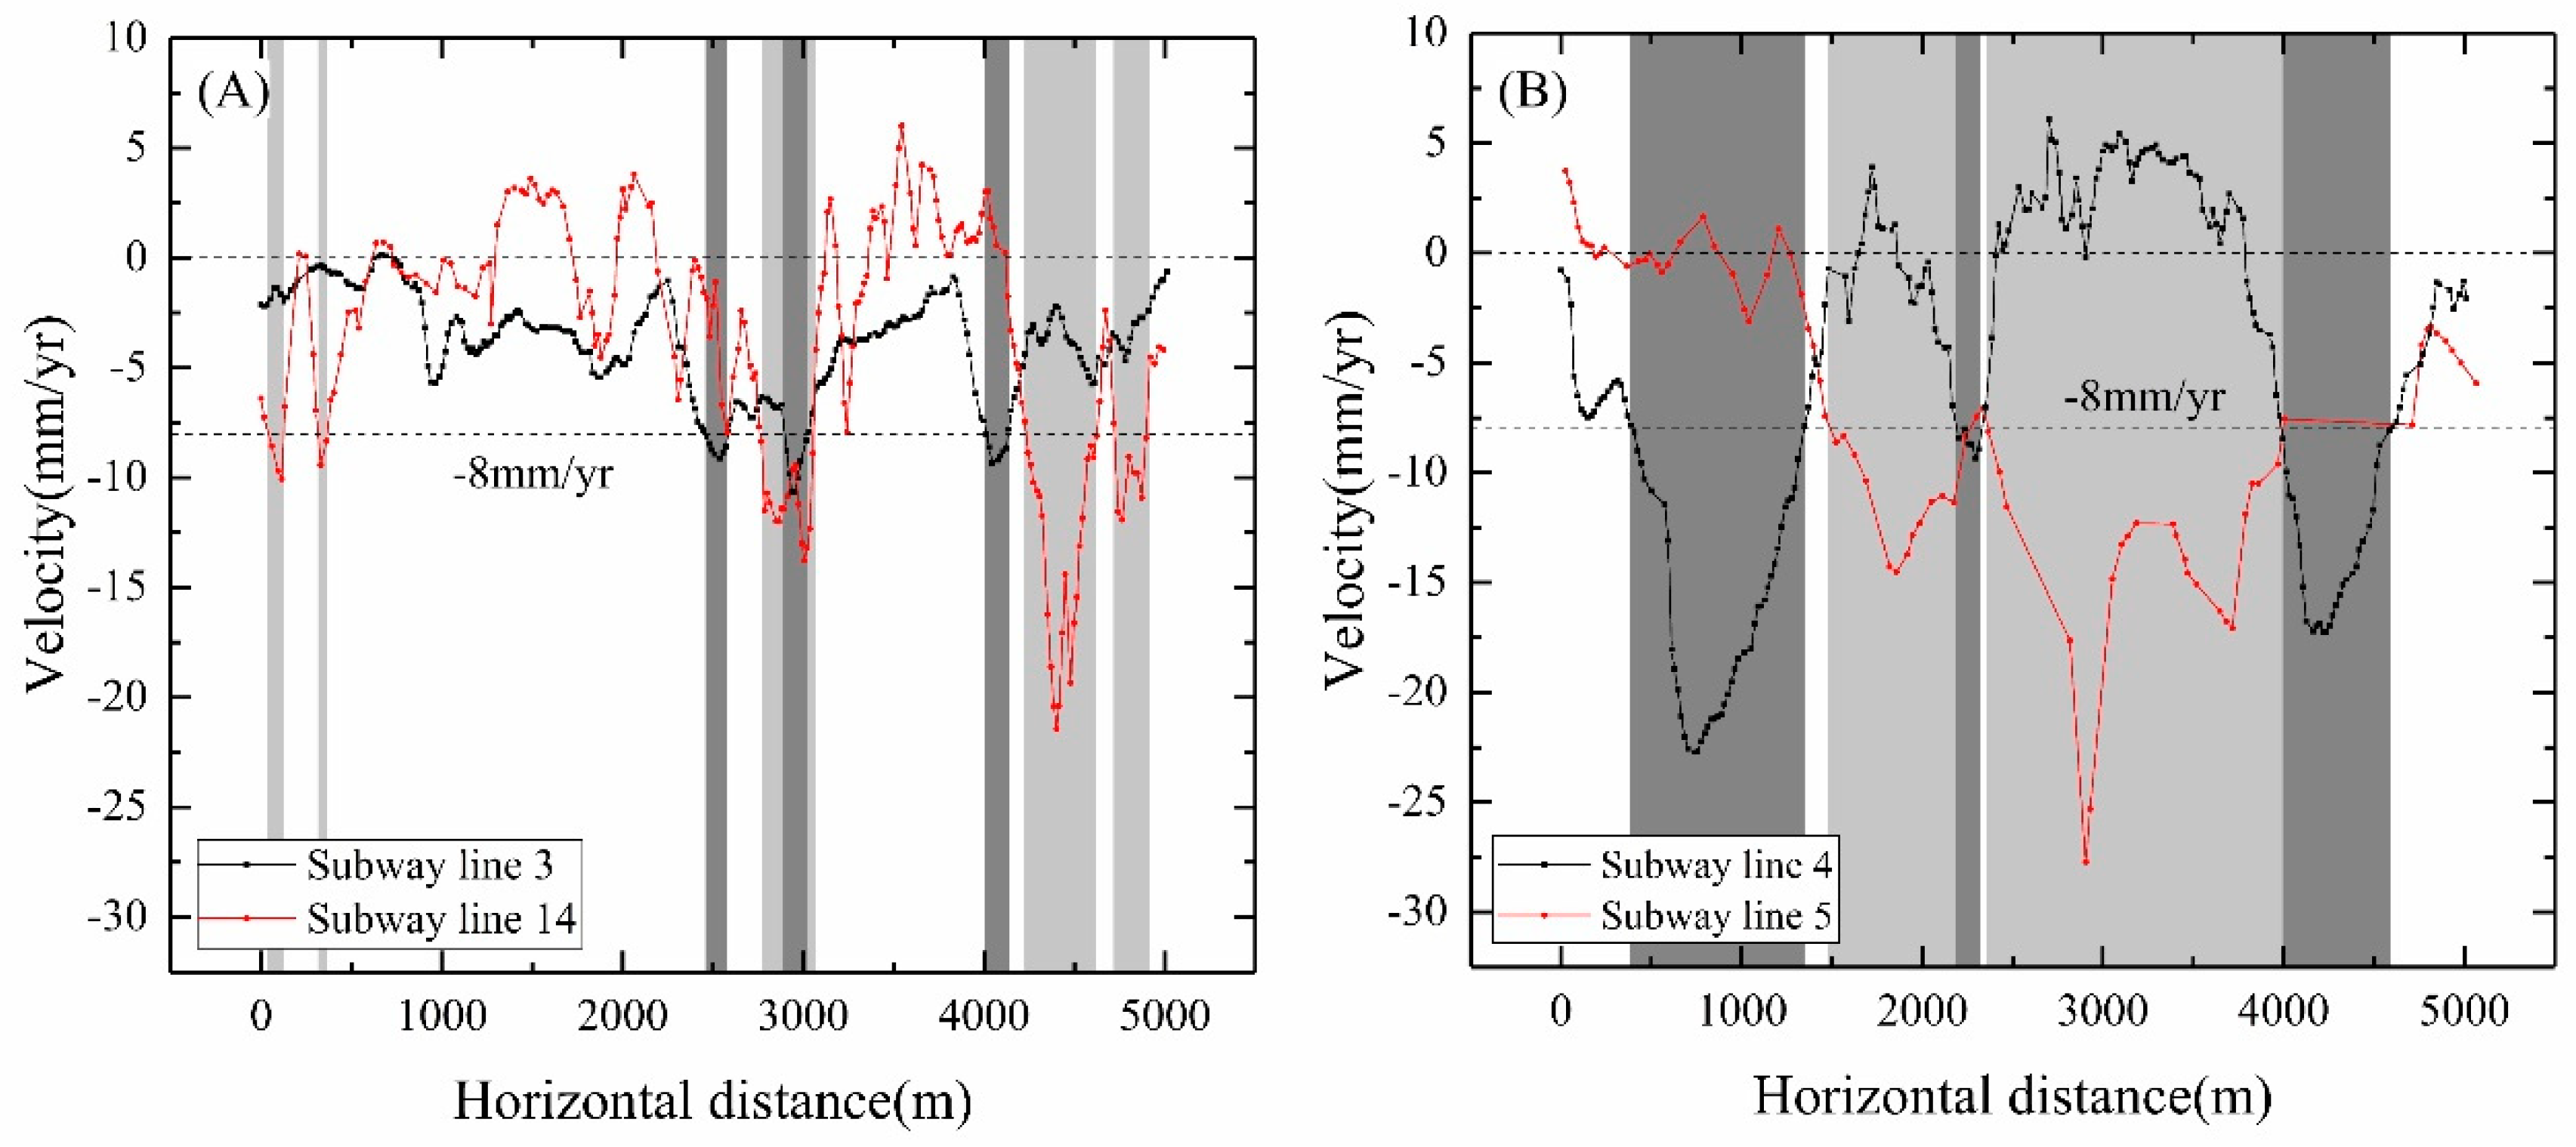
It can be seen from the deformation rate curves that there was more land subsidence than uplift sections along the subway lines during the construction than operation stage, indicating the subway in Xi’an influences land subsidence. The subsidence section along the subway line under construction was more than that along the subway line in operation; more numerous turning points on the deformation rate curve of the subway line under construction (Figure 11A,B) indicate that the influence of subway construction disturbance is greater than that of operation vibration. Subway lines have higher subsidence rates when passing through faults or ground fissures, and distinct grooves can be observed in the subsidence rate curves. It shows that the influence of subway construction and operation on land subsidence is far less than that of tectonic activities and ground fissures (Figure 10D). Additionally, continuous land subsidence causes subway line deformation, threatening normal railway operation. With the development of Xi’an City construction projects and the strengthening of urban groundwater control, the influence of the construction and operation of subway lines on land subsidence is likely to increase. In future urban planning and construction, attention should be given to subway construction and operation, and monitoring and prevention should be strengthened to ensure the safe construction and operation of subway lines.

5.3. Analysis of Land Subsidence and Rebound Trend

Different from previous studies in stages, we hope to analyze the historical trend change in land subsidence in Xi’an through the change in spatial distribution and to study its future development trend. Therefore, isolines of subsidence rates in the study area from 1959–1995, 2005–2006, and 2012 were extracted from relevant works of literature to analyze the evolution trend of land subsidence in Xi’an further by combining with our analysis results [21,23,44]. In terms of space, the main land subsidence of Xi’an was distributed in the east and south of the Xi’an Circumvallation in the early stage (1959–1995). Subsequently, it expanded in the three directions of east, west, and south, among which the east and west sides reached as far as the Fangzhicheng and Epang Palace (2005–2006). And the area increased sharply from 40 to 140 km2, reaching a maximum recorded (Figure 12A,B). Afterward, the main settlement area shrank to 35 km2, with the east and north sides being the most significant (2007–2010), but then the area expanded slightly and migrated southward (2012–2013) (Figure 12C). Finally, the area of the main settlement was reduced again and dispersed into multiple blocks, in which the settlement within the range of XZ to SYV disappeared, and the settlement near DJP was significantly weakened (2015–2019) (Figure 12D).
Considering the influence of confined water flow field, high-rise buildings, subway construction, and other factors on the development of land deformation in Xi’an, the study selected historical data from different years to conduct superposition analysis with known deformation areas and subway lines (Figure 13). From 2008–2017, the confined water level in the study area rose slowly, whereas a sharp increase was observed near the cone of depression. The high-rise buildings also increased significantly, especially along the subway lines. The variation in high-rise buildings and the cone of depression is in good spatial agreement with the land deformation areas and subway lines. The land subsidence in the study area was primarily located in the area with dense contour lines at the edge of the groundwater depression cones, which are the areas with a large hydraulic gradient. Whereas the two rebound locations were located at the center of the cones of depression. With the further recovery of confined water, land subsidence will continue to slow; however, the construction of multiple high-rise buildings and subway lines will partially curb this trend.
Land subsidence and rebound in Xi’an City is controlled by tectonic faults, active ground fissures, and anthropogenic activities (e.g., exploitation or recharge of groundwater, utilization of underground space, and new district construction). Considering the relationship between land subsidence and anthropogenic activities, and based on summarizing and analyzing the overall change characteristic and dynamic changes in groundwater level, the trend of land subsidence and rebound in the Xi’an area was predicted. Since 2005, the overall subsidence area has been decreasing, and the subsidence trend is gradually easing. It is expected that due to the rise in confined water level after HWTP in the main settlement centers of BSM and FQY in the main urban areas, the overall settlement problem will be greatly alleviated, the cumulative settlement will stabilize, and the annual settlement rate will also tend to slow down (Figure 13). Meanwhile, as the groundwater level rises, in some areas, including YHZ, TES-CAU, and BT-WSR, the strata will rebound in a small range for a short time. The rebound area will gradually increase, and the rebound areas in the cones of depression will be expanded further.
However, with the increase in anthropogenic activities, especially the construction of subways and high-rise buildings, the land subsidence mitigation trend along the subway or near high-rise buildings will be restrained, and the subsidence rate may locally increase. The construction of the new districts, such as Qujiang and Xixian, will aggravate or induce land subsidence to a certain extent. Due to the large-scale construction of the Qujiang New District and Xixian New District and the utilization of groundwater during the construction process, the land subsidence tends to increase locally or as a whole. Although the overall settlement of the new district can be controlled, uneven local settlement tends to increase. It is expected that the amount of land subsidence caused by the construction of the Xixian New District will increase, and the uneven settlement range will be further expanded. If the groundwater is improperly used and managed, and as the geological structure of the new district is highly consistent with the main urban area of Xi’an, it may induce overall large-scale settlement.

6. Conclusions

In this study, temporal and spatial evolution characteristics of land subsidence in Xi’an after the HWTP (2007–2019) were analyzed by SBAS-InSAR technology, the processes and causes of land subsidence and rebound in typical areas were analyzed, and factors influencing land subsidence along different subway lines were investigated. Finally, the development trend of land subsidence and rebound deformation was analyzed and predicted. The primary conclusions are as follows:
(1) From 2007–2019, the land subsidence area of Xi’an gradually shrank, and the subsidence rate gradually slowed. The maximum subsidence rate in the study area decreased from 150 to 91 mm/yr, and the area gradually dispersed into multiple subsidence areas dominated by YHZ, BSM, and FQY–DJP, showing an evident dispersion trend. Significant southward migration occurred in the FQY–DJP subsidence area under the influence of the LT–CA Fault and rapid urbanization. Additionally, the TES-CAU and BT–WSR rebound areas have maximum rebound rates of approximately 22 mm/yr, where the process and extent of rebound deformation were determined by the local groundwater recovery and ground fissures.
(2) Regarding groundwater recovery, land subsidence is still affected by confined water, tectonic faults, ground fissures, and anthropogenic activities. However, the strengthening effect of confined water on land subsidence gradually weakens and induces land rebound in local areas. The strengthening effect of the rapidly increasing building load on land subsidence is gradually highlighted, exacerbating the land subsidence trend or restraining local rebound trends. Tectonic faults and ground fissures primarily control the area of subsidence or rebound. The different high-rise building loads caused different geospatial ground subsidence centers in the YHZ area, the center of the confined water depression cone, and ground rebound center.
(3) Uneven land subsidence along subway lines is related to construction and operation. The influence of engineering disturbance due to construction on the land subsidence is greater than that of the operational vibration of the subway lines; however, the resulting land subsidence is relatively weak compared with that of factors, such as faults, ground fissures, and excessive exploitation of groundwater. Many subway lines, including those in operation, construction, and planning, pass through the ground fissures and land subsidence areas in Xi’an, and the interaction between the construction and operation of subway lines and land subsidence may be strengthened. Monitoring and preventive measures should be strengthened to ensure the safety of subway lines in future planning, construction, and operation.
(4) Based on historical land deformation data and the results of the driving mechanism analysis, the existing land subsidence area in Xi’an will likely be further reduced and differentiated into smaller non-uniform subsidence areas, and the land subsidence rate will continue slowing, whereas uneven settlement range may extend to the Qujiang and Xixian New District due to the rapid urbanization. With the continuous rise in groundwater after HWTP, the extent of rebound deformation will increase, and the rebound areas will be mainly distributed in the groundwater depression cones; however, because of the joint influence of engineering activities and rock–soil properties, the rebound trend will be temporary.
Our findings could improve our understanding of the driving effect of large-scale engineering activities, such as the Water Transfer Project and subway line construction on subsidence and rebound, and have significant implications for land subsidence hazard mitigation, underground space utilization, and water resource management in Xi’an or similar regions. Unfortunately, the lack of more detailed groundwater head data and geotechnical parameters of the compressible layer limited our clearer understanding of the driving mechanism and quantitative prediction of land subsidence and uplift. In the future, in-situ monitoring of groundwater levels and aquifer recharge, and laboratory test is needed to enhance our understanding of the long-term combined effect of groundwater recovery and underground space utilization on the land subsidence and rebound for further risk assessment.

Author Contributions

W.S. and G.C. designed this study, performed the main analysis, and wrote the paper. X.M. was mainly involved in supervision and discussion. Y.Z. contributed to the revising of the manuscript. Y.C. and W.J. contributed significantly to the field investigation. Y.D. and M.Z. provide the basic data and revise the manuscript. All authors have read and agreed to the published version of the manuscript.

Funding

This study was jointly supported by the National Key Research and Development Program of China (Grant Nos. 2017YFC1501005 and 2018YFC1504704), National Natural Science Foundation of China (Grant Nos. 41702292 and 42007232), Science and Technology Major Project of Gansu Province (Grant No. 19ZD2FA002) and the Fundamental Research Funds for the Central Universities (Grant No. lzujbky-2020-kb49).

Acknowledgments

The Sentinel-1A and ALOS images were provided by the European Space Agency and the Japan Aerospace Exploration Agency, respectively. We would like to acknowledge Fumeng Zhao, Shiqiang Bian, and Yunpeng Yang for their help in the field investigation and data processing.

Conflicts of Interest

The authors declare no conflict of interest.

References

  1. Xue, Y.; Zhang, Y.; Ye, S.; Wu, J.; Li, Q. Land subsidence in China. Environ. Geol. 2005, 48, 713–720. [Google Scholar] [CrossRef]
  2. Xu, Y.; Shen, S.; Cai, Z.; Zhou, G. The state of land subsidence and prediction approaches due to groundwater with drawal in China. Nat. Hazards 2008, 45, 123–135. [Google Scholar] [CrossRef]
  3. Galloway, D.L.; Burbey, T.J. Review: Regional land subsidence accompanying groundwater extraction. Hydrogeol. J. 2011, 19, 1459–1486. [Google Scholar] [CrossRef]
  4. Chen, B.; Gong, H.; Lei, K.; Li, J.; Zhou, C.; Gao, M.; Guan, H.; Lv, W. Land subsidence lagging quantification in the main exploration aquifer layers in Beijing plain, China. Int. J. Appl. Earth Obs. Geoinf. 2019, 75, 54–67. [Google Scholar] [CrossRef]
  5. Rateb, A.; Abotalib, A.Z. Inferencing the land subsidence in the Nile Delta using Sentinel-1 satellites and GPS between 2015 and 2019. Sci. Total Environ. 2020, 729, 138868. [Google Scholar] [CrossRef] [PubMed]
  6. Wang, Y.; Wang, Q.; He, Y.; Zheng, Z. Analysis and prediction of ground fractures and surface subsidence hazard in Xi’an city using projection tracing. J. Eng. Geol. 1999, 7, 30–34. (In Chinese) [Google Scholar]
  7. Suo, C.; Wang, D.; Liu, Z. Land fracture and subsidence prevention in Xi’an. Quat. Sci. 2005, 25, 23–28. (In Chinese) [Google Scholar]
  8. Wang, B.; Zhao, C.; Zhang, Q.; Peng, M. Sequential InSAR Time Series Deformation Monitoring of Land Subsidence and Rebound in Xi’an, China. Remote Sens. 2019, 11, 2854. [Google Scholar] [CrossRef] [Green Version]
  9. Peng, M.; Zhao, C.; Zhang, Q.; Lu, Z.; Li, Z. Research on spatial-temporal land deformation (2012–2018) over Xi’an, China, with Multi-Sensor SAR Datasets. Remote Sens. 2019, 11, 664. [Google Scholar] [CrossRef] [Green Version]
  10. Peng, J.; Sun, X.; Wang, W.; Sun, G. Characteristics of land subsidence, earth fissures and related disaster chain effects with respect to urban hazards in Xi’an, China. Environ. Earth Sci. 2016, 75, 1190. [Google Scholar] [CrossRef]
  11. Jung, H.C.; Kim, S.W.; Jung, H.S.; Min, K.D.; Won, J.S. Satellite observation of coal mining subsidence by persistent scatter analysis. Eng. Geol. 2007, 92, 1–13. [Google Scholar] [CrossRef]
  12. Ferretti, A.; Prati, C.; Rocca, F. Nolinear Subsidence Rate Estimation Using Permanent Scatterers in Differential SAR Interferometry. IEEE Trans. Geosci. Remote Sens. 2000, 38, 2202–2212. [Google Scholar] [CrossRef] [Green Version]
  13. Sousa, J.J.; Ruiz, A.M.; Hanssen, R.F.; Bastos, L.; Gil, A.J.; Galindo-Zaldívar, J.; Sanz de Galdeano, C. PS-InSAR processing methodologies in the detection of field surface deformation Study of the Granada basin (Central Betic Cordilleras, southern Spain). J. Geodyn. 2010, 49, 181–189. [Google Scholar] [CrossRef]
  14. Chaussard, E.; Wdowinski, S.; Cabral-Cano, E.; Amelung, F. Land subsidence in central Mexico detected by ALOS InSAR time-series. Remote Sens. Environ. 2014, 140, 94–106. [Google Scholar] [CrossRef]
  15. Bianchini, S.; Raspini, F.; Solari, L.; Soldato, M.D.; Casagli, N. From picture to movie: Twenty years of ground deformation recording over tuscany region (Italy) with satellite insar. Front. Earth Sci. 2018, 6, 177. [Google Scholar] [CrossRef] [Green Version]
  16. Zeng, R.; Meng, X.; Wasowski, J.; Dijkstra, T.; Bovenga, F.; Xue, Y.; Wang, S. Ground instability detection using PS-InSAR in Lanzhou, China. Q. J. Eng. Geol. Hydrogeol. 2014, 47, 307–321. [Google Scholar] [CrossRef]
  17. Zhang, Y.; Meng, X.; Chen, G. Detection of geohazards in the Bailong River Basin using synthetic aperture radar interferometry. Landslides 2016, 13, 1273–1284. [Google Scholar] [CrossRef]
  18. Du, Y.; Feng, G.; Liu, L.; Fu, H.; Wen, D. Understanding Land Subsidence Along the Coastal Areas of Guangdong, China, by Analyzing Multi-Track MTInSAR Data. Remote Sens. 2020, 12, 299. [Google Scholar] [CrossRef] [Green Version]
  19. Chaussard, E.; Amelung, F.; Abidin, H.; Hong, S.H. Sinking cities in Indonesia: ALOS PALSAR detects rapid subsidence due to groundwater and gas extraction. Remote Sens. Environ. 2013, 128, 150–161. [Google Scholar] [CrossRef]
  20. Zhao, C.; Zhang, Q.; Ding, X.; Lu, Z.; Yang, C.; Qi, X. Monitoring of land subsidence and ground fissures in Xian, China 2005-2006:mapped by SAR interferometry. Environ. Geol. 2009, 58, 1533–1540. [Google Scholar] [CrossRef]
  21. Wang, X.; Zhang, J.; Zhang, Q.; Zhao, C. Inferring Multi-dimensional Deformation Filed in Xi’an by Combining InSAR of Ascending and Descending Orbits with GPS Data. Acta Geod. Cartogr. Sin. 2016, 45, 810–817. [Google Scholar] [CrossRef]
  22. Qu, F.; Zhang, Q.; Lu, Z.; Zhao, C.; Yang, C.; Zhang, J. Land subsidence and ground fissures in Xi’an, China 2005-2012 revealed by multi-band InSAR time-series analysis. Remote Sens. Environ. 2014, 155, 366–376. [Google Scholar] [CrossRef]
  23. Li, M.; Ge, D.; Zhang, L.; Wang, Y.; Guo, X.; Wang, Y.; Zhang, D. Research on development characteristics and failure mechanism of land subsidence and ground fissure in Xi’an, monitored by using time-series SAR interferometry. Geomat. Nat. Hazards Risk 2019, 10, 699–718. [Google Scholar] [CrossRef] [Green Version]
  24. Zhang, M.; Dong, Y.; Zhang, X.; Liu, J.; Zeng, Q. Prediction of land subsidence and Its mitigation methods—A case study in the new urban district of Xi’an-Xianyang. Chin. J. Geol. Hazard Control 2013, 23, 115–118. (In Chinese) [Google Scholar]
  25. Zhang, Y.; Luo, L.; Wang, W. Computed Subsidence by Dislocation Model in Xi’an City. Northwestern Seismol. J. 2008, 30, 17–20. (In Chinese) [Google Scholar]
  26. Wang, Q.; Peng, J.; Jiang, Z.; Teng, H. Numerical simulation and layerwise mark monitoring of land subsidence and ground fissures of typical section in Xi’an. Rock Soil Mech. 2014, 35, 3298–3309. [Google Scholar] [CrossRef]
  27. Ling, Q.; Qu, W.; Zhang, Q.; Kong, L.; Li, J. Influennce of groundwater exploitation on the land subsidence of Xi’an hightech zone. Prog. Geophys. 2018, 33, 1232–1238. (In Chinese) [Google Scholar] [CrossRef]
  28. Dong, Y.; Zhang, M.; Liu, J.; Zhang, X.; Feng, L. Water Release Compaction Effect and Microstructure Change of Aquifer System in Xi’an. Northwestern Geol. 2019. (In Chinese) [Google Scholar] [CrossRef]
  29. Wang, H.; Yue, C.; Shi, J. Lowering of groundwater level and its negative environment effects in the area of Xi’an. Hydrogeol. Eng. Geol. 2005, 40, 100–103. (In Chinese) [Google Scholar] [CrossRef]
  30. Peng, J.; Su, S. Fractal Dimensions of Active Faults and Geologic Hazards in Weihe Basin. J. Northwest Univ. 1993, 23, 555–561. (In Chinese) [Google Scholar]
  31. Berardino, P.; Fornaro, G.; Lanari, R.; Sansosti, E. A New Algorithm for Surface Deformation Monitoring Based on Small Baseline Differential SAR Interferograms. IEEE Trans. Geosci. Remote Sens. 2002, 40, 2375–2382. [Google Scholar] [CrossRef] [Green Version]
  32. Colm, J.; Luke, B.; Alessandro, N. Environmental baseline monitoring for shale-gas development: Insights for monitoring ground motion using InSAR analysis. Sci. Total Environ. 2019, 696, 134075. [Google Scholar] [CrossRef]
  33. Tizzani, P.; Berardino, P.; Casu, F.; Euillades, P.; Manzo, M.; Ricciardi, G.P.; Zeni, G.; Lanari, R. Surface deformation of Long Valley caldera and Mono Basin, California, investigated with the SBAS-InSAR approach. Remote Sens. Environ. 2007, 108, 277–289. [Google Scholar] [CrossRef]
  34. Cigna, F.; Bateson, L.B.; Jordan, C.J.; Dashwood, C. Simulating SAR geometric distortions and predicting Persistent Scatter densities for ERS-1/2 and ENVISAT C-band SAR and InSAR applications: Nationwide feasibility assessment to monitor the landmass of Great Britain with SAR imagery. Remote Sens. Environ. 2014, 152, 441–466. [Google Scholar] [CrossRef] [Green Version]
  35. Rosi, A.; Agostini, A.; Tofani, V.; Casagli, N. A Procedure to Map Subsidence at the Regional Scale Using the Persistent Scatterer Interferometry (PSI) Technique. Remote Sens. 2014, 6, 10510–10522. [Google Scholar] [CrossRef]
  36. Cigna, F.; Osmanoglu, B.; Cabral-Cano, E.; Dixon, T.H.; Avila-Olivera, J.A.; Garduno-Monroy, V.H.; DeMets, C.; Wdowinski, S. Monitoring land subsidence and its induced geological hazard with Synthetic Aperture Radar Interferometry: A case study in Morelia, Mexico. Remote Sens. Environ. 2012, 117, 146–161. [Google Scholar] [CrossRef]
  37. Chen, G.; Zhang, Y.; Zeng, R.; Yang, Z.; Chen, X.; Zhao, F.; Meng, X. Detetion of Land Subsidence Associated with Land Creation and Rapid Urbanization in the Chinese Loess Plateau Using Time Series InSAR: A Case Study of Lanzhou New District. Remote Sens. 2018, 10, 270. [Google Scholar] [CrossRef] [Green Version]
  38. Zhang, J.; Zhang, H.; Zhang, M.; Li, Y.; Dong, Y.; Zhang, Q. Da preliminary study of Land Subsidence in the F4 Ground Fissure, Yuhuazhai area, Xi’an, China. J. Geol. Hazard Environ. Preserv. 2017, 28, 31–37. (In Chinese) [Google Scholar] [CrossRef]
  39. Shaanxi Government Procurement Network. Available online: http://www.ccgp-shaanxi.gov.cn/noticeDetail.do?noticeguid=8a85be33667756bc0166806259b553c6 (accessed on 10 September 2018).
  40. Xi’an Water Resources Center. Available online: https://www.meipian.cn/1yyjlr93 (accessed on 12 March 2019).
  41. Perissin, D.; Wang, Z.; Lin, H. Shanghai subway tunnels and highways monitoring through cosmo-skymed persistent scatterers. ISPRS J. Photogramm. Remote Sens. 2012, 73, 58–67. [Google Scholar] [CrossRef]
  42. Hu, B.; Wang, H.; Sun, Y.; Hou, J.; Liang, J. Long-Term Land Subsidence Monitoring of Beijing (China) Using the Small Baseline Subset (SBAS) Technique. Remote Sens. 2014, 6, 3648–3661. [Google Scholar] [CrossRef] [Green Version]
  43. Wang, H.; Feng, G.; Xu, B.; Yu, Y.; Li, Z.; Du, Y.; Zhu, J. Deriving Spatio-Tmporal Development of Ground Subsidence Due to Subway Construction and Operation in Delta Regions with PS-InSAR Data: A Case Study in Guangzhou, Chins. Remote Sens. 2017, 9, 1004. [Google Scholar] [CrossRef] [Green Version]
  44. Wu, F.; Fang, W.; Song, L.; Wang, F.; Zhu, X.; Jing, B.; Dong, X.; Zuo, Y. Analysis of the relationship among Geothermal water exploitation, Ground Subsidence and Ground Fissures in Xi’an city, China. Seismol. Geol. 2002, 24, 234–240. (In Chinese) [Google Scholar]
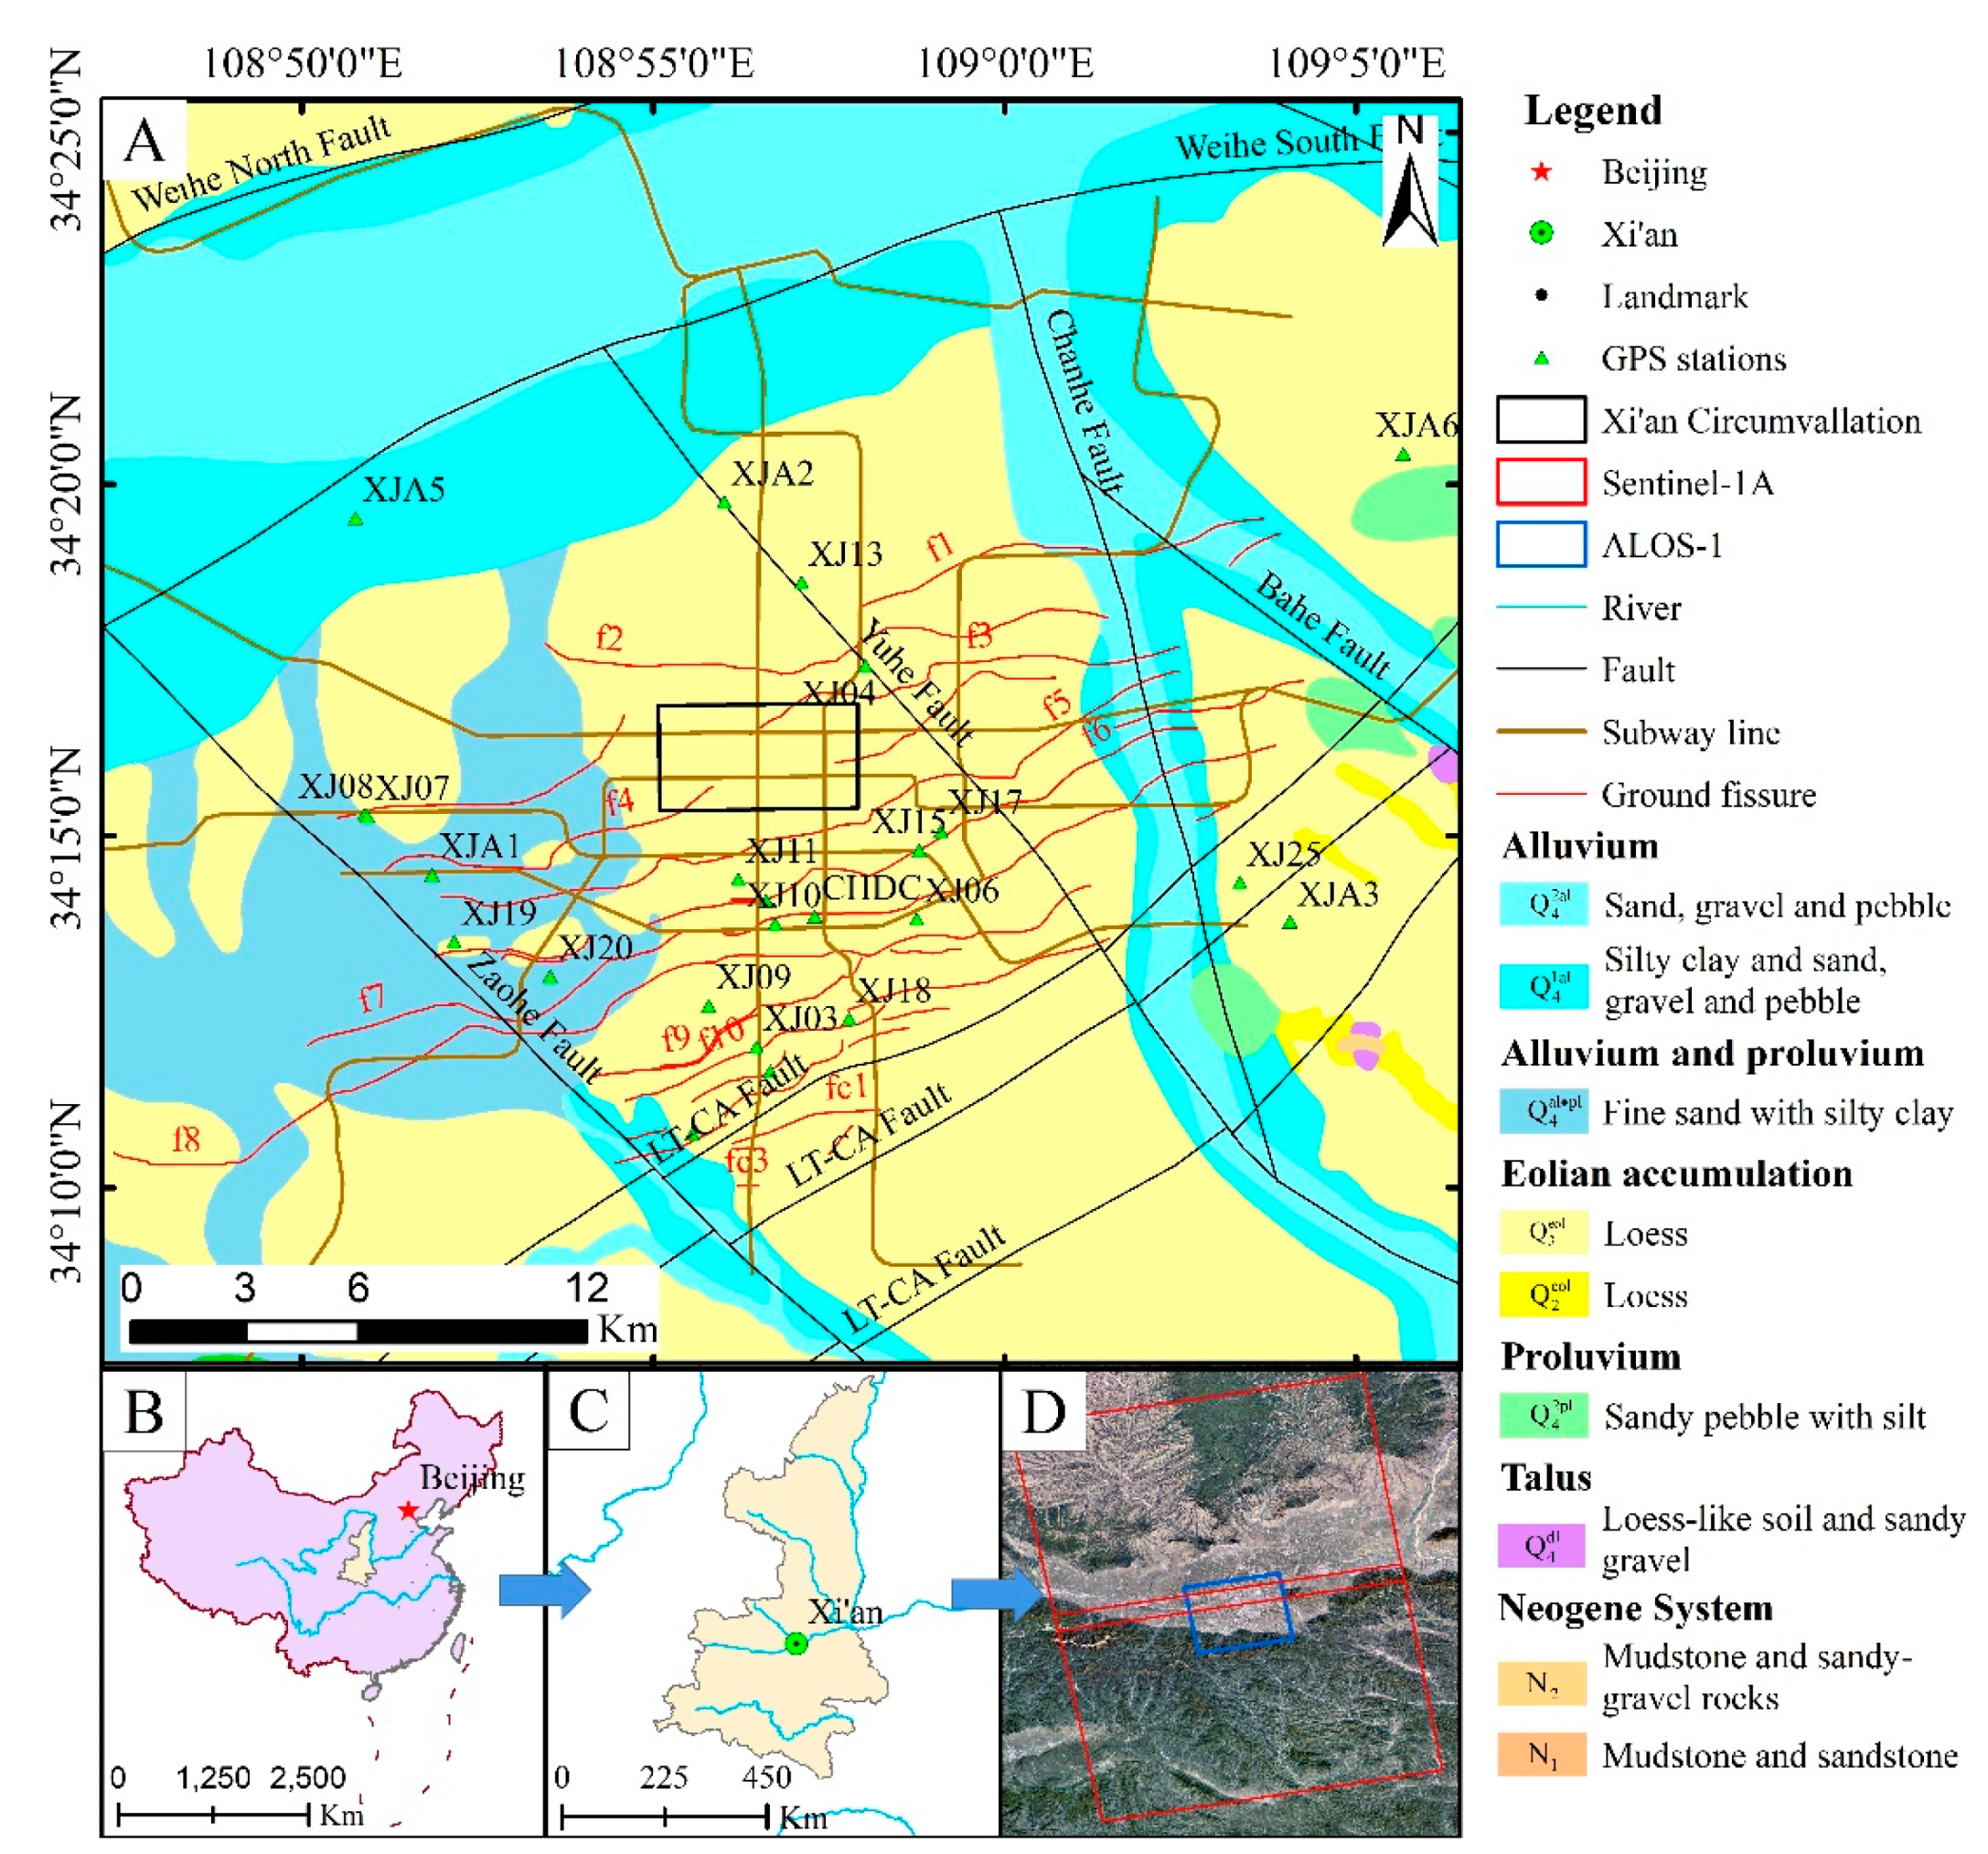
Figure 1. Overview of the research area. (A) Distribution of geology, tectonic faults, ground fissures, and subway lines; (B) Location of Shaanxi Province in China; (C) Location of the research area in Shaanxi Province; (D) Radar satellite data range.
Remotesensing 12 03756 g001
Figure 2. Logical workflow for the small baseline subset–Synthetic Aperture Radar Interferometry (SBAS-InSAR) module. STRM and POD are the abbreviations of Shuttle Radar Topography Mission and Precise Orbit Determination, respectively. MCF represents Minimum Cost Flow. GCPs stands for Ground Control Points.
Remotesensing 12 03756 g002
Figure 3. InSAR-derived velocity map in the vertical direction of Xi’an. (A) Linear deformation trend of Advanced Land Observing Satellite-1 (ALOS-1) from 2007–2010. (B) Linear deformation trend of Sentinel-1A from 2015–2019. The positions circled by red and blue ellipses in the figure are the subsidence and rebound regions, separately. The black rectangle in both maps is the broad outline of Xi’an circumvallation. And the black pentacle indicates the location of the reference point.
Remotesensing 12 03756 g003
Figure 4. Comparison of surface deformation SBAS-InSAR analysis results with existing data. (A) Comparison of cumulative subsidence in 2009 [22]; (B) Comparison of vertical deformation velocity in 2015. The ALOS result during 2015 was cited from [9].
Remotesensing 12 03756 g004
Figure 5. Land subsidence analysis in the Yuhuazhai (YHZ) District. (A,B) are the InSAR results from 2007–2010 and 2015–2019. The red line and the black line, respectively, represent the fault and ground fissure. (C) Vertical displacement time-series and corresponding linear rates of subsidence. ALOS (red) and Sentinel-1A (blue) time series are shown, and the black dotted line is fitted; (D,E) are the ground deformation signs observed during the survey, corresponding to positions in B.
Remotesensing 12 03756 g005
Figure 6. Land subsidence in the Beishanmen (BSM) District. (A,B) are the InSAR results from 2007–2010 and 2015–2019, separately, and the red line represents the ground fissure. (C) Vertical displacement time-series and corresponding linear rates of subsidence. ALOS (red) and Sentinel-1A (blue) time series are shown, and the black dotted line is fitted; (D,E) are the ground deformation signs observed during the survey, corresponding to positions in B.
Remotesensing 12 03756 g006
Figure 7. Land subsidence in the Fengqiyuan–Dengjiapo (FQY–DJP) District. (A,B) are the InSAR results from 2007–2010 and 2015–2019, separately; the red line and the black line, respectively, represent the fault and the ground fissure. (C) Vertical displacement time-series and corresponding linear rates of subsidence of a and b that correspond to positions in B. ALOS (red) and Sentinel-1A (blue) time series are shown, and the black dotted line is fitted. (D,E) are the ground deformation signs observed during the survey, corresponding to positions in B.
Remotesensing 12 03756 g007
Figure 8. Surface rebound analysis in the Electronic Square to Chang’an University (TES-CAU). (A,B) are the InSAR results from 2007–2010 and 2015–2019, respectively, and the red line represents the ground fissure. (C) Vertical displacement time-series and corresponding linear rates of subsidence. ALOS (red) and Sentinel-1A (blue) time series are shown, and the black dotted line is fitted; (D) Groundwater change cure. The blue, black, and red dot lines represent groundwater monitoring in the south, middle, and north of the region, respectively. (EH) are the ground deformation signs observed during the survey and correspond to field positions in B.
Remotesensing 12 03756 g008
Figure 9. Land subsidence, rebound deformation, and groundwater level in the YHZ Area. (A) Comparison between the isolines of land subsidence rate and confined water [38]; (B) Comparison between the isolines of rebound value and confined water; (C) Comparative analysis of surface deformation characteristic curve and groundwater monitoring data; (D) Characteristic curves of subsidence and rebound since 2015 in C.
Remotesensing 12 03756 g009
Figure 10. Land subsidence along the subway lines. (A) Land subsidence rate distribution map within 300 m on both sides of Xi’an subway construction and operation, and distribution of faults, ground fissures, and subsidence areas. We render the values with a land subsidence rate greater than 20 mm/yr in red and display values between 0–20 mm/yr in 2 mm intervals in different colors; (BD) are the land subsidence of subway line 14, 3, 5, and 4 chosen for analysis.
Remotesensing 12 03756 g010
Figure 11. Deformation rate along selected subway lines. (A,B) are the deformation characteristic curves of subway lines 14, 3, 5, and 4 chosen for analysis. In the figure, dark grey represents a subsidence rate greater than 8 mm/yr in operating subway sections, and light grey represents a subsidence rate greater than 8 mm/yr in subway sections under construction.
Remotesensing 12 03756 g011
Figure 12. Maps of main subsidence areas in different periods in Xi’an are determined by the 30 mm/yr subsidence rate isoline. (AD) are the comparison of two sets of data in adjacent periods from 1959–2019, respectively [21,23,44].
Remotesensing 12 03756 g012
Figure 13. Comparison of confined water level and high-rise buildings in different years with subway lines and deformation areas. (A) 2008; (B) 2011; (C) 2014 (Peng et al., 2019); (D) 2017.
Remotesensing 12 03756 g013
Table 1. Advanced Land Observing Satellite-1 (ALOS-1) and Sentinel-1A data for Xi’an.
ParametersALOS-1Sentinel-1A
BandLC
Wavelength (cm)23.55.63
Incidence angle (°)38.733.8
Track46484
PolarizationVVVV
Number of images used16186
Orbit DirectionAscendingAscending
Acquisition timeJan 2007–Dec 2010Oct 2014–May 2019
Publisher’s Note: MDPI stays neutral with regard to jurisdictional claims in published maps and institutional affiliations.