Article

Characteristics of the Residual Surface Deformation of Multiple Abandoned Mined-Out Areas Based on a Field Investigation and SBAS-InSAR: A Case Study in Jilin, China

1
College of Construction Engineering, Jilin University, Changchun 130026, China
2
Liaoning Nonferrous Geological Exploration and Research Institute Co., Shenyang 110013, China
*
Author to whom correspondence should be addressed.
Remote Sens. 2020, 12(22), 3752; https://doi.org/10.3390/rs12223752
Submission received: 30 September 2020 / Revised: 28 October 2020 / Accepted: 13 November 2020 / Published: 14 November 2020

Abstract

:
Residual surface deformation resulting from abandoned mined-out areas can lead to severe damage to ground structures (e.g., buildings and infrastructure in mining areas) and the local ecological environment. Long-term monitoring and analyses of surface deformation characteristics of abandoned mined-out areas are significant for preventing potential disasters. In this study, a detailed field investigation first was conducted in Ying’an and Baoshan coal mines located in Jilin Province, China, to survey mining-induced disasters in the mining areas. Based on the 40 Sentinel-1A images acquired from 14 February 2017 to 17 May 2020, small baseline subset interferometry synthetic aperture radar (SBAS-InSAR) technology was employed to obtain the time-series residual surface deformation. Validation of the SBAS-derived results is performed by comparing with the results obtained via leveling measurements. The root mean square error (RMSE) between SBAS-derived and leveling measurements results was found to be 1.144 mm, reflecting a fairly good agreement. Furthermore, the ordinary Kriging interpolation approach was adopted to obtain information on the deformation across the entire area. The spatial–temporal evolution characteristics of the derived subsidence bowls in multiple mined-out areas were revealed. The deformation characteristics for the abandoned mined-out areas in different periods were not completely consistent. Finally, the potential mechanism underlying the inconsistency in the subsidence associated with underground coal exploitation is analyzed. The findings of this study can provide insights into local construction and ecological improvement as well as guidance for the prediction of deformation in abandoned mined-out areas.

Graphical Abstract

1. Introduction

Coal resources are still one of the main energy sources in many countries [1], which are widely employed in industrial production, power generation and so on. Although coal resources have been central to promoting economic development, extensive underground coal exploitation inevitably results in some negative effects [2], such as surface subsidence [3,4]. Mining-induced surface subsidence gives rise to cracks and other types of damage to infrastructure and resident buildings within mining areas [5,6]. Such surface subsidence also may destroy cultivated land and even give rise to a threat to the local ecological environment [7,8,9]. Therefore, long-term monitoring of surface deformation in mining areas and analysis of surface deformation characteristics are of great significance for preventing and mitigating regional disasters.
Traditional approaches for monitoring and analyzing the surface deformation resulting from mining activities include leveling measurements, global navigation satellite systems, global positioning systems, total station surveys and three-dimensional laser scanning, etc. [10,11,12]. Over the past few decades, the aforementioned geodetic measurement approaches have proven to be reliable geodetic techniques with centimeter-to-millimeter accuracy [10,13], and have been extensively utilized to investigate surface deformation [14,15]. Since these techniques are implemented on a point-by-point basis, the collection of monitoring data is labor-intensive, time-consuming and costly, especially for large study regions [6,16]. Therefore, obtaining effectively the deformation characteristics of the entire mining areas becomes a major challenge [4,17].
Over the past few decades, the interferometric synthetic aperture radar (InSAR) technique has received increased attention. Differential interferometry synthetic aperture radar (D-InSAR) was proposed based on InSAR and has been developed as an available method for investigating surface deformation. As a novel earth observation technology, D-InSAR has the advantages of high precision, high spatial–temporal resolution, continuous coverage, and all-weather [18]. D-InSAR has thus become one of the most widely used measurement techniques for large spatial regions. D-InSAR has been employed to monitor subtle surface deformation resulting from underground mining activity [10,19], earthquakes [20,21], landslide activity [22,23,24], groundwater withdrawal [25,26] and so on. Moreover, the recently popular machine learning methods have been employed to identify related deformation by combining with InSAR data [27,28,29]. However, since the influence of atmospheric delay and temporal–spatial decorrelation on D-InSAR technique is significant, it has the deficiency of not being capable of extracting the long time surface deformation [10,30].
Afterwards, substantial progress in the development of advanced InSAR techniques has been made. Time-series InSAR techniques, such as persistent scatterer InSAR (PS-InSAR) [31] and small baseline subset InSAR (SBAS-InSAR) [32], have been successively proposed. At present, the SBAS-InSAR technique has been an extensively applied approach in monitoring time-series surface deformation. The SBAS-InSAR technique can reduce the influence of temporal–spatial decorrelation by recognizing highly coherent pixels [33,34]. Furthermore, it employs the least squares (LS) and singular value decomposition (SVD) algorithms to acquire surface deformation information at the high coherent pixels based on the multi-scene SAR images and thus characterize the time-series surface deformation [11,35].
For a region with abundant coal reserves, the exploitation time in different coal seams is not synchronous. Consequently, such regions may consist of multiple abandoned mined-out areas. A large number of monitoring cases related to mined-out areas have been effectively conducted using SBAS-InSAR technology. However, to our knowledge, the characteristics of surface deformation in this type of multiple abandoned mined-out areas varying in exploitation time have been rarely examined in the previous works. Nevertheless, the surface deformation problems caused by coal exploitation are complicated, given that the intensity of deformation is simultaneously affected by several factors, such as the mechanical properties of overlying rock strata, mining depth, coal seam thickness and mining method [17,36]. Furthermore, previous studies have indicated that surface deformation caused by coal exploitation tends to occur over longer timescales, lasting for several years or even decades [16]. Therefore, reasonable analyses of the spatial–temporal deformation characteristics of multiple abandoned mined-out areas based on the results of long-time monitoring are important for preventing and mitigating local disasters.
In this study, the deformation characteristics of multiple abandoned mined-out areas in two adjacent coal mines, located in Jilin Province, China, are analyzed. First, the study area and details of field investigation were described (Section 2). Subsequently, a brief description of the datasets (Sentinel-1A) and methodologies, i.e., SBAS-InSAR and ordinary Kriging method, was carried out (Section 3). The spatial–temporal evolution characteristics of the typical surface deformation were then analyzed (Section 4). Finally, the reliability of the SBAS-InSAR results was assessed via a comparison with monitoring data obtained by leveling measurements, followed by a discussion of the deformation mechanism associated with coal exploitation (Section 5).

2. Study Area

2.1. Overview

The mining areas, located in the northwestern part of Hunchun City, Jilin Province, Northeastern China (Figure 1a), were chosen as study areas in this paper. The mining areas as shown in Figure 1b cover an area of ~10 km2 and are mainly operated by two mining authorities, namely Ying’an and Baoshan coal mines (Figure 1b). The coal mines both belong to underground mining. The identified reserves of Ying’an and Baoshan coal mines are 6.7 × 10⁷ and 9.2 × 10⁶ tons, respectively. Coal exploitation is conducted at depths between 60 and 550 m by means of the long wall mining method, a highly efficient method for extracting coal [37].
The terrain in the mining areas is relatively flat, and only the northeastern side is gradually transiting to low mountainous areas with undulating topography. The elevation ranges from 30 m to 113 m, and the landform in the mining areas is mainly alluvial plain (Figure 1b).
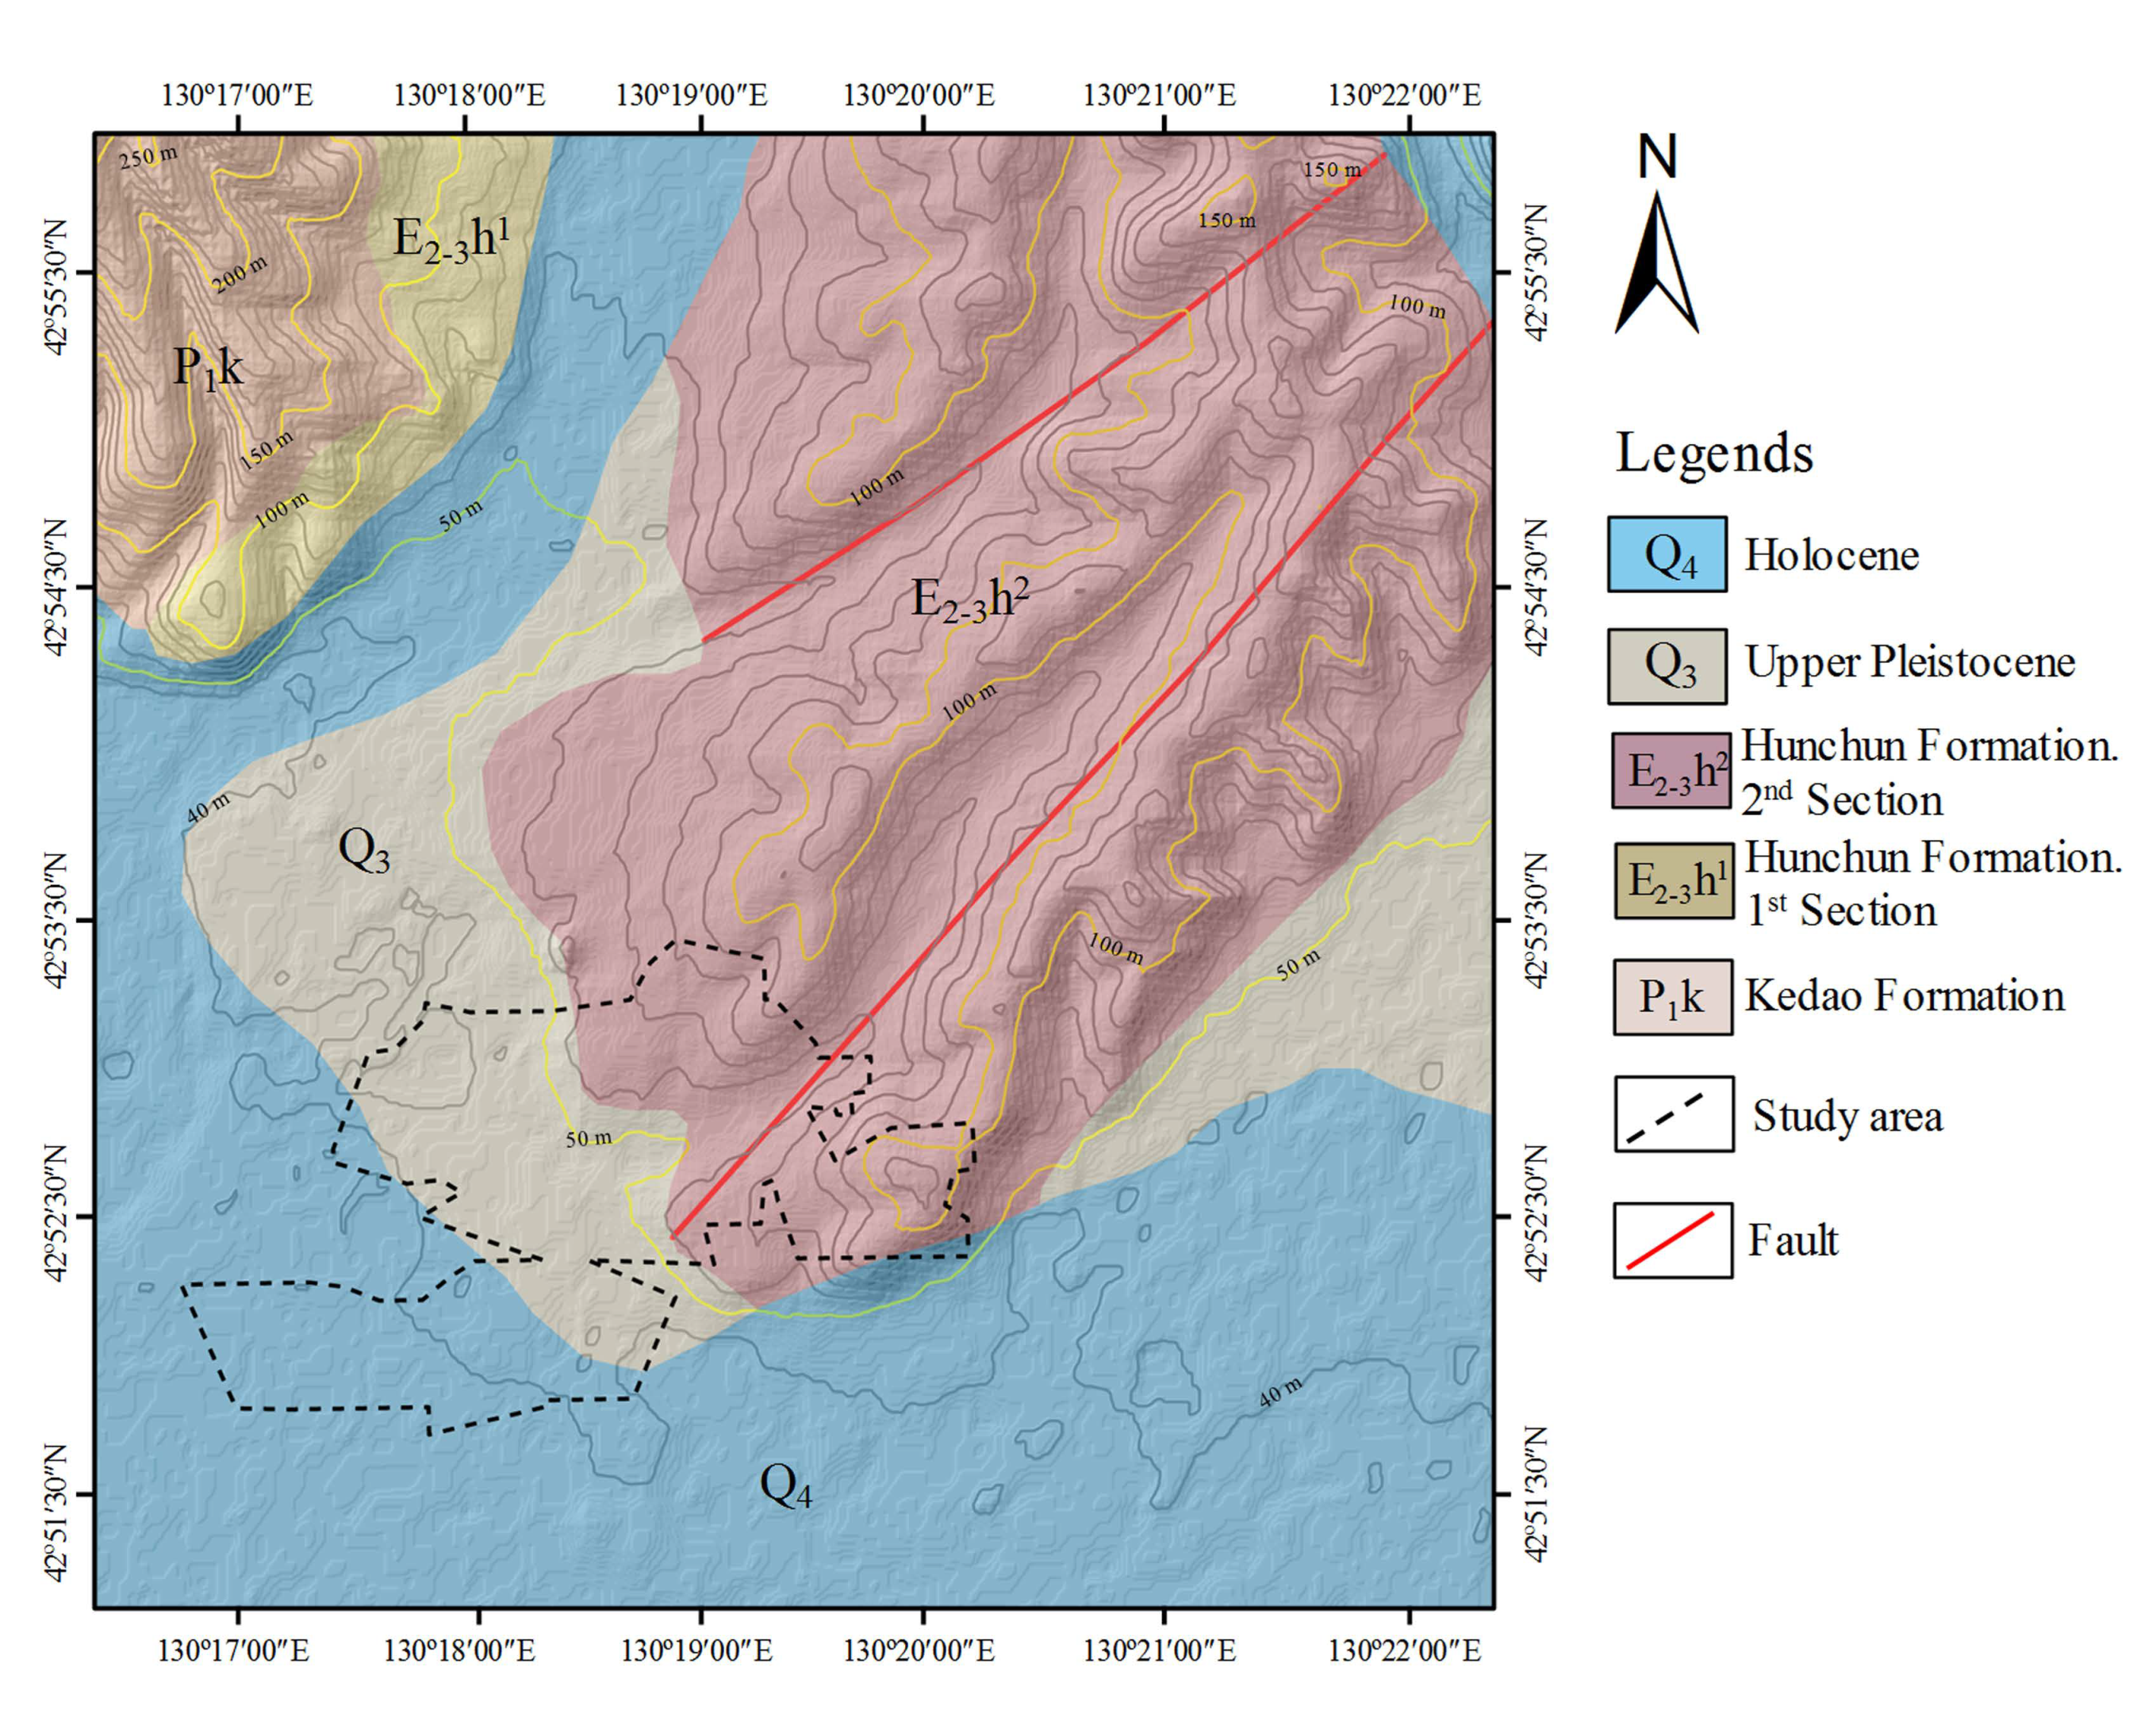
As is shown in Figure 2, the sedimentary sequences in the study area include the Lower Permian Kedao Formation (P1k), Paleogene Hunchun Formation (E2-3h) and Quaternary (i.e., Q3 and Q4). The Kedao Formation is mainly composed of black–gray slate and metamorphic sandstone. The Hunchun Formation is dominated by siltstone, conglomerate, mudstone and sandstone. The Quaternary primarily consists of loose deposits exposed in the form of silty clay and gravel.
The Hunchun Formation is the major coal-bearing sequence in the mining areas. It is divided into six subsections from bottom to top, namely E2-3h1, E2-3h2, E2-3h3, E2-3h4, E2-3h5 and E2-3h6. The E2-3h2, with an average thickness of 145 m, is a major coal-bearing unit in the Ying’an and Baoshan coal mines (Figure 2). It is composed of argillaceous siltstone, dark gray mudstone, medium/coarse-grained sandstone and coal seams.

2.2. Surface Deformation Features

The field engineering geological survey was carried out in the mining areas from 20 April to 8 May 2019. The investigation found that the field surface presented a series of non-uniform deformation phenomena due to the frequent mining activities.
Mining-induced collapses make the force exerted on the surface exceed its tensile strength, resulting in tensile cracks in farmlands and roads. As shown in Figure 3a,b, many tensile cracks with a nearly parallel distribution had developed in farmlands and roads. The field survey found that the cracks in the farmlands are by step-shaped with lengths ranging from 100 to 300 m and widths ranging from 0.6 to 3.0 m. The cracks are shallow in depth ranging from 0.5 to 1.0 m. These cracks had resulted in crop yield to be reduced, and in some case even destroyed cultivated land. The produced cracks directly cut off roads and pose a threat to the road surface landscape and traffic safety.
Mining-induced surface subsidence also increased the inclination of the foundation of houses, leading to cracks in the walls of the houses. As shown in Figure 3c,d, these cracks exhibited obvious radial distribution, which is a potential danger to the property and lives of local residents.
On the southwest side of the mining areas, the mining-induced subsidence produced several pits with depths between 1.0 and 2.0 m. Rainfall over long periods has gathered into the pits to form local lakes. Here, a lake is selected as representative example as shown in Figure 3f. The lake is in the shape of an approximate ellipse with a major axis of 418 m and a minor axis of 175 m. These lakes directly damage farmlands. In addition, the accumulation of rainwater in the pits over long time has an impact on the hydrogeological conditions of the area.
The surface collapse caused by the mining activities also occurred in the forest. Affected by the surface collapse, the surrounding trees tend to be bent (Figure 3e,g), which is similar to the bent trees arising from the movement of the landslide [38]. Over time, these trees may become dried-up. Therefore, mining activities can bring about some damage to the ecological environment to some extent.
In summary, mining-induced surface subsidence in the mining areas is obvious. The subsidence is a potential threat to the life and property of local residents, farmlands and ecological environment. Furthermore, filed investigations indicate that the subsidence in the mining areas is still going on. As a result, there is a need to detect the subsidence zones and quantitatively analyze the deformation characteristics of the mining area so that a valuable reference can be provided for local ecological construction and subsidence treatment.

3. Datasets and Methodology

3.1. Datasets

In order to comprehensively characterize the surface deformation of the study area, a total of 40 Sentinel-1A SAR images, collected by the European Space Agency (ESA), were utilized in this study. The time span was 14 February 2017 to 17 May 2020, with a sampling interval of approximately 30 days. The digital elevation model, i.e., Shuttle Radar Topography Mission (SRTM) is offered by the National Aeronautics and Space Administration (NASA) for removing the topographic phase component. Precise orbital ephemeris data, obtained by the ESA, were applied for orbital refinement and phase re-flattening. Table 1 shows the specific information of the datasets.

3.2. SBAS-InSAR

The SBAS is an advanced InSAR post-processing algorithm with millimeter accuracy [39], so it was employed to process the obtained Sentinel-1A SLC images to generate deformation velocity and accumulated surface deformation displacement.

3.2.1. Basic Theory of SBAS-InSAR

N + 1 SAR images covering the fixed area were obtained at the ordered times (t0, t1, …, tN). Accordingly, the number (M) of possible differential interferometric pairs were produced based on baseline threshold values. The M should meet the following relation [40,41]:
N + 1 2 M N ( N + 1 2 )
Assuming that j-interferogram is produced by combining two SAR at times tB and tA (tB > tA). Accordingly, the interferometric phase in the pixel of azimuth and range coordinates (x, r) can be obtained as follows:
δ ϕ j ( x , r ) = ϕ   ( t B , x , r ) ϕ   ( t A , x , r ) ϕ d i s p , j ( x , r ) + ϕ t o p o , j ( x , r ) + ϕ o r b , j ( x , r ) + ϕ a t m , j ( x , r ) + ϕ n o i s e , j ( x , r )
where ϕ ( t B , x , r ) and ϕ ( t A , x , r ) stand for phase values of two SAR images at times tB and tA, respectively. ϕ d i s p , j ( x , r ) corresponds to the deformation phase, which is generated due to the change in distance between the object and the radar along the direction of the line-of-sight (LOS). In addition, phases ϕ t o p o , j ( x , r ) , ϕ o r b , j ( x , r ) , ϕ a t m , j ( x , r ) and ϕ n o i s e , j ( x , r ) are caused by the terrain, satellite orbit, atmosphere and other noise (e.g., thermal noise and spatial decorrelation). To obtain deformation information, the deformation phase ϕ d i s p , j ( x , r ) can be obtained by removing the aforementioned phases in SBAS-InSAR. Afterwards, a system of M equations containing N unknown parameters can be expressed as
A ϕ = δ ϕ
where A refers to a coefficient matrix of M × N, ϕ = [ ϕ ( t 1 ) , ϕ ( t 2 ) , ϕ ( t N ) ] T stands for the N × 1 vector of unknown deformation phases on the basis of measurement points, and thus δ ϕ = [ δ ϕ ( t 1 ) , δ ϕ ( t 2 ) , δ ϕ ( t N ) ] T represents the vector of the unwrapped phase values related to differential interferograms. In order to acquire the deformation velocity, the Equation (3) can be rewritten as follows:
B v = δ ϕ
where B stands for an M × N coefficient matrix, and v is the mean phase velocity expressed as
v = [ v 1 , v 2 v N ] T = [ ϕ 1 t 1 t 0 , ϕ 2 ϕ 1 t 2 t 1 , ϕ N ϕ N 1 t N t N 1 ] T
Next, the deformation velocity can be obtained using the LS and singular value SVD. Finally, the accumulated displacement of each image relative to the first image can be calculated by multiplying the corresponding velocity and the time span [32].

3.2.2. Data Processing

In this study, the Environment for Visualizing Images (ENVI) and SARscape software packages were employed to obtain the surface subsidence deformation velocity and displacement time series in the study area. The steps of data processing are summarized below.
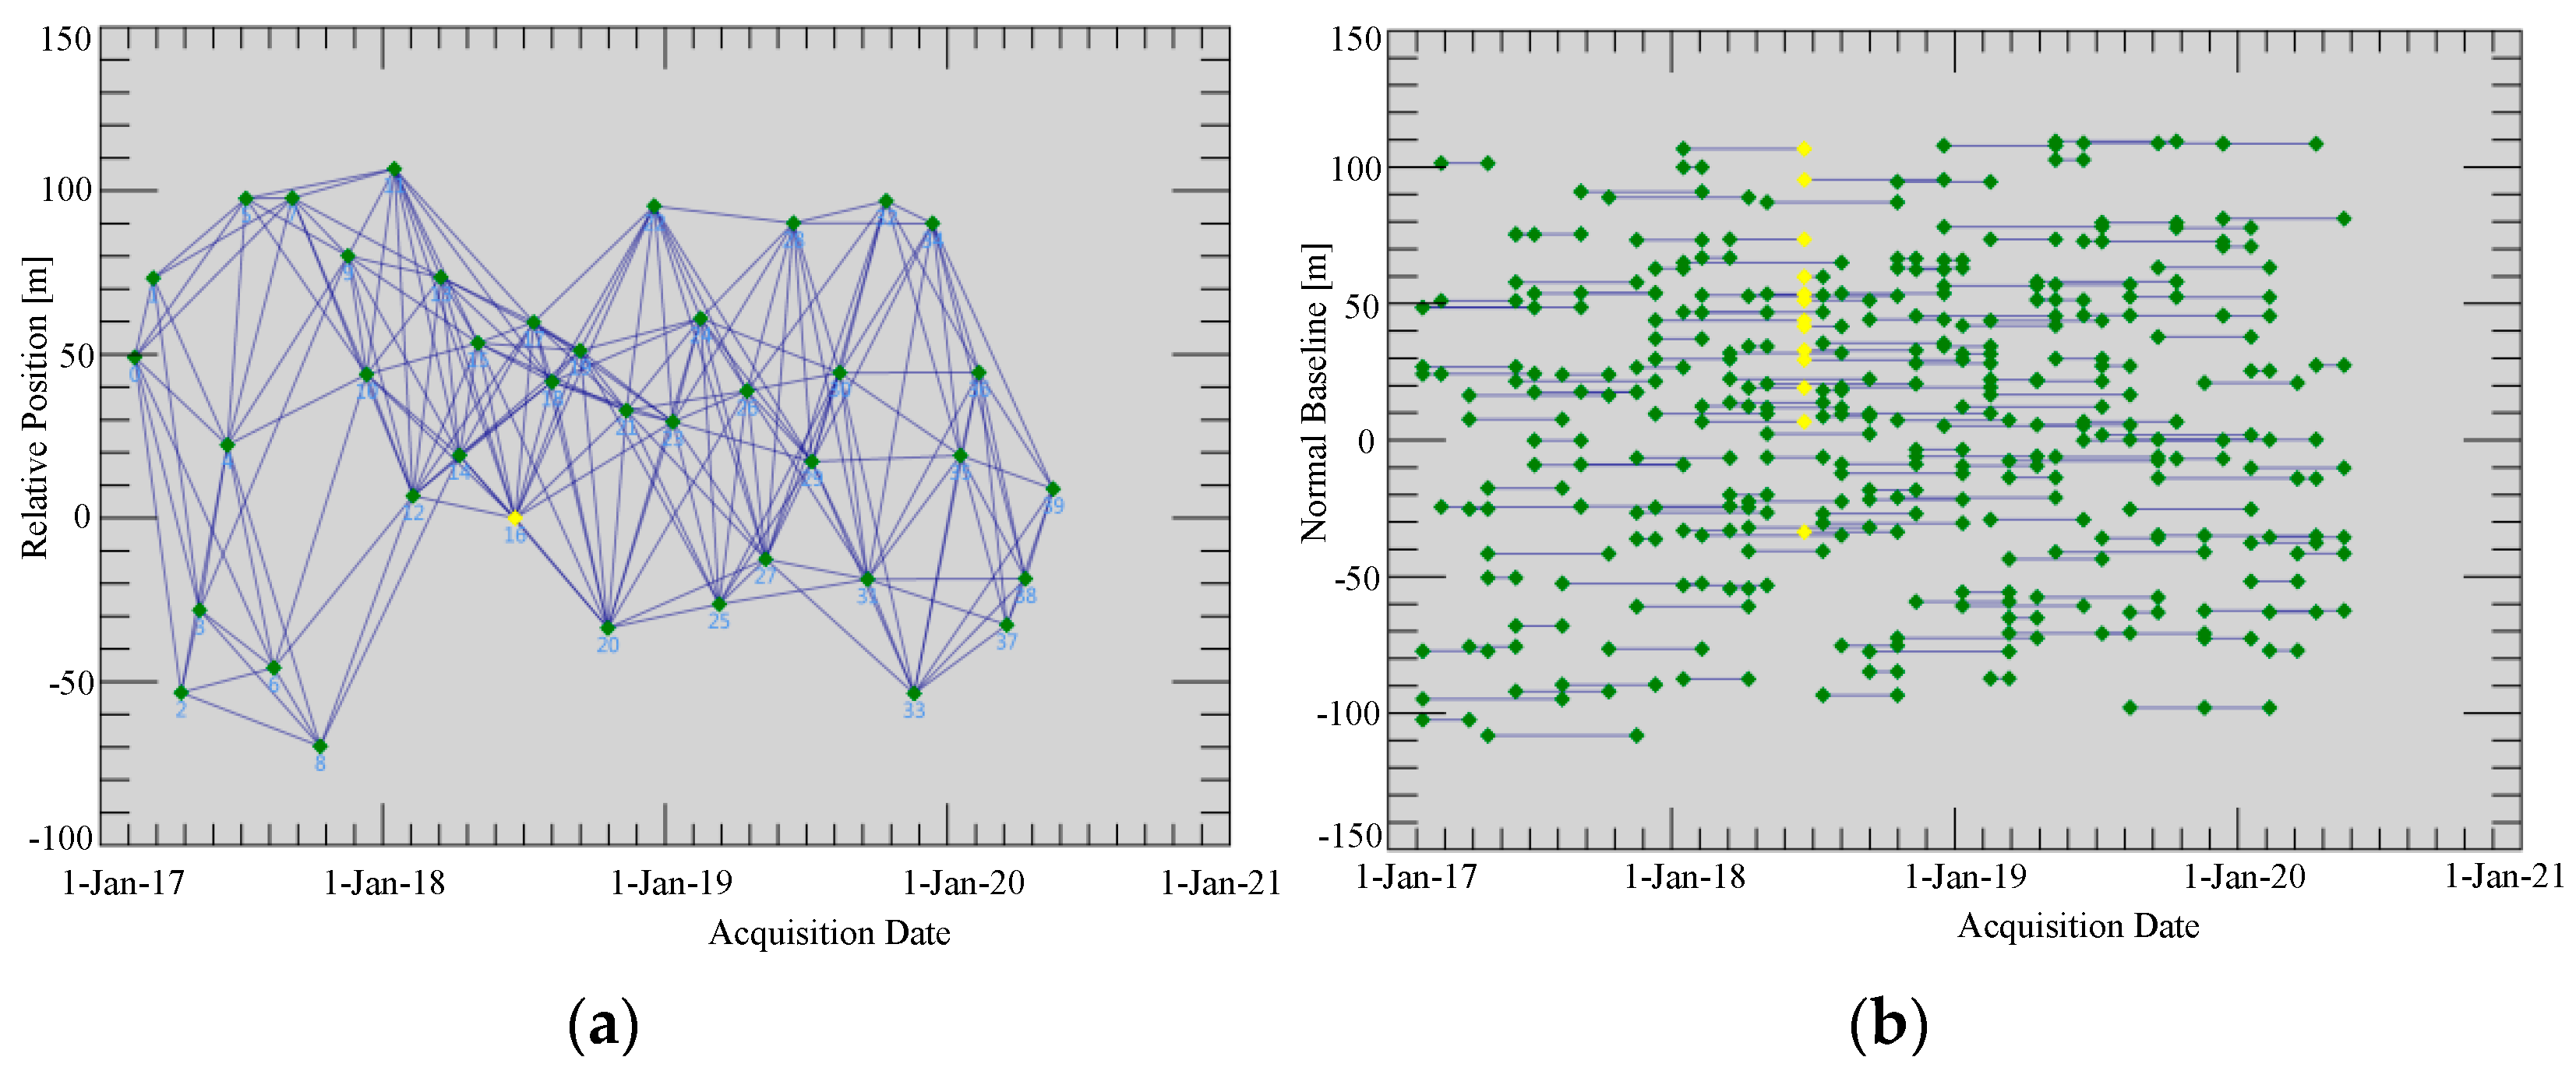
Step 1 Generation of the connection graph. Spatial and temporal baseline thresholds (121 m and 120 days, respectively) were first specified following the small baseline principles. The image obtained on 21 June 2018 was chosen as the super master image for interferometric combinations. The 40 SAR images were then separated into different subsets, and a total of 190 interferometric pairs were generated as shown in Figure 4.
Step 2 The interferometric process for generated pairs. During this process, the external SRTM was employed to eliminate the topographical phase. Furthermore, the noise phase was removed by means of the Goldstein filter, and the coherence coefficient map for each pair was obtained. Finally, the minimum cost flow (MCF) approach was utilized for phase unwrapping, and the unwrapping coherence threshold was set to 0.3 for calculation. Subsequently, 25 low-quality interferometric pairs (i.e., low coherence and poor unwrapped phase) were removed based on the above process. Finally, 165 interferometric pairs were utilized for the further time-series analysis.
Step 3 Generation of surface deformation. In the current study, 90 ground control points (GCPs) were selected to remove the change of phase resulting from satellite orbit and the residual topographic phase. Furthermore, the atmosphere delay was alleviated by spatial–temporal filter with the time filter window of 365 days and the space filter window of 1200 m to acquire the accumulated surface deformation value and deformation velocity along the LOS direction.
Step 4 Generation of surface deformation in the vertical direction. Vertical deformation is generally thought to be a dominant component in the mining-induced surface deformation. Therefore, the vertical surface subsidence (dv) was obtained according to the deformation (dLOS) along the LOS direction and incidence angle (θ) as presented in Equation (6) [42,43]. Finally, the deformation data were geocoded to gain the result in the form of the WGS84 coordinate system.
d v = d L O S c o s θ

3.3. Ordinary Kriging Model

Because of the inevitable technical problem, such as the incoherence and unwrapping problems [4], the SBAS-derived deformation results usually contain some pixels without data. However, researchers have demonstrated that the surface deformation caused by mining activities is usually spatially continuous [44]. In order to generate a continuous deformation map of the entire study area for comprehensively presenting the global deformation characteristics, the ordinary Kriging interpolation method was adopted in this study.
The ordinary Kriging model is one of the most popular approaches for spatial local prediction or spatial local interpolation in the field of geostatistics [45,46]. The fundamental assumption of the Kriging model is that closer sampled points tend to be more similar [47]. The model is based on variogram theory and structural analysis [48,49]. In order to obtain the weight coefficients, the fit of a variogram is indispensable to the spatial covariance structure of the known sampled points [50]. Therefore, the weight coefficients are not only associated with the distance between the known points and the prediction points but also with the spatial distribution among the known points [4].
In the model, the original known sampled data of the regionalized variables and variogram characteristics are utilized to handle the linear unbiased optimal estimation for the unmeasured points in the limited region. Specifically, the predicted value Z * ( x 0 ) at the unmeasured point x0 can be obtained according to the following equation [47,50]:
Z * ( x 0 ) = i = 1 n λ i Z ( x i )
where λi is the Kriging weight coefficient of point xi, and n is the number of measured points within the defined region around the unmeasured point x0. Furthermore, the weight coefficients meet the following equation:
i = 1 n λ i = 1
For more detailed introduction to the ordinary Kriging model, the readers can refer to the literatures [44,51].

4. Interpretation Results

4.1. Deformation Velocity

Based on the SBAS-InSAR technique, the mean deformation velocity map of the mining areas was obtained during the period from 14 February 2017 to 17 May 2020 as shown in Figure 5. A total of 16,078 coherence points were extracted by SBAS-InSAR in the mining areas, which are represented by the dots in Figure 5. The velocity results were superimposed on the Google Earth image. The map was represented using a color scale from red to green. In the deformation velocity map, positive values indicate that the points are uplifting in the vertical direction during the study period, whereas negative values denote subsidence in the vertical direction.
The SBAS-derived results indicate that the mean deformation velocity in the study area ranges from −36 mm/y to 5 mm/y. Three major subsidence zones were observed in the study areas, which are defined as Zone A, Zone B and Zone C and are marked by the black dashed ellipses in Figure 5. These three subsidence zones are located above the abandoned mined-out areas. It can be clearly seen that all the subsidence zones are characterized by uneven deformation. The maximum subsidence deformation occurred in Zone C, with a mean deformation velocity of −35.8 mm/y. More information on the relationship between uneven subsidence and coal exploitation will be discussed in detail in Section 5. In addition, Figure 5 also illustrates that the other regions approximatively remain stable from February 2017 to May 2020 and the mean deformation velocity ranged from −6 mm/y to 5 mm/y.
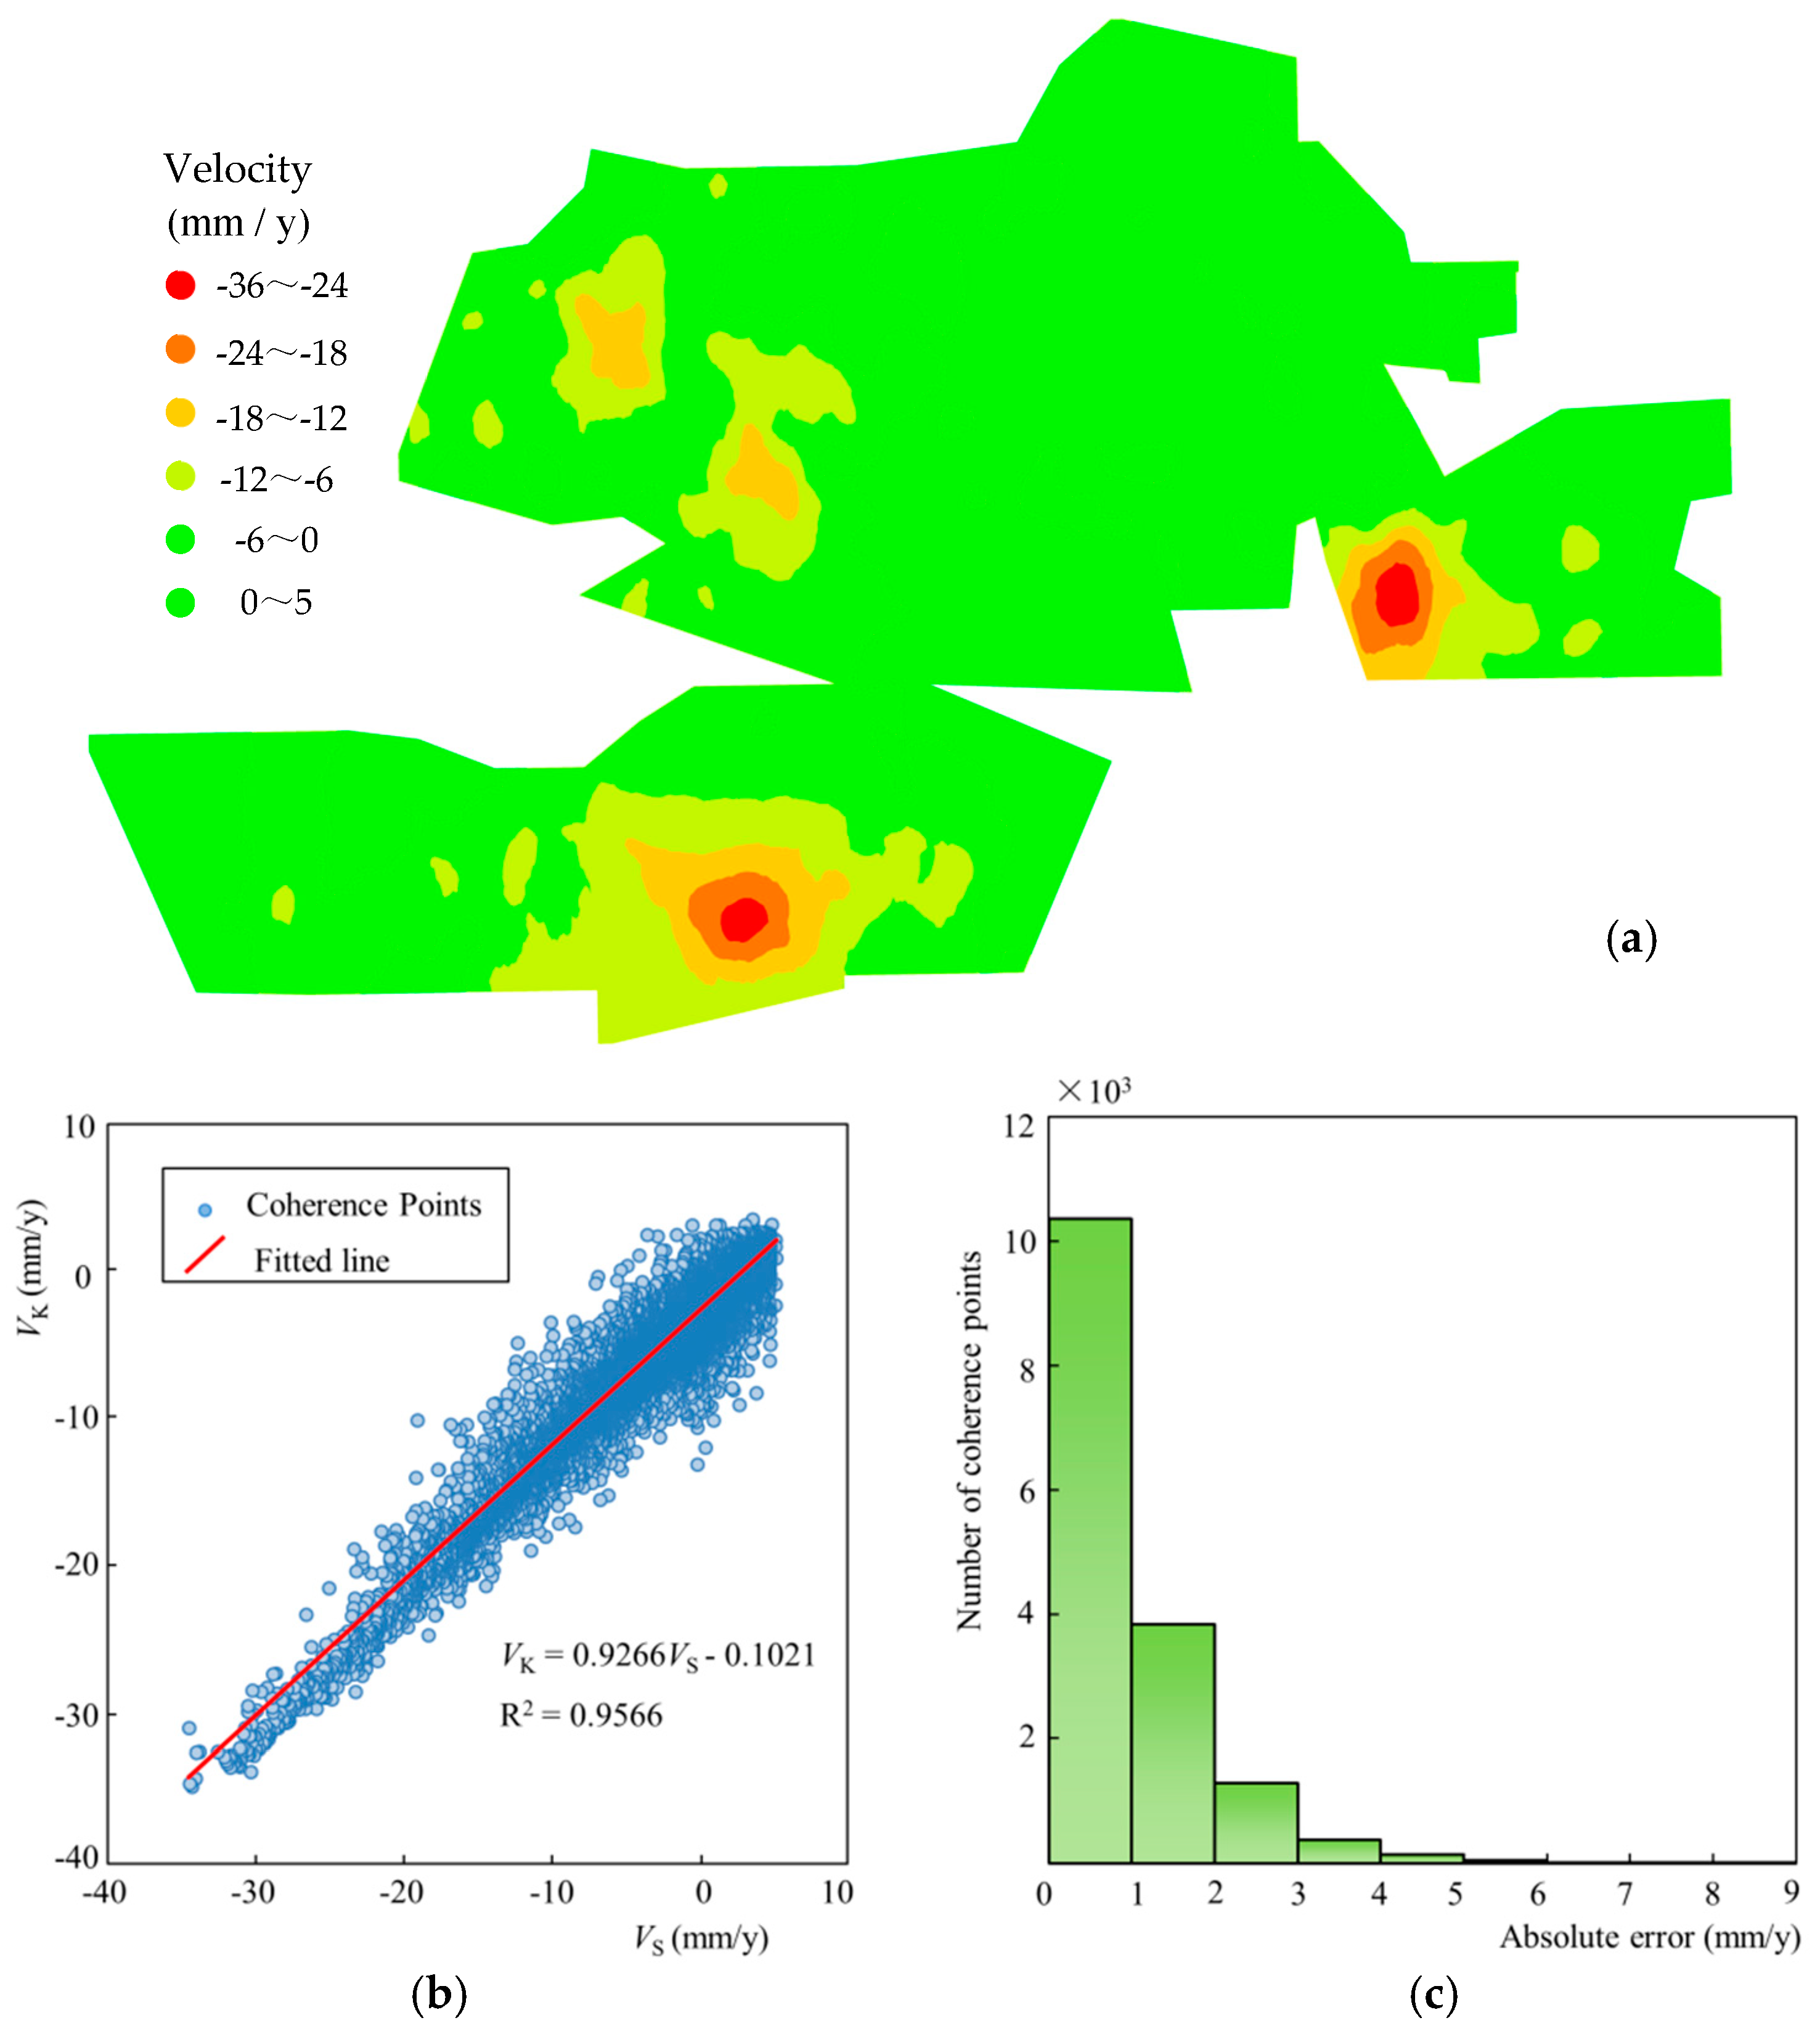
The mean deformation velocity of the entire study area was predicted based on the ordinary Kriging interpolation method. The exponential function is specified as the variogram in this study. Finally, the obtained mean velocity map is shown in Figure 6a. Based on the data of 16,078 coherence points, the linear regression analysis of mean deformation velocity between SBAS-derived and predicted results was carried out. The results indicate that there was an excellent correlation between them, with a correlation coefficient value of up to 0.9566 as shown in Figure 6b. Furthermore, the absolute errors of the mean deformation velocity between SBAS and the predicted results were also analyzed. The distribution map of the absolute errors is shown in Figure 6c. The absolute error of the 95% coherence points was less than 3 mm/y. The above analysis demonstrates that the interpolation results of the mean deformation velocity using the ordinary Kriging model are appropriate in the mining areas.

4.2. Time-Series Deformation

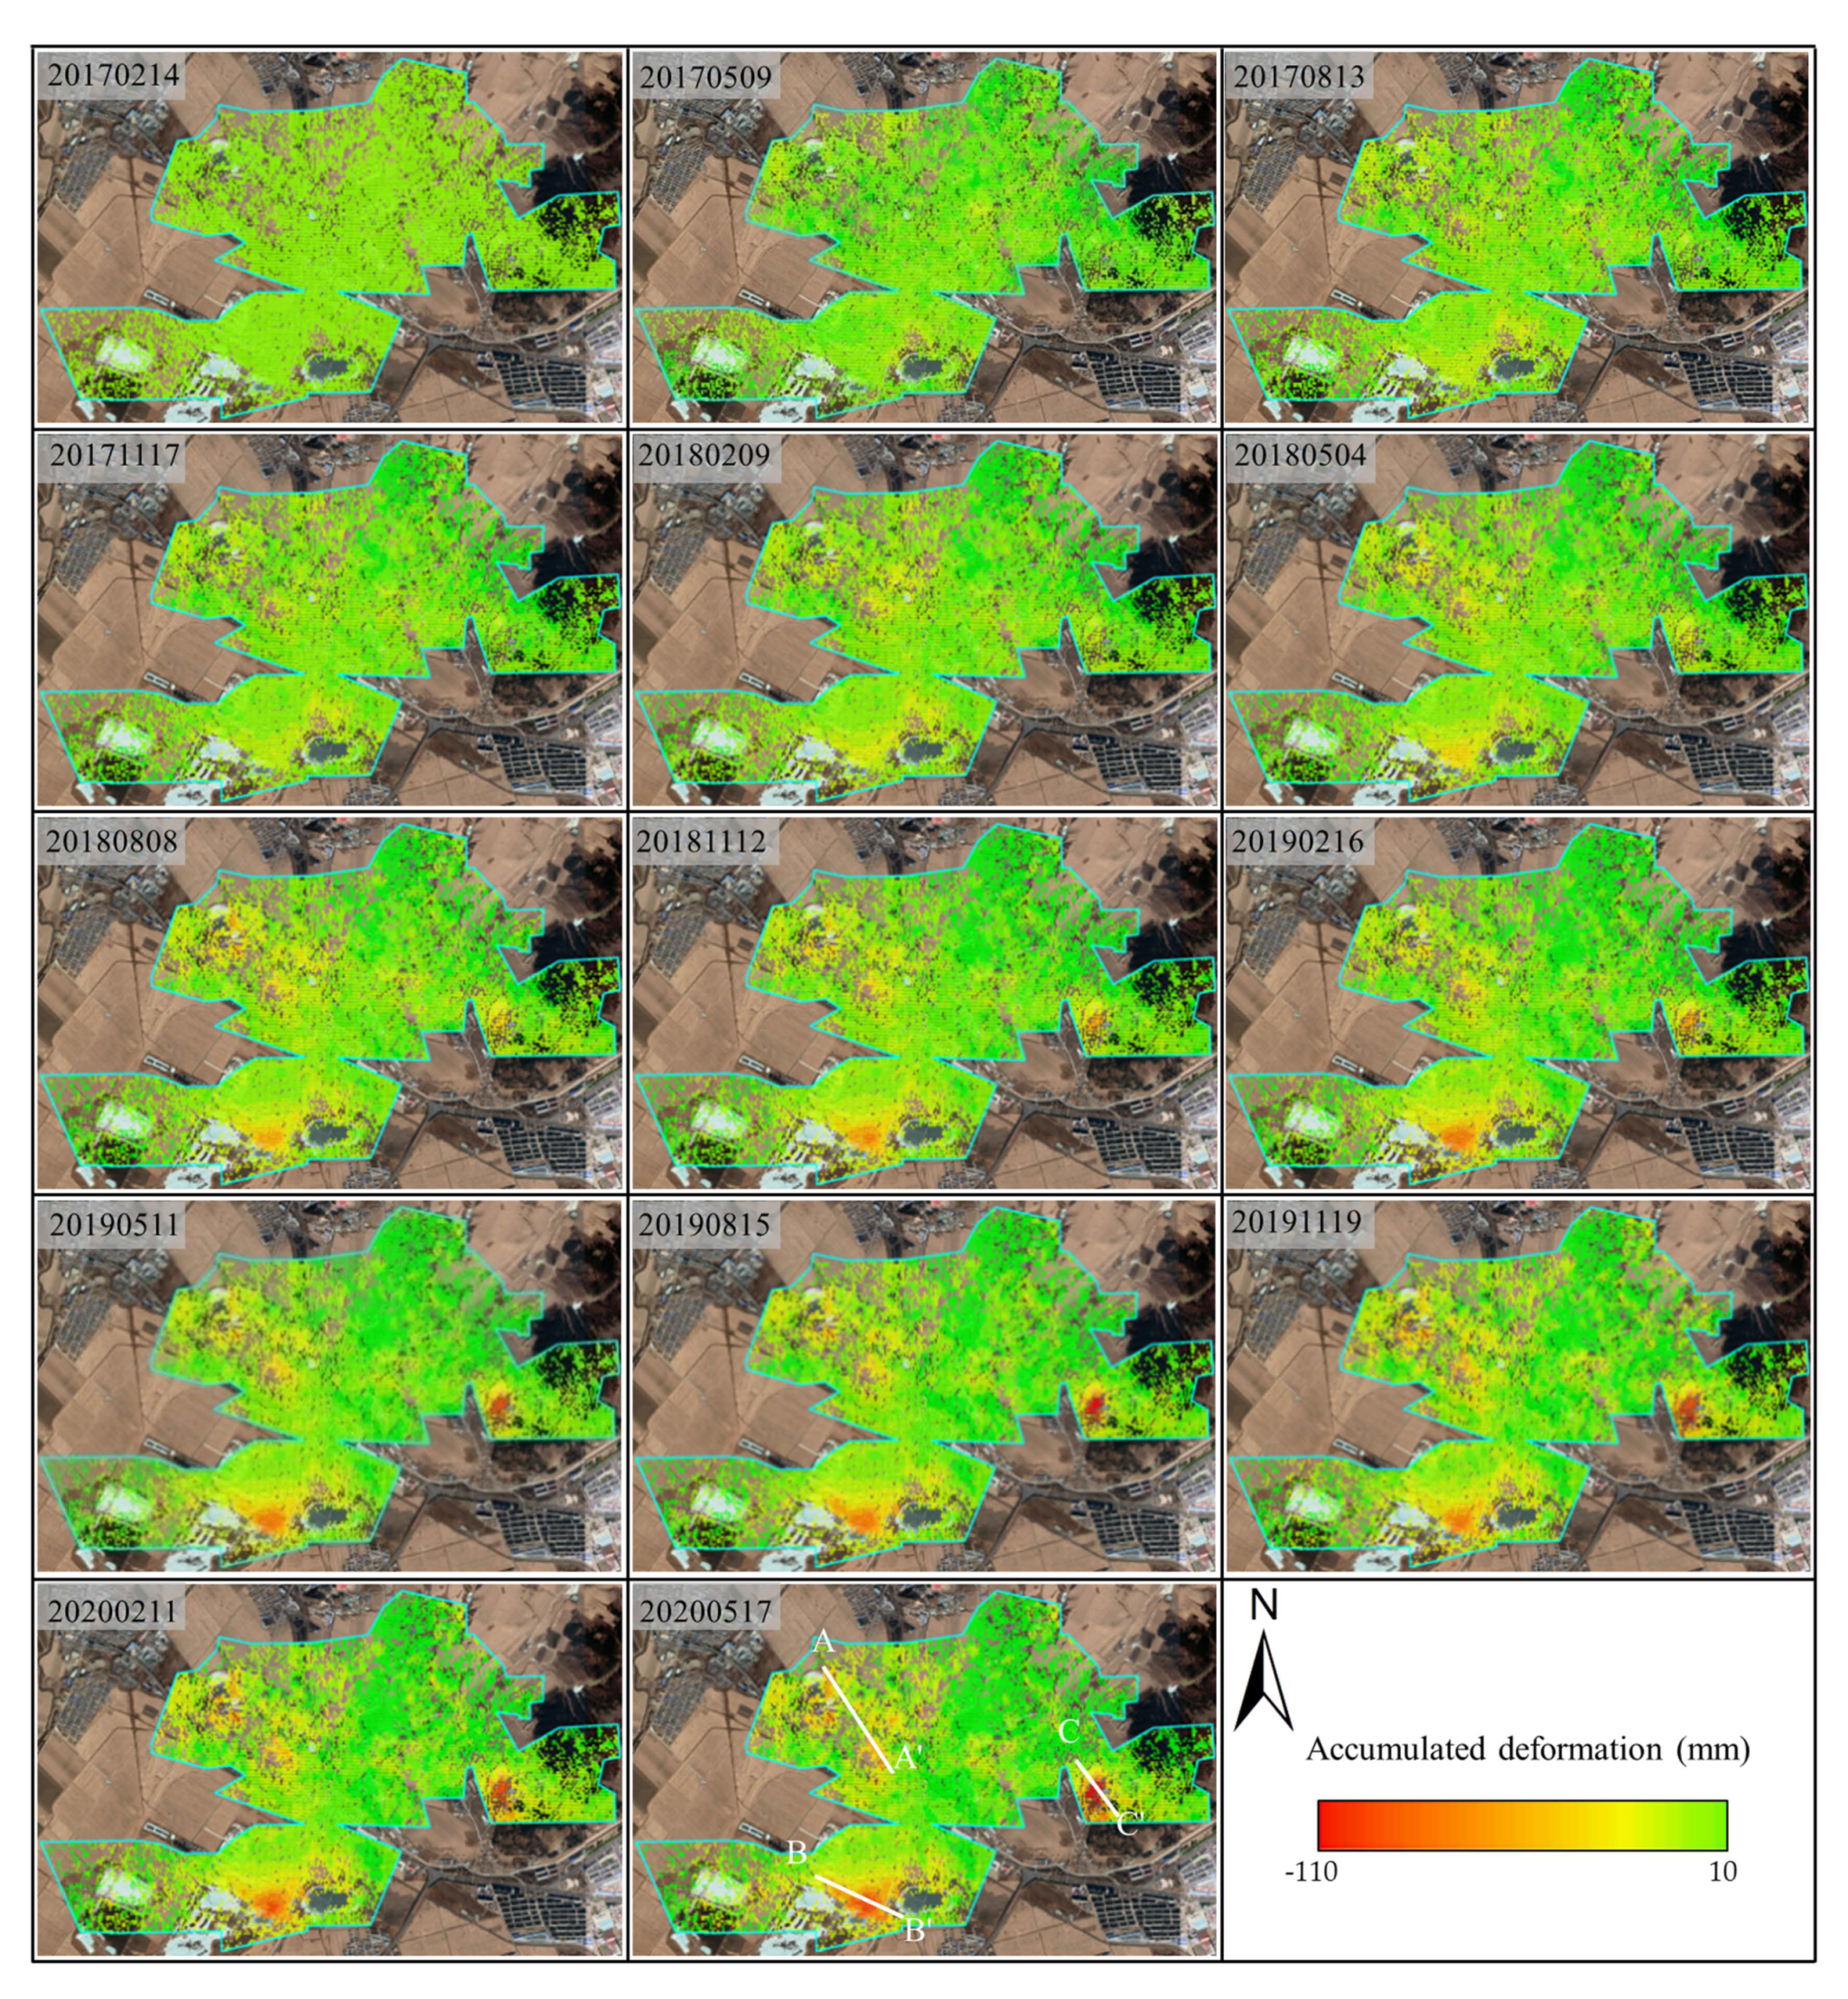
A total of 40 time-series deformation maps were obtained based on the SBAS-InSAR technique, but only 14 of them are selected for display here given the length limitation of this paper. The 14 maps were extracted every three months. The time-series deformation maps of the study area over 2017–2020 are presented in Figure 7. It should be noted that all accumulated deformations are relative to the acquisition time of the first image (i.e., 14 February 2017). The numbers in the upper left corner of every map stand for the acquisition time of the image. The deformation processes of the points are represented using a color scale from green to red. The intensity of the colors reflects the magnitude of the accumulated deformation. As described above, positive values indicate uplift, and negative values are for subsidence.
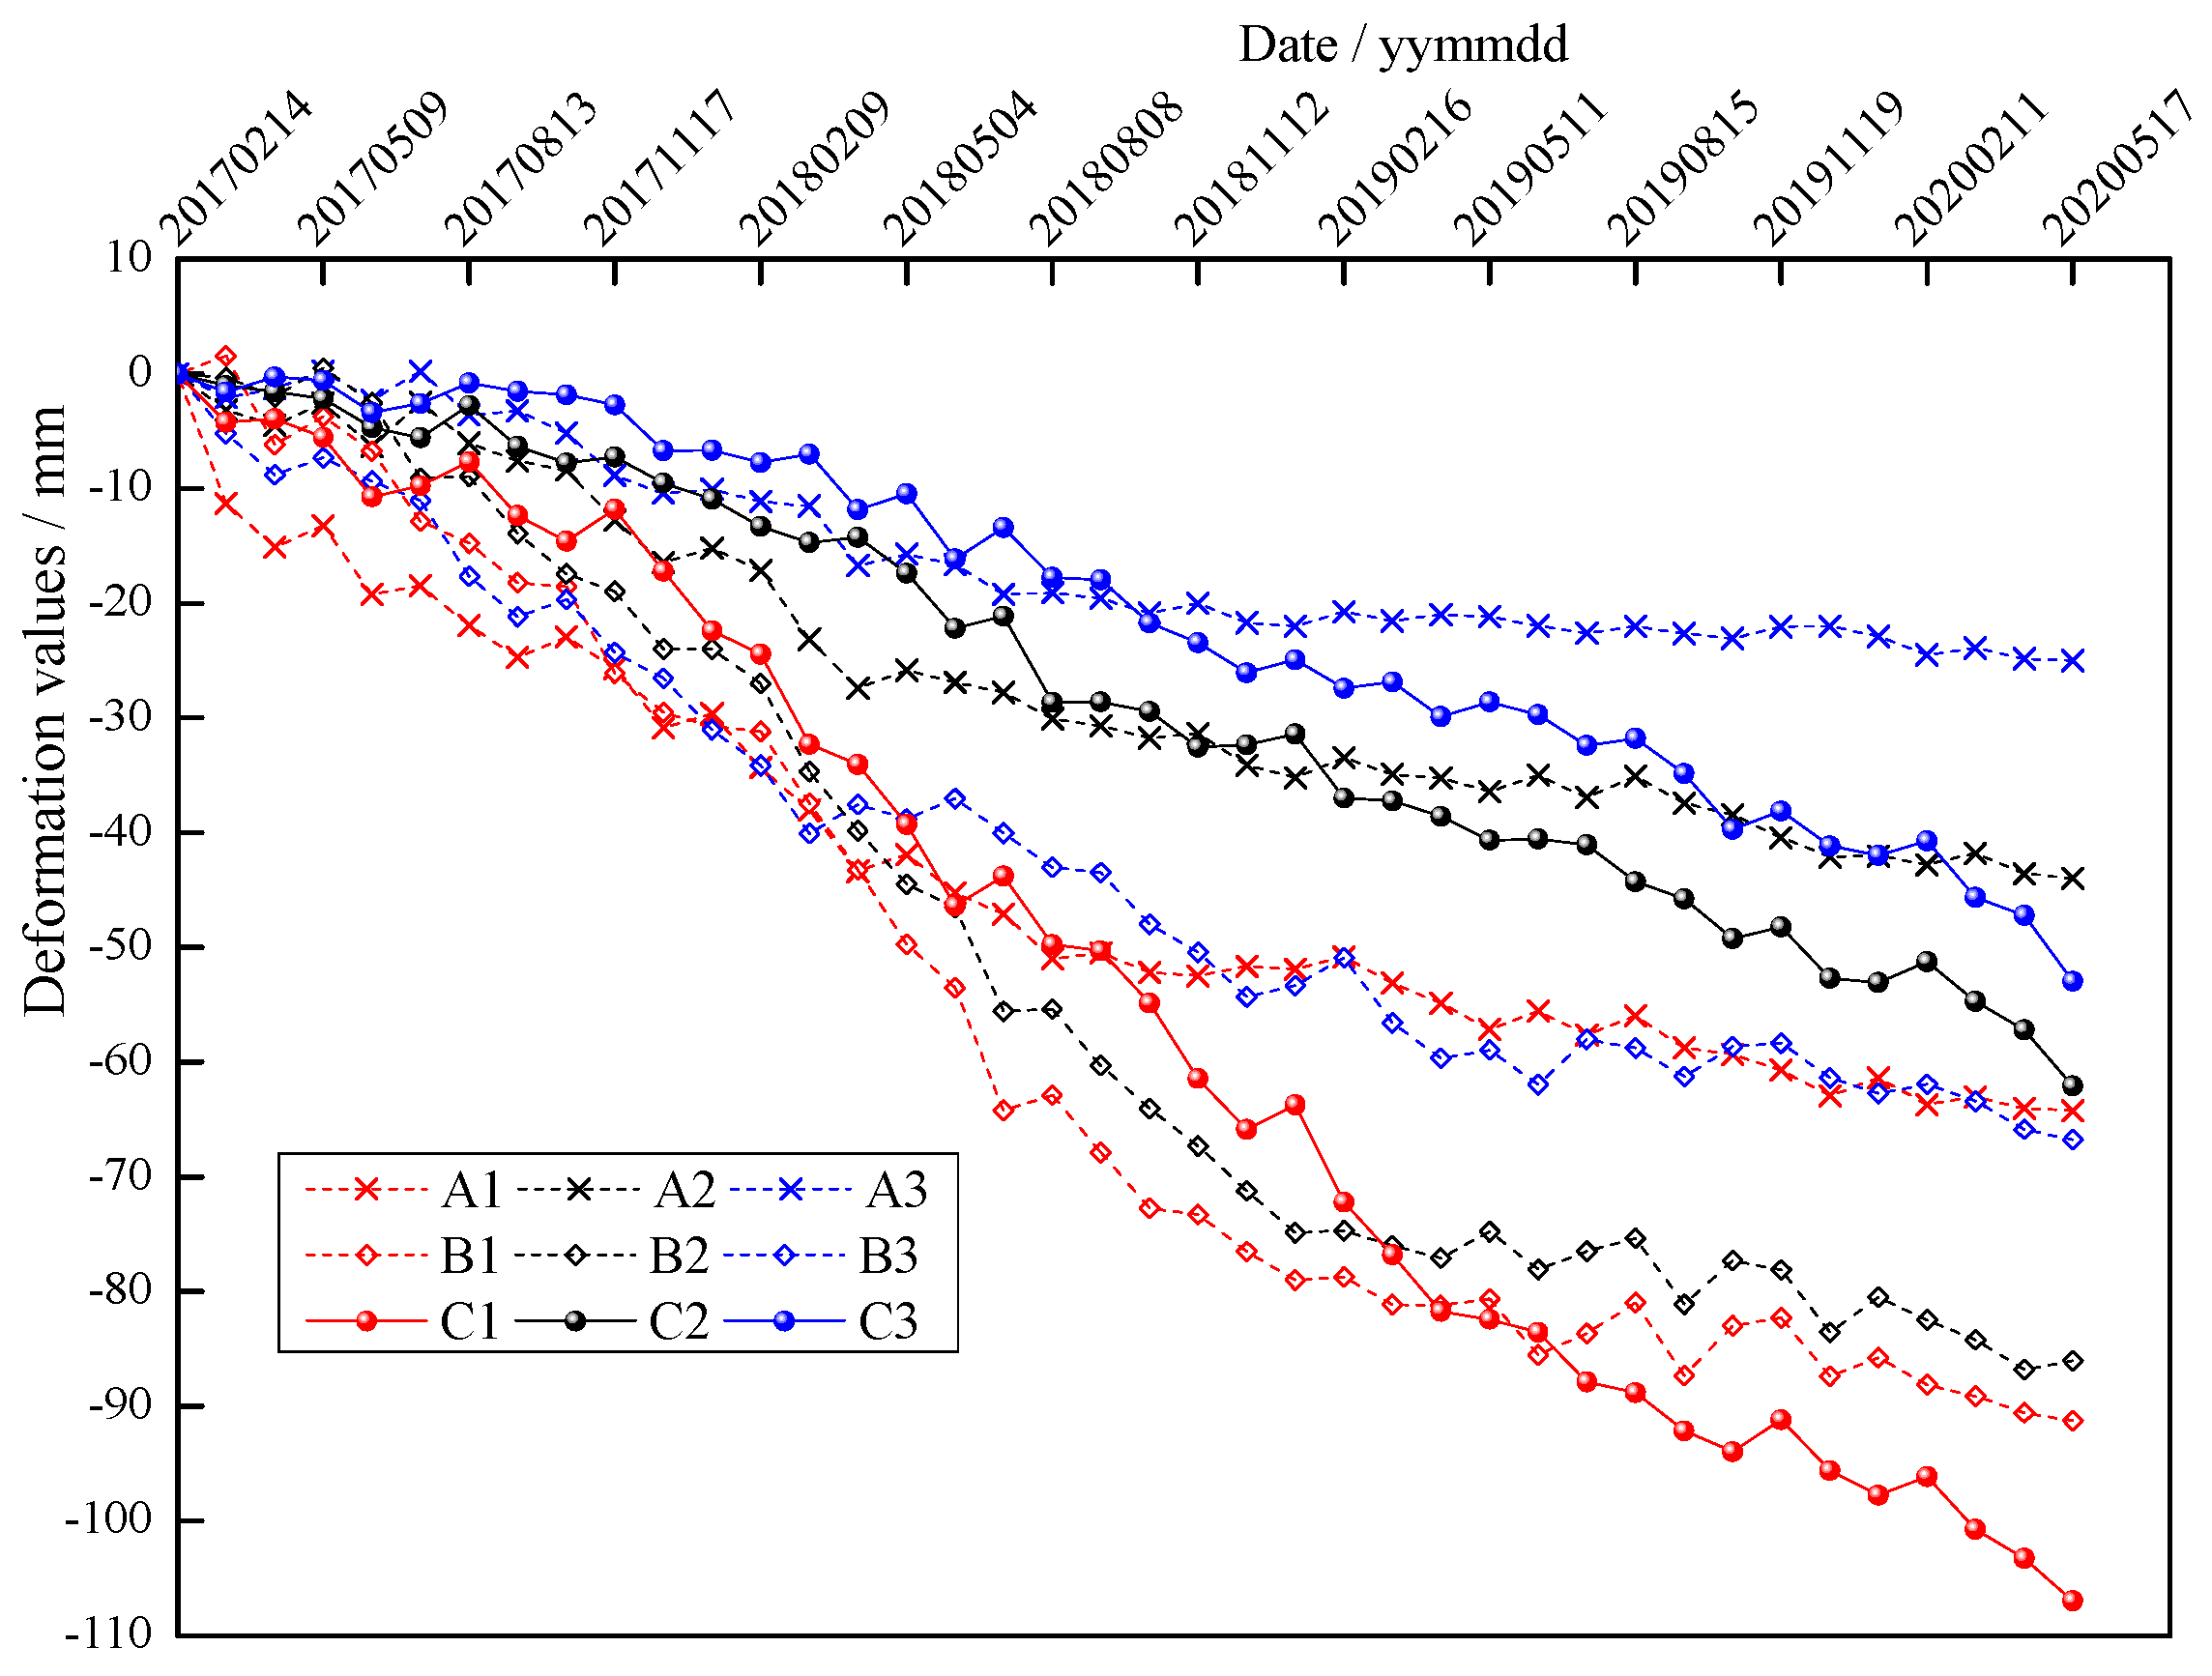
It can be seen that the above three zones have been undergoing subsidence over time during the period from February 2017 to May 2020. The maximum subsidence values of Zones A, B and C were 70.1, 94.6 and 109.3 mm, respectively. Except for the above three zones, the accumulated deformations of the other regions in the mining areas were relatively small, with accumulated deformation values ranging from -15 to 10 mm. Three coherent points were selected along the profiles AA’, BB’ and CC’ as shown in Figure 7, respectively, and these points are marked as A1, A2, A3, B1, B2, B3, C1, C2, C3. Then, their cumulative displacement curves over time were plotted as shown in Figure 8, showing that the cumulative subsidence deformation increases gradually.

5. Discussion

5.1. Validation with Leveling Measurements

To confirm the reliability of the results obtained by the SBAS-InSAR technique, precise in-situ monitoring based on widely used leveling measurement was conducted [52,53]. Four-order leveling was employed in this study, whose error of height difference per kilometer is 10 mm [16]. A total of twenty observation points (marked P1~P20) were set up around the study areas. The points P1~P4 were distributed in Baoshan coal mine and P5~P20 were in Ying’an coal mine. The specific locations of observation points are presented in Figure 3a and are indicated by yellow circles. The leveling data were acquired on 5 January 2019, 10 April 019, 20 July 2019, 20 October 2019 and 15 December 2019, respectively.
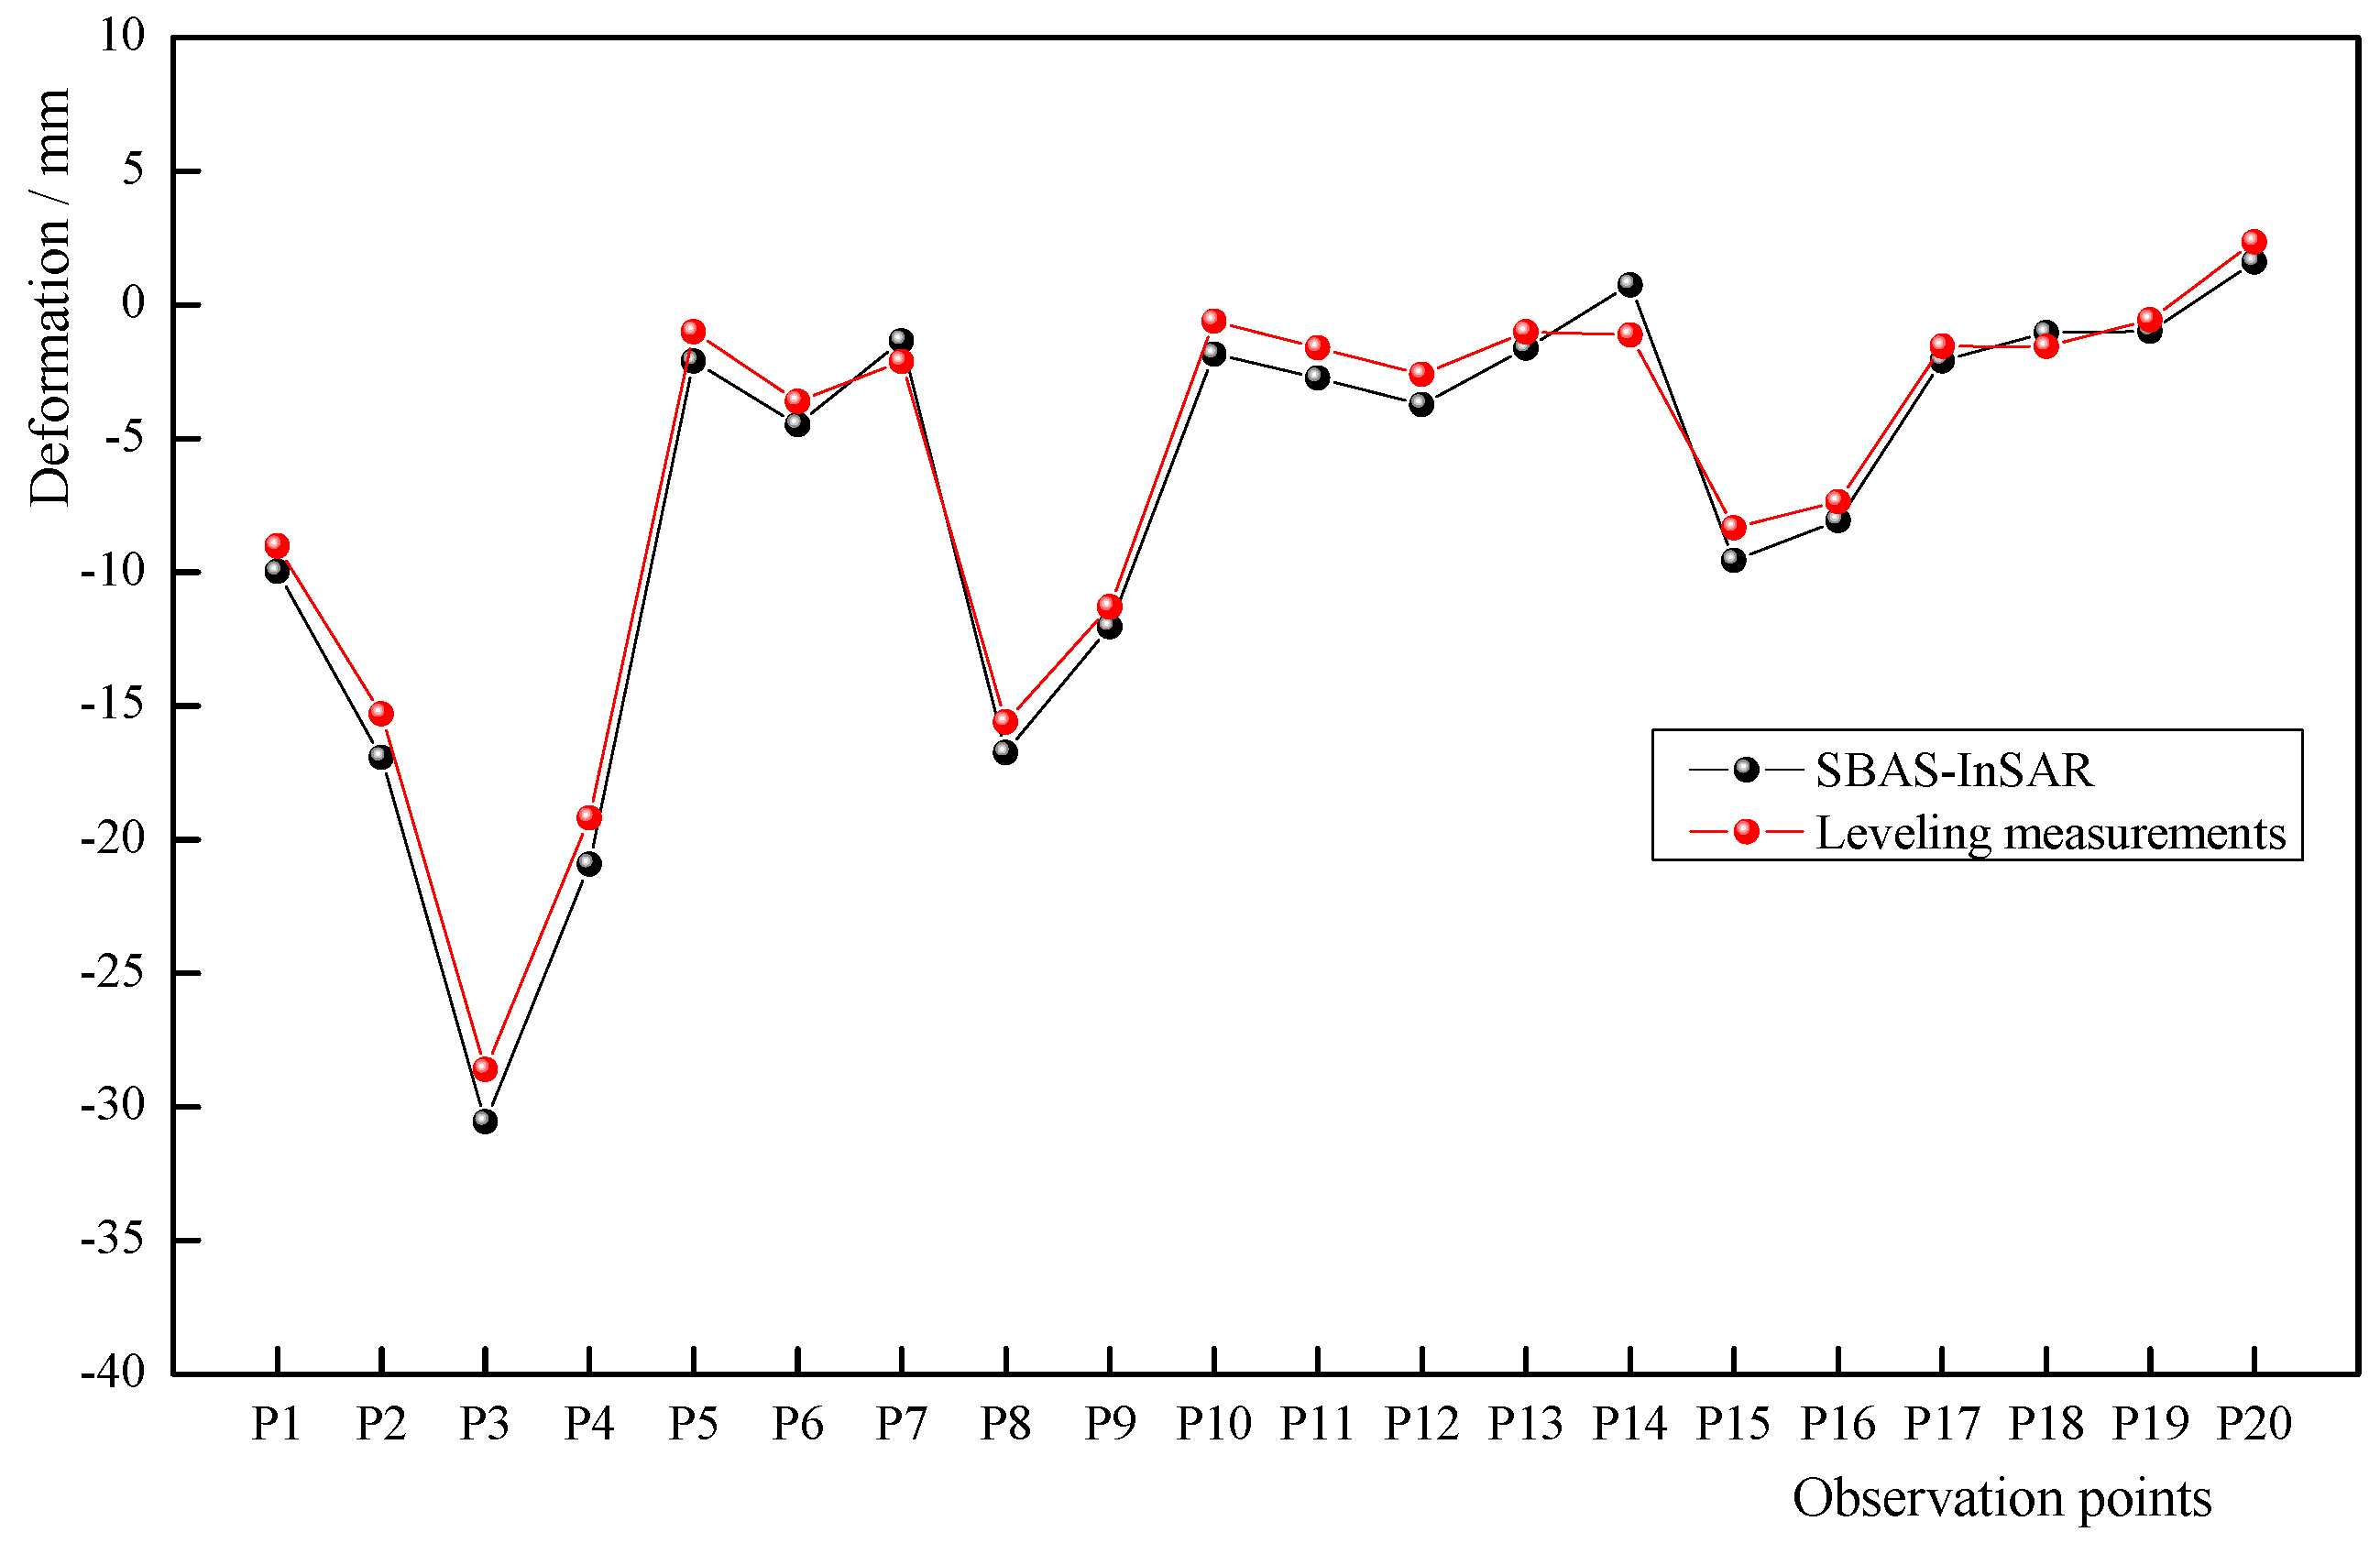
In the overlapping period from January 2019 to December 2019, the accumulative deformations obtained by leveling measurements and the SBAS-InSAR technique were extracted and plotted together in Figure 9. The comparison figure intuitively indicates that the SBAS-InSAR results agree well with the results obtained by the leveling measurements. Furthermore, the root mean square error (RMSE) between the results of the SBAS-InSAR and the leveling measurements was calculated by the following equation.
R M S E = 1 n i = 1 n ( d l e v , i d S B A S , i ) 2
In Equation (9), dlev,i and dSBAS,i stand for the deformation values of the ith observation point obtained by leveling measurements and SBAS-InSAR, respectively, and n is the number of observation points. Finally, the RMSE derived from Equation (9) was 1.144 mm, which quantitatively proves that the results obtained by SBAS-InSAR technique were reliable in this study.

5.2. The Residual Subsidence Associated with Coal Exploitation

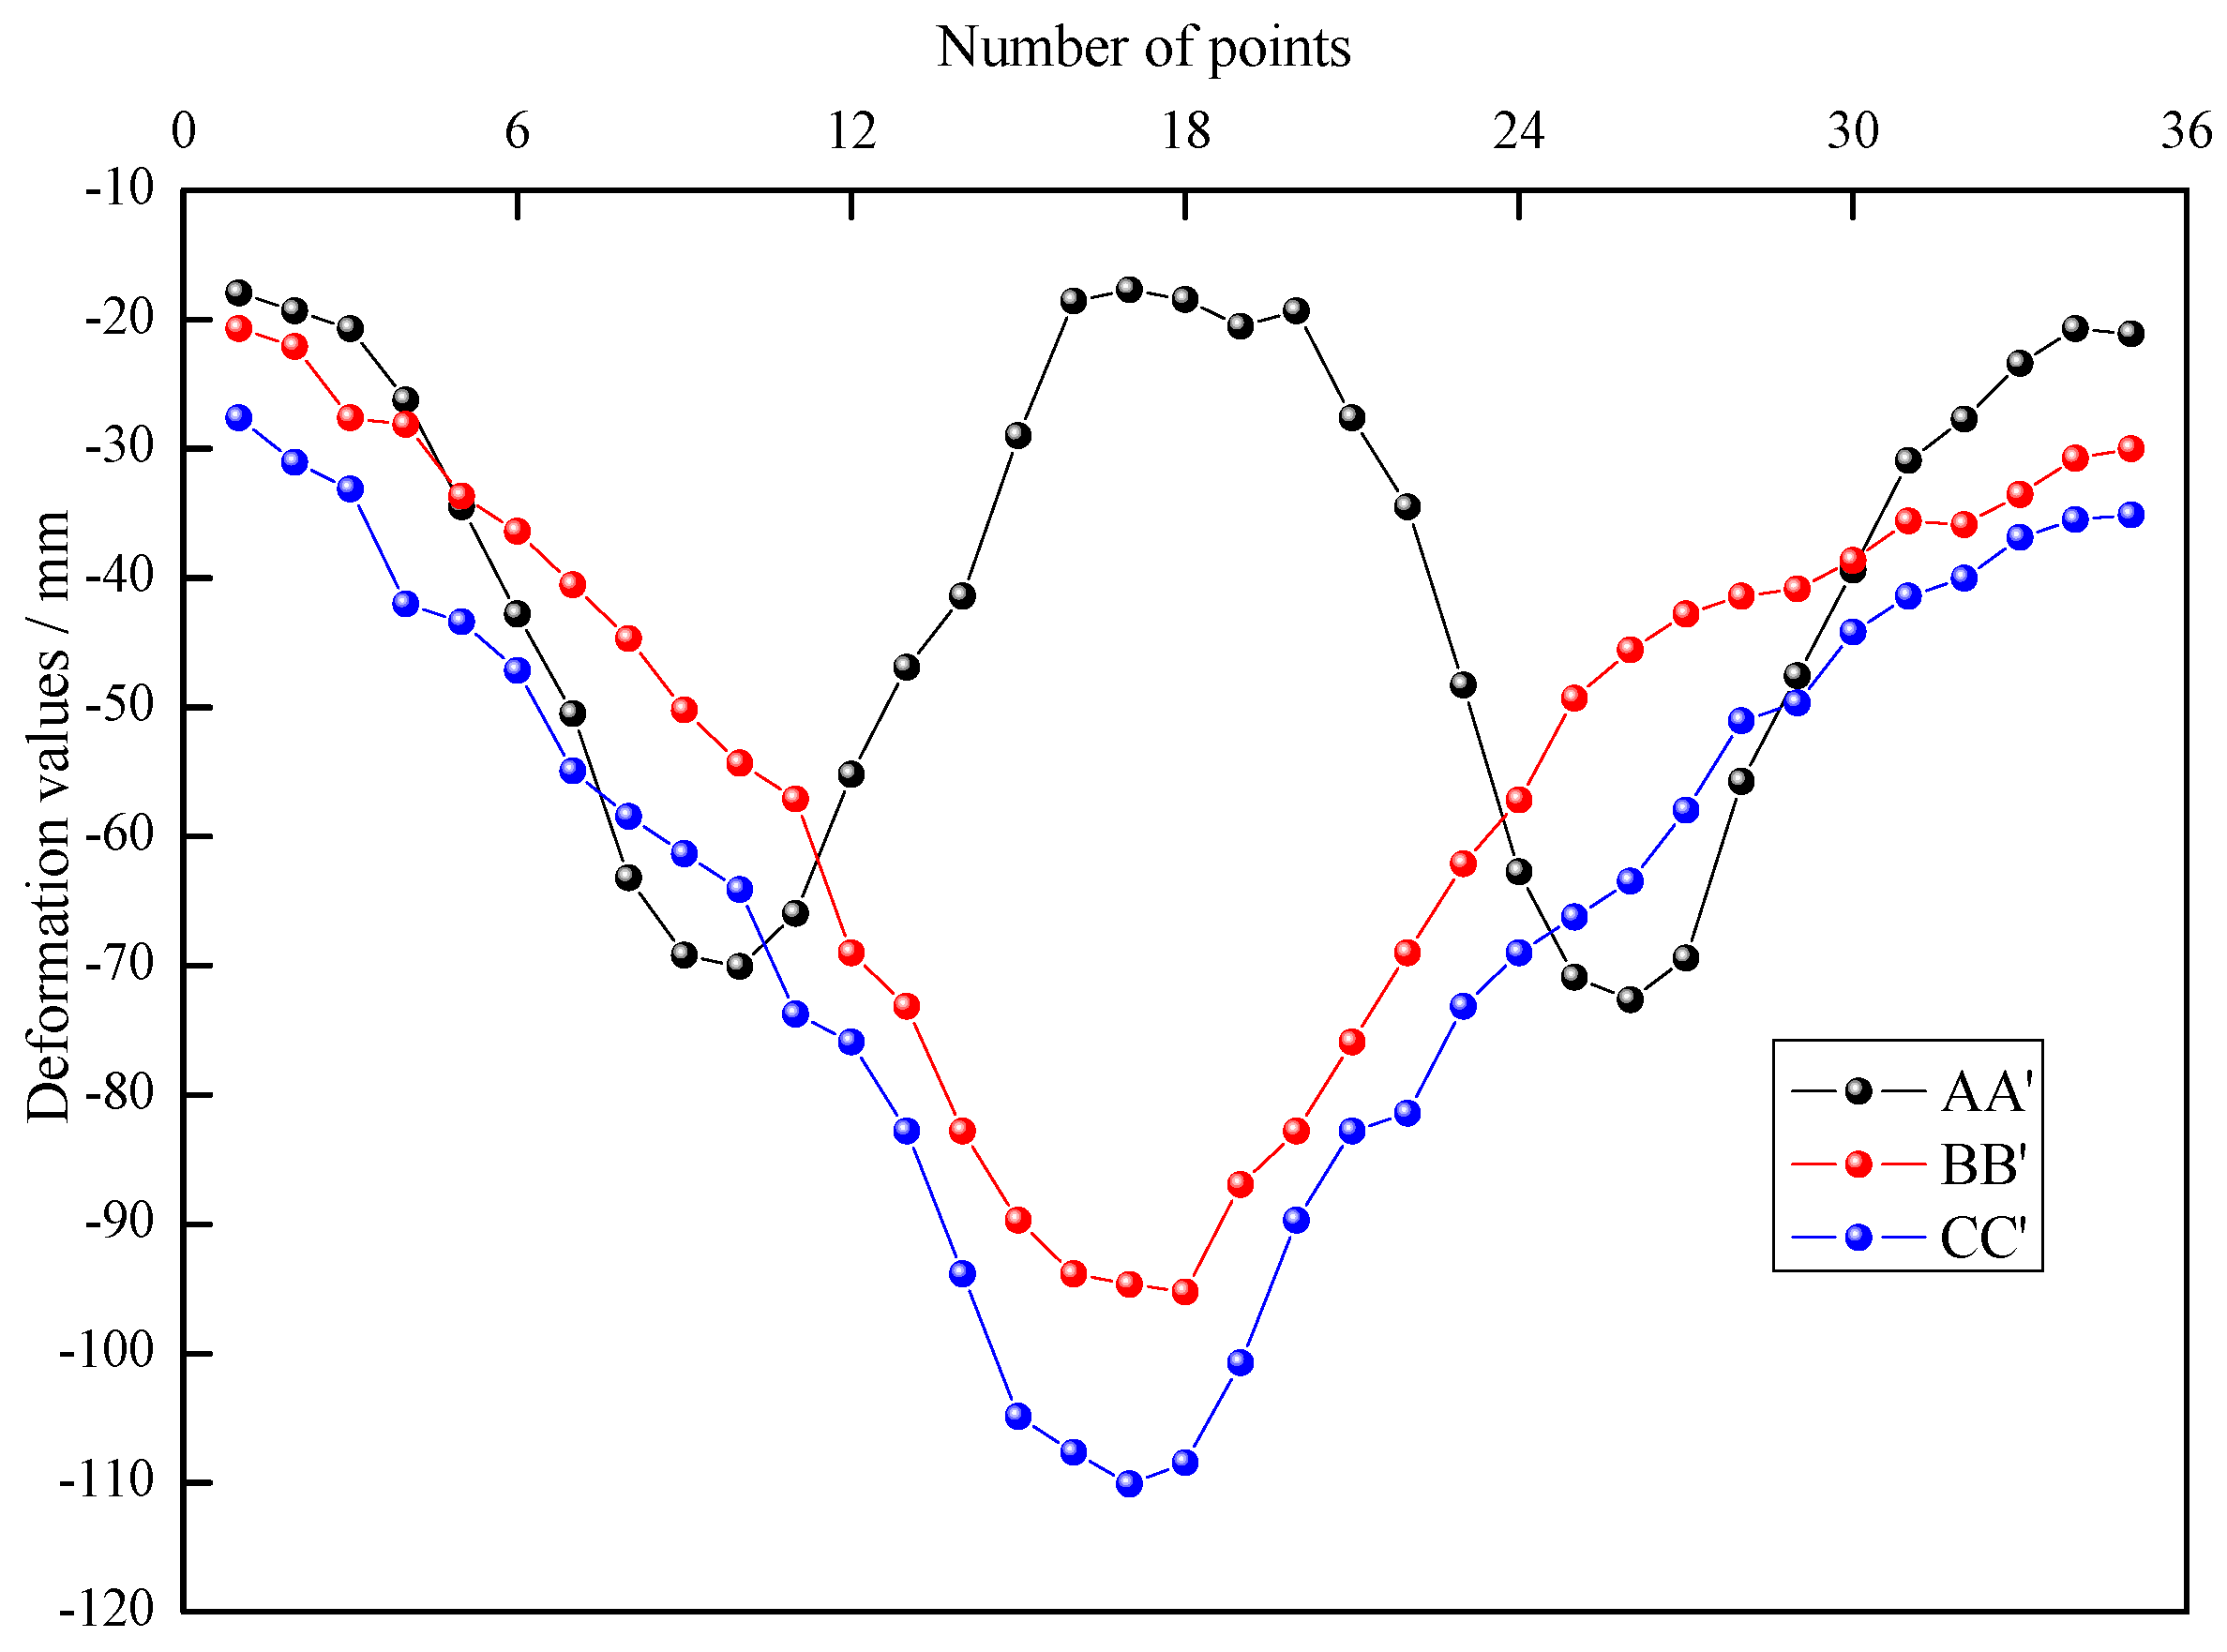
To further explore the spatial deformation evolution characteristics associated with coal exploitation, the profiles AA’, BB’ and CC’ shown in Figure 7 were arranged in to Zone A, Zone B and Zone C, respectively. Over the period between February 2017 and May 2020, the accumulative surface deformation values of 35 points in each profile were extracted and were presented in Figure 10. The uneven subsidence phenomenon along the three profiles could be clearly observed. The maximal subsidence magnitude of −109.3 mm occurred on profile CC’.
As shown in Figure 10, the subsidence phenomena of profiles BB’ and CC’ were characterized by a single subsidence bowl, whereas profile AA’ was characterized by double subsidence bowls. The time interval of the three mined-out areas from formation to the present state is recorded as TA, TB and TC, respectively. The data of the mining area indicate that the order of the three time intervals was TA > TB > TC, i.e., the mined-out area A was the earliest formed. These three profiles all correspond to the locations of the abandoned mined-out area, but their deformation characteristics were not completely consistent. The above characteristics can be explained through the following mechanisms based on the SBAS-InSAR results and subsidence process.
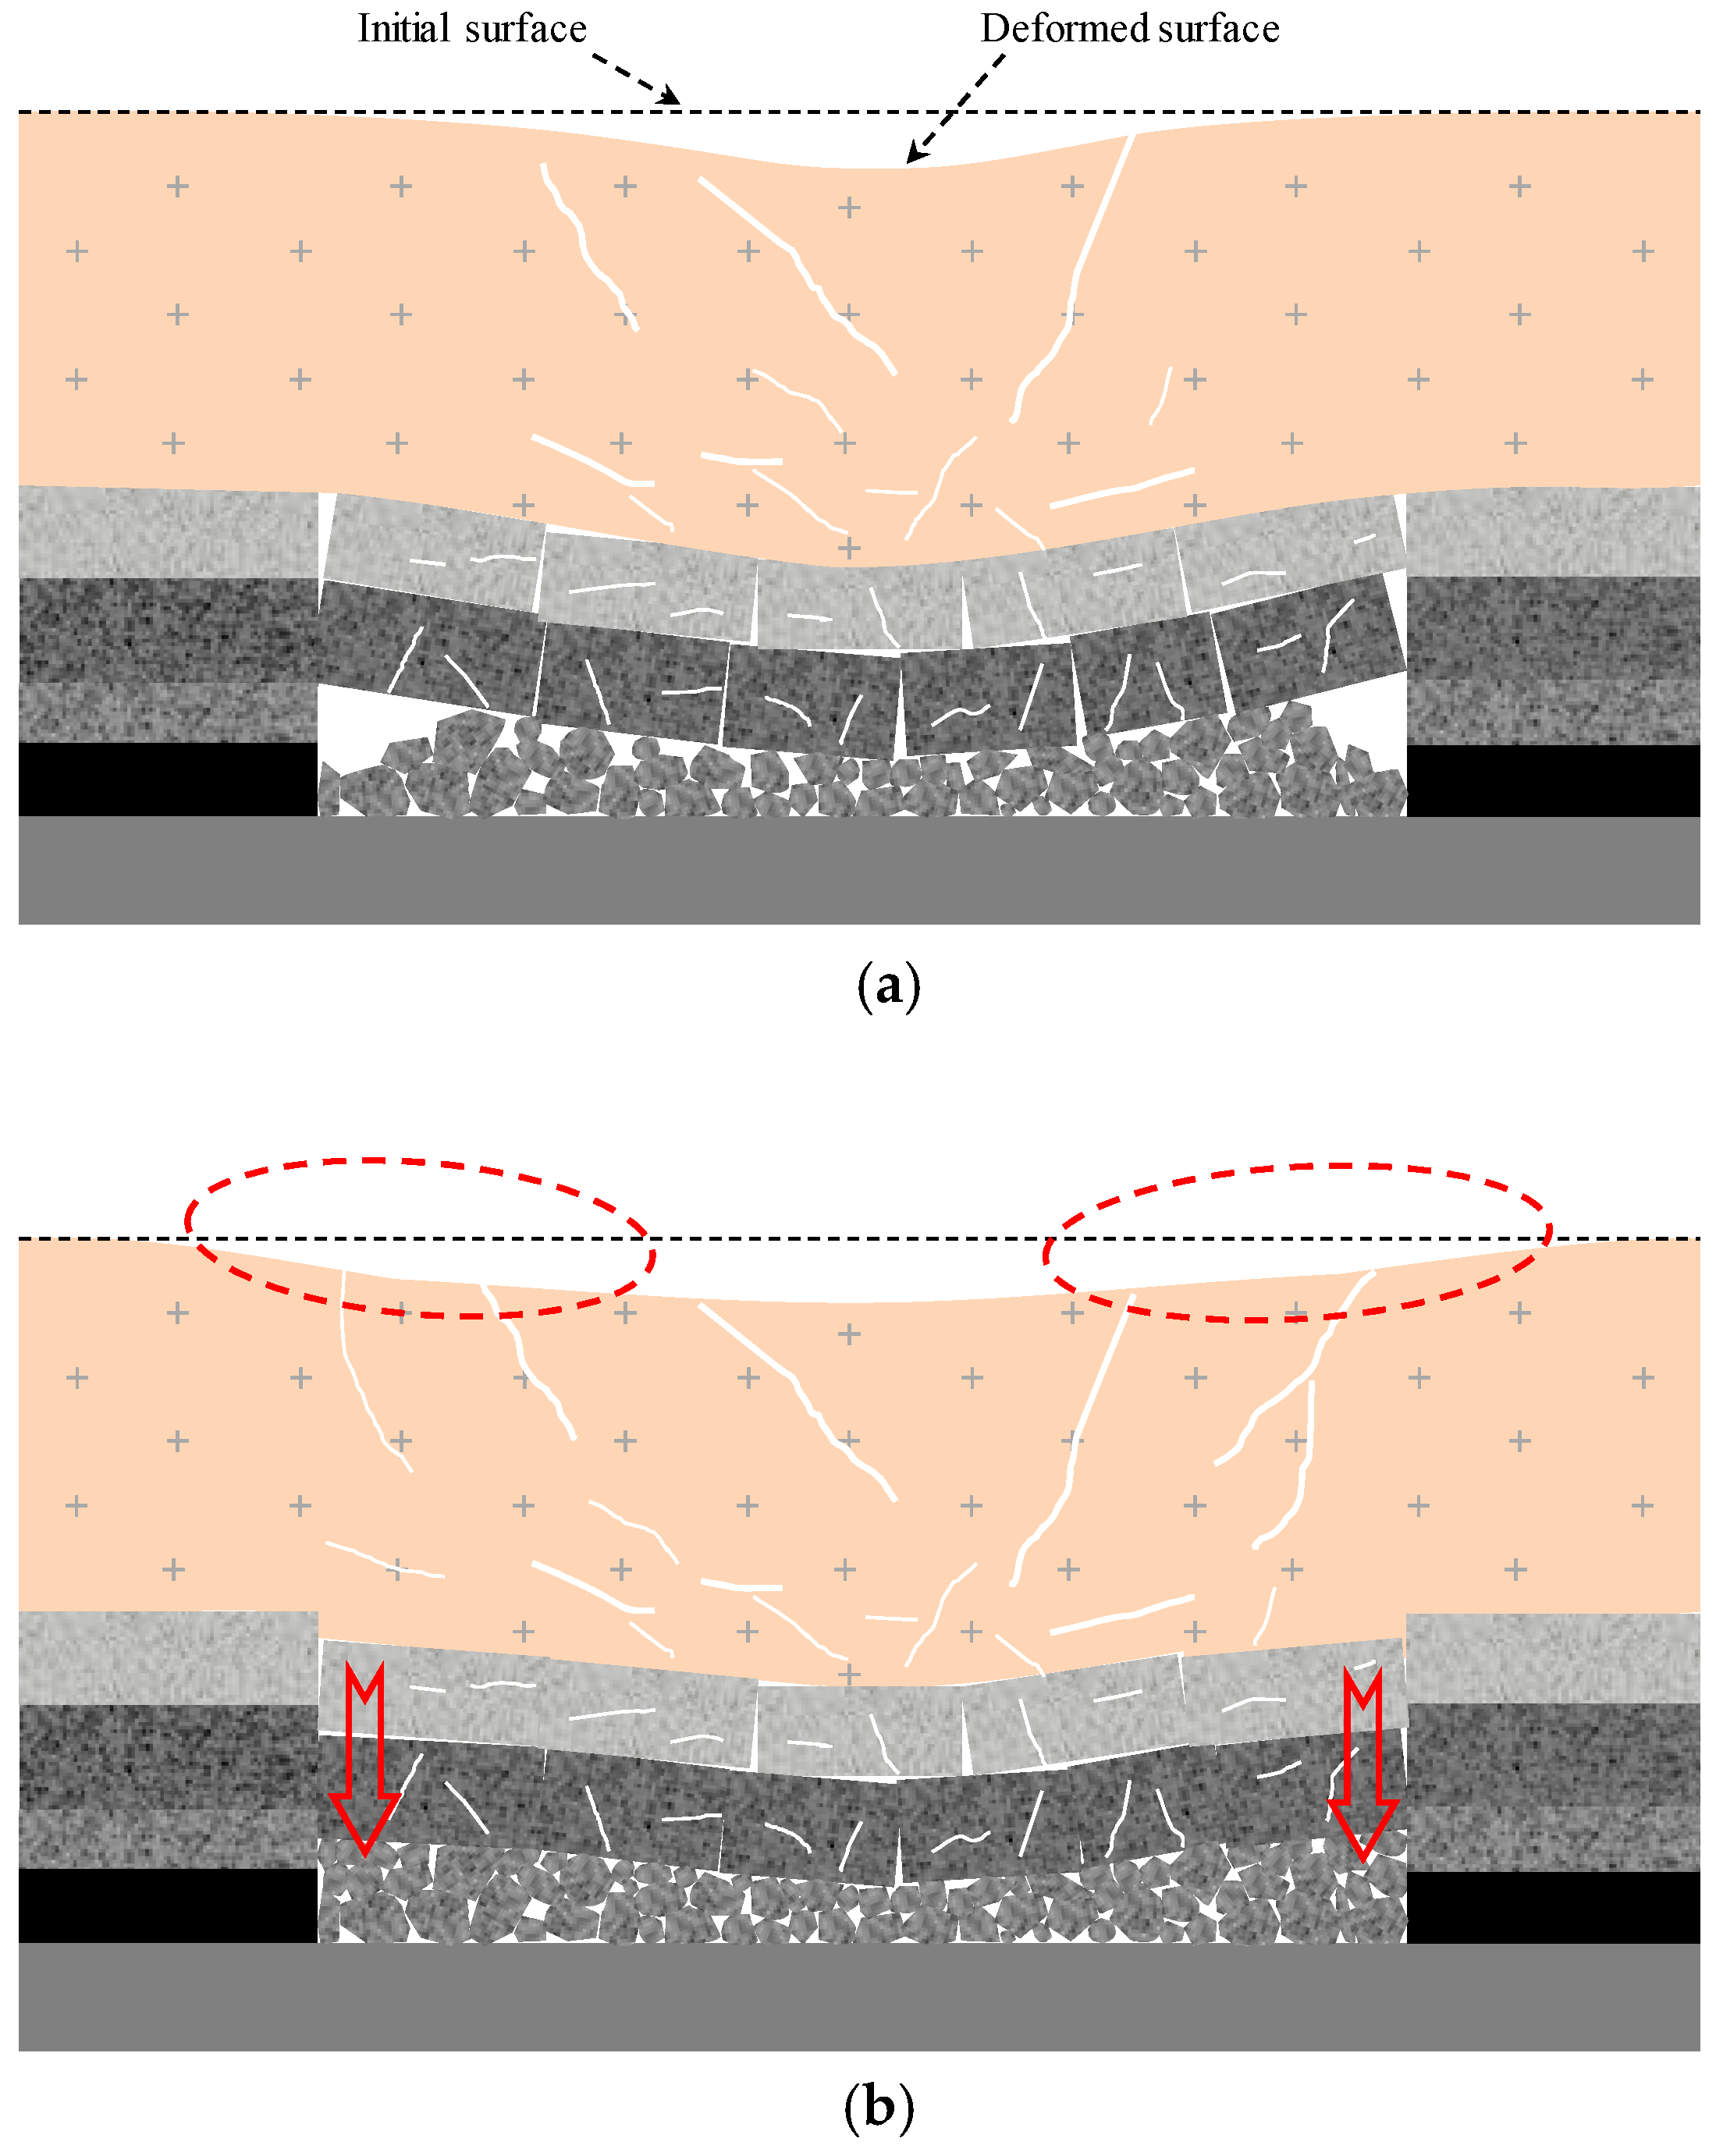
Generally, the original stress states of the overlying strata are disturbed and redistributed after the exploitation of underground coal seams, leading to the corresponding movement and deformation of the overlying strata. Meanwhile, numerous voids, including spaces between broken rocks, fractures in the overlying strata and fissures in the upper loose sediments, are produced [54]. Originally, the movement and deformation of overlying strata are mainly concentrated in the middle of the mined-out area since the middle provides the weakest support force for the overlying strata. As the overlying strata sink, the continuous deformation gradually extends upwards and eventually gives rise to the surface settlement, which was characterized by a single subsidence bowl as shown in Figure 11a. As time goes on, the regions close to the middle of the mined-out area are the first to reach a stable state. However, there is always a certain space that needs to be compacted in the boundary regions of the mined-out area as presented in Figure 11a. Consequently, later subsidence of the mined-out area mainly focuses on the boundary regions, causing the subsidence values of the boundary to be greater than those of the center. Once all types of voids are compacted, the subsidence is completed as shown in Figure 11b. The aforementioned processes can account for the surface deformation phenomenon with a characteristic of double subsidence bowls along profile AA’ as marked by the black curve in Figure 10. Overall, a desirable spatial–temporal correlation was detected between surface subsidence and coal exploitation.

6. Conclusions

In this study, a field investigation and SBAS-InSAR technology were adopted to obtain the characteristics of residual surface deformation caused by the underground mining activities in Ying’an and Baoshan coal mines. Time-series analysis of 40 Sentinel-1A SAR images between 14 February 2017 and 17 May 2020 indicated that the study area has been influenced by coal exploitation for a long time. Three dominant subsidence zones were detected in the study area, and they were all the location of abandoned mined-out areas. The maximum subsidence values of Zones A, B and C were 70.1 mm, 94.6 and 109.3 mm, respectively, during the study period. Comparison with in-situ leveling measurements demonstrated that SBAS-InSAR technology was a reliable monitoring method with high precision for characterizing mining-induced surface deformation.
According to the time-series deformation results obtained by SBAS-InSAR, mining-induced residual deformation was analyzed in the study area. Overall, the post-mining subsidence processes can be separated into two stages. In the first stage, the subsidence occurs mainly in the middle of the mined-out areas. In the second stage, the subsidence is concentrated on the boundary of the mined-out areas. Therefore, in the establishment of the subsidence prediction models of mined-out areas, the surface deformation characteristics of different stages should be fully taken into consideration in addition to the results of field investigations.

Author Contributions

Conceptualization, D.C. and W.Z.; Methodology, D.C.; Software, K.Z.; Validation, D.C.; Formal Analysis, D.C. and K.Z.; Investigation, C.C., X.Y. and Y.D.; Resources, W.Z.; Data Curation, K.Z.; Writing—Original Draft Preparation, D.C.; Writing—Review and Editing, H.C.; Visualization, D.C. and H.C.; Supervision, C.C.; Project Administration, W.Z.; Funding Acquisition, W.Z. All authors have read and agreed to the published version of the manuscript.

Funding

This research was financially supported by the National Key Research and Development Program of China (Grant number: 2017YFC1501004), and the National Natural Science Foundation of China (Grant numbers: 42022053, 41941017, 41877220, U1702241 and 41702301).

Acknowledgments

The authors would like to thank the European Space Agency (ESA) for arranging the Sentinel-1A data, and National Aeronautics and Space Administration (NASA) for providing the SRTM DEM data. The authors also thank the editor and anonymous reviewers very much for their valuable advices.

Conflicts of Interest

The authors declare no conflict of interest.

References

  1. Salmi, E.F.; Nazem, M.; Karakus, M. The effect of rock mass gradual deterioration on the mechanism of post-mining subsidence over shallow abandoned coal mines. Int. J. Rock Mech. Min. 2017, 91, 59–71. [Google Scholar] [CrossRef]
  2. Helm, P.R.; Davie, C.T.; Glendinning, S. Numerical modelling of shallow abandoned mine working subsidence affecting transport infrastructure. Eng. Geol. 2013, 154, 6–19. [Google Scholar] [CrossRef] [Green Version]
  3. Dawei, Z.; Kan, W.; Zhihui, B.; Zhenqi, H.; Liang, L.; Yuankun, X.; Xinpeng, D. Formation and development mechanism of ground crack caused by coal mining: Effects of overlying key strata. Bull. Eng. Geol. Environ. 2019, 78, 1025–1044. [Google Scholar] [CrossRef]
  4. Pawluszek-Filipiak, K.; Borkowski, A. Integration of DInSAR and SBAS Techniques to Determine Mining-Related Deformations Using Sentinel-1 Data: The Case Study of Rydułtowy Mine in Poland. Remote Sens. 2020, 12, 242. [Google Scholar] [CrossRef] [Green Version]
  5. Przyłucka, M.; Herrera, G.; Graniczny, M.; Colombo, D.; Béjar-Pizarro, M. Combination of Conventional and Advanced DInSAR to Monitor Very Fast Mining Subsidence with TerraSAR-X Data: Bytom City (Poland). Remote Sens. 2015, 7, 5300–5328. [Google Scholar] [CrossRef] [Green Version]
  6. Jung, H.C.; Kim, S.; Jung, H.; Min, K.D.; Won, J. Satellite observation of coal mining subsidence by persistent scatterer analysis. Eng. Geol. 2007, 92, 1–13. [Google Scholar] [CrossRef]
  7. Zhang, B.; Zhang, L.; Yang, H.; Zhang, Z.; Tao, J. Subsidence prediction and susceptibility zonation for collapse above goaf with thick alluvial cover: A case study of the Yongcheng coalfield, Henan Province, China. Bull. Eng. Geol. Environ. 2016, 75, 1117–1132. [Google Scholar] [CrossRef]
  8. Abidin, H.Z.; Andreas, H.; Gumilar, I.; Fukuda, Y.; Pohan, Y.E.; Deguchi, T. Land subsidence of Jakarta (Indonesia) and its relation with urban development. Nat. Hazards 2011, 59, 1753–1771. [Google Scholar] [CrossRef]
  9. Yang, X.; Wen, G.; Dai, L.; Sun, H.; Li, X. Ground Subsidence and Surface Cracks Evolution from Shallow-Buried Close-Distance Multi-seam Mining: A Case Study in Bulianta Coal Mine. Rock Mech. Rock Eng. 2019, 52, 2835–2852. [Google Scholar] [CrossRef]
  10. Zheng, M.; Deng, K.; Fan, H.; Du, S. Monitoring and Analysis of Surface Deformation in Mining Area Based on InSAR and GRACE. Remote Sens. 2018, 10, 1392. [Google Scholar] [CrossRef] [Green Version]
  11. Zhu, Y.; Xing, X.; Chen, L.; Yuan, Z.; Tang, P. Ground Subsidence Investigation in Fuoshan, China, Based on SBAS-InSAR Technology with TerraSAR-X Images. Appl. Sci. 2019, 9, 2038. [Google Scholar] [CrossRef] [Green Version]
  12. Zhou, C.; Gong, H.; Chen, B.; Gao, M.; Cao, Q.; Cao, J.; Duan, L.; Zuo, J.; Shi, M. Land Subsidence Response to Different Land Use Types and Water Resource Utilization in Beijing-Tianjin-Hebei, China. Remote Sens. 2020, 12, 457. [Google Scholar] [CrossRef] [Green Version]
  13. Liu, X.; Xing, X.; Wen, D.; Chen, L.; Yuan, Z.; Liu, B.; Tan, J. Mining-Induced Time-Series Deformation Investigation Based on SBAS-InSAR Technique: A Case Study of Drilling Water Solution Rock Salt Mine. Sensors 2019, 19, 5511. [Google Scholar] [CrossRef] [PubMed] [Green Version]
  14. Xu, Z.; Xu, E.; Wu, L.; Liu, S.; Mao, Y. Registration of Terrestrial Laser Scanning Surveys Using Terrain-Invariant Regions for Measuring Exploitative Volumes over Open-Pit Mines. Remote Sens. 2019, 11, 606. [Google Scholar] [CrossRef] [Green Version]
  15. Gee, D.; Sowter, A.; Grebby, S.; de Lange, G.; Athab, A.; Marsh, S. National geohazards mapping in Europe: Interferometric analysis of the Netherlands. Eng. Geol. 2019, 256, 1–22. [Google Scholar] [CrossRef]
  16. Fan, H.; Lu, L.; Yao, Y. Method Combining Probability Integration Model and a Small Baseline Subset for Time Series Monitoring of Mining Subsidence. Remote Sens. 2018, 10, 1444. [Google Scholar] [CrossRef] [Green Version]
  17. Ge, L.; Chang, H.; Rizos, C. Mine subsidence monitoring using multi-source satellite SAR images. Photogramm. Eng. Remote Sens. 2007, 73, 259–266. [Google Scholar] [CrossRef]
  18. Gabriel, A.K.; Goldstein, R.M.; Zebker, H.A. Mapping small elevation changes over large areas: Differential radar interferometry. J. Geophys. Res. 1989, 94, 9183–9191. [Google Scholar] [CrossRef]
  19. Herrera, G.; Tomás, R.; Lopez-Sanchez, J.M.; Delgado, J.; Mallorqui, J.J.; Duque, S.; Mulas, J. Advanced DInSAR analysis on mining areas: La Union case study (Murcia, SE Spain). Eng. Geol. 2007, 90, 148–159. [Google Scholar] [CrossRef] [Green Version]
  20. Prati, C.; Ferretti, A.; Perissin, D. Recent advances on surface ground deformation measurement by means of repeated space-borne SAR observations. J. Geodyn. 2010, 49, 161–170. [Google Scholar] [CrossRef] [Green Version]
  21. Reale, D.; Fornaro, G.; Pauciullo, A.; Zhu, X.; Bamler, R. Tomographic Imaging and Monitoring of Buildings With Very High Resolution SAR Data. IEEE Geosci. Remote Sens. 2011, 8, 661–665. [Google Scholar] [CrossRef] [Green Version]
  22. Bianchini, S.; Herrera, G.; Mateos, R.; Notti, D.; Garcia, I.; Mora, O.; Moretti, S. Landslide Activity Maps Generation by Means of Persistent Scatterer Interferometry. Remote Sens. 2013, 5, 6198–6222. [Google Scholar] [CrossRef] [Green Version]
  23. Calvello, M.; Peduto, D.; Arena, L. Combined use of statistical and DInSAR data analyses to define the state of activity of slow-moving landslides. Landslides 2017, 14, 473–489. [Google Scholar] [CrossRef]
  24. Herrera, G.; Gutiérrez, F.; García-Davalillo, J.C.; Guerrero, J.; Notti, D.; Galve, J.P.; Fernández-Merodo, J.A.; Cooksley, G. Multi-sensor advanced DInSAR monitoring of very slow landslides: The Tena Valley case study (Central Spanish Pyrenees). Remote Sens. Environ. 2013, 128, 31–43. [Google Scholar] [CrossRef]
  25. Sanabria, M.P.; Guardiola-Albert, C.; Tomás, R.; Herrera, G.; Prieto, A.; Sánchez, H.; Tessitore, S. Subsidence activity maps derived from DInSAR data: Orihuela case study. Nat. Hazard. Earth Syst. Sci. 2014, 14, 1341–1360. [Google Scholar] [CrossRef] [Green Version]
  26. Cigna, F.; Osmanoğlu, B.; Cabral-Cano, E.; Dixon, T.H.; Ávila-Olivera, J.A.; Garduño-Monroy, V.H.; DeMets, C.; Wdowinski, S. Monitoring land subsidence and its induced geological hazard with Synthetic Aperture Radar Interferometry: A case study in Morelia, Mexico. Remote Sens. Environ. 2012, 117, 146–161. [Google Scholar] [CrossRef]
  27. Du, S.; Feng, G.; Wang, J.; Feng, S.; Malekian, R.; Li, Z. A New Machine-Learning Prediction Model for Slope Deformation of an Open-Pit Mine: An Evaluation of Field Data. Energies 2019, 12, 1288. [Google Scholar] [CrossRef] [Green Version]
  28. Yang, Z.; Li, Z.; Zhu, J.; Wang, Y.; Wu, L. Use of SAR/InSAR in Mining Deformation Monitoring, Parameter Inversion, and Forward Predictions: A Review. IEEE Geosci. Remote Sens. Mag. 2020, 8, 71–90. [Google Scholar] [CrossRef]
  29. Anantrasirichai, N.; Biggs, J.; Kelevitz, K.; Sadeghi, Z.; Wright, T.; Thompson, J.; Achim, A.M.; Bull, D. Detecting Ground Deformation in the Built Environment Using Sparse Satellite InSAR Data with a Convolutional Neural Network. IEEE Trans. Geosci. Remote Sens. 2020, 1–11. [Google Scholar] [CrossRef]
  30. Ren, H.; Feng, X. Calculating vertical deformation using a single InSAR pair based on singular value decomposition in mining areas. Int. J. Appl. Earth Obs. 2020, 92, 102115. [Google Scholar] [CrossRef]
  31. Ferretti, A.; Prati, C.; Rocca, F. Permanent Scatterers in SAR Interferometry. IEEE Trans. Geosci. Remote Sens. 2001, 39, 8–20. [Google Scholar] [CrossRef]
  32. Berardino, P.; Fornaro, G.; Lanari, R.; Sansosti, E. A new algorithm for surface deformation monitoring based on small baseline differential SAR interferograms. IEEE Trans. Geosci. Remote Sens. 2002, 40, 2375–2383. [Google Scholar] [CrossRef] [Green Version]
  33. Zhang, L.; Ding, X.; Lu, Z.; Jung, H.; Hu, J.; Feng, G. A Novel Multitemporal InSAR Model for Joint Estimation of Deformation Rates and Orbital Errors. IEEE Trans. Geosci. Remote Sens. 2014, 52, 3529–3540. [Google Scholar] [CrossRef] [Green Version]
  34. Yang, K.; Yan, L.; Huang, G.; Chen, C.; Wu, Z. Monitoring Building Deformation with InSAR: Experiments and Validation. Sensors 2016, 16, 2182. [Google Scholar] [CrossRef]
  35. Samsonov, S.; D’Oreye, N.; Smets, B. Ground deformation associated with post-mining activity at the French–German border revealed by novel InSAR time series method. Int. J. Appl. Earth Obs. 2013, 23, 142–154. [Google Scholar] [CrossRef]
  36. Ju, J.; Xu, J. Surface stepped subsidence related to top-coal caving longwall mining of extremely thick coal seam under shallow cover. Int. J. Rock Mech. Min. 2015, 78, 27–35. [Google Scholar] [CrossRef]
  37. Brady, B.H.G.; Brown, E.T. Rock Mechanics for Underground Mining; Springer Science & Business Media: New York, NY, USA, 2004. [Google Scholar]
  38. Pawlik, A.; Migoń, P.; Owczarek, P.; Kacprzak, A. Surface processes and interactions with forest vegetation on a steep mudstone slope, Stołowe Mountains, SW Poland. Catena 2013, 109, 203–216. [Google Scholar] [CrossRef]
  39. Liu, Y.; Huang, H.; Liu, Y.; Bi, H. Linking land subsidence over the Yellow River delta, China, to hydrocarbon exploitation using multi-temporal InSAR. Nat. Hazards 2016, 84, 271–291. [Google Scholar] [CrossRef]
  40. Zhou, L.; Guo, J.; Hu, J.; Li, J.; Xu, Y.; Pan, Y.; Shi, M. Wuhan Surface Subsidence Analysis in 2015–2016 Based on Sentinel-1A Data by SBAS-InSAR. Remote Sens. 2017, 9, 982. [Google Scholar] [CrossRef] [Green Version]
  41. Wu, Q.; Jia, C.; Chen, S.; Li, H. SBAS-InSAR Based Deformation Detection of Urban Land, Created from Mega-Scale Mountain Excavating and Valley Filling in the Loess Plateau: The Case Study of Yan’an City. Remote Sens. 2019, 11, 1673. [Google Scholar] [CrossRef] [Green Version]
  42. Diao, X.; Bai, Z.; Wu, K.; Zhou, D.; Li, Z. Assessment of mining-induced damage to structures using InSAR time series analysis: A case study of Jiulong Mine, China. Environ. Earth Sci. 2018, 77, 166. [Google Scholar] [CrossRef]
  43. Dong, S.; Samsonov, S.; Yin, H.; Ye, S.; Cao, Y. Time-series analysis of subsidence associated with rapid urbanization in Shanghai, China measured with SBAS InSAR method. Environ. Earth Sci. 2014, 72, 677–691. [Google Scholar] [CrossRef]
  44. Zhu, G.Y.; Xu, Z.H.; Xie, C.; Guo, Y. Study of influence functions of surface residual movement and deformation above old goaf. J. Rock Mech. Eng. 2014, 33, 1962–1970. (In Chinese) [Google Scholar]
  45. Oliver, M.A.; Webster, R. A tutorial guide to geostatistics: Computing and modelling variograms and kriging. Catena 2014, 113, 56–69. [Google Scholar] [CrossRef]
  46. Zhao, L.; Choi, K.K.; Lee, I. Metamodeling Method Using Dynamic Kriging for Design Optimization. AIAA J. 2011, 49, 2034–2046. [Google Scholar] [CrossRef]
  47. Aryafar, A.; Khosravi, V.; Karami, S. Groundwater quality assessment of Birjand plain aquifer using kriging estimation and sequential Gaussian simulation methods. Environ. Earth Sci. 2020, 79, 210. [Google Scholar] [CrossRef]
  48. Lu, P.; Xu, Z.; Chen, Y.; Zhou, Y. Prediction method of bridge static load test results based on Kriging model. Eng. Struct. 2020, 214, 110641. [Google Scholar] [CrossRef]
  49. Tao, Z.; Cui, X.; Sun, X.; Wang, J.; Liu, K.; Chen, H. Rock mass quality prediction of open-pit gold mine slope based on the Kriging interpolation method. Geotech. Geol. Eng. 2020. [Google Scholar] [CrossRef]
  50. Bangroo, S.A.; Najar, G.R.; Achin, E.; Truong, P.N. Application of predictor variables in spatial quantification of soil organic carbon and total nitrogen using regression kriging in the North Kashmir forest Himalayas. Catena 2020, 193, 104632. [Google Scholar] [CrossRef]
  51. Montero, J.M.; Fernández-Avilés, G.; Mateu, J. Spatial and Spatio-Temporal Geostatistical Modeling and Kriging; John Wiley & Sons, Ltd.: Hoboken, NJ, USA, 2015. [Google Scholar]
  52. Tizzani, P.; Berardino, P.; Casu, F.; Euillades, P.; Manzo, M.; Ricciardi, G.; Zeni, G.; Lanari, R. Surface deformation of Long Valley caldera and Mono Basin, California, investigated with the SBAS-InSAR approach. Remote Sens. Environ. 2007, 108, 277–289. [Google Scholar] [CrossRef]
  53. Liu, D.; Shao, Y.; Liu, Z.; Riedel, B.; Sowter, A.; Niemeier, W.; Bian, Z. Evaluation of InSAR and TomoSAR for Monitoring Deformations Caused by Mining in a Mountainous Area with High Resolution Satellite-Based SAR. Remote Sens. 2014, 6, 1476–1495. [Google Scholar] [CrossRef] [Green Version]
  54. Wang, S.; Li, X.; Wang, D. Void fraction distribution in overburden disturbed by longwall mining of coal. Environ. Earth Sci. 2016, 75, 151. [Google Scholar] [CrossRef]
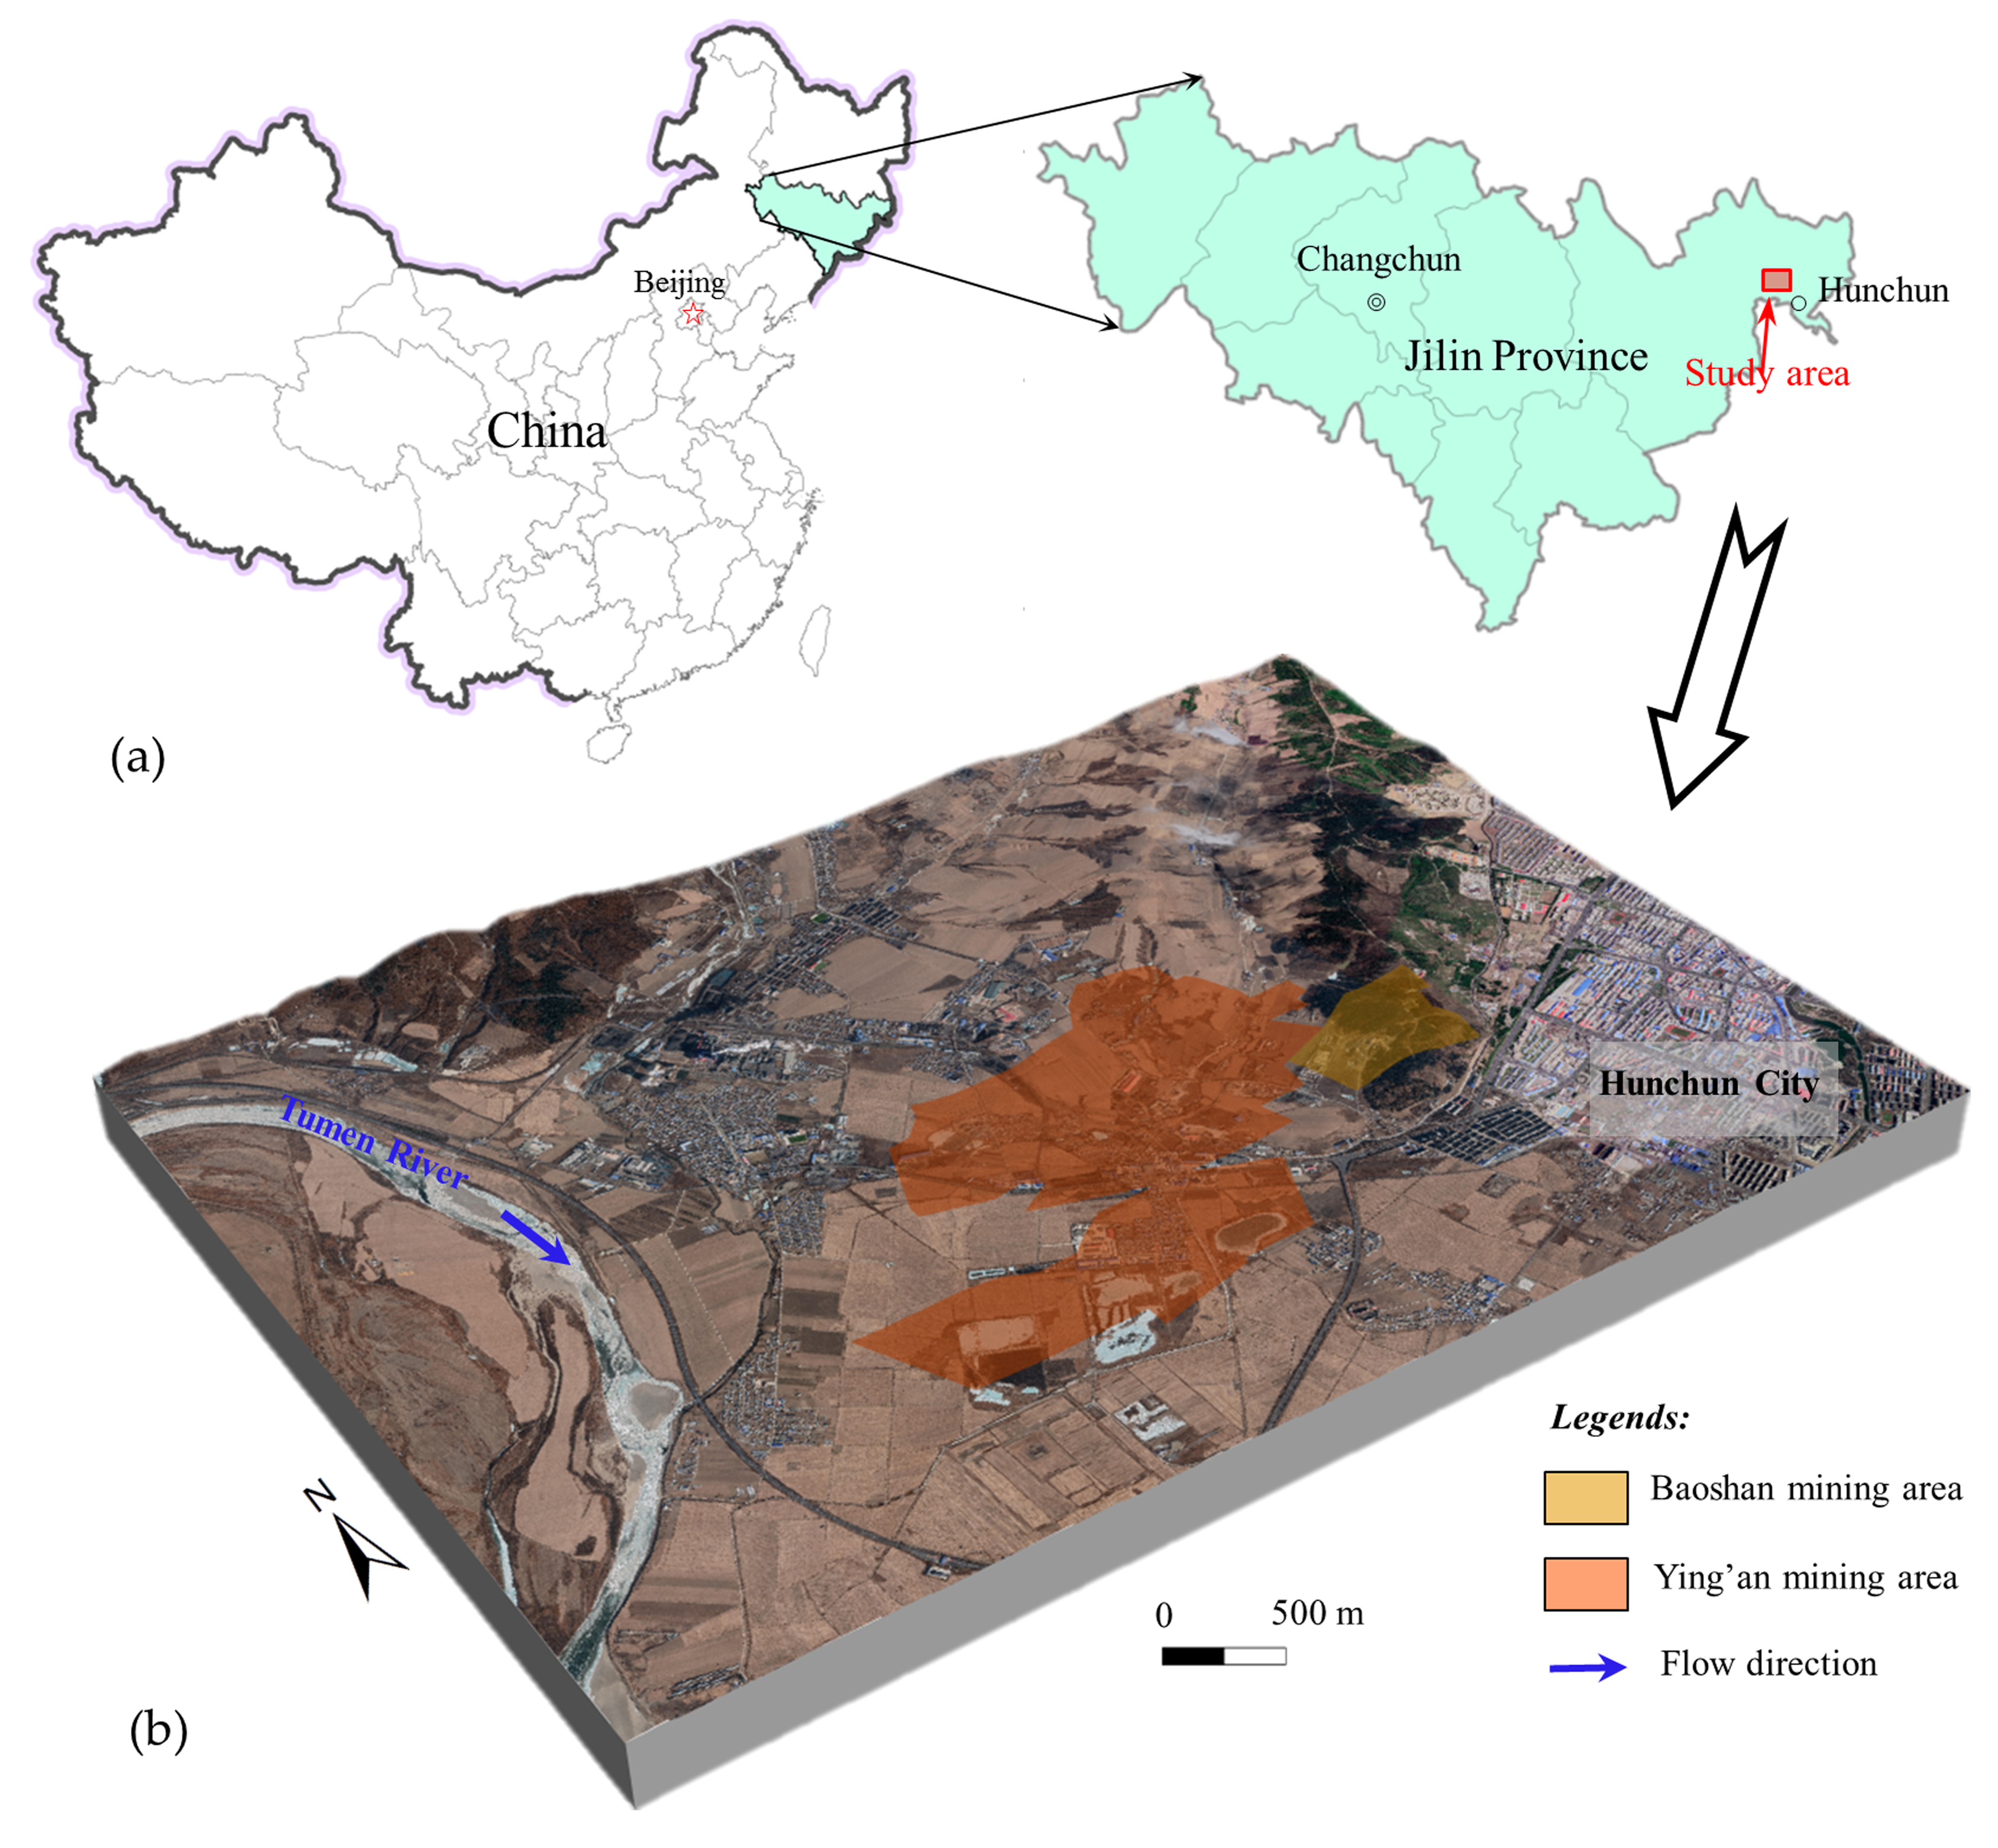
Figure 1. Overview map of the study area. (a) Geographic location of the study area. (b) The distribution map of the mining areas.
Remotesensing 12 03752 g001
Figure 2. Geological map of the study area.
Remotesensing 12 03752 g002
Figure 3. Field photographs of surface deformation in the mining areas. (a) The Google Earth image of mining areas. (b) Cracks in the farmlands. (c) Cracks in the roads. (d) Cracks in the walls of resident houses. (e) Bent trees. (f) The lake resulting from surface subsidence. (g) Surface collapse and bent trees. (Note that the yellow circles represent the location of observation points for leveling measurements, and will be introduced in Section 5.1).
Remotesensing 12 03752 g003
Figure 4. Spatial and temporal baselines utilized in the current study: (a) time-position plot of synthetic aperture radar (SAR) image acquisitions; (b) time-baseline plot of interferometric pairs of SAR images. The yellow mark stands for the super master image, and each line between two images denotes a connection.
Remotesensing 12 03752 g004
Figure 5. Map of the mean deformation velocity of the mining areas obtained by the small baseline subset interferometry synthetic aperture radar (SBAS-InSAR).
Remotesensing 12 03752 g005
Figure 6. The mean deformation velocity obtained by the ordinary Kriging model. (a) Map of the mean deformation velocity. (b) The fitted line between the results obtained by the SBAS-InSAR and the ordinary Kriging model. (c) Distributions of the residuals of mean deformation velocity. Note that VS on (b) is the deformation velocity obtained by the SBAS-InSAR, and VK is the deformation velocity obtained by the ordinary Kriging model.
Remotesensing 12 03752 g006
Figure 7. Maps of the time-series accumulated deformation maps of the mined-out areas with reference to 14 February 2017 (the acquisition time of the first SAR image). Note that the three white lines (AA’, BB’ and CC’) on the last image represent profiles.
Remotesensing 12 03752 g007
Figure 8. Time series of the accumulated deformation at selected points.
Remotesensing 12 03752 g008
Figure 9. Comparison of the accumulative deformation values obtained by leveling measurements and the SBAS-InSAR technique.
Remotesensing 12 03752 g009
Figure 10. Surface deformation values along the three selected profiles.
Remotesensing 12 03752 g010
Figure 11. Diagram of the development of surface deformation caused by underground coal exploitation in abandoned mined-out area. (a) The subsidence deformation at early stage. (b) The subsidence deformation at later stage.
Remotesensing 12 03752 g011
Table 1. Specific information related to Sentinel-1A images and Shuttle Radar Topography Mission (SRTM) data. (SLC: single look complex image; IW: interferometric wide swath; VV: vertical polarization).
DataParametersDescription
Sentinel-1ATypeSLC
Imaging modeIW
Band and wavelength (cm)C, 5.5
Incidence Angle (°)43.3
Orbit directionAscending
Azimuth resolution (m)20
Range resolution (m)5
PolarizationVV
SRTMResolution (m)30
Publisher’s Note: MDPI stays neutral with regard to jurisdictional claims in published maps and institutional affiliations.