Article

Vis-NIR Spectroscopy and Satellite Landsat-8 OLI Data to Map Soil Nutrients in Arid Conditions: A Case Study of the Northwest Coast of Egypt

1
National Authority for Remote Sensing and Space Sciences, Cairo 1564, Egypt
2
Soils and Water Department, Faculty of Agriculture, Tanta University, Gharbiya 31527, Egypt
3
Italian National Research Council, C.da Santa Loja, Tito Scalo, 85050 Potenza, Italy
4
Geography Department, King Saud University, Riyadh 11451, Saudi Arabia
5
Agrarian-Technological Institute of the Peoples’ Friendship University of Russia, ul. Miklukho-Maklaya 6, 117198 Moscow, Russia
*
Author to whom correspondence should be addressed.
Remote Sens. 2020, 12(22), 3716; https://doi.org/10.3390/rs12223716
Submission received: 12 September 2020 / Revised: 30 October 2020 / Accepted: 1 November 2020 / Published: 12 November 2020
(This article belongs to the Special Issue Remote Sensing in Applications of Geoinformation)

Abstract

:
The mapping of soil nutrients is a key issue for numerous applications and research fields ranging from global changes to environmental degradation, from sustainable soil management to the precision agriculture concept. The characterization, modeling and mapping of soil properties at diverse spatial and temporal scales are key factors required for different environments. This paper is focused on the use and comparison of soil chemical analyses, Visible near infrared and shortwave infrared VNIR-SWIR spectroscopy, partial least-squares regression (PLSR), Ordinary Kriging (OK), and Landsat-8 operational land imager (OLI) images, to inexpensively analyze and predict the content of different soil nutrients (nitrogen (N), phosphorus (P), and potassium (K)), pH, and soil organic matter (SOM) in arid conditions. To achieve this aim, 100 surface samples of soil were gathered to a depth of 25 cm in the Wadi El-Garawla area (the northwest coast of Egypt) using chemical analyses and reflectance spectroscopy in the wavelength range from 350 to 2500 nm. PLSR was used firstly to model the relationship between the averaged values from the ASD spectroradiometer and the available N, P, and K, pH and SOM contents in soils in order to map the predicted value using Ordinary Kriging (OK) and secondly to retrieve N, P, K, pH, and SOM values from OLI images. Thirty soil samples were selected to verify the validity of the results. The randomly selected samples included the spatial diversity and characteristics of the study area. The prediction of available of N, P, K pH and SOM in soils using VNIR-SWIR spectroscopy showed high performance (where R2 was 0.89, 0.72, 0.91, 0.65, and 0.75, respectively) and quite satisfactory results from Landsat-8 OLI images (correlation R2 values 0.71, 0.68, 0.55, 0.62 and 0.7, respectively). The results showed that about 84% of the soils of Wadi El-Garawla are characterized by low-to-moderate fertility, while about 16% of the area is characterized by high soil fertility.

Graphical Abstract

1. Introduction

Soil is a very complex ecosystem made up of biotic and abiotic factors that strongly differ from one environment to another. The characterization, modelling and mapping of soil properties are key factors for implementing good agricultural management practices [1,2,3,4] to maintain ecological balances and prevent land degradation in arid and semiarid environments. As an example, the accumulation of salts and soil nutrients in arid conditions is affected by many factors, such as topography, geology, climate, soil moisture, land use, agricultural activity, and local environmental conditions [5,6,7,8]. The traditional methods for estimating different soil properties typically involves extensive field work and laboratory analysis and, therefore, are not only expensive and time consuming but also may be affected by significant uncertainty. Therefore, over the last four decades, to model and map soil properties in a cost-effective manner at various scales, remotely sensed imagery has been proposed and used in combination with field measurements [9,10,11,12]. Important soil properties such as salinity, texture, minerals, and organic matter have been successfully characterized and investigated using multispectral scanner (MS), Landsat-8 operational land imager (OLI), Landsat-5 thematic mapper (TM), Landsat-7 enhanced thematic mapper plus (ETM+) [13].
Over the past two decades, scientists throughout the world have focused their interest on new technologies such as the visible–near-infrared (Vis-NIR) spectroscopy to identify and characterize soil in terms of (but not only) clay mineralogy, soil organic matter (SOM), soil composition, and soil texture [14,15,16,17]. It is well recognized that the absorption spectrum in the NIR zone (780–2500 nm) can be used for estimating H2O, CO2, OH, SO4, and CO3 groups [18]; furthermore, soil nutrients can be identified using NIR spectroscopy, particularly for estimating N, K, and P soil content (with expected satisfactory coefficients of correlation around 0.72 and 0.68 for N and K, respectively), and with higher value in the case of phosphorus (around 0.84) [19]. Moreover, additional independent studies have shown that calcium, potassium, magnesium, and sodium can be predicted using statistical models such as partial least-squares regression (PLSR) [20,21]. As a whole, today, Vis-NIR techniques are recognized to be effective for the quantitative retrieval of soil characteristics and usually provide good indications of soil quality [22]. Nevertheless, some critical issues have still to be faced, such as, for example, the estimation of carbonate and the gypsum contents that is still today a controversial issue. In fact, some studies highlighted that spectroscopic techniques cannot suitably predict the carbonate content (correlation lower than 0.52), whereas other studies pointed out that the joint use of spectroscopic techniques and PLSR improved the estimation with correlation values ranging from 0.86 to 0.91 [23,24,25].
From the methodological point of view, analytical methods based on changes in specific reflectance (in the visible range from 400 to 700 nm, and in the near-infrared range from 700 to 2500 nm [26,27]), enable the discrimination of different soil properties, such as pH, organic carbon, electrical conductivity, texture, nitrate–nitrogen, available phosphorus, exchangeable potassium, cation exchange capacity, exchangeable calcium, and exchangeable aluminum. Moreover, several prediction models have been used to assess soil properties based on reflectance spectroscopy, such as artificial neural networks (ANN), partial least square regression (PLSR), stepwise multiple linear regression (SIMR), multivariate adaptive regression splines (MARS), locally weighted regression (LWR), and principal components regression (PCR) [18,28].
As a whole, today, one of the major challenges to be faced is the need to develop low-cost methods for mapping soil properties over large areas and, on the other hand, it is important to consider that agricultural management needs a rapid analysis to identify the deficiency of elements in the soil and crops. To cope with this issue, Vis-NIR reflectance spectroscopy coupled with satellite data can suitably complement in situ analyses [29,30]. The timely availability of quantitative information on soil properties and their spatial distribution is extremely relevant for sustainable agricultural to achieve development, reducing the negative effects on soil and environment [31,32,33]. This is extremely important in arid and semi-arid areas which have several limiting factors for soil fertility, such as low nitrogen, phosphorus, scarcity of irrigation water, and low soil organic matter. Moreover, the mapping soil properties and fertility provides good indicators of land degradation [34,35,36] and/or evidence of land capacity.
An effort in this context is made in this paper, which is focused on the evaluation of soil nutrients (N, P, K), SOM, and pH in the arid area of Wadi El-Garawla (the northwest coast of Egypt) jointly using chemical analyses, Vis-NIR spectroscopy and satellite Landsat-8 data that are freely available from the NASA web site. In detail, the PLSR was used firstly to model the relationship between the averaged values from the analytical spectral devices (ASD) spectroradiometer and the soil’s available nitrogen (N), phosphorus (P), and potassium (K) content, along with the pH and the soil organic matter (SOM); and (ii) secondly to retrieve N, P, K, pH, and SOM values from the OLI images. Thirty soil samples were selected to verify the validity of the results. The randomly selected samples included the spatial diversity and characteristics of the study area.
The approach herein proposed enabled us to (I) model the relationship between the Spectral reflectance by ASD spectroradiometer and the laboratory analysis of soil of soil properties (N, P, K), pH, and SOM; (II) map the predicted soil properties using OK; (III) map the predicted soil properties from Landsat OLI images; and (IV) map the soil fertility status.
Today the availability of open satellite data from national and international space agencies strongly facilitates the investigation of soil properties, and their timely availability enables a prompt update and spatial distribution over a large area as necessary to support soil management strategies and to update information on the input parameters of crop models.

2. Materials and Methods

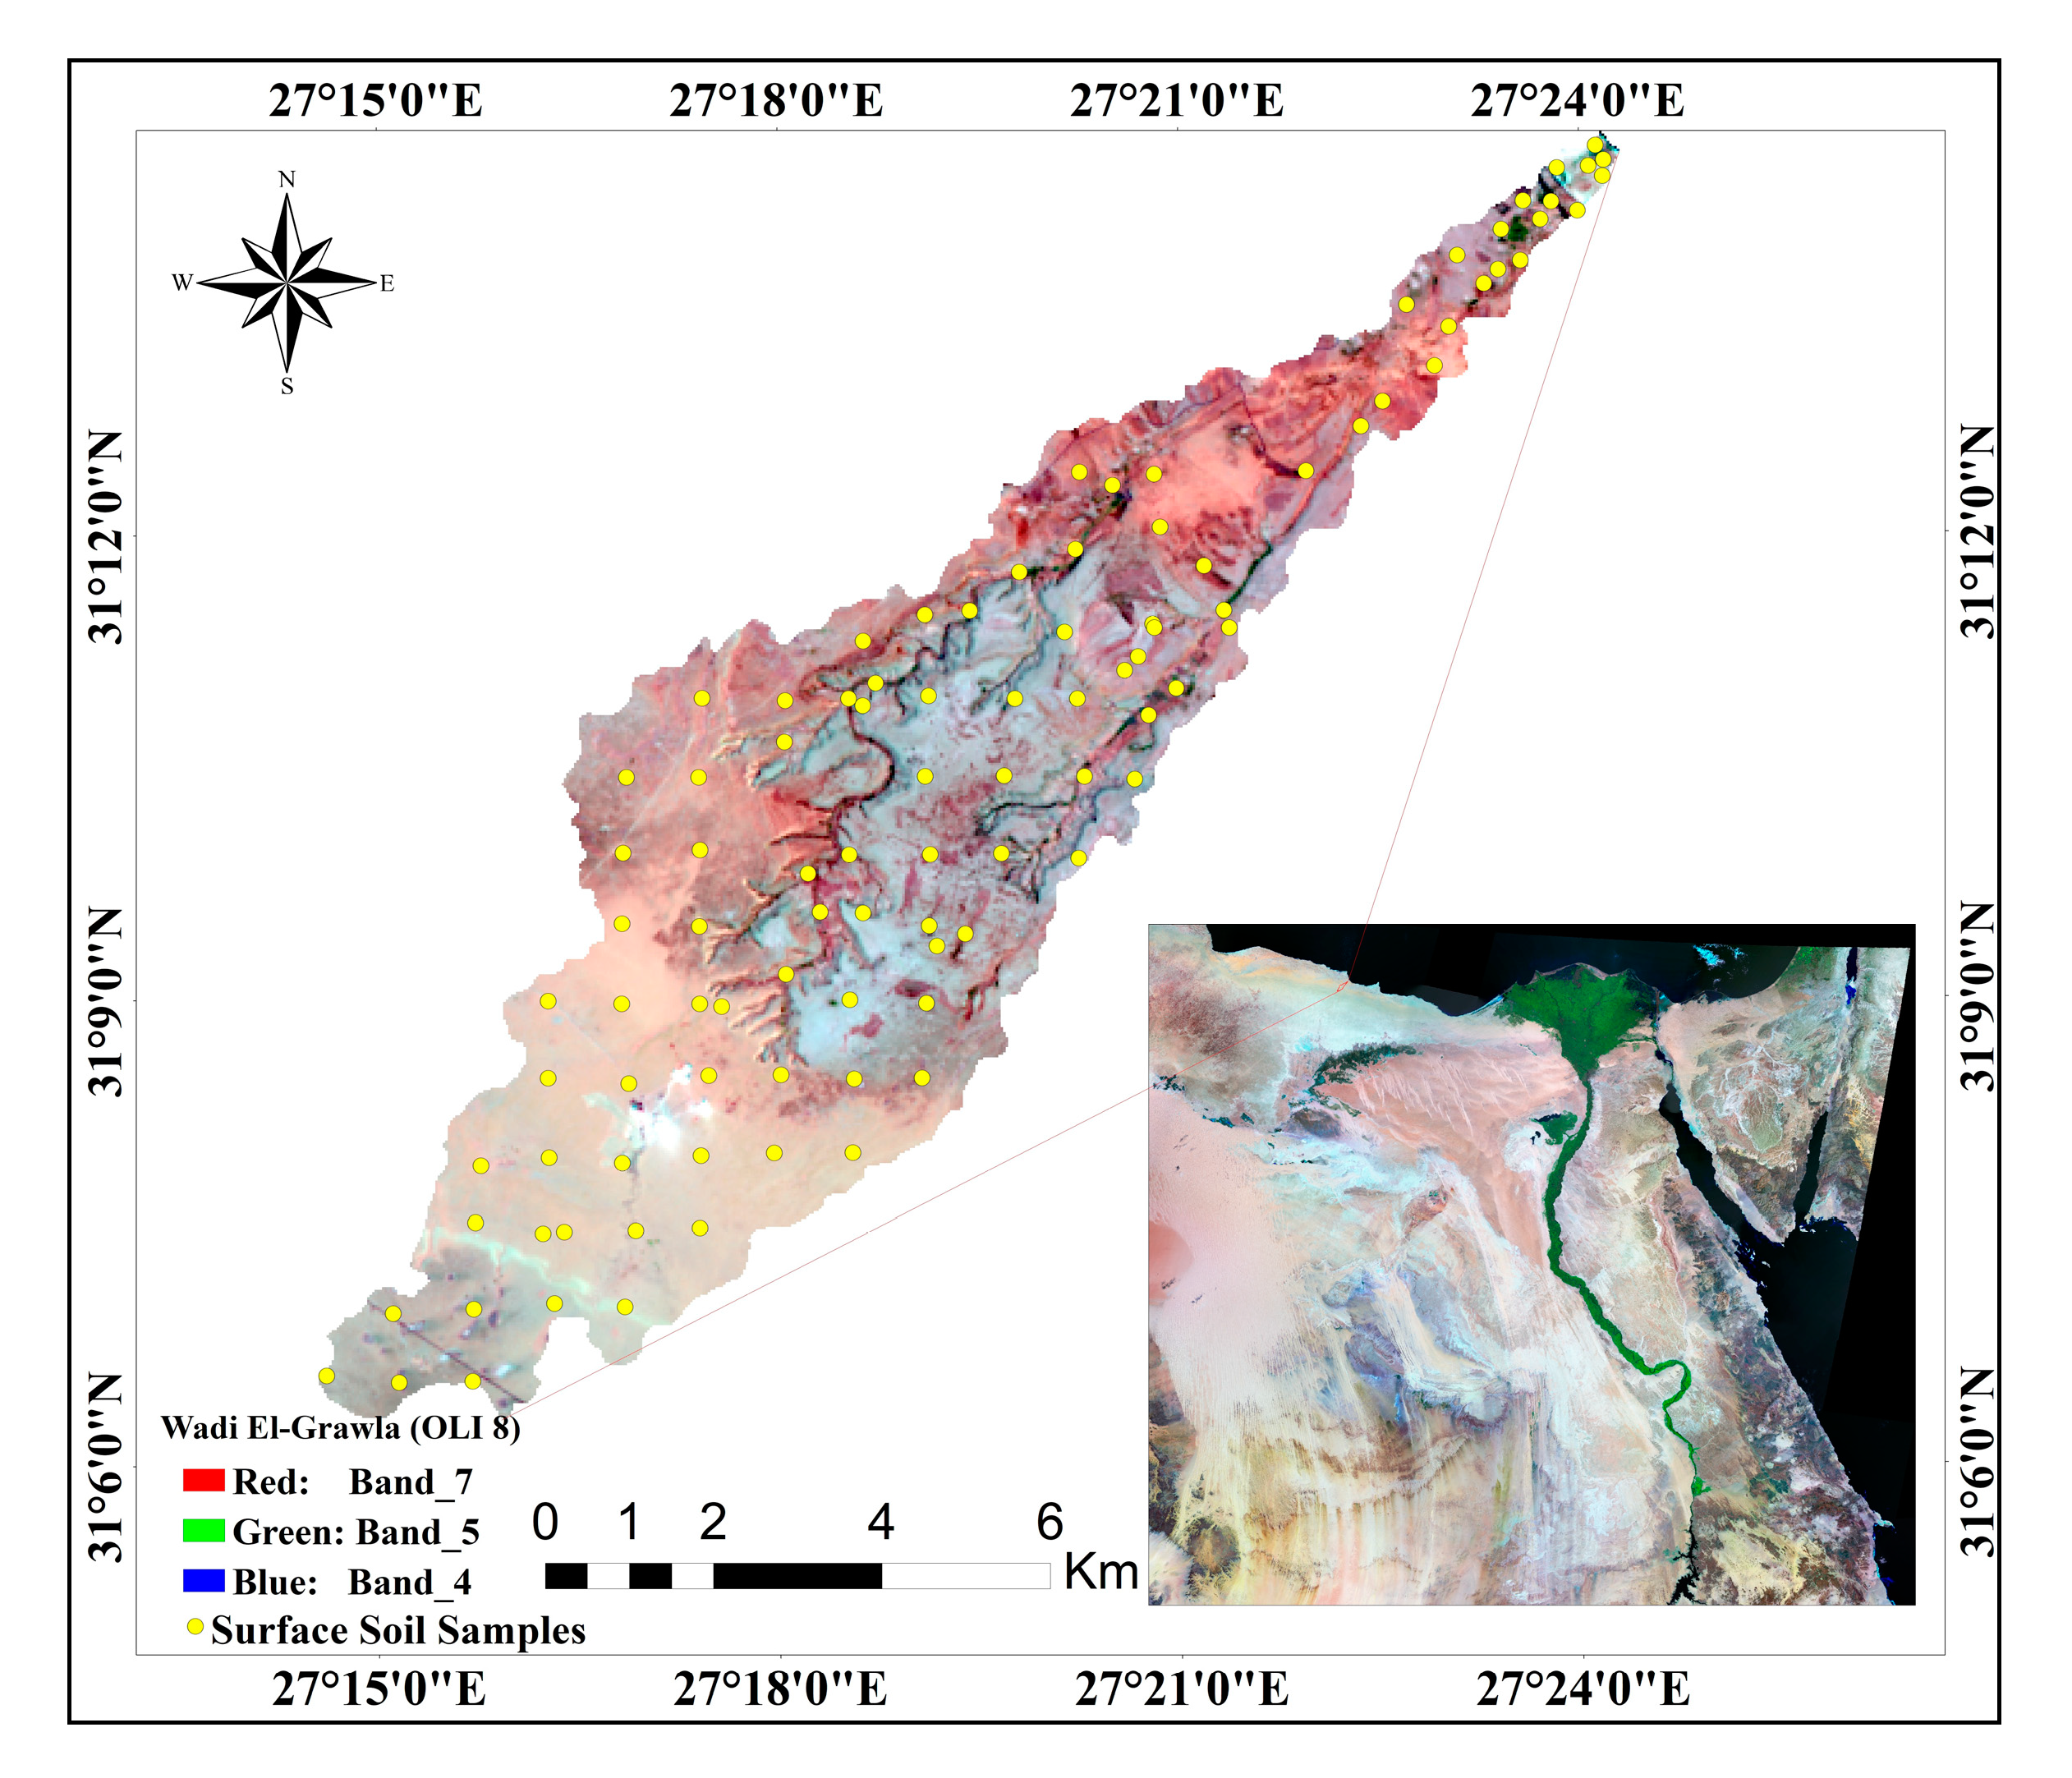
2.1. Experimental Site

The investigated area is located on the northwestern side of the coastal zone in the western desert area of Egypt. Wadi El-Garawla is located about 18 km east of city of Marsa Matruh as shown in Figure 1. The river pours into the Mediterranean Sea and extends approximately 22 km from south to north with varying slope rates [37]. The study area covers approximately 65.02 km2 and lies between longitudes 27°14′30″ and 27°24′30″ E and latitudes 31°3′30″ and 31°16′0″ N. Wadi El-Garawla has many varieties of environmental conditions typical for that region [38,39].
The rainfall in the studied area ranges between 105.0 to 200 mm/y and the average temperature ranges between 8.1 and 18 °C in the winter and 20 and 29.2 °C in the summer.
The study area is characterized by the scarcity of vegetation cover during the summer and autumn seasons. The vegetation begins to increase at the end of winter and spring, when seasonal herbs and plantings grow depending on the winter precipitation [1,30]. The soil temperature regime of the area is thermic and the soil moisture regime is torrid. In addition, the soils were classified in two orders—Entisols and Aridisols—and divided into five subgroups: Typic Calcigypsids, Typic Haplogypsids, Typic Haplocalcids, Typic TorriPsamments, and Lithic Torriorthents [39].

2.2. Soil Sampling and Chemical Analysis

The soil sample sites were determined based on the characteristics and the heterogeneity of the area because surface properties differ from south to north and were acquired on 15th December 2019. The amount of transported sediments is much deeper in the south. One hundred surface soil samples (0–25 cm) were gathered using a random sampling method. All geomorphic units were represented by several soil samples. The collected samples were dried in the laboratory at a normal temperature and then sifted by a 2 mm sieve. The collected soil samples were chemically analyzed in a laboratory where SOM was analyzed based on Walkley and Black and soil acidity (pH) in soil saturated paste by PH meter according to previous methods [40]. The soil’s available N content was measured for each soil sample using conventional chemical analysis via the Kjeldahl method. The available phosphorus content and available potassium content were determined using flame photometry [41].
Table 1 shows the basic statistics of chemical analysis and shows that the soil of the study area is slightly to moderately alkaline with pH values from 6.56 to 8.97. Total soluble salts differed widely from one site to another and had a wide range, as the electrical conductivity of the soil-saturated water (ECe) ranged between 0.11 and 10.53 dS/m. The cation exchange capacity (CEC) also differed from one site to another due to the ratio of the fine fraction and soil organic matter percentage, which ranged between 0.86 and 5.66 cmol/kg. The calcium carbonate percentage of the soils had a wide range, between 2% and 37%. The soil organic matter percentage (SOM%) ranged from almost none (0.04%) to low (1.57%).

2.3. Digital Image Processing

Operational land imager (OLI) Landsat 8 images are characterized by 15 m panchromatic and 30 m multi-spectral spatial resolutions with nine spectral bands. Firstly, two OLI images acquired on 15 December 2019 were downloaded from the U.S. Geological Survey (USGS). In particular, the blue to short-wave infrared portion of the spectrum were used in this study. The thermal bands were excluded, and the images were geo-rectified according to UTM coordinates. All further digital image processing and analyses of the OLI satellite images were executed using the standard approaches provided by the ENVI software. Afterwards, all OLI images were atmospherically corrected using the FLAASH module, and the spatial resolution of the visible/NIR bands was resampled to 15 m depending on the panchromatic band. The data were represented by calibration to spectral radiance and then transformed to surface reflectance [41]. The images were mosaicked by combining multiple images into a single composite image within a dereferenced output mosaic. Finally, all satellite images were corrected and matched with the ground measurements of the study.

2.4. Spectral Measurements of the Soil Samples

Analytical spectral devices (ASDs; ASD-4 field spectroradiometer, Boulder, CO, USA) can record a complete range of 350–2500 nm spectrum of 0.1 s. Therefore, an ASD was used to collect spectra over the visible and near-infrared regions for each soil sample at 1.4–2 nm intervals with a spectral resolution of 3–10 nm. The readings were calibrated using the white reference panel. To avoid any change in radiation conditions, the white reference was checked. An ASD spectroradiometer measures the reflectance, transmission, radiance, and irradiance of an object. The recorded data are usually affected by surrounding factors, such as sources of illumination, scanning time, atmospheric conditions, and the field-of-view of the device. Therefore, a contact probe was used to control for those factors in the laboratory. Spectral data were recorded concerning an external white reference panel. Afterwards, five spectra for each sample were recorded, and the average values for the five spectral readings were calculated. Thus, one value was obtained to express the spectral characteristics of each sample [9,42,43].

2.5. Model Calibration and Validation

The spectral modeling of the soil data was achieved using PLSR, which is considered one of the most common approaches in Vis-NIR chemometrics analysis. This method depends on making the relation between the data matrix X and Y through a linear multivariate model [44]. PLSR algorithm integrates the compression and regression steps and selects successive orthogonal factors that maximize the covariance between predictor and response variables [44]. The advantage of PLS regression is that all available wavebands can be incorporated in the model, while earlier studies indicate that PLS models include redundant wavelengths and selecting specific wavebands can refine PLS analyses [45]. The soil samples were representative of the variation soil types in the Wadi El-Garawla basin. Using a leave-one-out cross validation, the dominant absorption features of each soil variable (N, P, K, pH and OM) were determined using PLSR. One hundred soil samples were randomly divided into a subset of 70 samples used for calibration of a subset of 30 samples for validation. Modeling was performed using the PLSR adopted because it usually provides promising results for Vis-NIR analysis [46,47]. The PLSR models (one for each soil parameter) were evaluated by the coefficient of determination (R2), the root means square error (RMSE), and the mean of response (MR). In addition, R2 was used to describe the model validation, where “x” represents the soil parameter values (N, P, K, pH, and SOM), which was measured using chemical laboratory analyses and used as the reference values for the calibration phase, “y” is the predicted value, and “n” is the number of soil samples used for the calibration [48,49]. MR, RMSE, and root means square standardized error (RMSSE) were calculated according to Equation (2) [50], and NRMSE was applied according to Equation (3) [51].
R M S E =   ( 1 n ) ( p si     o si   ) 2  
where n is the total number of samples, and pi is the vector of predicted values of the variable being predicted, with o i being the observed values.
R M S S E =   [ 1 n i = 1 n ( p si     o si   ) 2 ] 1 2  
where n is the number of observations or samples; o is the osi is the standardized observed value at place i; psi is the standardized predicted/estimated value at place I
N R M S E = R M S E ( δ ( y ) )  
where NRMSE is defined as the normalized root mean square error, RMSE as the root mean square error, and σ   ( y ) as the standard deviation of y, which is used in [51], where it is explained that the standard deviation (sd)-based NRMSE represents the ratio between the variation not explained by the regression vs. the overall variation in y. Thus, if the regression explains all of the variation in y, nothing is unexplained, and the RMSE, and consequently the NRMSE, is zero. If the regression explains some parts and leaves other parts unexplained, which is at a scale similar to the overall variation, then the ratio will be around 1.

2.6. Mapping Soil Properties Using Ordinary Kriging

Ordinary kriging was used to interpolate the predicted soil values obtained from the PLSR model. OK is a geostatistical model that uses a set of statistical tools to predict the value of a given soil property (N, P, K, pH, and SOM) at a location that was not sampled. The normal distribution pattern of the data was checked using the histogram tool and normal QQPlots. The trend analysis was a check for each parameter.
The general equation of the kriging estimator method is as follows [51,52]:
Z ( x o ) = i = 1 N λ i Z ( X i )  
where Z ( x o ) is the estimated variable at the x o location, Z ( x i ) represents the values of an inspected variable at the x i location, λ i is the statistical weight that is offered to the Z ( x i ) sample located near x o , and N is the number of observations in the neighborhood of the inspected point.
The semivariogram of the selected soil parameter was achieved using the average squared differences among all pairs of values according to Equation (4) [52].
γ ( h ) =   1 2 N ( h ) i = 1 N ( h ) [ Z ( x i ) Z ( x i + h ) ] 2
where γ ( h )   is the semivariance for the interval distance classh, N(h) is the number of pairs of the lag interval, Z ( x i ) is the measured sample value at point i, and Z ( x i + h ) is the measured sample value at the position (i + h).
We applied the multiple semi-variogram models (linear plateau, circular, spherical, exponential, exponential, and Gaussian) for each parameter dataset. The validation and suitability of each model was tested via such parameters as the root mean square error (RMSE), the mean standardized error (MSE), and the root mean square standardized error (RMSSE) [50,51,52]. All data processing and analysis for OK were done in the ArcGIS software package, version 10.4.

2.7. Mapping N, P, K, SOM, and pH Using the Landsat 8 OLI

Spectral reflections obtained by the ASD spectroradiometer were used to determine the N, P, K, SOM, and pH values from the OLI images. The average of the spectral reflectance of the ASD was calculated at regions similar to that of the OLI images: blue (0.450–0.515 µm), green (0.525–0.600 µm), red (0.630–0.680 µm), NIR (0.845–0.885 µm), SWIR1 (1.560–1.660 µm), and SWIR2 (2.100–2.300 µm). PLSR was used for relationship modeling between the averaged values from the ASD spectroradiometer and the N, P, K, pH, and SOM values. Consequently, the models were applied to retrieve N, P, K, pH, and SOM values from OLI images. Thirty soil samples were selected to verify the validity of the results. The randomly selected samples included the spatial diversity of the topographic characteristics of the study area, where the element concentrations differed from one location to another, as they are usually related to the surrounding factors. Finally, the resulting maps were validated by comparing the predicted values with the laboratory values using the correlation coefficient (R2) and the root mean square error (RMSE). The stepwise linear regression model was used to conduct a regression analysis between the spectral band calculated from the ASD spectroradiometer and soil laboratory analysis in situ for N, P, K, PH, and SOM.

2.8. Soil Fertility Status of Wadi El-Garawla

Soil fertility status (SFS) represents the nutrient content of soil, the available nitrogen, phosphorus, and potassium, the organic matter content, and the soil reaction (pH) (Figure 2) which indicates the degree of suitability for most crops for specific uses. In this study, we relied on the criteria for crop growth and needs, which were suggested in [28,31]. Five factors were selected in this study for evaluating the fertility degree for most crops, as shown in Table 2. The selected factors were the available N, P, and K, the SOM, and the pH, which were produced based on the spectroscopy techniques using the above methodology. Each factor was reclassified using the Arc GIS spatial model, and its weight was taken according to standard methods. The soil fertility status was evaluated using the GIS spatial model based on the following Equation (6) [31].
[ ( S   ava .   N × S   ava .   P × S   ava   K   × S   OM   × S   pH ) ] ( 1 5 )    
where S is the score factor and ava. N, ava P, ava K, OM, and pH are factors that express, respectively.
Figure 2 shows the steps of mapping different soil nutrients based on the integration of spectral reflectance and satellite images.

3. Results

3.1. Soil Characteristics

Table 3 shows the basic statistical data of the predicted soil analysis (available N, P, and K, as well as the pH and SOM). The maximum values of the N, P, and K, the pH, and the SOM were 60.41, 1.32, 152, 8.97, and 1.05, respectively. On the other hand, the minimum values were 14.04, 0.72, 18, 6.56, and 0.04, and the standard deviations were 8.92, 0.45, 115.6, 0.5, and 0.27, respectively.

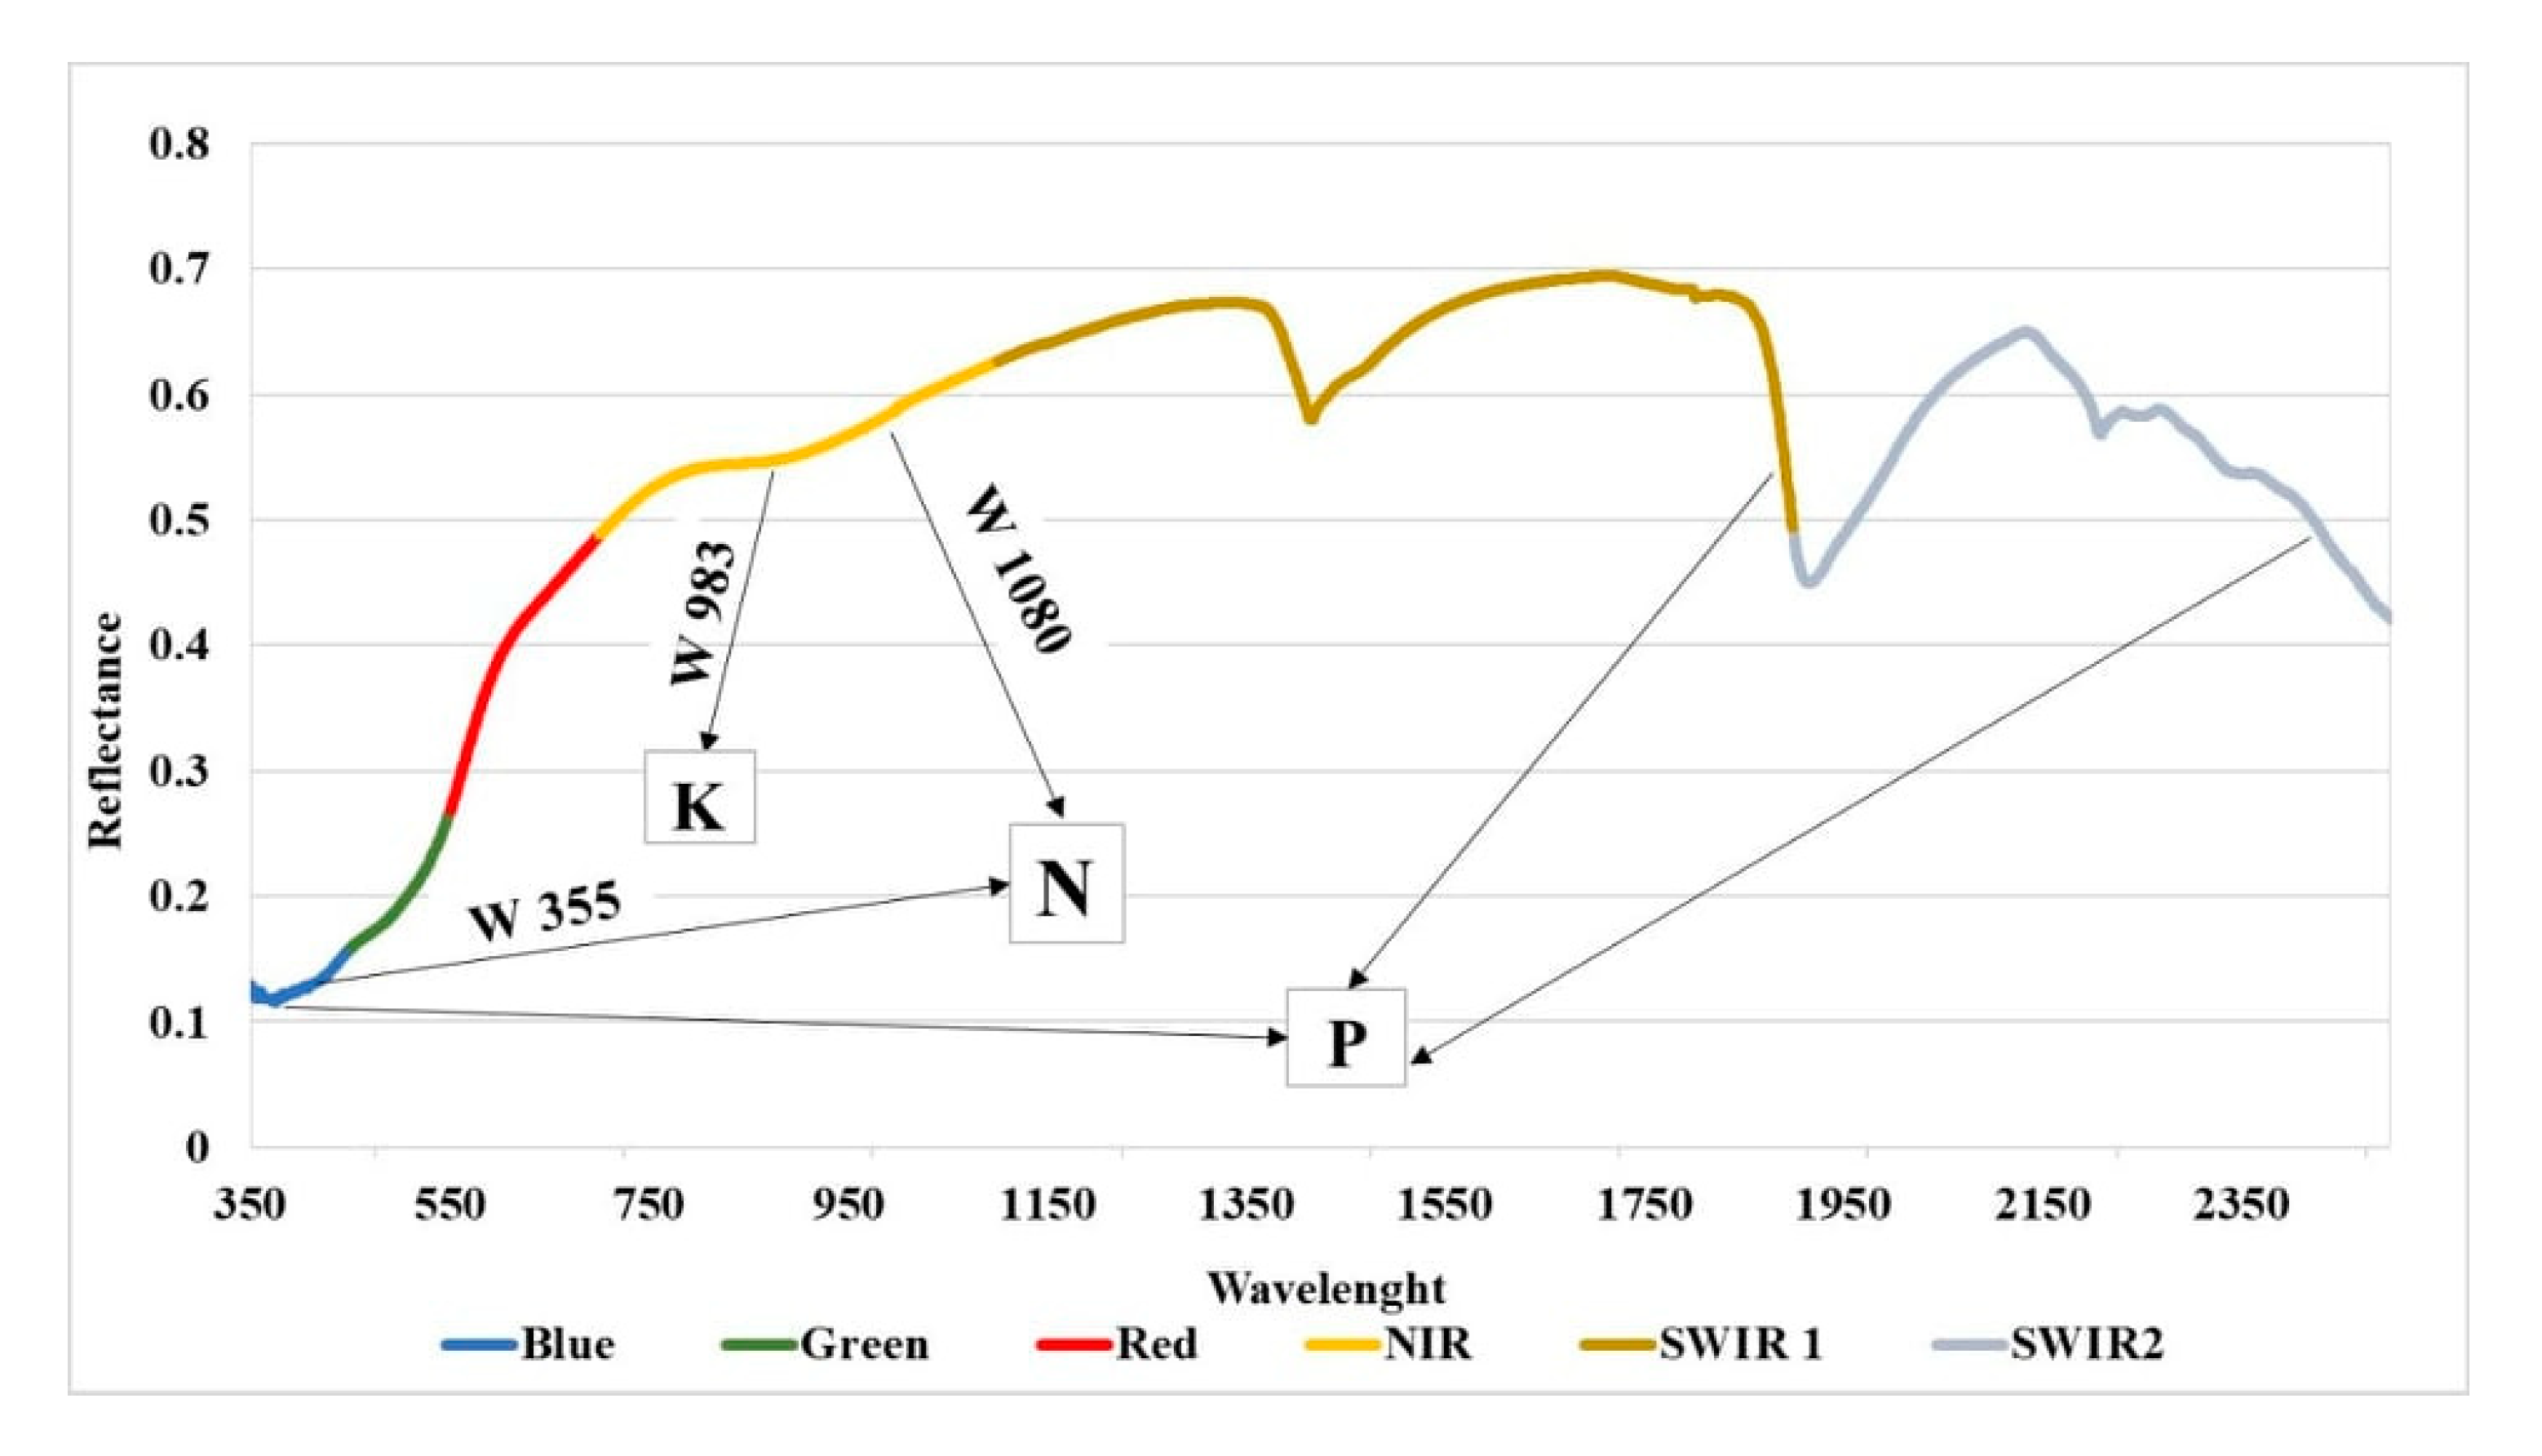
3.2. Spectral Characteristics of Studied Soil

The results showed the variance of the spectral reflections of the soil of the study area. Two dominant absorption features were observed in the ultraviolet and near-infrared wavelength ranges (355 and 1080 nm) in response to the N concentration. The change in the curve of the electromagnetic spectrum was associated with changes in the elements and the chemical composition, as the location of the response changed with K, where the response was in the NIR portion of the spectrum at 983 nm. Furthermore, the concentration of phosphorus affects several parts of the spectrum, in the red, SWIR1, and SWIR2 regions (Figure 3).

3.3. Prediction of N, P, K, pH, and SOM

The quantitative prediction of the N, P, K, pH, and SOM maps was produced using the PLSR models with an accuracy value (R2) calibration of 0.89 (N), 0.72 (P), 0.91 (K), 0.65 (pH), and 0.75 (SOM). These models were successfully validated with 30% of the soil samples. The calibration and validation were evaluated by RMSE, MR, NMRSE, and coefficient of determination, as described in Table 4. The validation of the models provided reasonable results for N, P, K, pH, and SOM R2 validation = 0.87, 0.87, 0.9, 0.69, and 0.84.
Table 5 shows the statistics of the measured and predicted values, including the maximum and minimum values and standard deviation. A variation between the estimated and predicted values was observed, the maximum values of N, P, K, pH, and SOM, and the difference between the measured and predicted values were recognized: they ranged from 60.41 to 56.33 ppm for available N, 1.32–1.81 ppm for available P, 152–151.5 ppm for available K, 8.67–9.79 ppm for pH, and 1.05%–1.23% for SOM. There was also better convergence of the mean values between the measured and predicted values, and the means ranged from 43.1 to 40.2 ppm for available N, 0.96–1.2 ppm for available P, 75.8–76.71 ppm for K, 8.01–8.03 for pH, and 0.39–0.46% for SOM. On the other hand, the minimum values exhibited weak convergence between the measured and predicted values for all factors except pH.

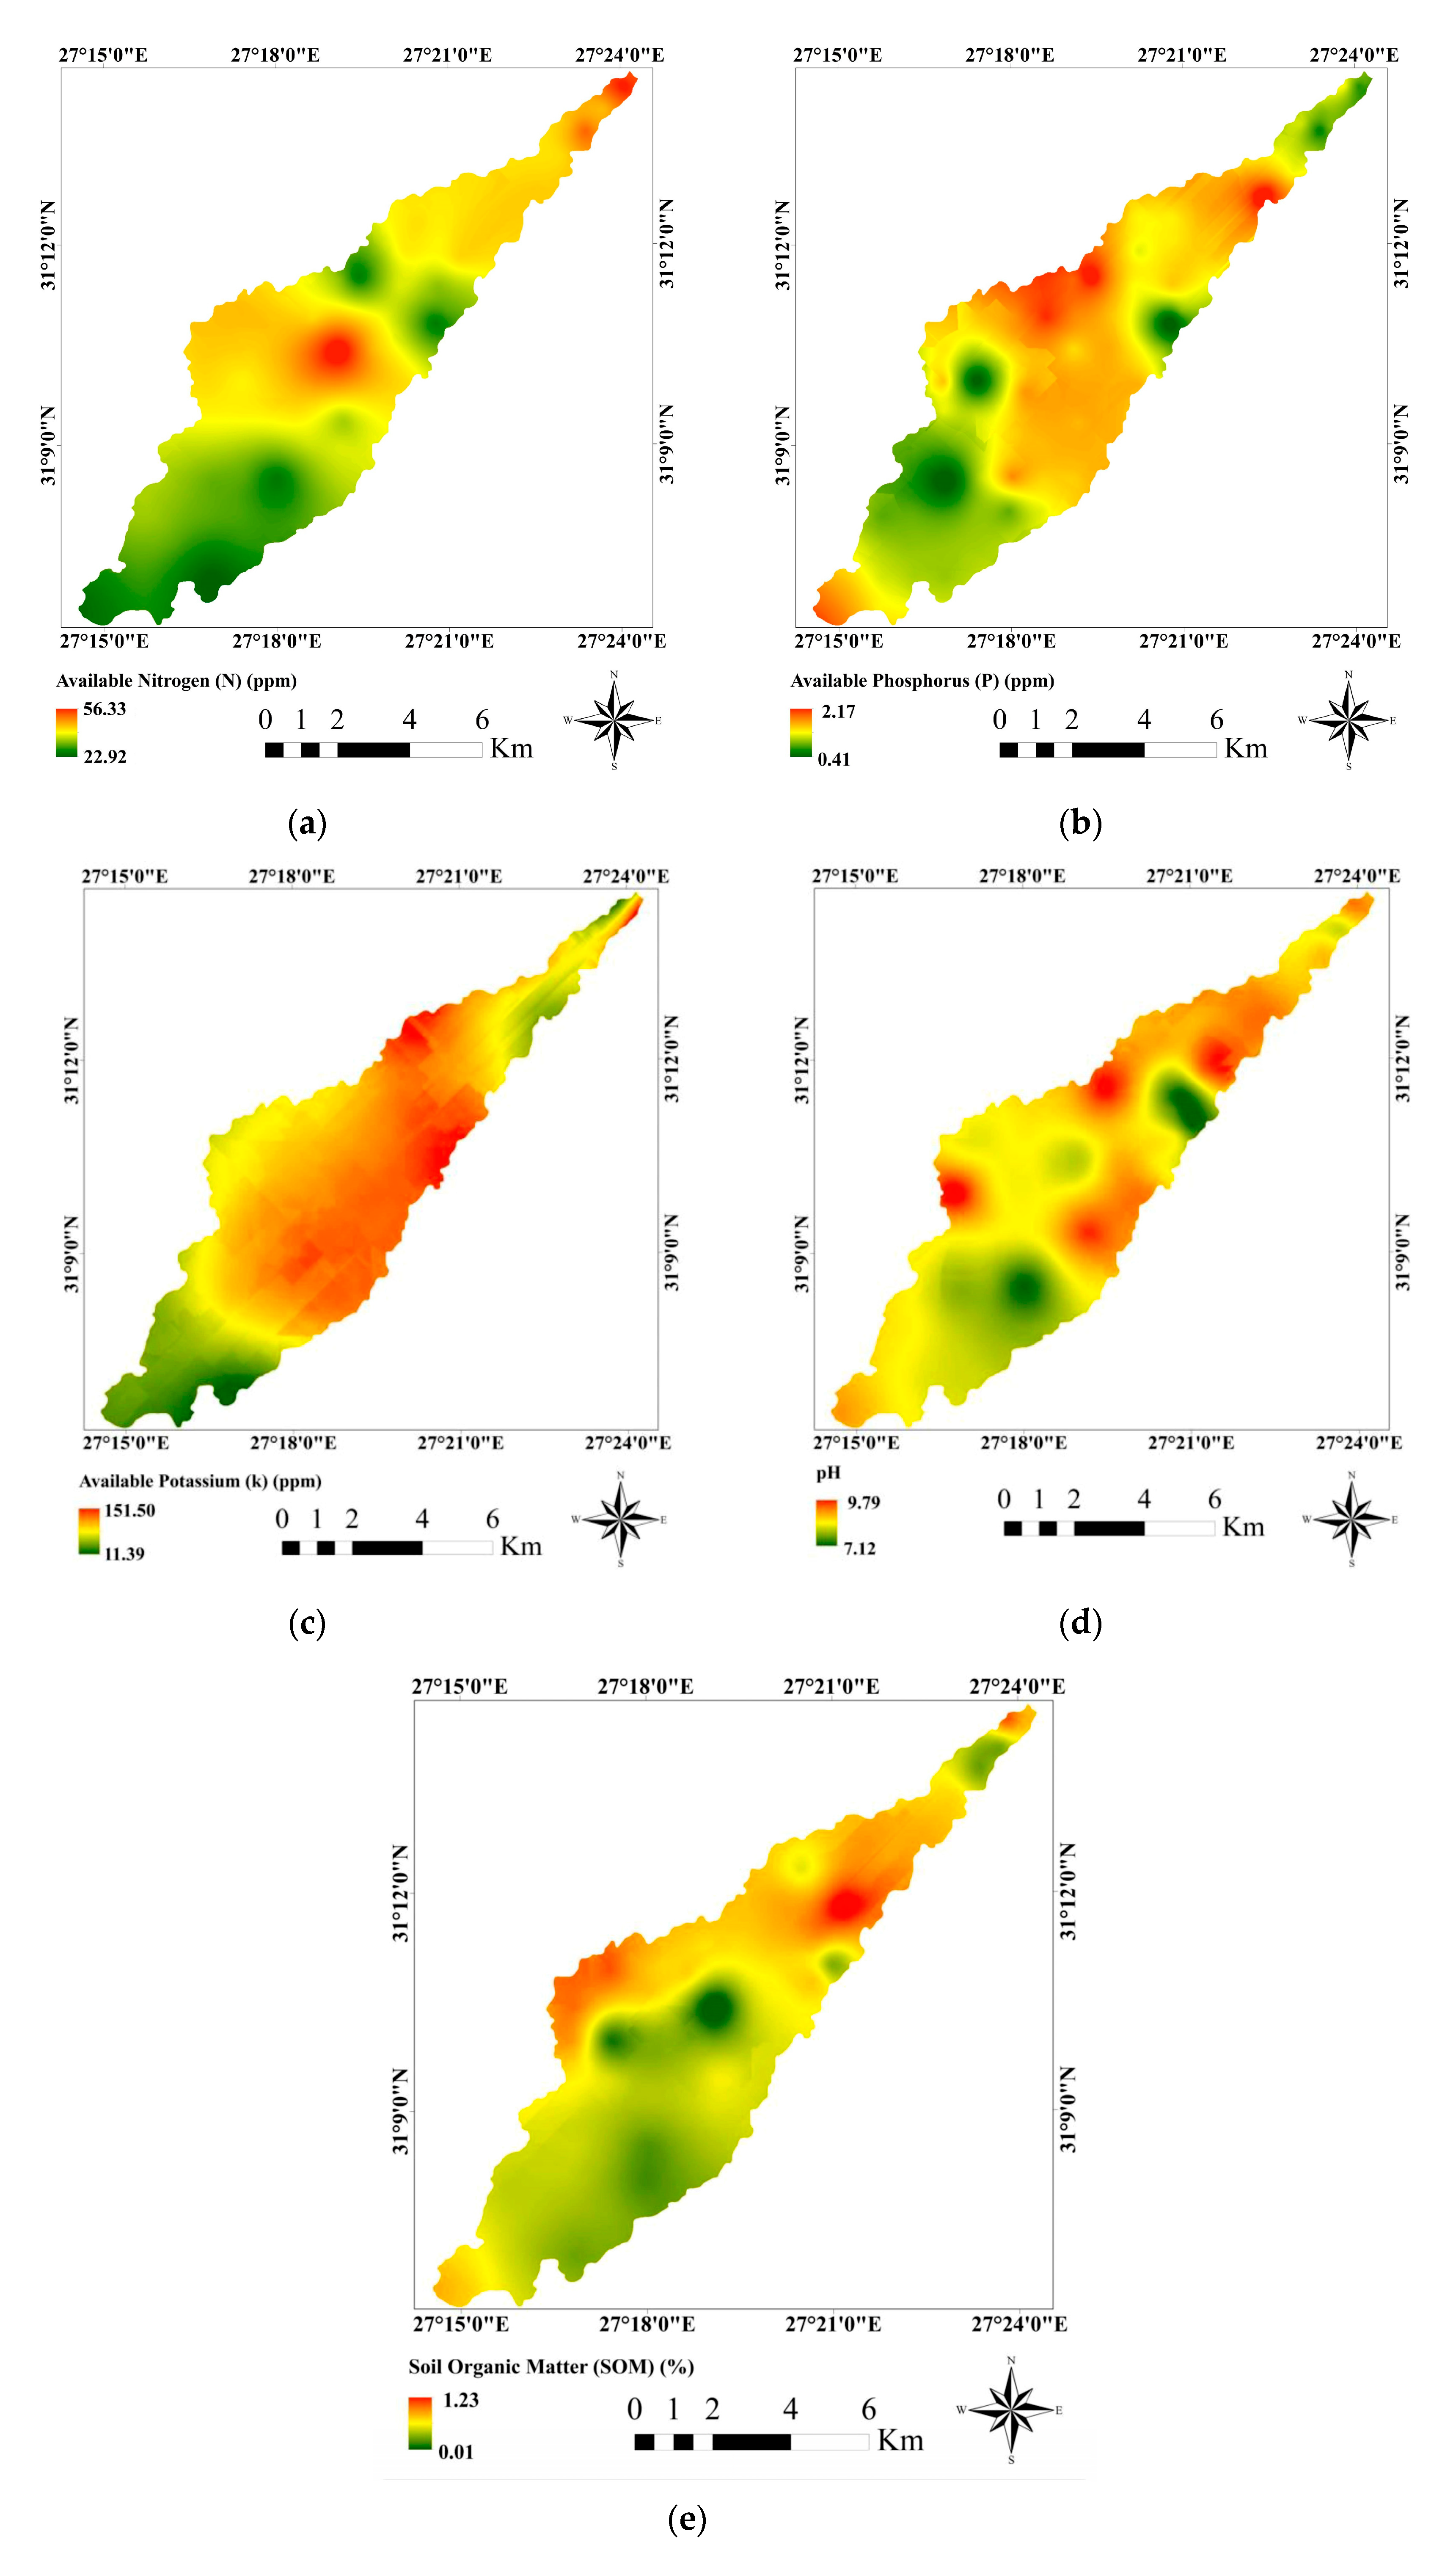
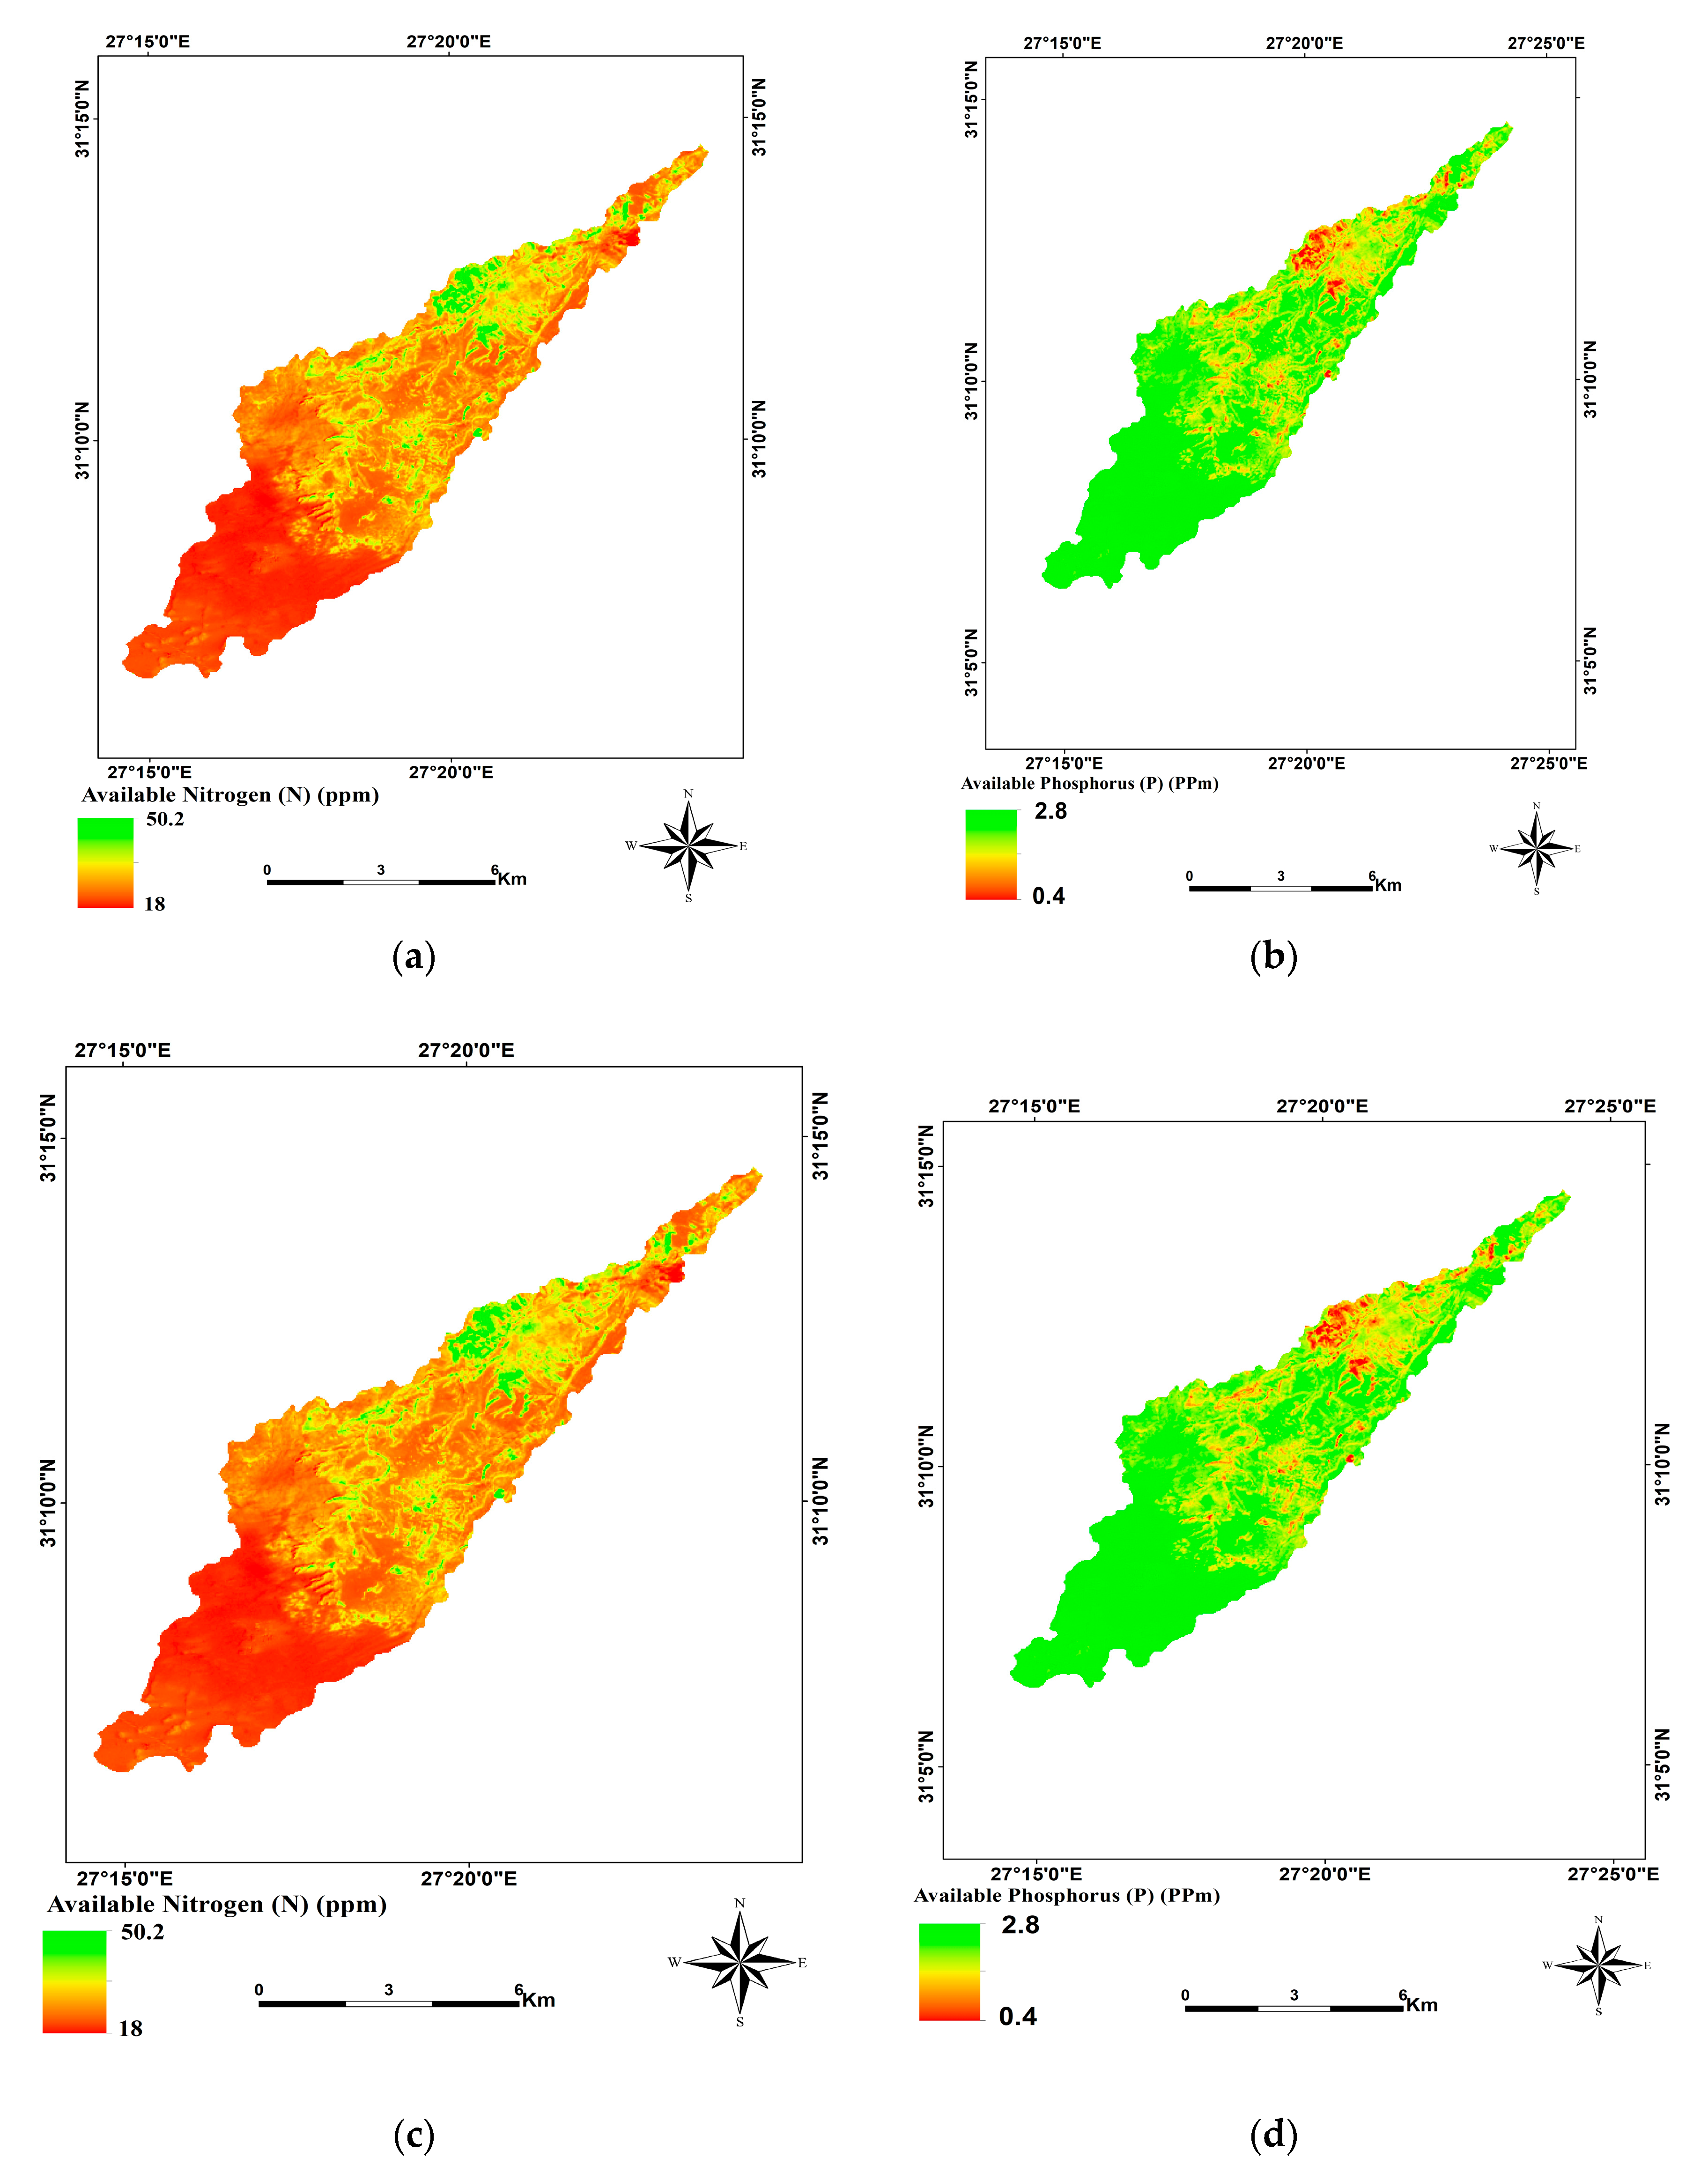
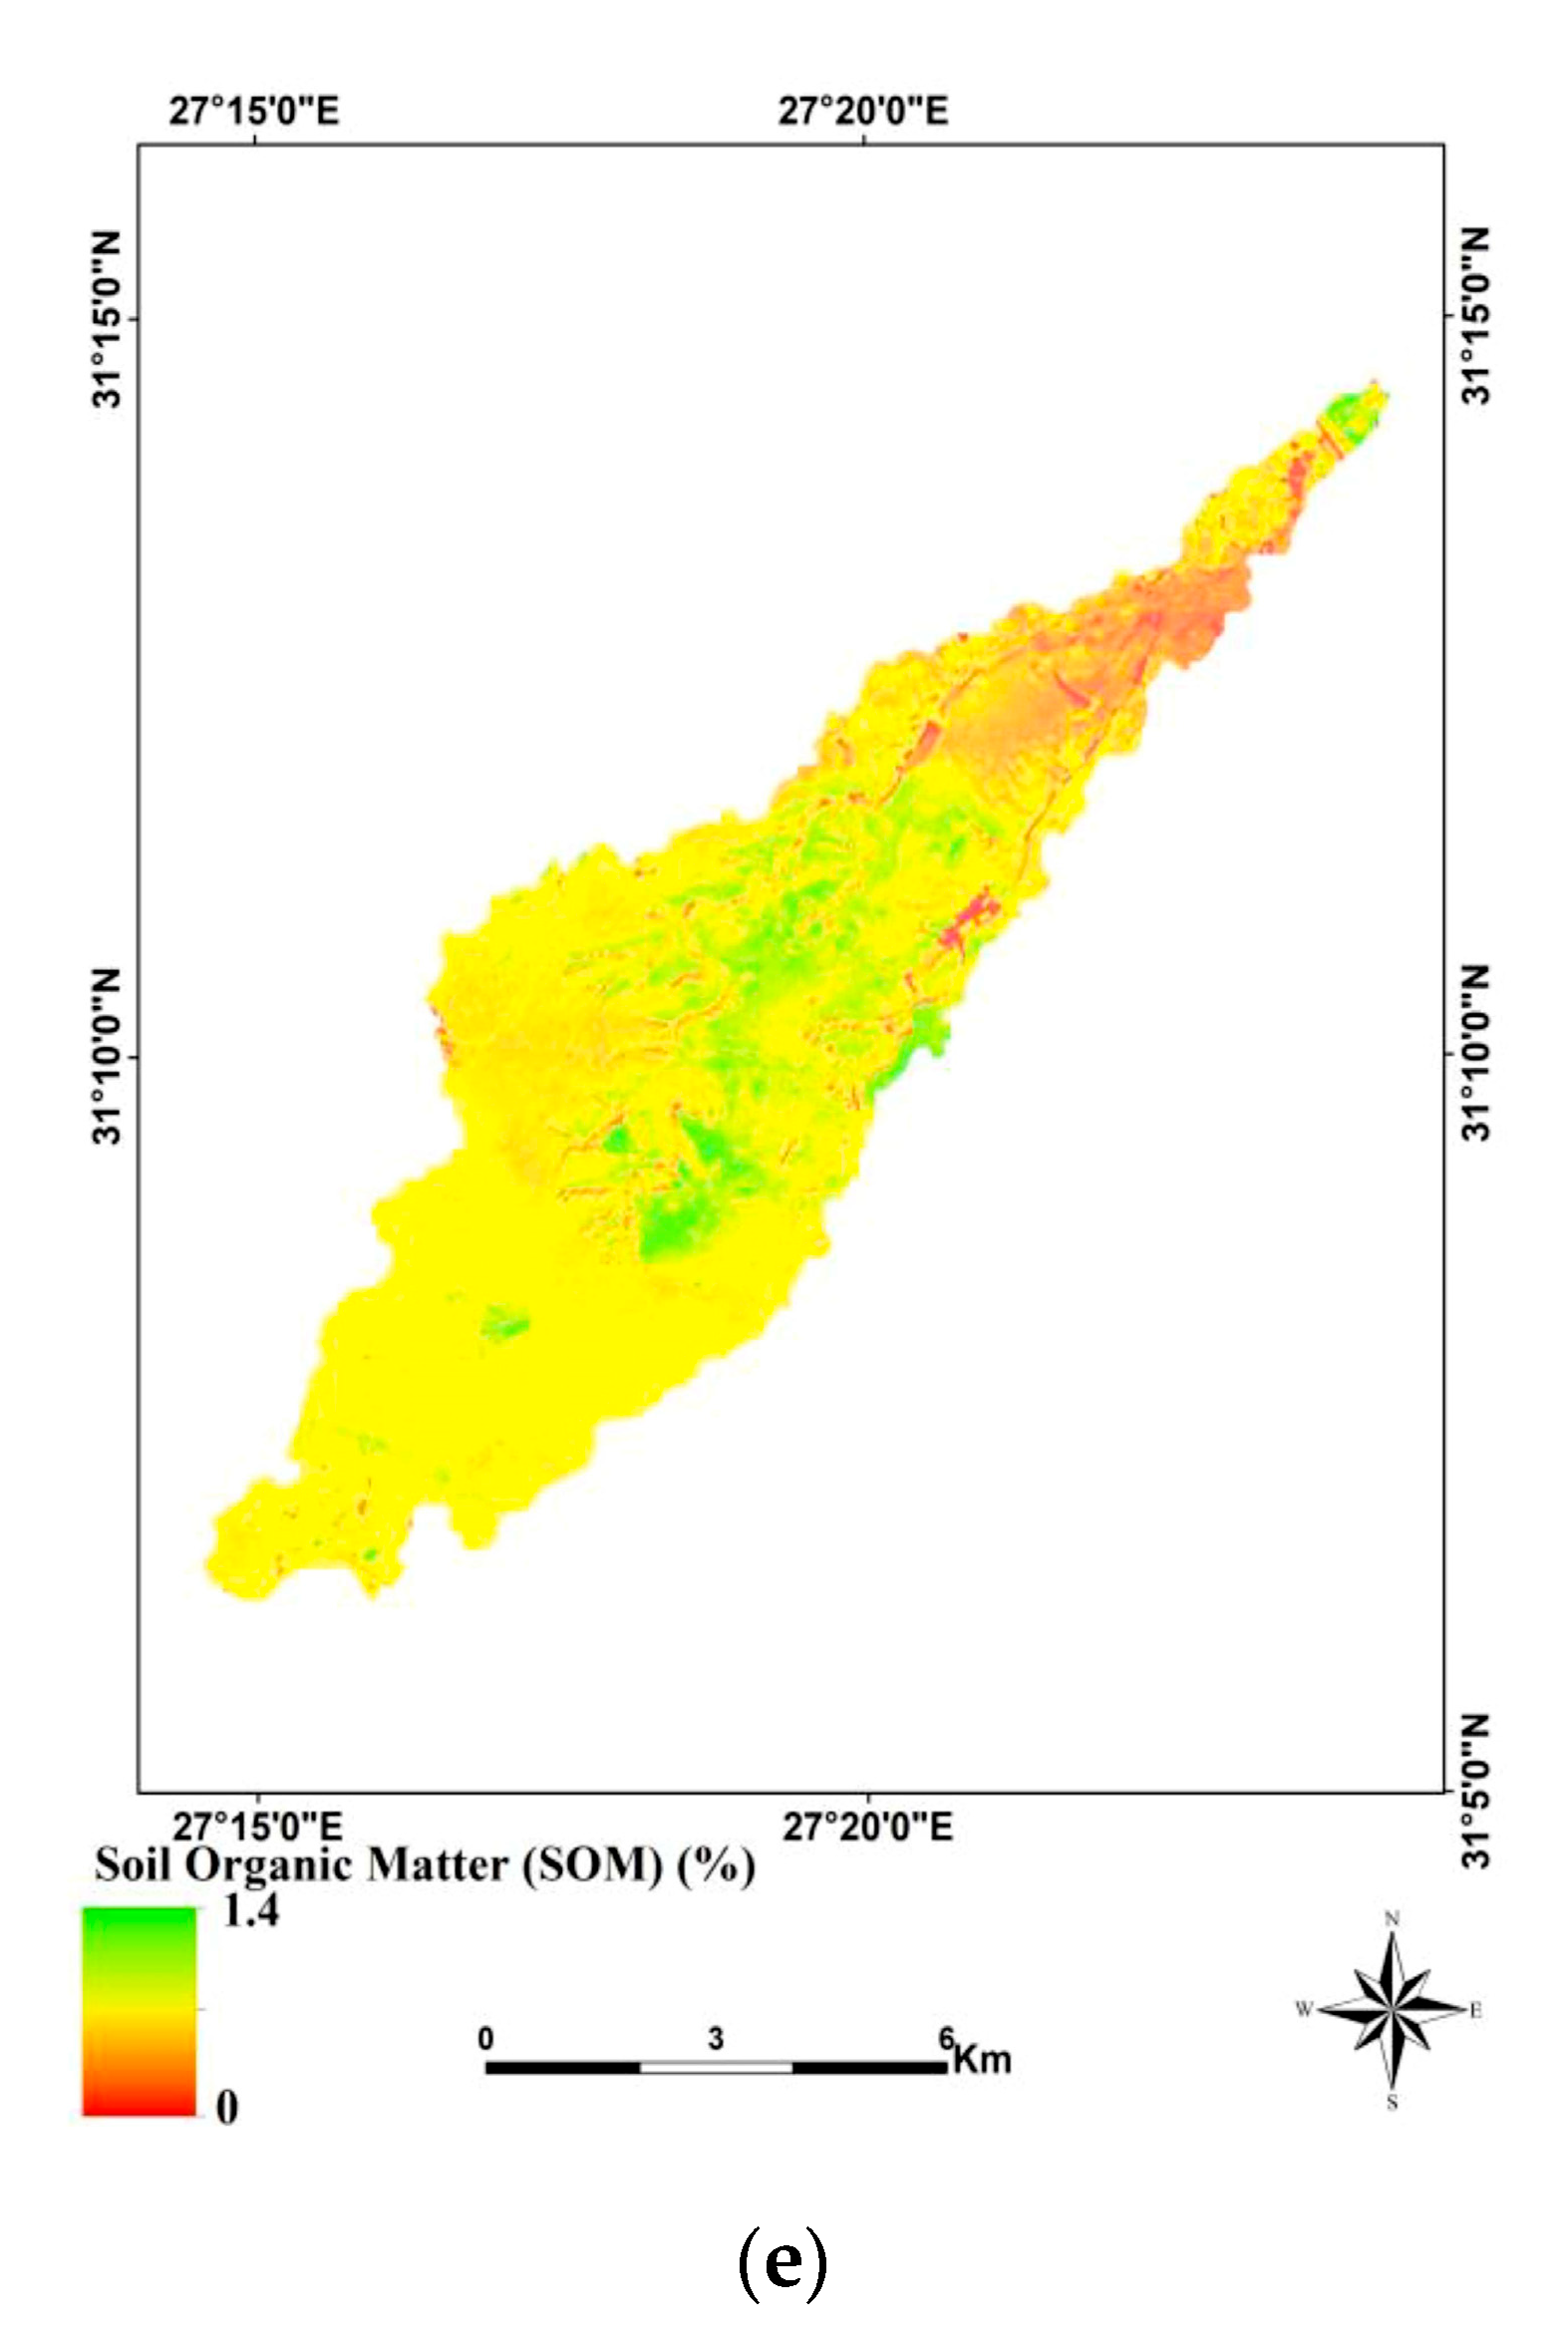
3.4. Mapping of Soil Nutrients of Based on Ordinary Kriging

The mapping of soil nutrient properties was based on retrieving the selected nutrient values based on the spectral fingerprints of each characteristic. The prediction models were applied by previous statistical analysis of N, P, K, pH, and SOM. Thus, OK was used to map the soil nutrients. The performance of ordinary kriging interpolation and the efficiency of the geostatistical model for each soil parameter were checked by such parameters as the RMSE, the MSE, and the RMSSE, as illustrated in Table 6. Results showed that the spherical model was suitable for available N, pH, and SOM, and the Gaussian model was suitable for available P and available K.
Figure 4a–e, respectively, show the spatial distribution of the predicted values of N, P, K, pH, and SOM. The available nitrogen varied from 22.9 to 56.3 ppm. The highest values of nitrogen were located in the north and middle of the study area, where there are agricultural activities. The available phosphorus varied from 0.4 to 2.17 ppm. The available potassium varied from 11.39 to 151.5 ppm. The map of the organic matter showed low SOM content as it varied from 0.01% to 1.23%. The results showed that the predicted pH varied from 7.12 to 9.79 with a mean pH of 8.03. In the current study, the results show that the integration of soil properties gives an acceptable overview of the fertile soil condition distribution.

3.5. Mapping of Soil Nutrients Using Landsat-8 OLI Images

Five equations were obtained, as represented in Equations (6)–(10). The obtained accuracy values for R2 were 0.923 (N), 0.907 (P), 0.957 (K), 0.978 (pH), and 0.952 (SOM). The five models were applied to OLI imagery to retrieve the spatial distribution values of N, P, K, pH, and SOM. The accuracy assessment was achieved by the NRMSE Table 7.
Ava. N = −31.661 + 186.022 × Blue − 364.274 × Green + 421.943 × Red − 308.068 × NIR + 207.957 × SWIR1 − 12.762 × SWIR2
Ava. P = 0.404 − 2.702 × Blue + 22.540 × Green − 14.156 × Red + 3.613 × NIR − 2.648 × SWIR1+ 2.304 × SWIR2
Ava. K = −610.060 − 1424.543 × Red + 933.043 × SWIR2 + 4103.577 × Green − 1733.486 × Blue
pH = 3.983 − 0.544 × Blue − 1.112 × Green + 6.131 × Red + 2.193 × NIR − 1.647 × SWIR1 + 2.739 × SWIR2
SOM = −1.421 − 8.083 × Blue + 17.355 × Green − 5.135 × Red + 2.473 × NIR − 3.275 × SWIR1 + 2.134 × SWIR2
Each of the variable values (N, P, K, pH, and SOM) were obtained as based on the averages of ASD reflectance spectroscopy and compared to the reflections of the satellite image ranges. Figure 5a–e show the spatial distribution of N, P, K, pH, and SOM, where the available N ranges between 18 and 50 ppm, available P between 0.4 and 2.8 ppm, available K between 9 and 156 ppm, soil PH between 7.30 and 8.28, and SOM between 0.02% and 1.4%. The results of the validation models indicate acceptable outputs for all the elements studied, as the R2 was 0.7 ± 3.5, 0.68 ± 0.06, 0.55 ± 4.3, 0.62 ± 0.07, and 0.7 ± 0.02 for N, P, K, pH, and SOM, respectively. Meanwhile, the NRMSE values were 0.39, 0.29, 0.076, 0.22, and 0.18 for N, P, K, pH, and SOM respectively, as shown in Table 7.

3.6. Soil Fertility Status of Wadi El-Garawla

Spatial distribution maps resulting from spectral measurements of soil nutrients were more significant than those produced using satellite imagery. Therefore, fertility status in the study area was evaluated using spectroscopic measurements directly as performed through the spatial modeling of all characteristics. Figure 6 shows the spatial distribution of the status fertility of the study area depending on the integration of available N, P, and K, the SOM, and the pH. Three degrees of soil fertility were recognized in the study area, namely high, moderate, and low. Their respective area of coverage was 1019.136 ha (about 16% of the total study area), 2709.02 ha (43%), and 2536.9 ha (41%).

4. Discussion

The PLSR was herein applied to the reflectance spectra measured in the arid conditions of Wadi El-Garawla (on the northwest coast of Egypt) to model, predict, and map the available N, P, and K, pH, and SOM from in situ analysis, Vis-NEARNEAR spectroscopy, and satellite OLI data. Outputs from our analysis indicated that PLSR is reliable and effective for predicting soil nutrients and characteristics, as already found in other diverse areas in the world [16,21,52]. This confirms that the soil’s available N, P, and K, the pH, and the SOM can be predicted using Vis-NEAR spectroscopy and shortwave infrared (Vis-NIR-SWIR). The variation in the spectral responses of N, P, and K throughout the wavelength range (350–2500) are associated with the diverse behavior of the diverse elements [18,53].
In addition, the absorption at 1400 and 1900 nm is referred to as the overtone bands related to water and hydroxyls [17,44,54]. On the other hand, the responses to pH were observed in three regions: blue, green, and SWIR2 [55]. Furthermore, the responses for SOM were evident in the blue-SWIR1-SWIR2 regions. As a whole, our findings are consistent with the results of a previous study [56,57]. Spectral reflections are influenced by different soil characteristics and the concentrations of different elements [58]. Even if the determination of the parts of the wavelength that respond to dynamic changes in the concentration of elements is a complicated process, the statistical analysis can overcome these problems.
The obtained models to predict the soil content of nitrogen, phosphorus, and potassium indicate an ability to measure the elements with acceptable accuracy, and these outputs are consistent with many scientists [59,60,61]. The PLSR model based on the resampled measured spectra as a result of the calibration models can be effectively used to predict N, P, K, pH and SOM values, as is evident by the coefficient of determination: R2 values were 0.89, 0.72, and 0.91 for N, P, and K and 0.65 and 0.75 for pH and SOM, respectively. The results show the capability of reflectance Vis-NEAR spectroscopy to predict soil pH with a correlation of validation of 0.69, and these findings are consistent with [62,63,64,65]. Furthermore, the validation of the models of SOM was 0.48. Hence, the results of the prediction of the SOM content have become acceptable and are consistent with other researchers studying arid and semi-arid areas [66,67]. The high values of pH in the study area refers to an increase in the carbonate contents, and the parent material was limestone. These calcareous lands are common in the western desert in Egypt and the north of Africa [68,69]. Soil pH is a critical factor because it affects the availability of soil nutrients to plant roots, and because it affects the biological activity in different soil environments and the activity of enzymes [70]. The map of available phosphorus shows that the soil of Wadi El-Garawla has low phosphorus content, which may be due to parent lime material. In addition, the available phosphorus is associated inversely with soil pH values, which is consistent with [69,70,71].
The spatial distribution of SOM in the study area shows that the area, in general, is poor in the proportion of organic matter, less than 0.5% in most of the region. In the northern parts, a relative increase in the percentage of organic matter was observed due to the presence of seasonal crops. Despite the increase of SOM in the north of the area, it was not observed that it had a significant effect on reducing the soil pH in the study area, except for some small areas where a decrease in soil pH with increasing SOM was observed. On the other hand, the results reflect the soil characteristics in Wadi El-Garawla, which strongly vary according to several factors ranging from topographic characteristics, climate conditions, human activities, and soil types [1,72,73]. The accuracy of the spatial distribution maps of soil characteristics using OK show the acceptability degree of the results and their compatibility with other study. The RMSSE values were 1, 0.98, 1.01, 0.99, and 0.97 for N, P, K, pH, and SOM, respectively; this finding agrees with [74]. The RMSSE values were close to one, and the MSE values were close to zero for all parameters. This indicates that OK was appropriate and reliable for predicting the spatial distribution of the studied soil properties.
The study area represents the lands of the northern coast, as it is similar in climatic and topographic conditions and characterized by a low-to-moderate content of available N and P, except in the north where agricultural activities occur, and these results are consistent with those of previous studies [73,75]. The OK map of N, P, and K showed that the predicted values were associated with the SOM content. This large difference in SOM may be due to the variations in topography and climate conditions [76,77].
The integration of Landsat-8 OLI images with spectral measurements provided satisfactory results on the distribution of soil nutrients in Wadi El-Garawla, even though the area is characterized by a low concentration of soil nutrients. These results demonstrate the effectiveness of satellite images (OLI) in predicting different soil properties, and these results are consistent with other independent investigations [18].
The R2 and root mean square error (Table 6) confirmed the expected results of retrieved soil nutrients by satellite images, where the R2 for nitrogen and soil organic matter were around 0.71 and 0.7, respectively. Furthermore, the R2 for phosphorous and soil pH were 0.68 and 0.62, while 0.55 was recorded for available potassium. The accuracy results of OK interpolation were better than the results obtained by satellites, but when using high resolution images satellite imagery, the results may be better than the interpolation method [18]. Wadi El-Garawla is exposed to winter monsoon rains that cause the removal of soil nutrients from the surface layers by the slope effect, where the slope increases from south to north and can cause several environmental hazards, such as drought and desertification [72,73,74,75,76,77,78,79,80].
However, these low values are due to mismanagement of agricultural activities and the location in a semi-dry climate system. The areas that have significantly high fertility as demonstrated by agricultural activity and natural cover, as reflected in the levels of N, P, and K and organic matter. The results showed that most of the area of Wadi El-Garawla is characterized by low-to-moderately fertile soil, except for some scattered areas to the north that are characterized by high fertility. The south of the area is characterized by shallow-to-very-shallow depths and a coarse texture in addition to an undulated surface topography. The fertile soils are characterized by a deep-to-moderate soil profile, with a flat or almost flat and gently undulating surface to the north [39,78,79,80].
Agricultural activities on Egypt’s northwest coast depend on the availability of water, and that depends on monsoon rains during the winter. The results showed that the Saharan areas in Egypt are poor in their fertile content compared with the soil of Nile Delta [81,82,83,84]. This means that the soil of Wadi El-Garawla requires appropriate management that is consistent with the nature of the fertile condition. The types of crops should suit the soil’s characteristics and water availability, as well as the climate of the region.

5. Conclusions

VNIR-SWIR spectroscopy is a very helpful technique for evaluating macronutrients, SOM, and soil pH. The current study was based on the modeling of the relationship between the spectral response and the concentrations of different elements. In detail, the PLSR was herein applied to the reflectance spectra measured in the arid conditions of Wadi El-Garawla (on the northwest coast of Egypt) to model, predict, and map the available N, P, and K, pH, and SOM from in situ analysis, Vis-NEAR spectroscopy, and satellite OLI data. Thirty soil samples were selected to verify the validity of the results. The randomly selected samples included the spatial diversity and characteristics of the study area.
As a whole, results from our investigations pointed out that the red and near-infrared regions are the most sensitive portions of the spectrum to N and K concentrations, while the red, SWIR1, and SWIR2 regions are the most sensitive to phosphorus concentrations. On the other hand, the responses to pH occur in three regions: blue, green, and SWIR2. Furthermore, the responses for SOM occur in the blue, SWIR1, and SWIR2 regions. The results indicated that spectroscopy could efficiently predict the concentrations of different elements, with R2 values of 0.89, 0.72, 0.91, 0.65, and 0.75 for N, P, K, pH, and SOM, respectively. On the other hand, the validation of the models provided reasonable results, where the R2 and RMSE for N, P, K, pH, and SOM were 0.87 ± 0.11, 0.87 ± 0.24, 0.9 ± 0.24, 0.69 ± 0.19, and 0.84 ± 0.12, respectively. Moreover, the use of Landsat-8 OLI images can produce acceptable results on the spatial distribution of soil nutrients, where R2 and RMSE were 0.7 ± 3.5, 0.68 ± 0.06, 0.55 ± 4.3, 0.62 ± 0.07, and 0.7 ± 0.02 for N, P, K, pH, and SOM, respectively. Soil fertility in Wadi El-Garawla was classified into three classes: high, moderate, and low, which respectively represented about 16%, 43%, and 41% of the total space of the study area.
The results show that Wadi El-Garawla is characterized by increasing concentrations of soil nutrients in the northern parts due to the removal of these nutrients by active water erosion from the south to the north as a result of the natural slope. The results illustrated the importance of using Vis-NIR for the quantitative prediction of soil nutrients as well as an alternative to chemical analysis procedures. Wadi El-Garawla is characterized by calcareous soils and has a low availability of nutrients. Therefore, the area requires special management that takes into consideration the spatial distribution of nutrients. Suitable crops that can grow in such soils need to be selected. Moreover, it is necessary to rely on organic additives to improve the soil properties, as it helps to facilitate soil nutrients in the calcareous soil.
The methodological approach herein adopted does provide a “fast,” low-cost tool that can be promptly applied widely to improve food production efficiency and significantly improve soil conservation and preservation. Our effort is also a contribution to supporting the sustainable management of soil and food production, so it provides a reference for the operational use of Earth Observation (EO)-based tools for addressing ecological problems and poverty alleviation, one of the major global goals of the 2030 Agenda for Sustainable Development (SDGs). As a whole, we proposed that the use of EO for efficient monitoring of the soil conditions can be further improved in the future on a multiscale and multi-parameter scale by integrating EO-based information with socioeconomic factors economy, population, etc., thus offering an integrated system that can be operationally adapted to suitably support and improve the efficiency of local government.

Author Contributions

All the authors substantially contributed to this article. E.S.M., A.A.E.B., A.A.B., A.M.A., and E.S.M conceptualized the study and developed the methodology. The satellite imagery was analyzed by A.A.B., E.S.M, A.M.A., and E.S.M. A.A.E.B., E.S.M., A.E., R.L., and T.E.-b. accomplished data analysis and wrote a draft of the manuscript. A.A.B., E.S.M, A.E., and R.L. contributed to reviewing and editing the manuscript. All authors have read and agreed to the published version of the manuscript.

Funding

The authors would like to declare that the funding of the study has been supported by the National Authority for Remote Sensing and Space Science (NARSS), Egypt and Research Group Project no. RGP-VPP-275., King Saud University, Saudi Arabia.

Acknowledgments

The authors would like to thank the National Authority for Remote Sensing and Space Science (NARSS) for funding the field survey and remote sensing work. The authors would like to thank the Soils and Water Department, Faculty of Agricultural, Tanta University, Egypt, for supervising this work and for sample analysis. The authors would like to thank the Italian National Research Council (CNR) at Potenza and 5-100 Project (RUDN University) and Agrarian-Technological Institute of the Peoples’ Friendship University of Russia for supporting the research activities. The authors would like to extend their sincere appreciation to the Deanship of Scientific Research at King Saud University for its funding of this research through the Research Group Project no. RGP-VPP-275.

Conflicts of Interest

The authors would like to hereby certify that there is no conflict of interest in the data collection, the processing of the data, the writing of the manuscript, or the decision to publish the results.

References

  1. Mohamed, E.S.; Abu-Hashim, M.; Belal, A.A.A. Sustainable indicators in arid region: Case study–Egypt. In Sustainability of Agricultural Environment in Egypt; Springer Cham: Basel, Switzerland, 2018; Part I; pp. 273–293. [Google Scholar]
  2. AbdelRahman, M.A.; Shalaby, A.; Mohamed, E.S. Comparison of two soil quality indices using two methods based on geographic information system. Egypt. J. Remote Sens. Space Sci. 2019, 22, 127–136. [Google Scholar] [CrossRef]
  3. Abu-hashim, M.; Elsayed, M.; Belal, A.E. Effect of land-use changes and site variables on surface soil organic carbon pool at Mediterranean Region. J. Afr. Earth Sci. 2016, 114, 78–84. [Google Scholar] [CrossRef]
  4. Hendawy, E.; Belal, A.A.; Mohamed, E.S.; Elfadaly, A.; Murgante, B.; Aldosari, A.A.; Lasaponara, R. The prediction and assessment of the impacts of soil sealing on agricultural land in the North Nile Delta (Egypt) using satellite data and GIS modeling. Sustainability 2019, 11, 4662. [Google Scholar] [CrossRef] [Green Version]
  5. Mohamed, E.S.; Morgun, E.G.; Bothina, S.G. Assessment of soil salinity in the Eastern Nile Delta (Egypt) using geoinformation techniques. Mosc. Univ. Soil Sci. Bull. 2011, 66, 11–14. [Google Scholar] [CrossRef]
  6. Hammam, A.A.; Mohamed, E.S. Mapping soil salinity in the East Nile Delta using several methodological approaches of salinity assessment. Egypt. J. Remote Sens. Space Sci. 2018. [Google Scholar] [CrossRef]
  7. Hassan, A.M.; Belal, A.A.; Hassan, M.A.; Farag, F.M.; Mohamed, E.S. Potential of thermal remote sensing techniques in monitoring waterlogged area based on surface soil moisture retrieval. J. Afr. Earth Sci. 2019, 155, 64–74. [Google Scholar] [CrossRef]
  8. Saleh, A.M.; Belal, A.B.; Mohamed, E.S. Land resources assessment of El-Galaba basin, South Egypt for the potentiality of agriculture expansion using remote sensing and GIS techniques. Egypt. J. Remote Sens. Space Sci. 2015, 18, S19–S30. [Google Scholar] [CrossRef] [Green Version]
  9. Horta, A.; Malone, B.; Stockmann, U.; Minasny, B.; Bishop, T.F.A.; McBratney, A.B.; Pallasser, R.; Pozza, L. Potential of integrated field spectroscopy and spatial analysis for enhanced assessment of soil contamination: A prospective review. Geoderma 2015, 241, 180–209. [Google Scholar] [CrossRef] [Green Version]
  10. Angelopoulou, T.; Tziolas, N.; Balafoutis, A.; Zalidis, G.; Bochtis, D. Remote sensing techniques for soil organic carbon estimation: A review. Remote Sens. 2019, 11, 676. [Google Scholar] [CrossRef] [Green Version]
  11. Chen, F.; Kissel, D.E.; West, L.T.; Adkins, W. Field-scale mapping of surface soil organic carbon using remotely sensed imagery. Soil Sci. Soc. Am. J. 2000, 64, 746–753. [Google Scholar] [CrossRef] [Green Version]
  12. Rossel, R.V.; Adamchuk, V.I.; Sudduth, K.A.; McKenzie, N.J.; Lobsey, C. Proximal soil sensing: An effective approach for soil measurements in space and time. In Advances in Agronomy; Academic Press: Cambridge, MA, USA, 2011; Volume 113, pp. 243–291. [Google Scholar]
  13. Nawar, S.; Buddenbaum, H.; Hill, J.; Kozak, J. Modeling and mapping of soil salinity with reflectance spectroscopy and landsat data using two quantitative methods (PLSR and MARS). Remote Sens. 2014, 6, 10813–10834. [Google Scholar] [CrossRef] [Green Version]
  14. Abd-Elmabod, S.K.; Alice, F.; Zhang, Z.; Ali, R.R.; Jones, L. Rapid urbanisation threatens fertile agricultural land and soil carbon in the Nile delta. J. Environ. Manag. 2019, 252, 109668. [Google Scholar] [CrossRef] [PubMed]
  15. Effat, H.A.; El-Zeiny, A.M. Integration of satellite data and spatial decision models for zoning new urban communities in El-Fayoum Desert. Arab. J. Geosci. 2020, 13, 1–13. [Google Scholar] [CrossRef]
  16. Ben-Dor, E.; Banin, A. Near-infrared analysis as a rapid method to simultaneously evaluate several soil properties. Soil Sci. Soc. Am. J. 1995, 59, 364–372. [Google Scholar] [CrossRef]
  17. Nawar, S.; Buddenbaum, H.; Hill, J. Digital mapping of soil properties using multivariate statistical analysis and ASTER data in an arid region. Remote Sens. 2015, 7, 1181–1205. [Google Scholar] [CrossRef] [Green Version]
  18. Nawar, S.; Mouazen, A.M. On-line Vis-NIR spectroscopy prediction of soil organic carbon using machine learning. Soil Tillage Res. 2019, 190, 120–127. [Google Scholar] [CrossRef]
  19. Mohamed, E.S.; Saleh, A.M.; Belal, A.B.; Gad, A. Application of near-infrared reflectance for quantitative assessment of soil properties. Egypt. J. Remote Sens. Space Sci. 2018, 21, 1–14. [Google Scholar] [CrossRef]
  20. Khayamim, F.; Wetterlind, J.; Khademi, H.; Robertson, A.J.; Cano, A.F.; Stenberg, B. Using visible and near infrared spectroscopy to estimate carbonates and gypsum in soils in arid and subhumid regions of Isfahan, Iran. J. Near Infrared Spectrosc. 2015, 23, 155–165. [Google Scholar] [CrossRef] [Green Version]
  21. Abdul Munnaf, M.; Nawar, S.; Mouazen, A.M. Estimation of Secondary Soil Properties by Fusion of Laboratory and On-Line Measured Vis–NIR Spectra. Remote Sens. 2019, 11, 2819. [Google Scholar] [CrossRef] [Green Version]
  22. Fang, Q.; Hong, H.; Zhao, L.; Kukolich, S.; Yin, K.; Wang, C. Visible and near-infrared reflectance spectroscopy for investigating soil mineralogy: A review. J. Spectrosc. 2018, 2018, 1–14. [Google Scholar] [CrossRef]
  23. Paz-Kagan, T.; Zaady, E.; Salbach, C.; Schmidt, A.; Lausch, A.; Zacharias, S.; Notesco, G.; Ben-Dor, E.; Karnieli, A. Mapping the spectral soil quality index (SSQI) using airborne imaging spectroscopy. Remote Sens. 2015, 7, 15748–15781. [Google Scholar] [CrossRef] [Green Version]
  24. El Nahry, A.H.; Mohamed, E.S. Potentiality of land and water resources in African Sahara: A case study of south Egypt. Environ. Earth Sci. 2011, 63, 1263–1275. [Google Scholar] [CrossRef]
  25. Bayer, A.; Bachmann, M.; Müller, A.; Kaufmann, H. A comparison of feature-based MLR and PLS regression techniques for the prediction of three soil constituents in a degraded South African ecosystem. Appl. Environ. Soil Sci. 2012, 2012, 1–20. [Google Scholar] [CrossRef] [Green Version]
  26. Islam, K.; Singh, B.; McBratney, A. Simultaneous estimation of several soil properties by ultra-violet, visible, and near-infrared reflectance spectroscopy. Soil Res. 2003, 41, 1101–1114. [Google Scholar] [CrossRef]
  27. Rossel, R.V.; Walvoort, D.J.J.; McBratney, A.B.; Janik, L.J.; Skjemstad, J.O. Visible, near infrared, mid infrared or combined diffuse reflectance spectroscopy for simultaneous assessment of various soil properties. Geoderma 2006, 131, 59–75. [Google Scholar] [CrossRef]
  28. Qiao, Y.; Zhang, S. Near-infrared spectroscopy technology for soil nutrients detection based on LS-SVM. In International Conference on Computer and Computing Technologies in Agriculture; Springer: Berlin/Heidelberg, Germany, 2011; pp. 325–335. [Google Scholar]
  29. Rossel, R.V.; McBratney, A.B. Laboratory evaluation of a proximal sensing technique for simultaneous measurement of soil clay and water content. Geoderma 1998, 85, 19–39. [Google Scholar] [CrossRef]
  30. Abd-Elmabod, S.K.; Muñoz-Rojas, M.; Jordán, A.; Anaya-Romero, M.; Phillips, J.D.; Jones, L.; Zhang, Z.; Pereira, P.; Fleskens, L.; Van Der Ploeg, M.; et al. Climate change impacts on agricultural suitability and yield reduction in a Mediterranean region. Geoderma 2020, 374, 114453. [Google Scholar] [CrossRef]
  31. El Baroudy, A.A. Mapping and evaluating land suitability using a GIS-based model. Catena 2016, 140, 96–104. [Google Scholar] [CrossRef]
  32. Barbosa, A.; Marinho, T.; Martin, N.; Hovakimyan, N. Multi-Stream CNN for spatial resource allocation: A crop management application. In Proceedings of the IEEE/CVF Conference on Computer Vision and Pattern Recognition Workshops, Seattle, WA, USA, 16–18 June 2020; pp. 58–59. [Google Scholar]
  33. Preston, W.; Araújo do Nascimento, C.W.; Agra Bezerra da Silva, Y.J.; Silva, D.J.; Alves Ferreira, H. Soil fertility changes in vineyards of a semiarid region in Brazil. J. Soil Sci. Plant Nutr. 2017, 17, 672–685. [Google Scholar] [CrossRef] [Green Version]
  34. Shrivastava, P.; Kumar, R. Soil salinity: A serious environmental issue and plant growth promoting bacteria as one of the tools for its alleviation. Saudi J. Biol. Sci. 2015, 22, 123–131. [Google Scholar] [CrossRef] [Green Version]
  35. Schütz, L.; Gattinger, A.; Meier, M.; Müller, A.; Boller, T.; Mäder, P.; Mathimaran, N. Improving crop yield and nutrient use efficiency via biofertilization—A global meta-analysis. Front. Plant Sci. 2018, 8, 2204. [Google Scholar] [CrossRef] [PubMed] [Green Version]
  36. Khdery, G.; Gad, A.A.; El-Zeiny, A.M. Spectroscopic Characterization of Plant Cover in El-Fayoum Governorate, Egypt. Egypt. J. Soil Sci. 2020. [Google Scholar] [CrossRef]
  37. Bellon-Maurel, V.; Fernandez-Ahumada, E.; Palagos, B.; Roger, J.M.; McBratney, A. Critical review of chemometric indicators commonly used for assessing the quality of the prediction of soil attributes by NIR spectroscopy. TrAC Trends Anal. Chem. 2010, 29, 1073–1081. [Google Scholar] [CrossRef]
  38. Abd-Elmabod, S.K.; Jordán, A.; Fleskens, L.; Phillips, J.D.; Muñoz-Rojas, M.; Van der Ploeg, M.; Anaya-Romero, M.; De la Rosa, D. Modelling agricultural suitability along soil transects under current conditions and improved scenario of soil factors. In Soil Mapping and Process Modeling for Sustainable Land Use Management; Elsevier: Amsterdam, The Netherland, 2017; pp. 193–219. ISBN 9780128052006. [Google Scholar]
  39. Khalifa, M.E.; Beshay, N.F. Soil classification and potentiality assessment for some rainfed areas at West of Matrouh, Northwestern Coast of Egypt. Alex. Sci. Exch. J. Int. Q. J. Sci. Agric. Environ. 2015, 36, 325–341. [Google Scholar]
  40. Soil Survey Staff. Soil survey field and laboratory methods manual. In Soil Survey Investigations Report No. 51, Version 2.0; Burt, R., Staff, S.S., Eds.; U.S. Department of Agriculture, Natural Resources Conservation Service: Washington, DC, USA, 2014. [Google Scholar]
  41. Rukun, L. Analysis Methods of Soil Agricultural Chemistry; Agriculutural Science and Technology Press: Beijing, China, 1999. [Google Scholar]
  42. Wold, S.; Sjöström, M.; Eriksson, L. PLS-regression: A basic tool of chemometrics. Chemom. Intell. Lab. Syst. 2001, 58, 109–130. [Google Scholar] [CrossRef]
  43. Chander, G.; Markham, B.L.; Helder, D.L. Summary of current radiometric calibration coefficients for Landsat MSS, TM, ETM+, and EO-1 ALI sensors. Remote Sens. Environ. 2009, 113, 893–903. [Google Scholar] [CrossRef]
  44. Bilgili, V.; van Es, H.; Akbash, F.; Durak, A.; Hively, W. Visible-Near Infrared Reflectance Spectroscopy for Assessment of Soil Properties in a Semi-Arid Area of Turkey. J. Arid. Environ. 2010, 74, 229–238. [Google Scholar] [CrossRef]
  45. Kawamura, K.; Tsujimoto, Y.; Rabenarivo, M.; Asai, H.; Andriamananjara, A.; Rakotoson, T. Vis-NIR spectroscopy and PLS regression with waveband selection for estimating the total C and N of paddy soils in Madagascar. Remote Sens. 2017, 9, 1081. [Google Scholar] [CrossRef] [Green Version]
  46. Helder, D.; Markham, B.; Morfitt, R.; Storey, J.; Barsi, J.; Gascon, F.; Clerc, S.; LaFrance, B.; Masek, J.; Roy, D.P.; et al. Observations and Recommendations for the Calibration of Landsat 8 OLI and Sentinel 2 MSI for improved data interoperability. Remote Sens. 2018, 10, 1340. [Google Scholar] [CrossRef] [Green Version]
  47. Geladi, P.; Kowalski, B.R. Partial least-squares regression: A tutorial. Anal. Chim. Acta 1986, 185, 1–17. [Google Scholar] [CrossRef]
  48. Dangal, S.R.; Sanderman, J.; Wills, S.; Ramirez-Lopez, L. Accurate and Precise Prediction of Soil Properties from a Large Mid-Infrared Spectral Library. Soil Syst. 2019, 3, 11. [Google Scholar] [CrossRef] [Green Version]
  49. Mohamed, E.; Belal, A.A.; Ali, R.R.; Saleh, A.; Hendawy, E.A. Land degradation. In The Soils of Egypt; Springer: Basel, Switzerland, 2019; pp. 159–174. [Google Scholar]
  50. Yang, Y.; Zhu, J.; Tong, X.; Wang, D. The spatial pattern characteristics of soil nutrients at the field scale. In International Conference on Computer and Computing Technologies in Agriculture; Springer: Boston, MA, USA, 2008; pp. 125–134. [Google Scholar]
  51. Otto, S.A.; Kadin, M.; Casini, M.; Torres, M.A.; Blenckner, T. A quantitative framework for selecting and validating food web indicators. Ecol. Indic. 2018, 84, 619–631. [Google Scholar] [CrossRef]
  52. Biswas, A.; Si, B.C. Model averaging for semivariogram model parameters. Adv. Agrophys. Res. 2013, 4, 81–96. [Google Scholar]
  53. El-Alfy, M.A.; Hasballah, A.F.; El-Hamid, H.T.A.; El-Zeiny, A.M. Toxicity assessment of heavy metals and organochlorine pesticides in freshwater and marine environments, Rosetta area, Egypt using multiple approaches. Sustain. Environ. Res. 2019, 29, 19. [Google Scholar] [CrossRef] [Green Version]
  54. Mohamed, E.S.; Belal, A.; Shalaby, A. Impacts of soil sealing on potential agriculture in Egypt using remote sensing and GIS techniques. Eurasian Soil Sci. 2015, 48, 1159–1169. [Google Scholar] [CrossRef]
  55. He, Y.; Huang, M.; García, A.; Hernández, A.; Song, H. Prediction of soil macronutrients content using near-infrared spectroscopy. Comput. Electron. Agric. 2007, 58, 144–153. [Google Scholar] [CrossRef]
  56. Mohamed, E.S.; Ali, A.M.; El Shirbeny, M.A.; El Razek, A.A.A.; Savin, I.Y. Near infrared spectroscopy techniques for soil contamination assessment in the Nile Delta. Eurasian Soil Sci. 2016, 49, 632–639. [Google Scholar] [CrossRef]
  57. Tekin, Y.; Tumsavas, Z.; Mouazen, A.M. Effect of moisture content on prediction of organic carbon and pH using visible and near-infrared spectroscopy. Soil Sci. Soc. Am. J. 2012, 76, 188–198. [Google Scholar] [CrossRef]
  58. Zhang, Z.; Yu, D.; Shi, X.; Warner, E.; Ren, H.; Sun, W.; Tan, M.; Wang, H. Application of categorical information in the spatial prediction of soil organic carbon in the red soil area of China. Soil Sci. Plant Nutr. 2010, 56, 307–318. [Google Scholar] [CrossRef]
  59. Mohamed, E.S.; Ali, A.; El-Shirbeny, M.; Abutaleb, K.; Shaddad, S.M. Mapping soil moisture and their correlation with crop pattern using remotely sensed data in arid region. Egypt. J. Remote Sens. Space Sci. 2019. [Google Scholar] [CrossRef]
  60. Zhai, Y.; Cui, L.; Zhou, X.; Gao, Y.; Fei, T.; Gao, W. Estimation of nitrogen, phosphorus, and potassium contents in the leaves of different plants using laboratory-based visible and near-infrared reflectance spectroscopy: Comparison of partial least-square regression and support vector machine regression methods. Int. J. Remote Sens. 2012, 34, 2502–2518. [Google Scholar]
  61. Mohamed, E.S.; Schütt, B.; Belal, A. Assessment of environmental hazards in the north western coast-Egypt using RS and GIS. Egypt. J. Remote Sens. Space Sci. 2013, 16, 219–229. [Google Scholar] [CrossRef] [Green Version]
  62. Stenberg, B.; Rossel, R.A.V.; Mouazen, A.M.; Wetterlind, J. Visible and near infrared spectroscopy in soil science. In Advances in Agronomy; Academic Press: Cambridge, MA, USA, 2010; Volume 107, pp. 163–215. [Google Scholar]
  63. Recena, R.; Fernández-Cabanás, V.M.; Delgado, A. Soil fertility assessment by Vis-NIR spectroscopy: Predicting soil functioning rather than availability indices. Geoderma 2019, 337, 368–374. [Google Scholar] [CrossRef]
  64. Dick, W.A.; Cheng, L.; Wang, P. Soil acid and alkaline phosphatase activity as pH adjustment indicators. Soil Biol. Biochem. 2000, 32, 1915–1919. [Google Scholar] [CrossRef]
  65. Tumsavas, Z. Possibility of determining soil pH using visible and near-infrared (Vis-NIR) spectrophotometry. Environ. Biol. 2017, 38, 1095–1100. [Google Scholar] [CrossRef]
  66. Vohland, M.; Ludwig, M.; Harbich, M.; Emmerling, C.; Thiele-Bruhn, S. Using variable selection and wavelets to exploit the full potential of visible–near infrared spectra for predicting soil properties. J. Near Infrared Spectrosc. 2016, 24, 255–269. [Google Scholar] [CrossRef]
  67. Al-Shujairy, Q.T.A.; Ali, N.S. Prediction of soil available phosphorous content using spectra-radiometer and gis in southern of Iraq. Iraqi J. Agric. Sci. 2017, 48, 171–177. [Google Scholar]
  68. Reeves, J.B.; McCarty, G.W. Quantitative analysis of agricultural soils using near infrared reflectance spectroscopy and a fibre-optic probe. J. Near Infrared Spectrosc. 2001, 9, 25–34. [Google Scholar] [CrossRef]
  69. El-Aziz, S.H.A. Evaluation of land suitability for main irrigated crops in the North-Western Region of Libya. Eurasian J. Soil Sci. 2018, 7, 73–86. [Google Scholar] [CrossRef]
  70. Ostovari, Y.; Ghorbani-Dashtaki, S.; Bahrami, H.A.; Abbasi, M.; Dematte, J.A.M.; Arthur, E.; Panagos, P. Towards prediction of soil erodibility, SOM and CaCO3 using laboratory Vis-NIR spectra: A case study in a semi-arid region of Iran. Geoderma 2018, 314, 102–112. [Google Scholar] [CrossRef]
  71. Yu, X.; Liu, Q.; Wang, Y.; Liu, X.; Liu, X. Evaluation of MLSR and PLSR for estimating soil element contents using visible/near-infrared spectroscopy in apple orchards on the Jiaodong peninsula. Catena 2016, 137, 340–349. [Google Scholar] [CrossRef]
  72. AbdelRahman, M.A.; Natarajan, A.; Hegde, R.; Prakash, S.S. Assessment of land degradation using comprehensive geostatistical approach and remote sensing data in GIS-model builder. Egypt. J. Remote Sens. Space Sci. 2019, 22, 323–334. [Google Scholar] [CrossRef]
  73. Belal, A.A.; Mohamed, E.S.; Abu-hashim, M.S.D. Land Evaluation Based on GIS-Spatial Multi-Criteria Evaluation (SMCE) for Agricultural Development in Dry Wadi, Eastern Desert, Egypt. Int. J. Soil Sci. 2015, 10, 100–116. [Google Scholar] [CrossRef]
  74. Aldabaa, A.; Yousif, I.A.H. Geostatistical approach for land suitability assessment of some desert soils. Egypt. J. Soil Sci. 2020, 60, 195–205. [Google Scholar] [CrossRef]
  75. Zaurov, D.E.; Perdomo, P.; Raskin, I. Optimizing soil fertility and pH to maximize cadmium removed by Indian mustard from contaminated soils. J. Plant Nutr. 1999, 22, 977–986. [Google Scholar] [CrossRef]
  76. Hopkins, B.; Ellsworth, J. Phosphorus availability with alkaline/calcareous soil. In Proceedings of the Western Nutrient Management Conference, Reno, NV, USA, 7–8 March 2005; Volume 6, pp. 88–93. [Google Scholar]
  77. Clark, R.N.; King, T.V.; Klejwa, M.; Swayze, G.A.; Vergo, N. High spectral resolution reflectance spectroscopy of minerals. J. Geophys. Res. Space Phys. 1990, 95, 12653–12680. [Google Scholar] [CrossRef] [Green Version]
  78. Abdel-Kader, F.H. Digital soil mapping at pilot sites in the northwest coast of Egypt: A multinomial logistic regression approach. Egypt. J. Remote Sens. Space Sci. 2011, 14, 29–40. [Google Scholar] [CrossRef] [Green Version]
  79. Mirzaee, S.; Ghorbani-Dashtaki, S.; Mohammadi, J.; Asadi, H.; Asadzadeh, F. Spatial variability of soil organic matter using remote sensing data. Catena 2016, 145, 118–127. [Google Scholar] [CrossRef]
  80. Said, M.E.S.; Ali, A.; Borin, M.; Abd-Elmabod, S.K.; Aldosari, A.A.; Khalil, M.; Abdel-Fattah, M.K. On the Use of Multivariate Analysis and Land Evaluation for Potential Agricultural Development of the Northwestern Coast of Egypt. Agronomy 2020, 10, 1318. [Google Scholar] [CrossRef]
  81. Barseem, M.; El Tamamy, A.; Masoud, M. Hydrogeophyical evaluation of water occurrences in El Negila area, Northwestern coastal zone–Egypt. J. Appl. Sci. Res. 2013, 9, 3244–3262. [Google Scholar]
  82. Abdel-Fattah, M.K.; Abd-Elmabod, S.K.; Aldosari, A.A.; Elrys, A.S.; Mohamed, E.S. Multivariate Analysis for Assessing Irrigation Water Quality: A Case Study of the Bahr Mouise Canal, Eastern Nile Delta. Water 2020, 12, 2537. [Google Scholar] [CrossRef]
  83. Mohamed, E.S. Spatial assessment of desertification in north Sinai using modified MEDLAUS model. Arab. J. Geosci. 2013, 6, 4647–4659. [Google Scholar] [CrossRef]
  84. Mohamed, E.S.; Abdellatif, M.A.; Abd-Elmabod, S.K.; Khalil, M.M. Estimation of surface runoff using NRCS curve number in some areas in northwest coast, Egypt. In Proceedings of the E3S Web of Conferences, Barcelona, Spain, 10–12 February 2020; EDP Sciences. Volume 167, p. 02002. [Google Scholar]
Figure 1. Location of the study area of Wadi El-Garawla and the soil samples as mapped in Landsat 8 satellite imagery (RGB 7, 5, 4).
Remotesensing 12 03716 g001
Figure 2. The flowchart methodology of soil nutrient status at Wadi El-Garawla.
Remotesensing 12 03716 g002
Figure 3. The spectral responses places of soil nutrients (N, P, K), each color refers to the portion of wavelength (blue, green, red, near-infrared (NIR), SWIR1, and SWIR2).
Remotesensing 12 03716 g003
Figure 4. Spatial distribution of predicted soil properties (a); predicted available nitrogen (N); (b) predicted phosphorus (P); (c) predicted available potassium (K); (d) predicted pH; (e) predicted soil organic matter (SOM) (%).
Remotesensing 12 03716 g004
Figure 5. Spatial distribution of predicted soil properties using OLI satellite images: (a) nitrogen (N); (b) phosphorus (P); (c) potassium (K); (d) pH; and (e) SOM.
Remotesensing 12 03716 g005aRemotesensing 12 03716 g005b
Figure 6. Spatial distribution of soil fertility in Wadi between high, moderate, and low values.
Remotesensing 12 03716 g006
Table 1. Basic statistics of chemical analysis of the study area.
Sand%Silt%Clay%CaCO3%pHECe (dS/m)CEC (cmol/kg)SOM%
min92.140.022.2726.560.110.860.04
max96.852.916.26378.9710.535.661.57
mean94.371.314.3219.58.015.322.230.38
Table 2. Criteria of soil fertility and their factor score.
Diagnostic FactorUnit10.80.50.2
Nmg/kg>8080–4040–20<20
Pmg/kg>1515–1010–5<5
Kmg/kg>400400–200200–100<100
SOMg/100 g>21–20.5–1<0.5
pH-5.5–77–7.87.9–8.5>8.5
Table 3. Statistical parameters of soil properties (N, P, K, pH, and soil organic matter (SOM)).
Ava. N ppmAva. P ppmAva. K ppmpHSOM%
Min14.040.72186.560.04
Max60.412.431528.971.57
Mean37.231.58858.010.38
Standard deviation8.920.45115.60.50.27
Table 4. Statistical parameters of soil properties (N, P, K, pH, and SOM).
PropertiesR2 CalibrationAdj. R2RMSEMRNRMSENRMSE (%)R2 ValidationSpectral Range
Ava. N0.890.860.111.010.011.290.87Blue–NIR
Ava. P0.720.70.241.120.6968.570.87Blue–SWIR1–SWIR2
Ava. K0.910.90.242.040.010.560.9NIR
pH0.650.610.198.020.2726.760.69Blue–Green–SWIR2
SOM0.75 0.730.120.410.4444.44 0.84Blue–SWIR1–SWIR2
Table 5. Measured and predicted values of N, P, K, pH, and SOM.
Ava. N (ppm)Ava. P (ppm)Ava. K (ppm)pHSOM%
Measu.Pred.Measu.Pred.Measu.Pred.Measu.Pred.Measu.Pred.
Min14.0422.920.720.441811.396.567.120.040.01
Max60.4156.331.321.81152151.58.979.791.571.23
Mean43.140.20.961.2075.876.718.018.030.380.46
Standard deviation9.38.50.160.3541.7430.70.710.270.27
Table 6. Geostatistical analyses and semi-varogram parameters.
Soil PropertiesModel TypeMeanRoot Mean Square (Rmse)Mean Standardized (Mse)Root-Mean-Square Standardized (Rmsse)Average Standard Error
Ava. NSpherical0.1338.640.05118.56
Ava. PGaussian−0.0020.38−0.0070.980.38
Ava. KGaussian0.1427.50.0041.0127.19
pHSpherical0.0090.440.010.990.44
SOMSpherical−0.0050.22−0.0190.970.23
Table 7. Model validation of retrieved N, P, K, pH, and SOM from operational land imager (OLI) images.
PropertiesRMSENRMSER2
Ava. N (ppm)3.50.390.71
Ava. P (ppm)0.060.290.68
Ava. K (ppm)4.30.0760.55
pH0.070.220.62
Ava. SOM (%)0.020.180.7
Publisher’s Note: MDPI stays neutral with regard to jurisdictional claims in published maps and institutional affiliations.

