Article

Spatial and Temporal Changes in Surface Water Area of Sri Lanka over a 30-Year Period

1
Key Laboratory of Digital Earth Science, Aerospace Information Research Institute, Chinese Academy of Sciences, Beijing 100094, China
2
University of Chinese Academy of Sciences, Beijing 100049, China
3
Department of Science and Technology, Faculty of Applied Sciences, Uva Wellassa University, Badulla 90000, Sri Lanka
4
School of Earth and Space Sciences, Peking University, Beijing 100871, China
*
Author to whom correspondence should be addressed.
Remote Sens. 2020, 12(22), 3701; https://doi.org/10.3390/rs12223701
Submission received: 19 August 2020 / Revised: 6 November 2020 / Accepted: 9 November 2020 / Published: 11 November 2020

Abstract

:
Sri Lanka contains a large number of natural and man-made water bodies, which play an essential role in irrigation and domestic use. The island has recently been identified as a global hotspot of climate change extremes. However, the extent, spatial distribution, and the impact of climate and anthropogenic activities on these water bodies have remained unknown. We investigated the distribution, spatial and temporal changes, and the impacts of climatic and anthropogenic drivers on water dynamics in Dry, Intermediate, and Wet zones of the island. We used Landsat 5 and Landsat 8 images to generate per-pixel seasonal and annual water occurrence frequency maps for the period of 1988–2019. The results of the study demonstrated high inter- and intra-annual variations in water with a rapid increase. Further, results showed strong zonal differences in water dynamics, with most dramatic variations in the Dry zone. Our results revealed that 1607.73 km2 of the land area of the island is covered by water bodies, among this 882.01 km2 (54.86%) is permanent and 725.72 km2 (45.14%) is seasonal water area. Total inland seasonal water increased with a dramatic annual growth rate of 7.06 ± 1.97 km2 compared to that of permanent water (4.47 ± 2.08 km2/year). Sri Lanka has the highest permanent water area during December–February (1045.97 km2), and drops to the lowest in May–September (761.92 km2) when the seasonal water (846.46 km2) is higher than permanent water. The surface water area was positively related to both precipitation and Gross Domestic Product, while negatively related to the temperature. Findings of our study provide important insights into possible spatiotemporal changes in surface water availability in Sri Lanka under certain climate change and anthropogenic activities.

1. Introduction

The surface water area of Earth is continuously varying with time [1]. These variations are mostly related to climate change processes as well as anthropogenic reasons [2]. Understanding the spatial distribution and inundation variability of surface water is essential for a wide range of applications and requisite for water resource managers, policymakers, and climate change scientists. More precise and frequent temporal information on water area and its dynamics are vital in water scarce regions as fluctuations can cause drought or flooding [3].
Sri Lanka comprises a large number of natural and man-made water bodies. However, vast spatial and temporal variability of water and low storage capacity resulted in competing demands over limited water bodies [4,5,6], despite receiving annual average precipitation from 900 to 5000 mm [7]. Besides, it continuously witnesses the challenges of climate change with frequent and more intense precipitation extremes, regular floods, and droughts [8,9]. Recently, Climate Risk Index list for 2019 ranked the island as the global second [10].
Spatiotemporal distribution and variation of surface water in Sri Lanka are mainly influenced by both climate (i.e., precipitation and temperature) [11,12,13] and anthropogenic activities, including irrigation and domestic water supply [6,14,15]. Recent studies have emphasized the necessity of detailed spatial and temporal information, by documented the heterogeneity in climate change impacts [16,17] and water scarcity [18,19] across Sri Lanka. So far, the spatial distribution of permanent and seasonal water, inter- and intra-annual variability, and impact of drivers have remained unknown in Sri Lanka. Furthermore, the extent and variation of inland surface water of the country are not well quantified. Improved quantification of historical and current surface water trends will help us to understand the impacts of such changes better and also to protect water resource related anthropogenic activities and ecosystem services. Thus, explicit knowledge of such information is essential for future water resource management.
Remote sensing practices in water monitoring has advanced with an increased amount of cost free high resolution data, such as Landsat satellites. Thus, this data is widely used to map surface water bodies for historical and real-time analysis. Thematic Mapper (TM), Enhanced Thematic Mapper Plus (ETM+), and Operational Land Imager (OLI) sensors onboard Landsat are particularly appropriate for generating time-series information for assessing water resources. Landsat accounts for the world’s most extended space-based land observation since the launch of Landsat 5 in 1984. Landsat scenes are well suitable spatial, spectral, and radiometric potentials to observe water and have been successfully used for mapping and monitoring surface water and its changes at global [1,20] and regional scales [21,22,23,24].
Intensified climate variations can severely affect surface water and cause strong seasonal dynamics in surface water [3]. Several water bodies have experienced both seasonal and interannual variations over the years [20,25,26,27,28]. Previous studies have assessed multidecadal changes of water area either by using one or a few Landsat scenes per year [29] or standalone years [30]. Several other studies have been evaluated using Landsat images either by cumulating annually [31,32] or seasonally [1,3,33]. The selection process of the appropriate time in a year or period of years to represent water is challenging due to the uncertainties in both seasonal and interannual variability of water, the driving factors, and cloud free observation availability. Therefore, it is crucial to utilize all the available imageries. Studies have also used entire data archive based on "per pixel frequency" due to the high variation of water in seasonally or interannually in the recent past [1,20,33,34]. This method is very suitable, particularly for the regions with sparse cloud free data. An accurate evaluation of the entire time-series is needed for actual water dynamics. Therefore, a more comprehensive spatiotemporal dynamic is possible via various space and time scales, such as small terrestrial regions, years, seasons, or months.
This study aimed to fill the aforementioned knowledge gap by evaluating the extent, spatial distribution, inter- and intra-annual variations of inland surface water across Sri Lanka in order to understand the effects of driving factors over it from 1988 to 2019. Surface water time-series maps, annual and the entire period frequency maps were built from all the available TM and OLI imageries at the pixel level. Then, we analyzed the spatial distribution, variations, and multidecadal trends in detail. The relationship between water area variability with precipitation, temperature and agricultural Gross Domestic Product (GDP) was investigated. We demonstrated the seasonal variations of surface water using two major Dry zone reservoirs: Senanayake Samudra (65.85 km2), which is the largest reservoir in Sri Lanka, and Padaviya (20.74 km2).

2. Materials and Methods

2.1. Study Area

Sri Lanka is a tropical island (between 5°55′N and 9°51′N latitude and 79°41′E and 81°53′E longitude) with 65,610 km2 land area. Above two-thirds of the total land area lies in the low flat plain of below 300 m and altitude decreases gradually from the south-central mountains. The island has 103 rivers and a large number of man-made water bodies, which include 309 irrigation reservoirs, and a further about 18,000 minor reservoirs (Figure 1).
The climate of the country is spatially and temporally varied. Thus, the unpredictable rainfall patterns significantly influence the spatiotemporal variation of water availability within the country. It has four climatic rainfall seasons as follows: (1) the north-east monsoon (DJF) season covers the months from December to February, (2) the first inter monsoon season (MA) includes March and April, (3) the south-west monsoon (MJJAS) season is the period from May to September, and (4) the second inter monsoon (ON) season is from October to November [7]. The annual average precipitation varies from 900 mm at the lowlands to over 5000 mm over central highland. The annual average temperature varies from 18 to 27.5 °C over central highland and lowlands, respectively [7].
Based on the spatial variation of annual and seasonal precipitations, soil type and major land use category, Sri Lanka has been broadly divided into three climate zones: Dry, Intermediate, and Wet. The Dry zone experiences severe water shortages during most of the year. For over 2000 years, minor irrigational reservoirs had been constructed to store water that is used for the dry season. At present, about 18,000 minor reservoirs exist in the Dry zone. Still, frequent water scarcity is faced during the dry season due to low storage capacity and unpredictable precipitation variation, where water resources are already stressed [18,19]. Senanayake Samudra reservoir (65.85 km2) is the largest reservoir in Sri Lanka, which is located in the Dry zone in the southeast part of Sri Lanka. This reservoir is located in a wildlife sanctuary with diverse ecosystems [35]. Padaviya reservoir (20.74 km2) is situated in the Northeastern part of the Dry zone. It is one of the ancient and largest open water reservoirs. These two reservoirs are playing crucial roles in the human and ecosystem related services in the Dry zone of the country [15,35].

2.2. Data Used

2.2.1. Landsat Images

We used Landsat 5 TM and Landsat 8 OLI images from December 1987 to November 2019. Level 1 terrain corrected (L1T) TM and OLI products with cloud cover less than 60% were downloaded from the United States Geological Survey. L1T data is radiometrically and geometrically corrected and pre-georeferenced using the WGS84 datum. Employed cloud cover threshold optimally excluded the scenes with extensive cloud cover.
Nine path/row combinations cover Sri Lanka, and a total of 2215 images were processed, including 1261 TM images from 1987 to 2011, and 954 OLI images for the period of 2013–2019. The number of processed TM and OLI images per scene is given in Table 1. The median of images per path/row across the country for the entire study period ranged between 5 and 11, with a mean of nine images.

2.2.2. Meteorological and GDP Data

Climate variables include monthly cumulative precipitation (40 stations) and monthly mean temperature (18 stations) datasets from the meteorological stations distributed across the study area for the entire study period were collected from the Meteorological Department of Sri Lanka [7]. Provincial agriculture sector GDP values were obtained from the Central Bank of Sri Lanka from 1996 to 2018 [36].

2.3. Methods

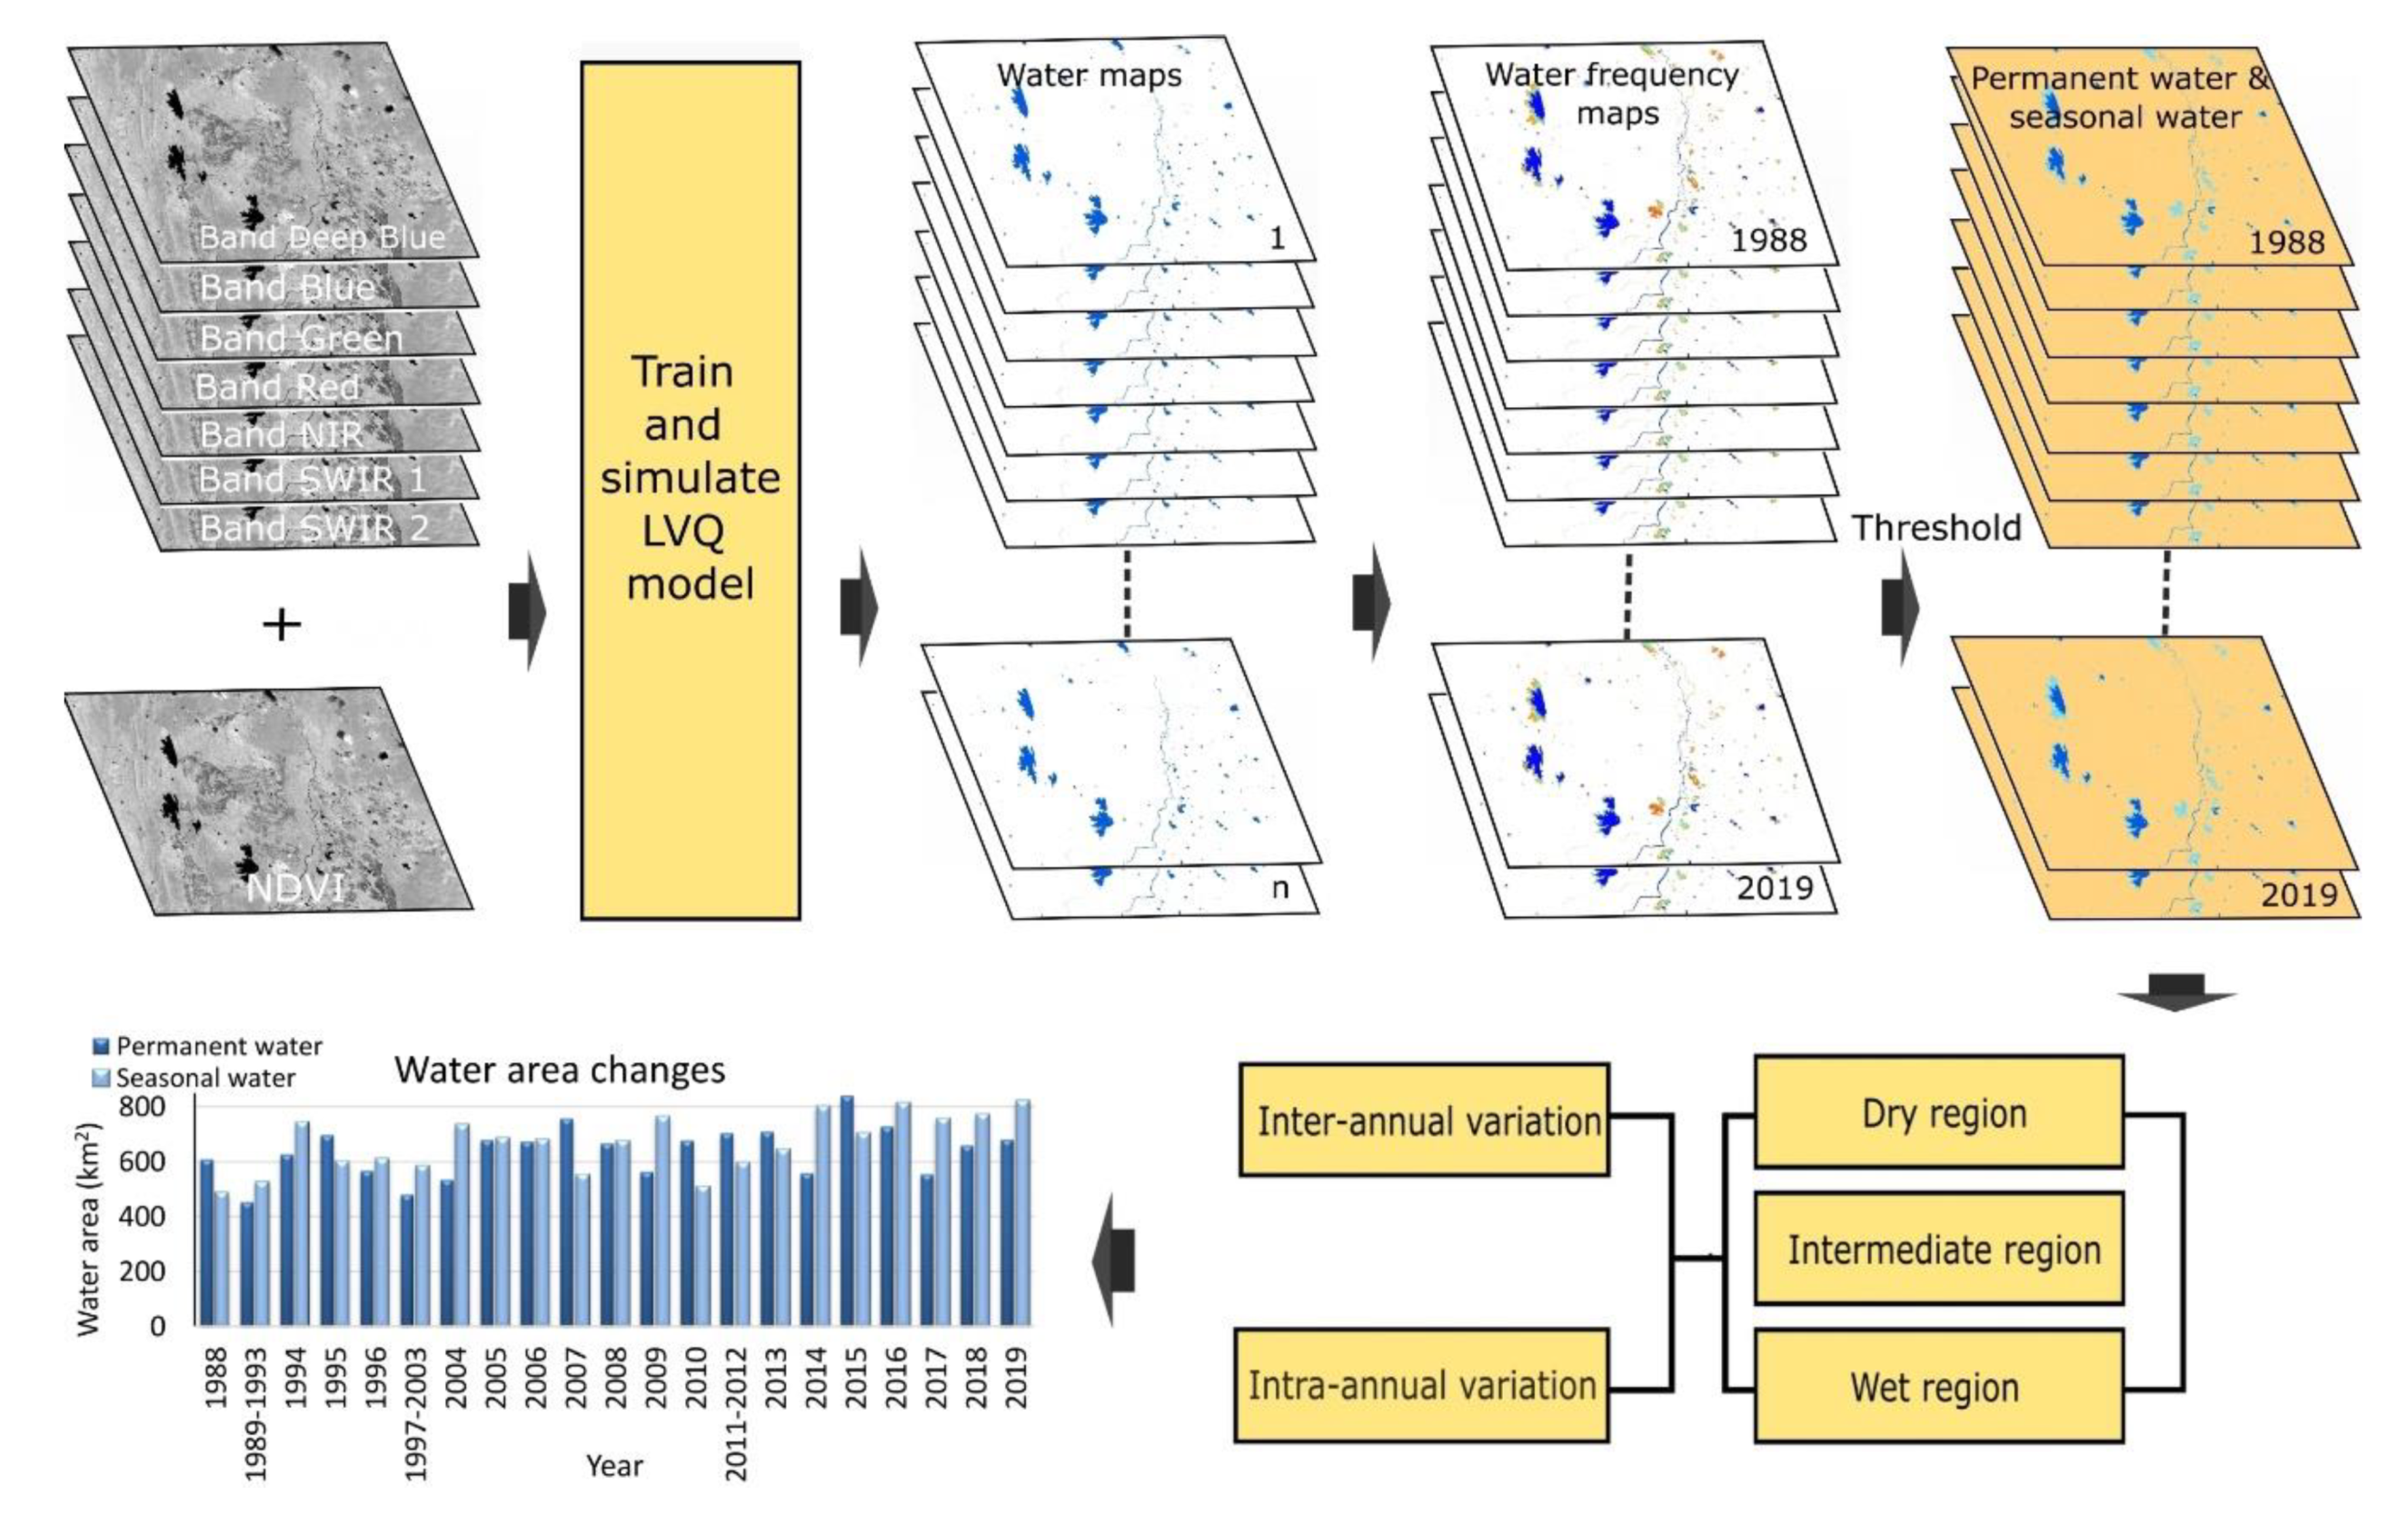
2.3.1. Image Processing and Water Extraction

Learning vector quantization (LVQ) neural network [37] is a supervised learning artificial neural network algorithm that predicts class label based on a competitive learning of spectral characteristics, shape, textural information, and the spatial dependence between the labels of neighboring pixels of satellite data [38]. We used LVQ models to extract water by the method described in Somasundaram et al. [39]. This model was used to accurately discriminate water pixels from the cloud, shadow, floating vegetation and other non-water, and segment water from the shadow. All visible bands of the Landsat sensor and normalized difference vegetation index (NDVI) were used to train the model in order to discriminate water from the diverse reflectance patterns in this complex study area [39]. We derived two generic LVQ models for each sensor, which consisted of TM water and non-water, and OLI water and non-water. We applied these models to classify each scene into water and non-water.
The digital numbers were converted to Rayleigh corrected reflectance to eliminate the variations among the images due to the image acquisition over different locations and times, and solar irradiance. Bands 1–5, 7 of TM and bands 1–7 of OLI and NDVI were processed and used in these models (Figure 2). The training samples for water and non-water were collected from images acquired at several times across the study area. These samples were selected manually by visual interpretation in order to represent the spectral variation. A total of 5370 water pixels, which includes reservoirs, rivers, and ponds, and 7530 non-water pixels, which includes land, building, vegetation, and cloud were used to train each model. Each model was processed with 0.0001 learning rate, 50 nodes, and 200 epochs using the Neural Network tool in Matlab.

2.3.2. Surface Water Distribution and Inter- and Intra-Annual Variations Analysis

Our LVQ models were able to detect water well from the cloud and very confusable non-water objects, such as terrain shadow, and cloud shadow over vegetation and urban areas. It also efficiently identified the water located under the cloud shadow. The remaining cloud-contaminated pixels were removed by applying a cloud mask threshold to the blue band surface reflectance (0.11 and 0.14 for TM and OLI, respectively).
The resultant water and non-water pixels of all images were then aggregated into frequency maps (Figure 2) at various time scales, using ArcPy scripts in ArcGIS 10.3.
We calculated per-pixel water occurrence frequency (WOF) percentage,
WOF ( t ) = 1 N t   i = 1 N t W t , i   × 100
where, t is the time lap (period of years or year or season), Wt,i is a binary observation of water: W = 1, 0 when a pixel labelled as water and non-water, Nt is the number of clear observations of a pixel within the time lap.
At first, the cumulative WOF map over the entire study period was calculated. Then, we applied a 3 × 3 spatial majority filter to minimize the salt and pepper noises. Areas with lower WOF (<10%) were considered as non-water. We found that this threshold removed a considerable amount of noise caused by paddy fields and floods. Visual inspection on this map identified the remaining scattered false detections due to paddy fields. Then, these identified non-water bodies were manually removed. Finally, the maximum water extent map of all water features during the entire study period was obtained from the time series cumulative WOF map. The resultant maximum water area map was used as a water mask for every water map.
Then, seasonal and annual time series WOF maps were created from all available water maps to investigate inter- and intra-annual variations. We created an annual time series WOF maps based on seasonal WOF maps. At first, all available water maps were cumulated per season (DJF, MA, MJJAS, ON) per year. Seasons with less than two observations were excluded to remove the impact of uneven temporal coverage on the annual time series. Greater than two seasons with data were then averaged in proportion to month durations, to evaluate annual WOF per year due to the insufficient data coverage during several years. We selected a water year that corresponded with climatic seasons. Thus, a year was defined between December of the previous year and November of that specific year (e.g. Year 2019 was defined as December 2018 to November 2019). Besides, we generated time series of permanent and seasonal water maps to account for interannual variations. Water pixels with WOF ≥ 80% were defined as permanent water, while the others were categorized as seasonal water bodies (80% > WOF ≥ 10%).
Furthermore, the seasonal average, annual average, and annual maximum water areas for the entire study period were calculated. Surface water changing trends were observed through linear regression analysis using RStudio version 1.2.5033. Additionally, intra-annual variations of Senanayake Samudra and Padaviya reservoirs were monitored.

2.3.3. Correlate Water Area Variations and Driving Factors

Previous studies have widely used GDP to assess the overall human-induced effect on water bodies [29,40]. Here, Agricultural GDP index was used as a proxy for direct human influencing factor. Time series trends of precipitation and temperature observations were studied and smoothed by exponential smoothing technique [41] using Matlab. Similarly, water area was smoothed by a moving average method. The seasonal standardized temperature anomalies (STA) [42] were derived as:
S T A j = 1 N j i = 1 N j T i j   T i σ i
where, Tij is the temperature of the jth season of the year at station i, Ti is the mean temperature of the season j at station i over the study period, σi is the standard deviation of the season j at station i over the study period. and Nj is the number of stations with complete records in season j of the year.
Then, correlation analyses were performed to evaluate the contribution of driving factors in water area variation during the last three decades. Linear regression analyses estimated the variability in the surface water and climate and anthropogenic factors.

3. Results

3.1. Accuracy Assessment of Water Extraction

The accuracy of the water extraction was assessed in terms of omission and commission errors for both TM and OLI LVQ models separately. Results were summarized into a confusion matrix (Table 2). Results indicated that overall accuracy of water was high for both TM and OLI data (99.90% and 99.93%, respectively). User’s accuracy was also the same for both data. Producer’s accuracy of TM (99.40%) was higher than that of OLI (98.54%).

3.2. Spatial Patterns of Surface Water Distribution

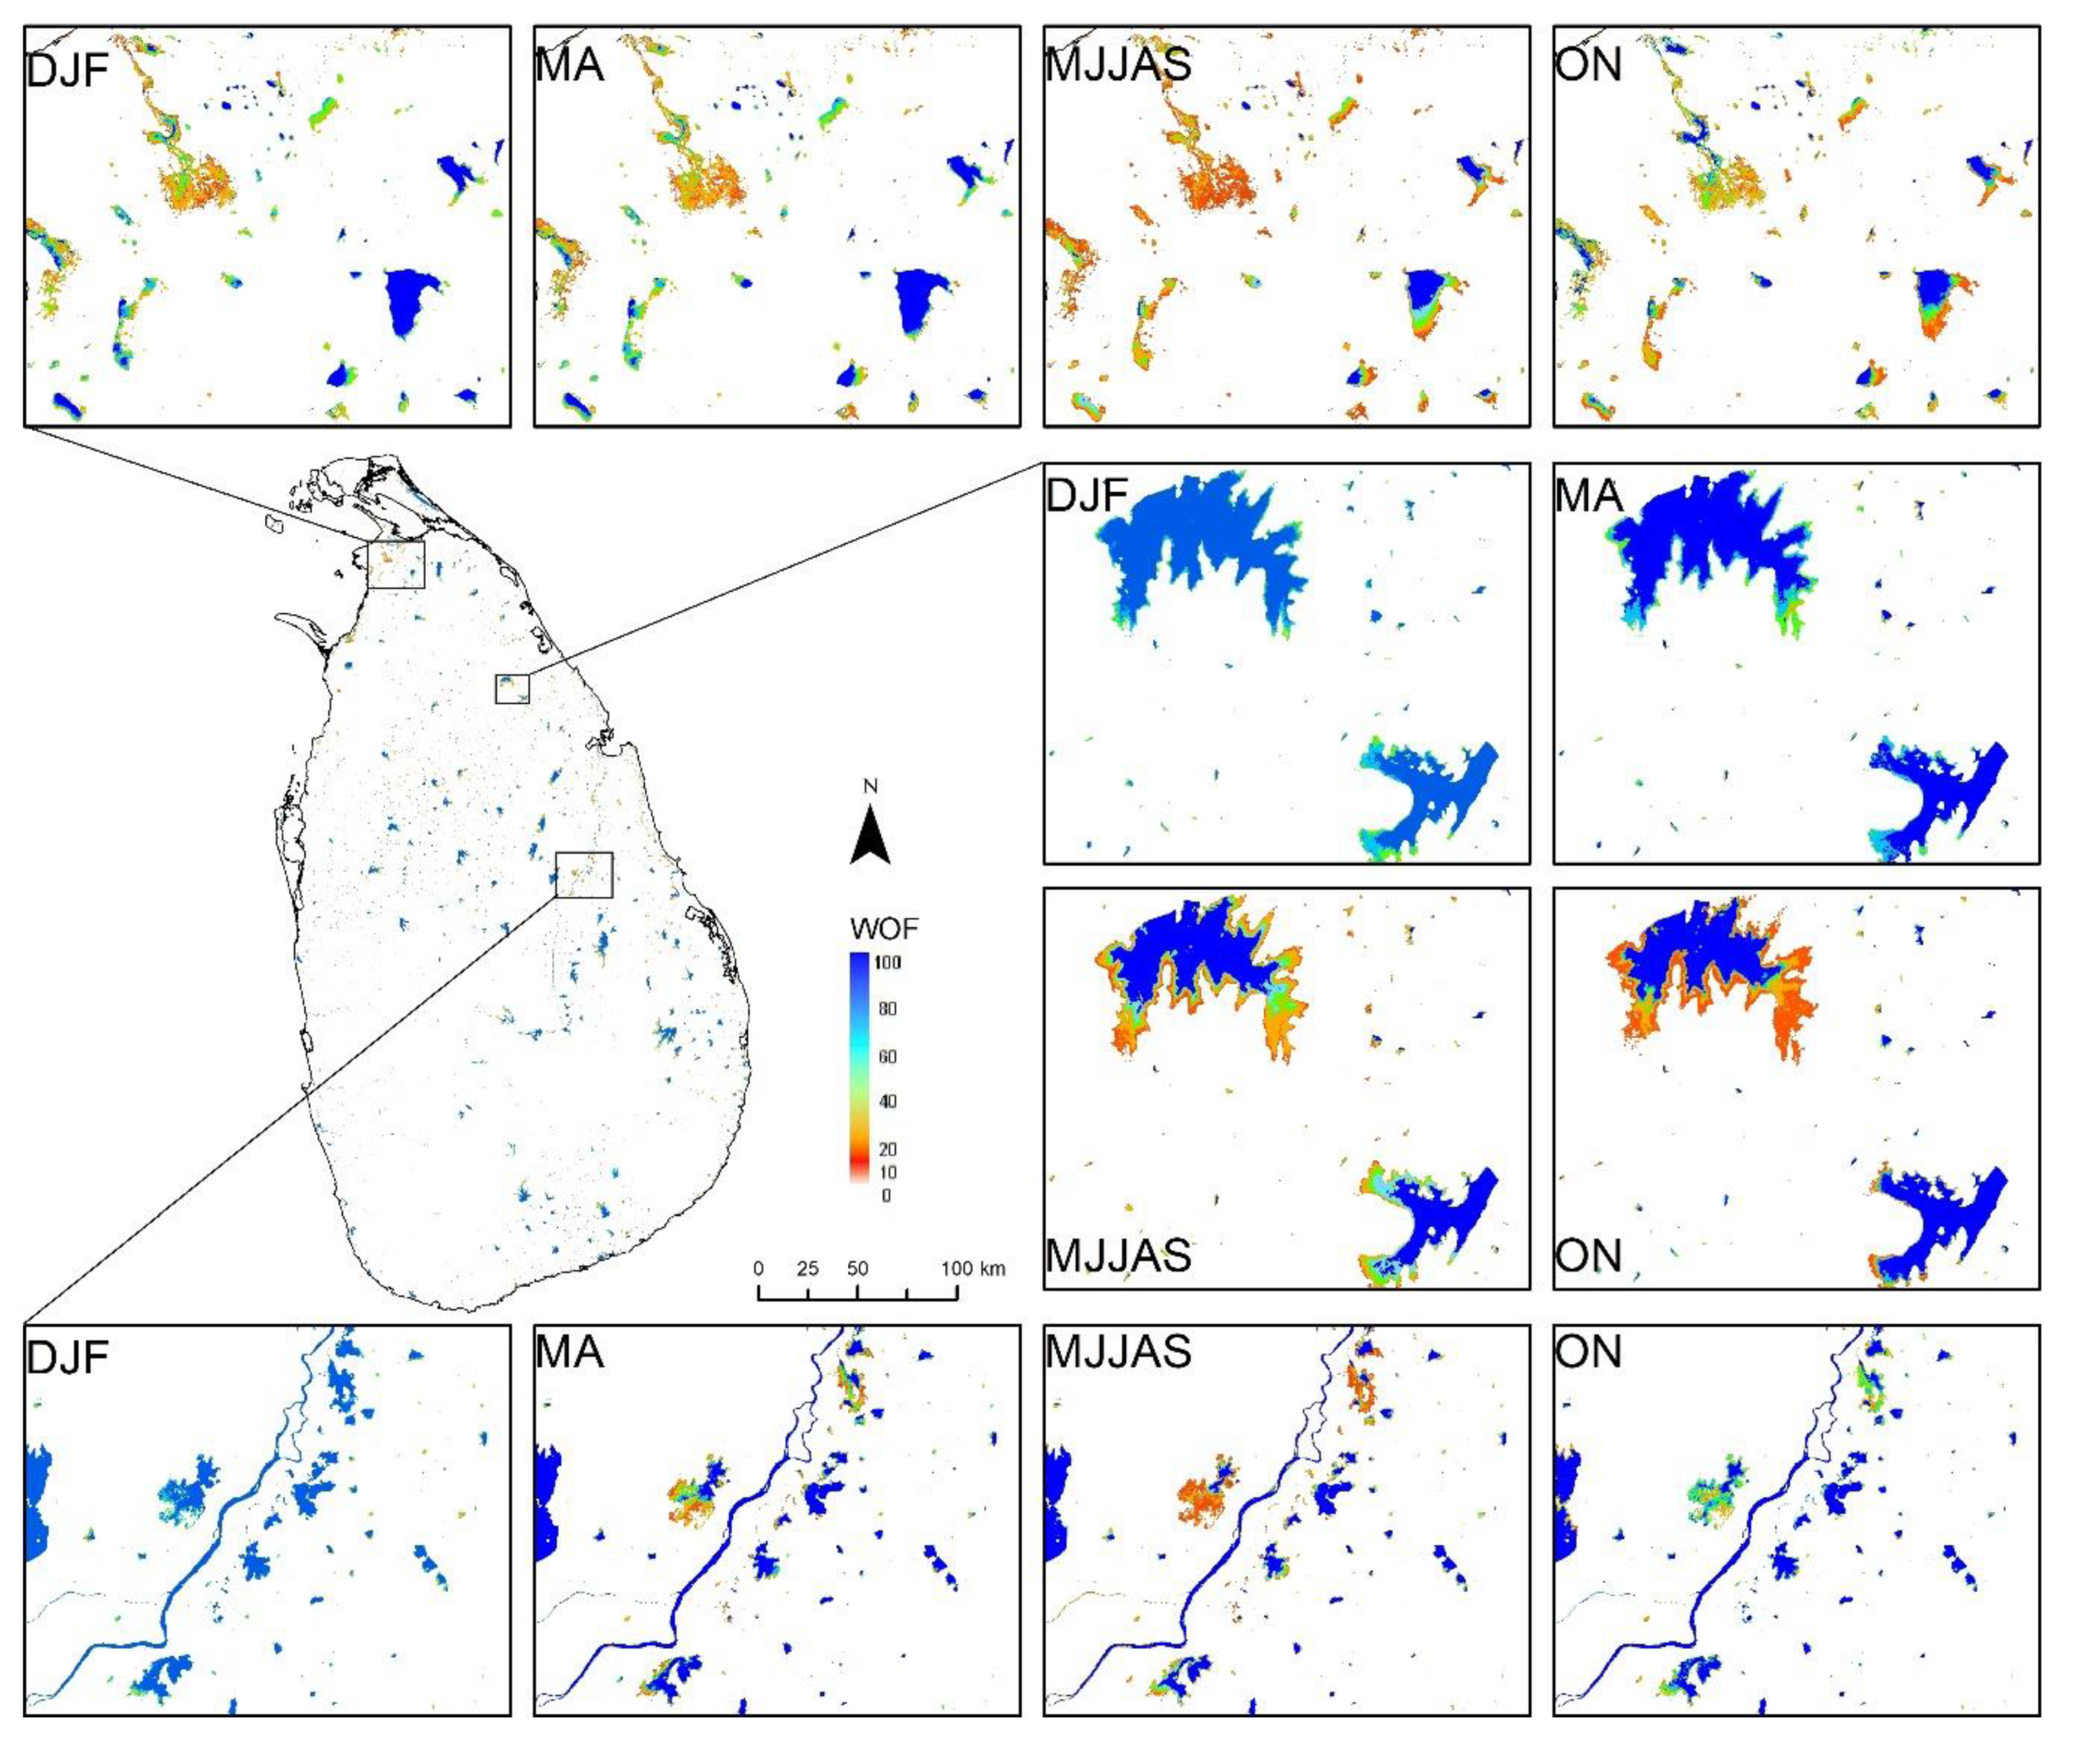
We used 2215 Landsat TM and OLI images to compute surface water dynamics of Sri Lanka over a time-series of the last 32 years. The cumulated WOF map of 1988–2019 resulted in a maximum water extent of 1607.73 km2 which is about 2.46% of the land area of Sri Lanka (Figure 3). Highest WOF (above 80%) occurred at deepest parts of lakes and reservoirs, major rivers, and other permanent water bodies, which retain water for the entire year. However, shallow edges of these permanent water bodies, small ponds, minor rivers, and other shallow water areas had water during heavy rainy periods. They dried up during dry periods and accounted for a lower WOF (below 40%). A vast amount of small water bodies had very low WOF, particularly in the Dry zone (Figure 3), which means that they only existed during the rainy seasons. The quantity of water area observed during the study period was given over five WOF ranges in Table 3.
Moreover, surface water distributed unevenly across Sri Lanka. About 83.77%, 12.46%, and 3.77% located in Dry, Intermediate, and Wet zones, respectively. In the Dry zone, the area of permanent and seasonal water covered nearly the same extent (53% and 47%, respectively). The high amount of seasonal water strongly indicates that there may be great possibilities for a reduction in water availability during dry periods. In contrast, the Wet zone contained a relatively stable permanent water (71%) with less temporal water, consecutively the Intermediate zone had 63% of permanent water (Table 3). The distribution of WOF over the entire period showed that only about 54.86% of the water pixels in Sri Lanka had a WOF higher than 80%, which categorized as permanent water. Nearly half of the total water bodies (45.14%) had water only for several months in a year during the precipitation period.

3.3. Interannual Variations

Various thresholds on the annual WOF can provide detailed information on inland water changes according to their period of existence (Figure 4). The cumulative water area of Sri Lanka varied from 974.33 to 1499.68 km2 during the entire study period. Overall, the proportions of permanent and seasonal water remained almost the same throughout the study period. Further, nearly a 20% reduction in the permanent water area (WOF > 80%) was observed since 2015. In contrast, seasonal water area with WOF < 40% showed a rapid expansion with that. These conditions indicated a further increment of competing demand and scarcity of water during the last three decades, with a recent escalation.
Significant increasing trends were found in permanent water area at a rate of 4.47 km2 (p-value = 0.04, r = 0.44) per year and seasonal surface water area at an annual rate of 7.06 km2 (p-value = 1.9 × 10⁻³, r = 0.64) during the entire time-series (1988-2019) (Figure 5a). These might be related to the intensification of heavy precipitation events and intensity [43]. Individual climatic zones showed remarkable divergent trends over the years in the permanent and seasonal water areas (Figure 5b–d). Dry zone seasonal water area had a significant upward trend of 6.70 km2 (p-value = 1.6 × 10⁻³, r = 0.64) per year over the last three decades. In contrast, permanent water had an increasing trend of 0.22 km2 (p-value = 0.01, r = 0.54) per year in the Wet zone. Notable increasing trends were found in both their permanent and seasonal water area at rates of 1.55 km2 (p-value = 5 × 10⁻⁴, r = 0.69) per year and 0.37 km2 (p-value = 0.07, r = 0.40) per year in the Intermediate zone, respectively.

3.4. Intra-Annual Patterns and Variations

WOF over four rainfall climate seasons, DJF, MA, MJJAS, and ON (starting on December, March, May, and October) across the study period showed a massive difference in the spatial patterns of surface water. Dramatic variations founded in the Dry zone seasonality over the study years (Figure 6). Various ranges of WOF among different seasons clearly shows the fluctuations of the water area between seasons. Water availability is higher in these water bodies during the first two seasons. Reduction in water area occurred during MJJAS to ON due to the dry up of shallow water areas.
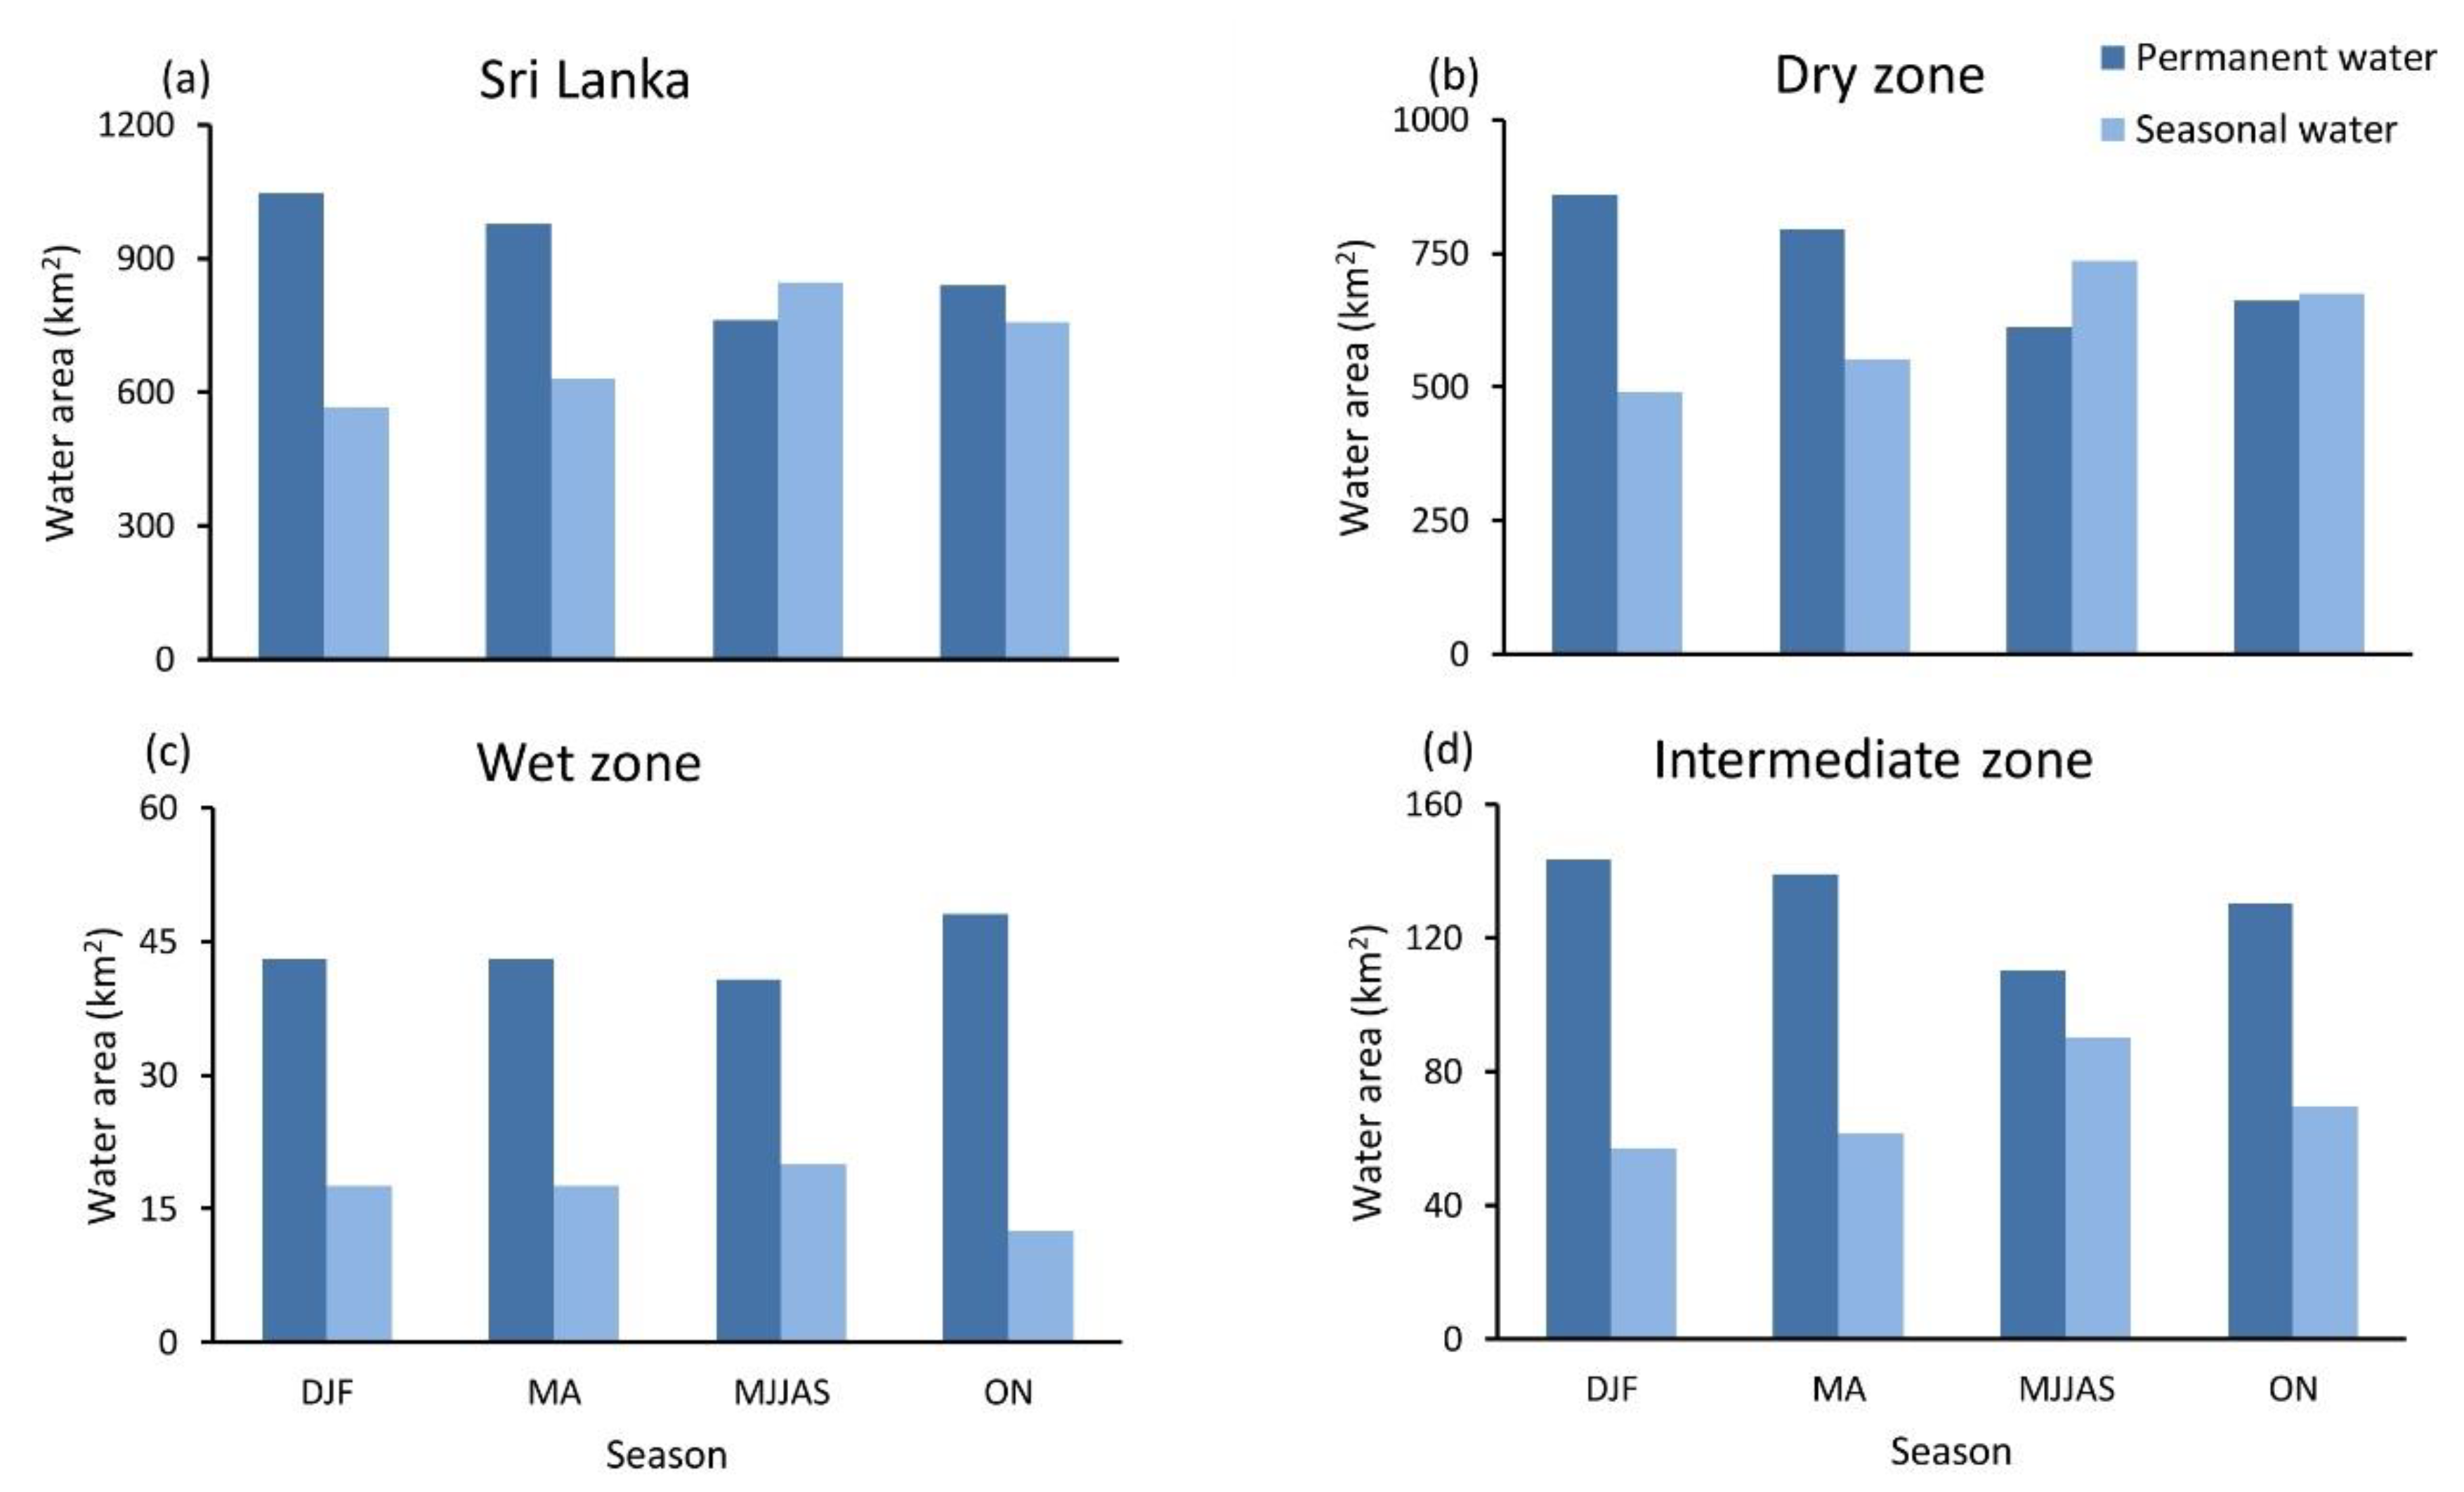
Overall, Sri Lanka showed apparent seasonality in both permanent (from 1045.97 to 761.92 km2) and seasonal (from 846.46 to 566.14 km2) water areas (Figure 7). It had the highest permanent water area during DJF and followed by MA, while peak seasonal water area in MJJRS, which is 84.54 km2 more than permanent water area.
Disparities in seasons was observed between different climatic zones of the country (Figure 7). The Dry zone entirely drove the changing pattern of the country. The permanent water areas in DJF and MA were visibly more significant than those in other seasons with the minimum at MJJAS. Seasonal water showed complete opposing trends. The Intermediate zone only showed little fluctuations in its water types over seasons. In contrast, the Wet zone had stable water throughout the year with a little peak permanent water area of 48.06 km2 in ON compared to other seasons.
Further, there were some temporal changing patterns among the climatic seasons through the study period over Sri Lanka. Dynamics of permanent and seasonal water area variations between six time phases 1988–1994, 1995–1999, 2000–2004, 2005–2009, 2010–2014, and 2015–2019 shown in Figure 8. The difference in trends and magnitude were found between permanent and seasonal water bodies during MJJAS and ON. Area of permanent water was comparatively lower than that of seasonal water in those two seasons. A gradual rising trend of permanent water was found in DJF and MA over the entire period. Seasonal water had exhibited growth over 2000–2019, notably with a faster rate in MJJAS than others. Generally, seasonal water showed speedy growth in all four seasons during the last five years (2015–2019).
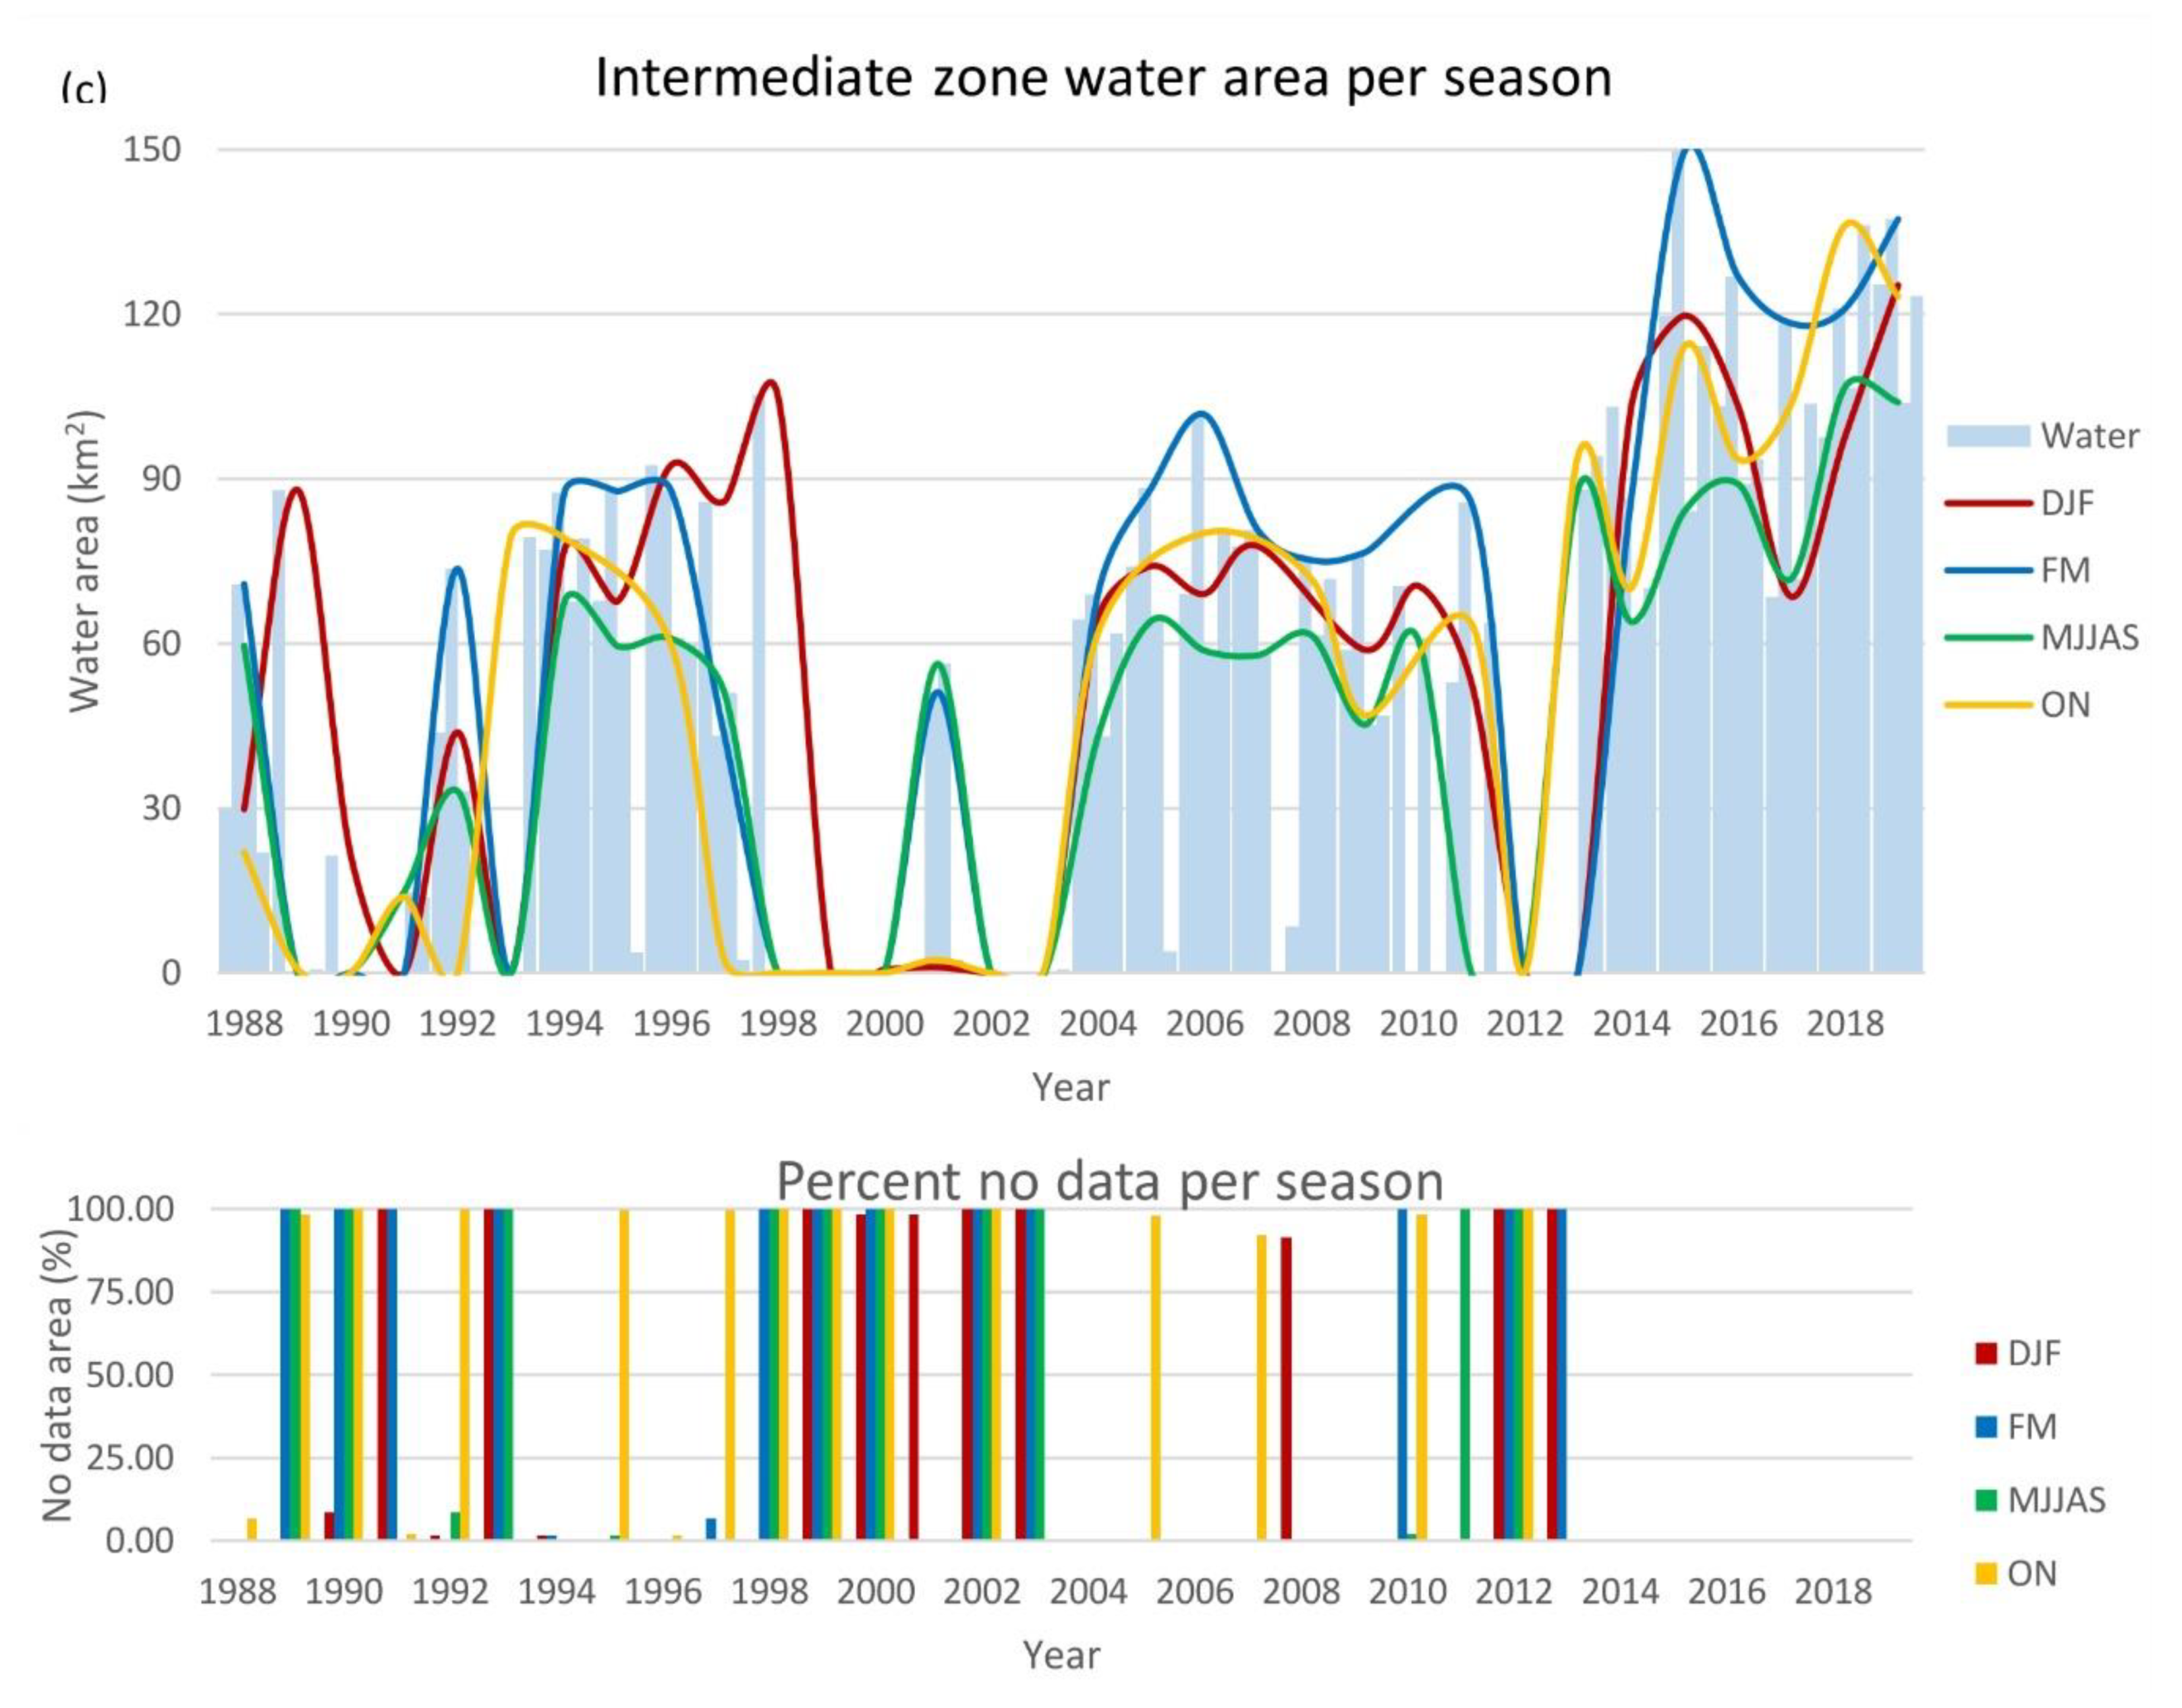
Comparisons of average surface water area were conducted for each climatic zone against seasons with the respective no-data area (Figure 9). We had 93, 84, and 92 time phases of seasons per year for Dry, Wet, and Intermediate zones for 32 years due to the gap between ageing of Landsat 5 and launch of Landsat 8, and non-coverage during certain seasons. During the time phases, ON season of 1997 in Dry zone, MA seasons of 2000 and 2013 in Intermediate zone and ON seasons of 1989, 1995, 1997, 2005, 2010, DJF seasons of 2000 and 2001, MA seasons of 2000 and 2013 in Wet zone reported without any observations. The total area covered during ON seasons of 1989, 1995, 2001, 2010, and 2013, MA seasons of 2001 and 2013, and DJF season of 2001 over the Dry zone, and ON seasons of 1989, 1995, 1997, 2005, 2007, and 2010, and DJF season of 2000, 2001, and 2008 in Intermediate zone were comparatively small and should not be compared with other seasons.
Generally, individual climatic zones exposed different intra-annual trends (Figure 9a). The Dry zone had greater fluctuations in surface water among seasons than other zones. However, all zones had comparatively lower area throughout MJJAS. Overall, statistically significant linear growing tendencies were found over all zones. The trends of water area change revealed an increase of 3.033 ± 0.428 (p-value < 0.001), 0.075 ± 0.027 (p-value = 6 × 10⁻³), and 0.445 ± 0.063 (p-value < 0.001) km2 per season for Dry, Wet, and Intermediate zones, respectively.

3.5. Correlation Between Water Area Variations and Climate and Anthropogenic Factors

Climate and GDP variables were considerably influencing surface water changes in this study area. Precipitation is the main source for Sri Lankan surface water. As shown in Figure 10, annual cumulative precipitation of the Wet zone decreased during 1988–2000 and 2011–2019, in contrast, a positive trend was observed from 2001 to 2010. Figure 10 shows the time-series of annual average (Dry and Intermediate zones) and maximum (Wet zone) surface water area, and annual cumulative precipitation from 1988 through 2019. Dry (p-value = 4 × 10⁻⁴, r = 0.66), Wet (p-value = 0.09, r = 0.35), and Intermediate (p-value = 0.06, r = 0.39) zones showed statistically moderate relationships. Figure 10 shows a clear consistency between water area fluctuations and the variation in precipitation in all zones.
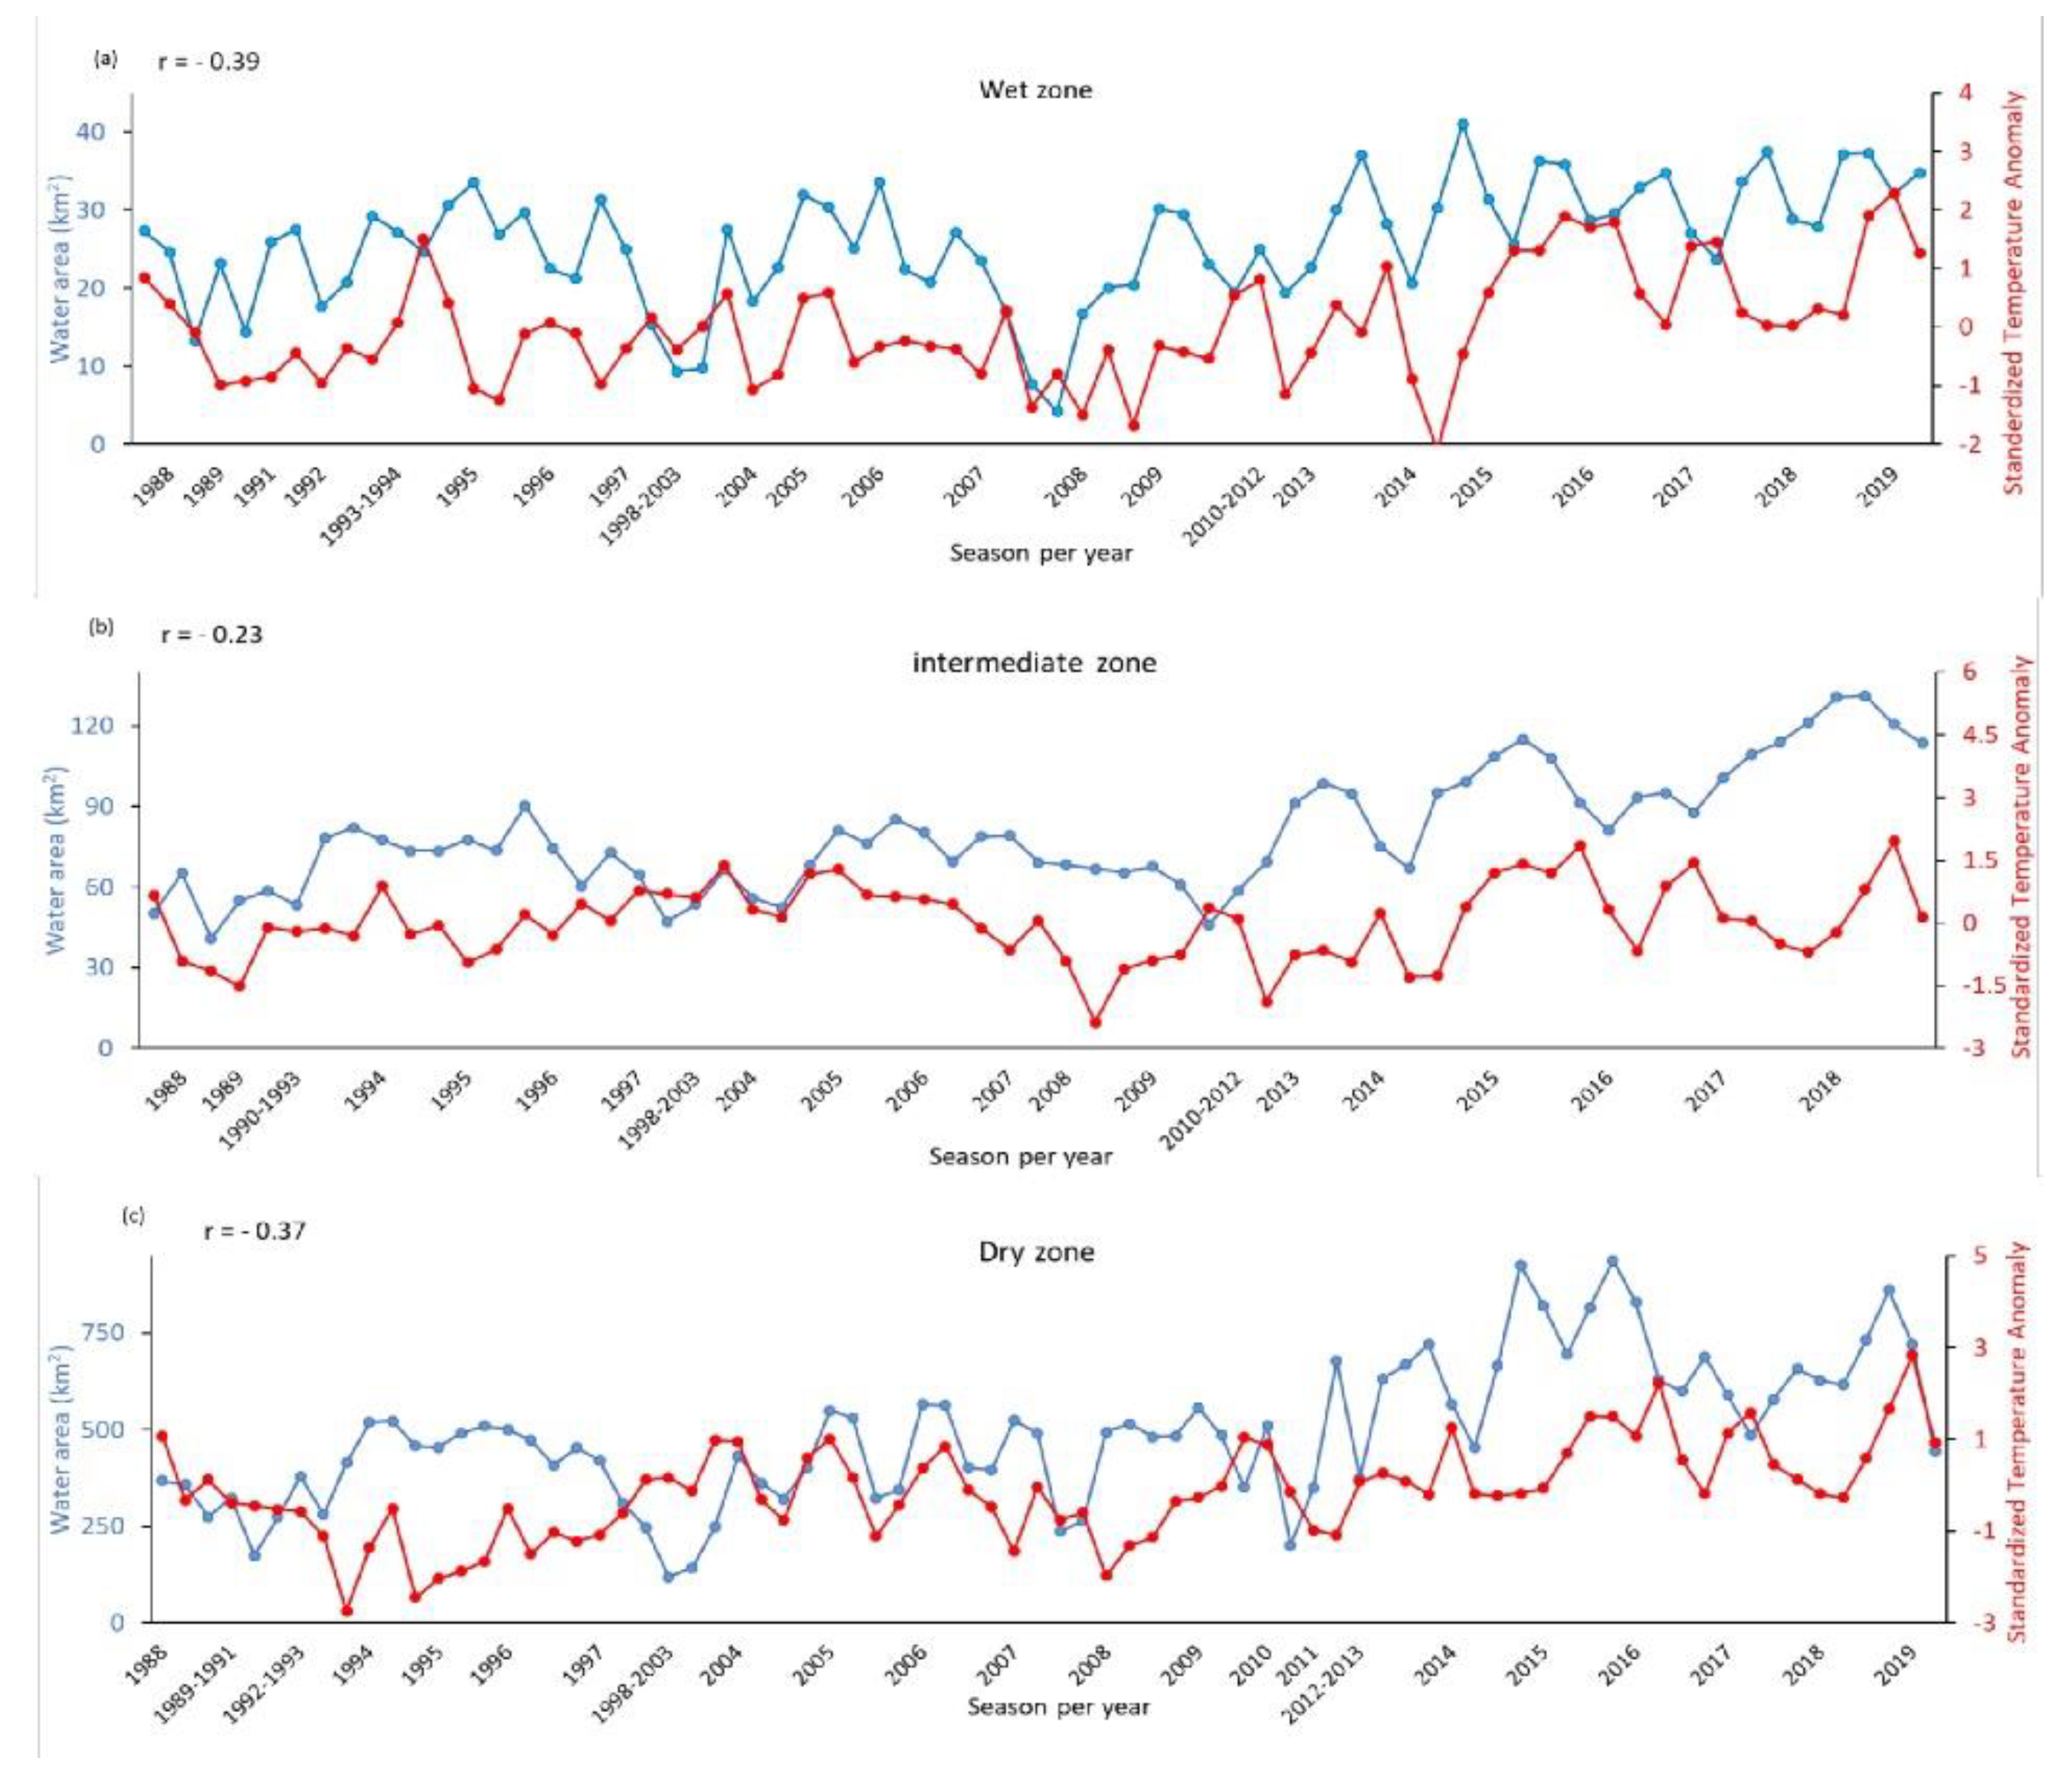
In contrary, the climatological seasonal temperature had a negative impact on the surface water area in all three zones (Figure 11). Dry (p-value = 9 × 10⁻⁴, r = −0.37) and Wet (p-value = 8 × 10⁻⁴, r = −0.39) zones showed a statistically moderate correlation. However, the Intermediate zone (p-value = 0.07, r = −0.23) expressed a weak statistical relationship. Temperature increment may increase evaporation from water bodies in this region where shallow water bodies are prevalent. Thus, the rise in temperature anomaly may reduce water area. Generally, the water area in all zones showed a strong association with positive peaks of STA, specifically in the MJJAS seasons, corresponding to a sharp decline in the water area and vice-versa. Figure 11 shows several occurrences of this tendency during the study period in the country. However, few exceptions observed during a few seasons. Heavy precipitation during strong El-Nino events caused sharp water area to rise in all zones [44,45]. Besides, high monsoonal rains may increase respective seasonal water extent across all three zones.
Agriculture is the main surface water consuming sector in Sri Lanka. To maintain the data consistency among different zones during the whole study period, we used the agriculture sector GDP data to evaluate the effect of human activities on water [29]. We considered a calendar year in the estimation of annual surface water area for the consistency among data. GDP was statistically very significant and positively related to the water area, despite the time-series from 1996 to 2018 (Figure 12). The Dry zone (p-value = 1 × 10⁻⁵, r = 0.80) showed high correlation, followed by Intermediate (p-value = 6 × 10⁻⁴, r = 0.73) and Wet (p-value = 0.03, r = 0.51) zones.

3.6. Intra-Annual Variations of Senanayake Samudra and Padaviya Reservoirs in the Dry Zone

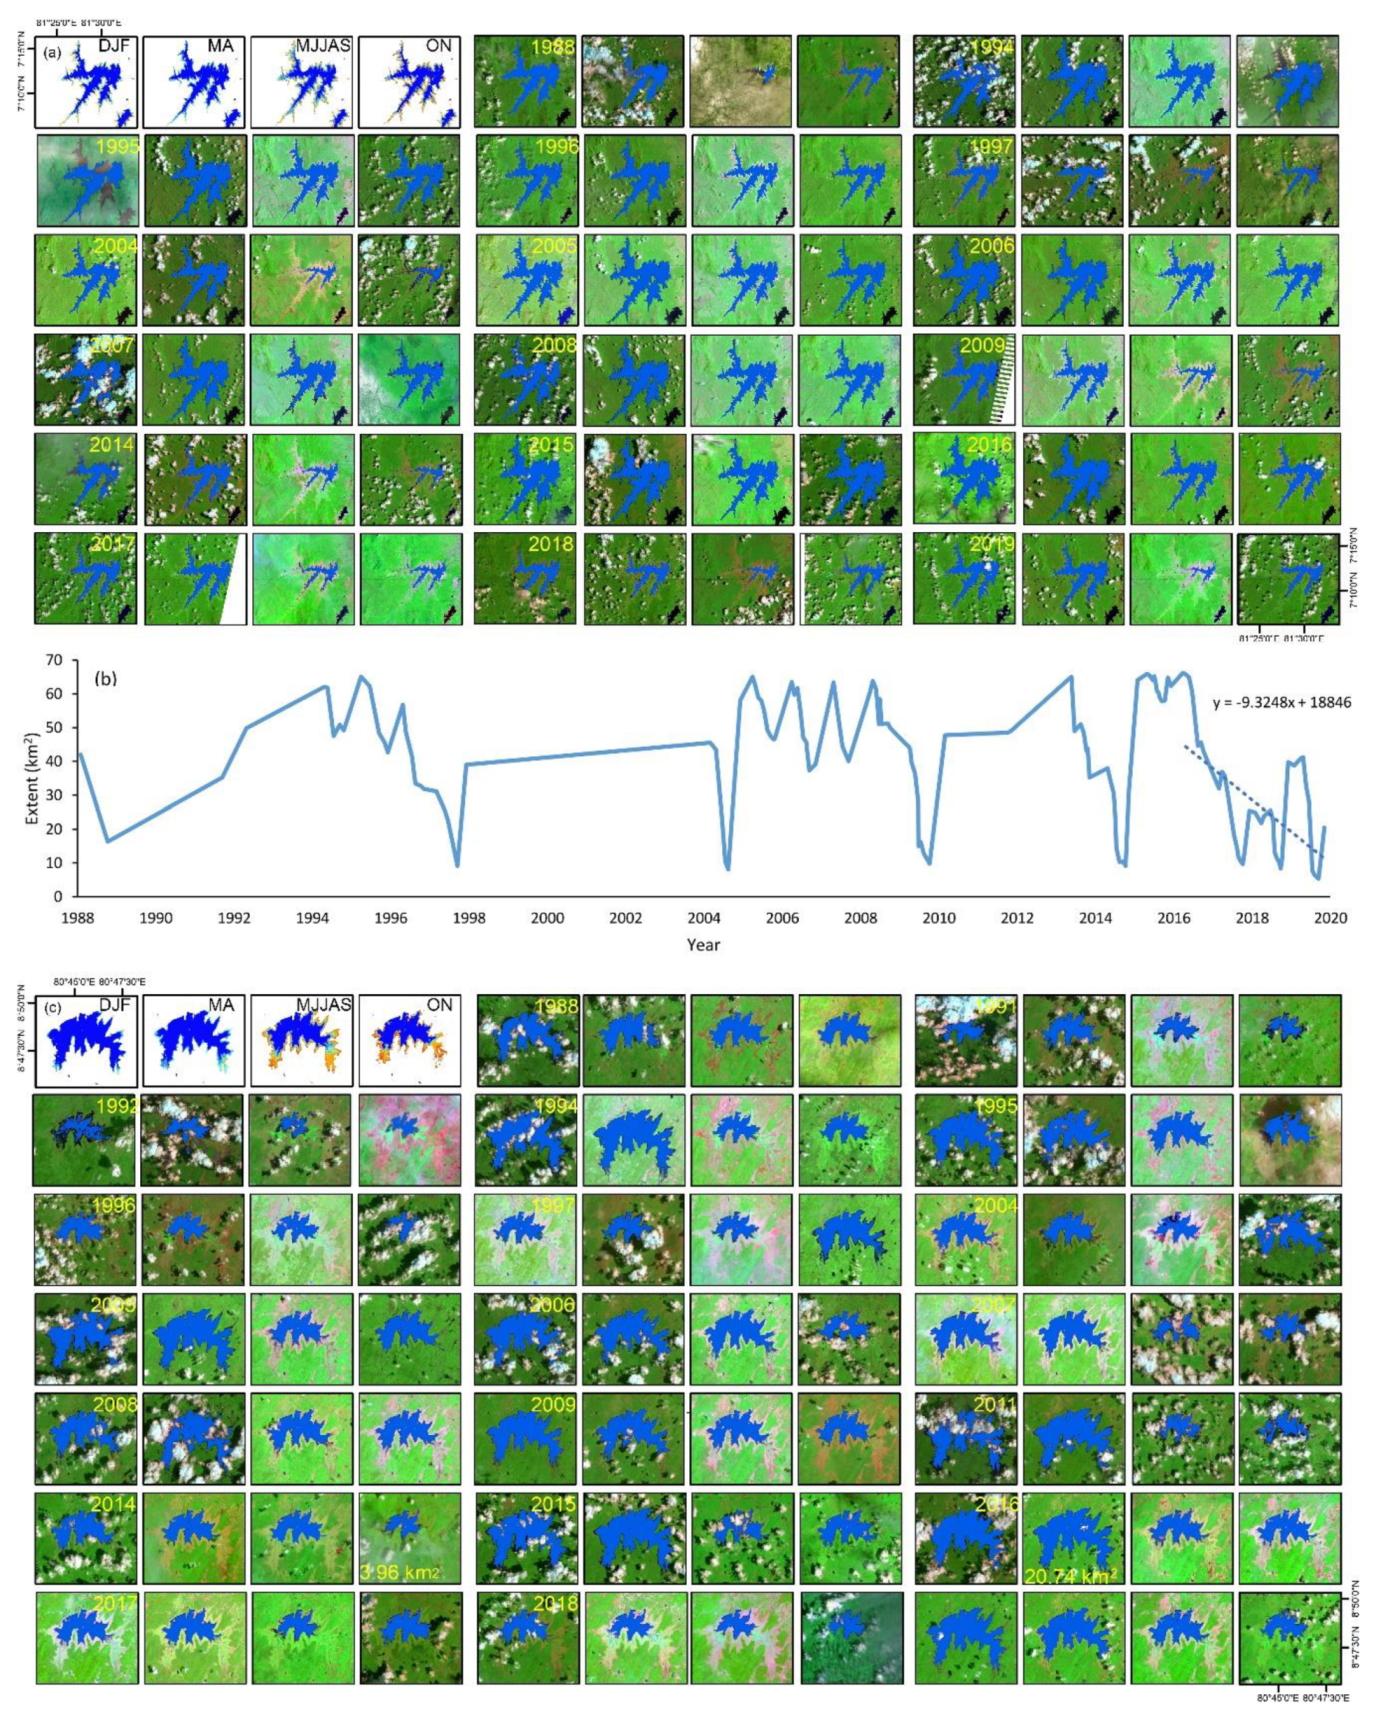
Impact of seasonal climates on water area variation is evident in the Dry zone water bodies. Variation in two major reservoirs (Senanayake Samudra and Padaviya) clearly illustrated these influences. Senanayake Samudra reservoir plays essential roles in the Dry zone irrigational agriculture with a command area of 486 km2 (about 7.5% of total irrigational extent), hydropower generation, and feeding other dams [46,47,48]. We found significant variations among seasons with the highest filled up and dried up during DJF and MJJAS seasons, respectively (Figure 13a). During the last three decades, water area varied from 65.85 km2 in MA 2015 to 5.32 km2 in MJJAS 2019, while the highest intra-annual difference by approximately 37.43 km2 in 2004, from DJF to MJJAS. The maximum area was almost consistent during 2004–2016. However, reservoir volume and extent continued to drop since 2016 to the end of 2019 at a drastic annual rate of 9.32 km2 (Figure 13a,b).
Padaviya reservoir plays an essential role in the agricultural activities [15] in the Dry zone. This reservoir area varied from 20.74 (MA 2017) to 3.96 km2 (ON 2014) in the past decades. Water extent continued to decline in MJJAS and ON seasons, and continued drops were found during 1991–1992 and 2017–2018 (Figure 13c) during the study period.

4. Discussion

4.1. Effects of Driving Factors on Surface Water Area Variation

Climate and anthropogenic activities are the main factors contributing to the seasonal variations of the surface water [1,3,33]. Due to the geographical location of Sri Lanka, its spatial and temporal heterogeneity of climatic conditions significantly influence the water availability and surface water dynamics across the country [17]. Dry and Wet zones exhibited positive and negative moderate relationships with precipitation and temperature, respectively. The Intermediate zone showed moderate and weak relationships with precipitation and temperature, respectively. Observed WOF is sensitive to the spatial bias of cloud free observations as Sri Lanka is under high incidents of the cloud. It may not provide an overall summary of the island.
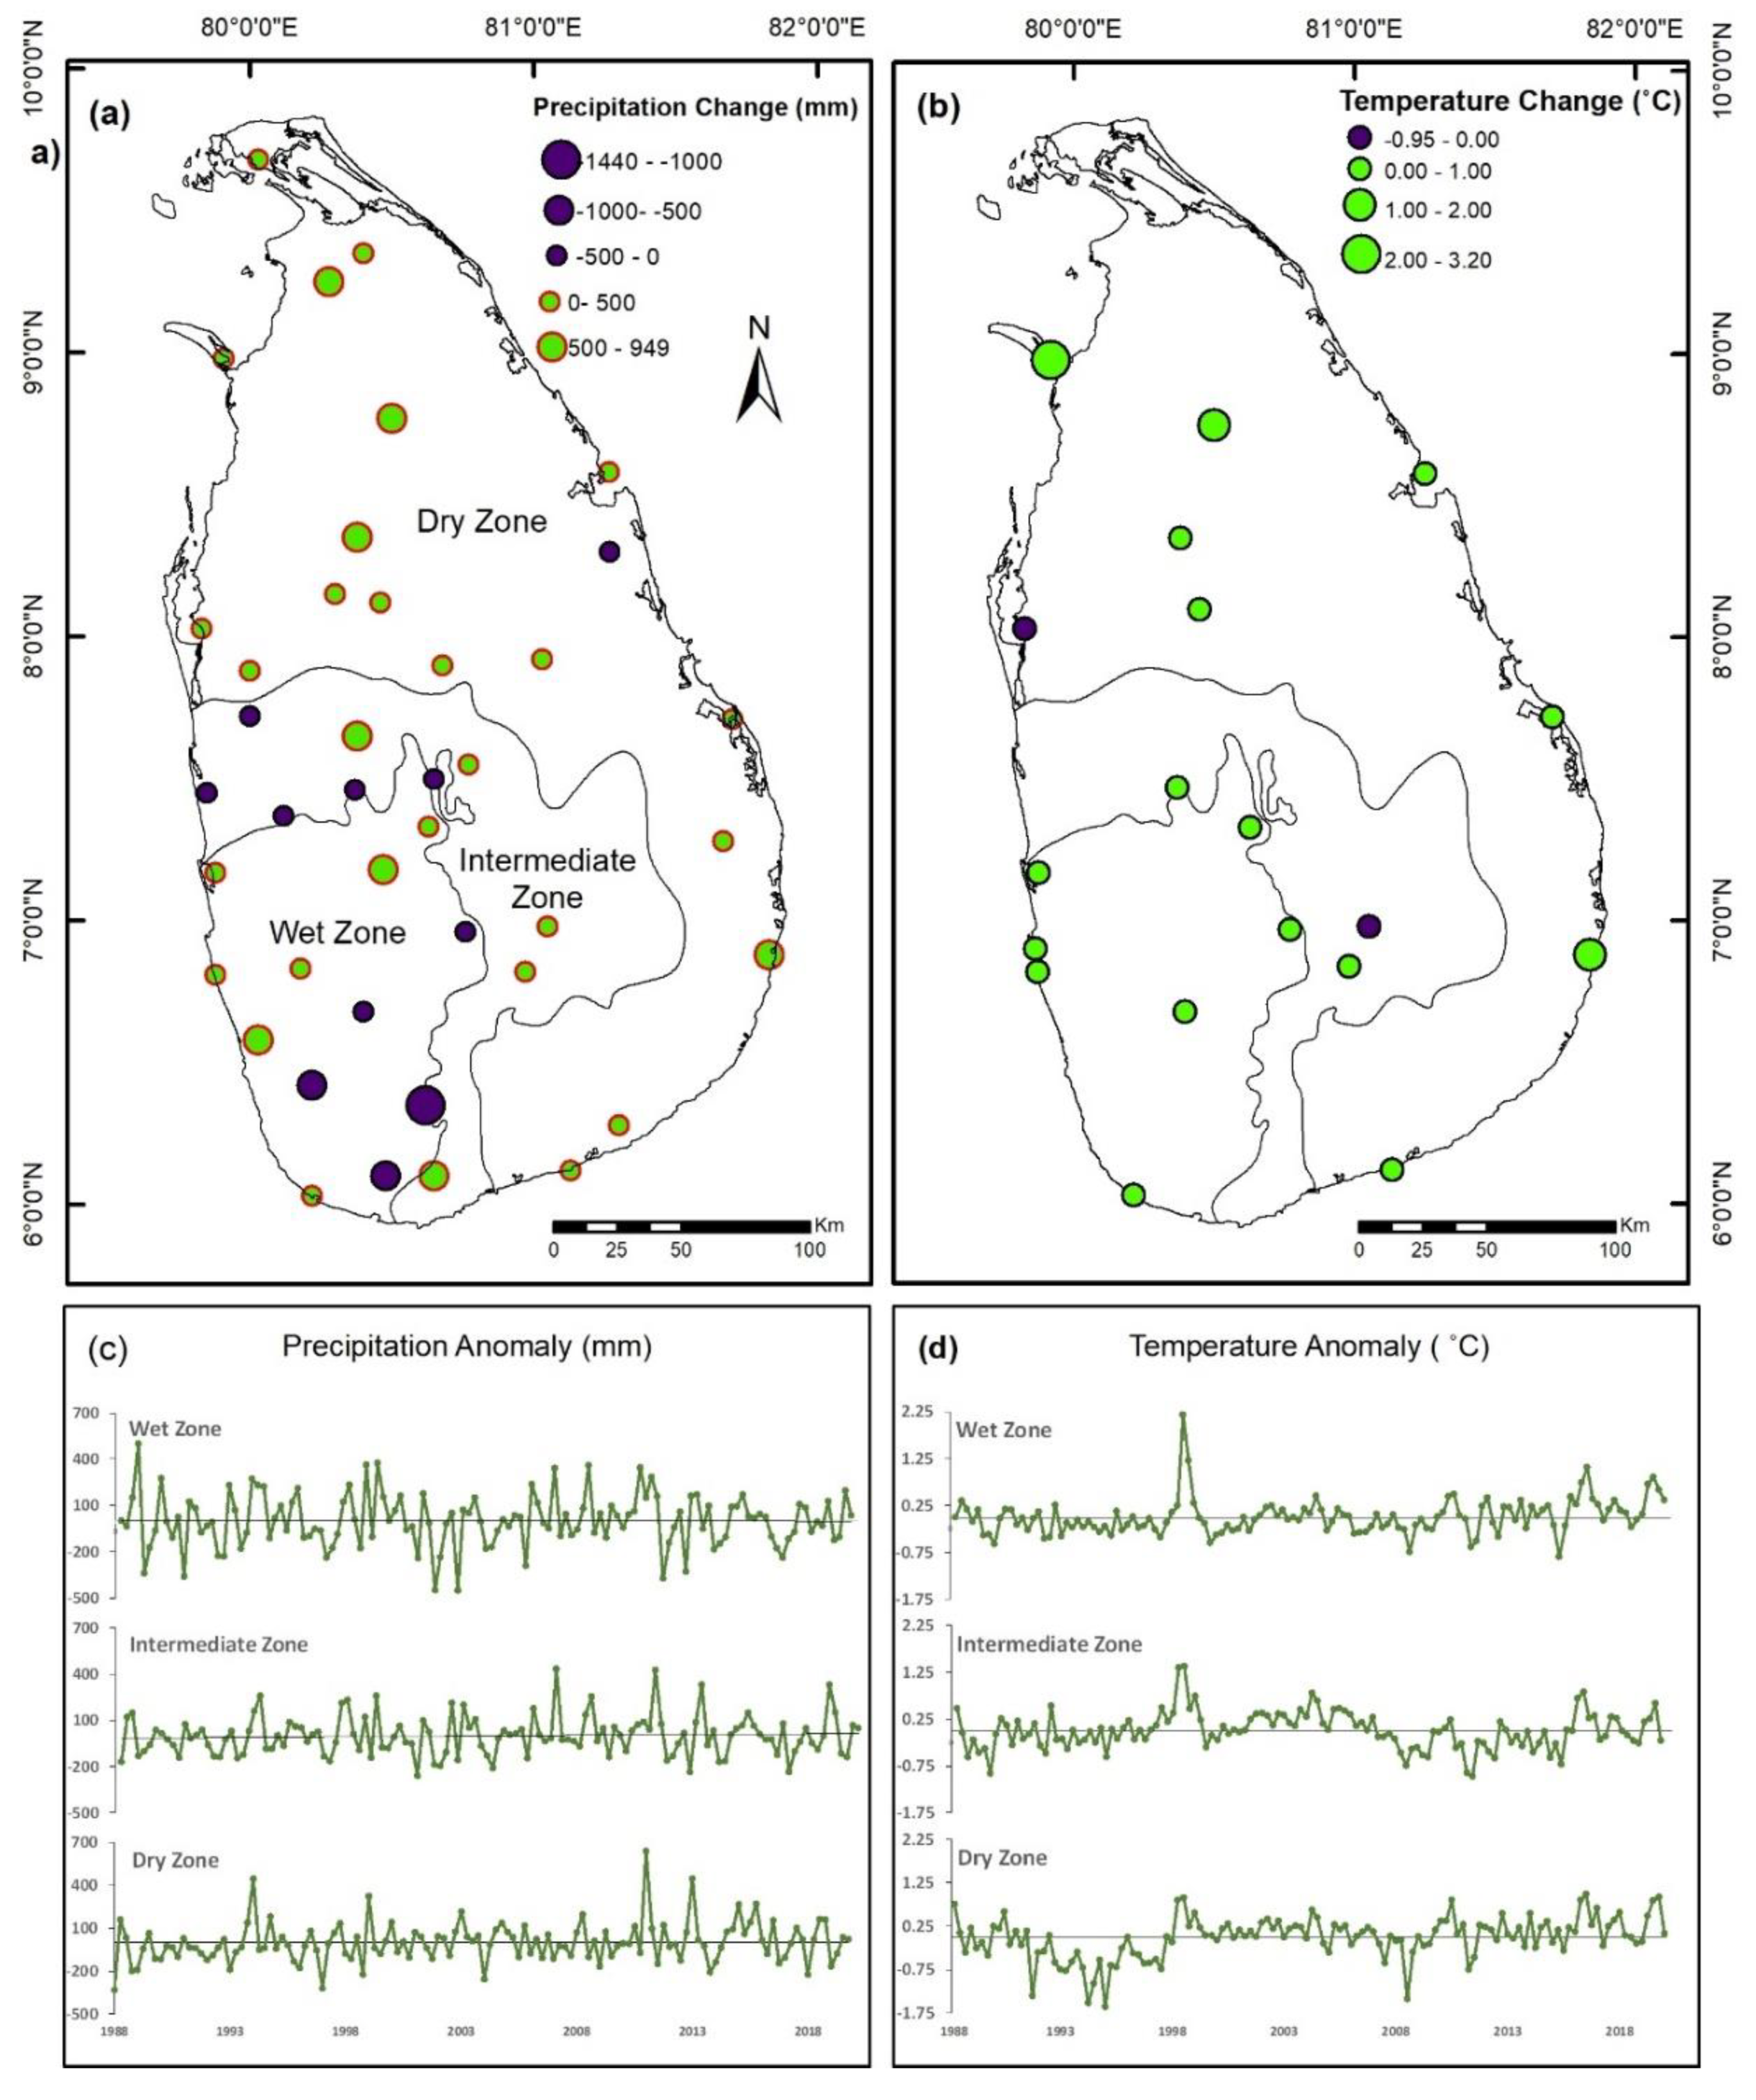
Precipitation and precipitation-induced runoff are the primary sources for the increment of surface water in Sri Lanka. Precipitation has shown vast spatiotemporal variation across the country over the past 32 years (Figure 14a). Generally, precipitation varied considerably without indicating a clear trend (Figure 14c). However, detailed quantification is difficult due to the limited rainfall observational stations around the main water bodies during the study period. Simple linear regressions were used to calculate the precipitation (temperature) change by its tendency rate, P = ay + b, where, a is the slope, b is the intercept, y is the year from 1988 to 2019, and P is the estimated precipitation (temperature). We found that temperature was one of the influencing factors for the surface water area decrease in Sri Lanka. This relationship was likely due to the distribution of the numerous small shallow water features across the island. Overall, faster warming trends in temperature were found in Sri Lanka with regional disparities (Figure 14c). Furthermore, agricultural and human activities also have an impact on water changes. Water demand on agricultural irrigation (mainly for paddy cultivation) is very high in the Dry and Intermediate zones [14,15,19]. Usually, these sectors use water directly or diverting from permanent water bodies, consequently having a more direct influence on their variation. These anthropogenic activities have shown intensification in these zones over recent decades (Figure 12) with increasing water requirement for paddy cultivation [14]. Here, we assessed the effects of these climatic and anthropogenic drivers on surface water change.
A vast amount of small shallow water features are distributed across the Dry zone, which revealed significant patterns in the water. The temperature has shown warming trend in this zone, remarkably in the northwest, southeast, and northcentral regions, during the entire study period (Figure 14b). Higher temperature may increase evaporation and, agricultural and domestic water withdrawals. The moderate inverse correlation between increased STA and water area shows the effect of increased temperature on water area declination. In contrast, precipitation moderately contributes to the fast expansion of the water area. The overall increasing trend of precipitation suggested that there were more probabilities for the transformation from non-water to seasonal or permanent water. As a consequence, both seasonal and permanent water have increased at rapid rates, with the resultant seasonal water bodies of nearly 50%. Recent studies have confirmed that there was significant rising in the frequency and the magnitude of extreme precipitation events across the island [9,10,16] which caused an intensified increment of short-term seasonal water (less than five months) since 2014 (Figure 5b). Climatic seasons are causing great fluctuation of the permanent and seasonal water areas in this zone. During the MJJAS, permanent water has dropped lower than the seasonal water. Further, this variability is clearly illustrated by the temporal variations of Senanayake and Padaviya reservoirs. The Dry zone is the top agricultural producing zone, where major paddy cultivation areas are located. Surface water withdrawals play a primary role in irrigated cultivation, livestock production, and domestic water supply and 96% was mainly utilized for paddy cultivation [14]. Irrigated paddy area increased from 5700 km2 in 1995 to 7980 km2 (76.66% of total paddy area) in 2018 [15,49], while most are situated in this zone. As shown in Figure 12c, the highest correlation found in this zone indicated the strong human influence on water area change and increasing demand for water.
The intermediate zone has shown an overall increasing trend in precipitation (Figure 14a), but with regional disparities. The water area was moderately consistent with the time-series changing patterns of precipitation (Figure 10b). However, the influence of temperature on water change cannot be ignored during warmer periods. Paddy and other intensive agricultural activities have resulted in strong correlations with water during the last three decades.
The Wet zone mostly contains large and deep reservoirs. The total water area in this zone showed insignificant inter- and intra-annual changing patterns during the last decade. Similarly, seasonal water has almost remained constant. This zone has shown a minimal overall decreasing trend in precipitation with regional disparities (Figure 14a). However, the areas with large water bodies in this zone had a positive trend. Overall, precipitation variation was one of the reliable drivers of surface water change. Notable decline in water area was observed with the severely decreased precipitation in the year 2001. Warmer climate with increased temperature imposed a negative effect on water area, which is similar to the Dry zone. Water consumption for irrigational activities is lesser compared to other zones.
Overall, all these results illustrate that climatic factors were moderate drivers of intra- and interannual dynamics of surface water area in Sri Lanka. Due to the influence of some other factors on surface water area change, lower correlations are possible between surface water area and studied climatic variables. Our results revealed that correlation between water area and annual precipitation in all zones decreased during the last decade. Intensified anthropogenic activities in these zones may lead to this situation. The surface water area was subject to a substantial increment due to the construction of several large reservoirs during the last 10 years. For instance, Deduruoya (46 km2 in 2014) and Moragahakanda (47 km2 during 2017–2018,) reservoirs in the Intermediate zone, Upper Kothmale reservoir (6 km2 during 2013–2014) in the Wet zone. and Rambakenoya reservoir (22 km2 during 2011–2013) in the Dry zone contributed to a notable expansion of permanent water in Sri Lanka [50]. Other than this, along with these new irrigation systems and hydropower dams, increased settlements, development of agricultural schemes, and systematic upgrade of agricultural processes, such as Sri Lanka Agriculture Sector Modernization Project, expanded export agriculture, diversification into more commercial crops resulted in extensive consumption of water. The recent steady increment in the agricultural GDP also demonstrated these influences (Figure 12). Other than this, our study revealed an extensive annual cloud cover of 35.23%, 25.58%, and 21.0% in Wet, Intermediate, and Dry zones, respectively. Due to this ample amount of cloud, underestimation of surface water area and its relationship with proximal drivers is also possible. Further, intense land-use changes over the last two decades was noted by a recent study, which may also influence surface water variations [51]. However, quantifying these influences are challenged with the lack of time-series data in regional scales.
Resultant statistically significant increasing trends (low p-values) of surface water areas with low R value, indicate that water variability was not steady enough to fit into a linear model. Therefore, water availability in Sri Lanka was highly varying. These trends are likely to continue in the future assuming the intensified human activities and abrupt climate change [50], with the climate change scenarios predicting wetter conditions for the areas with increasing water availability.

4.2. Limitations and Future Improvements

High incidences of clouds present a major challenge in tropical regions [28]. Cloud coverage is abundant at an annual average of nearly 25%, around Sri Lanka throughout the year and exerts a great restriction on the availability of clear observation area and imageries. Uncertainties are probable in the observed temporal trends due to the spatial and temporal bias of cloud and the low number of imageries. However, with the movement of cloud over time, the temporal behavior of water can be captured by the time-series imageries. However, water is more likely to be underestimated due to the discontinuity caused by recurrent cloud cover during rainy periods. Due to the gaps in the data archive, short term seasonal water may also be undervalued. Landsat data is more appropriate to be used in the MJJAS season when clouds are few and less frequent. Surface water covered by free-floating, floating-leaved, submerged and standing vegetation, and obscured by man-made features were excluded in this study. Furthermore, water bodies, which are less than one pixel in extent, were also not counted in.
The results suggest the need for understanding the multiple temporal dynamics of small seasonal water bodies due to their rapid increment, which are also very likely to be impacted by the frequent events of drought or flood (specifically with the extreme daily precipitation events) due to climate change. The combined usage of Landsat and recently launched satellites, such as Sentinel, with higher temporal and spatial resolutions together with microwave data, can enhance the weekly mapping and monitoring process of dynamic variabilities in future studies. Further study is needed to evaluate how external climate changing factors, such as El-Nino, relate to the surface water availability and spatial variations.

4.3. Water Management Implications

The Dry zone showed comparatively more variations in surface water dynamics, while other zones have relatively stable permanent water throughout the year. However, the total amount of available water (nearly equal amount of permanent and seasonal water) in the Dry zone remains highly unstable among the seasons. Surface water is mainly used for irrigational and anthropogenic activities in this zone [36]. The trends of increasing agricultural economic activities escalate the irrigational water demand. However, the permanent water in this zone reduced sharply by about 30% during MJJAS, which is one of the major rice cultivation seasons in Sri Lanka. This reduction causes regular periodical drought due to the limitations in withdrawal. Loss of reservoir storage capacity due to sedimentation, lack of storage extension, a large number of abandoned water bodies, poor water management and inefficient usage, deficiencies in government policy, population increment, deforestation, have been mentioned as reasons for the water insufficiency in this zone [49,52]. Furthermore, prolonged droughts due to extreme climatic events may also worsen the condition.
Necessary actions need to be taken to manage these scarce waterbodies, conserve their invaluable ecosystem services and aquatic species, and ensure adequate water supply during dry periods for all sectors. Removal of deposited sediments, increment of reservoir capacity, rehabilitation of abandoned water bodies, conservation of catchment areas, reforestation, proper coordination among water management authorities, and adaptation of strategic water policies can improve these situations. Implementation of a national strategic water management policy is desperately needed, which is currently not available and potentially threatens the water sustainability. Future policies shall need to consider the spatiotemporal dynamics and impact of proximal drivers for the mitigation of periodical water scarcities and efficient usage. Our findings on water dynamics are valuable for the natural resource planners and managers in Sri Lanka.

5. Conclusions

This study revealed a comprehensive visualization of the spatiotemporal dynamics of water bodies in Sri Lanka over three decades (1988–2019). We used time-series of Landsat TM and OLI imageries to quantify the surface water extent, distribution, and variability over seasons and years, across the climatic zones (Dry, Intermediate, and Wet), and the effects of climate and anthropogenic factors.
The findings of this study can be summarized as follows:
  • A total of 1607.73 km2 of the island is covered by permanent water (54.86%) and seasonal water (45.14%) with uneven spatial distributions: Dry zone (83.77%), Intermediate zone (12.46%), and Wet zone (3.77%).
  • Overall, the seasonal water area showed a faster annual growth rate (7.06 ± 1.97 km2) together with permanent water (4.47 ± 2.08 km2) across the country.
  • Sri Lanka showed the highest and the lowest amount of water areas during the DJF and MJJAS seasons.
  • Precipitation and agricultural GDP indicated positive effects on surface water, while temperature showed a negative impact.

Author Contributions

Conceptualization, D.S. and B.Z.; methodology, D.S. and F.Z.; formal analysis, D.S.; writing—original draft preparation, D.S.; writing—review and editing, D.S., F.Z., S.E., S.W., J.L. All authors have read and agreed to the published version of the manuscript.

Funding

This research was funded by the Strategic Priority Research Program of the Chinese Academy of Sciences, grant number XDA19080304, Science and Technology Service Network Initiative, Chinese Academy of Sciences, grant number KFJ-STS-ZDTP-077, Major Projects of High-resolution Earth Observation System, grant number 04-Y30B01-9001-18/20, and National Natural Science Foundation of China, grant number 41701402, 41971318, and 41671203.

Acknowledgments

The authors are grateful to the U.S. Geological Survey (USGS) for providing the Landsat data. The first author gratefully acknowledges the CAS-TWAS President Fellowship program for the support during the study. We would like to thank the reviewers for their helpful and constructive comments, which have improved the paper.

Conflicts of Interest

The authors declare no conflict of interest.

References

  1. Pekel, J.F.; Cottam, A.; Gorelick, N.; Belward, A.S. High-resolution mapping of global surface water and its long-term changes. Nature 2016, 540, 418–422. [Google Scholar] [CrossRef] [PubMed]
  2. Zou, Z.; Dong, J.; Menarguez, M.A.; Xiao, X.; Qin, Y.; Doughty, R.B.; Hooker, K.V.; David Hambright, K. Continued decrease of open surface water body area in Oklahoma during 1984–2015. Sci. Total Environ. 2017, 595, 451–460. [Google Scholar] [CrossRef] [PubMed]
  3. Tulbure, M.G.; Broich, M. Spatiotemporal patterns and effects of climate and land use on surface water extent dynamics in a dryland region with three decades of Landsat satellite data. Sci. Total Environ. 2019, 658, 1574–1585. [Google Scholar] [CrossRef] [PubMed]
  4. Keller, A.; Sakthivadivel, R.; Seckler, D. Water scarcity and the role of storage in development. Int. Water Manag. Inst. 2000, 39, 1–24. [Google Scholar] [CrossRef]
  5. Amarasinghe, U.A.; Mutuwatta, L.; Sakthivadivel, R. Water Scarcity Variations within a Country: A Case Study of Sri Lanka; Research Report; International Water Management Institute (IWMI): Colombo, Sri Lanka, 1999; Volume 32. [Google Scholar] [CrossRef]
  6. Bandara, K.M.P. Monitoring irrigation performance in Sri Lanka with high-frequency satellite measurements during the dry season. Agric. Water Manag. 2003, 58, 159–170. [Google Scholar] [CrossRef]
  7. Department of Meteorology, Sri Lanka. Available online: http://www.meteo.gov.lk (accessed on 21 February 2020).
  8. Naveendrakumar, G.; Vithanage, M.; Kwon, H.-H.; Chandrasekara, S.S.K.; Iqbal, M.C.M.; Pathmarajah, S.; Fernando, W.C.D.K.; Obeysekera, J. South Asian perspective on temperature and rainfall extremes: A review. Atmos. Res. 2019, 225, 110–120. [Google Scholar] [CrossRef]
  9. Hemachandra, E.M.G.P.; Dayawansa, N.D.K.; De Silva, R.P. Developing a Composite Map of Vulnerability to Rainfall Extremes in Sri Lanka. In Water, Flood Management and Water Security under a Changing Climate; Springer International Publishing: Cham, Switzerland, 2020; pp. 63–84. [Google Scholar]
  10. Eckstein, D.; Hutfils, M.; Winges, M. Global Climate Risk Index 2019; Germanwatch: Bonn, Germany, 2018; ISBN 9783943704709. [Google Scholar]
  11. Bastiaanssen, W.G.M.; Chandrapala, L. Water balance variability across Sri Lanka for assessing agricultural and environmental water use. Agric. Water Manag. 2003, 58, 171–192. [Google Scholar] [CrossRef]
  12. Malmgren, B.A.; Hulugalla, R.; Hayashi, Y.; Mikami, T. Precipitation trends in Sri Lanka since the 1870s and relationships to El Niño-southern oscillation. Int. J. Climatol. 2003, 23, 1235–1252. [Google Scholar] [CrossRef]
  13. Wickramagamage, P. Seasonality and spatial pattern of rainfall of Sri Lanka: Exploratory factor analysis. Int. J. Climatol. 2010, 30, 1235–1245. [Google Scholar] [CrossRef]
  14. De Silva, C.S.; Weatherhead, E.K.; Knox, J.W.; Rodriguez-Diaz, J.A. Predicting the impacts of climate change—A case study of paddy irrigation water requirements in Sri Lanka. Agric. Water Manag. 2007, 93, 19–29. [Google Scholar] [CrossRef]
  15. Burchfield, E.K.; Gilligan, J. Agricultural adaptation to drought in the Sri Lankan dry zone. Appl. Geogr. 2016, 77, 92–100. [Google Scholar] [CrossRef] [Green Version]
  16. Abeysekera, A.B.; Punyawardena, B.V.R.; Premalal, K.H.M.S. Recent trends of extreme positive rainfall anomalies in the dry zone of Sri Lanka. Trop. Agric. 2015, 163, 1–23. [Google Scholar]
  17. Burt, T.; Weerasinghe, K. Rainfall Distributions in Sri Lanka in Time and Space: An Analysis Based on Daily Rainfall Data. Climate 2014, 2, 242–263. [Google Scholar] [CrossRef] [Green Version]
  18. Shah, T.; Samad, M.; Ariyaratne, R.; Jinapala, K. Ancient Small-Tank Irrigation in Sri Lanka Continuity and Change. Econ. Polit. Wkly. 2013, 58, 58–65. [Google Scholar]
  19. Köpke, S.; Withanachchi, S.S.; Pathiranage, R.; Withanachchi, C.R.; Ploeger, A. Social—Ecological dynamics in irrigated agriculture in dry zone Sri Lanka: A political ecology. Sustain. Water Resour. Manag. 2019, 5, 629–637. [Google Scholar] [CrossRef]
  20. Prigent, C.; Papa, F.; Aires, F.; Jimenez, C.; Rossow, W.B.; Matthews, E. Changes in land surface water dynamics since the 1990s and relation to population pressure. Geophys. Res. Lett. 2012, 39, 1–5. [Google Scholar] [CrossRef] [Green Version]
  21. Mueller, N.; Lewis, A.; Roberts, D.; Ring, S.; Melrose, R.; Sixsmith, J.; Lymburner, L.; McIntyre, A.; Tan, P.; Curnow, S.; et al. Water observations from space: Mapping surface water from 25years of Landsat imagery across Australia. Remote Sens. Environ. 2016. [Google Scholar] [CrossRef] [Green Version]
  22. Heimhuber, V.; Tulbure, M.G.; Broich, M. Addressing spatio-temporal resolution constraints in Landsat and MODIS-based mapping of large-scale floodplain inundation dynamics. Remote Sens. Environ. 2018, 211, 307–320. [Google Scholar] [CrossRef]
  23. Deng, Y.; Jiang, W.; Tang, Z.; Li, J.; Lv, J.; Chen, Z.; Jia, K. Spatio-Temporal Change of Lake Water Extent in Wuhan Urban Agglomeration Based on Landsat Images from 1987 to 2015. Remote Sens. 2017, 9, 270. [Google Scholar] [CrossRef] [Green Version]
  24. Che, X.; Feng, M.; Sexton, J.; Channan, S.; Sun, Q.; Ying, Q.; Liu, J.; Wang, Y. Landsat-Based Estimation of Seasonal Water Cover and Change in Arid and Semi-Arid Central Asia (2000–2015). Remote Sens. 2019, 11, 1323. [Google Scholar] [CrossRef] [Green Version]
  25. Tulbure, M.G.; Broich, M. Spatiotemporal dynamic of surface water bodies using Landsat time-series data from 1999 to 2011. ISPRS J. Photogramm. Remote Sens. 2013, 79, 44–52. [Google Scholar] [CrossRef]
  26. Tulbure, M.G.; Broich, M.; Stehman, S.V. Spatiotemporal dynamics of surface water extent from three decades of seasonally continuous landsat time series at subcontinental scale. ISPRS Int. Arch. Photogramm. Remote Sens. Spat. Inf. Sci. 2016, XLI-B8, 403–404. [Google Scholar] [CrossRef]
  27. Wang, Y.; Ma, J.; Xiao, X.; Wang, X.; Dai, S.; Zhao, B. Long-Term Dynamic of Poyang Lake Surface Water: A Mapping Work Based on the Google Earth Engine Cloud Platform. Remote Sens. 2019, 11, 313. [Google Scholar] [CrossRef] [Green Version]
  28. Souza, C.; Kirchhoff, F.; Oliveira, B.; Ribeiro, J.; Sales, M. Long-Term Annual Surface Water Change in the Brazilian Amazon Biome: Potential Links with Deforestation, Infrastructure Development and Climate Change. Water 2019, 11, 566. [Google Scholar] [CrossRef] [Green Version]
  29. Wang, M.; Du, L.; Ke, Y.; Huang, M.; Zhang, J.; Zhao, Y.; Li, X.; Gong, H.; Wang, M.; Du, L.; et al. Impact of Climate Variabilities and Human Activities on Surface Water Extents in Reservoirs of Yongding River Basin, China, from 1985 to 2016 Based on Landsat Observations and Time Series Analysis. Remote Sens. 2019, 11, 560. [Google Scholar] [CrossRef] [Green Version]
  30. Feng, M.; Sexton, J.O.; Channan, S.; Townshend, J.R. A global, high-resolution (30-m) inland water body dataset for 2000: First results of a topographic–spectral classification algorithm. Int. J. Digit. Earth 2016, 9, 113–133. [Google Scholar] [CrossRef] [Green Version]
  31. Zou, Z.; Xiao, X.; Dong, J.; Qin, Y.; Doughty, R.B.; Menarguez, M.A.; Zhang, G.; Wang, J. Divergent trends of open-surface water body area in the contiguous United States from 1984 to 2016. Proc. Natl. Acad. Sci. USA 2018, 115, 3810–3815. [Google Scholar] [CrossRef] [Green Version]
  32. Deng, Y.; Jiang, W.; Tang, Z.; Ling, Z.; Wu, Z. Long-Term Changes of Open-Surface Water Bodies in the Yangtze River Basin Based on the Google Earth Engine Cloud Platform. Remote Sens. 2019, 11, 2213. [Google Scholar] [CrossRef] [Green Version]
  33. Pickens, A.H.; Hansen, M.C.; Hancher, M.; Stehman, S.V.; Tyukavina, A.; Potapov, P.; Marroquin, B.; Sherani, Z. Mapping and sampling to characterize global inland water dynamics from 1999 to 2018 with full Landsat time-series. Remote Sens. Environ. 2020, 243, 111792. [Google Scholar] [CrossRef]
  34. Tulbure, M.G.; Broich, M.; Stehman, S.V.; Kommareddy, A. Surface water extent dynamics from three decades of seasonally continuous Landsat time series at subcontinental scale in a semi-arid region. Remote Sens. Environ. 2016, 178, 142–157. [Google Scholar] [CrossRef]
  35. Atapattu, S.; Wickremasinghe, C.S. Sri Lanka’s Gal Oya National Park: Aspects and prospects. Biol. Conserv. 1974, 6, 219–222. [Google Scholar] [CrossRef]
  36. Central bank of Sri Lanka. Available online: https://www.cbsl.gov.lk (accessed on 3 January 2020).
  37. Kohonen, T. Improved versions of learning vector quantization. In Proceedings of the 1990 IJCNN International Joint Conference on Neural Networks, San Diego, CA, USA, 17–21 June 1990; IEEE: New York, NY, USA, 1990; Volume 1, pp. 545–550. [Google Scholar]
  38. Wang, Z.; Nasrabadi, N.M.; Huang, T.S. Spatial–Spectral Classification of Hyperspectral Images Using Discriminative Dictionary Designed by Learning Vector Quantization. IEEE Trans. Geosci. Remote Sens. 2014, 52, 4808–4822. [Google Scholar] [CrossRef]
  39. Somasundaram, D.; Zhang, F.; Wang, S.; Ye, H.; Zhang, Z.; Zhang, B. Learning vector quantization neural network for surface water extraction from Landsat OLI images. J. Appl. Remote Sens. 2020, 14, 1. [Google Scholar] [CrossRef] [Green Version]
  40. Zhang, G.; Yao, T.; Chen, W.; Zheng, G.; Shum, C.K.; Yang, K.; Piao, S.; Sheng, Y.; Yi, S.; Li, J.; et al. Regional differences of lake evolution across China during 1960s–2015 and its natural and anthropogenic causes. Remote Sens. Environ. 2019, 221, 386–404. [Google Scholar] [CrossRef]
  41. Murat, M.; Malinowska, I.; Hoffmann, H.; Baranowski, P. Statistical modelling of agrometeorological time series by exponential smoothing. Int. Agrophys. 2016, 30, 57–65. [Google Scholar] [CrossRef] [Green Version]
  42. Lamb, P.J. Persistence of Subsaharan drought. Nature 1982, 299, 46–48. [Google Scholar] [CrossRef]
  43. Naveendrakumar, G.; Vithanage, M.; Kwon, H.; Iqbal, M.C.M.; Pathmarajah, S.; Obeysekera, J. Five Decadal Trends in Averages and Extremes of Rainfall and Temperature in Sri Lanka. Adv. Meteorol. 2018, 2018, 4217917. [Google Scholar] [CrossRef]
  44. Zubair, L. El Niño-southern oscillation influences on the Mahaweli streamflow in Sri Lanka. Int. J. Climatol. 2003, 23, 91–102. [Google Scholar] [CrossRef] [Green Version]
  45. Marambe, B. Effect of El Niño Southern Oscillation (ENSO) events on inter-seasonal variability of rainfall in Wet and Intermediate zones of Sri Lanka. Trop. Agric. 2019, 167, 14–27. [Google Scholar]
  46. Murray-Rust, H.; Sakthivadivel, R.; Amarasinghe, U.A. Impact Assessment of Organizing Farmers in the Gal Oya Left Bank Irrigation Scheme, Sri Lanka. Int. J. Water Resour. Dev. 1999, 15, 197–217. [Google Scholar] [CrossRef]
  47. Department of Irrigation. Available online: https://www.irrigation.gov.lk/ (accessed on 27 April 2020).
  48. Ministry of Agriculture, Irrigation, and Mahaweli Development of Sri Lanka. Sri Lanka National Water Development Report; Imbulana, K., Wijesekera, N.T.S., Neupane, B.R., Eds.; UNESDOC: Paris, France, 2006. [Google Scholar]
  49. Food and Agriculture Organization of the United Nations. Available online: http://www.fao.org/home/en/ (accessed on 27 May 2020).
  50. Stocker, T.F.; Qin, D.; Plattner, G.K.; Tignor, M.; Allen, S.K.; Boschung, J.; Nauels, A.; Xia, Y.; Bex, V.; Midgley, P.M. (Eds.) IPCC, 2013: Climate Change 2013: The Physical Science Basis; IPCC: Geneva, Switzerland, 2013; Volume 1535. [Google Scholar]
  51. Rathnayake, C.W.M.; Jones, S.; Soto-Berelov, M. Mapping Land Cover Change over a 25-Year Period (1993–2018) in Sri Lanka Using Landsat Time-Series. Land 2020, 9, 27. [Google Scholar] [CrossRef] [Green Version]
  52. Dharmasena, P.B. Magnitude of sedimentation in Village tanks. Trop. Agric. 1992, 148, 97–110. [Google Scholar]
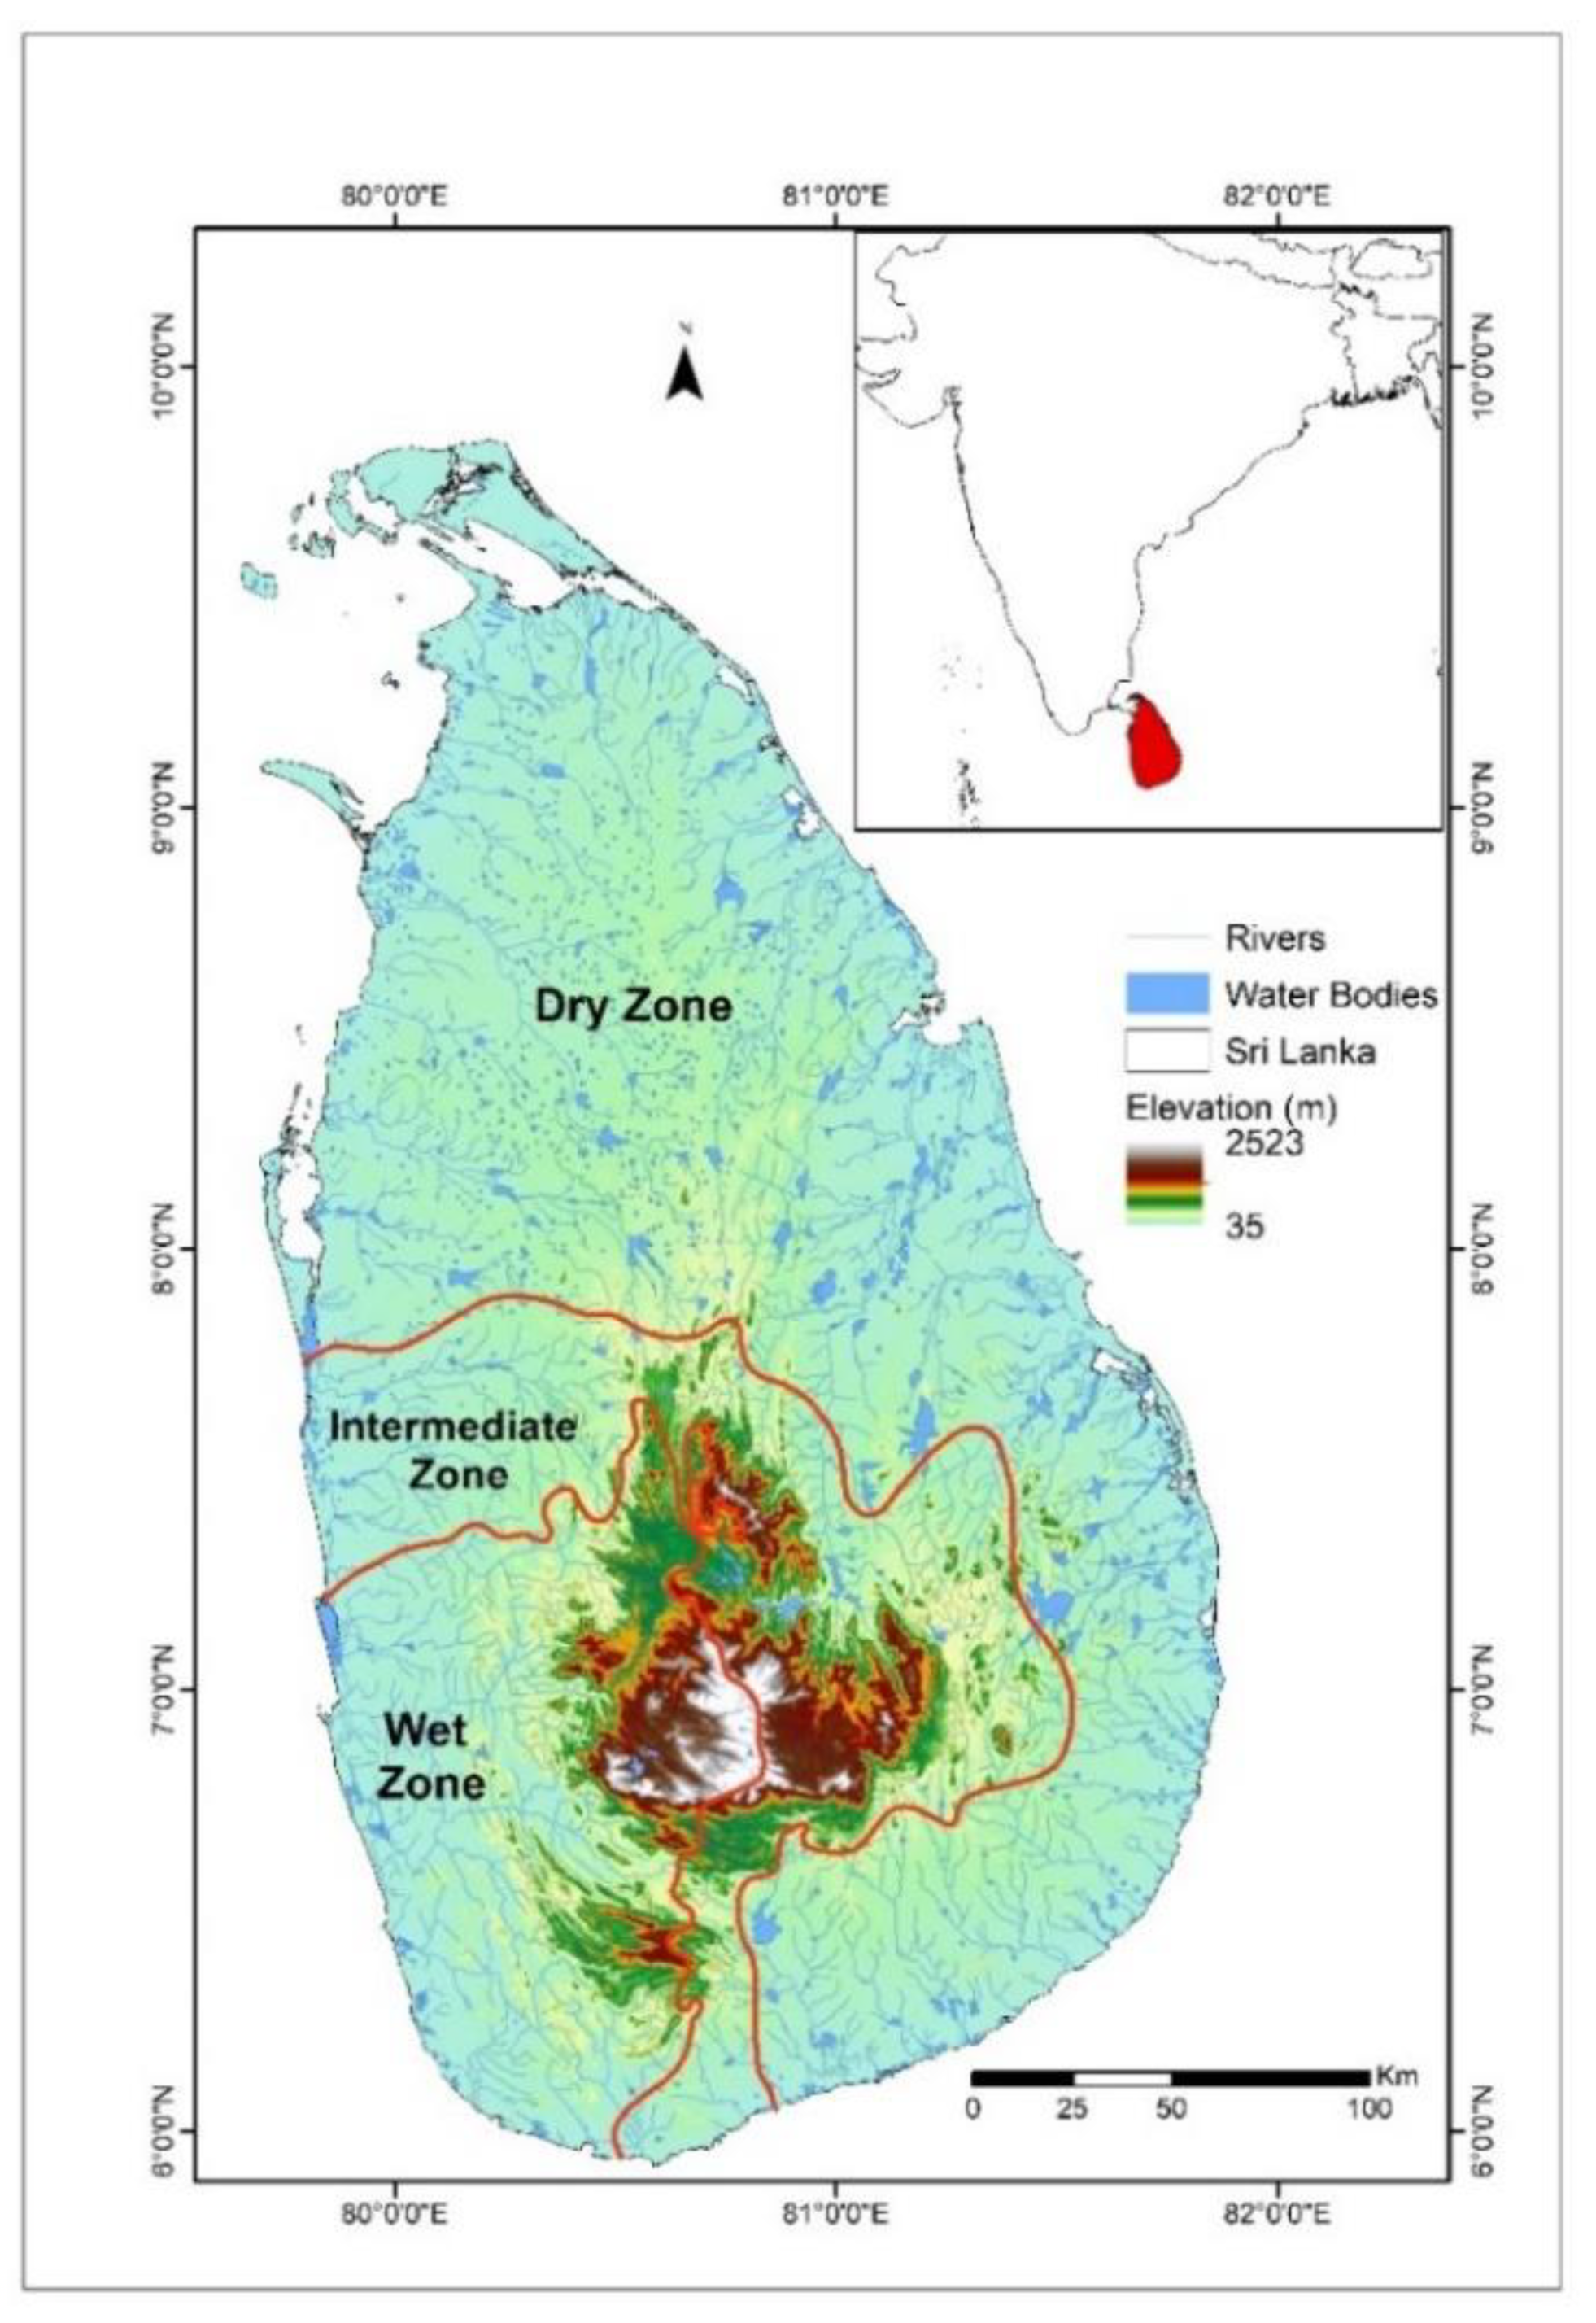
Figure 1. The location of the study area.
Remotesensing 12 03701 g001
Figure 2. Flowchart of the applied methodology in this study.
Remotesensing 12 03701 g002
Figure 3. Water occurrence frequencies in Sri Lanka for the whole time-series (December 1987–November 2019), its zoom-in views, and maximum water profile with 1 km North/East.
Remotesensing 12 03701 g003
Figure 4. Cumulative water area of all pixels in Sri Lanka with various water occurrence frequency thresholds of the year ≥10%, ≥40%, ≥60%, and ≥80%, respectively.
Remotesensing 12 03701 g004
Figure 5. Inter annual variations of surface water area in Sri Lanka. (a) Entire country, and different climatic zones: (b) Dry zone, (c) Wet zone, and (d) Intermediate zone during 1988–2019.
Remotesensing 12 03701 g005
Figure 6. Intra-annual water occurrence frequencies (WOF) in Sri Lanka for the whole time-series (1988–2019).
Remotesensing 12 03701 g006
Figure 7. The seasonal variations of surface water area in Sri Lanka. (a) Entire country and different climatic zones: (b) Dry zone, (c) Wet zone, and (d) Intermediate zone from 1988 to 2019.
Remotesensing 12 03701 g007
Figure 8. The variations of water area during different seasons in Sri Lanka. During (a) DJF, (b) MA, (c) MJJAS, and (d) ON.
Remotesensing 12 03701 g008
Figure 9. Surface water area per season per year with no data per season per year for (a) Dry, (b) Wet, and (c) Intermediate zones.
Remotesensing 12 03701 g009aRemotesensing 12 03701 g009b
Figure 10. Time-series of annual surface water area and annual cumulative precipitation in different zones: (a) Wet zone, (b) Intermediate zone, and (c) Dry zone.
Remotesensing 12 03701 g010
Figure 11. Time-series of seasonal standardized temperature anomaly index and water area and in different zones: (a) Wet zone, (b) Intermediate zone, and (c) Dry zone.
Remotesensing 12 03701 g011
Figure 12. Time-series of annual average water area and GDP (Agriculture) in different zones: (a) Wet zone, (b) Intermediate zone, and (c) Dry zone.
Remotesensing 12 03701 g012
Figure 13. Variations in the spatial water extent of Senanayake Samudra and Padaviya reservoirs from 1988 to 2019. (a) Seasonal water extent of Senanayake Samudra as mapped by our LVQ model, displayed over Landsat 5 TM imagery (bands 7, 4, 2 as RGB) and Landsat 8 OLI imagery (bands 7, 5, 3 as RGB). (b) Variations in the area of Senanayake Samudra reservoir with all available good-quality observations. (c) Seasonal water extent of Padaviya as mapped by our LVQ model, displayed over Landsat 5 TM imagery (bands 7, 4, 2 as RGB) and Landsat 8 OLI imagery (bands 7, 5, 3 as RGB).
Remotesensing 12 03701 g013
Figure 14. Primary drivers for surface water dynamics between 1988 and 2019. (a) Changes in precipitation from meteorological stations, (b) changes in temperature from meteorological stations. A linear regression model evaluated the magnitude of changes, (c) time-series seasonal anomalies of precipitation, and (d) time-series seasonal anomalies of temperature.
Remotesensing 12 03701 g014
Table 1. The number of Landsat Thematic Mapper (TM) and Operational Land Imager (OLI) images used per path/row in this study.
SensorPath/RowTotal
140/55140/56141/53141/54141/55141/56142/53142/54142/55
TM (1987–2011)1431081671621561171401501181261
OLI (2013–2019)106106981279992106116104954
Total2492142652892552092462662222215
Table 2. The error matrix of TM and OLI water classification.
Landsat 5 TM (Number of Samples = 6801)Landsat 8 OLI (Number of Samples = 11,523)
Map Map
WaterNo-WaterTotalProducer’s AccuracyWaterNo-WaterTotalProducer’s Accuracy
ReferenceWater499350299.40ReferenceWater405641198.54
No-water46295629999.94No-water411,10811,11299.96
Total50362986801 Total40911,11411,523
User’s accuracy99.2099.95 99.90User’s accuracy99.0299.95 99.93
Table 3. Spatial distribution of water in climatic zones of Sri Lanka during the entire time-series (1988–2019).
ZoneSurface Water of Sri Lanka (km2)
Seasonal (WOF%)Permanent (WOF%)Total
10–2020–4040–6060–8080–100
Dry161.61191.35152.75128.62712.461346.78
Intermediate13.6821.3517.9720.69126.65200.33
Wet3.326.034.603.7542.9060.62
Total178.61218.73175.32153.06882.011607.73
Publisher’s Note: MDPI stays neutral with regard to jurisdictional claims in published maps and institutional affiliations.