Abstract
The main objective of this study is to develop a Hapke photometric model that is suited for Chang’E-1 (CE-1) Interference Imaging Spectrometer (IIM) data. We first divided the moon into three areas including ‘maria’, ‘new highland’ and old ‘highland’ with similar photometry characteristic based on the Hapke parameters of the moon derived from Lunar Reconnaissance Orbiter Camera (LROC) Wide Angle Camera (WAC) multispectral data. Then, we selected the sample data in the ‘maria’ area and obtained a new set of Hapke model’s parameters that can best fit these data. Result shows that photometric correction using Hapke model with these new derived parameters can eliminate the effect of variations in viewing and luminating geometry, especially ‘opposition surge’, more efficiently than the empirical model. The corrected mosaic shows no significant artifacts along the tile boundaries and more detailed information of the image can be exhibited due to a better correction of ‘opposition surge’ at small phase angle (g < 15°).
1. Introduction
Visible and infrared spectroscopy is sensitive to the mineralogy of the Moon. Abundance of these minerals can be estimated according to their hyperspectral reflectance data and characteristic absorption features. However, most of the spectrometers used in the remote sensing exploration of the moon are multi-spectral cameras, which only cover the limited range of wavelengths.
At present, the inversion of mineral abundance on the lunar surface mainly depends on ‘band ratio’ [1], which are strongly affected by the extreme differences in the measured spectral reflectance resulting from the variation in viewing geometry of different orbits. The viewing geometry can be defined by three angles: incidence angle i, emission angle e and phase angle g. The viewing geometry varies in different orbits and at different location of the Lunar surface. 2% variation in ratio can lead to 0.6 wt% and 1.7 wt% deviations of FeO content for highland and mare respectively [2,3]. Much details of the image obtained at small phase angle (phase angle < 20°) can be lost because of ‘opposition surge’ effect and obvious brightness difference can be observed at the boundary between two adjacent orbits images.
To eliminate the influence of the viewing geometry, photometric correction should be conducted for CE-1 IIM spectral data. The goal of photometric correction is to empirically correct the reflectance to a standard viewing geometry. The geometry with i = 30°, e = 0° and g = 30° is widely employed as a standard viewing geometry [4], which is also used in this study. Photometric correction has been performed for a variety of spectral and imaging data acquired by different sensors such as Ultraviolet/Visible Camera on Clementine [4], Spectral Profiler (SP) on SELENE [5], Moon Mineralogy Mapper on Chandrayaan-1 (M3) [6], Wide Angle Camera on the Lunar Reconnaissance Orbit (LRO) [7], Interference Imaging Spectrometer on Chang’E-1(CE-1 IIM) [8]. Although the empirical model (Lommel-Seeinger model) was used for the photometric correction of CE-1 IIM, it was found that the correction cannot eliminate the ‘opposition surge’ effect and the brightness difference of images at low latitude completely. There is also no physical interpretation for the parameters of the empirical model. Hapke model has demonstrated its effectiveness in removing the influence of the viewing geometry and ‘opposition surge’ by the laboratory measurements [9] and the work of Sato et al., 2014 [7] and lunar surface physical properties (e.g., roughness, grain size, porosity) can be evaluated from derived parameters of Hapke’s model [9]. However, parameters of Hapke model cannot be fully constrained by CE-1 IIM data due to limited observing geometries.
Determination of Hapke model’s parameters requires photometric observations of the Lunar surfaces for a wide range of incidence, emission and phase angles. The objective of this study is to develop an accurate Hapke model for CE-1 IIM data of the limited observing geometry. To accomplish this goal, we first divided the lunar surface into three areas according to the derived Hapke parameters of the Moon provided by Sato [7] and then analyzed whether each area has approximately the same photometry characteristic. Finally, the data of ‘maria’ area were used to test whether a new set of Hapke model parameters suited for CE-1 IIM data can be accurately derived and whether the photometric correction shows a good performance.
2. Methods
NASA’s Lunar Reconnaissance Orbiter Camera (LROC) Wide Angle Camera (WAC) has achieved multispectral observations of the moon with phase ranging from 0 to 120°. Sato et al., 2014 divided the moon into tiles which is 1° latitude by 1° longitude and derived Hapke photometric parameters for each tile based on the LROC WAC data [7]. In the theory of Hapke model [10,11,12,13,14,15,16,17,18], each Hapke parameter represents a unique photometric character. The photometric character of an area on the Moon can be approximately regarded as the same if all Hapke parameters of this area vary in a small range. Therefore, we divided the Moon surface into three areas base on the Hapke parameters (Table 1) derived by Sato et al., 2014 [7] including ‘maria’, ‘new highland’ and ‘old highland’ (Figure 1).

Table 1.
The range of Hapke model parameters for the three areas.
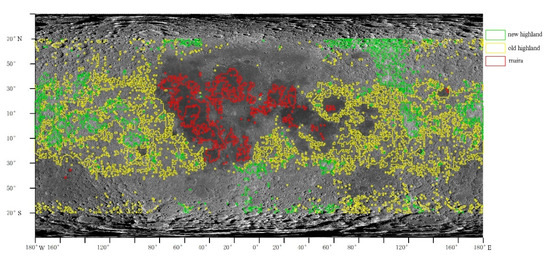
Figure 1.
Three areas we divided: ‘maria’, ‘new highland’ and ‘old highland’ (The different of ‘new highland’ and ‘old highland’ is the maturity of the Lunar soil. The maturity of lunar soil in ‘new highland’ was low while that in ‘old highland’ was high) (base map is global mosaic of the moon by Lunar Reconnaissance Orbit (LRO), resolution is 200/pixel, http://wms.lroc.asu.edu/lroc/view_rdr/WAC_GLOBAL).
3. Data Set
3.1. Sample Data
Chang’E-1 IIM is the first Sagnac-based push-broom imaging spectrometer to collect data of the Moon with the goal of collecting the compositional and mineralogical information of the lunar surface. With a global coverage of ~78% at 200 m/pixel spatial resolution [19], IIM has a higher spectral sampling than other instruments ranging from 480 to 960 nm. Because Chang’E-3 was landed at Mare Imbrium in the mare region of the Moon [20] and Chang’E-5 will be also landed at Oceanus Procellarum in the mare region, sample IIM data at ‘maria’ area were selected in this study to derive a set of new Hapke’s parameters and to test the performance of photometric correction method built upon these new Hapke parameters. Because reflectance data around 750 nm is widely used in band ratio to evaluate the composition of the lunar surface, 757 nm IIM sample reflectance data of ‘maria’ area with wide coverage (wide longitude and latitude range) and phase range (including data at g < 20°) were selected. The information of the sample data is listed at Table 2.

Table 2.
Information of sample data.
3.2. Preprocessing of the Sample Data
In this study, the data we used were CE-1 IIM 2A radiance data. The radiance data were firstly converted to radiance factor (RADF), which is defined as [13]:
Here, r is the radiance factor measured under viewing geometry (i, e, g). is the wavelength of incident light which is 757 nm in this study. I is the measured radiance and F corresponds to the radiance from a Lambertian surface that is illuminated vertically and is at the same distance as the Moon from the Sun and J is the solar irradiance at surface of the IIM.
We calculated J using the following equation based on the known spectral curve of solar irradiance of the lunar surface and the corresponding spectral response function of IIM (Equation (2)):
Here, is spectral curve of solar irradiance on the lunar surface; is corresponding spectral response function of IIM, is the start and end wavelength of . The spectral response function of IIM can be simulated with central wavelength and Full Width Half maximum (FWHM) as following:
In Equation (3), , is central wavelength corresponding to 757.44 nm.
Inhomogeneity still exists in the sample data because of the influence of the terrain. This can be illustrated by the histogram of the sample data of orbit 2525 (Figure 2a,b) which exhibits two albedo peaks increasing the uncertainty in the model fitting. To improve the accuracy of parameter inversion, we reduced the fitting data by a ‘albedo filtering’. We selected one of the albedo populations (from multimodal spreads) by applying a lower/upper limit threshold. The lower/upper limits are given by the range defined as the most frequent albedo value ±1 standard deviation (dashed lines in Figure 2b). The homogeneity of sample data was improved after ‘albedo filtering’ (Figure 2 c,d). Then, the sample data were binned by the 1° increments of photometric angles i, e and g. The average of r value in each bin was used for fitting. This process can be called ‘angle binning’.
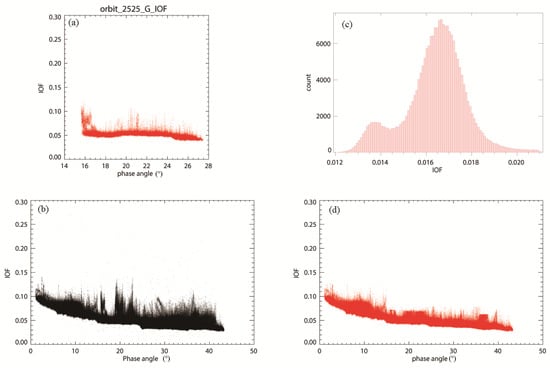
Figure 2.
(a) Density plot of I/F at orbit 2525; (b) The histogram of the I/F of sample data at orbit 2525; (c) density plot of I/F; (d) density plot of I/F after ‘albedo filtering’.
The data and software we used can be found in Supplementary Materials.
4. Results and Discussion
4.1. Photometric Characteristics of the Three Areas
We divided the moon into three areas based on the Hapke model parameters and each area should approximately have the similar photometric characteristic. USGS made a global false color image mosaic with Clementine UV/VIS spectral data at 415 nm, 750 nm and 1000 nm. 750/415 nm band ratio was set as R representing low titanium area or high glass content; 750/1000 nm band ratio was set as G, which is sensitive to the content of iron; 415/750 nm was set as B which indicates the presence of the high titanium content. Band ratio reduces the effects of influencing factors such as topographic and brightness variation of the lunar surface. Therefore, the false-color map of Clementine UV/VIS spectral data are mainly controlled by the composition and maturity of the lunar surface. It can be seen that the three areas shows distinguished color (Figure 3) and there is no obvious color variation within each area indicating that the mineral composition and maturity of the lunar soil in each area are approximately homogeneous. The mare region is mainly composed of basalt including low titanium, medium titanium and high titanium basalt. The ‘maria’ selected in this study possess a high titanium content and can be distinguished from low titanium area. The ‘new highland’ area is well distinguished from the ‘old highland’ with obvious fresh ejecta producing by the impact cratering event. These results suggest that using Hapke model parameters to divide the moon surface can effectively eliminate the influence of mineral composition and lunar soil maturity.
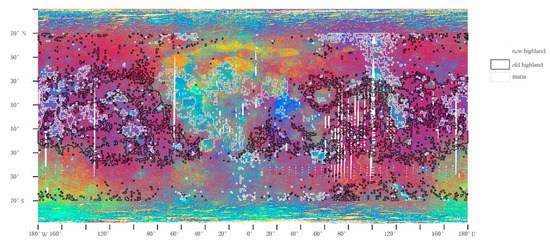
Figure 3.
Global false color image mosaic with Clementine UV/VIS spectral data (R = 750/415 nm, G = 750/1000 nm, B = 415/750 nm, https://planetarymaps.usgs.gov) and the three areas.
Terrain has great influence on the illumination observation geometry. Regions with large topographic relief have a large variation in luminosity. We made the fluctuation distribution map of the moon (Figure 4) according to the DEM data of Chang’E-1 (resolution is 500 m/pixel) and made the fluctuation statistics of the three regions (Figure 5). It can be seen that the ‘maria’ area is relatively flat and the fluctuation is small. The ‘new highland’ is flatter than the ‘old highland’ might be due to the fact that some impact craters have been filled in by crater ejecta. Our results clearly show that craters of large terrain variation are not included in the ‘maria’ area which demonstrate the efficiency of using Hapke model parameters in eliminating the influence of terrain.
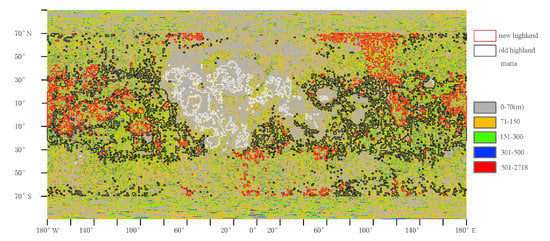
Figure 4.
Globe fluctuation distribution map of the moon and the three areas. Fluctuation of ‘maria’ is between 0 and 70 m, ‘old highland’ is between 0 and 300 m, ‘new highland’ is between 0 and 500 m.
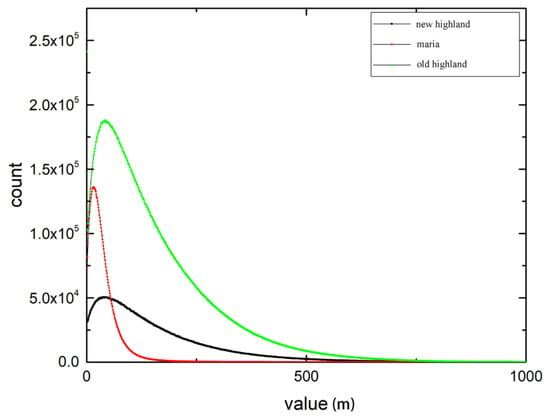
Figure 5.
Fluctuation statistics of the three regions respectively.
4.2. Hapke Model Parameters Calculation
The photometric model we employed is the Hapke radiative transfer model (the bidirectional reflectance function proposed by Hapke [10,11,12,13,14,15,16,17,18]) reproduced bellow:
There are nine free parameters (, see Table 3) in Hapke model. The accurate determination of these nine free parameters directly from the data inversion process is difficult due to the mathematical coupling of some parameters [21,22]. To minimize these issues, we simplified the original Hapke model based on several assumptions and determined the parameters in a stepwise manner described below.

Table 3.
Calculation of Hapke parameters in this study.
The porosity factor K was set to 1.0 (K = 1 − , ) to avoid mathematical coupling with the single scattering albedo because the two factors both control the multiple scattering (Equation (10)) and amplitude of I/F. The Henyey-Greenstein double-lobed single particle phase function (Equation (7)) parameter c was derived as a function of b, which is written in form of Equation (8). This function was obtained from an empirical relation between b and c (called the “hockey stick relation”) described by Hapke [23]. The ‘opposition surge’ was dominated by Coherent Backscatter Opposition Effect (CBOE) and Shadow Hiding Opposition Effect (SHOE). Theoretically CBOE dominates only at very low phase angles (g < 3°) and SHOE dominates significantly at g < 20°. g of sample data used in this study are >3°. Because it is difficult to discriminate between CBOE and SHOE only by model fitting [7,18], we set CBOE to 1.0 ( = 0) to avoid competing CBOE and SHOE. In addition, we ignored the influence of roughness ( = 1, ) because terrain factors were not considered in this calculation. These assumptions and simplifications are listed at Table 3.
After the simplification of the Hapke model, the four Hapke model parameters are derived with the MPFIT-Robust non-linear least squares curve fitting (http://cow.physics.wisc.edu./~craigm/idl/idl.html) based on the sample data of the ‘maria’ area ). Shown in Figure 6 is the fitted Hapke model and the sample data. The comparation between the results and the original parameter ranges is shown in Table 4. The values of are all within the defined ranges while is relatively small. This might be accounted for by several reasons. First, the original parameter ranges for the division were based on 689 nm reflectance data of LROC WAC. However, our parameters were estimated using 757.44 nm data and thus the ‘opposition surge’ between these two wavelengths could be different. Second, the data we used were selected from the ‘maria’ and the ‘opposition surge’ could be probably weaker than that of the whole ‘maria’ area.
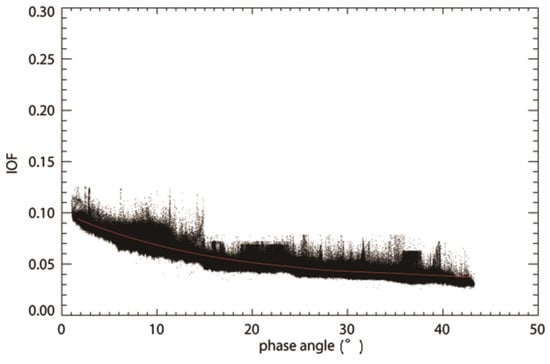
Figure 6.
The phase functions of the sample data for the 757 nm band. The red curve represents the Hapke model we fitted.

Table 4.
The comparation between the results and the original parameter ranges of the ‘maria’ area.
4.3. Photometric Correction Results of the Reflectance Data
Photometric correction should be performed to the reflectance data of different observation geometries to remove effects of observation geometries. The standard viewing geometry used in this study are . The basic concept of photometric correction can be summarized as follows [12]:
where is the photometrically corrected reflectance, is the observed reflectance (not photometrically corrected) and is the fitted reflectance (Hapke model).
The ‘opposition surge’ is a sharp surge observed in the reflected brightness of a particulate medium around zero phase angle. There is obvious ‘opposition surge’ in the reflectance data of orbit 2576 with phase range 0~15° as shown in Figure 7a. We performed the photometric correction to this data using the fitted model and the reflectance data after correction is shown in Figure 7b. The standard deviation of the reflectance data is 0.016 and 0.0034 before and after correction, respectively. It clearly shows that photometric correction with Hapke model can remove effects of observation geometries effectively, especially for the ‘opposition surge’.
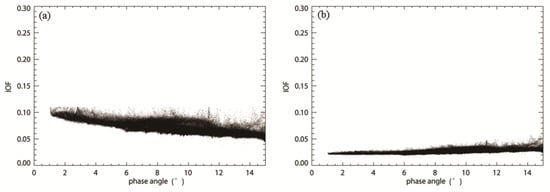
Figure 7.
Reflectance data of orbit 2576 with phase range 0~15° before (a) and after (b) photometric correction by Hapke model.
We also conducted photometric correction for two adjacent orbits images with ‘opposition surge’ based on empirical model (Lommel-Seelinger model) and Hapke model respectively to compare the result. Figure 8a is a mosaic of two original adjacent 2A images (part of image of orbit 2576 and 2885). There is an obvious ‘opposition surge’ in the image of orbit 2576 (area in the red box) and nothing can be seen but hot spot within this area. Apparent artifacts can be found along the tile boundaries because of the brightness difference between the two images. Figure 8b,c are the mosaic of images after photometric correction using empirical model and Hapke model respectively. It can be seen that the ‘opposition surge’ and artifacts are still existed in the mosaic corrected by the empirical model. By contrast, the ‘opposition surge’ is removed effectively in the images corrected by Hapke model and more detailed geographic information such as some impact craters can be revealed. Moreover, no artifacts can be seen within the mosaic.
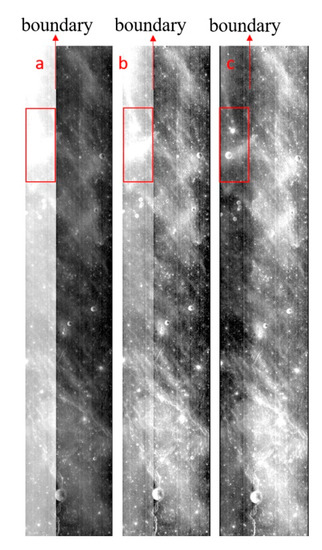
Figure 8.
Mosaic of two adjacent images (part of orbit 2576 and 2885) before (a) and after photometric correction with empirical (b) and Hapke model (c) (In the red box, 3.73 < i < 4.89, 0.013 < e < 5.86, 2.20 < g < 6.52).
5. Conclusions
We proposed the division method of the moon base on the Hapke model parameters to solve the problem that CE-1 IIM spectral data did not have a large range of phase angle observations for the same area on the moon. The three areas we divided in this study have similar photometric characteristics. Our results show that the Hapke model can more effectively eliminate the influence of observation geometries than empirical model, especially removing the effect of ‘opposition surge’ at small phase angles. Images with ‘opposition surge’ exhibit more detailed geographic information and no obvious artifacts along the tile boundaries can be observed after photometric corrected by Hapke model. This division method can be used for other lunar surface reflectance spectral data. There is also a problem that the three areas in this study does not cover the whole moon. Our future work will focus on dividing the whole moon into more areas with consistent photometric characteristics based on Hapke model parameters to further improve the photometric correction results of CE-1 IIM.
Supplementary Materials
The data and software are available online at https://pan.baidu.com/s/1Y9x03zm_HehTg0Zq2YxCTQ and the password is: 01si.
Author Contributions
Conceptualization, J.L. and X.X.; Formal analysis, X.X.; Methodology, X.X.; Supervision, J.L. and R.S.; Writing—original draft, X.X.; Writing—review & editing, D.L. and B.L. All authors have read and agreed to the published version of the manuscript.
Funding
This research was supported by the grant from Key Laboratory of Lunar and Deep Space Exploration, CAS, grant number: LDSE201802 and LDSE202003, Key Laboratory of Space Active Opto-Electronics Technology, Shanghai Institute of Technical Physics, Chinese Academy of Science and National Natural Science Foundation of China (Grant No.11941002 and 41601374) and Beijing Municipal Science and Technology Commission (NO. Z191100004319001).
Acknowledgments
We thank Sato for providing Hapke parameters of the moon about this division method.
Conflicts of Interest
The authors declare no conflict of interest.
References
- Lucey, P.G. Model near-infrared optical constants of olivine and pyroxene as a function of iron content. J. Geophys. Res. Space Phys. 1998, 103, 1703–1713. [Google Scholar] [CrossRef]
- Tompkins, S.; Pieters, C.M. Mineralogy of the lunar crust: Results from Clementine. Meteorit. Planet. Sci. 1999, 34, 25–41. [Google Scholar] [CrossRef]
- Garrick-Bethell, I.; Zuber, M.T. Elliptical structure of the lunar South Pole-Aitken basin. Icarus 2009, 204, 399–408. [Google Scholar] [CrossRef]
- McEwen, A.; Eliason, E.; Lucey, P. Summary of Radiometric Calibration and Photometric Normalization Steps for the Clementine UVVIS images. Lunar Planet. Sci. Conf. 1998, XXIX, 1466. [Google Scholar]
- Yokota, Y.; Matsunaga, T.; Ohtake, M. Lunar Photometric Properties at Wavelengths 0.5–1.6 μm Acquired by SELENE Spectral Profiler and Their Dependency on Local Albedo and Latitudinal Zones. Icarus 2011, 215, 639–660. [Google Scholar] [CrossRef]
- Besse, S.; Boardman, J.; Nettles, J.; Staid, M.; Sunshine, J.M.; Li, J.Y.; Yokota, Y.; Buratti, B.; Hicks, M.; Pieters, C. Deriving a photometric model for the Moon Mineralogy Mapper data (M3). Lunar Planet. Sci. Conf. 2011, 42, 1773. [Google Scholar]
- Sato, H.; Robinson, M.; Hapke, B.; Denevi, B.W.; Boyd, A.K. Resolved Hapke parameter maps of the Moon. J. Geophys. Res. Planets 2014, 119, 1775–1805. [Google Scholar] [CrossRef]
- Wu, Y.; Besse, S.; Li, J.-Y.; Combe, J.-P.; Wang, Z.; Zhou, X.; Wang, C. Photometric correction and in-flight calibration of Chang’E-1 Interference Imaging Spectrometer (IIM) data. Icarus 2013, 222, 283–295. [Google Scholar] [CrossRef]
- Xu, X.-S.; Liu, J.-J. Hapke’s parameters inverse method of Lunar analog sample. J. Infrared Millim. Waves 2018, 37, 227–234. [Google Scholar]
- Hapke, B. Bidirectional reflectance spectroscopy: 1. Theory. J. Geophys. Res. Space Phys. 1981, 86, 3039–3054. [Google Scholar] [CrossRef]
- Hapke, B.; Wells, E. Bidirectional reflectance spectroscopy: 2. Experiments and observations. J. Geophys. Res. Space Phys. 1981, 86, 3055–3060. [Google Scholar] [CrossRef]
- Hapke, B. Bidirectional reflectance spectroscopy: 3. Correction for macroscopic roughness. Icarus 1984, 59, 41–59. [Google Scholar] [CrossRef]
- Hapke, B. Bidirectional reflectance spectroscopy: 4. The extinction coefficient and the opposition effect. Icarus 1986, 67, 264–280. [Google Scholar] [CrossRef]
- Hapkea, B.; Nelson, R.M.; Smythe, W.D. The Opposition Effect of the Moon: Coherent Backscatter and Shadow Hiding. Icarus 1998, 133, 89–97. [Google Scholar] [CrossRef]
- Hapke, B. Bidirectional reflectance spectroscopy: 5. The coherent backscatter opposition effect and anisotropic scattering. Icarus 2002, 157, 523–534. [Google Scholar] [CrossRef]
- Hapke, B. Bidirectional reflectance spectroscopy: 6. Effects of porosity. Icarus 2008, 195, 918–926. [Google Scholar] [CrossRef]
- Hapke, B. Bidirectional reflectance spectroscopy: 7. The single particle phase function hockey stick relation. Icarus 2012, 221, 1079–1083. [Google Scholar] [CrossRef]
- Hapke, B. Theory of Reflectance and Emittance Spectroscopy; Cambridge University Press: Cambridge, UK, 2012. [Google Scholar]
- Sun, L.; Ling, Z.; Zhang, J.; Li, B.; Chen, J.; Wu, Z.; Liu, J. Lunar iron and optical maturity mapping: Results from partial least squares modeling of Chang’E-1 IIM data. Icarus 2016, 280, 183–198. [Google Scholar] [CrossRef]
- Li, C.-L.; Mu, L.-L.; Zou, X.-D.; Liu, J.-J.; Ren, X.; Zeng, X.-G.; Yang, Y.; Zhang, Z.-B.; Liu, Y.-X.; Zuo, W.; et al. Analysis of the geomorphology surrounding the Chang’e-3 landing site. Res. Astron. Astrophys. 2014, 14, 1514–1529. [Google Scholar] [CrossRef]
- Helfenstein, P. Photometrically determined surface physical properties of terrains on Ganymede. Lunar Planet. Sci. 1986, 28, 333–334. [Google Scholar]
- Mustard, J.F.; Pieters, C.M. Photometric phase functions of common geologic minerals and applications to quantitative analysis of mineral mixture reflectance spectra. J. Geophys. Res. Space Phys. 1989, 94, 13619–13634. [Google Scholar] [CrossRef]
- Hapke, B.; Denevi, B.W.; Sato, H.; Braden, S.E.; Robinson, M.S. The wavelength dependence of the lunar phase curve as seen by the Lunar Reconnaissance Orbiter wide-angle camera. J. Geophys. Res. Space Phys. 2012, 117. [Google Scholar] [CrossRef]
Publisher’s Note: MDPI stays neutral with regard to jurisdictional claims in published maps and institutional affiliations. |
© 2020 by the authors. Licensee MDPI, Basel, Switzerland. This article is an open access article distributed under the terms and conditions of the Creative Commons Attribution (CC BY) license (http://creativecommons.org/licenses/by/4.0/).