Article

Oil Spill Detection and Mapping: A 50-Year Bibliometric Analysis

by
Rodrigo N. Vasconcelos
1,*,
André T. Cunha Lima
2,3,
Carlos A. D. Lentini
2,3,4,5,
Garcia V. Miranda
2,
Luís F. Mendonça
4,6,
Marcus A. Silva
7,
Elaine C. B. Cambuí
8,
José M. Lopes
2,4 and
Milton J. Porsani
3,5
1
Programa de Pós Graduação em Modelagem em Ciências da Terra e do Ambiente—PPGM, Universidade Estadual de Feira de Santana—UEFS, Feira de Santana 44036-900, Bahia, Brazil
2
Departamento de Física da Terra e do Meio Ambiente, Campus Ondina, Instituto de Física, Universidade Federal da Bahia—UFBA, Salvador 40170-115, Bahia, Brazil
3
Centro Interdisciplinar de Energia e Ambiente (CIEnAm), Universidade Federal da Bahia—UFBA, Salvador 40170-115, Bahia, Brazil
4
Programa de Pós-Graduação em Geoquímica: Petróleo e Meio Ambiente (Pospetro), Instituto de Geociências (IGEO/UFBA), Universidade Federal da Bahia—UFBA, Salvador 40170-115, Bahia, Brazil
5
Programa de Pós-Graduação em Geofísica, Instituto de Geociências (IGEO/UFBA), Universidade Federal da Bahia—UFBA, Salvador 40170-115, Bahia, Brazil
6
Departamento de Oceanografia, Campus Ondina, Instituto de Geociências, Universidade Federal da Bahia—UFBA, Salvador 40170-115, Bahia, Brazil
7
Centro de tecnología e Geociências, LITPEG - Laboratório Integrado de Tecnologia em Petróleo, Gás e Biocombustíveis, Campus Recife, Universidade Federal de Pernambuco—UFPE Recife, Pernambuco 50670-901, Brazil
8
Mestrado Profissional em Ecologia Aplicada, Instituto de Biología, Universidade Federal da Bahia—UFBA, Salvador 40170-115, Bahia, Brazil
*
Author to whom correspondence should be addressed.
Remote Sens. 2020, 12(21), 3647; https://doi.org/10.3390/rs12213647
Submission received: 1 October 2020 / Revised: 31 October 2020 / Accepted: 1 November 2020 / Published: 6 November 2020
(This article belongs to the Special Issue Remote Sensing Applications in Ocean Observation)

Abstract

:
Oil spill detection and mapping (OSPM) is an extremely relevant issue from a scientific point of view due to the environmental impact on coastal and marine ecosystems. In this study, we present a new approach to assess scientific literature for the past 50 years. In this sense, our study aims to perform a bibliometric and network analysis using a literature review on the application of OSPM to assess researchers and trends in this field of science. In methodological terms we used the Scopus base to search for articles in the literature, then we used bibliometric tools to access information and reveal quantifying patterns in this field of literature. Our results suggest that the detection of oil in the sea has undergone a great evolution in the last decades and there is a strong relationship between the technological evolution aimed at detection with the improvement of remote sensing data acquisition methods. The most relevant contributions in this field of science involved countries such as China, the United States, and Canada. We revealed aspects of great importance and interest in OSPM literature using a bibliometric and network approach to give a clear overview of this field’s research trends.

Graphical Abstract

1. Introduction

Nowadays ocean oil spill is among the most significant environmental impacts [1], bringing damage to ecosystems and biodiversity while causing loss of the ecosystem process [2,3,4]. In addition to the adverse impacts on the environment, other sectors of society, such as the economy and public health, are documented in the literature [5,6,7,8], a fact that reinforces its importance especially lately, where several environmental disasters with oil spills have been observed [3,4].
Since the beginning of the popularization of remote sensing as a science, an increasing number of studies with oil spill detection and mapping (OSPM) have been using remotely detected data for monitoring, surveillance, or risk assessment and management [9,10,11,12,13,14,15,16,17,18,19]. Albeit there are well-formed theoretical and conceptual frameworks according to the remote sensing literature dealing with the detection of oil spills and mapping from in situ observations [20,21,22,23,24,25,26,27,28], there is still a lack in the scientific community showing the trending techniques and algorithms that systematically summarize this kind of information. OSPM is not a new field of research, indeed although it has been carried out since the 1970s [1,2], it is crucial to conduct a comprehensive overview to investigate and understand the underlying developing patterns in this field of research [3,4]. Subsequently, scientists have used bibliometrics based on mathematical and statistical tools to analyze publications, citations, journals in many disciplines and fields of study [29,30,31,32].
Bibliometrics can be commonly defined as a qualitative and quantitative analysis of research that is often used to assess the impact of an individual researcher, research groups, institutions, countries, or journals [33,34]. Its method can analyze several publications to efficiently find influential researchers, authors, journals, organizations, and countries [33,34].
In fact, it can also analyze information intuitively by mapping networks, such as co-word, co-authorship, and co-citation networks [29,30,31]. Co-word is the co-occurrence of terms extracted from either the title or abstract fields of a dataset to find a specific research topic [30,31]. Co-authorship describes intellectual collaboration in scientific research [31]. Co-citation is defined as two or more publications that are cited by the same manuscript [31].
In recent years, bibliometric network visualization has been used to evaluate the research trends of remote sensing data and its applications in different scientific fields [35,36]. Several studies show that published literature analysis could provide critical information about the research production and scientific quality. Moreover, we believe that describing trends and characteristics of the articles for a specific scientific field can trigger authors’ and institutions’ collaborations. The same can be done to OSPM studies, which increased significantly in the past few years due to the Deepwater Horizon disaster [3].
A few questions may arise based on our dataset and methods related to oil spill detection and mapping. For instance, which countries have mostly contributed to OSPM research? Is there any trend in OSPM-related publications over the decades? If so, since when? Who are the top researchers and institutions that have focused their work on OSPM? What are the most influential journals in the OSPM field? What are the main differences in terms of the semantic network topology more evident over decades? Therefore, this paper aims to perform bibliometric and network analysis using a literature review regarding the application of OSPM to appraise the research, trends, and characteristics. Additionally, we report the amount of oil spill, the number of accidents, and the main tanker spills in the last 50 years. To the best of our knowledge, no study has specifically investigated OSPM using this conceptual framework. The manuscript is outlined as follows. Section 2 describes the Material and Methods, such as the search strategies and validation, as well as the semantic network analysis. Section 3 shows the publishing trend results of OSPM, co-occurrence, co-authoring, and top-cited authors and journals per decades, followed by Discussion (Section 4) and Concluding Remarks.

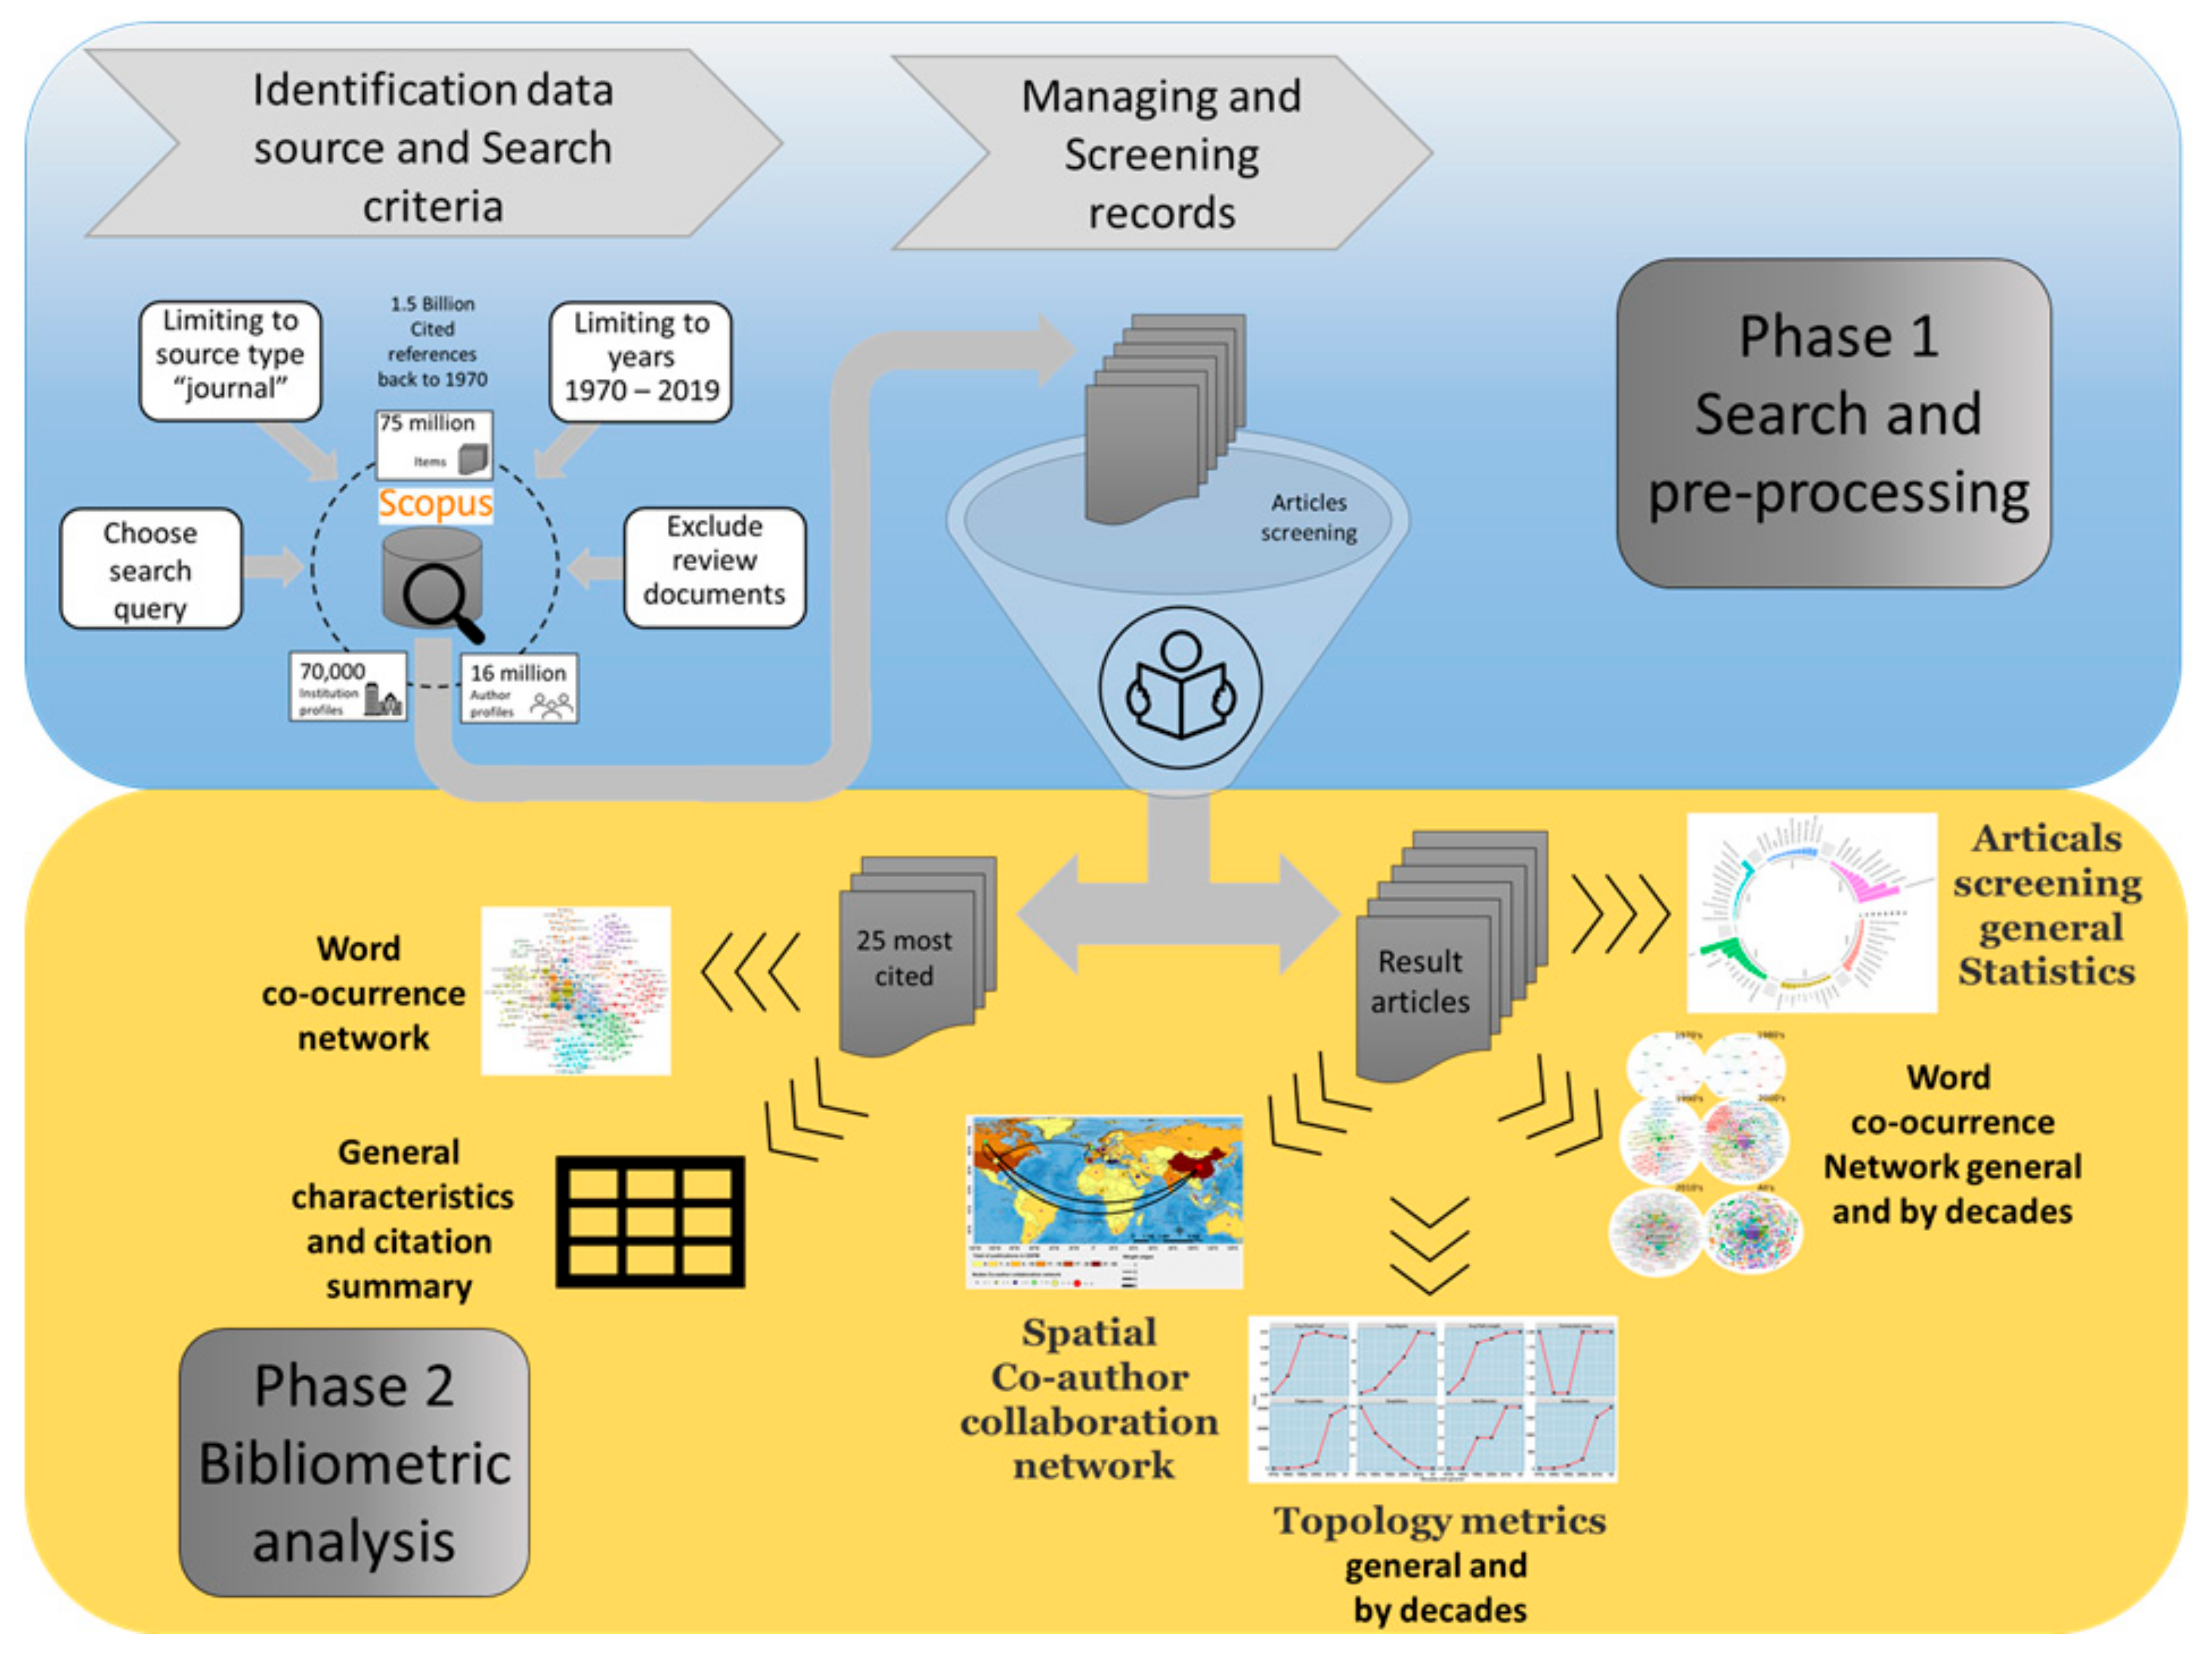
2. Materials and Methods

To answer the questions proposed in our study, we built a unified methodological approach that is able to unite classical bibliometric analysis using qualitative descriptors. Moreover, we added the calculation of metrics of the topological structure of the networks. This approach has the advantage of including in the universe of analysis associated with bibliometrics the quantification of topological patterns using quantitative descriptors with proper indexes. That is, the approach used here involves the use of qualitative and quantitative descriptors giving greater robustness to answer our work questions described above. Our approach and steps can be seen in Figure 1. In terms of methodological approach our study is divided into two main stages: Phase 1 and Phase 2. The first phase includes choosing the search database, identifying relevant terms to the subject, and including filters in the search engine. Afterwards, we performed a manual screening reading all the titles and abstracts of the articles returned in the search, identifying and excluding possible articles that did not fit our objective (Phase 1). After these two steps, we performed all analyses (Phase 2) for two data sets: for all articles and for the 25 most cited ones (Table 1). Table 1 describes the relationship between the working questions and the analysis proposed in our methodological approach and source data to make it. In order to make it clear, Table 1 contains three main fields: the questions of interest, the analysis used to answer it, and what kind of data is used.

2.1. Bibliographic Base

In this study, we choose the Scopus database. Scopus is the multidisciplinary largest database of abstracts and references in the literature, accounting for more than 24,000 peer-reviewed journals and 5000 international publishers and citations [37]. It has efficient analysis tools for retrieving and aggregating information and data exportation in multiple formats, which offers a comprehensive overview of the total volume of the world’s research products in the areas of science, technology, medicine, social sciences, arts, and humanities. For these reasons, we employed Scopus as the database literature for this research.
This study limited our analysis to journal publications only, reducing bias caused by duplicate publications, minimizing false-positive results. Reviews, conference proceedings, book chapters, and books were not considered because they include works that might have been published more than once in different media sources (Figure 1).

2.2. Search Strategy and Screening Records

We considered documents with a year of publication between 1970 and 2019 (a 50-year study) and studies regarding the application of oil spill detection and mapping only. The search was implemented as follows: only article retrievals containing the words “Oil Spill detection” OR “Oil Spill mapping” in the title, abstract, or keywords were selected. Previous tests were performed with different words, terms and synonyms until we reached the used set of words and terms, which proved to be relevant to the scope of our study.
A pool of selected papers was followed by a manual screening of all retrieved documents to avoid word ambiguity. After that, a systematic review was performed in ten percent of the most cited articles. Within these articles, specific information was extracted, such as: sensor used, spatial and temporal resolutions, bands or feature space evaluated, number of analyzed images, country and region of interest, classification algorithms, mapped classes, or targets. Additionally to report the amount of oil spill, the number of accidents in the last 50 years in the world we use ITOPF data report [38] and the Max Roser data base [39].

2.3. Semantic and General Network Analysis

In this paper, the minimum number of occurrences of a keyword is once for titles, abstracts, and Keywords for all publications to build up a network. The network visualization was carried out using VOSviewer program [30,31,32,40]. This tool, specifically designed for bibliometric analysis, was employed to visualize the retrieved data of a specific search. VOSviewer can be used to construct networks of scientific publications, scientific journals, researchers, research organizations, countries, and keywords, for example. Items in these networks can be connected by co-authorship, co-occurrence, citation, bibliographic coupling, or co-citation links [31,32].
From a network point-of-view, items are represented by nodes and edges. In this study, nodes are objects as such word co-occurrence and countries. Between any pair of nodes there can be an edge. An edge is a connection or a relation between two nodes. The distance between two nodes in the visualization approximately indicates the relatedness of searching terms in terms of co-occurrence. The size of a label into a node is determined by the weight of an item in a network [31,32].
All articles from our search were analyzed according to their authorship, country, data sources, affiliation, and citations. Individual terms and words in titles, abstracts, and keywords were assessed by their frequency, and a ranking of publication sources by relevance was constructed. Authors’ and countries’ rankings were also related to productivity analyses. The total and the average number of citations were analyzed by country. Authorship analysis was carried out by computing the number of single-authored articles and multi-authored publications. We also calculated the number of articles per author.
In order to analyze word co-occurrence, all the following settings have the same weight and were flagged as one: number of keywords’ occurrence, words and countries’ co-authorship. For adequacy, a thesaurus file was built to avoid redundant terms. This text file is used to perform data cleaning when creating a map based on bibliographic data or text data. For more details, the reader should address [29] and [31,32] references.
To calculate all metrics related to semantic networks, we employed Gephi software [41,42]. It is an open-source platform for viewing and manipulating dynamic graphs and hierarchical trees, including all types of networks and complex systems. The user has the autonomy to modify the graphical outputs, as well as to interact with the structure of its network. Moreover, it is possible to add filters highlighting desired aspects and export the final results to SVG, PNG or PDF formats. Its principal function is to serve as a tool for data method analysis, building hypotheses, discovering of social and behavioral patterns, and isolation of essential structures within the hierarchical networks [41,42].
Graph theory uses mathematical structures that model relationships between objects of a specific group [43]. Graphs are defined as a set of vertices and edges [43]. In other nomenclatures, they can be addressed as networks, where the vertices are connected by the edges, determining a relationship of some kind between them, whether directed or undirected. A graph is represented by G = (V, E), where V is a set of vertices and E is a set of edges [43]. Different indexes of the networks’ structures were also used to reveal the topological changes in semantic networks over the decades. A description of each index used can be seen in Table 2.
All plot charts were made on R version 3.6.2 [44], using IDE Rstudio, version 1.2.5033 [45], and the ggplot2 package, version 3.2.1 [46].

3. Results

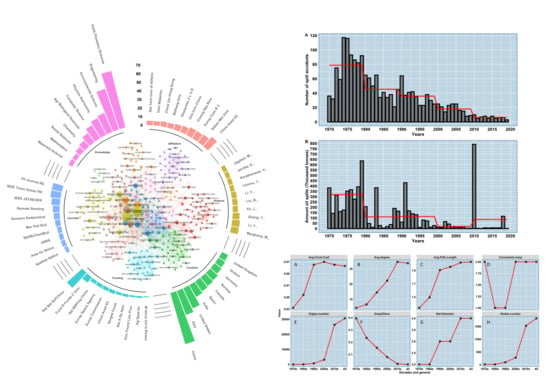
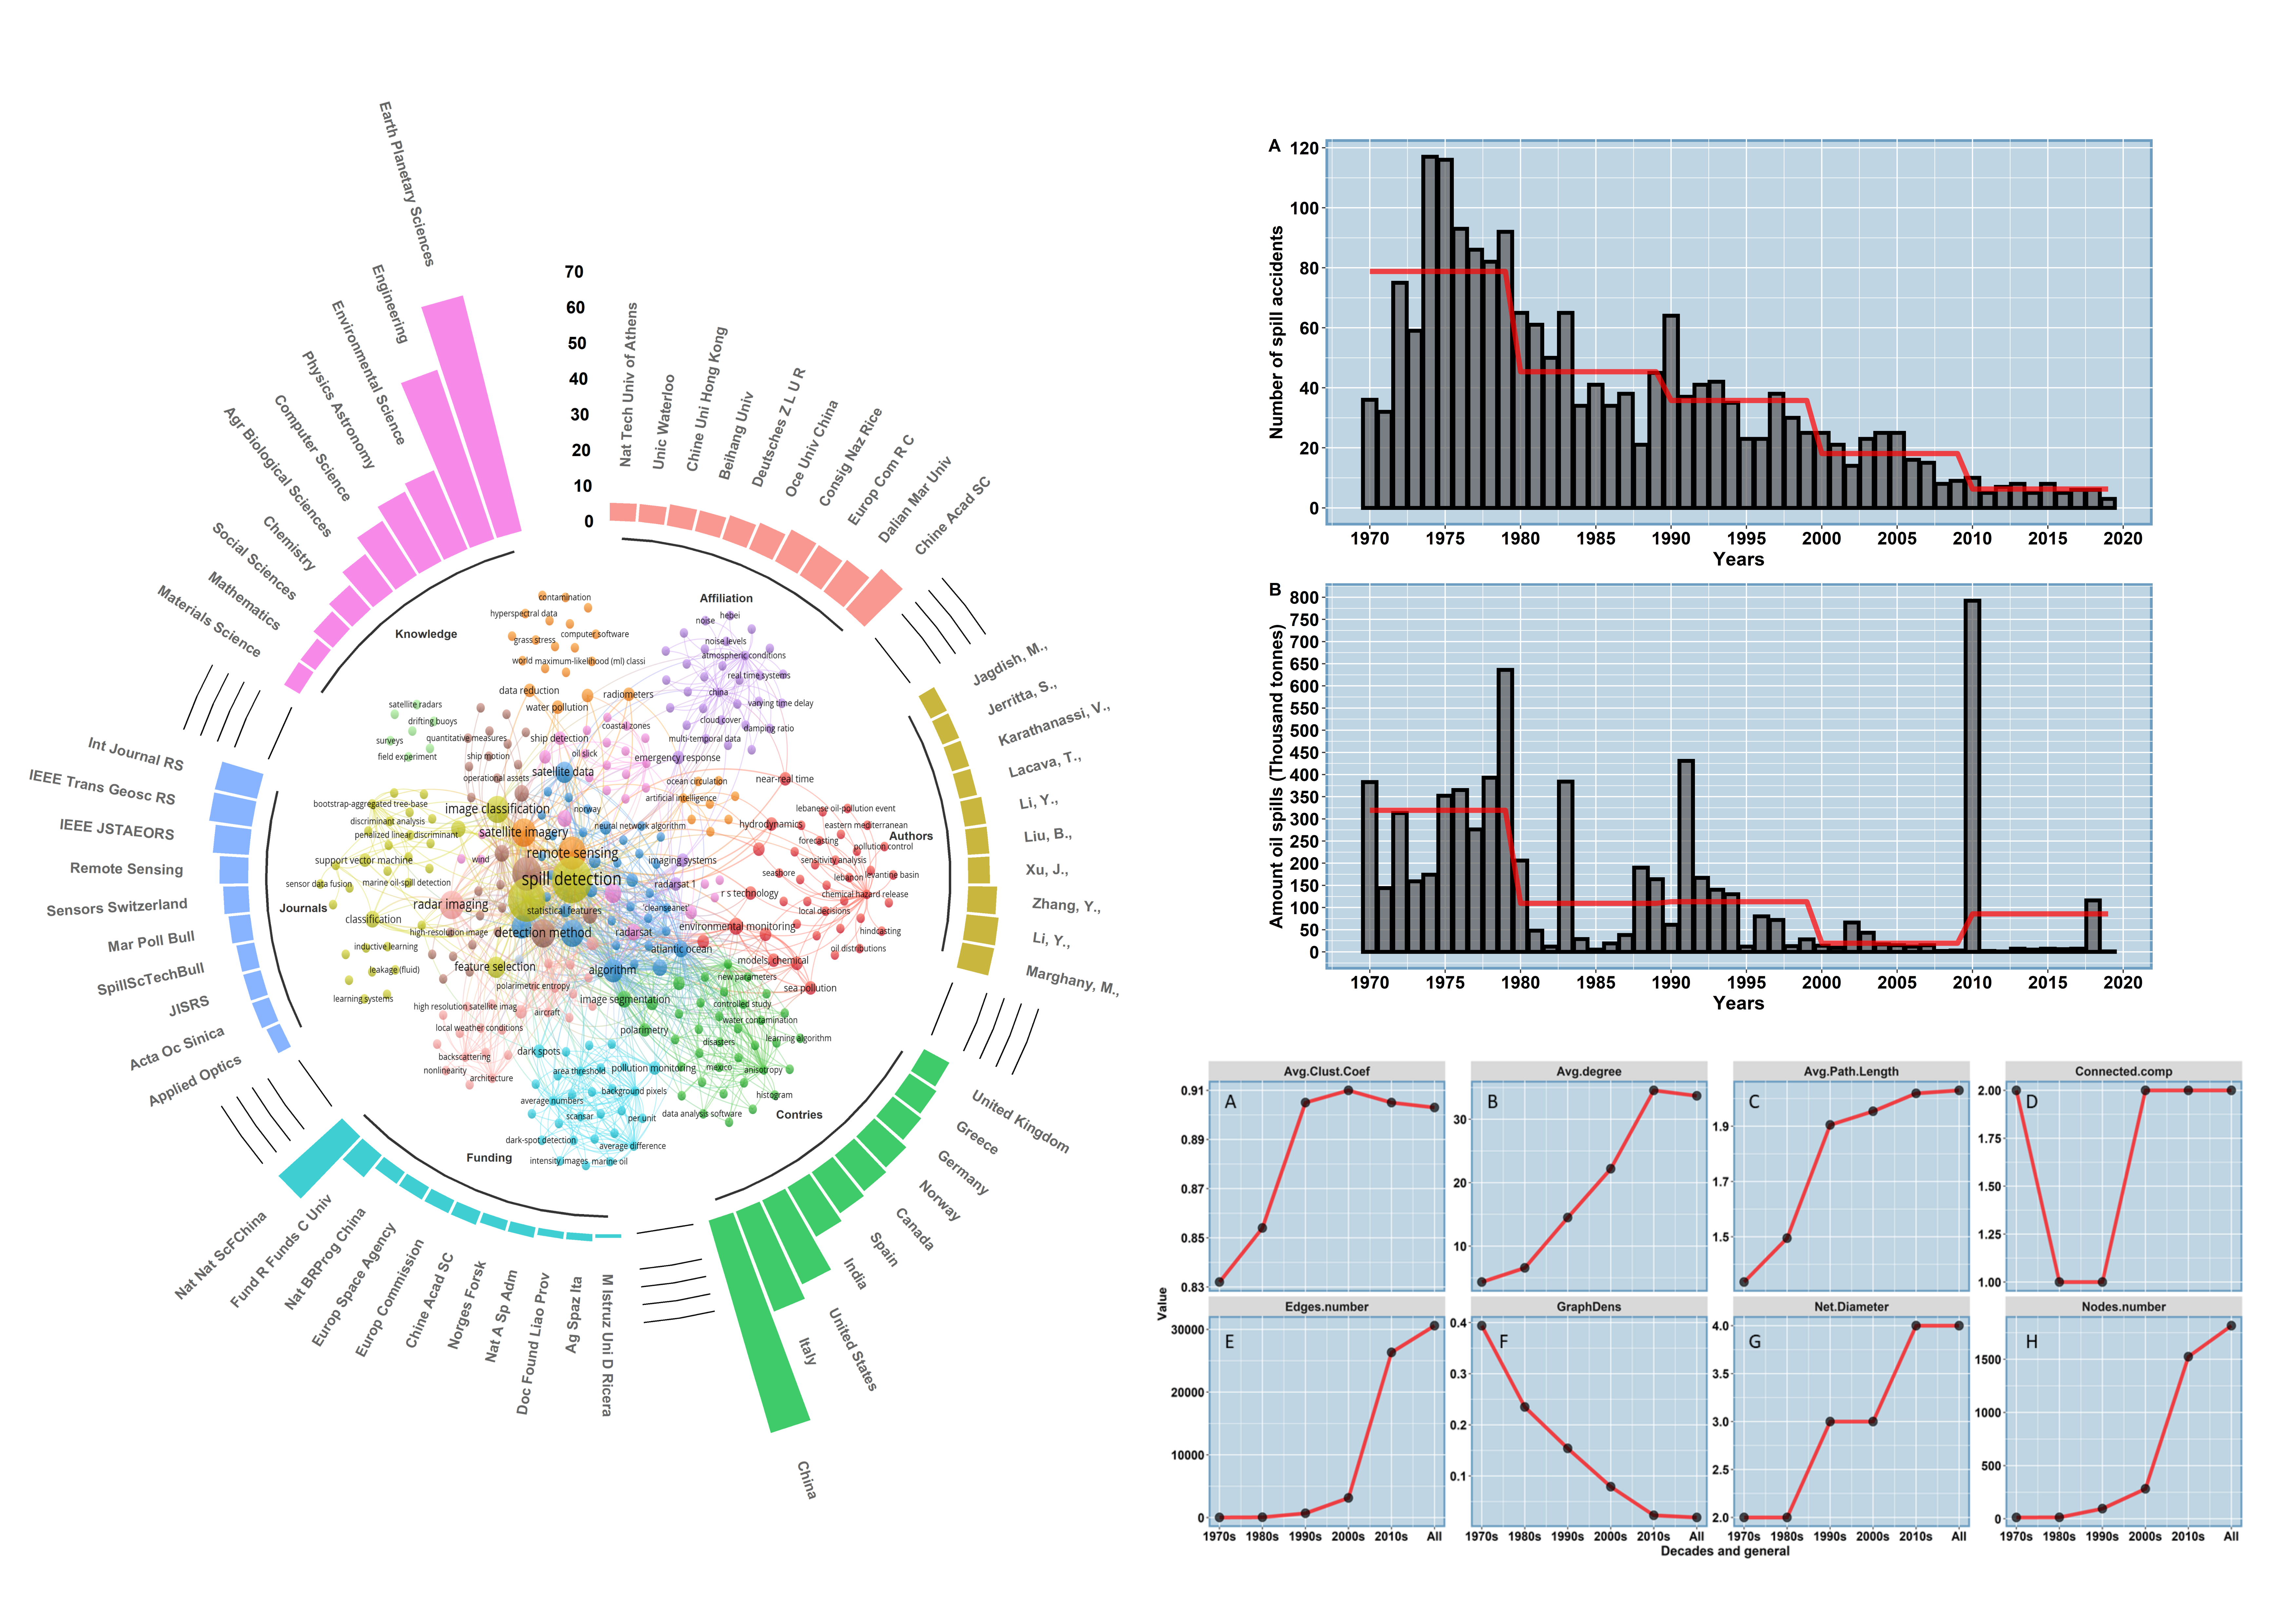
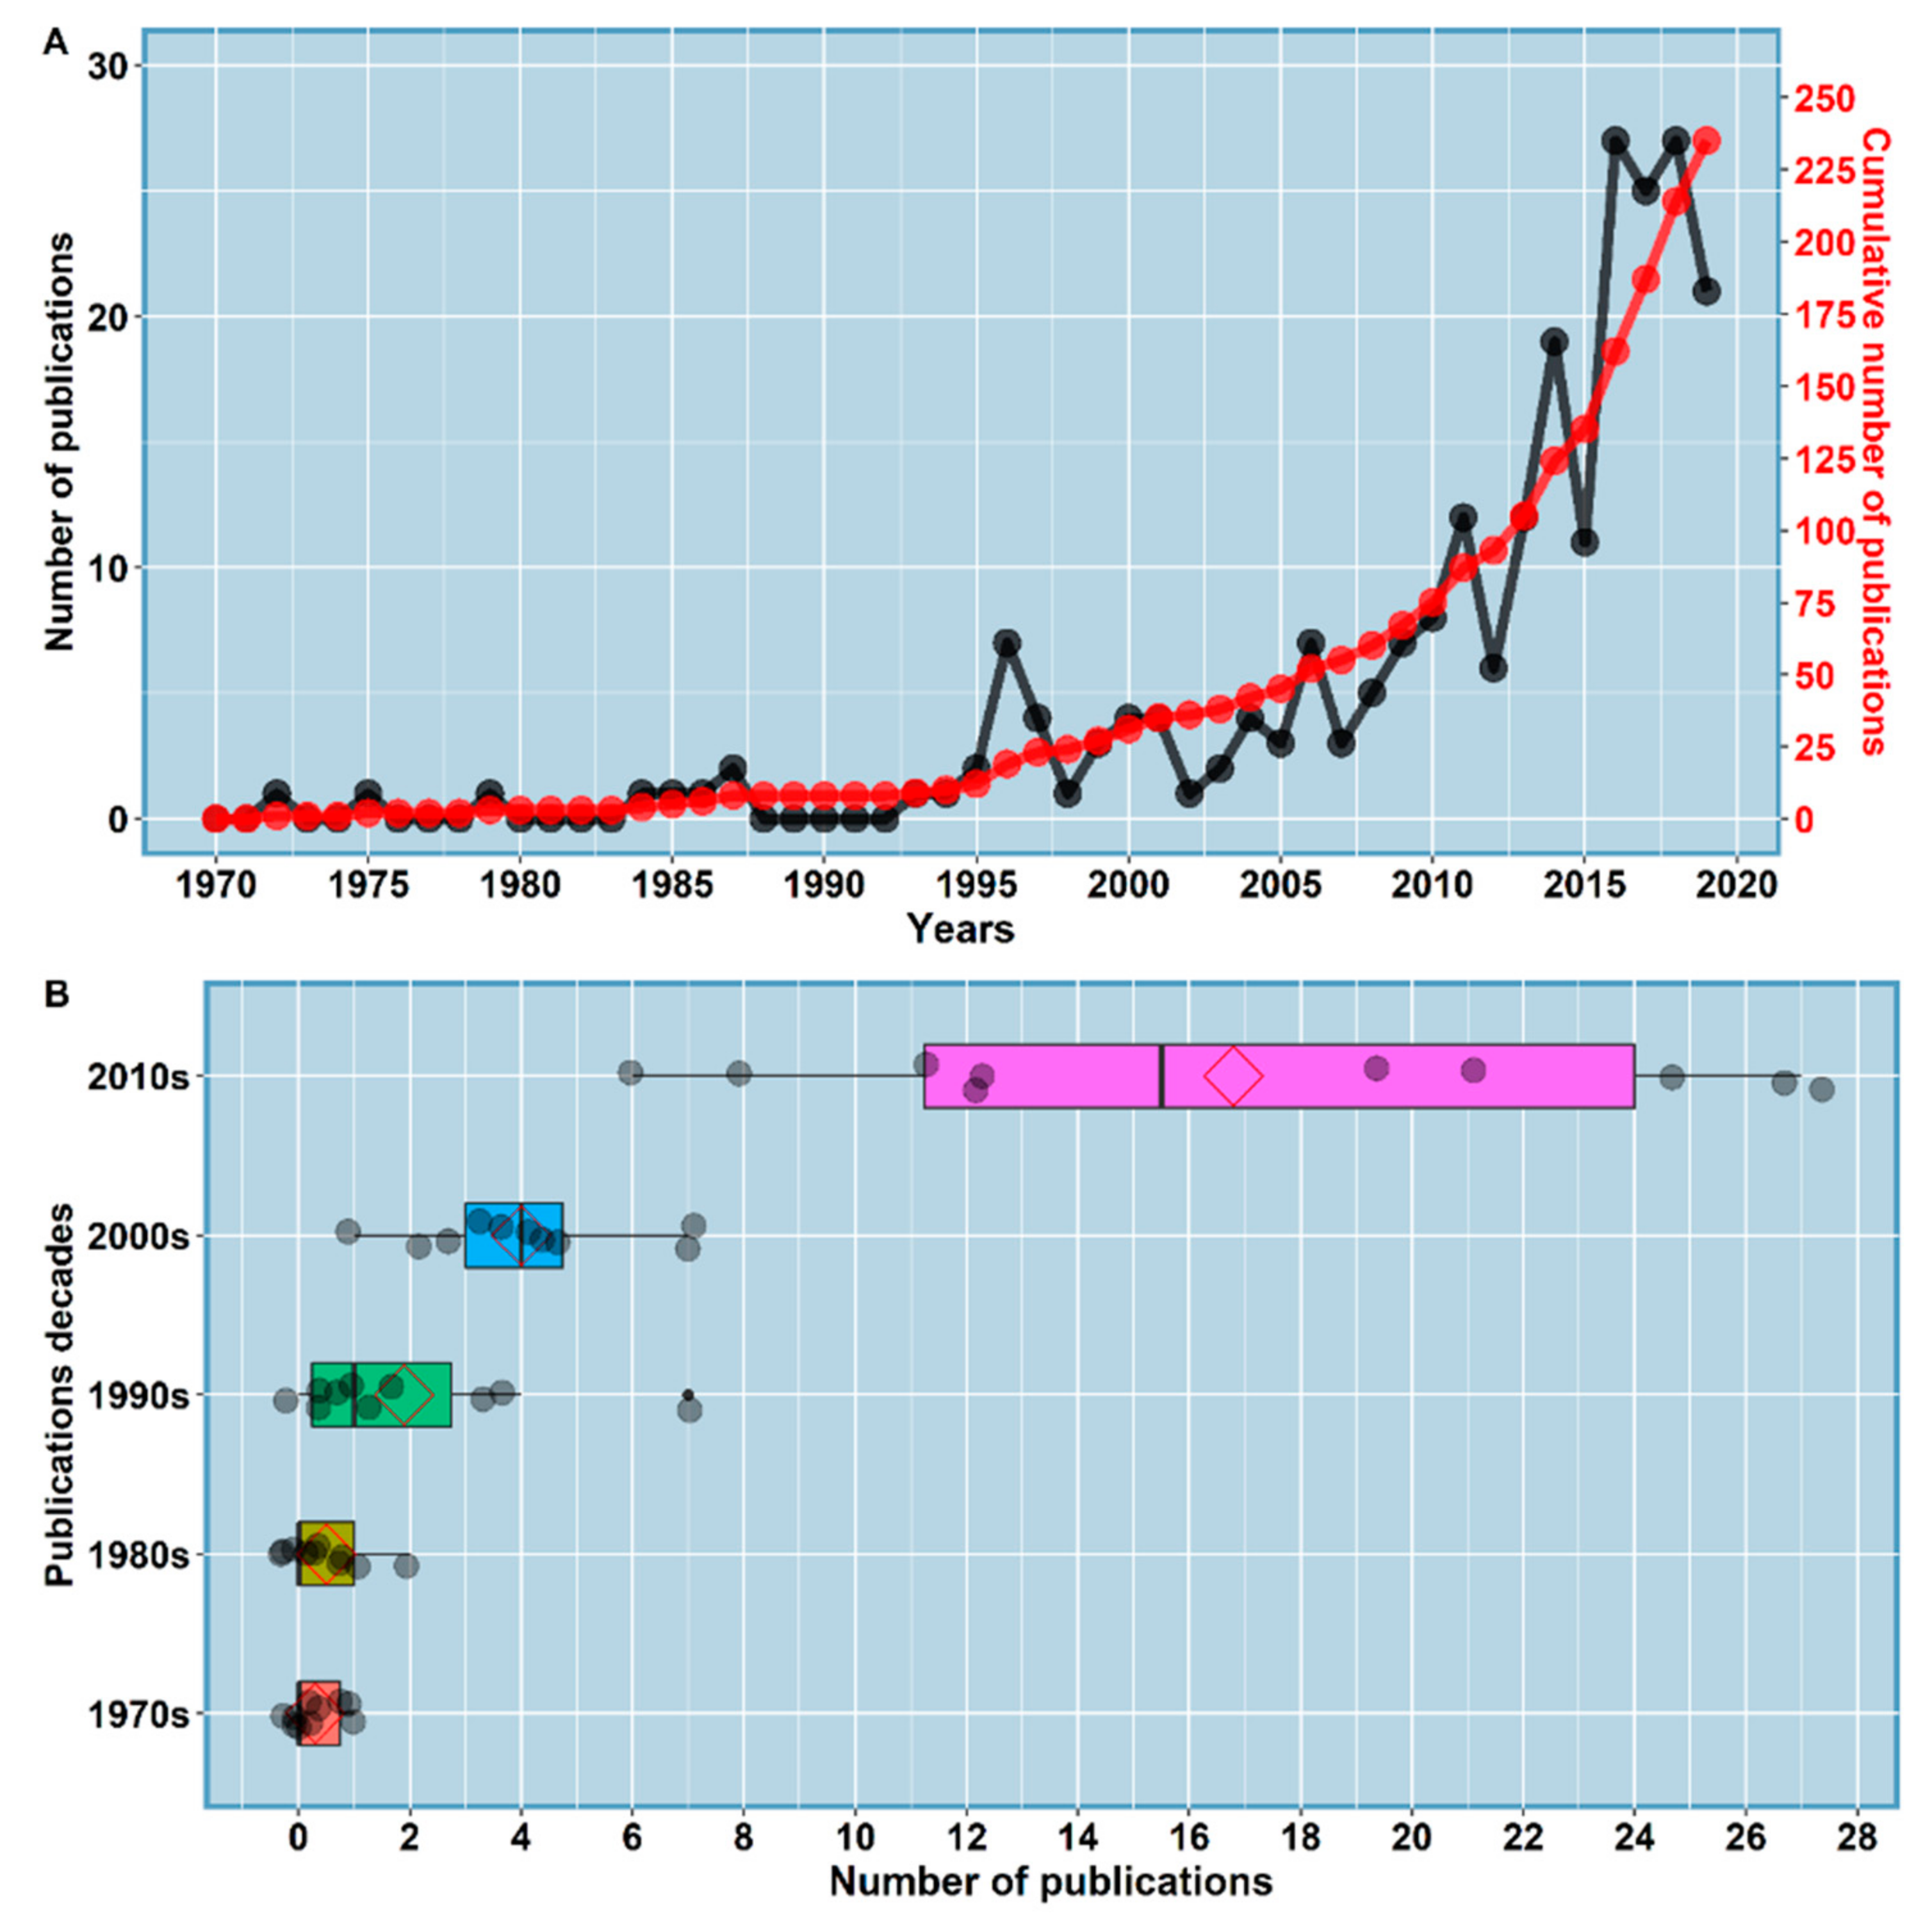
3.1. Publishing Trend of OSPM

The total number of 235 documents was published between 1970–2019 (see Supplementary Materials Table S1 for details) with a mean and standard deviation of 4.7 ± 7.2 papers/year (Figure 2A,B). The number of cumulative publications in the later years increased significantly, being more than twenty-five by the year 2019 (Figure 2A). The first peak of productivity was evident from the mid-1990s, with a peak in 1996 with seven articles, which comprised 3% of the total productivity in the studied period. The highest peak of productivity was observed in 2016 and 2018. Both years accounted for 27 articles, which corresponds to 23% of the total productivity in that decade. This decadal period has the highest number of publications with 168, which corresponds to 71.5% of the total number of published documents in this 50-year time frame with a mean value of 16.8 ± 7.6 publications. This is followed by the 2000s with 17% (mean 4 ± 1.8 SD), 1990s, 8.1% (mean 1.9 ± 2.1 SD), 1980s, 2.1% (mean 0.5 ± 0.7 SD) and 1970s, 1.3% (mean 0.3 ± 0.5 SD). The majority of the retrieved documents were published in English (e.g., 93.2% = 231 manuscripts), followed by 15 documents in Chinese (~6.0%) and one document in Croatian (0.4%).
Figure 3 shows the top 10 manuscripts in terms of their distribution by subject area were Earth and Planetary Sciences (68 papers ~29.1%) Engineering (50 papers ~21.4%), Environmental Science (24 papers ~10%), Physics and Astronomy (22 papers ~9.3%), Computer Science (18 papers ~7.7%), Agricultural and Biological Sciences (13 papers ~5.6%), Chemistry (9 papers ~3.7%), Social Sciences (7 papers ~2.8%), Materials Science (5 papers ~2.3%), and Mathematics (5 papers ~2.1%) (Table S2 for details).

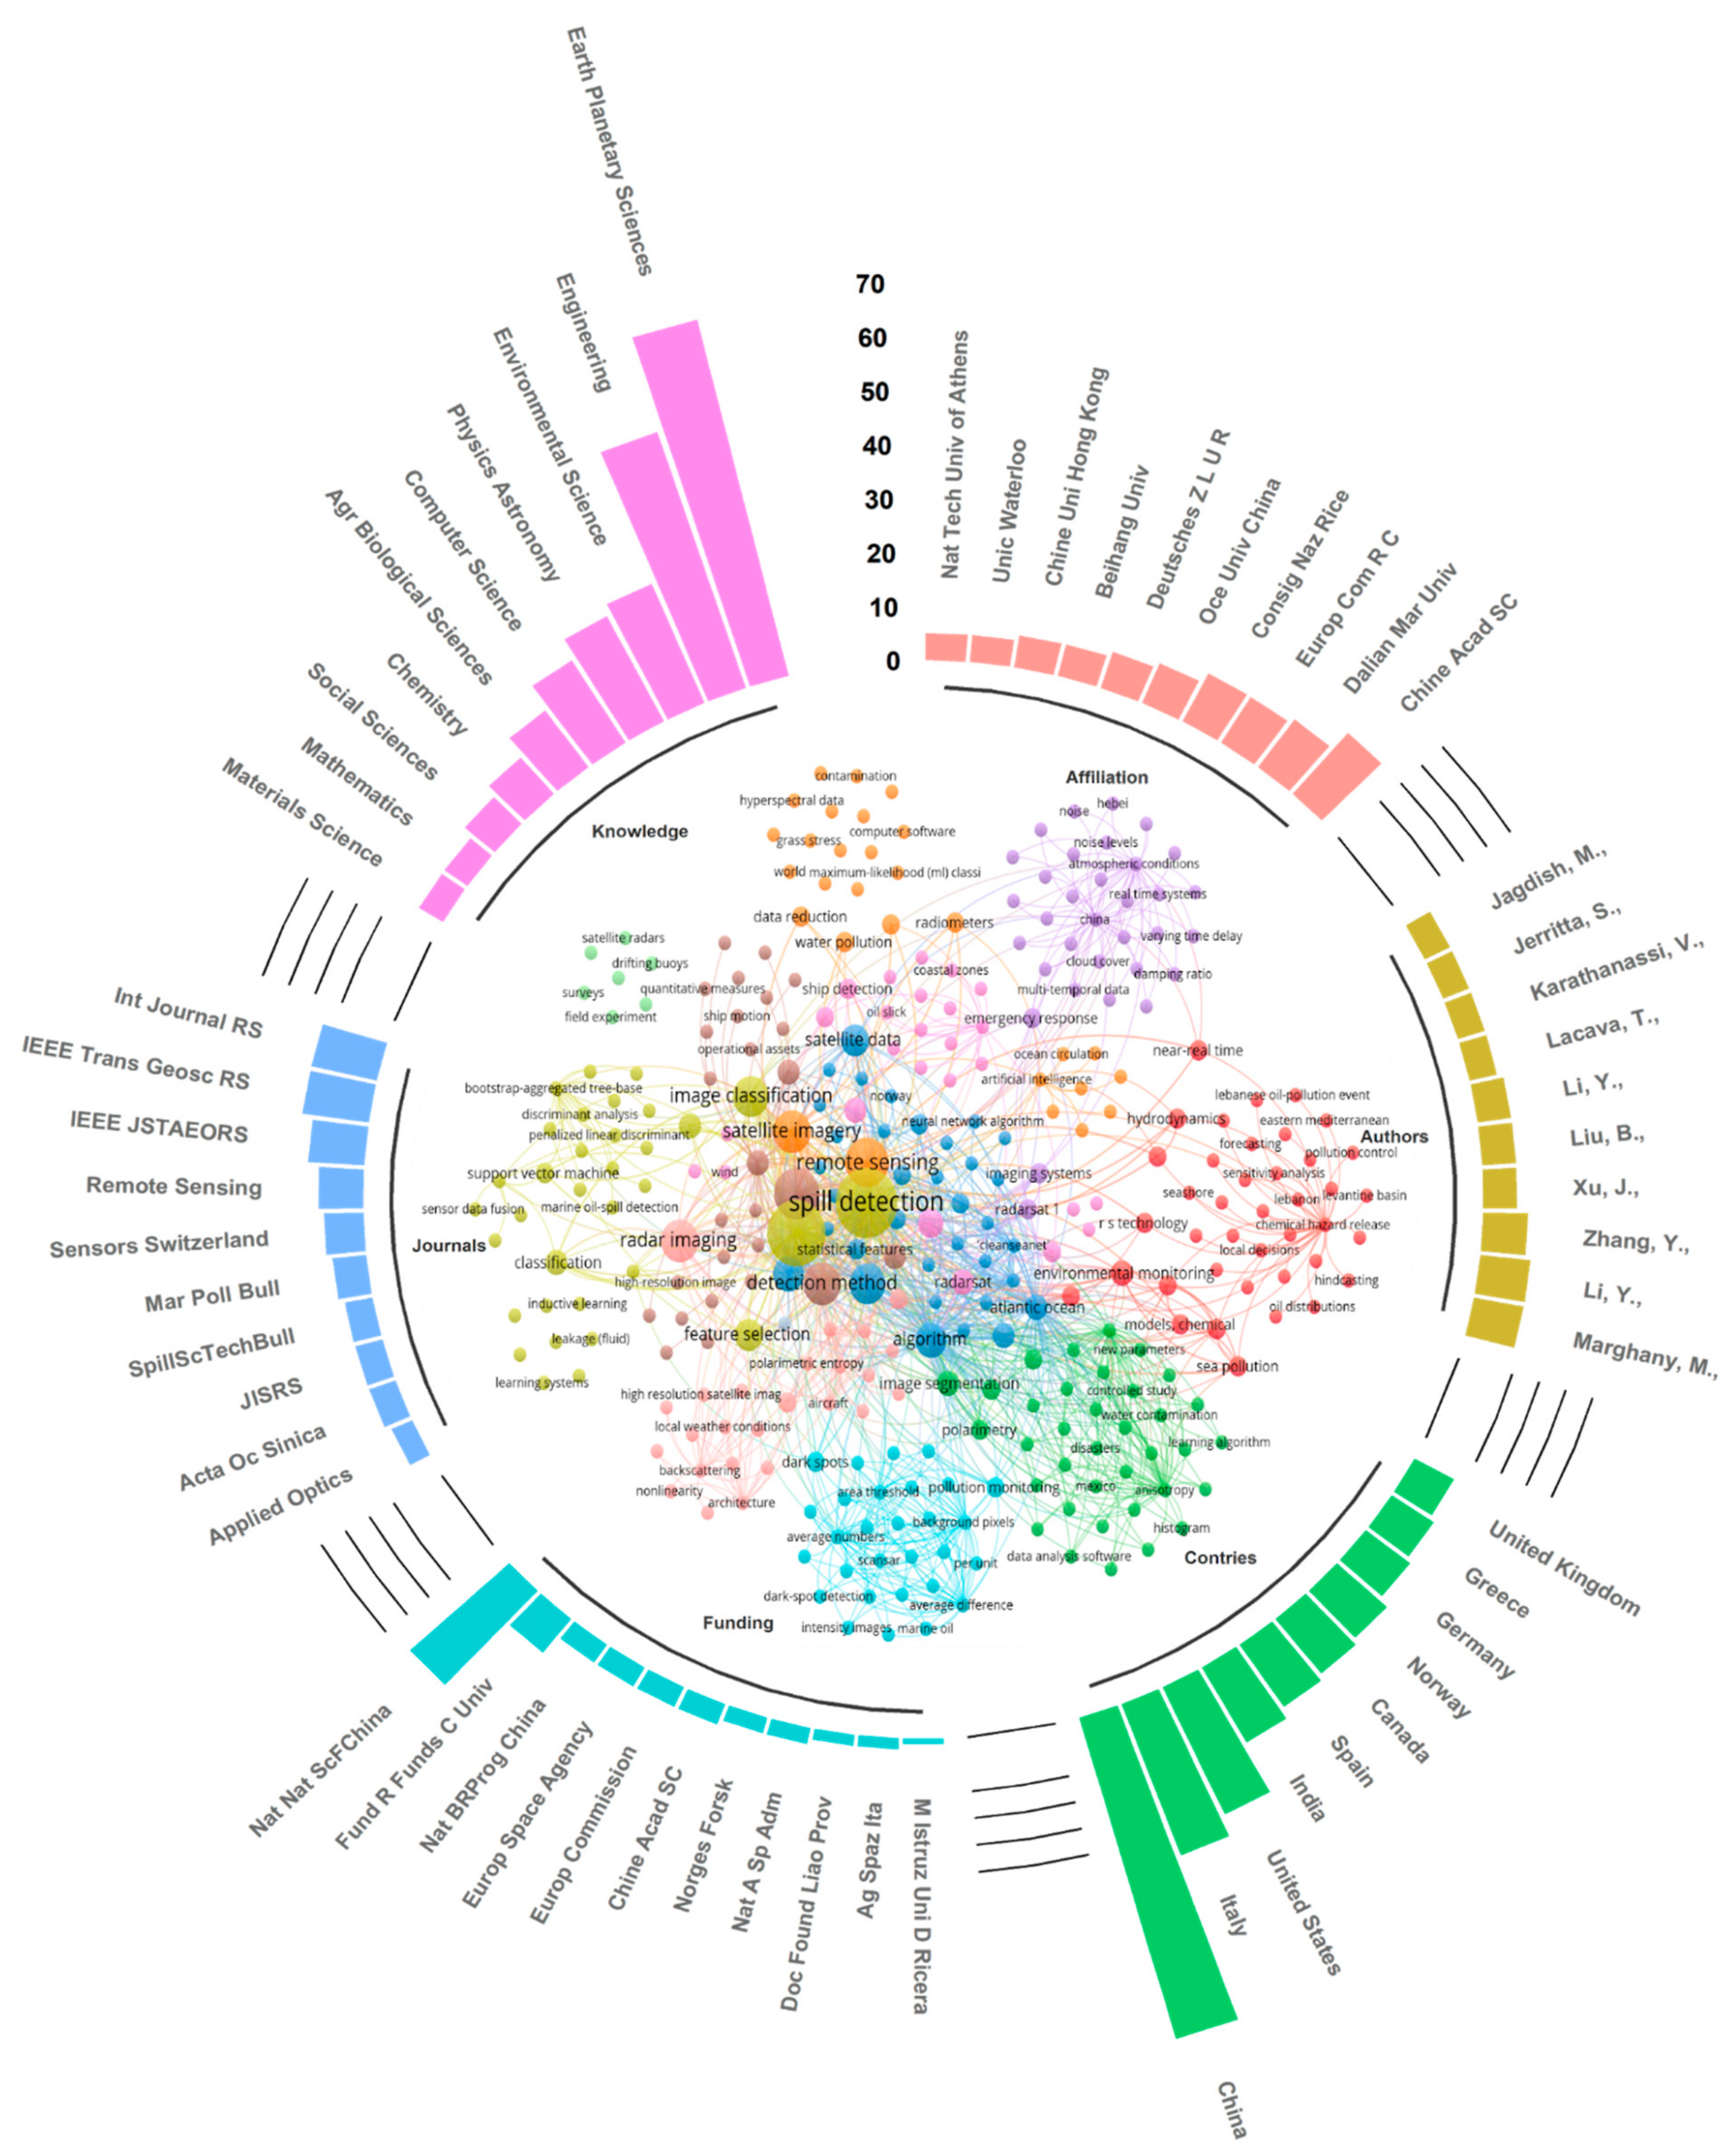
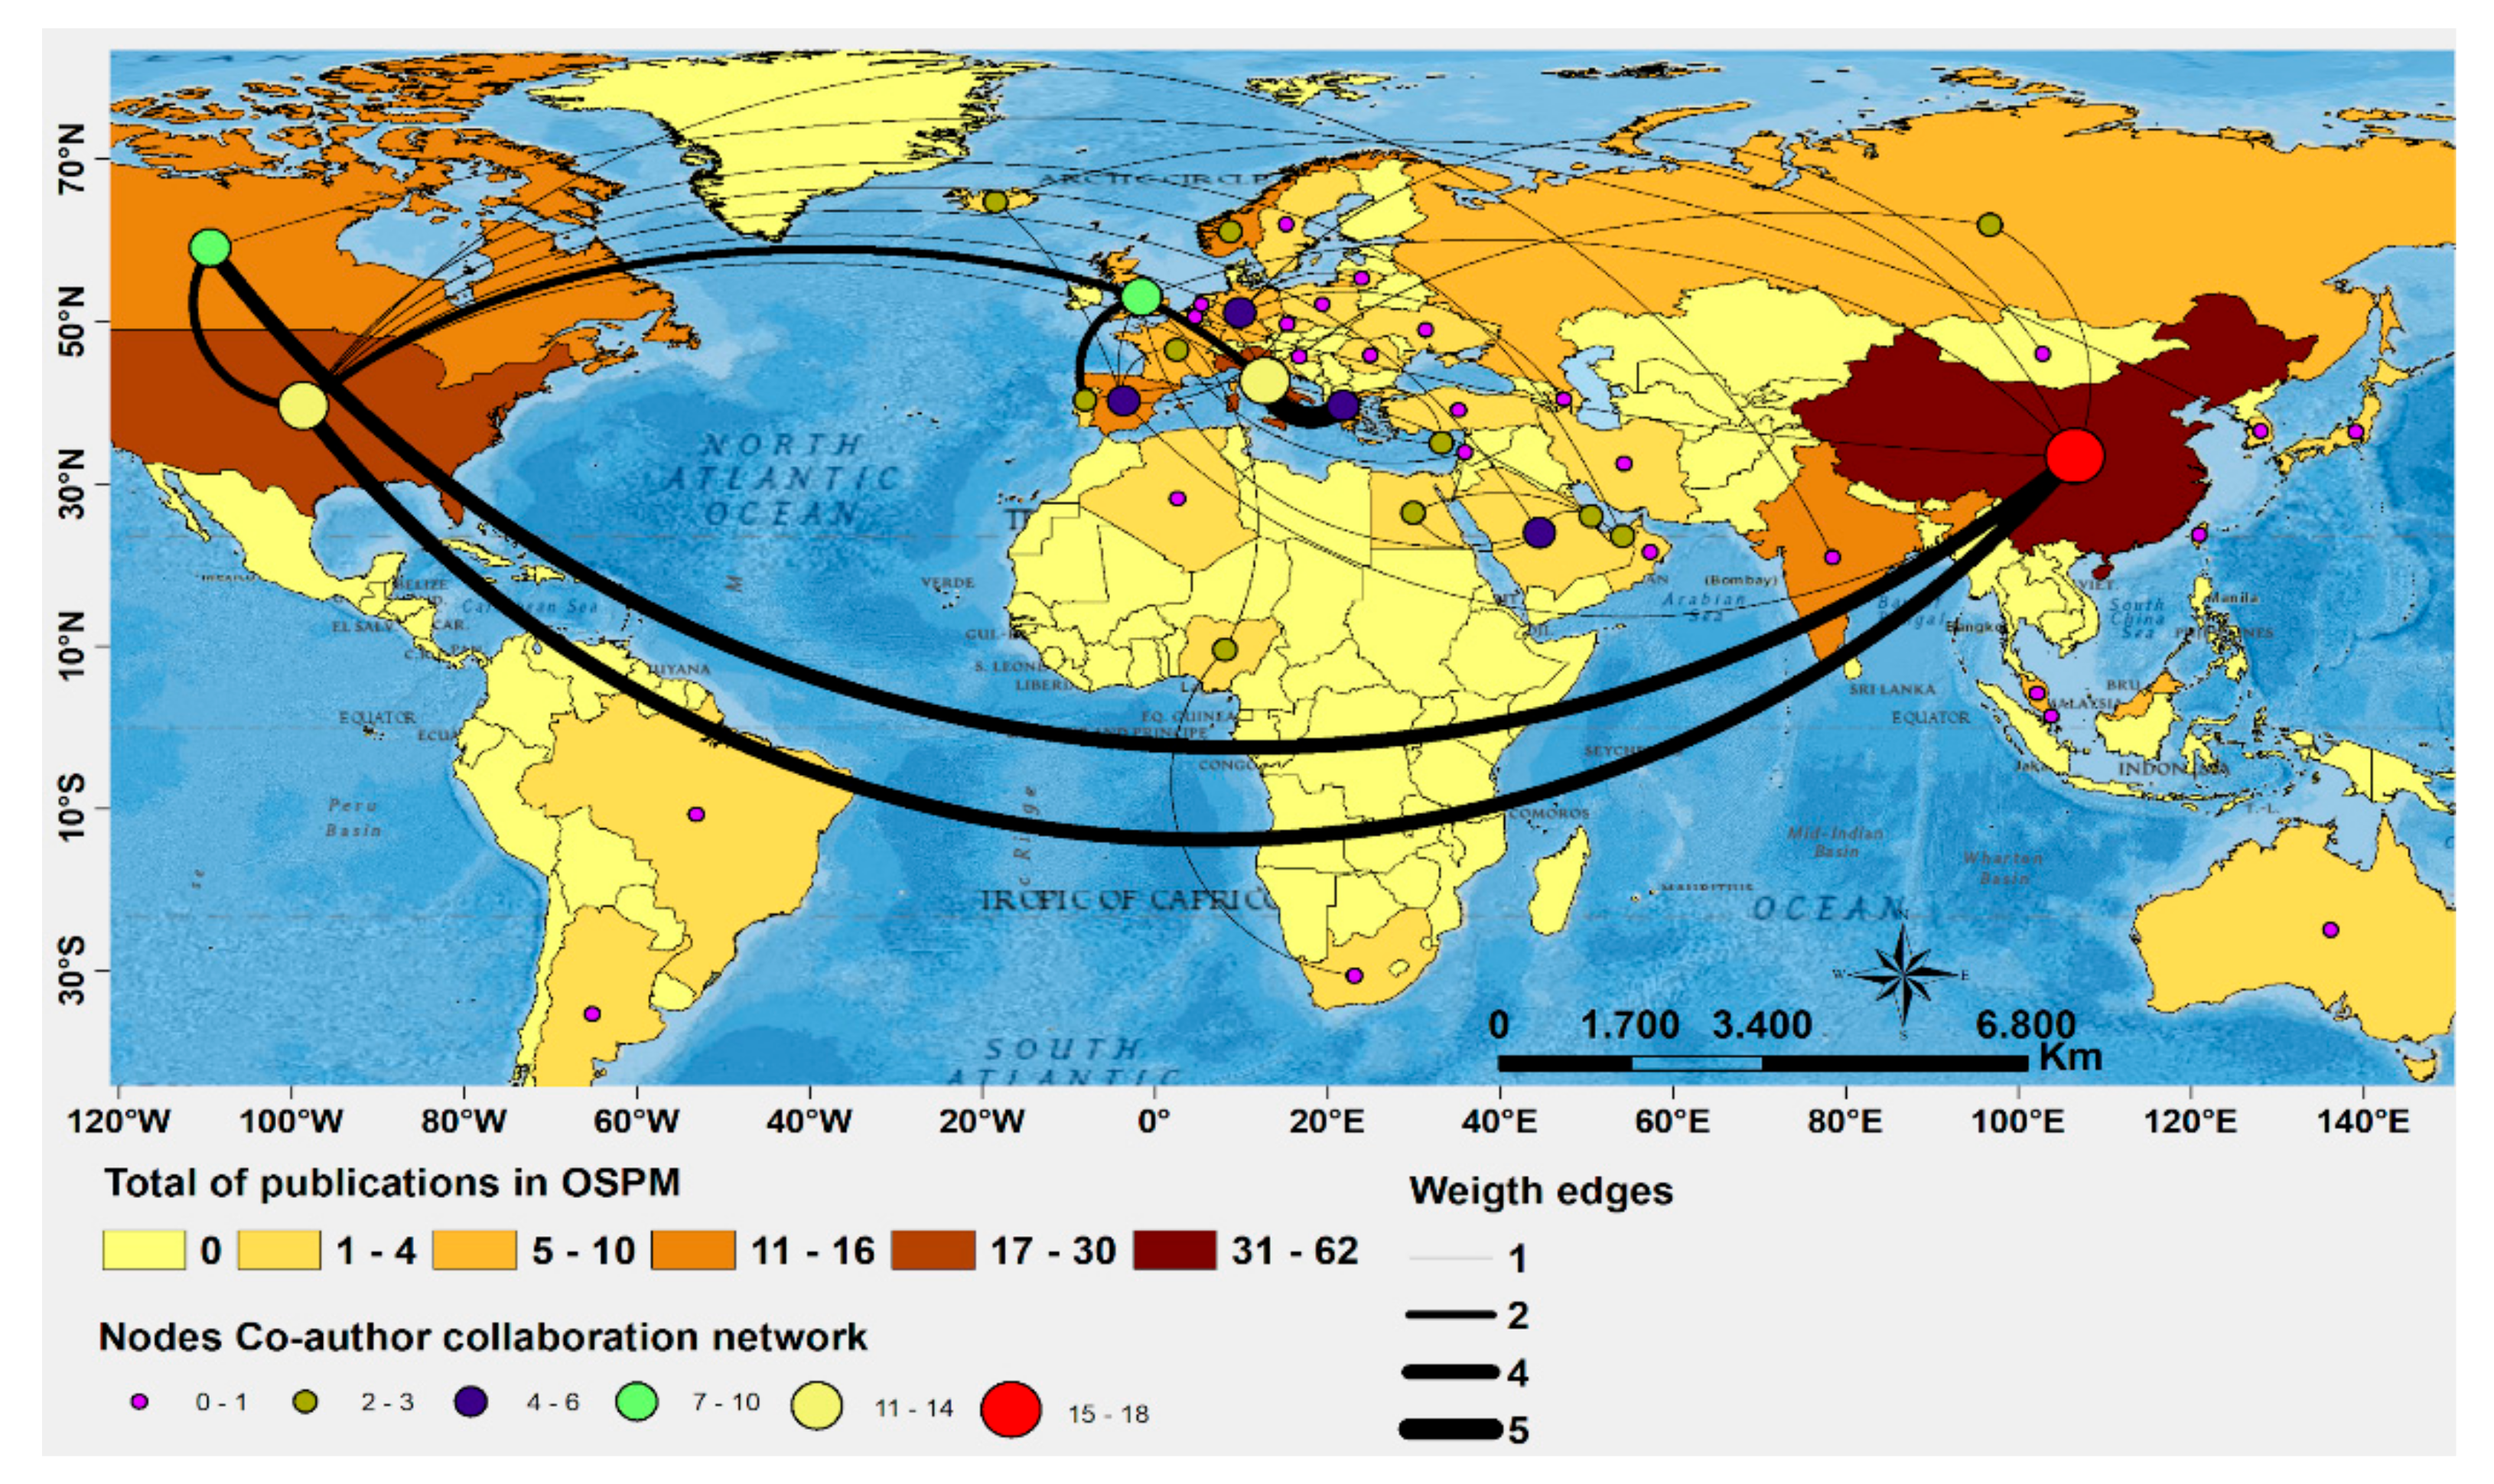
3.2. Countries Contributed to OSPM Research

We constructed a bibliometric network to visualize collaboration nets and the distribution of publications across the world regarding the application of OSPM (Figure 4). Results show a total of forty-five researchers (45) from different countries with at least one connection with each other. China ranked first, with a total of 61 (i.e., 26% of the total) documents, followed by Italy (30 docs ~12.8% of the total), United States (26 docs ~11.1% of the total), India (16 docs ~6.8% of the total), Spain (14 docs ~6% of the total), Canada (13 docs ~5.5% of the total), Norway (12 docs ~5.1% of the total), Germany (10 docs ~4.3% of the total), Greece (9 docs ~3.8% of the total), United Kingdom (8 docs ~3.4% of the total), (Figure 3 and Figure 4, Table S2).
Regarding the number of citations by countries, the United States ranked first, with a total of 1155 (27% of the total) documents, followed by Canada, Italy, Norway, China, Greece, Spain, United Kingdom, Germany and India, with 1030 (24% of the total), 976 (22,8% of the total), 519 (12.1% of the total), 436 (10.2% of the total), 269 (6.3% of the total), 161 (3.8% of the total), 119 (2.8% of the total) 105 (2.5% of the total) and 41 (1% of the total), respectively.
When only the number of total link strength is considered, described by the weight edges, the United States ranked first with a total of 18, followed by Italy, Canada, India, Greece, Germany, China, United Kingdom, Spain, Norway, with 14, 13, 10, 8, 6, 5, 5,2, 1 respectively. When we observe the relationship of scientific cooperation via publication between countries, the intensity of the links between the United States and China, the United States and Canada, Canada and China, Greece and Italy, the United Kingdom and Portugal, the United Kingdom and Italy is noteworthy (Figure 4). These connections are more evident between countries, indicating strong scientific cooperation on the subject.

3.3. Most Influential Publication Features in the OSPM Field

We evaluated the 25 most cited articles for the 50-year span, which accounted for ~10% of the total published papers between 1970–2019. The highest cited published papers can be seen in Tables S2 and S3. This subset represented 61.7% with 2.642 citations out of an overall total of 4.283 in the OSPM field (Tables S3 and S4). The top 10 most cited papers represented 45.1%, which corresponded to 1.923 citations (Table S4). The most cited article in the field of OSPM was from 1998 and had 760 quotations and represented 17.74% of all mentions. The decade that produced manuscripts with the highest number of citations was 1990 with 948 quotes (22.1%), followed by the 2000s and 2010s, with 919 and 18.1 775, respectively (Table S4).
The main terms and words most frequent in this top 25 subset were “spill detection”(24 occurrences), “SAR image” (21), “image analysis” (13), “remote sensing” (12), “detection method” (9), “radar imaging” (9), “satellite imagery” (9), “image classification” (8), “marine pollution” (8), and “algorithm” (6), respectively (Figure 3). The co-occurrence word networks presented 12 clusters totalizing 322 words. The largest cluster contained 40 words and in terms of conceptual approach it dealt with forecasting, pollution and prediction (Figure 3). Methodological approaches, evaluated targets, and sensor systems used in each of the top 25 articles can be seen in Table S3. Overall, all papers had the central objective of generating information regarding the detection of oil spills with different methodological approaches (Table S3). In all articles, oil spills were the main target to be identified, although in some studies other targets have been identified, for example, boats and soil contamination or even levels of pollution severity (Table S3). Except for one article, all the others used radar images to identify oil spills (Table S3). Only one of the manuscripts could be classified as an approach using hyperspectral images (Table S3). Moreover, in only three studies, it was possible to identify the use of a hybrid approach with the use of radar images and optical sensors to spot oil spills (Table S3). Only in one article we identified which sensor system was used (Table S2). In 12 studies, we observed the use of more than one type of radar image for oil spill detection. Of the total of sensor systems listed in the top 25 papers, the following stand out in many uses ranking ENVISAT ASAR with nine articles (17.3%), RADARSAT-1 with eight (15.4%), RADARSAT-2 seven (13.5%), ERS-2 SAR six (11.5), ERS-1 SAR five (9.6%), MODIS four (7.7%), MERIS three (5.8%), TerraSAR-X and UAVSAR with two, and 3.8% for each and Hyperspectral AISA, Landsat 7, Landsat 8, COSMO-SkyMed, ScanSAR, ALOS PALSAR with one paper (~2.0% for each one). The main methodological approaches used to detect oil spills are listed in Table S3. The methodological approaches that were most used were Artificial Neural Networks, Segmentation, Supervised Classification using different algorithms as such Support Vector Machine, Supervised Maximum Likelihood, Generalized Additive Model (Table S3).
There is a positive association of evolution and quality in detecting oil spills and the development and maturation of remote sensing as a science over the 25 most cited articles.
Through 50 years of peer-reviewed published material analyzed on this work using most cited 25 articles, we noticed a remarkable evolution in the digital processing image techniques, classification methods, and extracting relevant features useful to oil spill detection.
There was an association of evolution and quality improvement in detecting oil spills and the development and maturation of remote sensing as a science. Over the decades, the increasing number of published material was a clear sign of the gradual expansion in sensor systems’ availability and the increment in the images’ spatial and temporal resolution.
Another key point that prompted the search for refinement of oil spill detection methods was the occurrence of disasters. The search for more sophisticated techniques to determine the magnitude of the effects of these disasters served as a significant catalyst for improving detection methods. Besides that, it is important to remark that a few years ago satellite images could be costly but nowadays there are a great number of free images to download.
Over these 25 articles there was a consensus that SAR images provide a fundamental way for monitoring coastal and ocean waters, minimizing its potential adverse effects with a relatively extensive spatial coverage, short repeatability, day and night time, and in almost any climate condition. However, similar dark spots can arise from a range of unrelated meteorological (e.g., rain cells) and oceanographic phenomena (e.g., algae bloom), resulting in incorrect identification, known as look-alikes. Although there are limitations in the usage of optical images due to cloud cover, the auxiliary use of optical satellite images, such as multispectral and hyperspectral sensors, were pointed out as a plausible and suitable alternative in assisting SAR images in detecting oil spills from look-alike surface targets. Therefore, it is clear that there are still challenges associated with detecting oil spills with SAR-derived images in adverse weather conditions such as low wind and heavy rain, and biogenic films.
In specific situations, interpreter supervision was used as an alternative when SAR images were obtained in unfavorable conditions and in the absence of auxiliary data from optical sensor systems.
In the case of developing an automatic system for detecting oil spills, one should be cautious. Classifier balancing and training were the most common ones. Issues such as the low frequency of oil spills compared to the satellite-derived data remains a problem, even with the advance and abundance in the number of sensor systems and images available over the globe.
Machine learning and deep learning are the fundamental methods used over these 25 articles to identify real oil spills from the so-called look-alikes. On the other hand, processing in cloud computing environments was not evidenced over the 25 most cited articles, although it is a topic of great relevance.
According to the most influential publication features found in the neural network-related papers, the most used features in the top 25 articles are: area, perimeter, complexity, spreading, object standard deviation, background standard deviation, max contrast, difference, mean contrast, max gradient, mean gradient, gradient standard deviation, form factor, perimeter to area ratio, ratio between intensity and its standard deviation inside the dark area, granularity, shape, fractal dimension. They are widely used to classify a target as a real oil spill or just a look-alike.

3.4. Influential Journals in the OSPM Field

The highest number of published papers by journals can be seen in Figure 3. A total of 127 different journals, with an average of 2.54 publications per year. The top 10 journals in the context of OSPM are “IEEE Transactions on Geoscience and Remote Sensing” and “International Journal of Remote Sensing”, with a total of 12 articles which corresponds to 5.1% of the total documents for each one, followed by “IEEE Journal of Selected Topics in Applied Earth Observations and Remote Sensing” (10 papers and 4.3% out of the total), “Remote Sensing” (8 papers and 3.4% out of the total), “Sensors Switzerland” (7 papers and 3% out of the total), “Marine Pollution Bulletin” (6 papers and 2.6% out of the total), both “Acta Oceanologica Sinica”, “Journal of The Indian Society of Remote Sensing”, and “Spill Science and Technology Bulletin” (5 papers and 3.0% out of the total for each one), and finally “Applied Optics” with four articles corresponding to 1.7% of the total (Figure 3, Table S2).

3.5. Authors Contributing to OSPM Research

Taking into account the number of publications by authors, we found 159 different authors with an average of 1.25 authors per paper. The top 10 articles per author in the context of OSPM can be seen in Figure 3. Li, Y., and Marghany, M., ranked first, with a total of 9 and 3.8% of the total documents for each, followed by Zhang, Y., with 8 (3.4% of the total), Li, Yy., Liu, B., and Xu, J., with a total of 6 and 2.6% of the total documents for each, Jagdish, M., Jerritta, S., Karathanassi, V., Lacava, T., with a total of 5 and 2.1% of the total documents for each, respectively (Figure 3, Table S2).
Considering the author’s affiliation, 159 different institutions or organizations published at least one manuscript in the context of OSPM out of that 235 documents, with an average of 1.47 institutions or organizations per document. The top 10 affiliation institutions can be seen in Figure 3. It is possible to show that among this top 10 institutions, 50% are Chinese, 40% European, and 10% from Canada (Figure 3, Table S2). The Chinese Academy of Sciences ranked first, with a total of 15 documents (6.4% of the total), followed by Dalian Maritime University, Consiglio Nazionale delle Ricerche, European Commission Joint Research Centre, Ocean University of China, Deutsches Zentrum fur Luft- Und Raumfahrt, Chinese University of Hong Kong, Beihang University, National Technical University of Athens, University of Waterloo, with 11 (4.7% of the total), 10 (4.3% of the total), 10 (4.3% of the total), 8 (3.4% of the total), 7 (3.0% of the total), 6 (2.6% of the total), 6 (2.6% of the total), 5 (2.1% of the total) and 5 (2.1% of the total) documents, respectively (Figure 3, Table S2).
Similar to what was previously described, if one considered the number of institutions that funded scientific research related to OSPM, 59 names showed up, with an average of 4% institutions or organizations per publication. It is possible to show that among this top 10, 50% are Chinese, 20% European, 30% from the United States, and 10% each for Italy and Norway (Figure 3, Table S2). The National Natural Science Foundation of China ranked first, with a total of 24 documents (10.2% of the total), followed by Fundamental Research Funds for the Central Universities, Chinese Academy of Sciences, European Commission, European Space Agency, National Basic Research Program of China, National Aeronautics and Space Administration, Norges forskningsråd, Agenzia Spaziale Italiana, Doctoral Start-up Foundation of Liaoning Province, Ministero dell ‘Istruzione Ministero dell’ Università e della Ricerca, with 8 (3.4% of the total), 4 (1.7% of the total), 4 (1.7% of the total),4 (1.7% of the total),4 (1.7% of the total), 3 (1.3% of the total), 3 (1.3% of the total), 2 (0.9% of the total), 2 (0.9% of the total) and 1 (0.4% of the total) documents, respectively (Figure 3, Table S2).

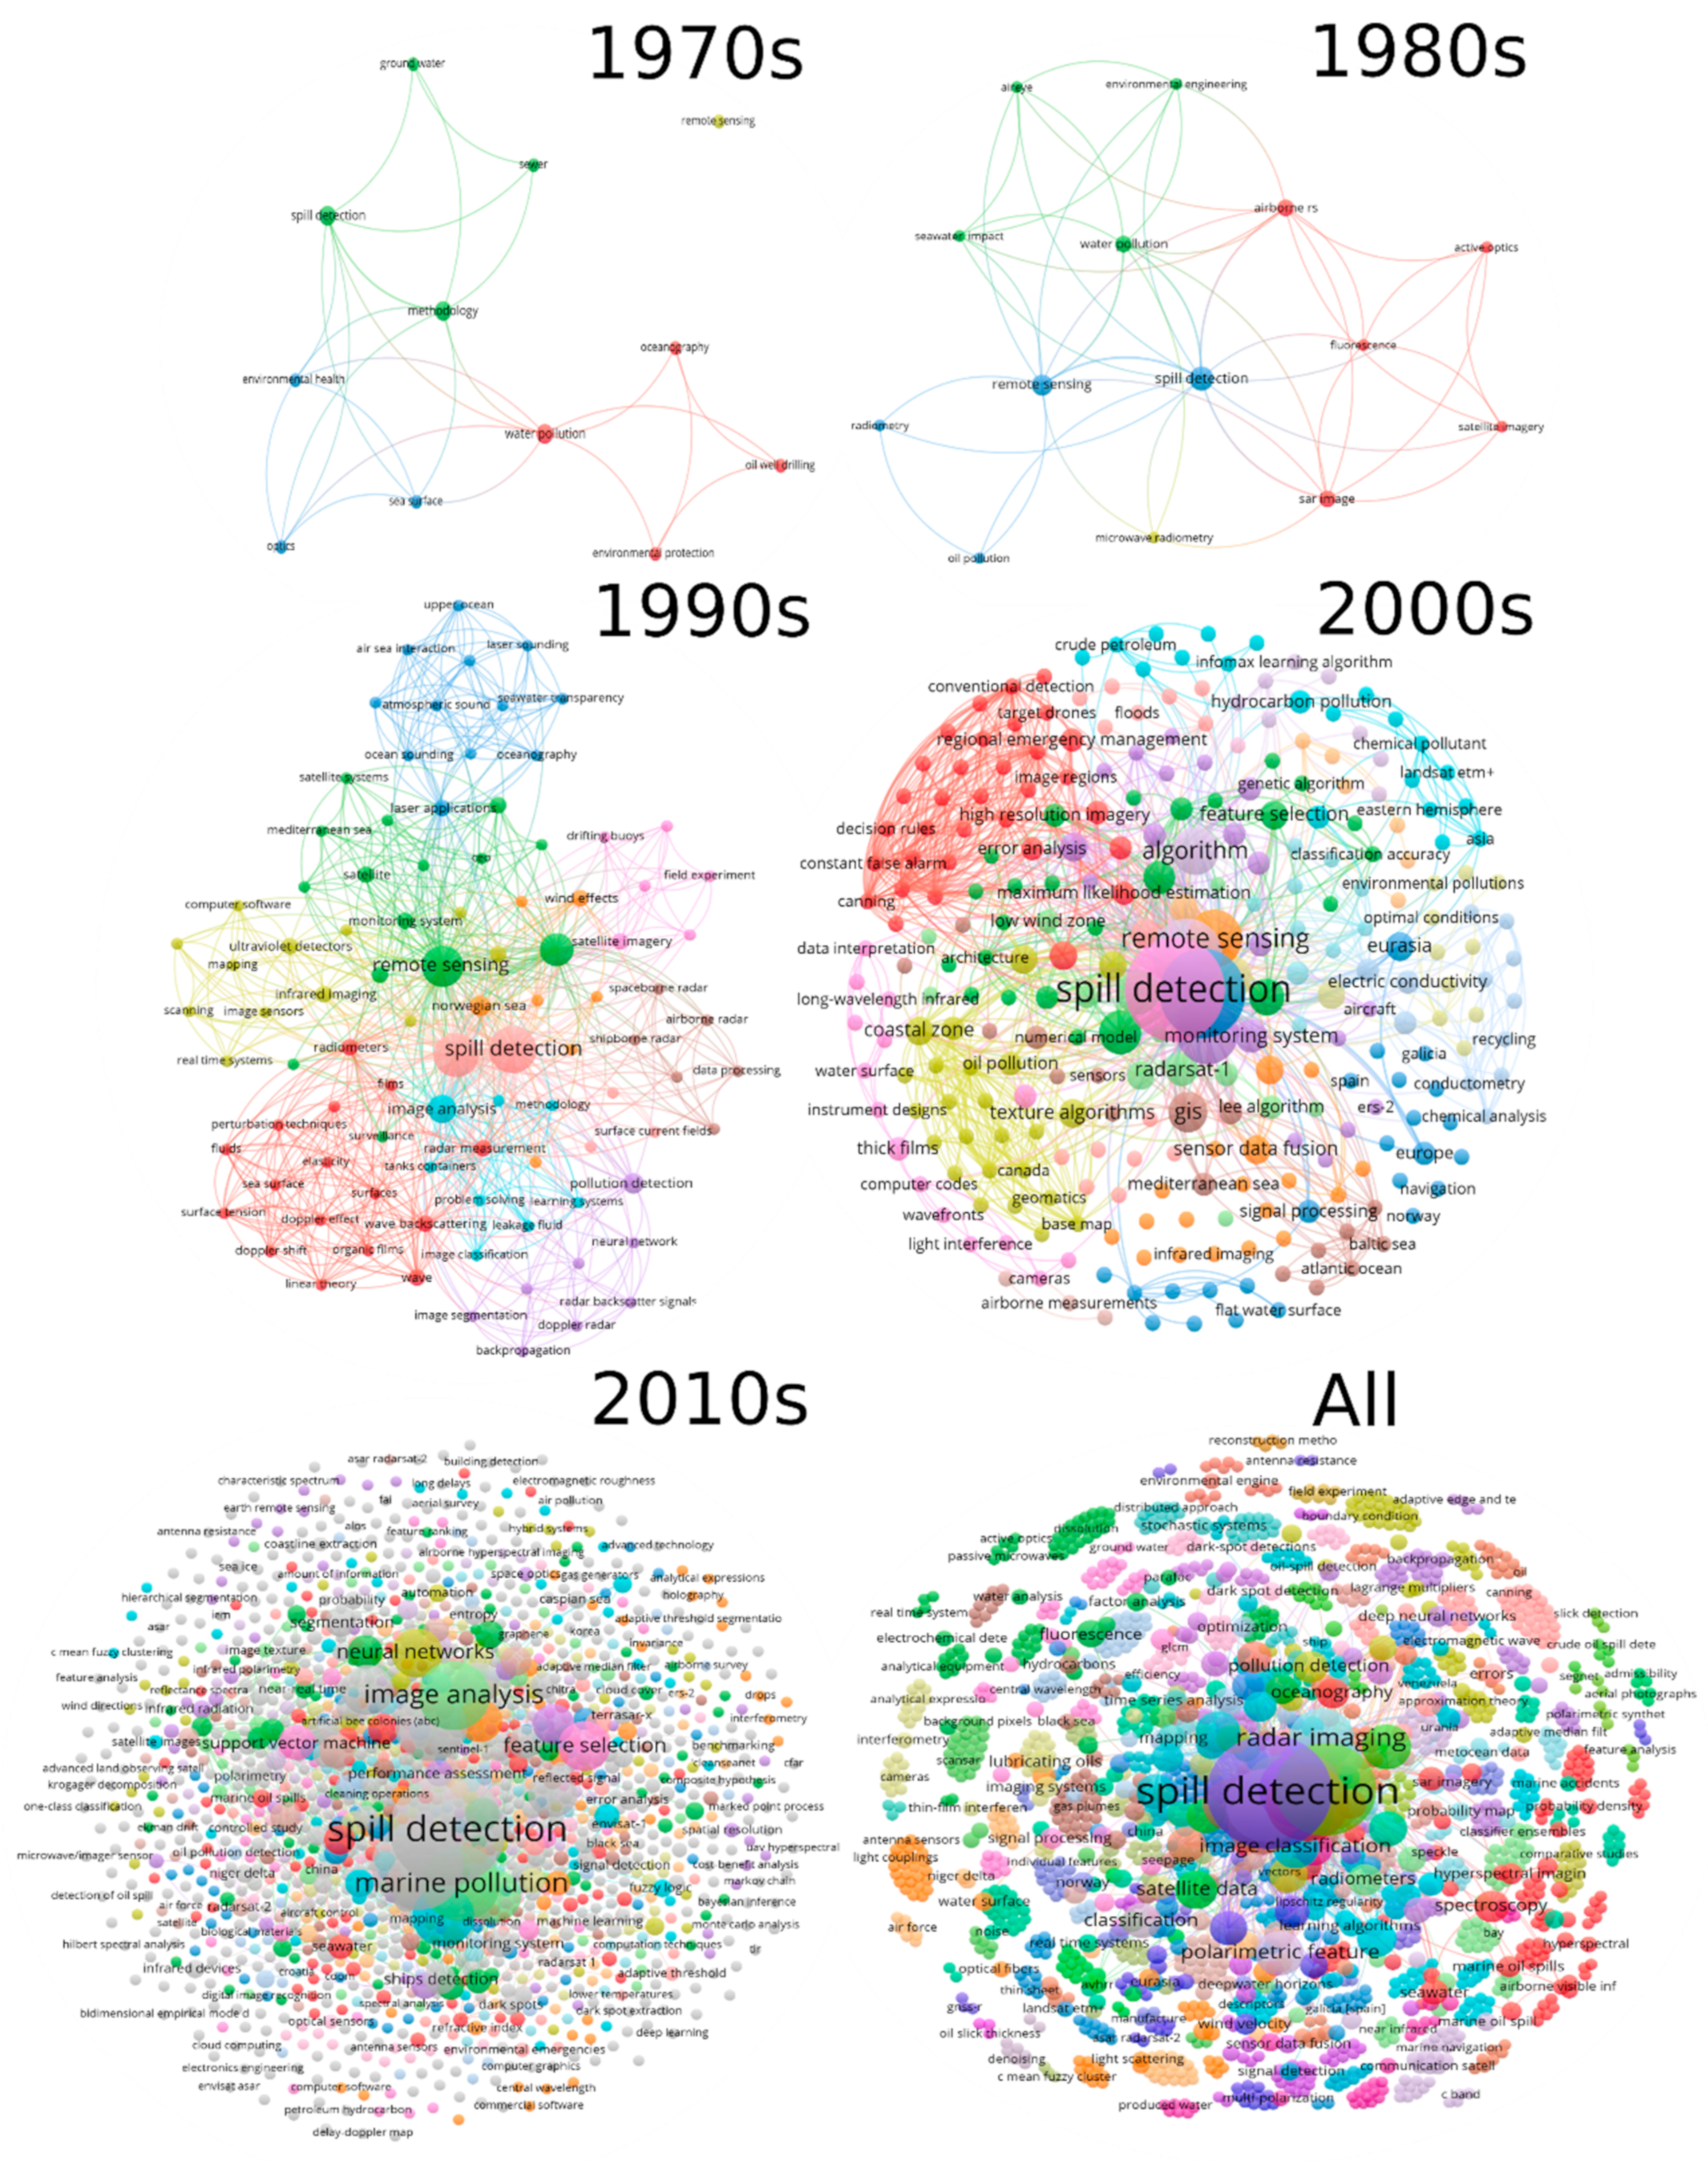
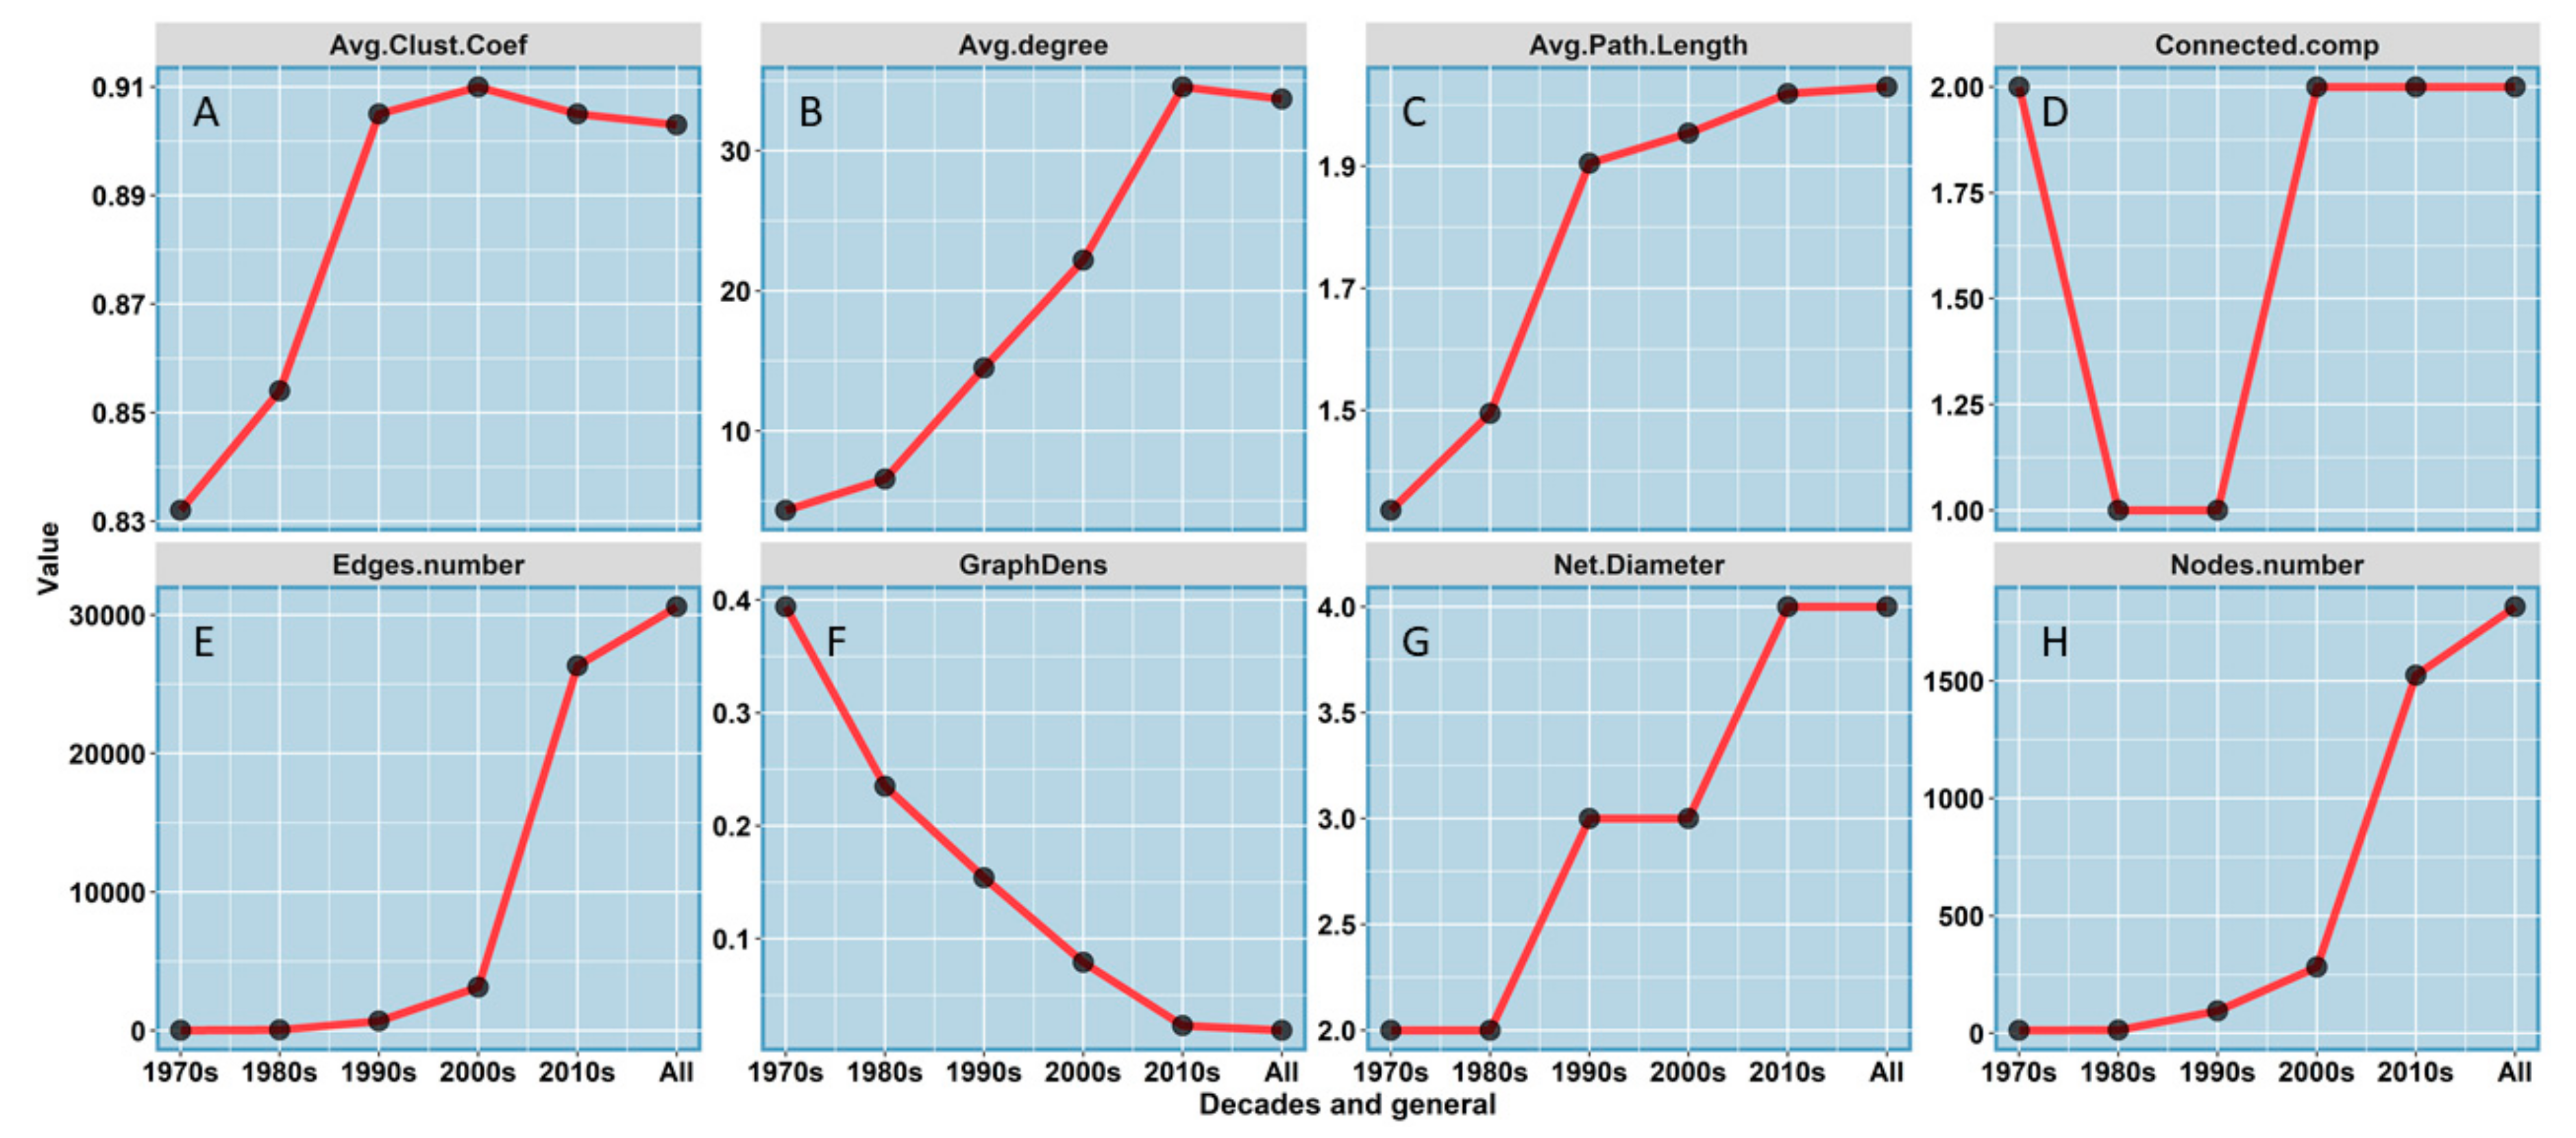
3.6. Decadal Topology of Research Focus and Semantic Networks

Figure 5 shows a co-word occurrence network analysis of the keywords, which can be used to identify the state-of-the-art. The OSPM research topic has been categorized into five colored clusters, following composition over time: 1970s (4 clusters), 1980s (4 clusters), 1990s (10 clusters), 2000s (17 clusters), 2010s (50 clusters), and a comprehensive network for the 50 years with 58 groups (Figure 6).
The ten words with the highest number of co-occurrences between decadal networks and the worldwide network, in general, were spill detection SAR image, marine pollution, remote sensing, image analysis, detection method, satellite imagery, algorithm, neural network, feature selection. These words are a strong indication that they represent important conceptual and methodological constructs associated with OSPM research literature. The largest cluster of each of the co-word networks and the broad network, including all five decades, was associated with the methods used to detect and monitor oil spots, classification algorithms, types of images, and investigated targets (Figure 5).
In terms of topological structure, the co-word networks presented a gradual increase in the number of words and their links over the decades. However, there is a decrease in the network density and just a small change in the average clustering coefficient (i.e., ~0.07), especially in the last three decades. This topological behavior indicates that when a set of new terms is added to the field, they are more likely to be linked to the old terms than to each other. This suggests that the evolution of the concepts, method and techniques in the area is not abrupt; instead, they show a gradual increase. This behavior reveals an increase in the area’s complexity, resulting in new approaches, themes, and interactions (Figure 5 and Figure 6).
Two components divided the 1970s network. The larger one consists of 26 vertices (Figure 5), representing almost 95% of the network vertices, while the other one has just one vertex (~5%). However, the 1980s and 1990s have only one component, with 46 and 689 vertices (Figure 5). Regarding the 2000s and 2010s, and the overall network for all years, both decades presented two components, with the largest part comprising 46 and 689 vertices (Figure 6). However, these last two decades and the worldwide network of all years, show the largest components consisting of 3126, 26329, and 30529 vertices (Figure 6), representing approximately 98.9%, 99.7% and 99.7% of the network vertices respectively. The second-largest component of the co-word network for the 1970s, the 2000s, the 2010s and the global network was 0, 3, 4, and 4 vertices, representing approximately 0%, 0.10%, and 0.02% and 0.02% of the network vertices, respectively. To avoid confusion or a misleading result, one should keep in mind that the zero value means that the 1970s network has either only one node or no connection at all to another word. However, this same network gives an average centrality degree of 4.33 and a density equal to 0.4; that is, only 4% of the network’s possible connections occur. Regarding the last four decades and the overall network, an average centrality degree of 6.57, 14.51, 22.19, 34.56, and 33.70 is observed, followed by a density value equal to 0.235, 0.154, 0.079, 0.023, and 0.019. These numbers correspond to 23.5, 15.4, 0.79, 0.23 and 0.19% of the possible connections in the network occur, respectively.
The 1970s network gives an average clustering coefficient of 0.8. The following four decades and the global network provide a coefficient of 0.85, 0.9, 0.9, 0.9, and 0.9, respectively.
The network diameter for the 1970s and the 1980s is the same and equals two, while the 1990s and the 2000s is a little higher (i.e., 3), and 2010s, as well as the worldwide network, amounts to four. The average path distance length between a pair of vertices for all the five decades increased over time: 1.3 in the (1970s), 1.5 (1980s), 1.9 (1990s), 1.95 (2000s), and 2.20 (2010s).
The most significant change in the network’s topology occurred between the 1980s and 1990s, increasing the clustering coefficient and the network’s average minimum path (Figure 6). This change occurred due to the inclusion of new techniques such as image analysis, perturbation techniques, and laser applications, mostly due to a new oceanographic approach shown in the dark blue module in the 1990s network.

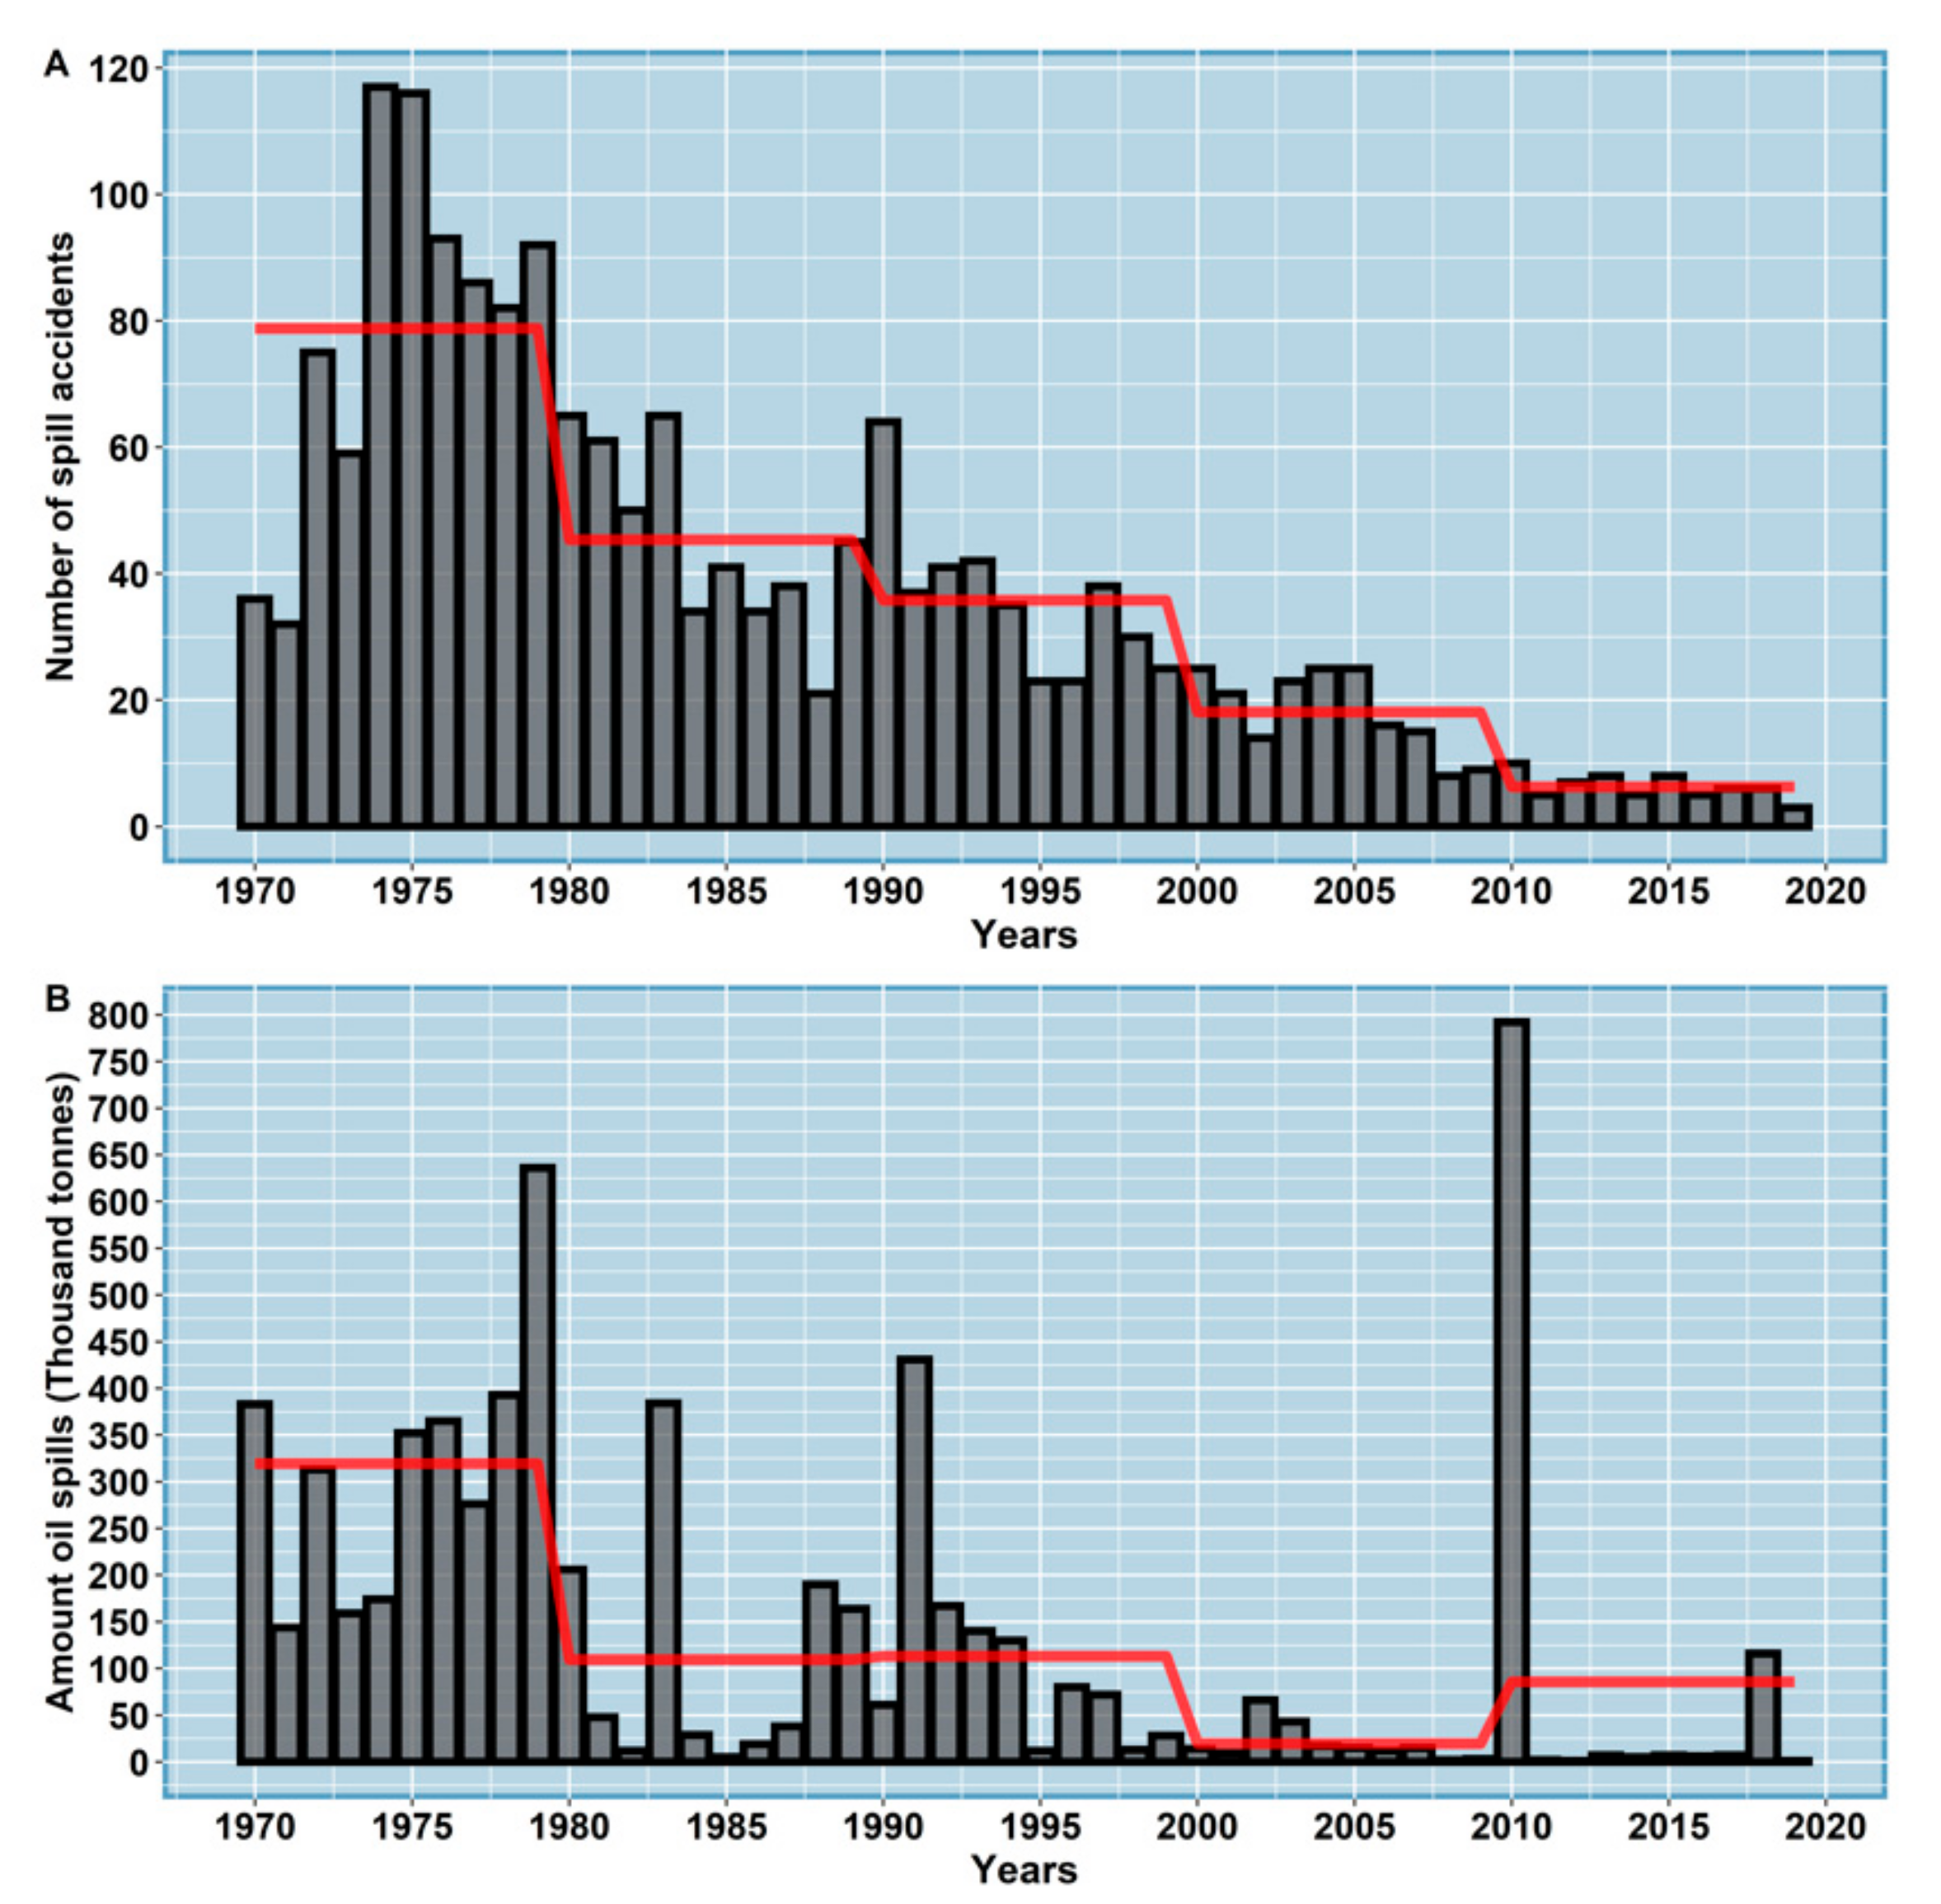
3.7. Amount and the Number of Oil Spill in the Last 50 Years

This result is based on the ITOPF data report [38] and the Max Roser database [39]. A general negative trend in the number of oil spills from tankers indicates a marked decrease of accidents with time (Figure 7A). A similar trend can be also seen in the amount of oil spills with time (Figure 7B) until 2010, when the Deepwater Horizon resulted in the worst oil disaster in oil drilling history, and then in 2018 off the Shanghai coastline, China, when the oil tanker named SANCHI spilled over 113,000 tonnes of oil (Table 3).
According to Table 3, almost all the recorded oil spill incidents took place before the year 2000, except for the oil tanker named SANCHI (9th ranking position), which occurred in 2018 off the Shanghai coastline, China, and the Deepwater Horizon oil drilling platform (1st ranking position) in 2010 (Gulf of Mexico). Although the PRESTIGE (2002, off Galician waters—Spain) and the EXXON VALDEZ (1989, off Alaskan waters—USA) are some of the most worldwide well-known disasters, the total amount of oil spilled was less than the KATINA P oil tanker (Table 3). These two vessels were responsible for oil spill sizes of 63,000 and 37,000 tons, respectively.

4. Discussion

An increasing trend in the number of publications was observed over the years. However, this increase was more evident in the mid-1990s, with a peak in 1996, following an increasing trend until the current decade. Moreover, part of the previous years’ production was higher than the general average of all years in some cases. This pattern can be explained by the increased frequency of the number of oil spills in the seas in the last decades [3,4], which has aroused the interest of scientists to create and improve new tools and useful technologies in the detection of oil spills in the seas. Another important point that influenced this increase can be seen by the rise in the number of sensor systems and the consequent increase in the availability of images to be used in the detection of spills [20,21,22,23,24,25,26,27,28].
From the perspective of subject categories of knowledge, the areas of Earth and Planetary Sciences, Engineering and Environmental Science were identified as the most influential in terms of the number of publications. This can be detected by the number of articles in each area and indicates that the field of OSPM is probably relevant in terms of the themes addressed by the frequency of publications [2,3,4].
The top four journals are all well-known journals in the field of remote sensing, IEEE Transactions on Geoscience and Remote Sensing, International Journal of Remote Sensing, IEEE Journal of Selected Topics in Applied Earth Observations, and Remote Sensing, all occupy a leading position concerning the number of articles published.
When considering the top four countries that stand out in terms of the number of publications, research support, and the number of authors, we found China, the United States, Canada, and Italy. This pattern can be evidenced in the co-authorship analysis of countries that determined that China, the United States, Canada, and Italy were at the center of international cooperation. Based on changing patterns and similarities in the presence of words and terms in the co-word networks over the decades, the general network of all years and the top 25 networks in terms of citations, it can be seen that oil spill detection, oil spill monitoring and remote sensing were the main foci in OSPM research over time.
An important observation regarding the use of sensor systems is that, in general, regardless of the decade or even in the case of the top 25 of the most cited articles, only one study did not use radar images to identify oil spills. Several other works corroborated this pattern and somehow drove the research in this field [2,3,4]. Another area that notoriously deserves more in-depth investigation is the use of hyperspectral images in the detection and monitoring of oil spills, although it has appeared in co-word networks in more recent decades. Optical sensor systems were less frequent; however, they were used and found in the word networks associated with the use of radar images, which determines the potential use of these images in conjunction with other sensor systems. In this sense, Modis and Landsat were the most frequent. When we consider classification methods and algorithms, undoubtedly, machine learning is the most frequently used technique. Algorithms such as artificial neural networks, Support Vector Machine, and Maximum Likelihood are the ones that stand out with higher frequency, regardless of the evaluated decade. It is clear that the OSPM field’s evolution reflects the dynamics associated with the topology of all the networks due to the increase in the number of words, terms, and their interplay. In fact, it refers to the tendency of the increasing complexity of research in terms of objectives, the volume of published data, and interactions between countries. These topology changes indicate that the developed approaches are gradual without the appearance of new disruptive concepts with the previous themes, having their biggest change in the 1990s with the emergence of new techniques. All calculated indices indicate that this field of investigation is expanding rapidly and remains active over time.

5. Conclusions

In this article, we revisit the relevant literature on oil spill detection and mapping from the last fifty years (1970–2019). We revealed aspects of great importance and interest in this field of knowledge, using the qualitative and quantitative word association network approach to give a clear overview of this field’s research trends for the past 50 years. We performed a bibliometric analysis with a systematic review. We found as an overall result that the main trends observed in this field of science, at this moment, are in frank expansion in terms of its conceptual, theoretical, and methodological approaches. The gradual increase in the number of new terms and words presented in the networks, as well as the intricate structure over the decades and their interactions, are also noticed.
Our results point to strong evidence that oil detection at sea has shown significant evolution in recent decades. This evolution is explained by the fact that there is a strong relationship between the technological evolution of detection and remote sensing data acquisition methods.
Among the countries that contributed most to this field of science, China, the United States and Canada stood out as the largest producers and disseminators of information in this research field.
Our study’s approach, which involves bibliometric techniques and tools, and the use of metrics that describe the structure of the networks, depicted meaningful advances related to better highlighting the general and specific research trends in this field of science.

Supplementary Materials

The following are available online at https://www.mdpi.com/2072-4292/12/21/3647/s1, Table S1—The table containing the results of the search was carried out on the Scopus base between the years 1970–2019 without carrying out the screening. The table is structured with the following fields: Citation information (Author (s), Author (s) ID, Document title, Year, EID, Source title, volume, issue, pages, Citation count, Source and document type, Publication Stage, DOI, Access Type), Bibliographical information (Affiliations, Serial identifiers (e.g., ISSN), PubMed ID, Publisher, Editor (s), Language of original document, Correspondence address, Abbreviated source title), Abstract & keywords (Abstract, keywords, Index keywords), Funding details (Number, Acronym, Sponsor, Funding text), Table S2—Feature information statistics based on the 50 years of documents published between 1970–2019, Table S3—Top 25 most referenced publications by articles in the field of OSPM, Table S4—Citation number by decades and summary of the twenty-five most cited documents published for the 50-year period (1970–2019) in the field of OSPM.

Author Contributions

Conceptualization, R.N.V., A.T.C.L., C.A.D.L., G.V.M., J.M.L., L.F.M., M.J.P., M.A.S. and E.C.B.C.; methodology, R.N.V., A.T.C.L., C.A.D.L., G.V.M. and E.C.B.C.; software execution, R.N.V., A.T.C.L., C.A.D.L. and E.C.B.C.; writing—original draft preparation, R.N.V., C.A.D.L., A.T.C.L., and E.C.B.C.; writing—review and editing, R.N.V., C.A.D.L., A.T.C.L., G.V.M., J.M.L., L.F.M., M.J.P., M.A.S. and E.C.B.C.; supervision, R.N.V., C.A.D.L. and A.T.C.L.; funding acquisition, A.T.C.L., C.A.D.L. and M.J.P. All authors have read and agreed to the published version of the manuscript.

Funding

This work was funded by INCT-GP and MCTI/CNPQ/CAPES/FAPS Nº 16/2014 process 465517/2014-5, PROGRAMA INCT and additive project entitled “Modeling, remote sensing, and preventive detection of oil/fuel accidents by MCTI/CNPQ/CAPES/FAPS 2019. During this work, the following authors were supported by research fellowship: RNV (CNPQ, process 103189/2020-3), JML (CNPQ, process 381139/2020-4), JGVM (CNPQ, process 307828/2018-2), ATCL (CNPQ, process 380653/2020-6), CADL (CNPQ, process 380671/2020-4), LFM (CNPQ, process 424495/2018-0 and 380652/2020-0).

Acknowledgments

We appreciate comments and suggestions from the anonymous reviewers that helped improve the quality and presentation of the manuscript.

Conflicts of Interest

The authors declare no conflict of interest.

References

  1. Singh, H.; Bhardwaj, N.; Arya, S.K.; Khatri, M. Environmental impacts of oil spills and their remediation by magnetic nanomaterials. Environ. Nanotechnol. Monit. Manag. 2020, 14, 100305. [Google Scholar] [CrossRef]
  2. Kingston, P.F. Long-term environmental impact of oil spills. Spill Sci. Technol. Bull. 2002, 7, 53–61. [Google Scholar] [CrossRef]
  3. Beyer, J.; Trannum, H.C.; Bakke, T.; Hodson, P.V.; Collier, T.K. Environmental effects of the Deepwater Horizon oil spill: A review. Mar. Pollut. Bull. 2016, 110, 28–51. [Google Scholar] [CrossRef] [PubMed] [Green Version]
  4. Li, P.; Cai, Q.; Lin, W.; Chen, B.; Zhang, B. Offshore oil spill response practices and emerging challenges. Mar. Pollut. Bull. 2016, 110, 6–27. [Google Scholar] [CrossRef] [PubMed]
  5. Lawa, R.J.; Kelly, C. The impact of the “sea empress” oil spill. Aquat. Living Resour. 2004, 17, 389–394. [Google Scholar] [CrossRef] [Green Version]
  6. Palinkas, L.; Downs, M.; Petterson, J.; Russell, J. Social, Cultural, and Psychological Impacts of the Exxon Valdez Oil Spill. Hum. Organ. 1993, 52, 1–13. [Google Scholar] [CrossRef]
  7. Piatt, J.F.; Ford, G.R. How many seabirds were killed by the Exxon Valdez oil spill? Am. Fish. Soc. Symp. 1996, 18, 712–719. [Google Scholar]
  8. Picou, J.S.; Gill, D.A.; Dyer, C.L.; Curry, E.W. Disruption and stress in an Alaskan fishing community: Initial and continuing impacts of the Exxon Valdez oil spill. Organ. Environ. 1992, 6, 235–257. [Google Scholar] [CrossRef]
  9. Millard, J.P.; Arvesen, J.C. Airborne Optical Detection of Oil on Water. Appl. Opt. 1972, 11, 102–107. [Google Scholar] [CrossRef]
  10. Gruner, K.; Bartsch, N.; Keydel, W.; Witte, F. Contributions to Oil-Spill Detection and Analysis with Radar and Microwave Radiometry: Results of the Archimedes II Campaign. IEEE Trans. Geosci. Remote Sens. 1987, 6, 677–690. [Google Scholar] [CrossRef]
  11. Krestenitis, M.; Orfanidis, G.; Ioannidis, K.; Avgerinakis, K.; Vrochidis, S.; Kompatsiaris, I. Oil spill identification from satellite images using deep neural networks. Remote Sens. 2019, 11, 1762. [Google Scholar] [CrossRef] [Green Version]
  12. Espedal, H.A.; Wahl, T. Satellite sar oil spill detection using wind history information. Int. J. Remote Sens. 1999, 20, 49–65. [Google Scholar] [CrossRef]
  13. Del Frate, F.; Petrocchi, A.; Lichtenegger, J.; Calabresi, G. Neural networks for oil spill detection using ERS-SAR data. IEEE Trans. Geosci. Remote Sens. 2000, 38, 2282–2287. [Google Scholar] [CrossRef] [Green Version]
  14. Shirvany, R.; Member, S.; Chabert, M. Ship and Oil-Spill Detection Using the Degree of Polarization in Linear and Hybrid/Compact Dual-Pol SAR. IEEE J. Sel. Top. Appl. Earth Obs. Remote Sens. 2012, 5, 885–892. [Google Scholar] [CrossRef] [Green Version]
  15. Minchew, B.; Jones, C.E.; Holt, B. Polarimetric analysis of backscatter from the deepwater horizon oil spill using l-band synthetic aperture radar. IEEE Trans. Geosci. Remote Sens. 2012, 50, 3812–3830. [Google Scholar] [CrossRef]
  16. Liu, P.; Li, Y.; Liu, B.; Chen, P.; Xu, J. Semi-automatic oil spill detection on X-band marine radar images using texture analysis, machine learning, and adaptive thresholding. Remote Sens. 2019, 11, 756. [Google Scholar] [CrossRef] [Green Version]
  17. Tong, S.; Liu, X.; Chen, Q.; Zhang, Z.; Xie, G. Multi-feature based ocean oil spill detection for polarimetric SAR data using random forest and the self-similarity parameter. Remote Sens. 2019, 11, 451. [Google Scholar] [CrossRef] [Green Version]
  18. Pisano, A.; Bignami, F.; Santoleri, R. Oil spill detection in glint-contaminated near-infrared MODIS imagery. Remote Sens. 2015, 7, 1112–1134. [Google Scholar] [CrossRef] [Green Version]
  19. Lacava, T.; Ciancia, E.; Coviello, I.; Di Polito, C.; Grimaldi, C.S.L.; Pergola, N.; Satriano, V.; Temimi, M.; Zhao, J.; Tramutoli, V. A MODIS-based robust satellite technique (RST) for timely detection of oil spilled areas. Remote Sens. 2017, 9, 128. [Google Scholar] [CrossRef] [Green Version]
  20. Brekke, C.; Solberg, A.H.S. Oil spill detection by satellite remote sensing. Remote Sens. Environ. 2005, 95, 1–13. [Google Scholar] [CrossRef]
  21. Jha, M.N.; Levy, J.; Gao, Y. Advances in remote sensing for oil spill disaster management: State-of-the-art sensors technology for oil spill surveillance. Sensors 2008, 8, 236–255. [Google Scholar] [CrossRef] [PubMed] [Green Version]
  22. Gens, R. Oceanographic applications of SAR remote sensing. GISci. Remote Sens. 2008, 45, 275–305. [Google Scholar] [CrossRef]
  23. Topouzelis, K.N. Oil spill detection by SAR images: Dark formation detection, feature extraction and classification algorithms. Sensors 2008, 8, 6642–6659. [Google Scholar] [CrossRef] [Green Version]
  24. Liu, Y.; MacFadyen, A.; Ji, Z.G.; Weisberg, R.H. Introduction to Monitoring and Modeling the Deepwater Horizon Oil Spill. Monit. Model. Deep. Horiz. Oil Spill A Rec. Break. Enterp. 2013, 195, 1–7. [Google Scholar] [CrossRef]
  25. Ambituuni, A.; Amezaga, J.; Emeseh, E. Analysis of safety and environmental regulations for downstream petroleum industry operations in Nigeria: Problems and prospects. Environ. Dev. 2014, 9, 43–60. [Google Scholar] [CrossRef]
  26. Catapano, I.; Affinito, A.; Bertolla, L.; Porsani, J.L.; Soldovieri, F. Oil spill monitoring via microwave tomography enhanced GPR surveys. J. Appl. Geophys. 2014, 108, 95–103. [Google Scholar] [CrossRef]
  27. Fingas, M.; Brown, C.E. A review of oil spill remote sensing. Sensors 2018, 18, 91. [Google Scholar] [CrossRef] [Green Version]
  28. Li, Y.; Chen, J.; Zhang, Y. Progress in Research on Marine Oil Spills Detection Using Synthetic Aperture Radar. Dianzi Yu Xinxi Xuebao/J. Electron. Inf. Technol. 2019, 41, 751–762. [Google Scholar] [CrossRef]
  29. Van Eck, N.J.; Waltman, L.; Van Den Berg, J.; Kaymak, U. Visualizing the computational intelligence field. IEEE Comput. Intell. Mag. 2006, 1, 6–10. [Google Scholar] [CrossRef] [Green Version]
  30. Van Eck, N.J.; Waltman, L. Bibliometric mapping of the computational intelligence field. Int. J. Uncertain. Fuzziness Knowl. Based Syst. 2007, 15, 625–645. [Google Scholar] [CrossRef]
  31. van Eck, N.J.; Waltman, L. Software survey: VOSviewer, a computer program for bibliometric mapping. Scientometrics 2010, 84, 523–538. [Google Scholar] [CrossRef] [Green Version]
  32. van Eck, N.J.; Waltman, L.; Noyons, E.C.M.; Buter, R.K. Automatic term identification for bibliometric mapping. Scientometrics 2010, 82, 581–596. [Google Scholar] [CrossRef] [Green Version]
  33. Andres, A. Measuring Academic Research; Chandos Publishing: Oxford, UK, 2009. [Google Scholar] [CrossRef]
  34. De Bellis, N. Bibliometrics and Citation Analysis from the Science Citation Index to Cybermetrics; De Bellis, N., Ed.; Scarecrow Press, Inc.: Lanham, MD, USA, 2009; ISBN 9780128019115. [Google Scholar]
  35. Viana, J.; Santos, J.V.; Neiva, R.M.; Souza, J.; Duarte, L.; Teodoro, A.C.; Freitas, A. Remote sensing in human health: A 10-year bibliometric analysis. Remote Sens. 2017, 9, 1225. [Google Scholar] [CrossRef] [Green Version]
  36. Hu, K.; Qi, K.; Guan, Q.; Wu, C.; Yu, J.; Qing, Y.; Zheng, J.; Wu, H.; Li, X. A scientometric visualization analysis for night-time light remote sensing research from 1991 to 2016. Remote Sens. 2017, 9, 802. [Google Scholar] [CrossRef] [Green Version]
  37. Elsevier Content—How Scopus Works—Scopus—Elsevier Solutions. Available online: https://www.elsevier.com/solutions/scopus/how-scopus-works/content (accessed on 27 September 2020).
  38. ITOPF. Oil Tanker Spill Statistics; Itopf Limited: London, UK, 2019. [Google Scholar]
  39. Roser, M. Oil Spills. Available online: https://ourworldindata.org/oil-spills (accessed on 27 September 2020).
  40. Van Eck, N.J.; Waltman, L. Text mining and visualization using VOSviewer. arXiv 2011, arXiv:1109.2058. [Google Scholar]
  41. Bastian, M.; Heymann, S.; Jacomy, M. Gephi: An open source software for exploring and manipulating networks. Int. AAAI Conf. Weblogs Soc. Media 2009, 8, 361–362. [Google Scholar]
  42. Cherven, K. Mastering Gephi Network Visualization. Produce Advanced Network Graphs in Gephi and Gain Valuable Insights into Your Network Datasets; Packt Publishing: Birmingham, UK, 2015; ISBN 9781783987344. [Google Scholar]
  43. Pachayappan, M.; Venkatesakumar, R. A Graph Theory Based Systematic Literature Network Analysis. Theor. Econ. Lett. 2018, 8, 960–980. [Google Scholar] [CrossRef] [Green Version]
  44. R Core Team. The R Project for Statistical Computing; R Foundation for Statistical Computing: Vienna, Austria, 2019; pp. 1–12. Available online: http://www.R-Project.Org/ (accessed on 1 January 2019).
  45. RStudio RStudio. Open Source & Professional Software for Data Science Teams—RStudio. Available online: https://rstudio.com/ (accessed on 27 September 2020).
  46. Wickham, H. Ggplot2: Elegant Graphics for Data Analysis; Version 3.6.1.; Springer: New York, NY, USA, 2016; ISBN 978-3-319-24277-4. [Google Scholar]
Figure 1. Logical scheme, methodological approach and data analysis for Phases 1 (blue color) and 2 (yellow color).
Remotesensing 12 03647 g001
Figure 2. (A) Annual growth rate of OSPM publications (black curve, left y-axis) compared to the cumulative annual growth (red curve, right y-axis) rate of all the manuscripts indexed in the Scopus database per year (1970–2019). (B) Boxplot by decades. Red diamonds inside the polygons represent the mean.
Remotesensing 12 03647 g002
Figure 3. Word co-occurrence network built for the top 25 papers using words presented in titles, abstracts, keywords, and general feature information of the 50 years of documents published between 1970–2019.
Remotesensing 12 03647 g003
Figure 4. Total of publications on OSPM and co-authoring collaboration network by countries from documents published between 1970–2019.
Remotesensing 12 03647 g004
Figure 5. Word co-occurrence network presented in titles, abstracts and keywords for each decade (1970s, 1980s, 1990s, 2000s, and 2010s), as well as for all the scientific articles published in the 50-year time frame (1970–2019).
Remotesensing 12 03647 g005
Figure 6. Similar to Figure 4, except for the topology metrics. Letters (AH) indicate a topological metric described in Table 2.
Remotesensing 12 03647 g006
Figure 7. Number of spill events (A) and amount of oil spill (B, in thousand tonnes) over last 50 years (i.e., 1970–2019 record) based on ITOPF data report and the Max Roser database. Red line indicates the mean of each decade, respectively.
Remotesensing 12 03647 g007
Table 1. Description of the relationship between working questions, analyses and data sources.
QuestionsAnalysisSource Data
What is the publishing trends of OSPM?General statistics/Word Co-ocurrence network/Co-author spatial networkAll papers
Which countries have contributed to OSPM research?General statistics/Co-author spatial networkAll papers
What are the influential publications in the OSPM field?General charactheristics and citation tables/Co-ocurrence network25s Most cited
What are the influential journals in the OSPM field?General statistics/General charactheristics and citation tablesAll papers/25s Most cited
Who has contributed to OSPM research?General statistics/General charactheristics and citation tables/Co-author spatial networkAll papers/25s Most cited
What is the research focus in different periods?Word Co-ocurrence networkAll papers
What are the main differences in terms of the semantic network topology more evident over decades?Topology metricsAll papers
What is the amount and the number of tanker spill in the last 50 years?Plots of amount and number of tanker spillRoser (2019)
What is the 20’s main tanker spill in the last 50 years?Table of 20s main tanker spillRoser (2019)
Table 2. Computed topological index and its description and characteristic.
MetricsDescriptionTopological Network Metrics Characteristics
Edges NumberAct as the connections that link them to one another a series of connections (edges). Remotesensing 12 03647 i001
Nodes NumberRefers to the amount of information present in the network. Remotesensing 12 03647 i002
Average Clustering CoefficientMeasure the level at which the nodes are grouped together, as opposed to being equally or randomly connected across the network. Scores on this measure will have an inverse correlation with other statistics, including several of the centrality calculations, particularly when we are speaking at the global level (the entire graph). Remotesensing 12 03647 i003
Average degreeAssess importance through the number of direct connections (degrees) one node has to other nodes. The assumption with degree centrality is that the number of connections is a key measure of importance or influence within the network. In an undirected network we do not have the luxury of determining whether one node exerts more or less influence in a relationship; we merely see that they are in fact connected and as such are weighted equally. Remotesensing 12 03647 i004
Average Path LengthThe clustering coefficient for the word co-occurrence network refers to the probability or level at which the words are grouped together. Indicates how each word is connected to its neighborhood. Average clustering coefficient is the average value of the individual or local coefficients. Remotesensing 12 03647 i005
Connected ComponentsNumber of distinct components within the network. When our network is fully connected, a value of 1 will be returned, so there is little need for this calculation. However, in very large networks it might be difficult to visually determine whether the network is fully connected, so we can use this function to ascertain the number of components. Remotesensing 12 03647 i006
Graph DensityMeasure of the level of connected edges within a network relative to the total possible value and is returned as a decimal value between zero and one. Graphs with values closer to one are typically considered to be dense graphs, while those closer to zero are termed as sparse graphs. Remotesensing 12 03647 i007
Network DiameterRefers to the maximum number of connections required to traverse the graph. Another way to look at it is knowing how many steps it takes for the two most distant nodes in the network to reach one another Remotesensing 12 03647 i008
Table 3. Top 20 oil spill disasters around the world based on the amount of spill size for the 1970–2019 record based on the public media.
Shipname/PlatformYearLocationSpill Size (Tonnes)
DEEPWATER HORIZON2010Macondo Prospect, Central Gulf of Mexico780,000
ATLANTIC EMPRESS1979Off Tobago, West Indies287,000
ABT SUMMER1991700 nautical miles off Angola260,000
CASTILLO DE BELLVER1983Off SaIdanha Bay, South Africa252,000
AMOCO CADIZ1978Off Brittany, France223,000
HAVEN1991Genoa, Italy144,000
ODYSSEY1988700 nautical miles off Nova Scotia, Canada132,000
SEA STAR1972Gulf of Oman115,000
SANCHI*2018Off Shanghai, China113,000
IRENES SERENADE1980Navarino Bay, Greece100,000
URQUIOLA1976La Coruna, Spain100,000
HAWAIIAN PATRIOT1977300 nautical miles off Honolulu95,000
INDEPENDENTA1979Bosphorus, Turkey95,000
JAKOB MAERSK1975Oporto, Portugal88,000
BRAER1993Shetland Islands, UK85,000
AEGEAN SEA1992La Coruna, Spain74,000
SEA EMPRESS1996Milford Haven, UK72,000
KHARK 51989120 nautical miles off Atlantic coast of Morocco70,000
NOVA1985Off Kharg Island, Gulf of Iran70,000
KATINA P1992Off Maputo, Mozambique67,000
Publisher’s Note: MDPI stays neutral with regard to jurisdictional claims in published maps and institutional affiliations.

