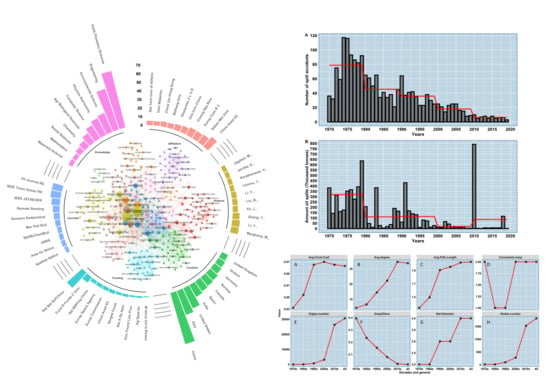
Oil Spill Detection and Mapping: A 50-Year Bibliometric Analysis
Abstract
1. Introduction
2. Materials and Methods
2.1. Bibliographic Base
2.2. Search Strategy and Screening Records
2.3. Semantic and General Network Analysis
3. Results
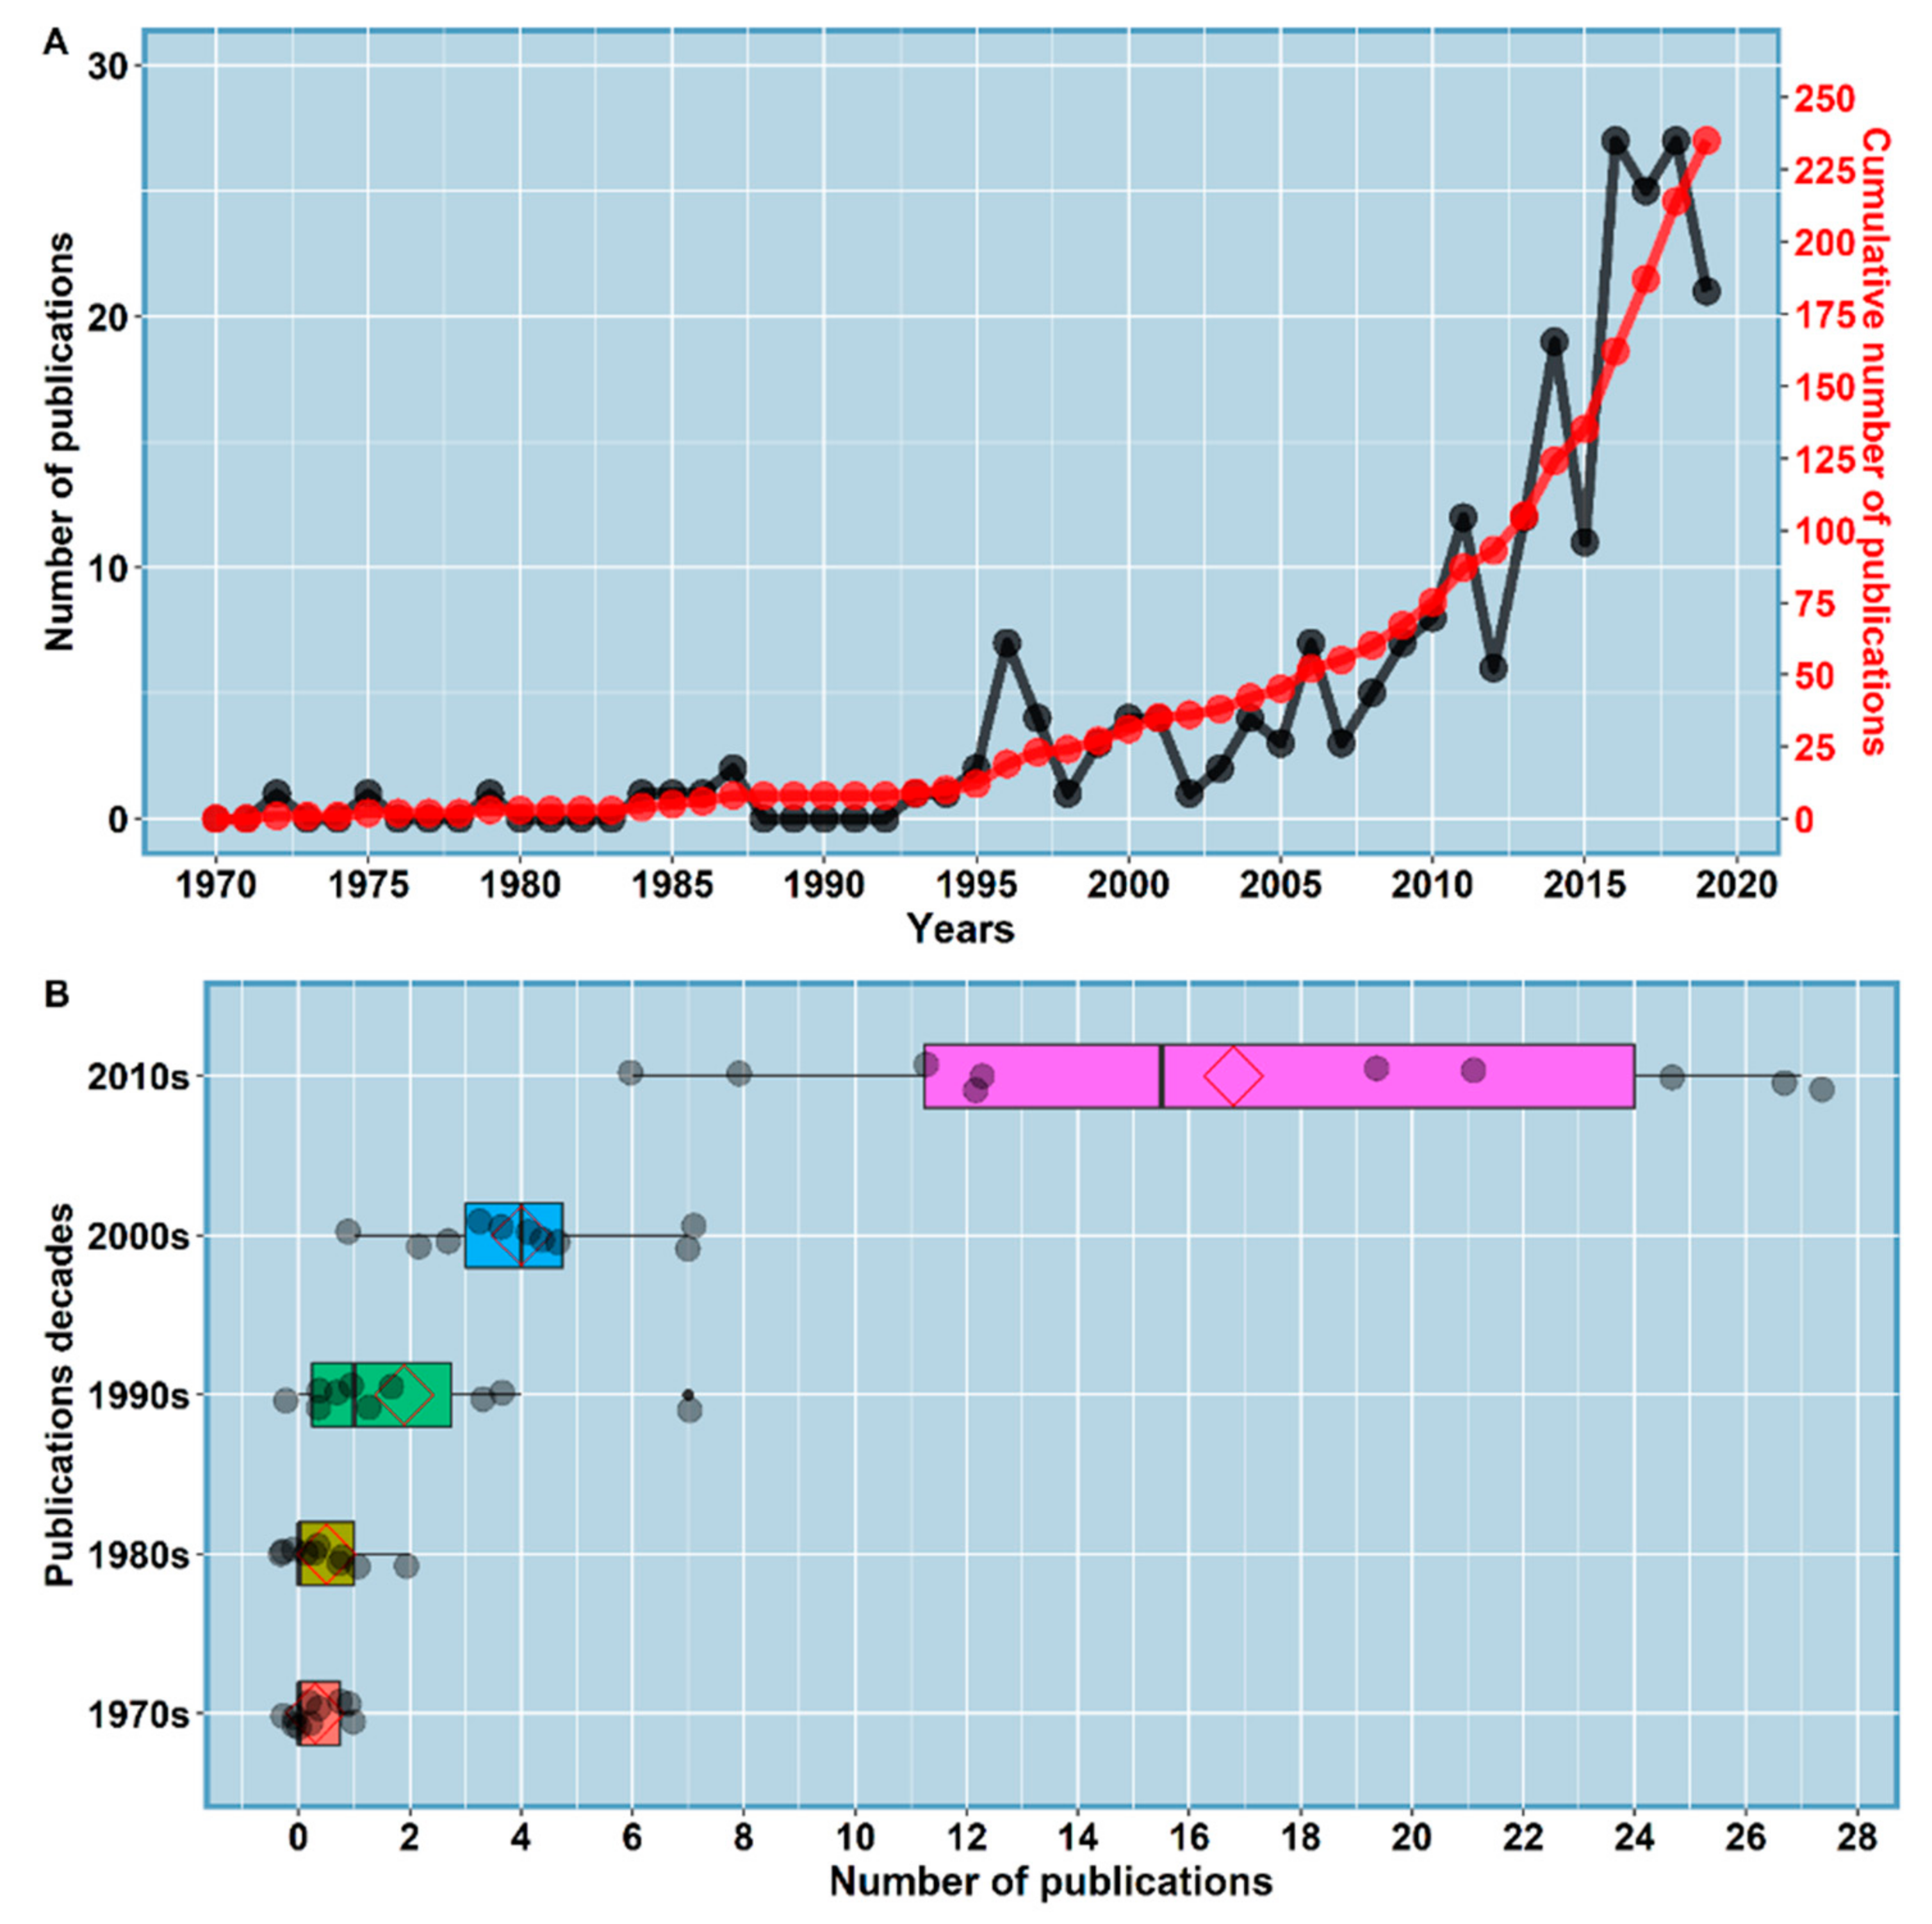
3.1. Publishing Trend of OSPM
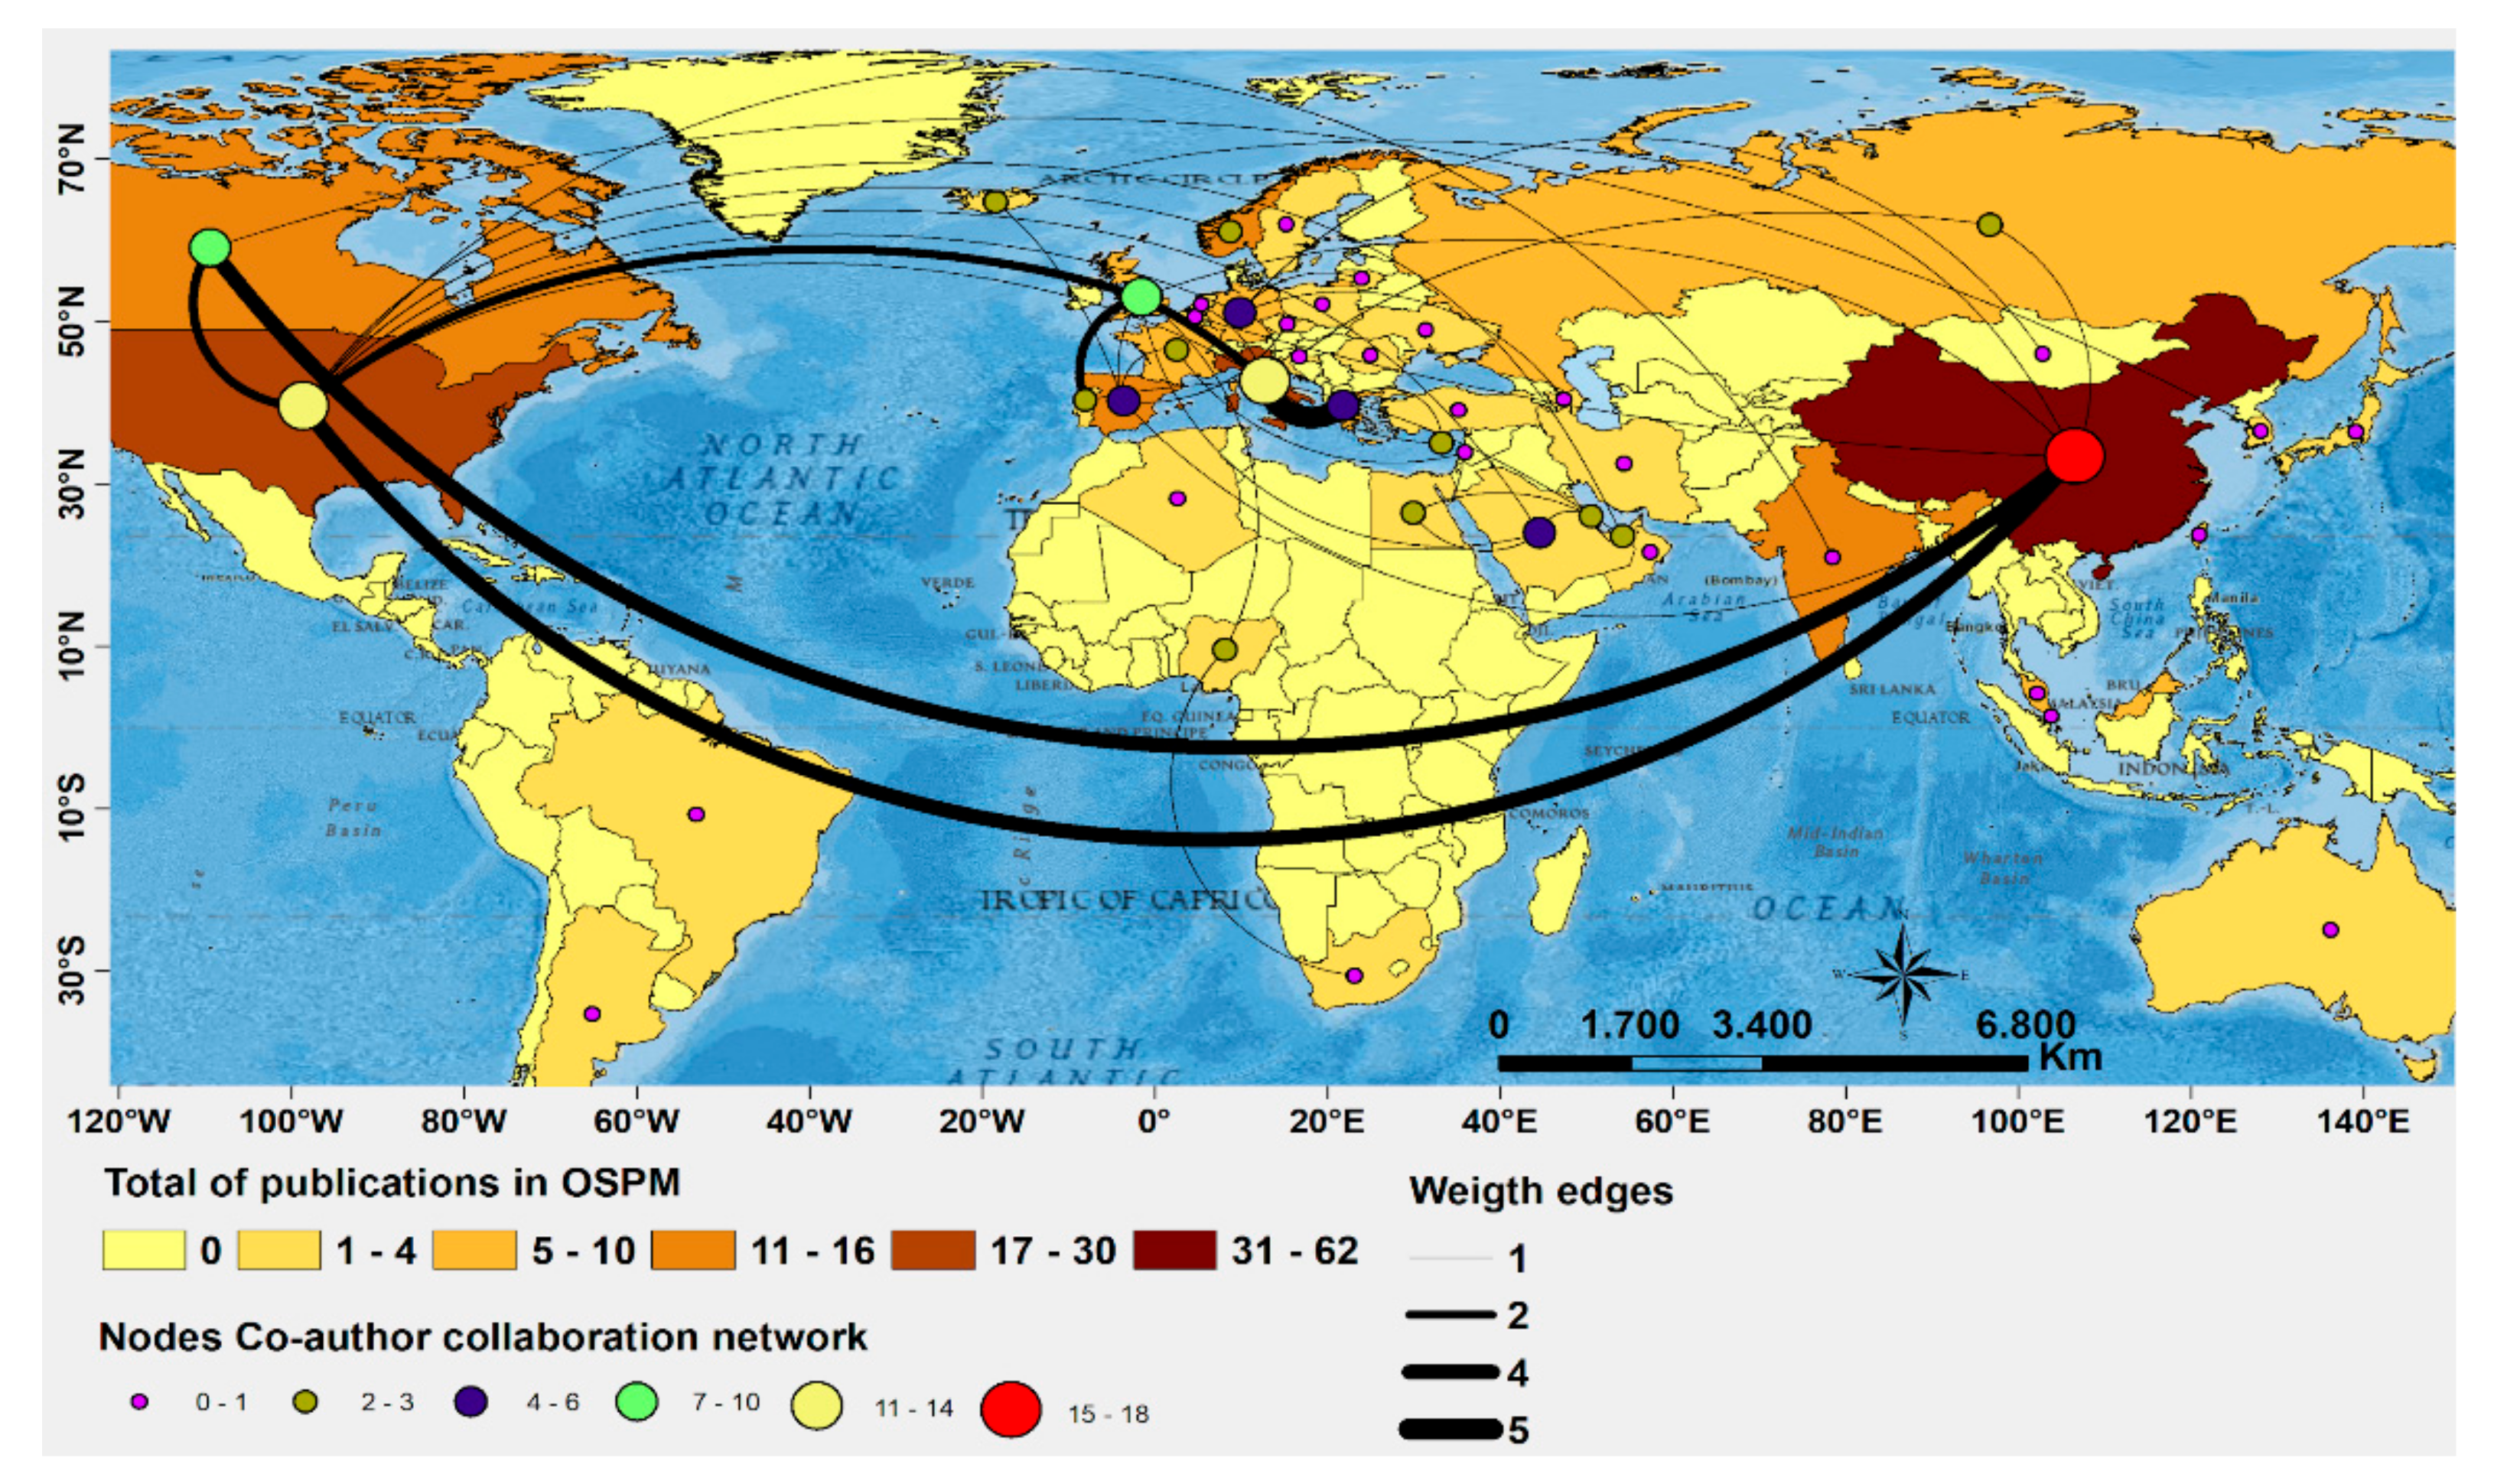
3.2. Countries Contributed to OSPM Research
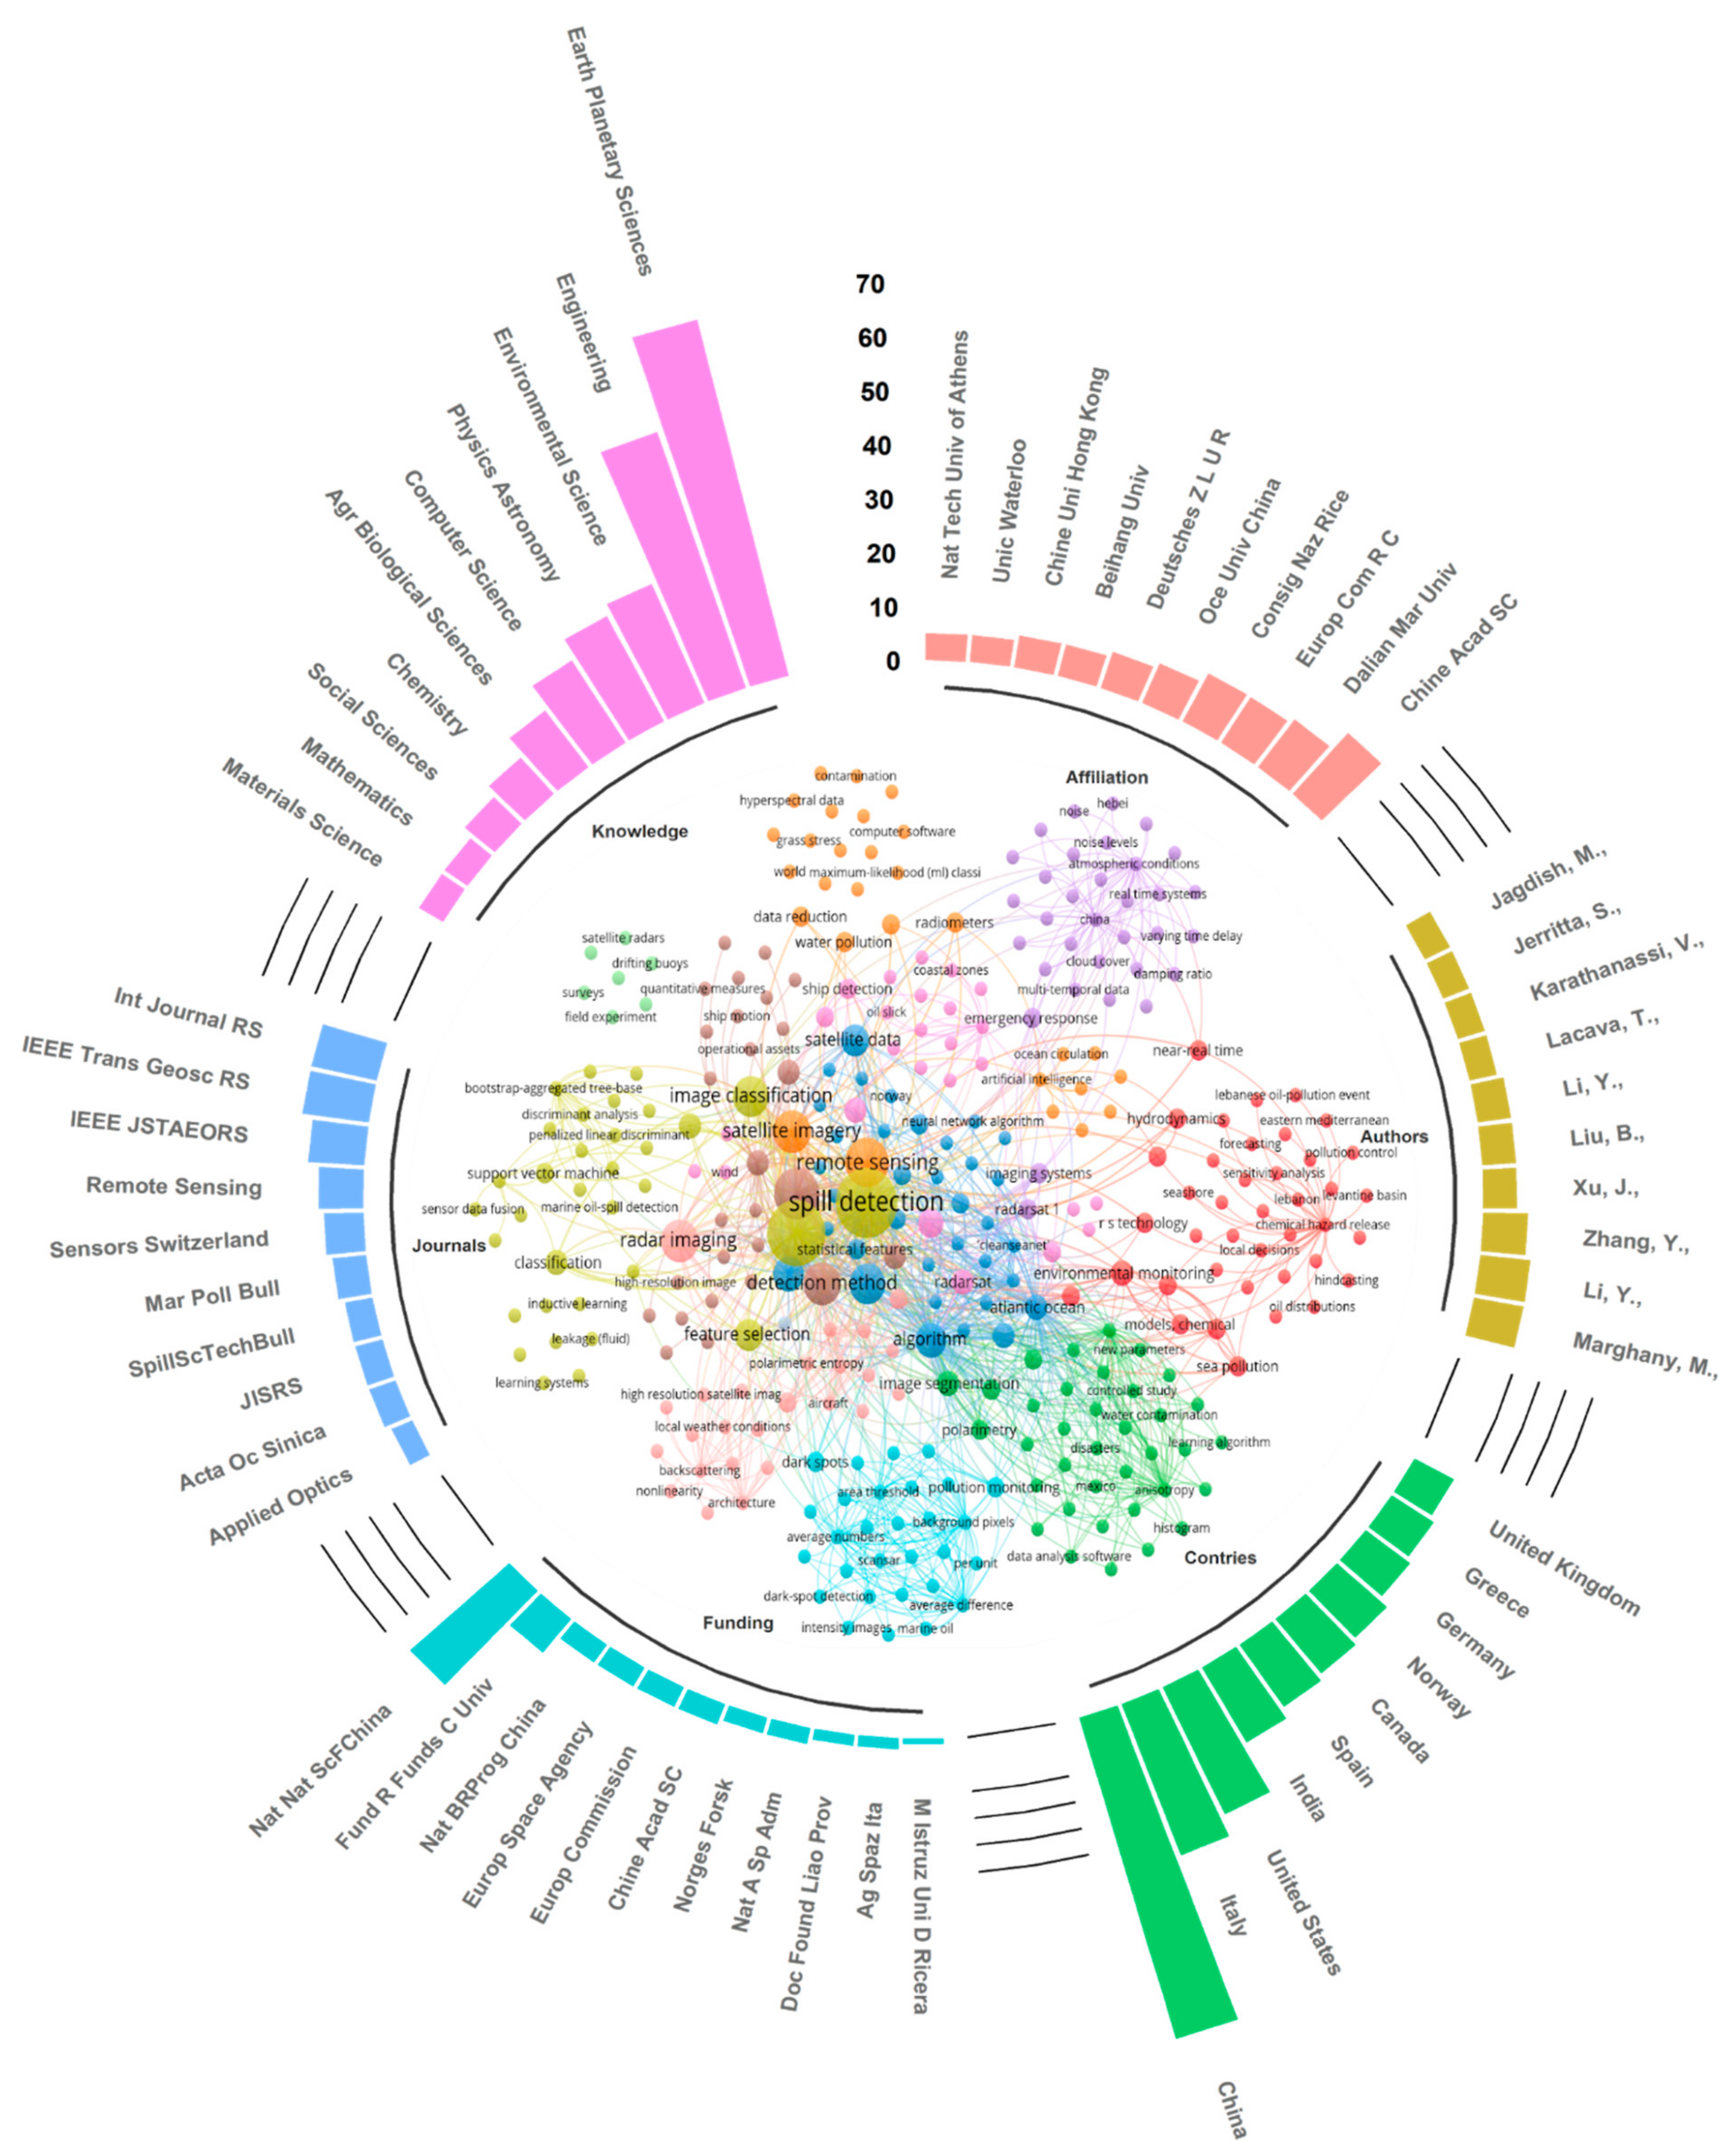
3.3. Most Influential Publication Features in the OSPM Field
3.4. Influential Journals in the OSPM Field
3.5. Authors Contributing to OSPM Research
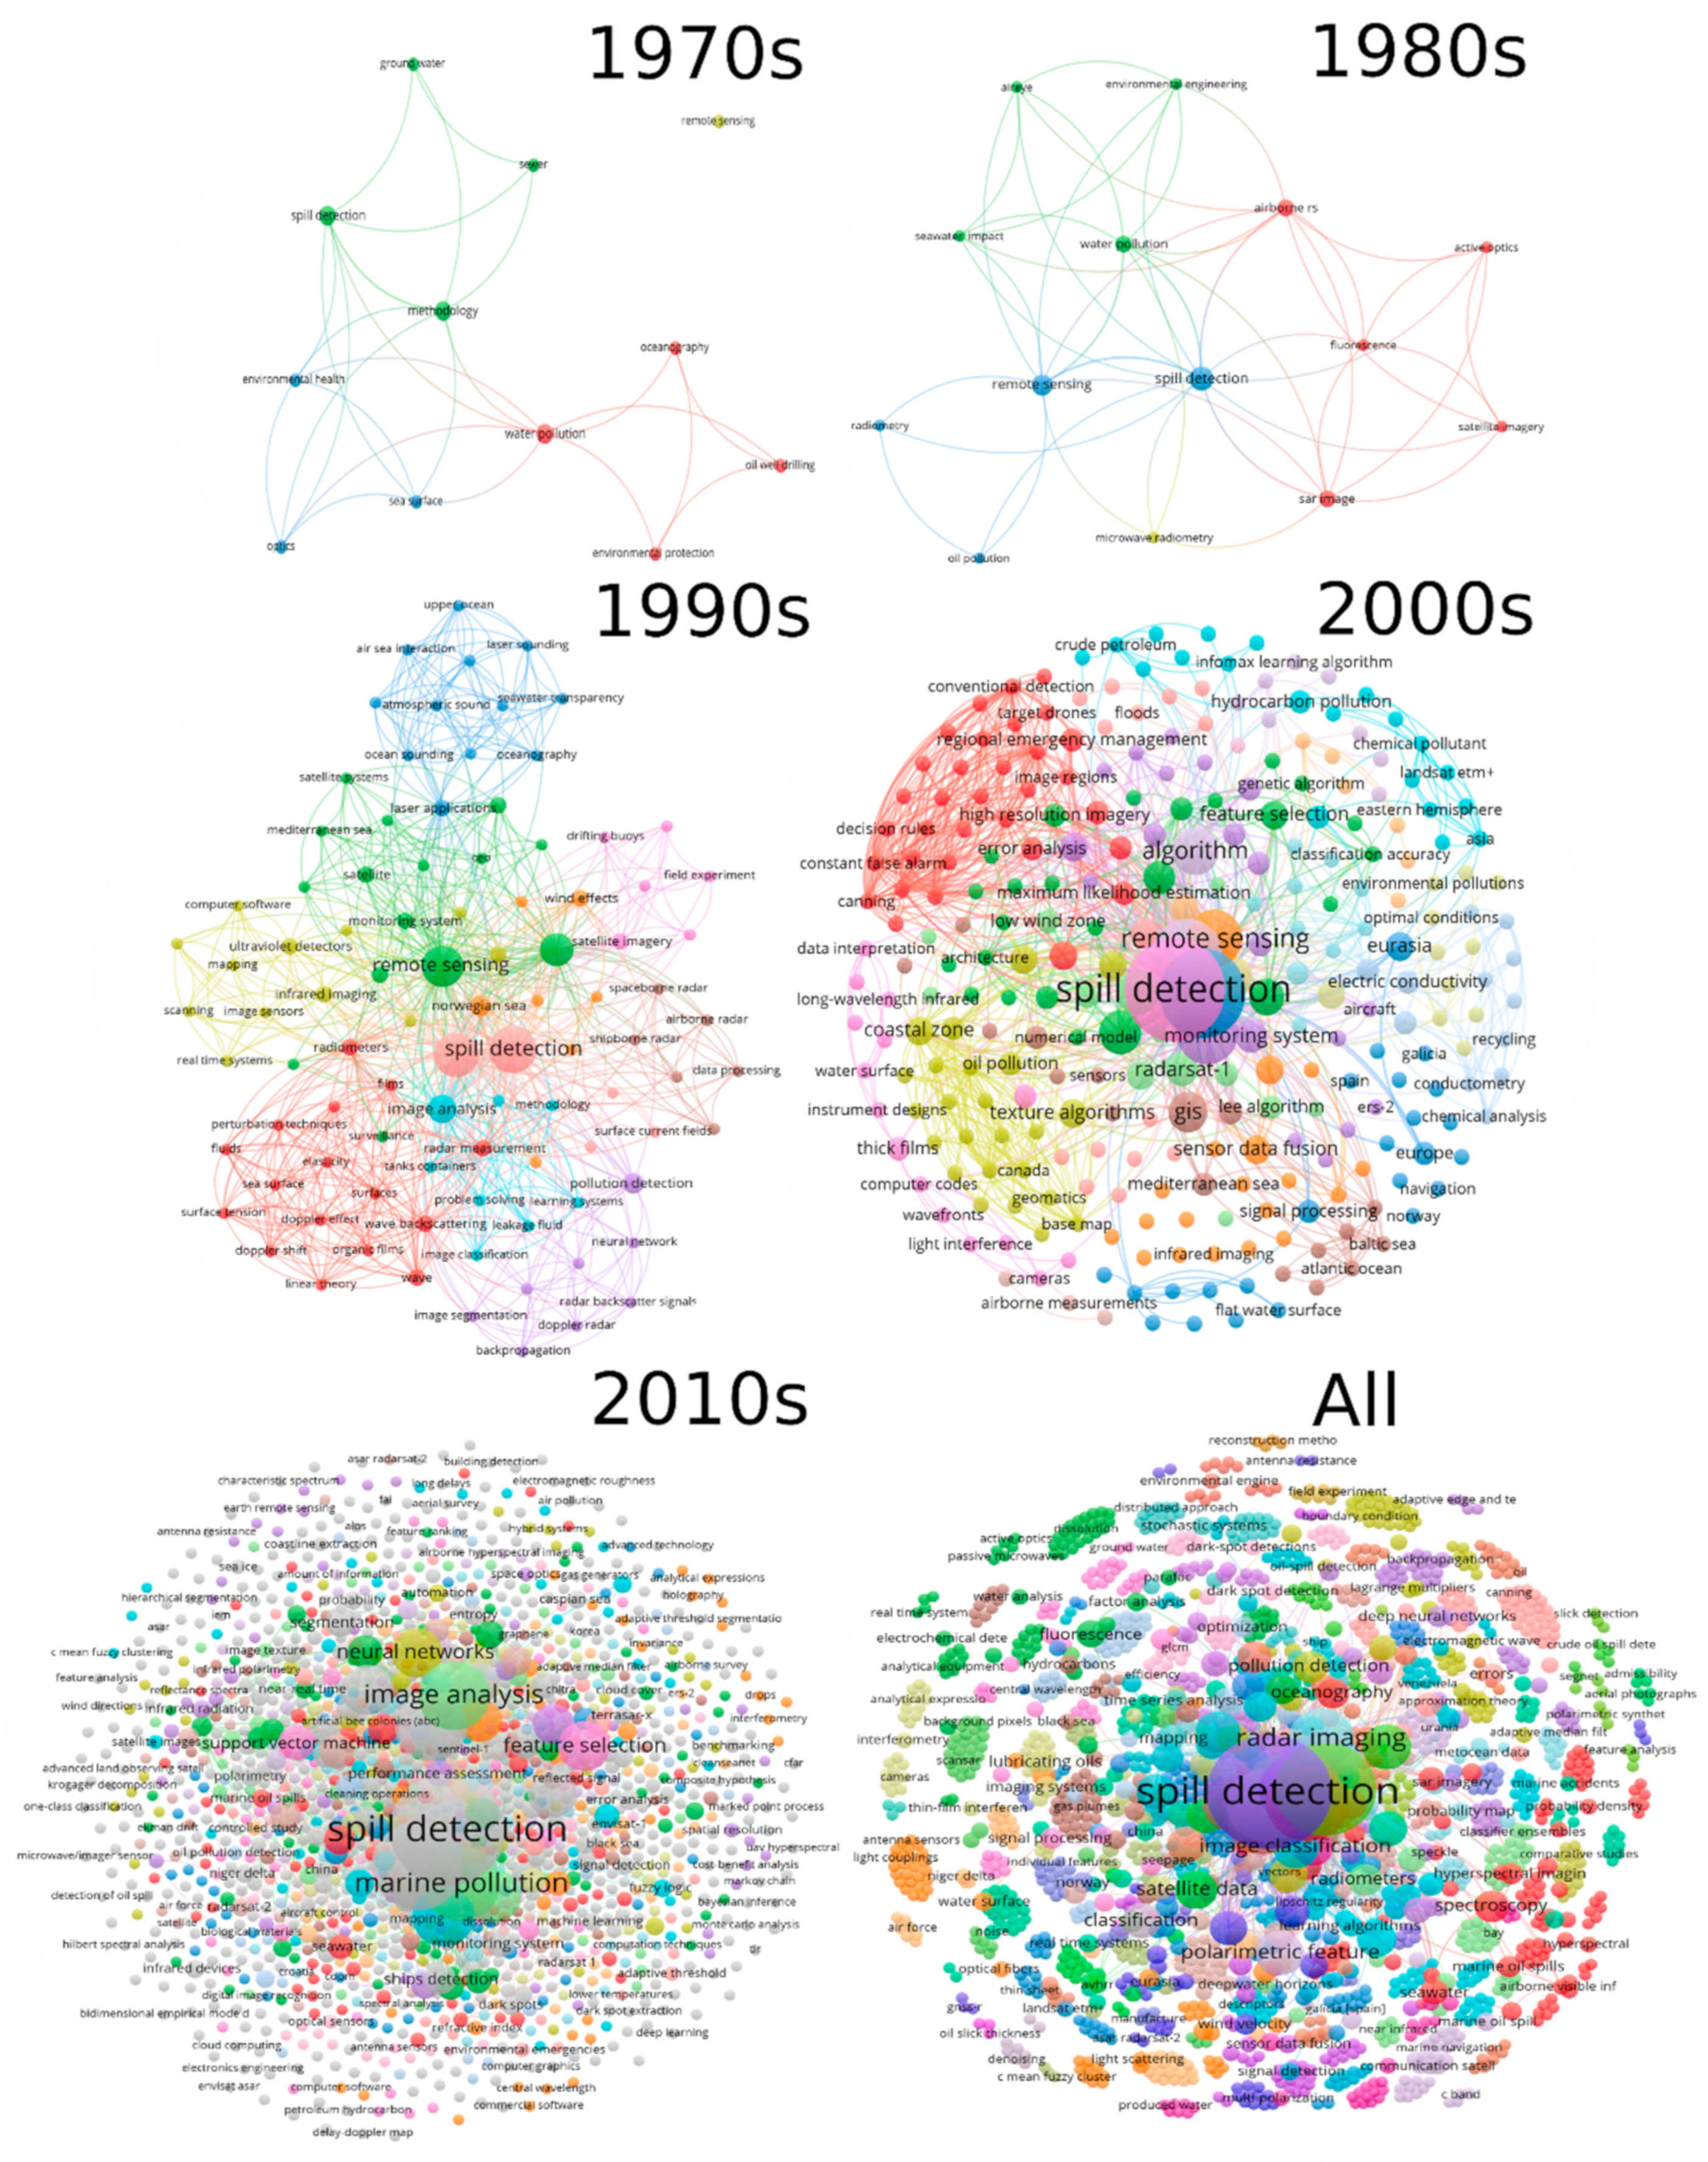
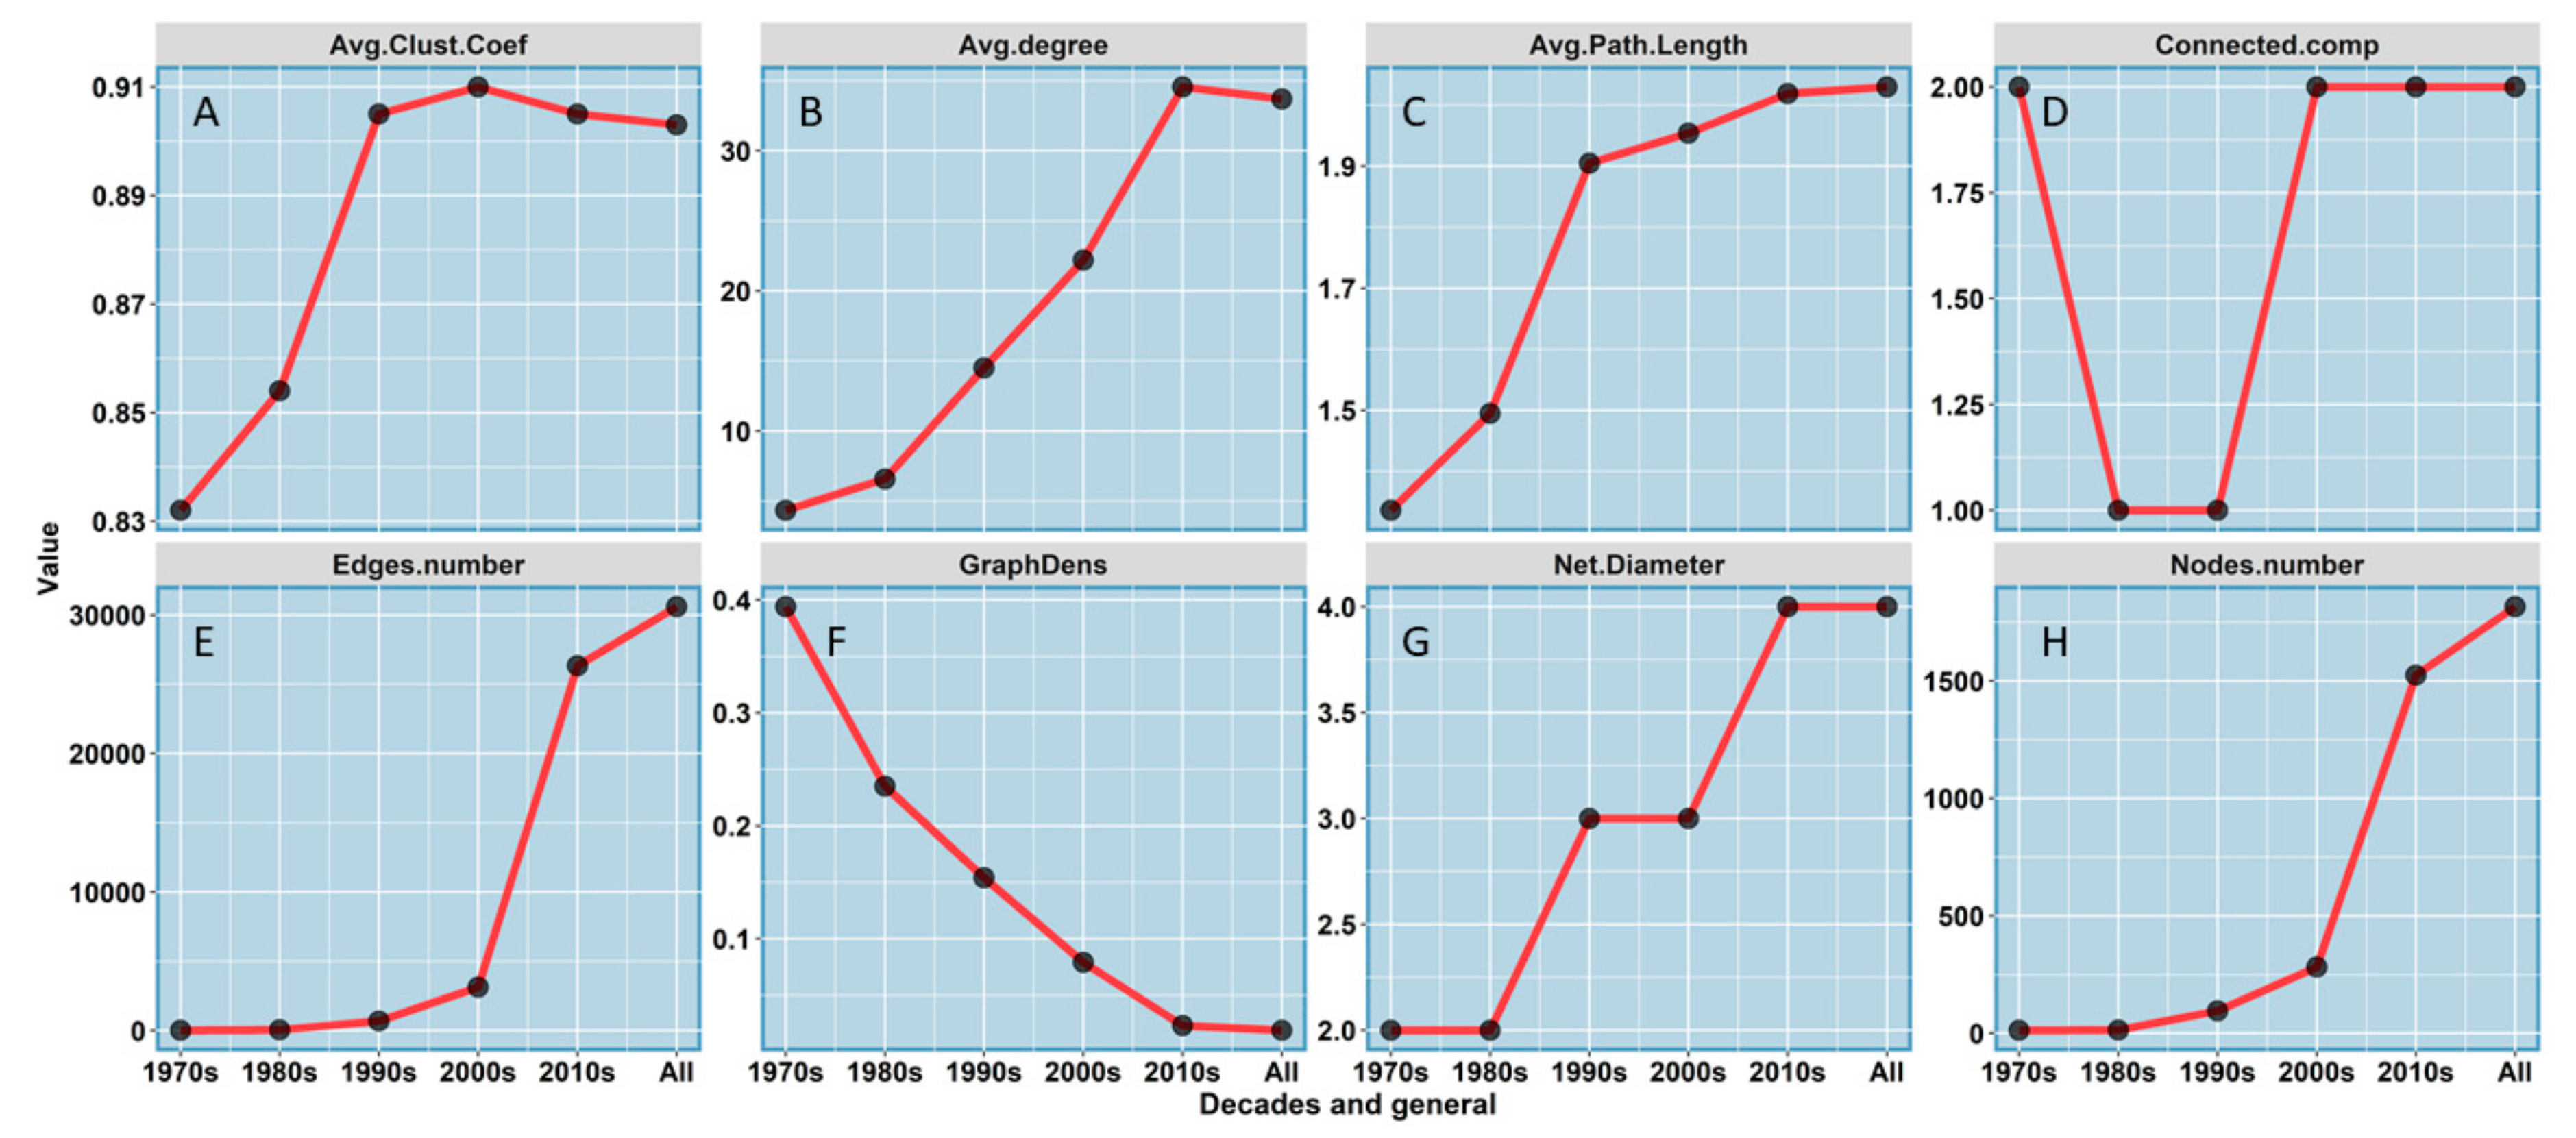
3.6. Decadal Topology of Research Focus and Semantic Networks
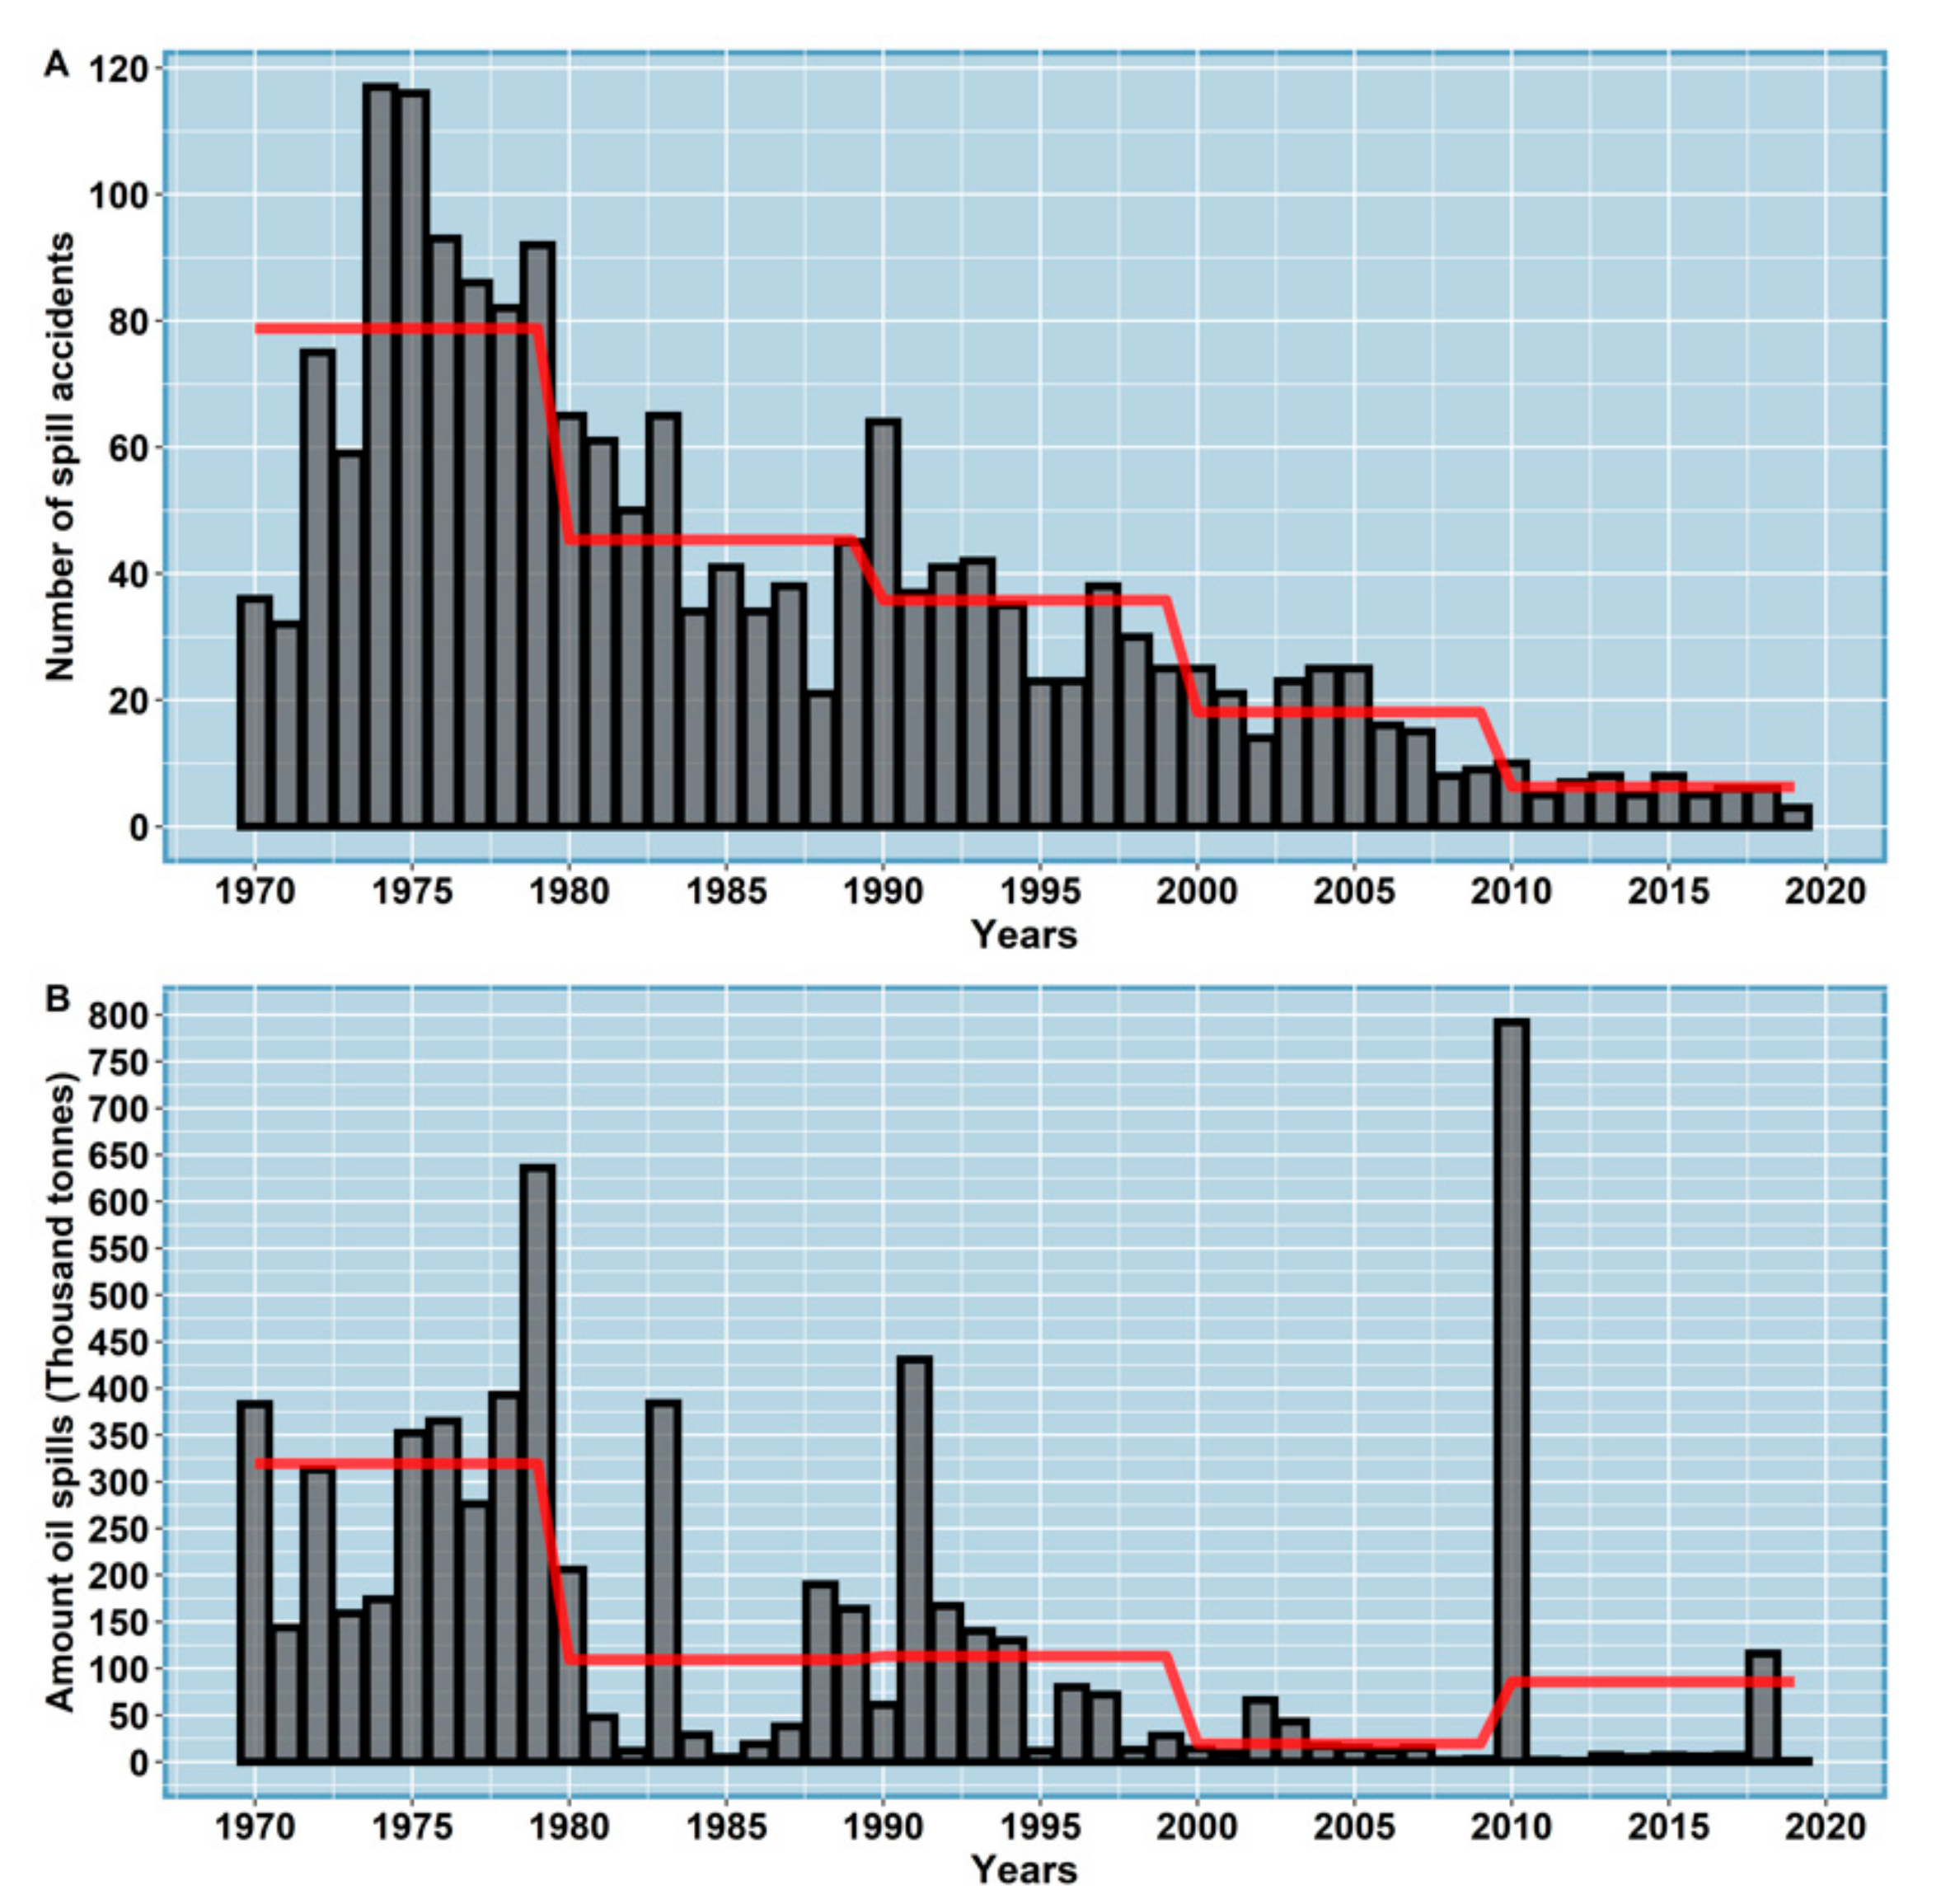
3.7. Amount and the Number of Oil Spill in the Last 50 Years
4. Discussion
5. Conclusions
Supplementary Materials
Author Contributions
Funding
Acknowledgments
Conflicts of Interest
References
- Singh, H.; Bhardwaj, N.; Arya, S.K.; Khatri, M. Environmental impacts of oil spills and their remediation by magnetic nanomaterials. Environ. Nanotechnol. Monit. Manag. 2020, 14, 100305. [Google Scholar] [CrossRef]
- Kingston, P.F. Long-term environmental impact of oil spills. Spill Sci. Technol. Bull. 2002, 7, 53–61. [Google Scholar] [CrossRef]
- Beyer, J.; Trannum, H.C.; Bakke, T.; Hodson, P.V.; Collier, T.K. Environmental effects of the Deepwater Horizon oil spill: A review. Mar. Pollut. Bull. 2016, 110, 28–51. [Google Scholar] [CrossRef] [PubMed]
- Li, P.; Cai, Q.; Lin, W.; Chen, B.; Zhang, B. Offshore oil spill response practices and emerging challenges. Mar. Pollut. Bull. 2016, 110, 6–27. [Google Scholar] [CrossRef] [PubMed]
- Lawa, R.J.; Kelly, C. The impact of the “sea empress” oil spill. Aquat. Living Resour. 2004, 17, 389–394. [Google Scholar] [CrossRef]
- Palinkas, L.; Downs, M.; Petterson, J.; Russell, J. Social, Cultural, and Psychological Impacts of the Exxon Valdez Oil Spill. Hum. Organ. 1993, 52, 1–13. [Google Scholar] [CrossRef]
- Piatt, J.F.; Ford, G.R. How many seabirds were killed by the Exxon Valdez oil spill? Am. Fish. Soc. Symp. 1996, 18, 712–719. [Google Scholar]
- Picou, J.S.; Gill, D.A.; Dyer, C.L.; Curry, E.W. Disruption and stress in an Alaskan fishing community: Initial and continuing impacts of the Exxon Valdez oil spill. Organ. Environ. 1992, 6, 235–257. [Google Scholar] [CrossRef]
- Millard, J.P.; Arvesen, J.C. Airborne Optical Detection of Oil on Water. Appl. Opt. 1972, 11, 102–107. [Google Scholar] [CrossRef]
- Gruner, K.; Bartsch, N.; Keydel, W.; Witte, F. Contributions to Oil-Spill Detection and Analysis with Radar and Microwave Radiometry: Results of the Archimedes II Campaign. IEEE Trans. Geosci. Remote Sens. 1987, 6, 677–690. [Google Scholar] [CrossRef]
- Krestenitis, M.; Orfanidis, G.; Ioannidis, K.; Avgerinakis, K.; Vrochidis, S.; Kompatsiaris, I. Oil spill identification from satellite images using deep neural networks. Remote Sens. 2019, 11, 1762. [Google Scholar] [CrossRef]
- Espedal, H.A.; Wahl, T. Satellite sar oil spill detection using wind history information. Int. J. Remote Sens. 1999, 20, 49–65. [Google Scholar] [CrossRef]
- Del Frate, F.; Petrocchi, A.; Lichtenegger, J.; Calabresi, G. Neural networks for oil spill detection using ERS-SAR data. IEEE Trans. Geosci. Remote Sens. 2000, 38, 2282–2287. [Google Scholar] [CrossRef]
- Shirvany, R.; Member, S.; Chabert, M. Ship and Oil-Spill Detection Using the Degree of Polarization in Linear and Hybrid/Compact Dual-Pol SAR. IEEE J. Sel. Top. Appl. Earth Obs. Remote Sens. 2012, 5, 885–892. [Google Scholar] [CrossRef]
- Minchew, B.; Jones, C.E.; Holt, B. Polarimetric analysis of backscatter from the deepwater horizon oil spill using l-band synthetic aperture radar. IEEE Trans. Geosci. Remote Sens. 2012, 50, 3812–3830. [Google Scholar] [CrossRef]
- Liu, P.; Li, Y.; Liu, B.; Chen, P.; Xu, J. Semi-automatic oil spill detection on X-band marine radar images using texture analysis, machine learning, and adaptive thresholding. Remote Sens. 2019, 11, 756. [Google Scholar] [CrossRef]
- Tong, S.; Liu, X.; Chen, Q.; Zhang, Z.; Xie, G. Multi-feature based ocean oil spill detection for polarimetric SAR data using random forest and the self-similarity parameter. Remote Sens. 2019, 11, 451. [Google Scholar] [CrossRef]
- Pisano, A.; Bignami, F.; Santoleri, R. Oil spill detection in glint-contaminated near-infrared MODIS imagery. Remote Sens. 2015, 7, 1112–1134. [Google Scholar] [CrossRef]
- Lacava, T.; Ciancia, E.; Coviello, I.; Di Polito, C.; Grimaldi, C.S.L.; Pergola, N.; Satriano, V.; Temimi, M.; Zhao, J.; Tramutoli, V. A MODIS-based robust satellite technique (RST) for timely detection of oil spilled areas. Remote Sens. 2017, 9, 128. [Google Scholar] [CrossRef]
- Brekke, C.; Solberg, A.H.S. Oil spill detection by satellite remote sensing. Remote Sens. Environ. 2005, 95, 1–13. [Google Scholar] [CrossRef]
- Jha, M.N.; Levy, J.; Gao, Y. Advances in remote sensing for oil spill disaster management: State-of-the-art sensors technology for oil spill surveillance. Sensors 2008, 8, 236–255. [Google Scholar] [CrossRef] [PubMed]
- Gens, R. Oceanographic applications of SAR remote sensing. GISci. Remote Sens. 2008, 45, 275–305. [Google Scholar] [CrossRef]
- Topouzelis, K.N. Oil spill detection by SAR images: Dark formation detection, feature extraction and classification algorithms. Sensors 2008, 8, 6642–6659. [Google Scholar] [CrossRef]
- Liu, Y.; MacFadyen, A.; Ji, Z.G.; Weisberg, R.H. Introduction to Monitoring and Modeling the Deepwater Horizon Oil Spill. Monit. Model. Deep. Horiz. Oil Spill A Rec. Break. Enterp. 2013, 195, 1–7. [Google Scholar] [CrossRef]
- Ambituuni, A.; Amezaga, J.; Emeseh, E. Analysis of safety and environmental regulations for downstream petroleum industry operations in Nigeria: Problems and prospects. Environ. Dev. 2014, 9, 43–60. [Google Scholar] [CrossRef]
- Catapano, I.; Affinito, A.; Bertolla, L.; Porsani, J.L.; Soldovieri, F. Oil spill monitoring via microwave tomography enhanced GPR surveys. J. Appl. Geophys. 2014, 108, 95–103. [Google Scholar] [CrossRef]
- Fingas, M.; Brown, C.E. A review of oil spill remote sensing. Sensors 2018, 18, 91. [Google Scholar] [CrossRef]
- Li, Y.; Chen, J.; Zhang, Y. Progress in Research on Marine Oil Spills Detection Using Synthetic Aperture Radar. Dianzi Yu Xinxi Xuebao/J. Electron. Inf. Technol. 2019, 41, 751–762. [Google Scholar] [CrossRef]
- Van Eck, N.J.; Waltman, L.; Van Den Berg, J.; Kaymak, U. Visualizing the computational intelligence field. IEEE Comput. Intell. Mag. 2006, 1, 6–10. [Google Scholar] [CrossRef]
- Van Eck, N.J.; Waltman, L. Bibliometric mapping of the computational intelligence field. Int. J. Uncertain. Fuzziness Knowl. Based Syst. 2007, 15, 625–645. [Google Scholar] [CrossRef]
- van Eck, N.J.; Waltman, L. Software survey: VOSviewer, a computer program for bibliometric mapping. Scientometrics 2010, 84, 523–538. [Google Scholar] [CrossRef]
- van Eck, N.J.; Waltman, L.; Noyons, E.C.M.; Buter, R.K. Automatic term identification for bibliometric mapping. Scientometrics 2010, 82, 581–596. [Google Scholar] [CrossRef]
- Andres, A. Measuring Academic Research; Chandos Publishing: Oxford, UK, 2009. [Google Scholar] [CrossRef]
- De Bellis, N. Bibliometrics and Citation Analysis from the Science Citation Index to Cybermetrics; De Bellis, N., Ed.; Scarecrow Press, Inc.: Lanham, MD, USA, 2009; ISBN 9780128019115. [Google Scholar]
- Viana, J.; Santos, J.V.; Neiva, R.M.; Souza, J.; Duarte, L.; Teodoro, A.C.; Freitas, A. Remote sensing in human health: A 10-year bibliometric analysis. Remote Sens. 2017, 9, 1225. [Google Scholar] [CrossRef]
- Hu, K.; Qi, K.; Guan, Q.; Wu, C.; Yu, J.; Qing, Y.; Zheng, J.; Wu, H.; Li, X. A scientometric visualization analysis for night-time light remote sensing research from 1991 to 2016. Remote Sens. 2017, 9, 802. [Google Scholar] [CrossRef]
- Elsevier Content—How Scopus Works—Scopus—Elsevier Solutions. Available online: https://www.elsevier.com/solutions/scopus/how-scopus-works/content (accessed on 27 September 2020).
- ITOPF. Oil Tanker Spill Statistics; Itopf Limited: London, UK, 2019. [Google Scholar]
- Roser, M. Oil Spills. Available online: https://ourworldindata.org/oil-spills (accessed on 27 September 2020).
- Van Eck, N.J.; Waltman, L. Text mining and visualization using VOSviewer. arXiv 2011, arXiv:1109.2058. [Google Scholar]
- Bastian, M.; Heymann, S.; Jacomy, M. Gephi: An open source software for exploring and manipulating networks. Int. AAAI Conf. Weblogs Soc. Media 2009, 8, 361–362. [Google Scholar]
- Cherven, K. Mastering Gephi Network Visualization. Produce Advanced Network Graphs in Gephi and Gain Valuable Insights into Your Network Datasets; Packt Publishing: Birmingham, UK, 2015; ISBN 9781783987344. [Google Scholar]
- Pachayappan, M.; Venkatesakumar, R. A Graph Theory Based Systematic Literature Network Analysis. Theor. Econ. Lett. 2018, 8, 960–980. [Google Scholar] [CrossRef]
- R Core Team. The R Project for Statistical Computing; R Foundation for Statistical Computing: Vienna, Austria, 2019; pp. 1–12. Available online: http://www.R-Project.Org/ (accessed on 1 January 2019).
- RStudio RStudio. Open Source & Professional Software for Data Science Teams—RStudio. Available online: https://rstudio.com/ (accessed on 27 September 2020).
- Wickham, H. Ggplot2: Elegant Graphics for Data Analysis; Version 3.6.1.; Springer: New York, NY, USA, 2016; ISBN 978-3-319-24277-4. [Google Scholar]
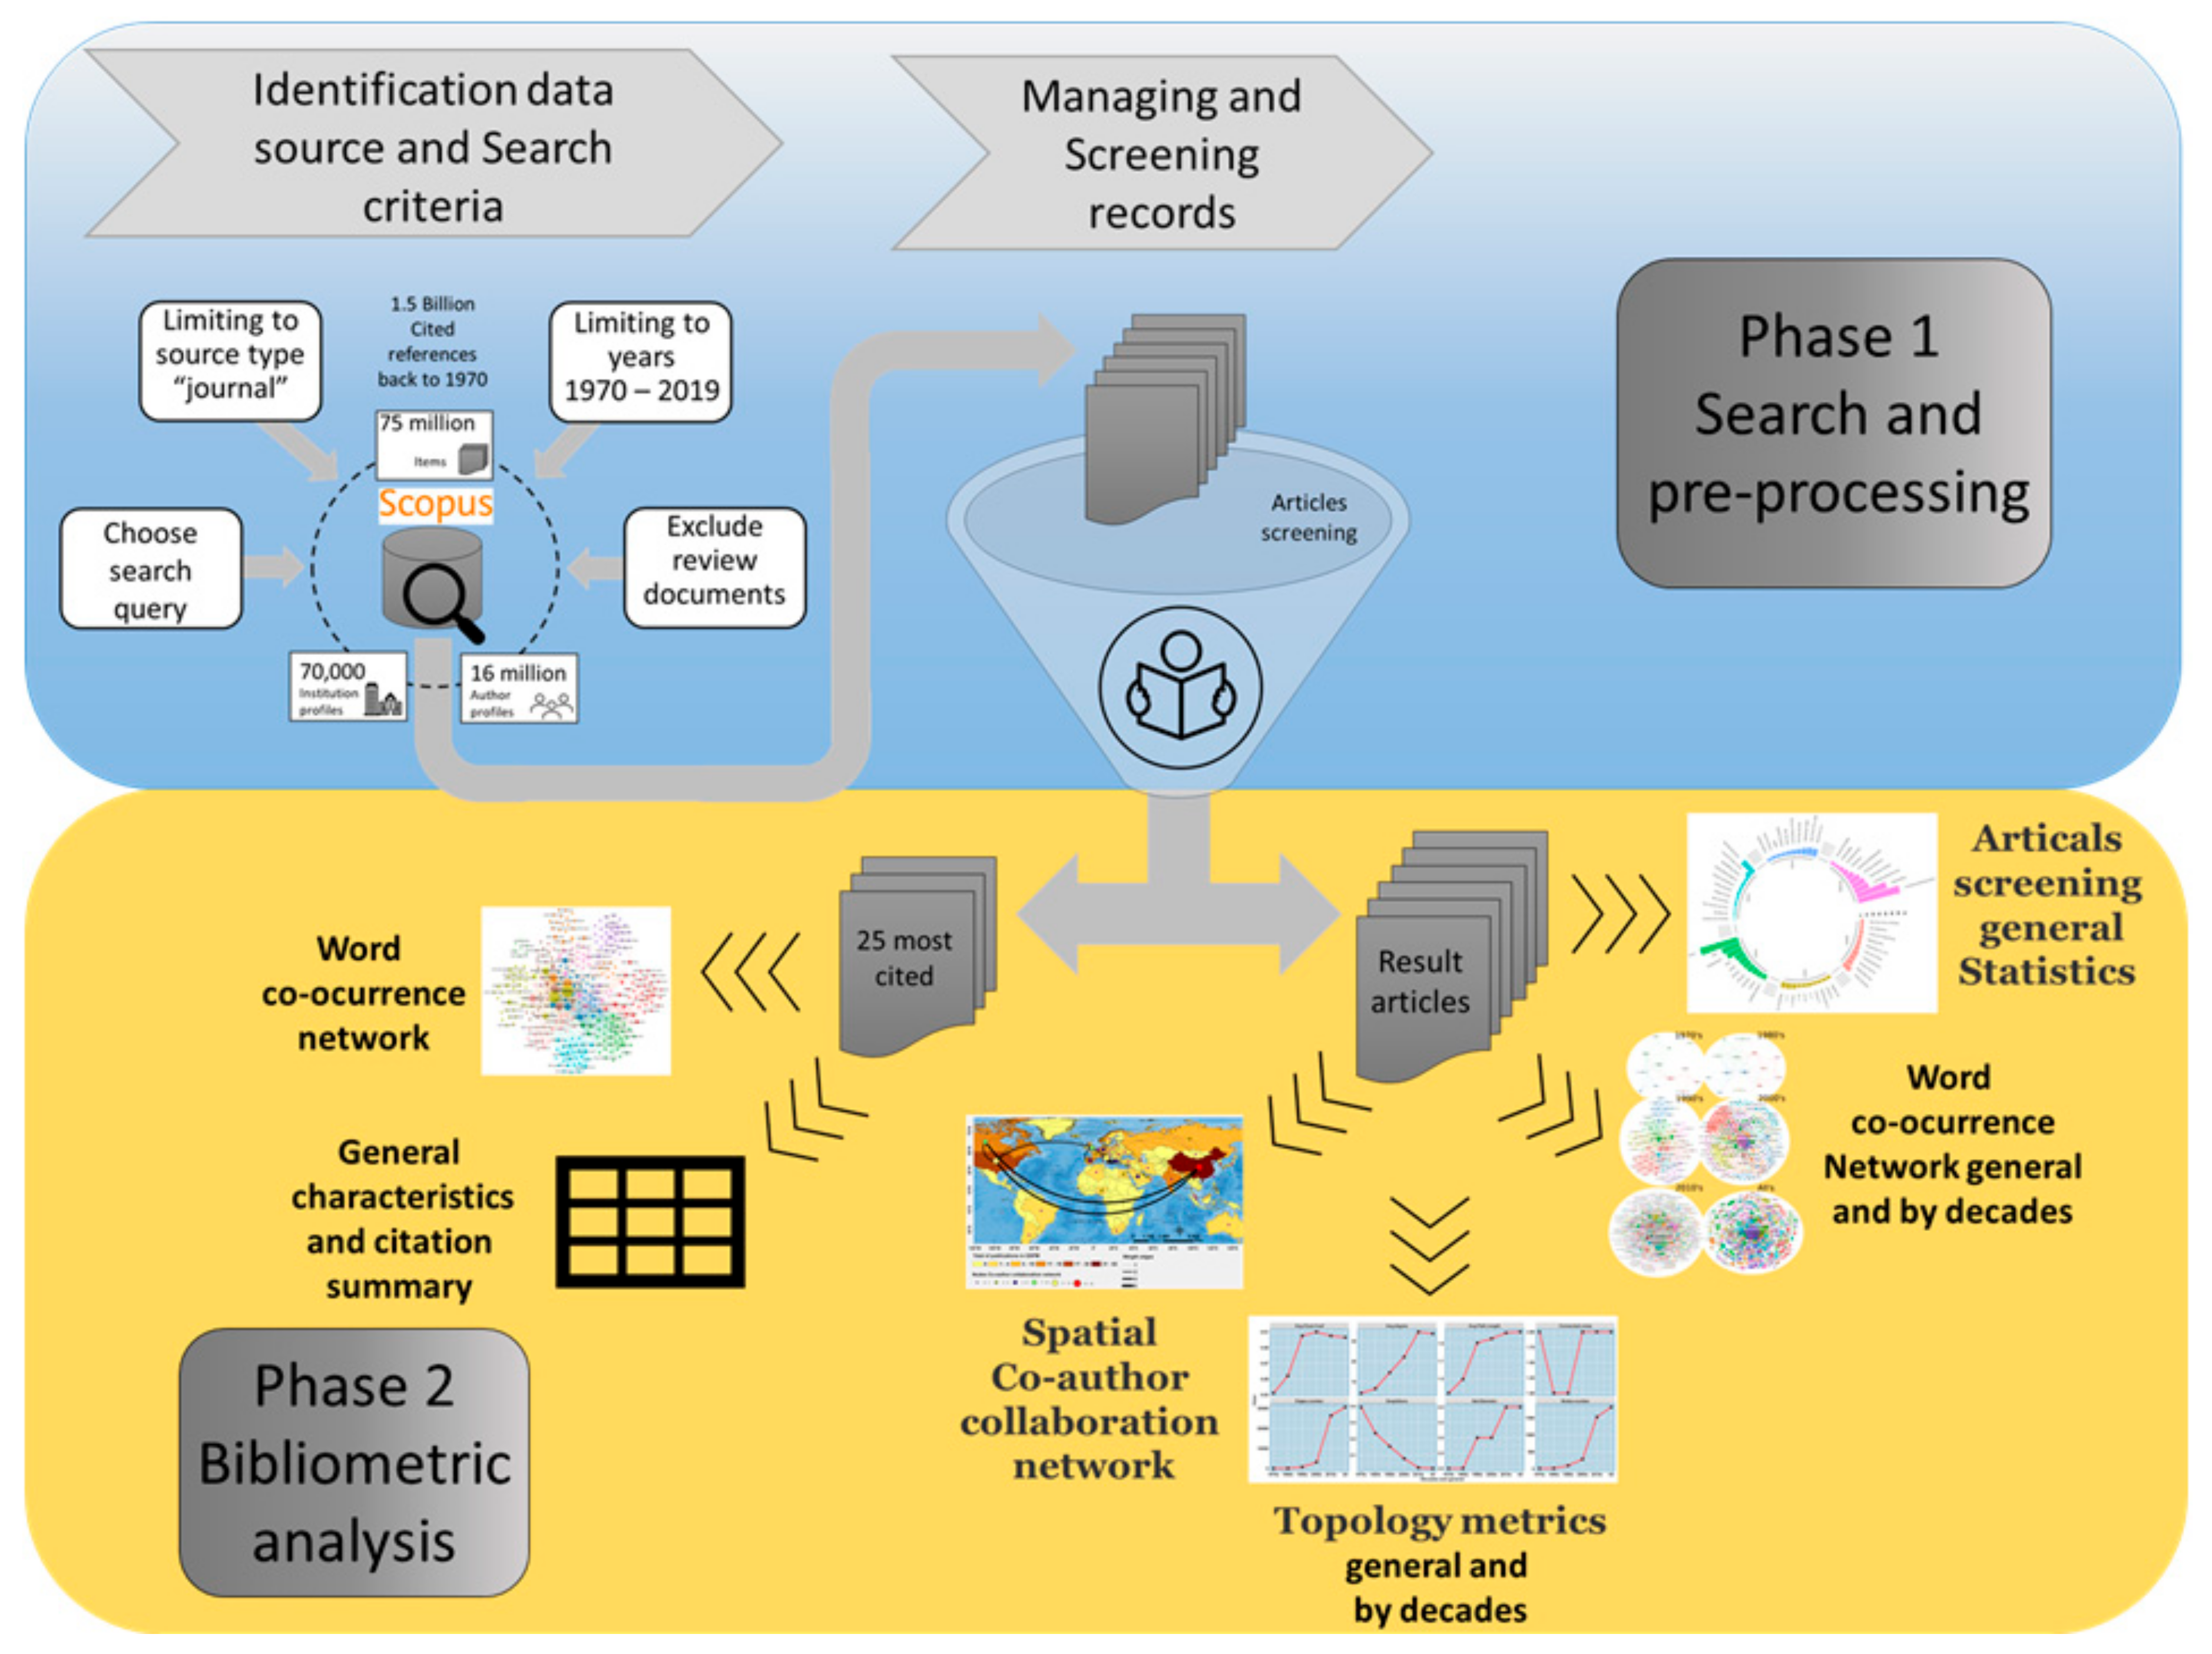
| Questions | Analysis | Source Data |
|---|---|---|
| What is the publishing trends of OSPM? | General statistics/Word Co-ocurrence network/Co-author spatial network | All papers |
| Which countries have contributed to OSPM research? | General statistics/Co-author spatial network | All papers |
| What are the influential publications in the OSPM field? | General charactheristics and citation tables/Co-ocurrence network | 25s Most cited |
| What are the influential journals in the OSPM field? | General statistics/General charactheristics and citation tables | All papers/25s Most cited |
| Who has contributed to OSPM research? | General statistics/General charactheristics and citation tables/Co-author spatial network | All papers/25s Most cited |
| What is the research focus in different periods? | Word Co-ocurrence network | All papers |
| What are the main differences in terms of the semantic network topology more evident over decades? | Topology metrics | All papers |
| What is the amount and the number of tanker spill in the last 50 years? | Plots of amount and number of tanker spill | Roser (2019) |
| What is the 20’s main tanker spill in the last 50 years? | Table of 20s main tanker spill | Roser (2019) |
| Metrics | Description | Topological Network Metrics Characteristics |
|---|---|---|
| Edges Number | Act as the connections that link them to one another a series of connections (edges). |  |
| Nodes Number | Refers to the amount of information present in the network. |  |
| Average Clustering Coefficient | Measure the level at which the nodes are grouped together, as opposed to being equally or randomly connected across the network. Scores on this measure will have an inverse correlation with other statistics, including several of the centrality calculations, particularly when we are speaking at the global level (the entire graph). |  |
| Average degree | Assess importance through the number of direct connections (degrees) one node has to other nodes. The assumption with degree centrality is that the number of connections is a key measure of importance or influence within the network. In an undirected network we do not have the luxury of determining whether one node exerts more or less influence in a relationship; we merely see that they are in fact connected and as such are weighted equally. |  |
| Average Path Length | The clustering coefficient for the word co-occurrence network refers to the probability or level at which the words are grouped together. Indicates how each word is connected to its neighborhood. Average clustering coefficient is the average value of the individual or local coefficients. |  |
| Connected Components | Number of distinct components within the network. When our network is fully connected, a value of 1 will be returned, so there is little need for this calculation. However, in very large networks it might be difficult to visually determine whether the network is fully connected, so we can use this function to ascertain the number of components. |  |
| Graph Density | Measure of the level of connected edges within a network relative to the total possible value and is returned as a decimal value between zero and one. Graphs with values closer to one are typically considered to be dense graphs, while those closer to zero are termed as sparse graphs. |  |
| Network Diameter | Refers to the maximum number of connections required to traverse the graph. Another way to look at it is knowing how many steps it takes for the two most distant nodes in the network to reach one another |  |
| Shipname/Platform | Year | Location | Spill Size (Tonnes) |
|---|---|---|---|
| DEEPWATER HORIZON | 2010 | Macondo Prospect, Central Gulf of Mexico | 780,000 |
| ATLANTIC EMPRESS | 1979 | Off Tobago, West Indies | 287,000 |
| ABT SUMMER | 1991 | 700 nautical miles off Angola | 260,000 |
| CASTILLO DE BELLVER | 1983 | Off SaIdanha Bay, South Africa | 252,000 |
| AMOCO CADIZ | 1978 | Off Brittany, France | 223,000 |
| HAVEN | 1991 | Genoa, Italy | 144,000 |
| ODYSSEY | 1988 | 700 nautical miles off Nova Scotia, Canada | 132,000 |
| SEA STAR | 1972 | Gulf of Oman | 115,000 |
| SANCHI* | 2018 | Off Shanghai, China | 113,000 |
| IRENES SERENADE | 1980 | Navarino Bay, Greece | 100,000 |
| URQUIOLA | 1976 | La Coruna, Spain | 100,000 |
| HAWAIIAN PATRIOT | 1977 | 300 nautical miles off Honolulu | 95,000 |
| INDEPENDENTA | 1979 | Bosphorus, Turkey | 95,000 |
| JAKOB MAERSK | 1975 | Oporto, Portugal | 88,000 |
| BRAER | 1993 | Shetland Islands, UK | 85,000 |
| AEGEAN SEA | 1992 | La Coruna, Spain | 74,000 |
| SEA EMPRESS | 1996 | Milford Haven, UK | 72,000 |
| KHARK 5 | 1989 | 120 nautical miles off Atlantic coast of Morocco | 70,000 |
| NOVA | 1985 | Off Kharg Island, Gulf of Iran | 70,000 |
| KATINA P | 1992 | Off Maputo, Mozambique | 67,000 |
Publisher’s Note: MDPI stays neutral with regard to jurisdictional claims in published maps and institutional affiliations. |
© 2020 by the authors. Licensee MDPI, Basel, Switzerland. This article is an open access article distributed under the terms and conditions of the Creative Commons Attribution (CC BY) license (http://creativecommons.org/licenses/by/4.0/).
Share and Cite
Vasconcelos, R.N.; Lima, A.T.C.; Lentini, C.A.D.; Miranda, G.V.; Mendonça, L.F.; Silva, M.A.; Cambuí, E.C.B.; Lopes, J.M.; Porsani, M.J. Oil Spill Detection and Mapping: A 50-Year Bibliometric Analysis. Remote Sens. 2020, 12, 3647. https://doi.org/10.3390/rs12213647
Vasconcelos RN, Lima ATC, Lentini CAD, Miranda GV, Mendonça LF, Silva MA, Cambuí ECB, Lopes JM, Porsani MJ. Oil Spill Detection and Mapping: A 50-Year Bibliometric Analysis. Remote Sensing. 2020; 12(21):3647. https://doi.org/10.3390/rs12213647
Chicago/Turabian StyleVasconcelos, Rodrigo N., André T. Cunha Lima, Carlos A. D. Lentini, Garcia V. Miranda, Luís F. Mendonça, Marcus A. Silva, Elaine C. B. Cambuí, José M. Lopes, and Milton J. Porsani. 2020. "Oil Spill Detection and Mapping: A 50-Year Bibliometric Analysis" Remote Sensing 12, no. 21: 3647. https://doi.org/10.3390/rs12213647
APA StyleVasconcelos, R. N., Lima, A. T. C., Lentini, C. A. D., Miranda, G. V., Mendonça, L. F., Silva, M. A., Cambuí, E. C. B., Lopes, J. M., & Porsani, M. J. (2020). Oil Spill Detection and Mapping: A 50-Year Bibliometric Analysis. Remote Sensing, 12(21), 3647. https://doi.org/10.3390/rs12213647


