Abstract
Geotagged smartphone photos can be employed to build digital terrain models using structure from motion-multiview stereo (SfM-MVS) photogrammetry. Accelerometer, magnetometer, and gyroscope sensors integrated within consumer-grade smartphones can be used to record the orientation of images, which can be combined with location information provided by inbuilt global navigation satellite system (GNSS) sensors to geo-register the SfM-MVS model. The accuracy of these sensors is, however, highly variable. In this work, we use a 200 m-wide natural rocky cliff as a test case to evaluate the impact of consumer-grade smartphone GNSS sensor accuracy on the registration of SfM-MVS models. We built a high-resolution 3D model of the cliff, using an unmanned aerial vehicle (UAV) for image acquisition and ground control points (GCPs) located using a differential GNSS survey for georeferencing. This 3D model provides the benchmark against which terrestrial SfM-MVS photogrammetry models, built using smartphone images and registered using built-in accelerometer/gyroscope and GNSS sensors, are compared. Results show that satisfactory post-processing registrations of the smartphone models can be attained, requiring: (1) wide acquisition areas (scaling with GNSS error) and (2) the progressive removal of misaligned images, via an iterative process of model building and error estimation.
1. Introduction
Structure from motion-multiview stereo (SfM-MVS) photogrammetry workflows allow the construction of high-resolution 3D models of landforms by matching narrow baseline partly overlapping aerial and/or terrestrial photo surveys [1,2,3,4]. In practice, the application of SfM-MVS photogrammetry towards close-range remote sensing of the planets’ surface requires two fundamental procedures, namely (i) model building and (ii) model registration. Model building initiates with the acquisition of image data and encompasses image key point detection and matching, camera pose and sparse scene estimation (i.e., structure from motion), multiview reconstruction of a dense point cloud, as well as mesh tessellation and texturing, producing a model with arbitrary scaling, translation, and orientation. This component of the workflow is typically achieved through the use of proprietary software tools, with the main user impact on reconstruction quality being the characteristics of the input image data. The required hardware for this initial stage of the workflow is readily available and includes consumer-grade cameras and personal computers, as well as unmanned aerial vehicle (UAV) in the case of aerial image acquisition. Indeed, the ease of deployment and low cost of the aforementioned tools is largely responsible for the rapid proliferation of SfM-MVS-based close-range remote sensing within the earth and environmental sciences over the past decade [5,6,7,8,9,10,11,12,13]. Model registration seeks to rectify the model’s location and attitude within a local or global reference frame, which is achieved via a series of geometric transformations (scaling, translation, and rotation: i.e., the similarity transform [14]). To do so, three solutions exist: (1) the use of the extrinsic camera parameters (i.e., the position and the orientation of photographs [15,16], (2) the use of ground control points (GCPs) (i.e., key points included in the reconstructed scene, for which the positions have been accurately measured, often using survey-grade Global Navigation Satellite System (GNSS) equipment [9,17,18,19,20], and (3) model rotation using reference surfaces on the model [21].
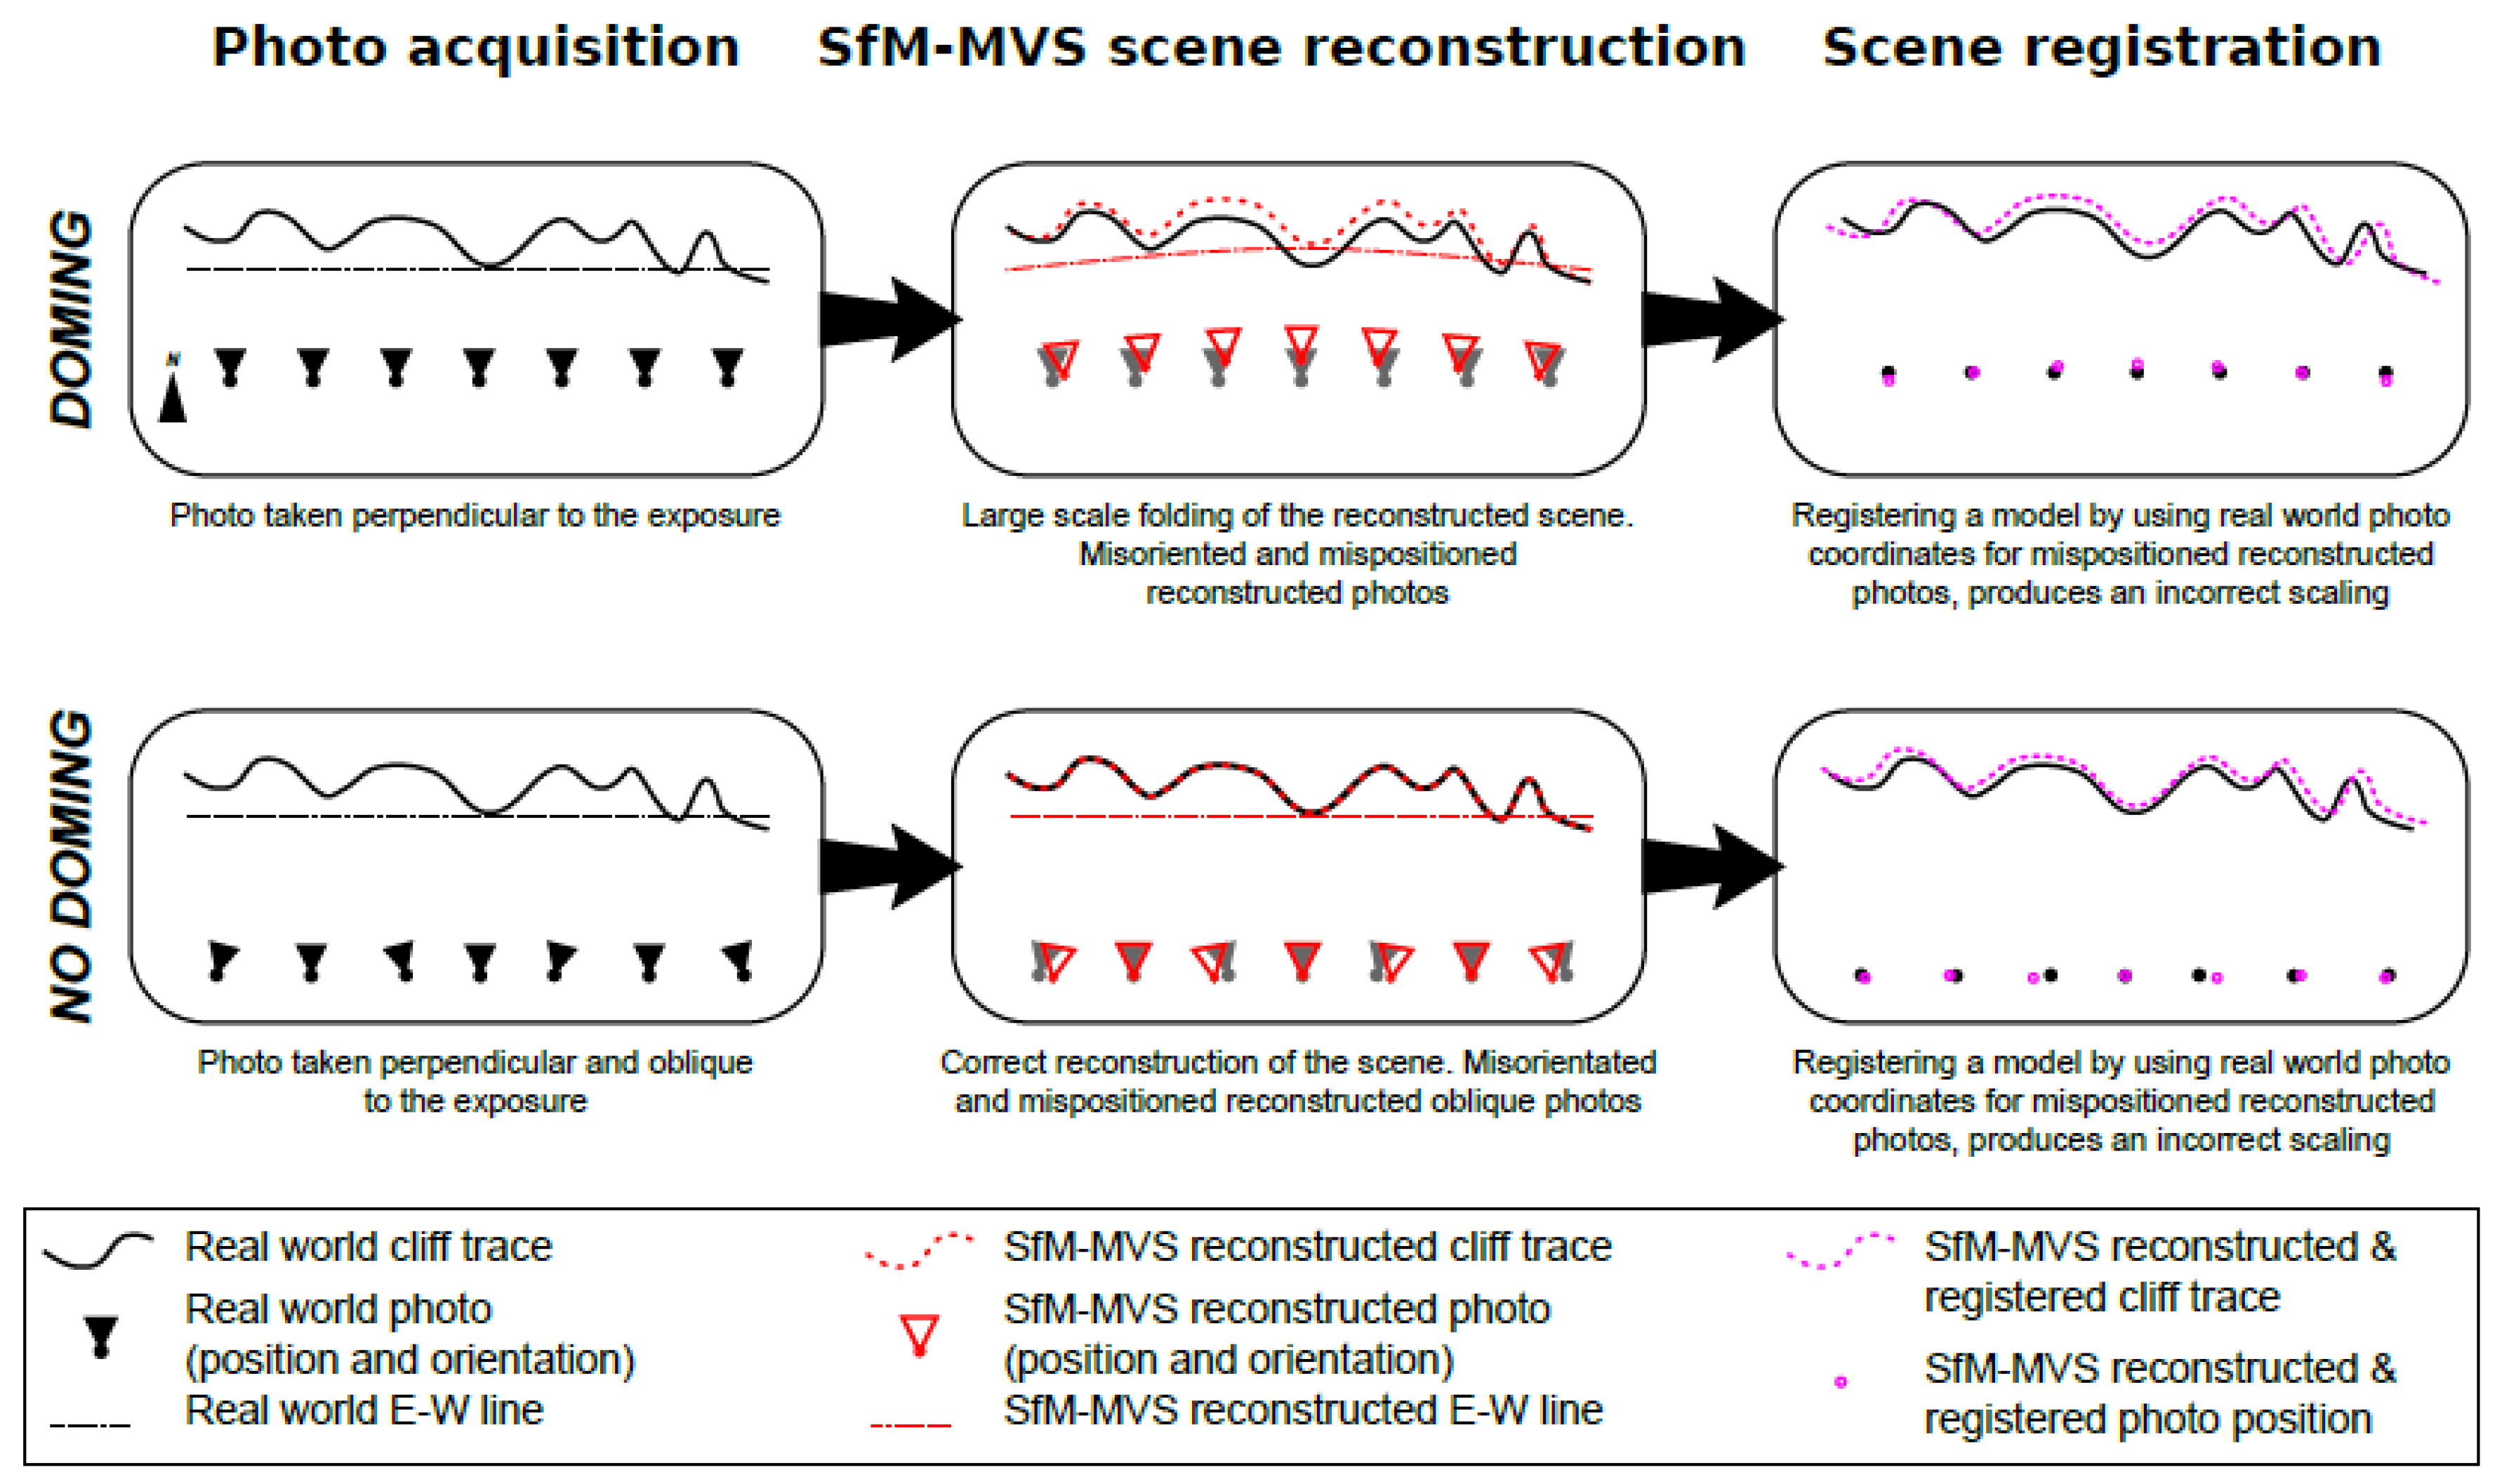
The use of ground control points measured with real-time kinematics (RTK) or differential GNSS allows operators to finely register SfM-MVS models. Conversely, challenges encountered in accessing the mapped site for the placement and measurement of GCPs have motivated the exploration of alternative model registration solutions. The employment of a UAV equipped with GNSS RTK provides a viable solution in which the position of each photograph, instead of that of GCPs, is used to register the model [22,23,24], with equivalent solutions possible for terrestrial photo-survey. This requires the use of either a smartphone [16,25] or an RTK or differential GNSS antenna [15,19] to obtain the camera position. In the case of smartphones and some cameras, magnetometer and accelerometer/gyroscope sensors are also used to retrieve the camera orientation, which is integrated with its position information [16]. Whilst inexpensive and convenient, the accuracy of measurements provided by smartphone sensors is highly variable, and the integration of position and orientation data, albeit partially redundant, only provides reliable data within a certain scale-range of the reconstructed scene and acquisition area. An additional issue when using extrinsic camera parameters for the registration of models is the potential occurrence of large-scale distortions (Figure 1) (i.e., the so-called “doming” effect [26,27]). Doming results from errors in the definition of lens distortion during manual or self-calibration [28,29,30] and can be minimized during the photo acquisition by capturing images oriented oblique to each other [26]. However, obliquely captured images needed to build a fair ‘undomed’ model can exacerbate camera positional errors during SfM recovery of the scene and camera pose, which may adversely affect model scaling when camera location is used as the basis for model registration (Figure 1).
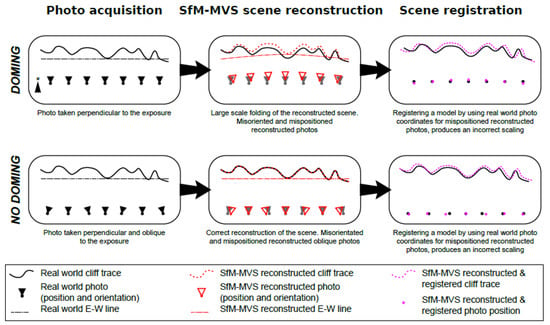
Figure 1.
Scheme showing in map view the effect of lens distortion on scene registration. Models using only photographs oriented perpendicular to the reconstructed landscape are affected by doming of the scene, which leads to erroneous estimates of camera position during structure from motion-multiview stereo (SfM-MVS) reconstruction. Models using oblique photos are not affected by doming, but the reconstructed orientation and position of photos oblique to the scene exhibit large errors. In both cases, utilizing XYZ coordinates for an image that has been misaligned during SfM-MVS reconstruction stretches the scene and produces major scaling errors.
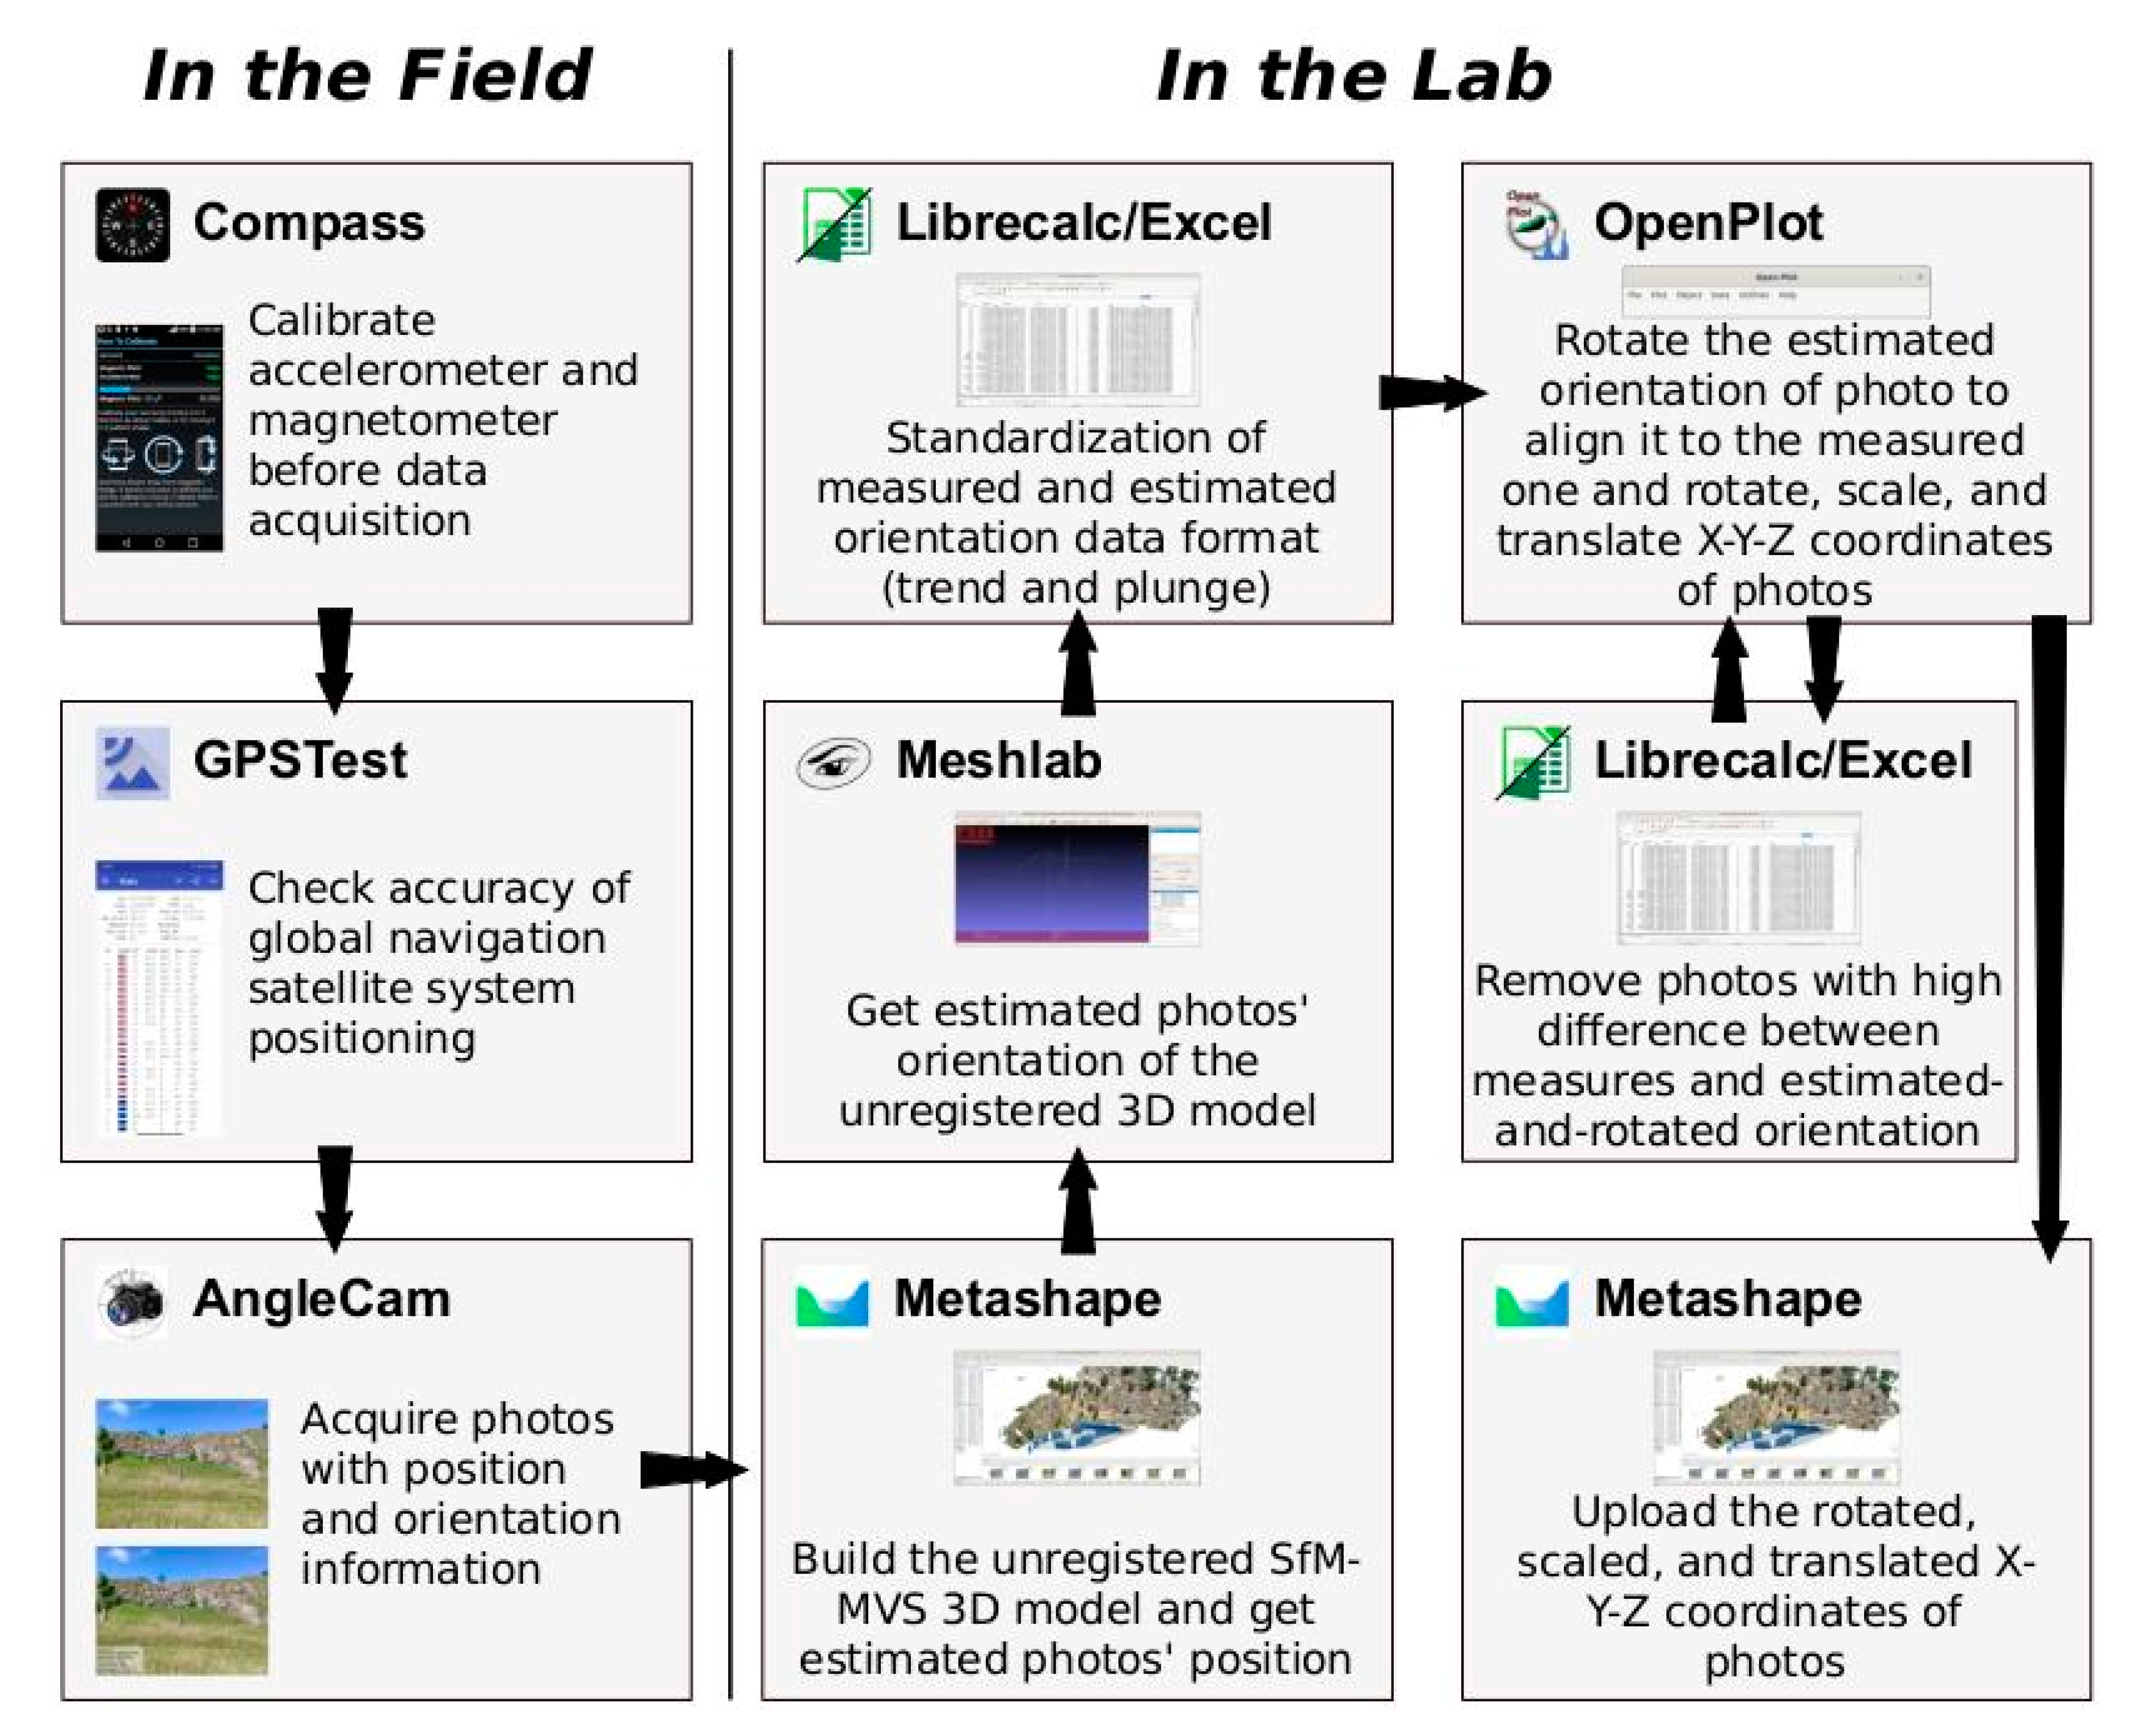
This work aims to test the accuracy of terrestrial SfM-MVS photogrammetric models registered with smartphones, addressing potential issues pertaining to scene reconstruction and (geo) location. For this purpose, we used the Pietrasecca (L’Aquila, Italy) exposure in central Italy as a test case. We initially built a 3D model using UAV photogrammetry (from hereinafter named as the UAV model). Then we registered the UAV model using ground control points (GCPs), located by fast-static positioning using a differential GNSS antenna. Then we built two separate terrestrial SfM-MVS photogrammetry models using smartphone images (hereinafter named smartphone models). We registered these smartphone models using data from the accelerometer/gyroscope and GNSS sensors of the smartphone, following the workflow illustrated in Figure 2 and in the step-by-step video tutorial (https://youtu.be/Jcoa0cc0L4I). Finally, we compared the smartphone models against the UAV model. Results of this comparison are discussed, with best practices for image acquisition proposed.
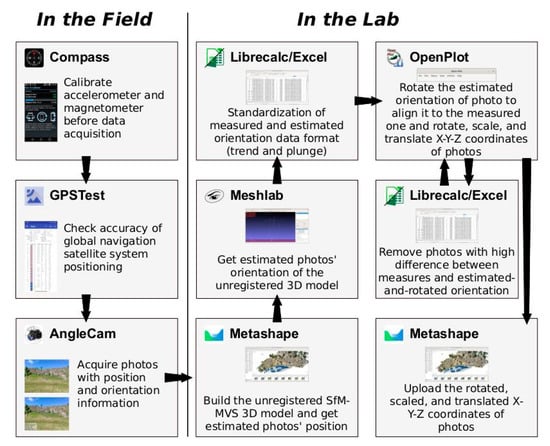
Figure 2.
Workflow for SfM-MVS photogrammetric model production and registration from smartphone sensors with the software packages and Android apps used in this study.
2. Method
2.1. The Site
The reconstructed scene is a rocky cliff situated in the village of Pietrasecca in Central Italy (Latitude 42.135° N, Longitude 13.134° E) (Figure 3). The cliff consists of two nearly vertical, perpendicular rock walls exposing fractured Miocene limestones surrounding the Pietrasecca fault [31]. The western wall is oriented NNW-SSE and it is 10–20 m high, whereas the northern wall is oriented WSW-ENE and it is 50 m high. The two walls are separated by a 5 m wide fault core zone striking WSW-ENE.
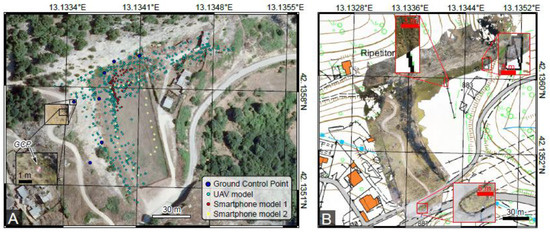
Figure 3.
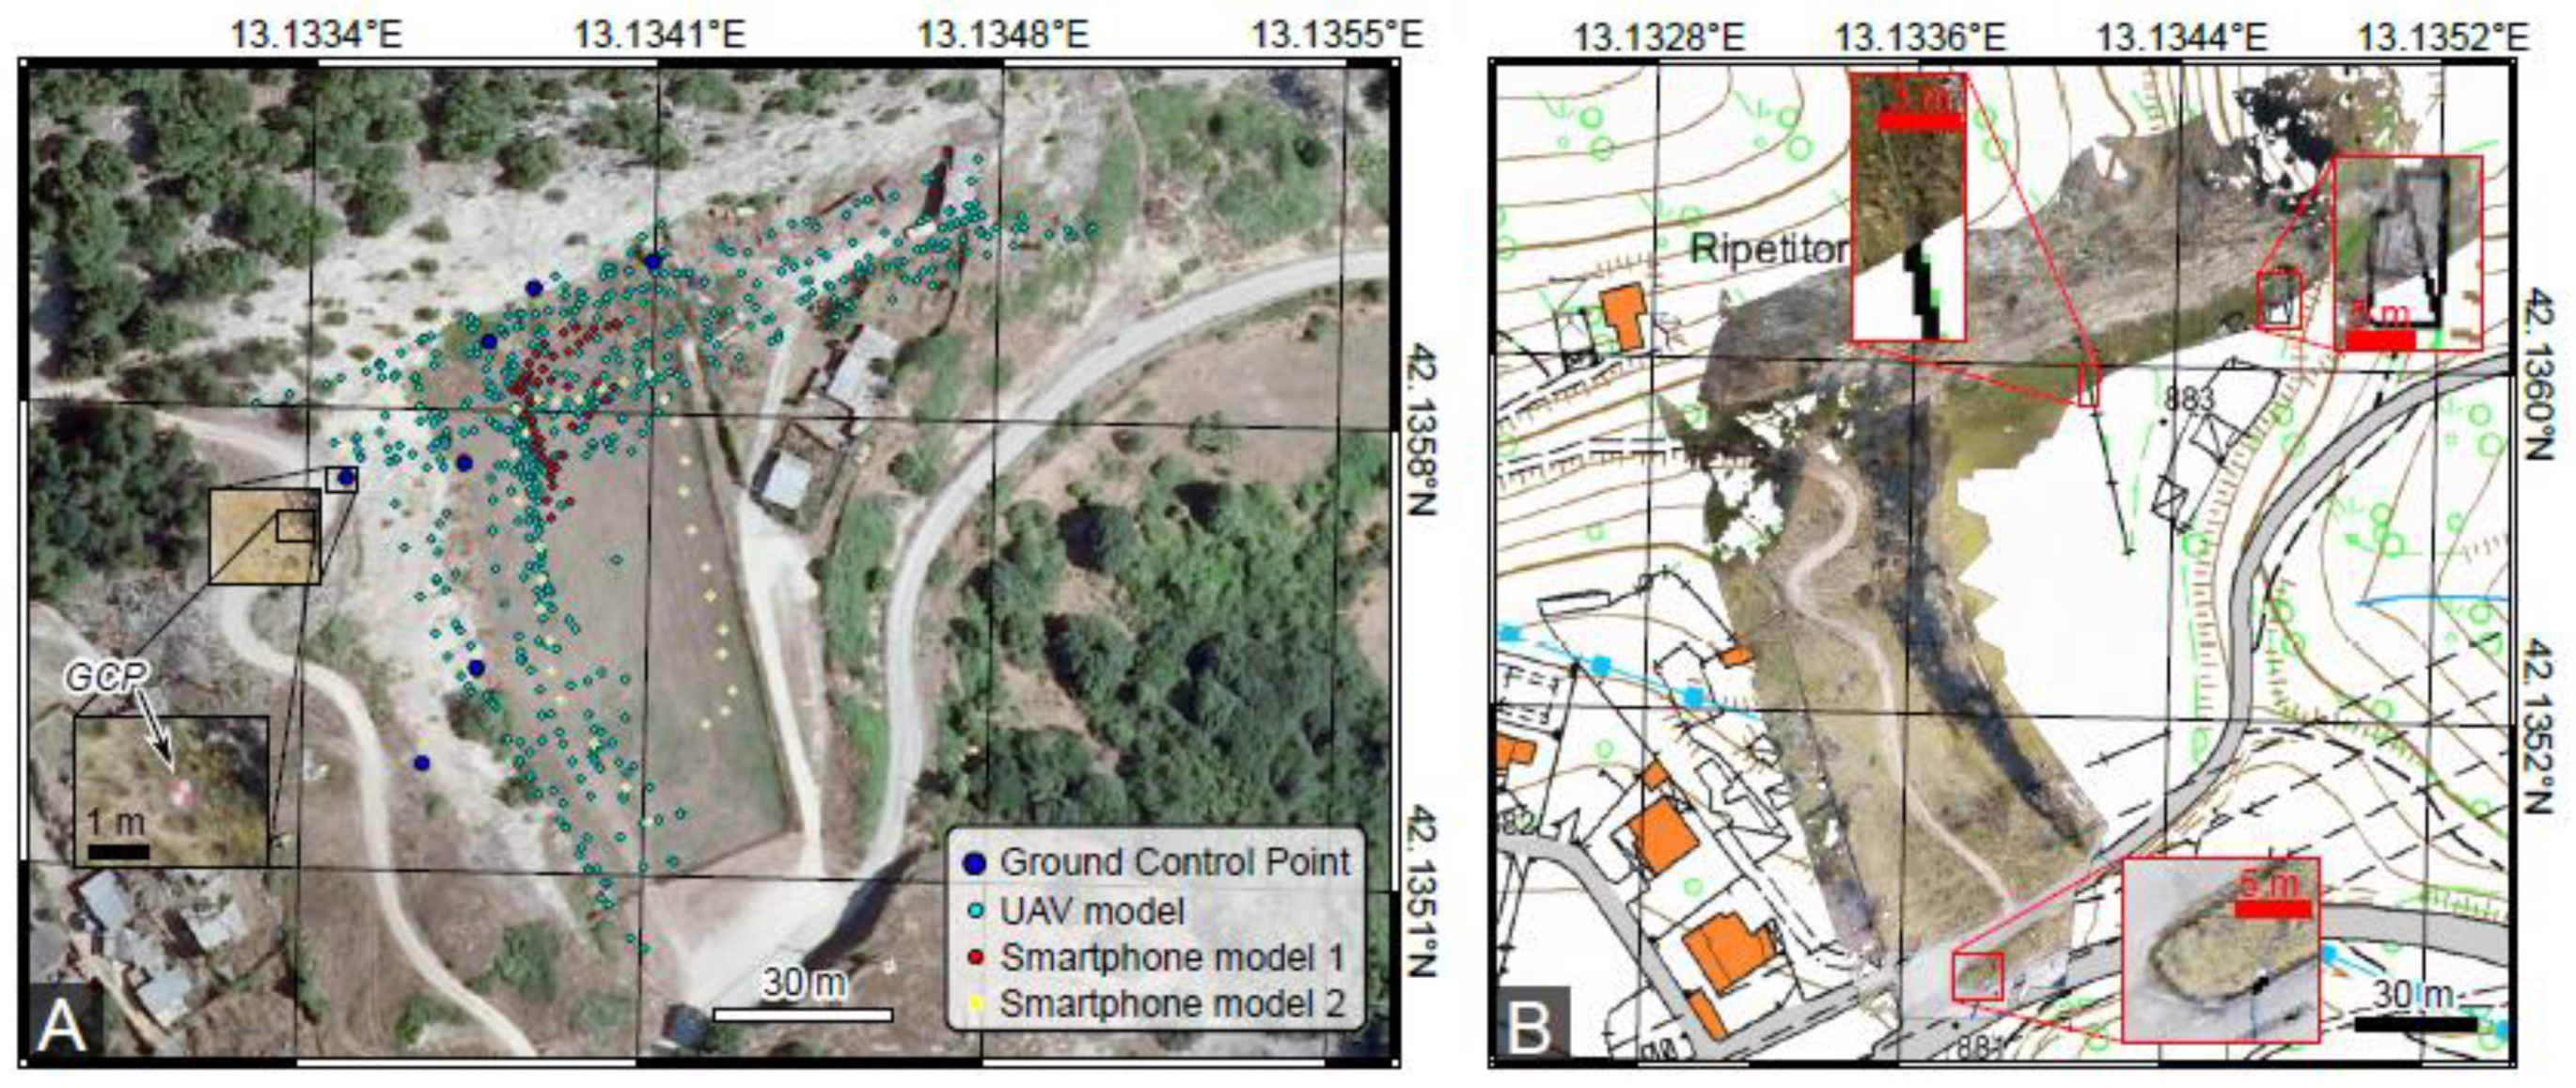
The Pietrasecca site and models. (A) orthophoto of the Pietrasecca football field, with location of photographs used in the UAV and smartphone models, as well as the ground control points used for UAV model registration. (B) Comparison between the orthophoto derived from the UAV model and the official 1:5000 topographic map (http://geoportale.regione.abruzzo.it/Cartanet/viewer), with details showing the degree of coincidence between the two datasets.
2.2. SfM-MVS Model from UAV Photogrammetry
We acquired 542 photos on 1 February 2020 (Figure 3A), between 11:51 and 13:36 CET, using a DJI Mavic 2 Pro equipped with a Hasselblad Camera with a CMOS 1”-sized 20Mpx sensor. Focal length was 10.26 mm (corresponding to 28 mm/35 mm equivalent focal lengths) and flight distances from the cliff ranged between 7 and 20 m, resulting in a ground sampling distance spanning from 2 to 5 mm/pixel. We processed these photos in the Agisoft Metashape software (formerly Photoscan), version 1.6.2, and generated a point cloud composed of 1.43 × 10⁸ vertices (Figure 4). The area of the reconstructed surface is 13,933 m2, resulting in an average point density of 1.03 point/cm2. We measured seven GCPs using a differential GNSS Leica Geosystems GS08 antenna, which were later used for model georeferencing (Figure 3A). The model was georeferenced directly in Metashape, by inputting the measured coordinates of the manually identified GCPs. The difference between the measured and estimated position for the 7 GCPs was <5 cm, this representing a proxy for the georeferencing error. Accuracy of the model in X and Y coordinates was also evaluated by projecting an orthophoto built from the model over a 1:5000 topographic map (Figure 3B). Mismatches are in the order of <50 cm, which is far below the nominal cartographic accuracy of the map (1 m). Based on the availability of GCPs and the high number of input images, we consider the UAV model as ground truth data to benchmark the subsequent smartphone models, which form the main focus of this study.
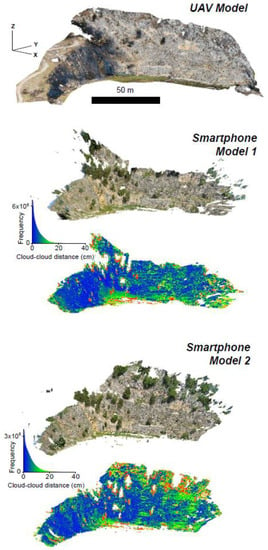
Figure 4.
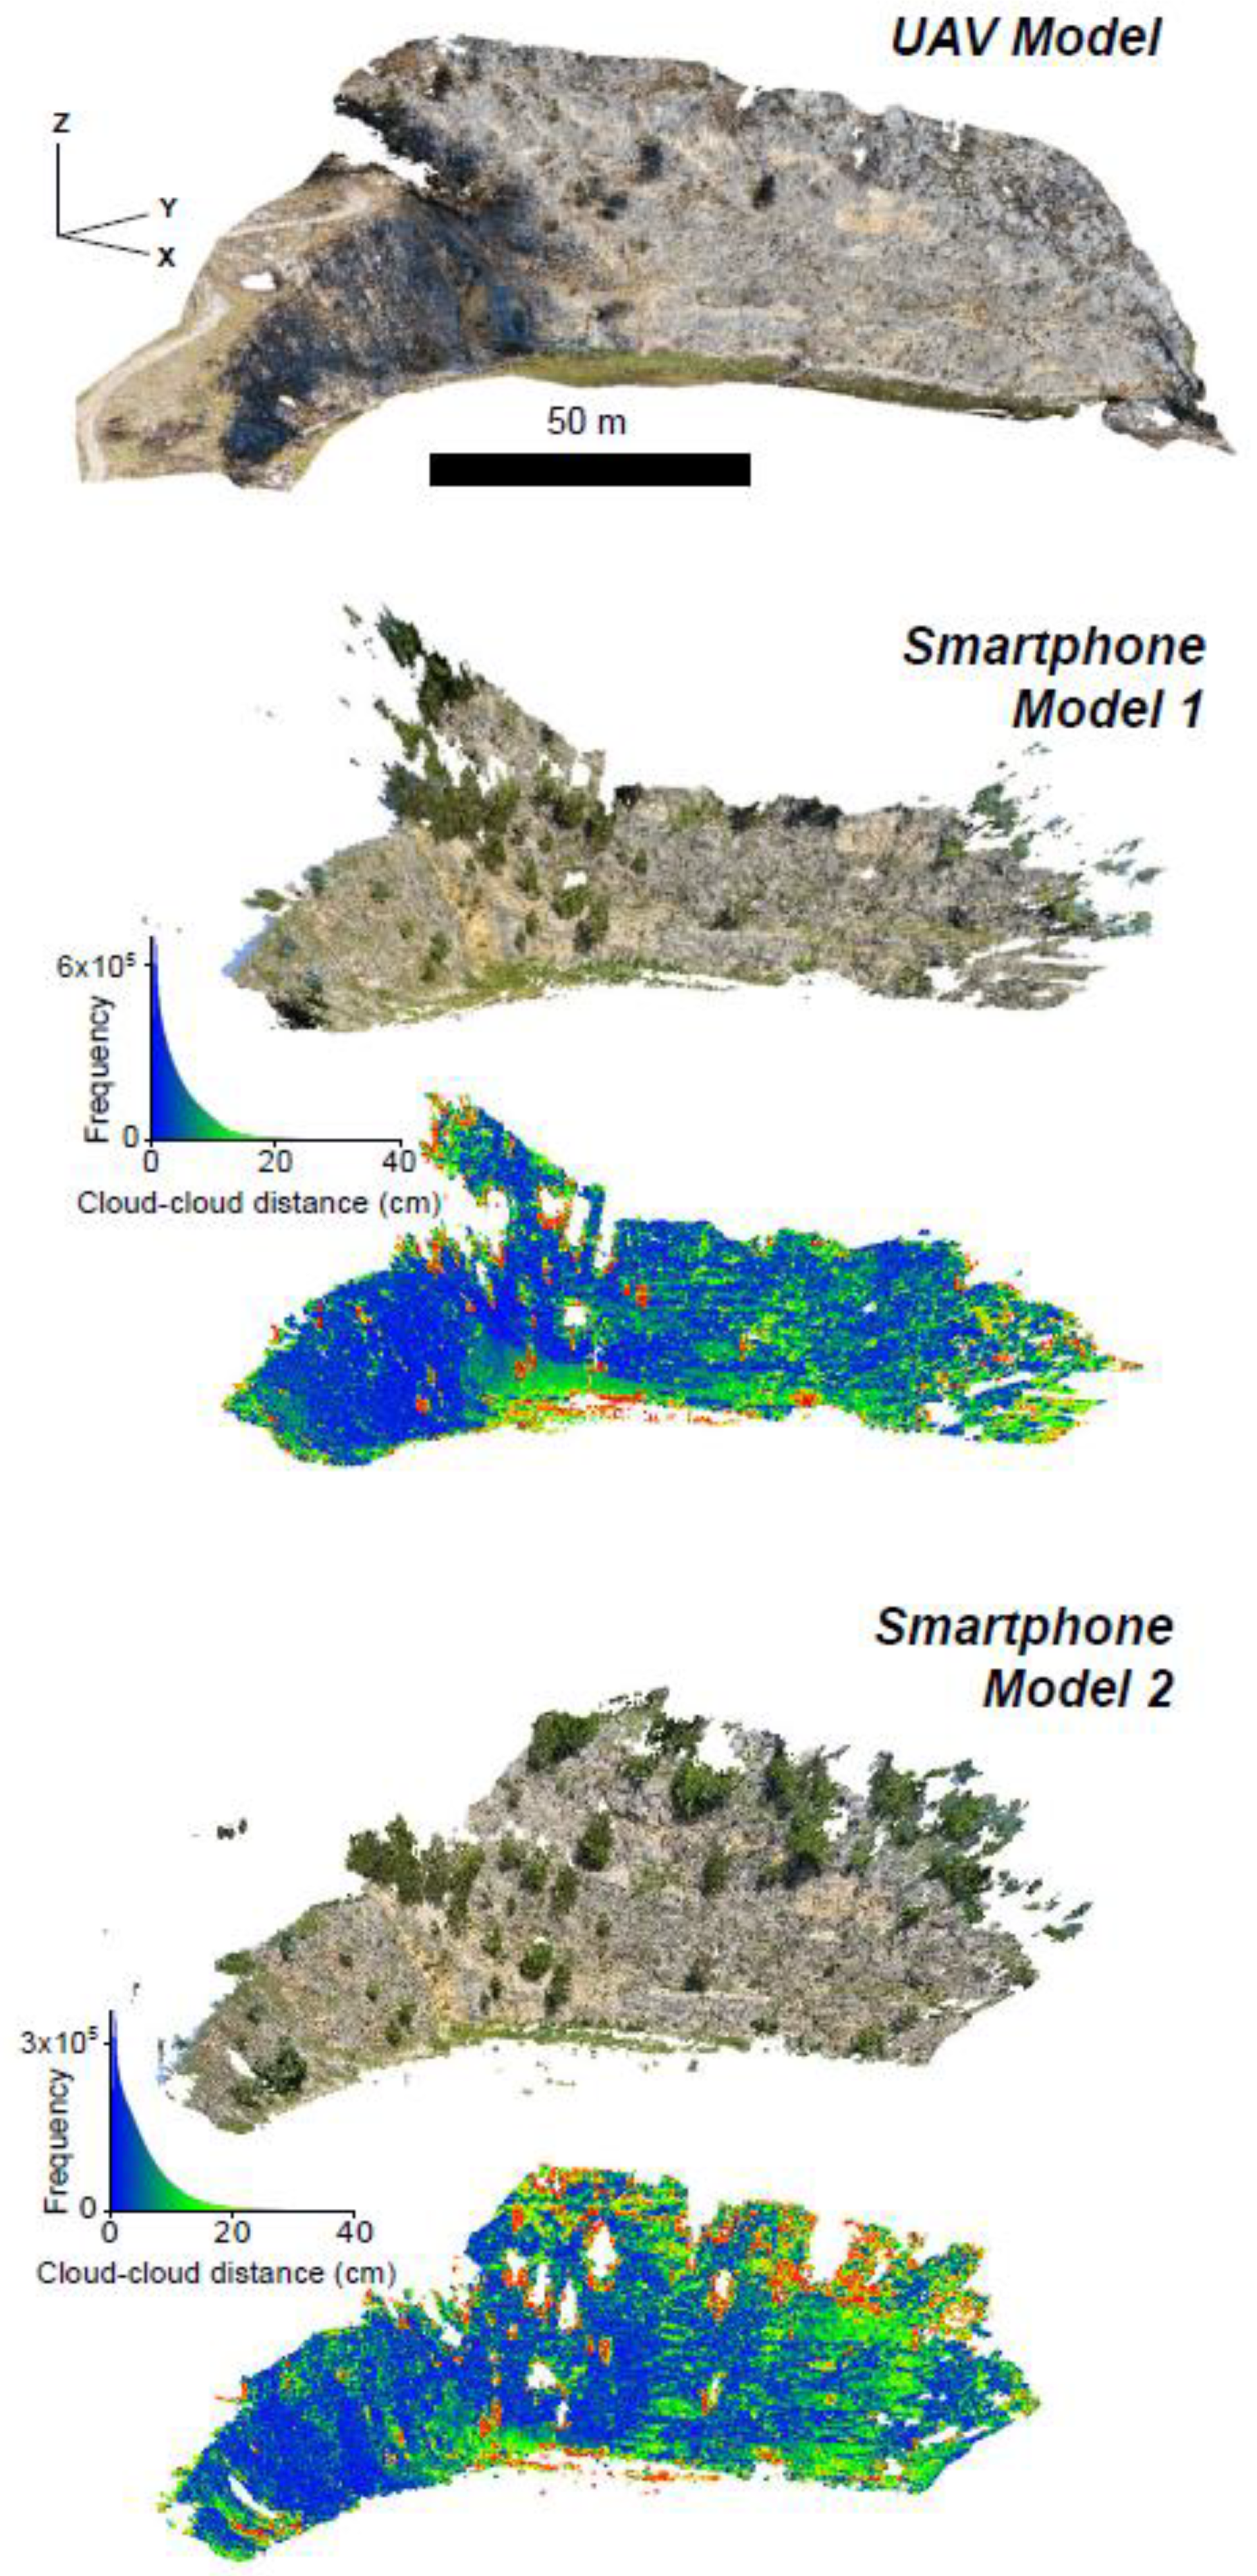
View from south east (SE) of the unmanned aerial vehicle (UAV) and smartphone models. For the two smartphone models, we show both the RGB model and the model colored with the cloud-to-cloud distance (along with the frequency distribution of values) between the smartphone model and the UAV model.
2.3. SfM-MVS Model from Smartphone
For smartphone image acquisition we use a Xiaomi 9T Pro smartphone equipped with the Broadcom’s BCM47755 dual-frequency (E1/L1 + E5/L5) GNSS chip. Image acquisition was carried out by walking at a distance spanning from 10 to 50 m from the exposure and keeping the long axis of the smartphone nearly horizontal and in a nearly upright position (i.e., the inclination was <10°). The availability of dual-frequency GNSS smartphones, jointly with the readiness of GNSS raw measurements in Android, represents a breakthrough for precise geolocation with user-grade technology. The readiness of raw GPS/Galileo measurements allows using algorithms once restricted to professional geodetic GNSS receivers. This, in turn, allows users to fully benefit from the differentiators offered by GPS and Galileo satellites. Thanks to E5/L5 and E1/L1 frequencies, chipsets and receivers benefit from better accuracy, improved code tracking pseudorange estimates, and faster transition from code-to-phase tracking. The simultaneous use of two frequencies reduces the propagation errors due to the ionosphere. In addition, the frequency diversity is more robust to interference and jamming. It is well known that the E5/L5 frequency makes it easier to distinguish real signals from the ones reflected by buildings, reducing the multipath effect, which is a major source of navigation, static, and RTK positioning error in cities and other challenging environments [32]. All this provides improved positioning and navigation both in urban and mountainous environments.
We constructed the two SfM-MVS models using two 12 Mpx resolution photographic datasets. In detail, Model 1 was built using 48 photographs taken on 6 June 2020, between 9.16 and 9.22 CET, whereas Model 2 was built using 31 photographs taken on June 30th, between 10.26 and 10.30 CET. For both models, the acquisition speed was ~1 photo every 10 s. The two models consist of 2.15 × 10⁷ points (Model 1) and 1.39 × 10⁷ points (Model 2) over a surface of 8467 m2 (Model 1) and 12,898 m2 (Model 2), with a mean vertex density of 0.25 point/cm2 and 0.11 point/cm2 respectively. We acquired the photographs using the AngleCam App for Android, which provides photos’ orientation via the magnetometer and accelerometer/gyroscope sensors. The AngleCam App also provides an estimation of the precision of the camera positioning, which for Model 1 was 3.8 m for 40 photos and ~10 m for 8 photos, whereas Model 2 was 3.8 m for all the photographs. The precision for the obtained coordinates is apparently not in accordance with the E5/L5 + E1/L1 GNSS mode, which should ensure cm-level accuracy. As later discussed, this is due to high acquisition speed, preventing stabilization of the measure.
We used orientation and position information prior to and after subsequent steps of image filtering to register the smartphone models, leading to the construction of 15 and 9 pairs of sub-models for Model 1 and Model 2, respectively, following the workflow illustrated in Figure 2.
2.4. Ground Truth Smartphone Models
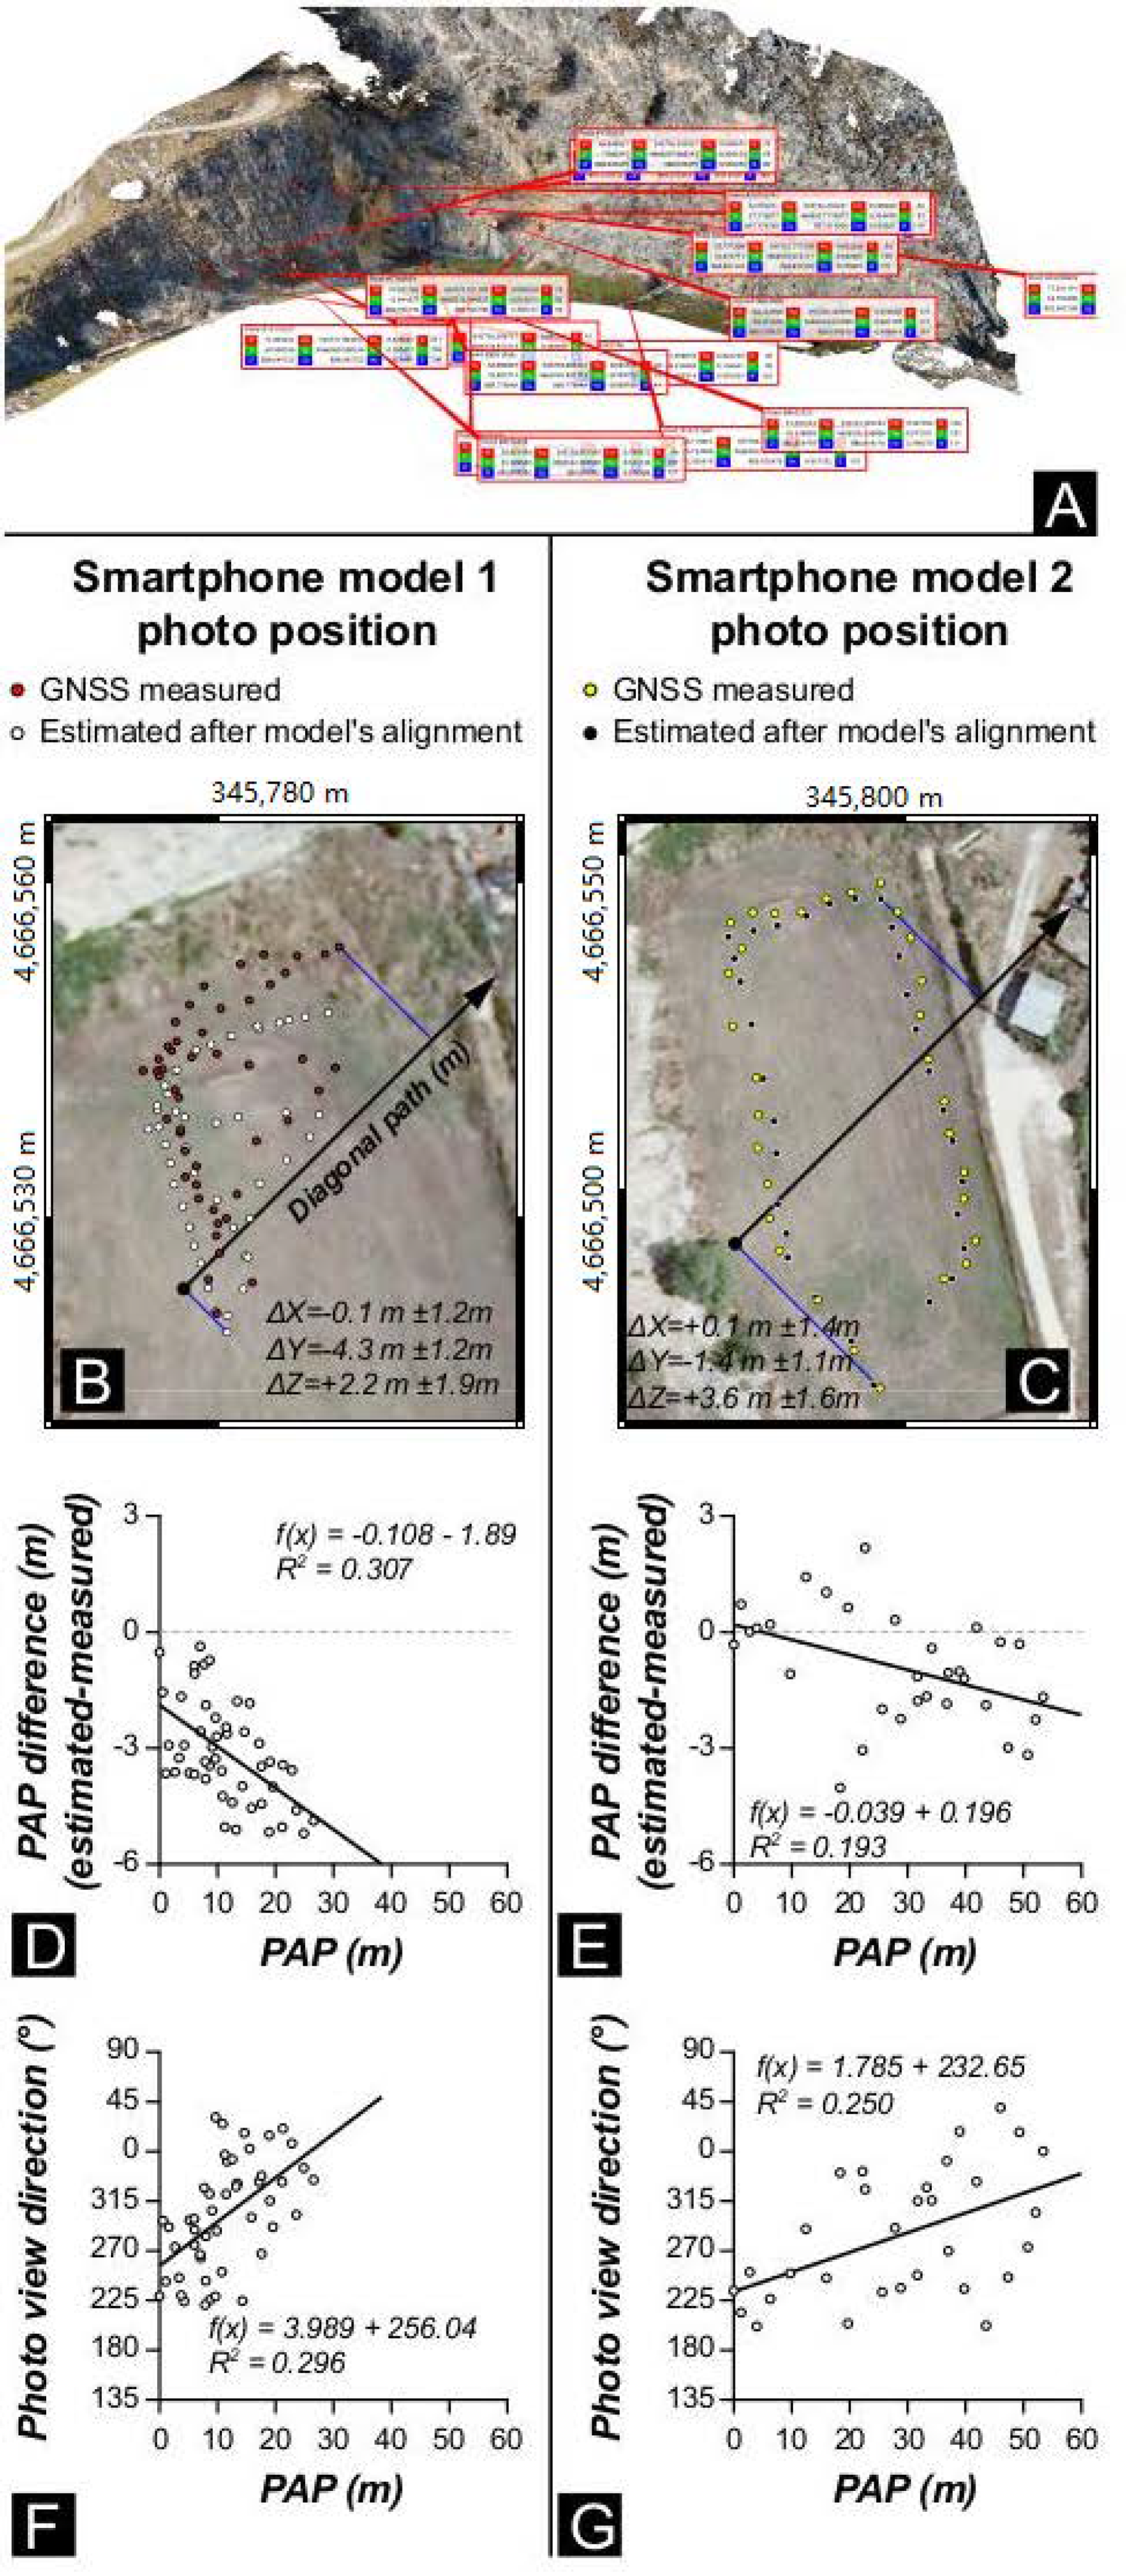
To standardize the comparison of the smartphone sub-models, we built ground truth smartphone models for both smartphone Model 1 (GTSModel 1) and Model 2 (GTSModel 2). In detail, we built GTSModel 1 and 2 in CloudCompare, where we manually aligned the unreferenced point clouds of smartphone Model 1 and Model 2 to the georeferenced UAV model using 16-point pairs (Figure 5A). These point pairs are well-recognizable in all the models and were selected in unvegetated portions of the cliff. The manual alignment (instead of an automatic one) was necessary to overcome issues related to the vegetation: the UAV and smartphone surveys were performed in different periods (February vs. June) and during this time lag, the vegetation has grown. Apart from differences due to vegetation, namely trees and bushes occurring in the smartphone models and not present in the UAV model, GTSModel 1 and GTSModel 2 show a very good agreement with the UAV model, with the cloud-cloud nearest neighbor distance computed in CloudCompare being largely below 20 cm for both models (Figure 4). The alignment of the smartphone models in CloudCompare returns a transformation matrix that we used to reconstruct the estimated position of photographs. The result of this reconstruction is shown in Figure 5B (Model 1) and Figure 5C (Model 2). In both cases, the estimated and measured positions of the cameras show poor correspondence. The average values for ΔX, ΔY, and ΔZ are provided in Figure 5B,C. This mismatch includes different effects: (i) systematic and random errors associated with the GNSS data and (ii) errors in the derivation of camera position during structure from motion estimation, including the lens distortion effect mentioned in the introduction. As shown in Figure 1, this latter problem can produce: (1) a doming effect (i.e., a non-uniform shift of the photos’ position along the survey transect), which is readily detected by analyzing camera position in the direction parallel to the reconstructed scene, or (2) a shift of photos with a view direction oblique to the reconstructed scene. The doming effect can be identified by projecting estimated and measured positions along a direction approximately parallel to the scene straight direction (i.e., the direction labeled “diagonal path” in Figure 5B,C). We computed the camera positions along the diagonal path (PAP) for both the estimated (after model’s alignment) and the measured camera positions. The difference between the two positions for Model 1 varies along the path (Figure 5D), apparently evidencing the occurrence of doming. Model 2 is less affected by this deformation (Figure 5E), as shown by the high degree of data scattering. For both models, the negative value of the slope indicates that the reconstructed PAP of photos tends to be slightly closer to the center of the path than the measured one. On the other hand, plots of the azimuth of the camera view directions versus PAP (Figure 5F,G) clearly evidence that the apparent shift of positions is related to the fact that the camera view direction changes along the diagonal path, i.e., oblique photos are mostly taken at the edges of the survey transect. In the following sections, we show how to mitigate lens distortion issues through the recognition and progressive removal of misoriented photos.
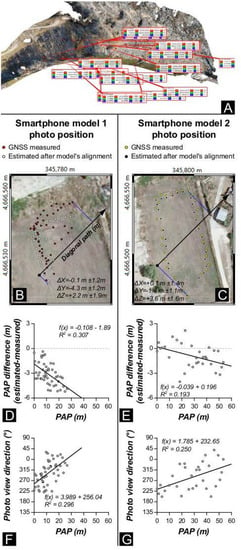
Figure 5.
Ground truth smartphone models. (A) distribution of the 16 points used to align the smartphone models to the UAV model. (B,C) Orthophoto showing the global navigation satellite system (GNSS) measured camera positions and the position of photos as retrieved by the SfM-MVS reconstruction and the subsequent alignment of the smartphone model to the UAV model. (D,E) Measured position along the diagonal path (X-axis) vs. the component along the same direction of the difference between the estimated (i.e., reconstructed and then aligned) and measured camera position. (F,G) Measured position along the diagonal path (X-axis) vs measured camera position.
2.5. Registration of Smartphone Models and Comparison with Aligned Models
The Metashape output for the two smartphone models which form the focus of this study was initially unreferenced and unscaled (i.e., they were output within an arbitrary reference frame). Subsequently, these models were georeferenced following the procedure described in Tavani et al. [16], whereby the model is initially rotated using camera orientation data, and then scaled, translated, and re-oriented using positional data provided by the GNSS, as detailed below.
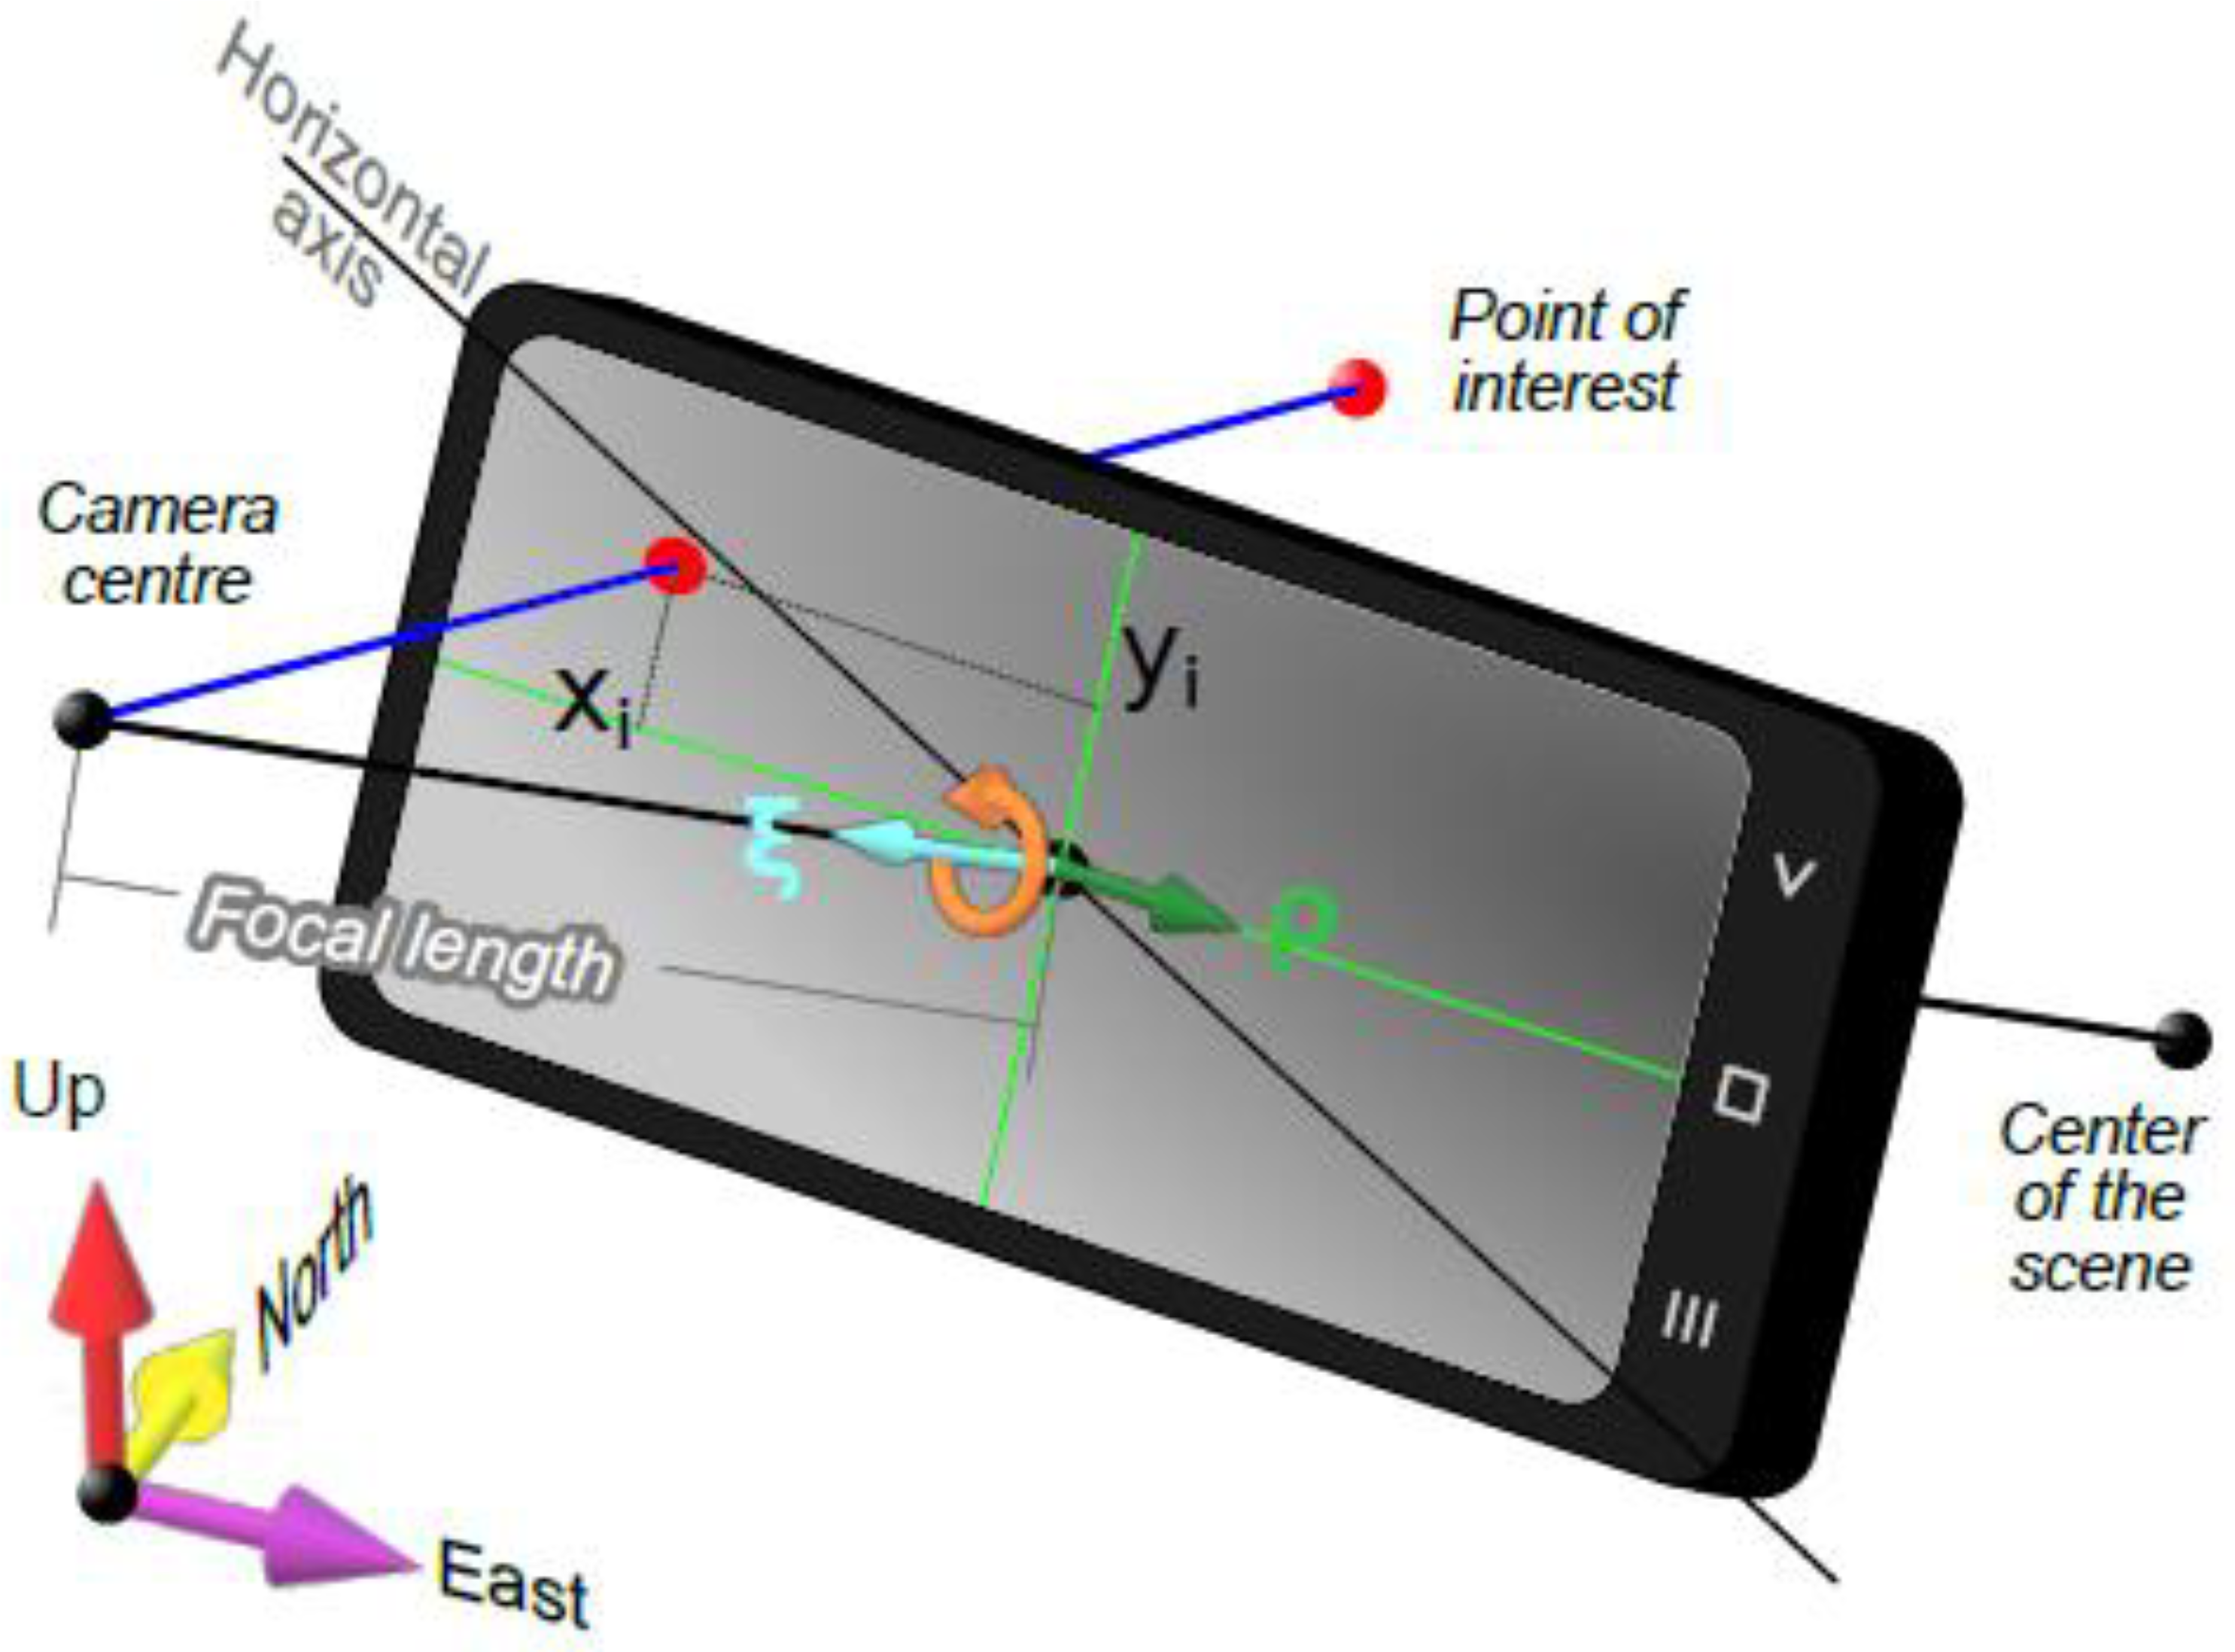
Comparison between measured (by AngleCam) and estimated (i.e., reconstructed from the SfM-MVS software) camera orientations represents the first step in model registration. The orientation of each image can be described by three mutually orthogonal directions: the first is the view direction (ξ), whereas the other two correspond to the direction parallel to the long (ρ) and short axis of the photo, respectively (Figure 6; Table 1). For smartphone photos, these measured directions (ξ and ρ) are obtained from orientation data given by the AngleCam Android App. The estimated view directions can be derived from the reconstructed Yaw, Pitch, and Roll angles in the arbitrary reference frame defined within Metashape. Alternatively, for a less complicated derivation, we suggest that the users export the cameras from Metashape as N-View Match format (*.nvm) files and import these into Meshlab software (https://www.meshlab.net/), where ξ and ρ are represented in a more readable and visually inspectable form as unit vectors.
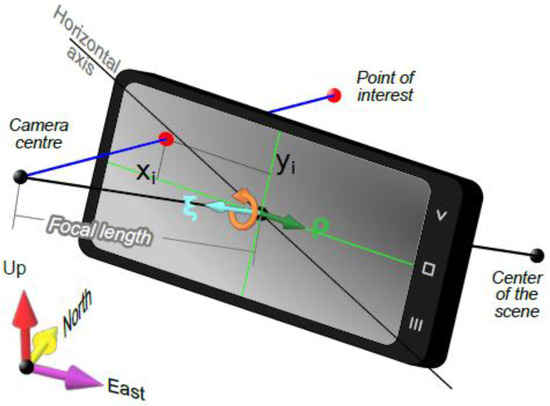
Figure 6.
Pinhole camera model. The camera center and focal length are shown outside the phone for sake of simplicity. ξ is the unit vector defining the camera view direction; ρ is the unit vector orthogonal to the camera view direction and containing the image long axis.

Table 1.
Parameters and acronymous notation.
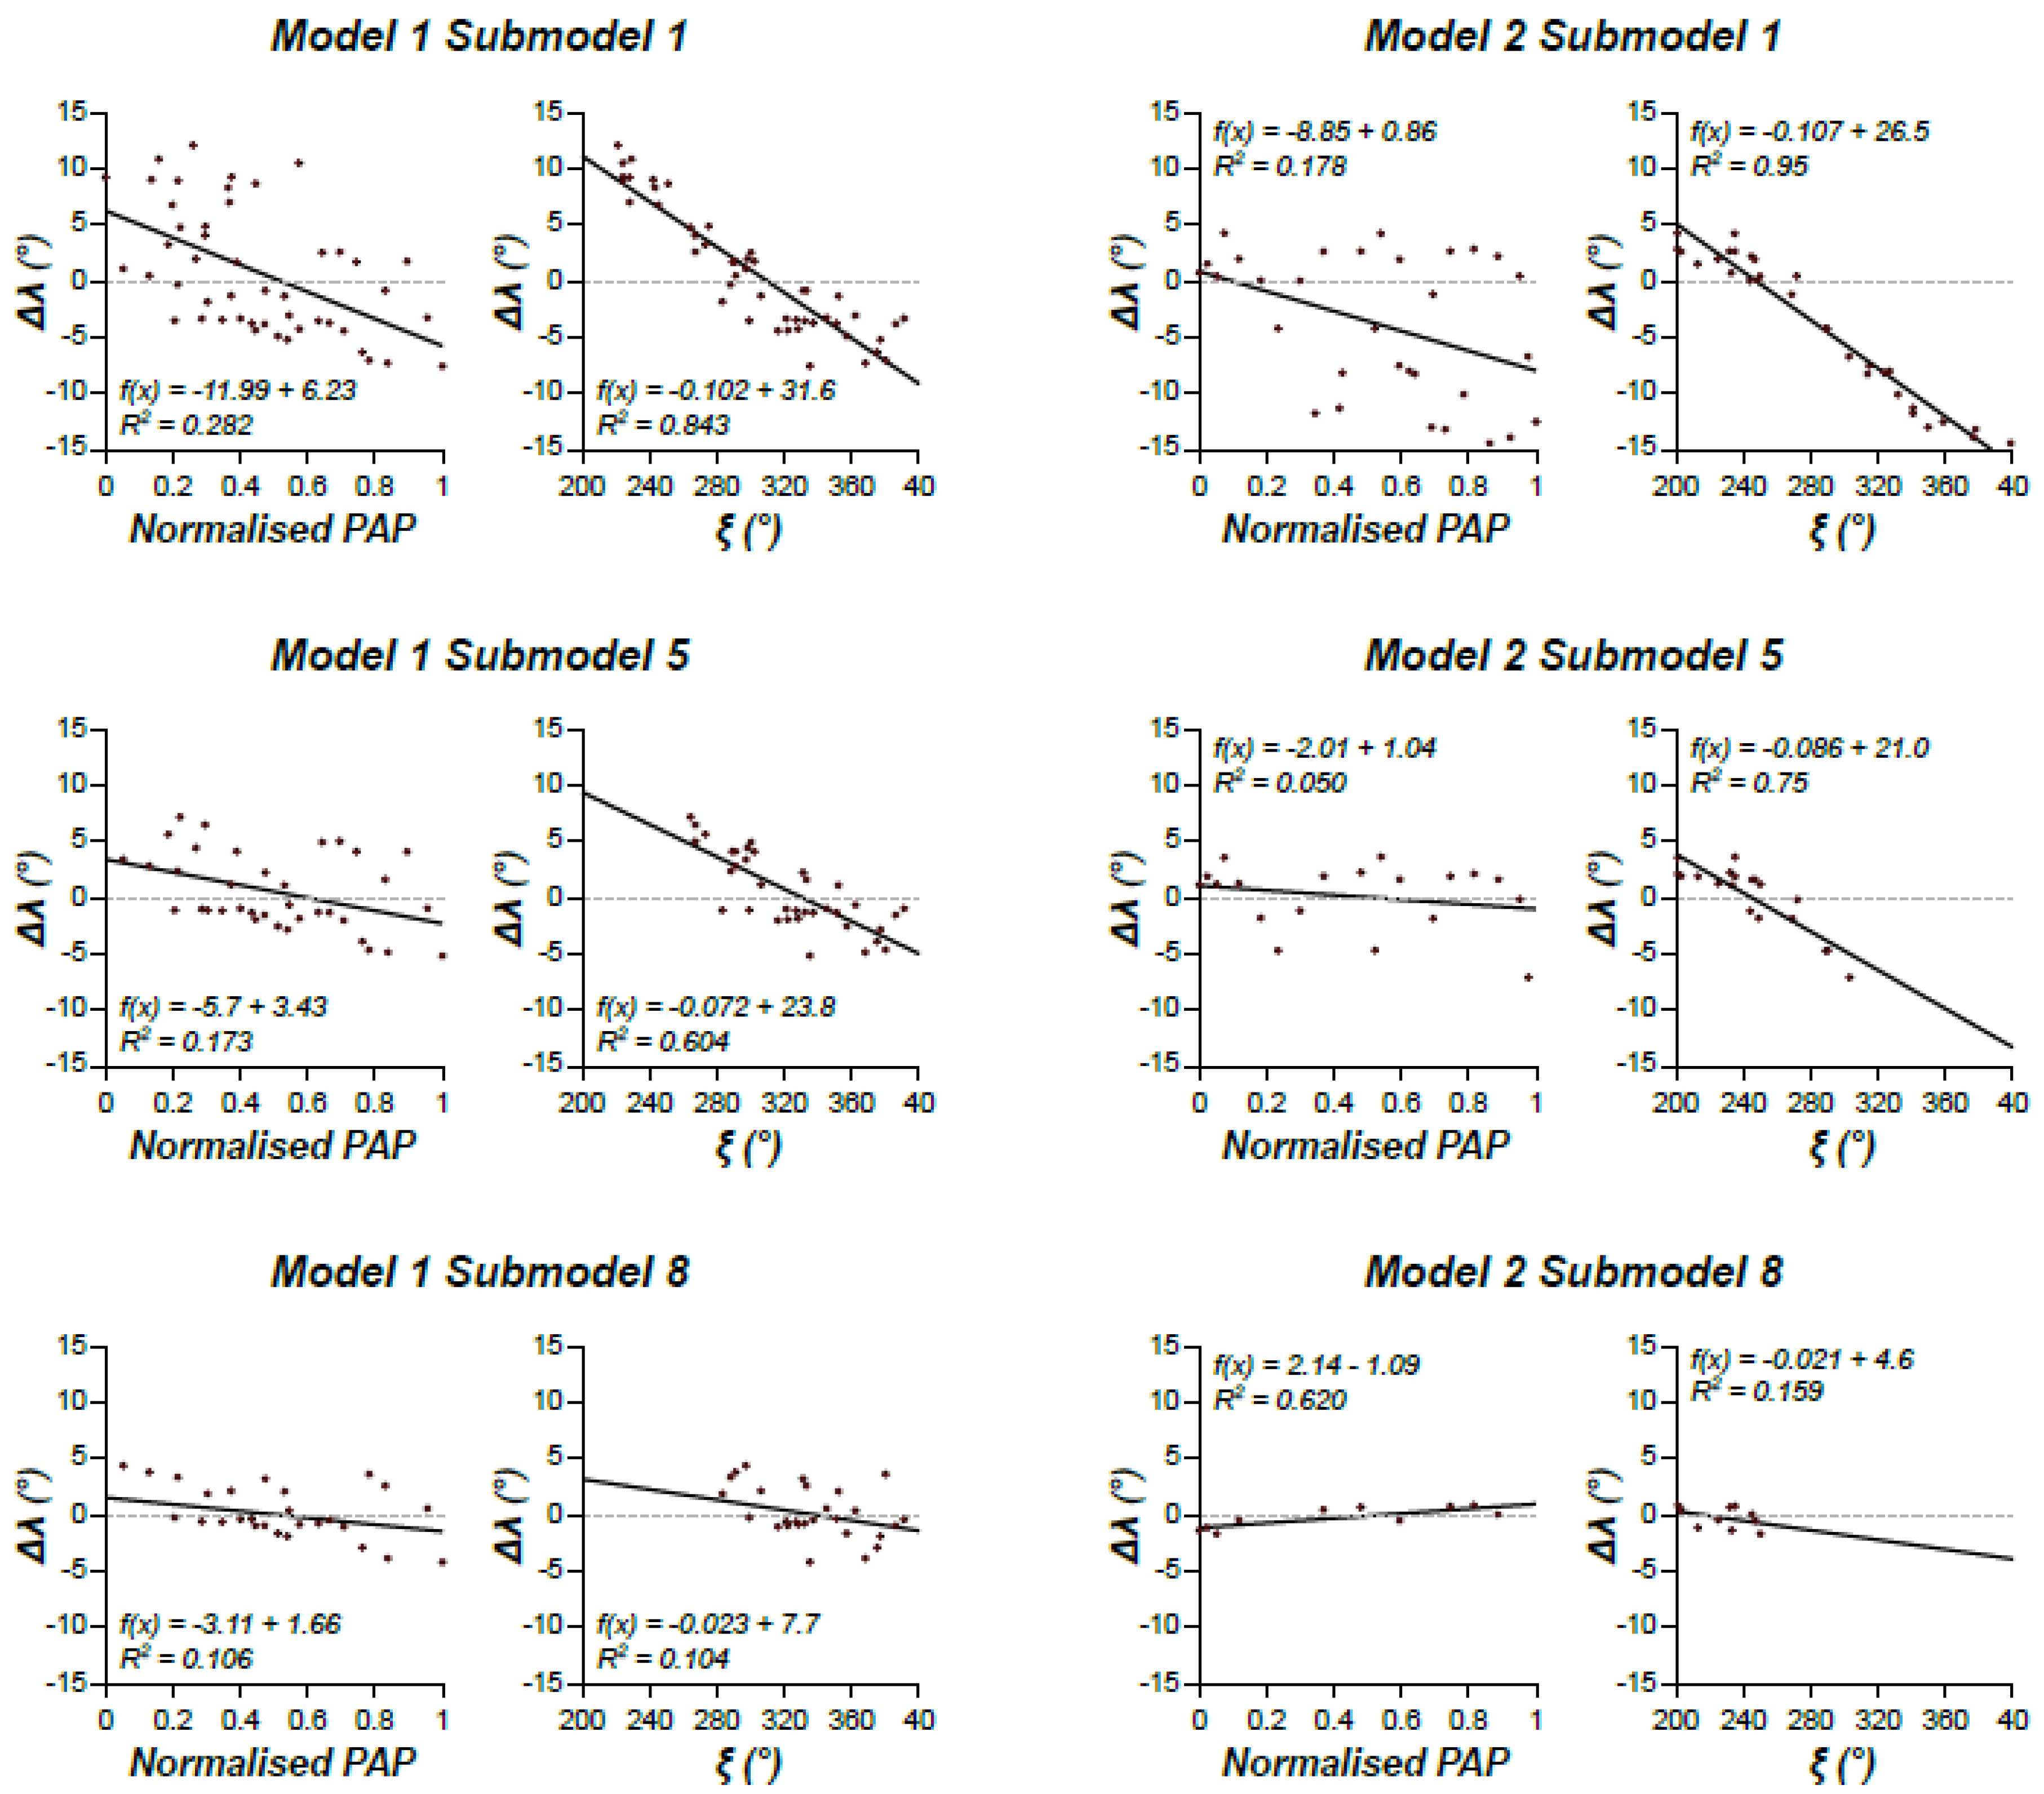
Orienting the model seeks to find the rotation axis and angle which align the ξ and ρ of the Metashape unreferenced model with those measured using the smartphone. We retrieved these two parameters using the method described in Tavani et al. [25] and subsequently used them to rotate the estimated camera positions of the two smartphone models. After this procedure, the camera locations have been translated and scaled. The translation vector is obtained by subtracting the centroid of the estimated-and-rotated SfM-MVS camera locations from the barycenter of the GNSS measured camera locations, while the scaling factor is obtained minimizing the residual sum of squares (RSS) between the previously translated SfM-MVS camera positions and their measured equivalents. The position of the cameras obtained at this stage is hereinafter named registered camera position (RCP). This procedure is further optimized by aligning the RCP XY coordinates to the measured camera XY coordinates, by rotating data around a vertical axis. The position of cameras obtained at this stage is hereinafter named finely registered camera position (FRCP). These two steps of RCP and FRCP computation are achieved using OpenPlot [33]. For each photo, we also computed the angular difference between the estimated-and-rotated and the measured ξ and ρ directions: i.e., Δξ and Δρ. We used the Δξ and Δρ average values (Δλ) to characterize the orientation mismatch. We recursively performed the aforementioned procedure of model registration, eliminating at each step, the three photos with the higher values of Δλ, until we reached a minimum number of suitable photos (i.e., >8). During these iterations, we produced 15 pairs of sub-models (i.e., 15 RCP and 15 FRCP) for smartphone Model 1, and 9 pairs of sub-models for smartphone Model 2. This process is aimed at removing misoriented outlier photos, to investigate if and how this improves the registration process. As an example, Figure 7 shows Δλ versus the normalized position along the diagonal path (trace of the path is shown in Figure 5B,C) and camera view direction (ξ) for six sub-models. The slope of the best fit lines reduces with progressive removal of photos with higher Δλ. This latter parameter becomes almost zero in the sub-models with the least number of photos, meaning that Δλ for these models decreases and becomes ostensibly insensitive to camera position and orientation.
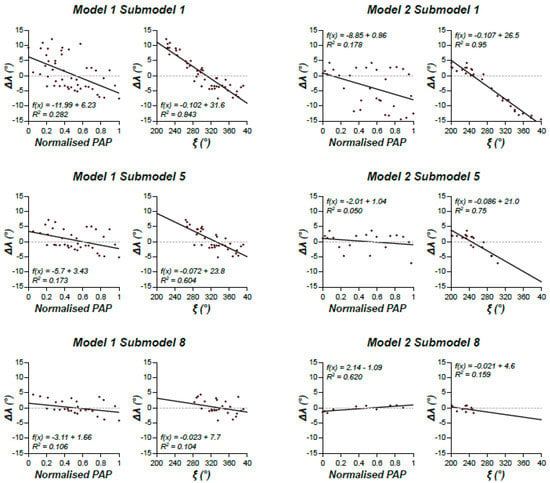
Figure 7.
Graphs for three sub-models of Model 1 and 2, showing the relationships between the position of (normalised position along the diagonal path shown in Figure 5) and view direction of photographs vs. the angular difference between the estimated-and-rotated ξ and ρ and the measured ones (i.e., Δλ = (Δξ + Δρ)/2).
The importance of Δλ vs PAP and Δλ vs ξ relies on the fact that, differently from parameters shown in Figure 5D–G (i.e., the difference between measured and estimated camera position), they are derivable factors regardless of the availability of ground truth models. Hence, defining how these parameters vary according to the quality of georeferencing enables their use to evaluate the georeferencing quality when GCPs are unavailable.
3. Results
Through the registration procedure outlined above, we produced multiple registered camera positions (RCP) and finely registered camera positions (FRCP) for the two smartphone models. We used these positions (RCP and FRCP) to georeference the two smartphone models, obtaining 48 sub-models (15 pairs for Model 1 and nine pairs for Model 2). We also produced two GNSS models, whose registration was obtained by using the XYZ coordinates of each photo, as recorded by the smartphone GNSS sensor, without considering the photo orientation data.
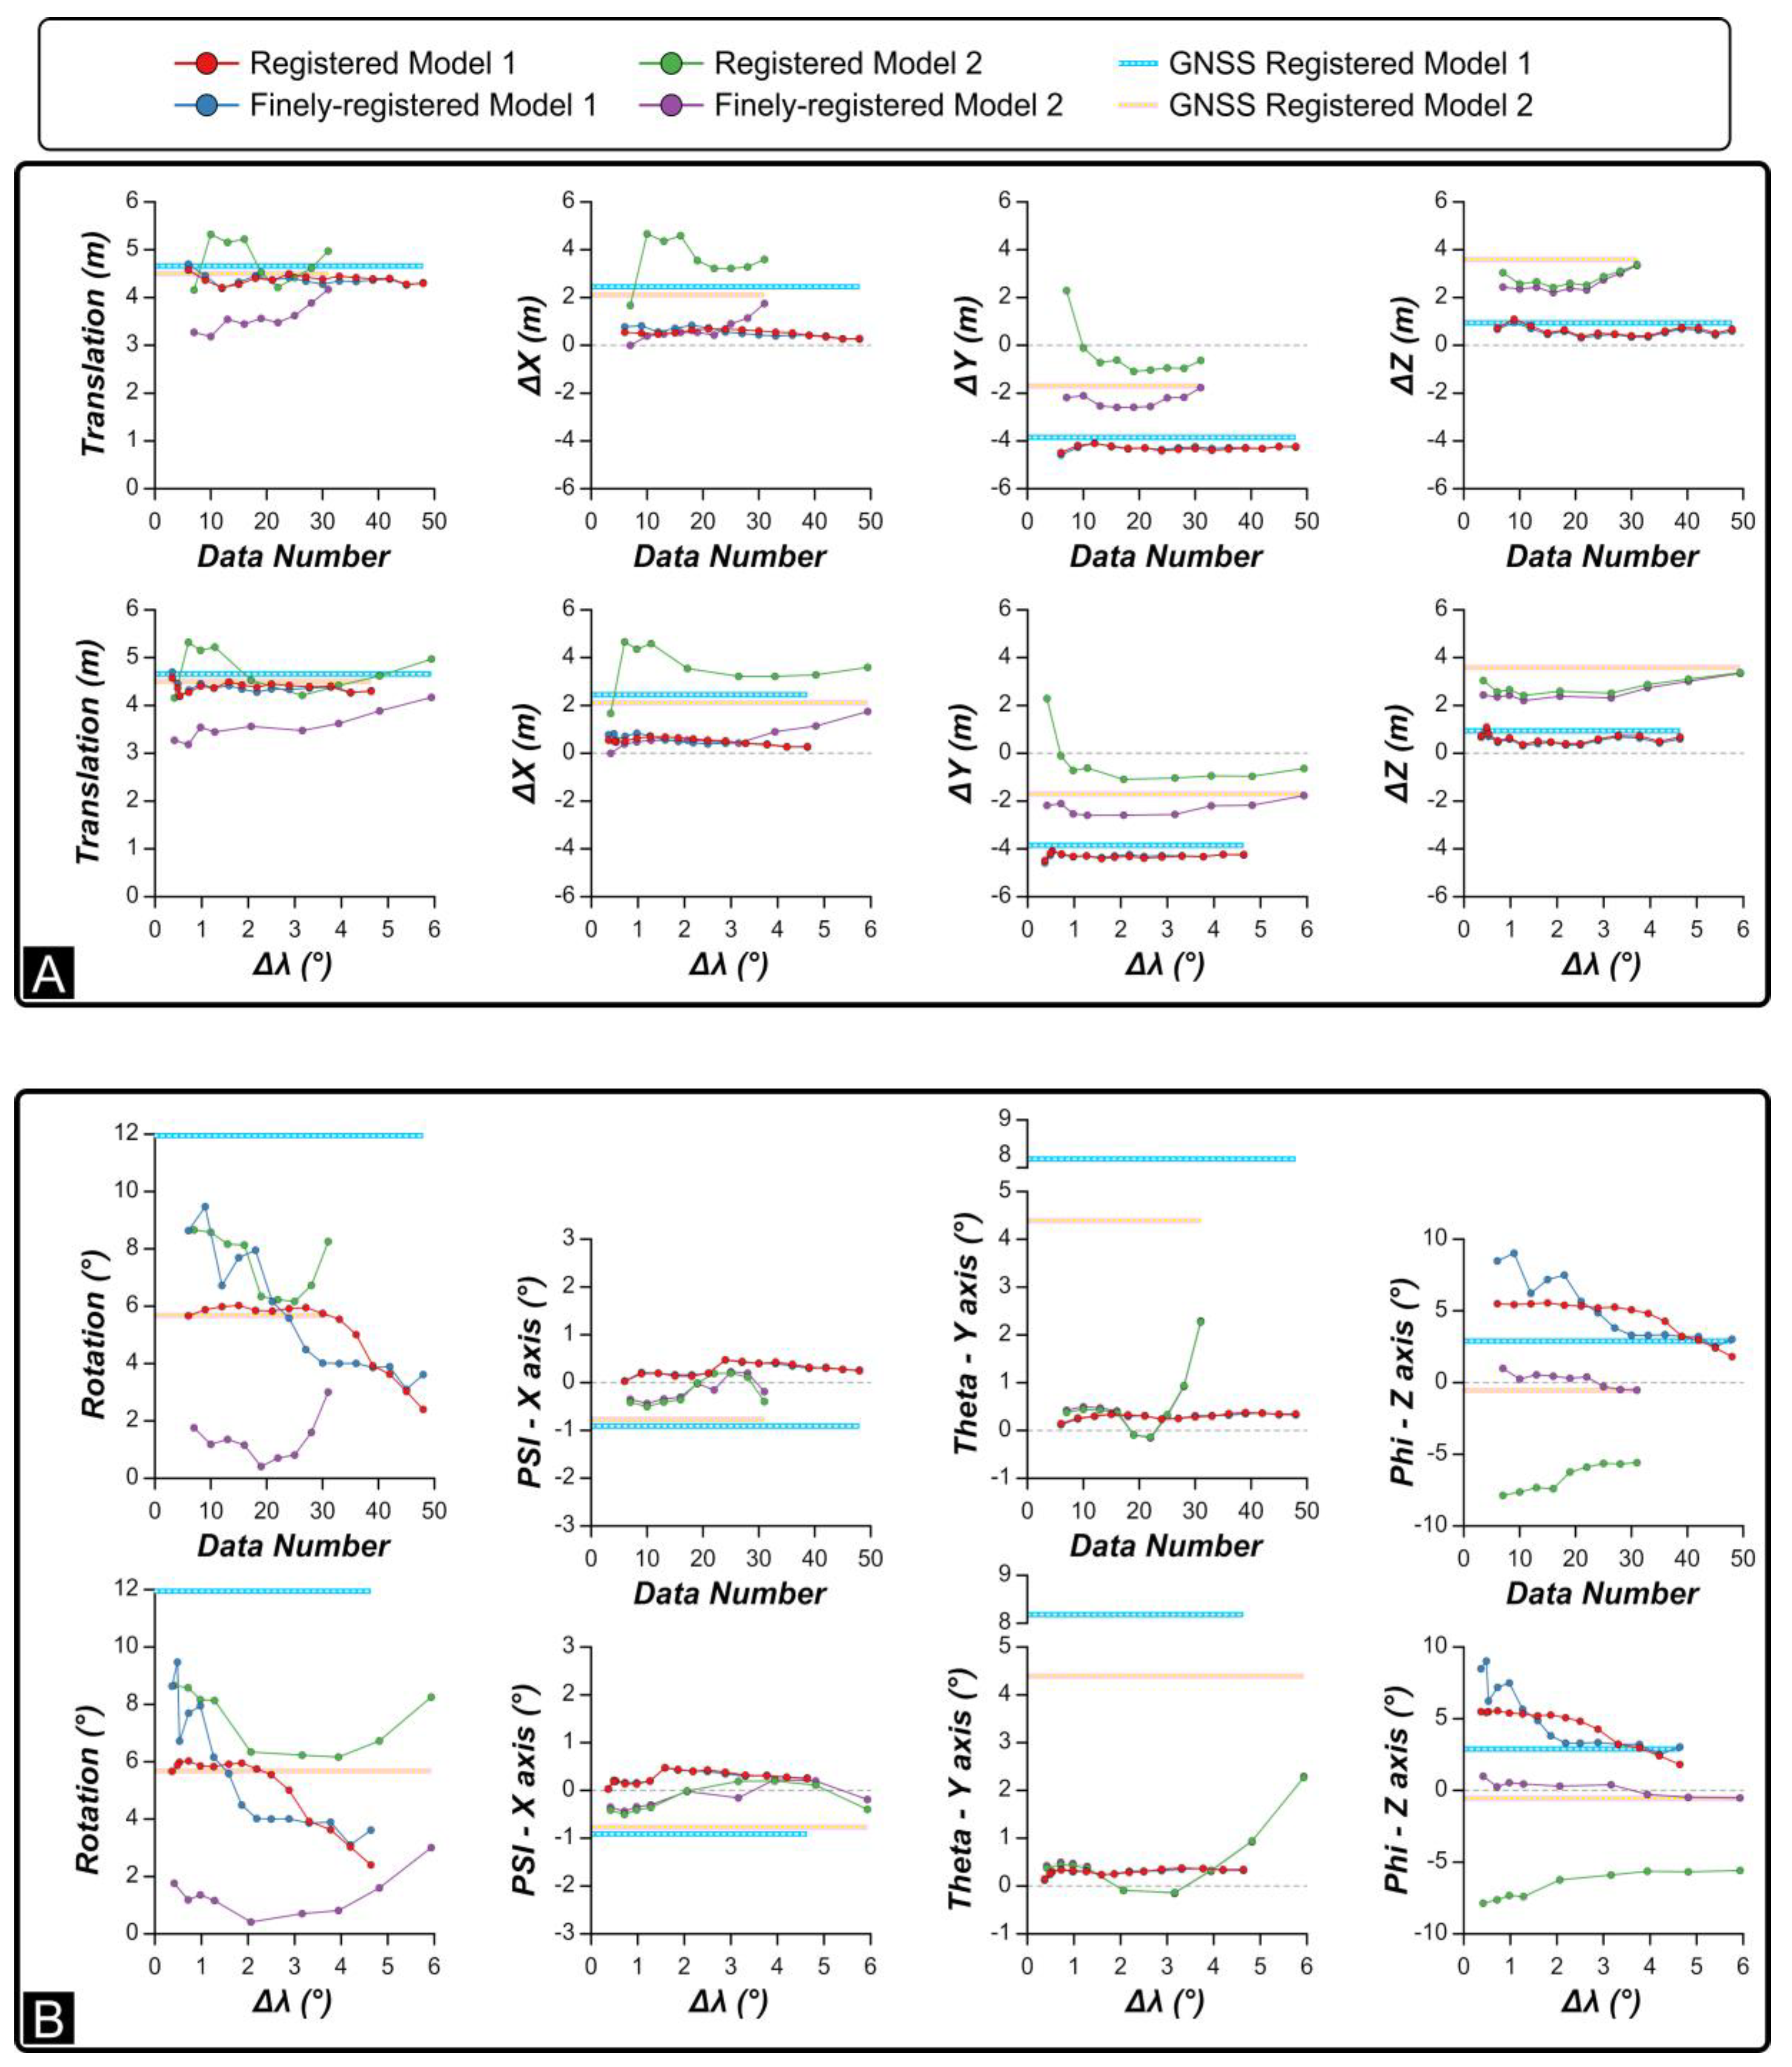
In CloudCompare, we have automatically aligned each one of these sub-models to the corresponding ground truth model (i.e., GTSModel 1 and GTSModel 2) using the “finely register” alignment function. Outputs of this automatic alignment procedure include: scaling factor, translation vector (with the ΔX, ΔY, and ΔZ component), and three Euler angles, i.e., the angles of rotation around the X (Psi angle), Y (Theta angle), and Z axis (Phi angle), along with the sum of the modulus of these angles. In Figure 8, translation and rotation parameters of the alignment to the ground truth models are plotted against the data number (i.e., the number of photos used to register the sub-model) of the sub-models and the Δλ parameter (Δλ is computed using those photos employed to register each sub-model). In all the graphs, the highest values of data number and Δλ correspond to models for which misoriented photos have not been removed yet. Hence, each subsequent data point from right to left corresponds to a successive iteration. The two GNSS models are unique and consequently are represented in the graphs of Figure 8 as two horizontal lines at constant value. Figure 8A shows that the progressive removal of misaligned photos produces a slight increase in quality in terms of translation, with up to 1.5 m of gain in positional agreement for the FRCP model 2 with respect to the GNSS model 2. Conversely, the impact that this iterative optimization procedure has on the rotational component of model registration is significant (Figure 8B). For Model 1, the sum of rotation angles passes from almost 12° for the GNSS model, to less than 6° for many FRCP and RCP sub-models. For Model 2, the sum of the rotation components passes from 6° for the GNSS model to less than 2° for the FRCP sub-models, down to less than 1° for some of these sub-models. It is worth noting that the minimum angular displacement is obtained when Δλ 2°, corresponding to sub-model 5, for which the data number (i.e., the number of used photos) is 19. Concerning the individual rotation components, Psi and Theta tend to stabilize in models with Δλ < 2° and differences between each FRCP and RCP sub-model is <1°. The Phi angle (rotation around the Z axis) is instead highly variable. It is even higher than the GNSS models for RCP models and the FRCP Model 1. For FRCP Model 2, it is <1° regardless of the Δλ value.
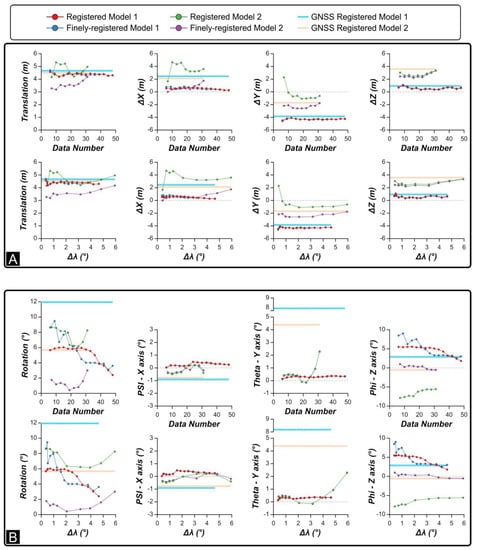
Figure 8.
Mismatch between registered and ground truth smartphone models for the different sub-models. (A) Translation and (B) rotation needed to perfectly align the smartphone sub-models to the corresponding ground truth model. The plots also include the mismatch between the ground truth models and the model registered using the GNSS position (without using camera orientation information).
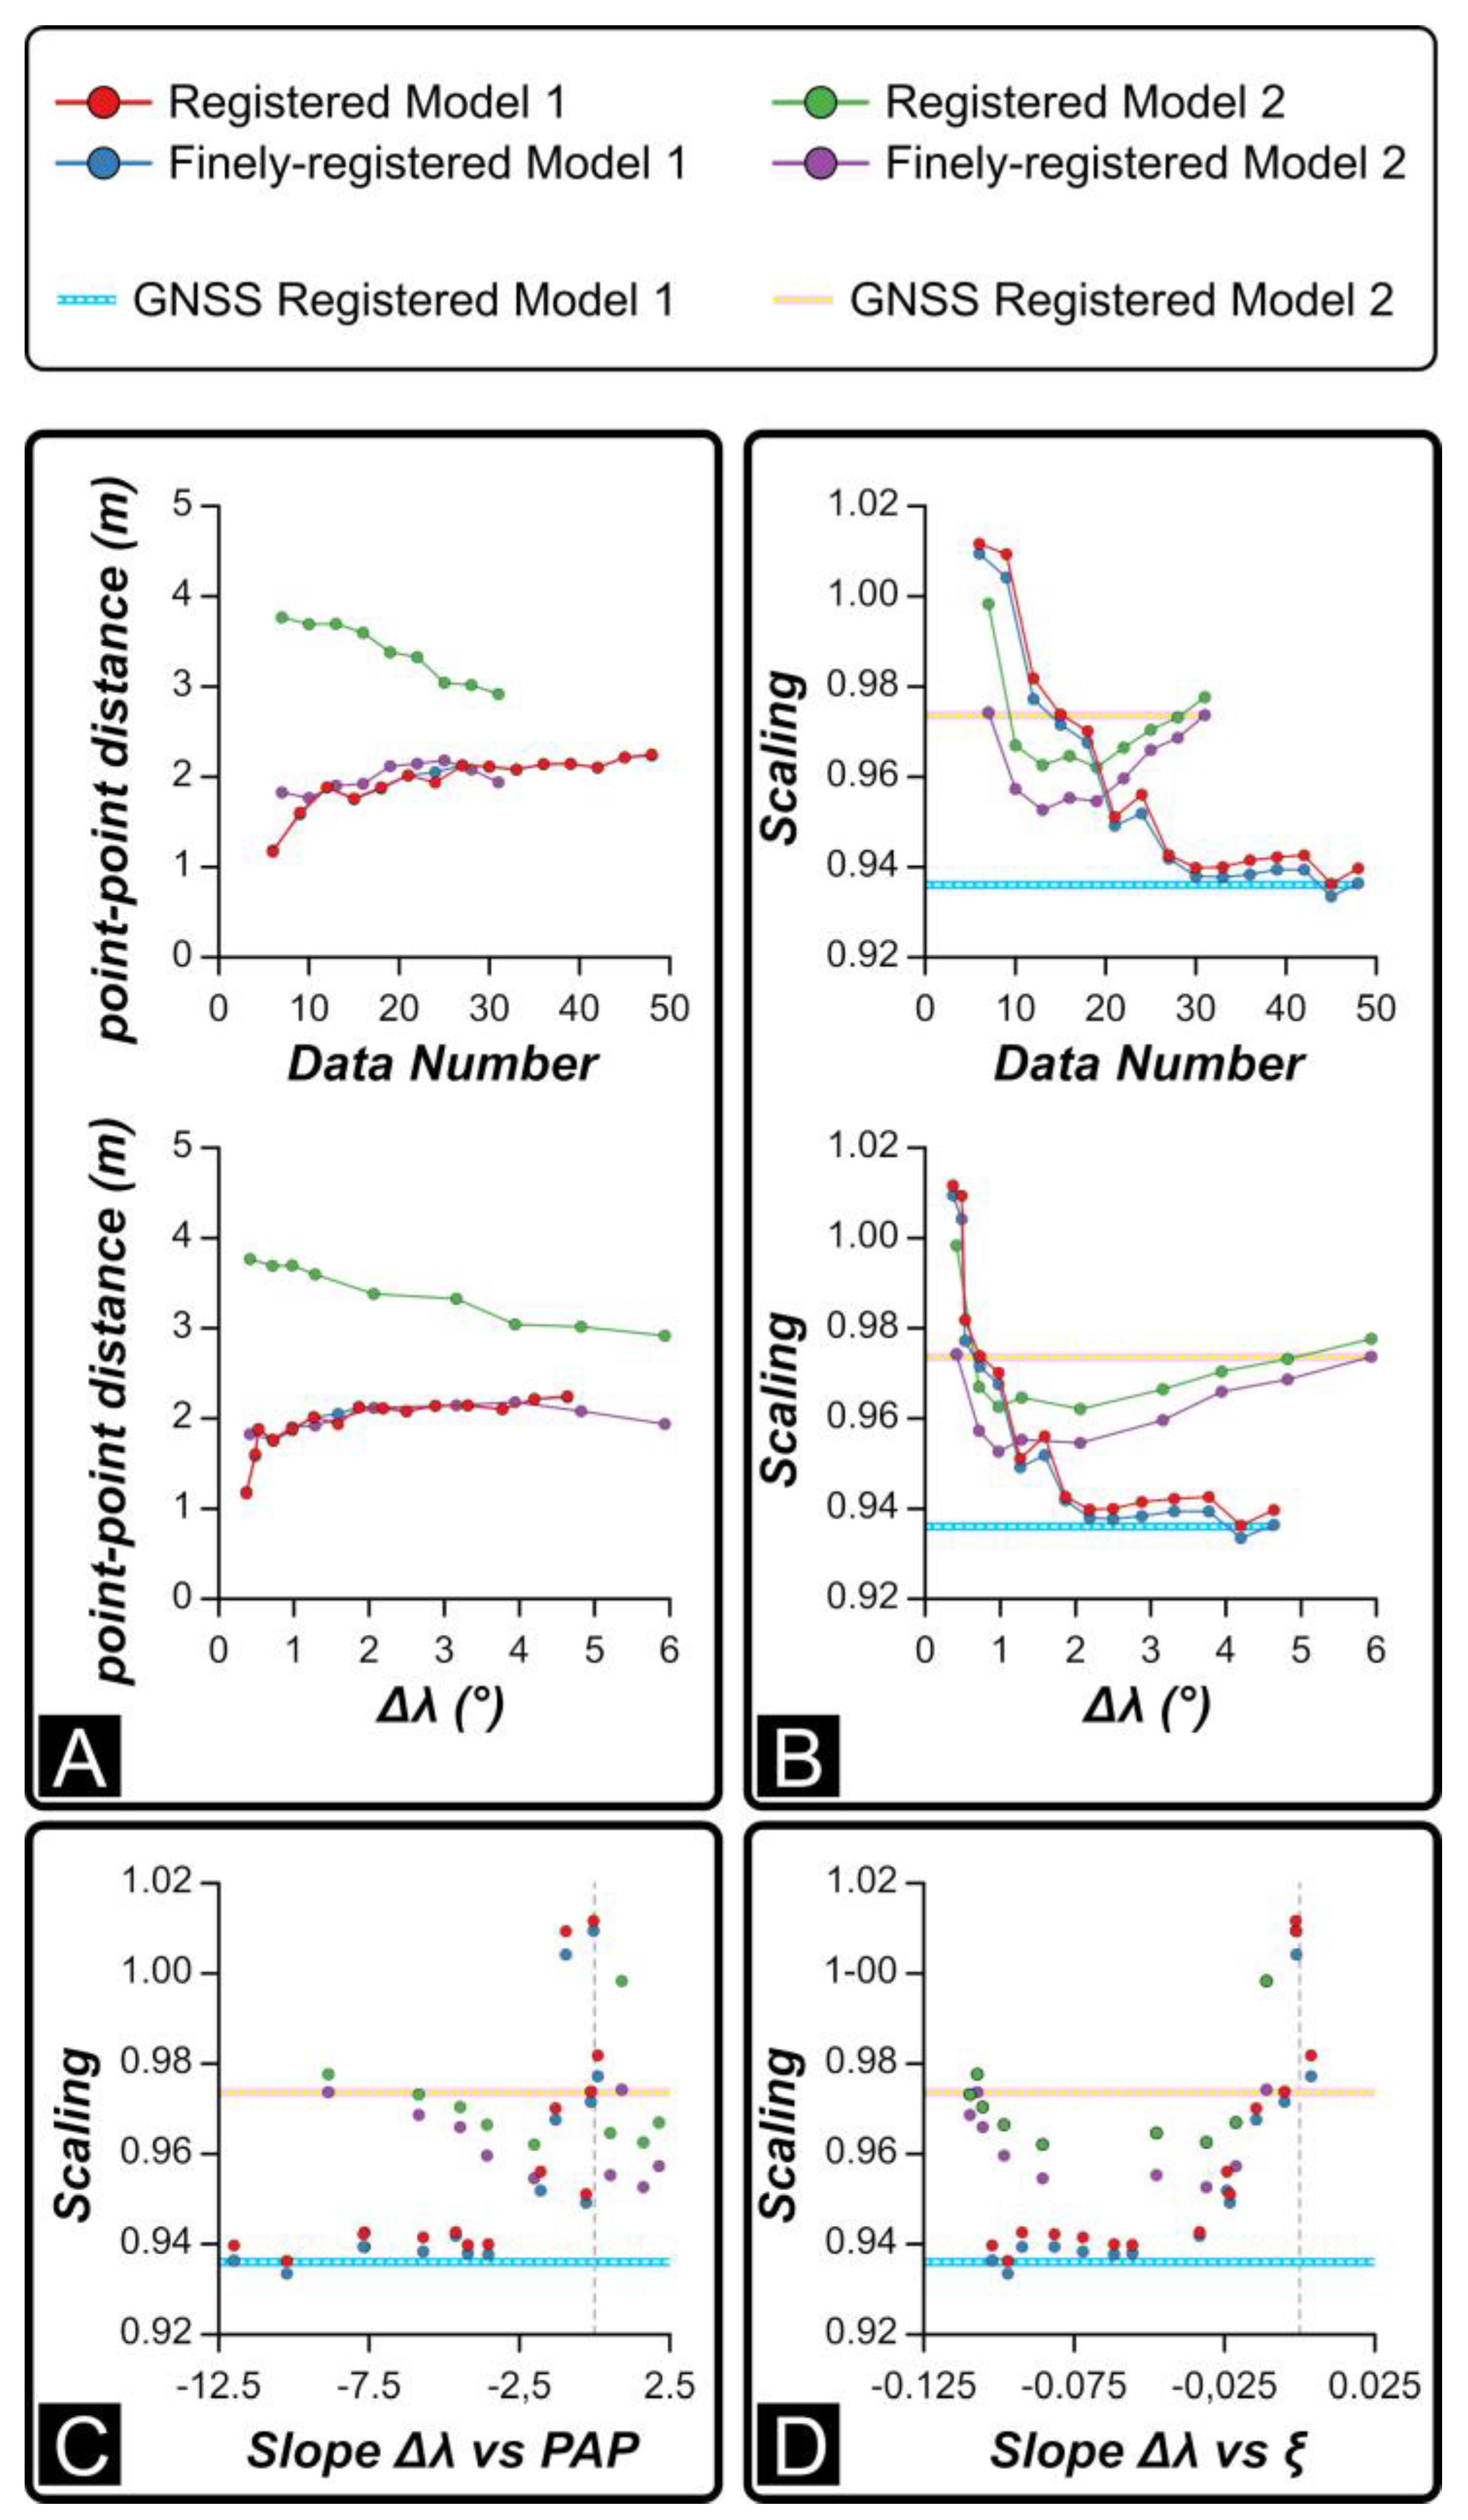
We also plotted the average distance between the measured and reconstructed positions of photos (point to point distance) (Figure 9A) and the scaling factor against the number of photos used to register the sub-model and Δλ (Figure 9B). The scaling factor is also plotted against the slope of the Δλ vs. (i) normalized PAP (Figure 9C) and (ii) view direction (ξ) (Figure 9D). These plots allow us to evaluate whether scaling is influenced by the spatial distribution and orientation of photographs used for registration and, ultimately, to quantify how much camera misalignment related to lens distortion affects the scaling. Data illustrated in Figure 9A suggests that when photos with high Δλ are progressively removed, the average distance between the measured and reconstructed positions of cameras slightly reduces for FRCP and RCP Model 1 and for FRCP Model 2. RCP Model 2 shows contrary behavior, with a general increase of point to point average distance when photos with high Δλ values are progressively removed. With respect to scaling (Figure 9B), progressive removal of misaligned photos produces improved scaling factor accuracy for both RCP and FRCP Model 1, which approaches 1 (i.e., the model is correctly scaled) for Δλ < 1°. Model 2 shows, instead, a more complex trend: the scaling factor firstly decreases from 0.97 to 0.95, then rises up to 0.98%. The local minimum is attained for Δλ values ranging between 1° and 2°. As anticipated (Figure 1), an incorrect scaling factor could be related to the non-random misalignment of cameras caused by unaccounted lens distortions. The effect of misaligned cameras on scaling is readily detectable in the plots of Figure 9C,D, showing that when the slope of the Δλ vs. PAP and of Δλ vs. view direction decrease, the scaling factor decreases. In summary, when the slope of these regressions is 0, the corresponding sub-model is registered with images negatively affected by lens distortion and the scaling is close to 1.
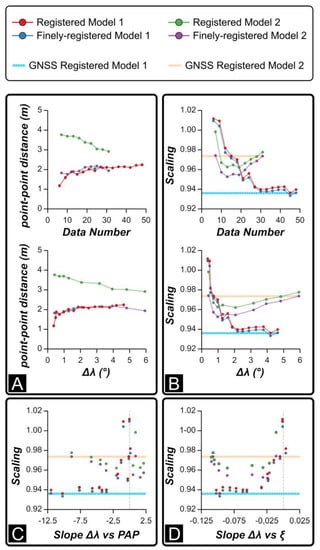
Figure 9.
Mismatch between registered and ground truth smartphone models for the different sub-models. The mismatch includes: (A) the average distance between measured and reconstructed camera position and (B) scaling needed to accurately align the smartphone sub-models to the corresponding ground truth model. Scaling is also compared with the slope of the best fit lines of Δλ vs (C) position along diagonal path and (D) view direction (as shown in Figure 7). The plots also include the mismatch between the ground truth models and the model registered using the GNSS position (without using camera orientation information).
4. Discussion
4.1. Rationale
In this work, we have benchmarked SfM-MVS photogrammetric 3D models created and registered via smartphone sensors against a SfM-MVS photogrammetric 3D model created via UAV based image acquisition and registered using accurately geo-located GCPs (georeferenced using a differential GNSS antenna). The latter model has been considered as the true ground data (benchmark), with the good agreement between the orthophoto derived from the UAV model and the 1:5000 topographic map of the study area largely supporting this assumption (Figure 3A). The registration of the smartphone models has been done comparing the orientation and position of photographs (as measured by the smartphone sensors) with the same dataset estimated in the reconstructed SfM-MVS photogrammetric scene, prior to and during an iterative procedure of misaligned camera removal.
4.2. Position and Orientation Errors
Both the measured and estimated data are affected by errors that are only partly detectable and distinguishable. Orientation data includes trend and plunge of the camera view direction (ξ) and of the direction parallel to the long axis of the camera (ρ). Since both ξ and ρ are gently plunging (<10°), the measurement of their plunge basically relies only on the inclinometer/gyroscope sensors, and errors associated with this kind of measurements are typically <1° [16], providing the most robust metric of the entire procedure. This is evidenced by values of Psi and Theta (i.e., the angle of rotation for each model to the ground truth around the X and Y axis respectively) that are <1° for most of the models (Figure 8B). The measured trend of ξ and ρ is instead provided by the magnetometer and it can be affected by errors of variable magnitude. The need for frequent recalibrations, along with possible sources of local magnetic fields (both internal and external to the smartphone), in our experience as field geologists as well as studies that quantify the effect [34,35] may imply errors up to ten degrees, depending in part on the device. These errors can significantly affect the georeferencing of models registered with the Registered Camera Position method. Instead, for models registered via the Finely Registered Camera Position methods, the occurrence of systematic errors in the measurements provided by the magnetometer does not affect the model registration. Indeed, the final rotation about the Z axis, constrained by the GNSS measured XY coordinates of photos, can essentially cancel out any systematic error in the trend of ξ and ρ. In agreement, our results show that a model’s registration based only on orientation data (i.e., RCP) produces unsatisfactory results. Consequently, this method is no longer considered in the following discussion.
Concerning the measured XYZ coordinates of photographs, errors associated with the built-in GNSS smartphone sensor were ~4 m as recorded by the AngleCam App, also observed in the field using the GPSTest app. Models translation error ranges from 3 to 5 m in the tested models (Figure 8A). This value includes both the systematic positioning error of the recorded GNSS locations and the contribution associated with the image misalignment during the SfM scene reconstruction. The minimum translation value is attained in the FRCP sub-models 2, for which the amount of translation decreases from 4 m down to 3 m as Δλ decreases from 6° to 1°. This suggests that 3 m can be taken as an estimation of the systematic GNSS positioning error for the camera locations of Model 2. Similarly, 4–5 m is taken as the systematic positioning error for photographs of Model 1. The rather stable values of the translation components for the FRCP models (Figure 8A) suggest that these stable values roughly correspond to the systematic error of each component. These components are congruent with the average ΔX, ΔY, and ΔZ shown in Figure 5B,C, derived by comparing the UAV and smartphone models. In the same figure, the standard deviation of ΔX, ΔY, and ΔZ is reported, spanning from 1.1 to 1.4 m for ΔX and ΔY, and from 1.6 to 1.9 m for ΔZ. We take these values as proxies for the random positioning error of each component. Rotation and scaling procedures in the FRCP models are not affected by the systematic positioning error, whereas the random component may significantly impact these two steps. These errors are similar in the two models, though the length of the survey transect for Model 1 is approximately twice that of Model 2 (60 m vs. 30 m). The high values of Phi for the FRCP Model 1 (Figure 8B) indicates that a random positioning error of 1.5 m for the X and Y component for a 30 m long survey transect (5%) can lead to unsatisfactory registration results. When the random error decreases to about 2.5% of the length of the survey transect, the quality of the registration drastically increases. Notice that the provided random and systematic positioning errors have been derived, whereas the only hard datum is the positioning error provided by the smartphone GNSS sensor, which we estimated to be 4 m for both Model 1 and Model 2, corresponding to about 14% and 7% of the survey transect of model 1 and 2, respectively.
4.3. Best Practice for Image Acquisition
Results presented here allow the definition of a standard registration procedure using smartphone camera position and orientation data for terrestrial SfM-MVS photogrammetric models. This procedure is aimed at mitigating positioning errors and scene reconstruction artifacts.
It is important to consider that any GNSS systematic positioning error is directly transferred to the model and there is no way of removing it without adding at least one externally referenced ground control point. The advent of the dual-frequency GNSS chipset for user-grade smartphones has undoubtedly represented a breakthrough in high-precision smartphone positioning. Nevertheless, the state of the art [36,37] recognizes that observation sessions lasting at least 20 ÷ 30 min are needed, for a fast-static surveying mode, to achieve centimeter-level accuracy. Such timing, due to the low quality of the carrier phase smartphone observations to fix integer ambiguity resolution and to stabilize the signals, would require image acquisition sessions of tens of hours, which would nullify most of the advantages of SfM-MVS photogrammetry. Indeed, the acquisition speed adopted here (i.e., one photo every 10 s) has degenerated the positioning to meter-level accuracy. Practically, this speed could be slightly reduced to one photo every one or two minutes, but the need of tens to hundreds of photographs to build a high-resolution model, prevents the adoption of an acquisition speed of one photo every 20 min, which is required to optimize positional accuracy. The second point concerns the correct planning of the acquisition area size. In many cases, a wide scene can be reconstructed using a relatively narrow acquisition area. However, the correct scaling (for both FRCP and RCP methods) and orientation (for the FRCP method) require evaluating the ratio between the GNSS positioning error and the acquisition path length, which should be always <7%. As discussed before, systematic errors in the measurements provided by the GNSS sensor and magnetometer do not affect the correct orientation and scaling of the model. Accordingly, a short acquisition time period is to be preferred and, for the same reason, magnetometer re-calibration during the image acquisition procedure is to be avoided. For the sake of consistency of data capture, including the consistency of magnetometer systematic error, use of different smartphone devices for individual photo-surveys is not recommended. In comparison to the classic similarity transform used for the registration of matched pointsets [14], high collinearity of photos is not detrimental to the proposed procedure. The use of convergent photos to mitigate the doming effect should be a standard procedure for image acquisition. However, the user must be aware that oblique photos are likely to be misaligned during the SfM scene reconstruction, as illustrated in Figure 1, and their use for the registration of the model should be avoided. We have shown that accurate orientation (i.e., sum of the three rotation components <2°) and scaling (i.e., scaling error < 3%) can be achieved only using photographs for which the measured and reconstructed orientations differ <2°. A critical problem, potentially having a major impact on photo survey planning is that the procedure of progressive removal of misaligned images can drastically reduce the number of photos. In this situation, the risk of having only a very limited number of photos available for the model registration, not sufficient to average random positioning errors, is very high. In agreement, the user must plan an acquisition campaign in which the number of photographs is up to one order of magnitude larger than that needed to create the model.
4.4. Research Perspectives, Applications and Limits
Removal of the need for ground control points for model registration provides an invaluable improvement to facilitate the SfM-MVS photogrammetric reconstructions of poorly accessible areas. The most striking example of this is the reconstruction of extraterrestrial scenes. Indeed, both position and orientation of images are available for Martian rover cameras [38], making it now virtually possible to produce (extra)terrestrial SfM-MVS photogrammetric DEMs, provided a sufficient overlap between the extraterrestrial images occurs [39]. Additional fields of application include any case in which high accuracy RTK or Differential GNSS antennas cannot be employed, for both logistics and costs, including, for example, the common geological fieldwork, during which the acquisition of a digital outcrop may have not been planned but becomes necessary once in the field. In those cases, the operator has to find the right compromise between acquisition time, scene size, and required accuracy of the model. In fact, the resolution of the model is primarily determined by the ground sampling distance of images, whereas its accuracy depends on the georeferencing procedure. We have seen that using a dual-frequency smartphone, a rapid acquisition (i.e., one photo every 10 s) leads to positioning errors in the order of a few meters. When the acquisition area width is >50 m, such an error poorly affects scaling (the error is in the order of 2%) and orientation (the sum of the three rotation components <2°), whereas errors in the positioning of the model equal the positioning error of the smartphone GNSS. In this scenario, orientation data and dimensional parameters of features seen in the models (e.g., fracture spacing, fault orientation, slope angle of river streams, offset of faulted rives) can be successfully measured. As seen in our work, when the acquisition area becomes <50 m wide, a positioning error of a few meters affects also the orientation of the model. In order to overcome this issue and take full advantage of the dual-frequency GNSS smartphone potentialities, the acquisition speed must be reduced. As previously mentioned, at least 20 ÷ 30 min of stabilization are needed to achieve centimeter-level accuracy [36,37], whereas sessions of <10 min allow to achieve tens of cm-level accuracy [37]. Accordingly, for 10 ÷ 50 m wide acquisition areas, an acquisition speed of one photo every 2 ÷ 3 min should result in a positioning accuracy sufficient to scale and orient the model. A 3-axis gimbal stabilizer may greatly help in this case. In all the cases, a practice to be explored, which could drastically reduce positioning errors, is that of including in the datasets just a few photos (oriented perpendicular to the scene, since oblique photos are generally mispositioned and not useful for registration) for which the GNSS signal has been recorded for 10 ÷ 20 min. Acquisition areas <5 m wide become challenging when trying to use the GNSS positioning system of smartphones. In those cases, the XY position of images cannot be used to mitigate the measurement error of the magnetometer. The orientation of the scene can be achieved only by integrating image orientation data and orientation of previously measured features seen in the scene [21]. Similarly, scaling requires including in the scene an object of known dimension, whereas a long-lasting GNSS signal recording can lead to cm-level positioning accuracy.
5. Conclusions
We have proposed a method for terrestrial structure from motion–multiview stereo (SfM-MVS) photogrammetry which employs smartphone sensors and removes the need for ground control points for model registration. Indeed, position and orientation of photos cannot be directly used to georeference the model. Instead, a recursive procedure of model registration and image deletion must be carried out, until images, whose position in the virtual scene has been incorrectly reconstructed in the SfM process are removed. The remaining photos then can be used to produce a satisfactory georeferentiation of the model, provided the ratio between the GNSS positioning error and the width of the acquisition area is 7% or less. The main advantage of this method with respect to previous ones is the extreme ease of use and portability of tools involved in the registration of 3D models.
Author Contributions
Conceptualization, S.T., T.P., U.R., and T.S.; methodology, S.T., A.C., and A.P.; software and formal analysis, S.T., M.M., A.P., and L.S.; writing-original draft preparation, S.T., A.B., and A.C.; writing-review and editing, A.B., P.T., and T.S.; project administration, S.T.; All authors have read and agreed to the published version of the manuscript.
Funding
This research received no external funding.
Conflicts of Interest
The authors declare no conflict of interest.
References
- Remondino, F.; El-Hakim, S. Image-based 3D modelling: A review. Photogramm. Rec. 2006, 21, 269–291. [Google Scholar] [CrossRef]
- Agarwal, S.; Snavely, N.; Simon, I.; Seitz, S.; Szelinski, R. Building Rome in a Day. In Proceedings of the IEEE 12th International Conference on Computer Vision (ICCV 2009), Kyoto, Japan, 27 September–4 October 2009. [Google Scholar] [CrossRef]
- James, M.R.; Robson, S. Straightforward reconstruction of 3D surfaces and topography with a camera: Accuracy and geoscience application. J. Geophys. Res. Earth Surf. 2012, 117, F03017. [Google Scholar] [CrossRef]
- Westoby, M.J.; Brasington, J.; Glasser, N.F.; Hambrey, M.J.; Reynolds, J.M. ‘Structure-from-Motion’ photogrammetry: A low-cost, effective tool for geoscience applications. Geomorphology 2012, 179, 300–314. [Google Scholar] [CrossRef]
- Verhoeven, G. Taking computer vision aloft—Archaeological three-dimensional reconstructions from aerial photographs with Photoscan. Archaeol. Prospect. 2011, 18, 67–73. [Google Scholar] [CrossRef]
- Favalli, M.; Fornaciai, A.; Isola, I.; Tarquini, S.; Nannipieri, L. Multiview 3D reconstruction in geosciences. Comput. Geosci. 2012, 44, 168–176. [Google Scholar] [CrossRef]
- Bemis, S.P.; Micklewaite, S.; Turner, D.; James, M.R.; Akciz, S.; Thiele, S.T.; Bangash, H.A. Ground-based and UAV-based photogrammetry: A multi-scale, high-resolution mapping tool for structural geology and paleoseismology. J. Struct. Geol. 2014, 69, 163–178. [Google Scholar] [CrossRef]
- Javernick, L.; Brasington, J.; Caruso, B. Modeling the topography of shallow braided rivers using Structure-from-Motion photogrammetry. Geomorphology 2014, 213, 166–182. [Google Scholar] [CrossRef]
- Carrivick, J.L.; Smith, M.W.; Quincey, D.J. Structure from Motion in the Geosciences; Wiley-Blackwell: Oxford, UK, 2016; p. 208. [Google Scholar]
- Bisdom, K.; Nick, H.M.; Bertotti, G. An integrated workflow for stress and flow modelling using outcrop-derived discrete fracture networks. Comput. Geosci. 2017, 103, 21–35. [Google Scholar] [CrossRef]
- Pitts, A.D.; Casciano, C.I.; Patacci, M.; Longhitano, S.G.; Di Celma, C.; McCaffrey, W.D. Integrating traditional field methods with emerging digital techniques for enhanced outcrop analysis of deep water channel-fill deposits. Mar. Pet. Geol. 2017, 87, 2–13. [Google Scholar] [CrossRef][Green Version]
- Hansman, R.J.; Ring, U. Workflow: From photo-based 3-D reconstruction of remotely piloted aircraft images to a 3-D geological model. Geosphere 2019, 15, 1393–1408. [Google Scholar] [CrossRef]
- Dering, G.M.; Micklethwaite, S.; Thiele, S.T.; Vollgger, S.A.; Cruden, A.R. Review of drones, photogrammetry and emerging sensor technology for the study of dykes: Best practises and future potential. J. Volcanol. Geotherm. Res. 2017, 373, 148–166. [Google Scholar] [CrossRef]
- Horn, B.K. Closed-form solution of absolute orientation using unit quaternions. J. Opt. Soc. Am. A 1987, 4, 629–642. [Google Scholar] [CrossRef]
- Jaud, M.; Bertin, S.; Beauverger, M.; Augereau, E.; Delacourt, C. RTK GNSS-Assisted Terrestrial SfM Photogrammetry without GCP: Application to Coastal Morphodynamics Monitoring. Remote Sens. 2020, 12, 1889. [Google Scholar] [CrossRef]
- Tavani, S.; Granado, P.; Riccardi, U.; Seers, T.; Corradetti, A. Terrestrial SfM-MVS photogrammetry from smartphone sensors. Geomorphology 2020, 367, 107318. [Google Scholar] [CrossRef]
- Colomina, I.; Molina, P. Unmanned aerial systems for photogrammetry and remote sensing: A review. ISPRS J. Photogramm. Remote Sens. 2014, 92, 79–97. [Google Scholar] [CrossRef]
- James, M.R.; Robson, S.; d’Oleire-Oltmanns, S.; Niethammer, U. Optimising UAV topographic surveys processed with structure-from-motion: Ground control quality, quantity and bundle adjustment. Geomorphology 2017, 280, 51–66. [Google Scholar] [CrossRef]
- Brush, J.A.; Pavlis, T.L.; Hurtado, J.M.; Mason, K.A.; Knott, J.R.; Williams, K.E. Evaluation of field methods for 3-D mapping and 3-D visualization of complex metamorphic structure using multiview stereo terrain models from ground-based photography. Geosphere 2019, 15, 188–221. [Google Scholar] [CrossRef]
- Oniga, V.-E.; Breaban, A.-I.; Pfeifer, N.; Chirila, C. Determining the Suitable Number of Ground Control Points for UAS Images Georeferencing by Varying Number and Spatial Distribution. Remote Sens. 2020, 12, 876. [Google Scholar] [CrossRef]
- Fleming, Z.D.; Pavlis, T.L. An orientation based correction method for SfM-MVS point clouds. Implications for field geology. J. Struct. Geol. 2018, 113, 76–89. [Google Scholar] [CrossRef]
- Turner, D.; Lucieer, A.; Wallace, L. Direct georeferencing of ultrahigh-resolution UAV imagery. IEEE Trans. Geosci. Remote Sens. 2014, 52, 2738–2745. [Google Scholar] [CrossRef]
- Forlani, G.; Dall’Asta, E.; Diotri, F.; di Cella, U.M.; Roncella, R.; Santise, M. Quality Assessment of DSMs Produced from UAV Flights Georeferenced with On-Board RTK Positioning. Remote Sens. 2018, 10, 311. [Google Scholar] [CrossRef]
- Štroner, M.; Urban, R.; Reindl, T.; Seidl, J.; Brouček, J. Evaluation of the Georeferencing Accuracy of a Photogrammetric Model Using a Quadrocopter with Onboard GNSS RTK. Sensors 2020, 20, 2318. [Google Scholar] [CrossRef]
- Tavani, S.; Corradetti, A.; Granado, P.; Snidero, M.; Seers, T.D.; Mazzoli, S. Smartphone: An alternative to ground control points for orienting virtual outcrop models and assessing their quality. Geosphere 2019, 15, 2043–2052. [Google Scholar] [CrossRef]
- James, M.R.; Robson, S. Mitigating systematic error in topographic models derived from UAV and ground-based image networks. Earth Surf. Process. Landf. 2014, 39, 1413–1420. [Google Scholar] [CrossRef]
- Magri, L.; Toldo, R. Bending the doming effect in structure from motion reconstructions through bundle adjustment. Int. Arch. Photogramm. 2017, XLII-2/W6, 235–241. [Google Scholar] [CrossRef]
- Wackrow, R.; Chandler, J.H. A convergent image configuration for DEM extraction that minimises the systematic effects caused by an inaccurate lens model. Photogramm. Rec. 2008, 23, 6–18. [Google Scholar] [CrossRef]
- Luhmann, T.; Robson, S.; Kyle, S.; Boehm, J. Close-Range Photogrammetry and 3d Imaging, 2nd ed.; Walter de Gruyter: Berlin, Germany, 2014. [Google Scholar]
- Griffiths, D.; Burningham, H. Comparison of pre- and self-calibrated camera calibration models for UAS-derived nadir imagery for a SfM application. Prog. Phys. Geogr. Earth Environ. 2019, 43, 215–235. [Google Scholar] [CrossRef]
- Smeraglia, L.; Aldega, L.; Billi, A.; Carminati, E.; Doglioni, C. Phyllosilicate injection along extensional carbonate-hosted faults and implications for co-seismic slip propagation: Case studies from the central Apennines, Italy. J. Struct. Geol. 2016, 93, 29–50. [Google Scholar] [CrossRef]
- Teunissen, P.J.G.; Montenbruck, O. Springer Handbook of Global Navigation Satellite Systems; Springer International Publishing: Cham, Switzerland, 2017. [Google Scholar] [CrossRef]
- Tavani, S.; Arbués, P.; Snidero, M.; Carrera García de Cortázar, N.; Muñoz, J.A. Open Plot Project: An open-source toolkit for 3-D structural data analysis. Solid Earth 2011, 2, 53–63. [Google Scholar] [CrossRef]
- Allmendinger, R.W.; Siron, C.R.; Scott, C.P. Structural data collection with mobile devices: Accuracy, redundancy, and best practices. J. Struct. Geol. 2017, 102, 98–112. [Google Scholar] [CrossRef]
- Novakova, L.; Pavlis, T.L. Assessment of the precision of smartphones and tablets for measurement of planar orientations: A case study. J. Struct. Geol. 2017, 97, 93–103. [Google Scholar] [CrossRef]
- Dabove, P.; Di Pietra, V.; Piras, M. GNSS Positioning Using Mobile Devices with the Android Operating System. ISPRS Int. J. Geo-Inf. 2020, 9, 220. [Google Scholar] [CrossRef]
- Uradziński, M.; Bakuła, M. Assessment of Static Positioning Accuracy Using Low-Cost Smartphone GPS Devices for Geodetic Survey Points’ Determination and Monitoring. Appl. Sci. 2020, 10, 5308. [Google Scholar] [CrossRef]
- Bell, J.F., III; Godber, A.; McNair, S.; Caplinger, M.A.; Maki, J.N.; Lemmon, M.T.; Van Beek, J.; Malin, M.C.; Wellington, D.; Kinch, K.; et al. The Mars Science Laboratory Curiosity rover Mastcam instruments: Preflight and in-flight calibration, validation, and data archiving. Earth Space Sci. 2017, 4, 396–452. [Google Scholar] [CrossRef]
- Caravaca, G.; Le Mouélic, S.; Mangold, N.; L’Haridon, J.; Le Deit, L.; Massé, M. 3D digital outcrop model reconstruction of the Kimberley outcrop (Gale crater, Mars) and its integration into virtual reality for simulated geological analysis. Planet. Space Sci. 2019, 182, 104808. [Google Scholar] [CrossRef]
Publisher’s Note: MDPI stays neutral with regard to jurisdictional claims in published maps and institutional affiliations. |
© 2020 by the authors. Licensee MDPI, Basel, Switzerland. This article is an open access article distributed under the terms and conditions of the Creative Commons Attribution (CC BY) license (http://creativecommons.org/licenses/by/4.0/).

