Flood Hazard and Risk Assessment of Extreme Weather Events Using Synthetic Aperture Radar and Auxiliary Data: A Case Study

 ,
,
Abstract

1. Introduction
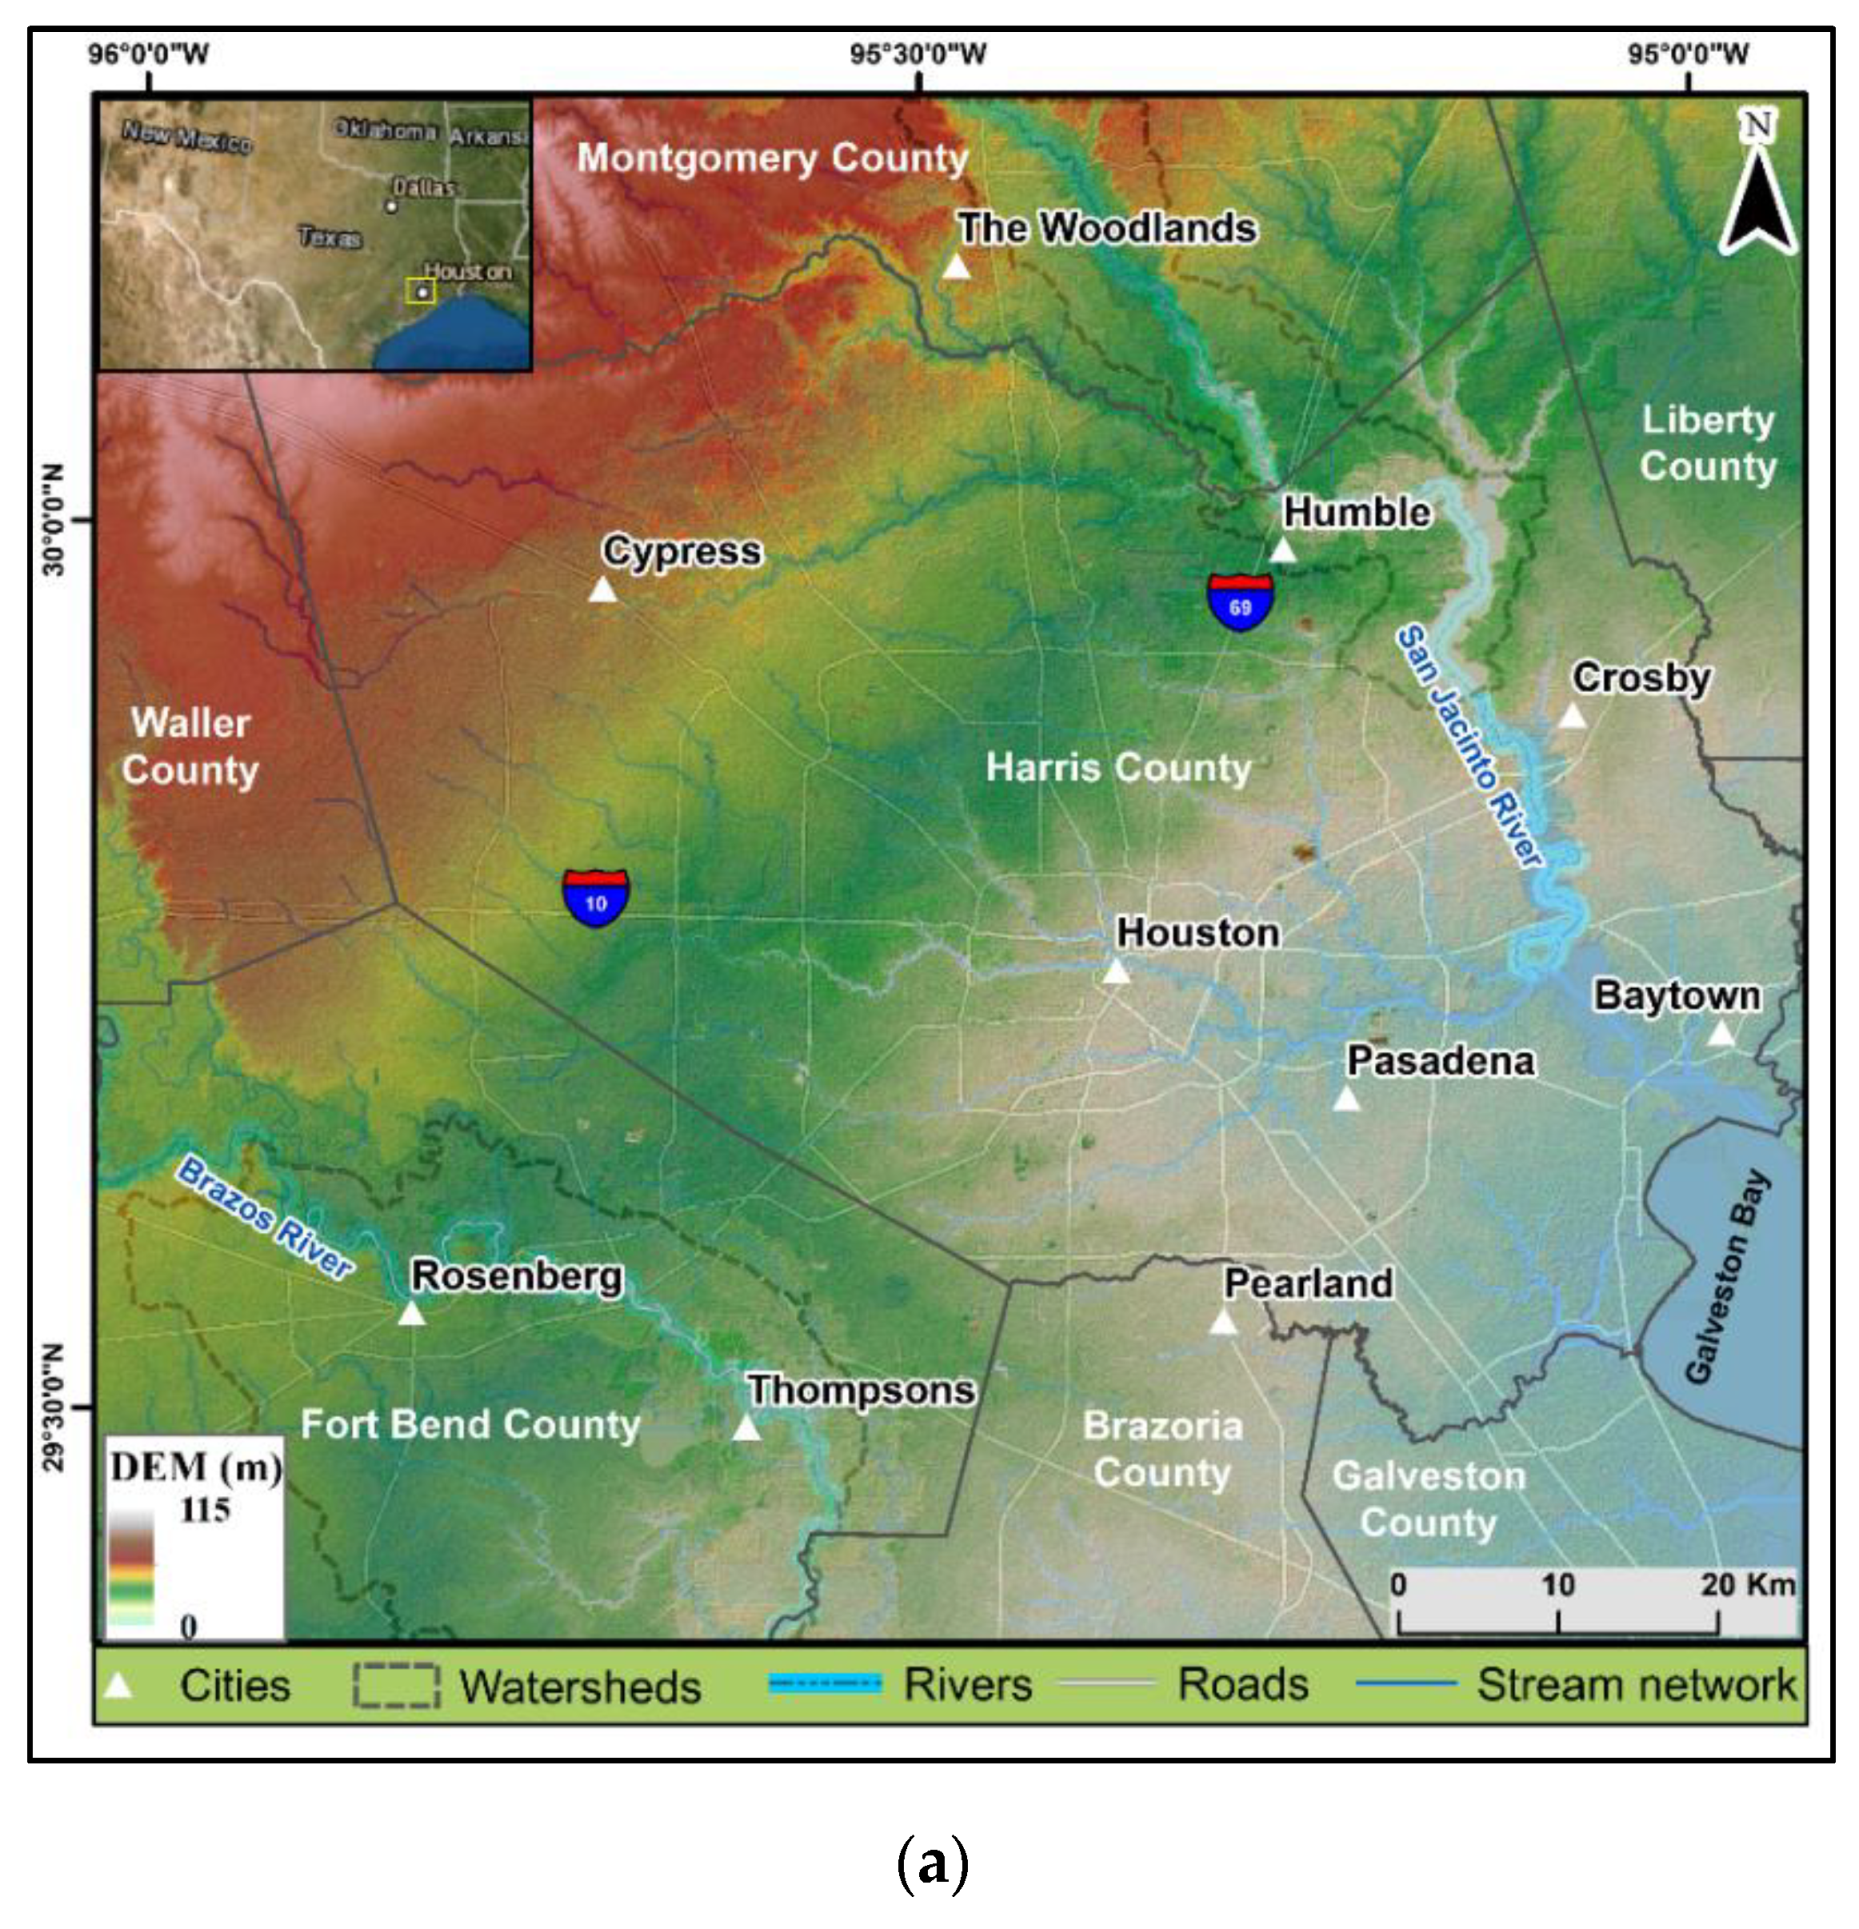
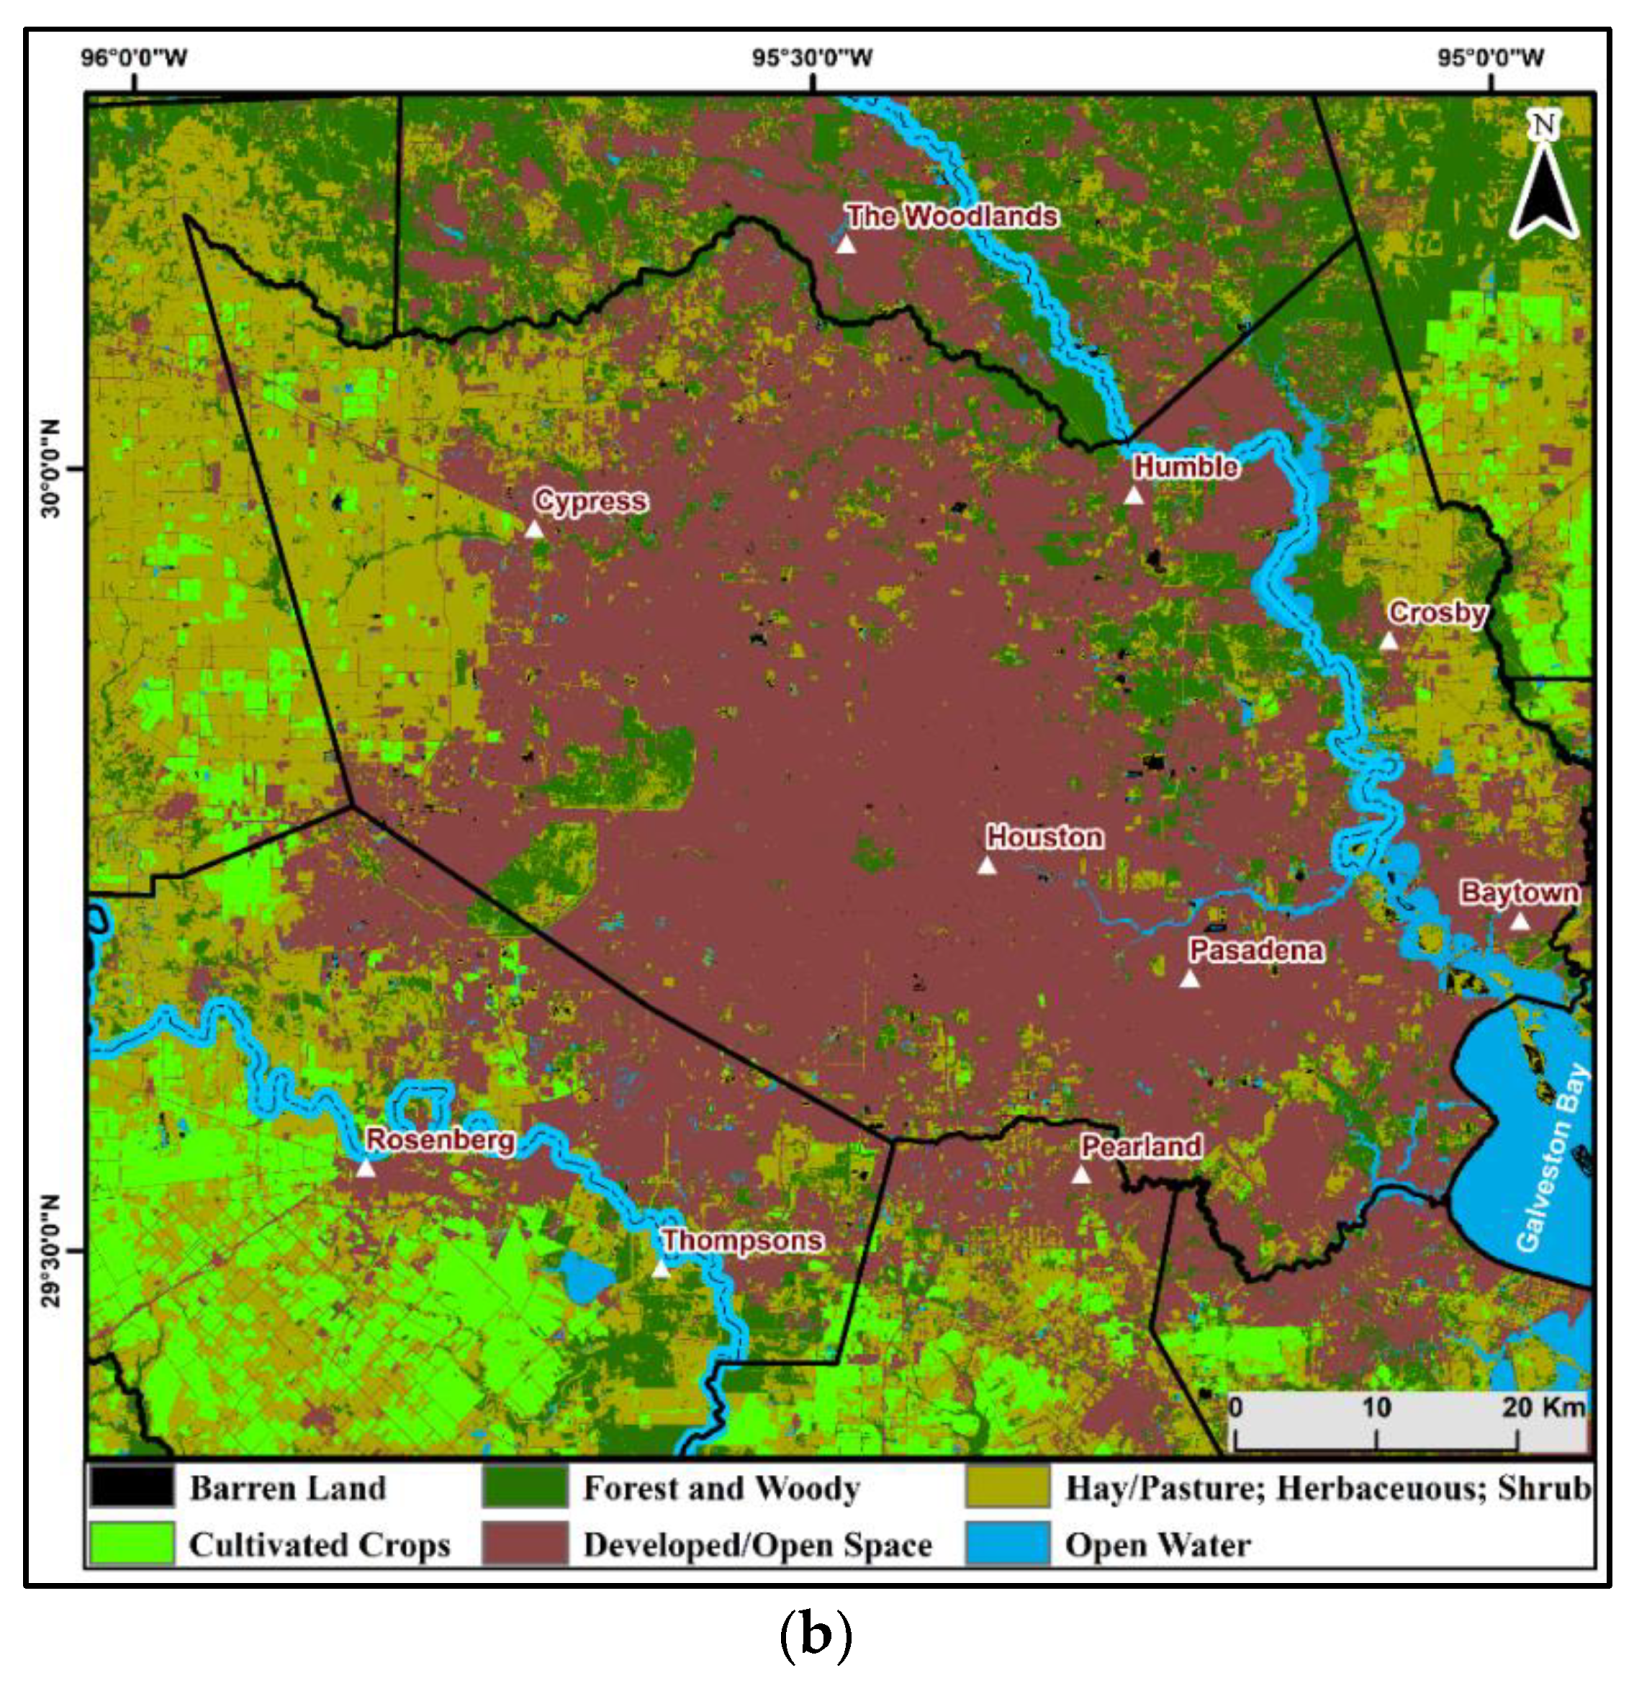
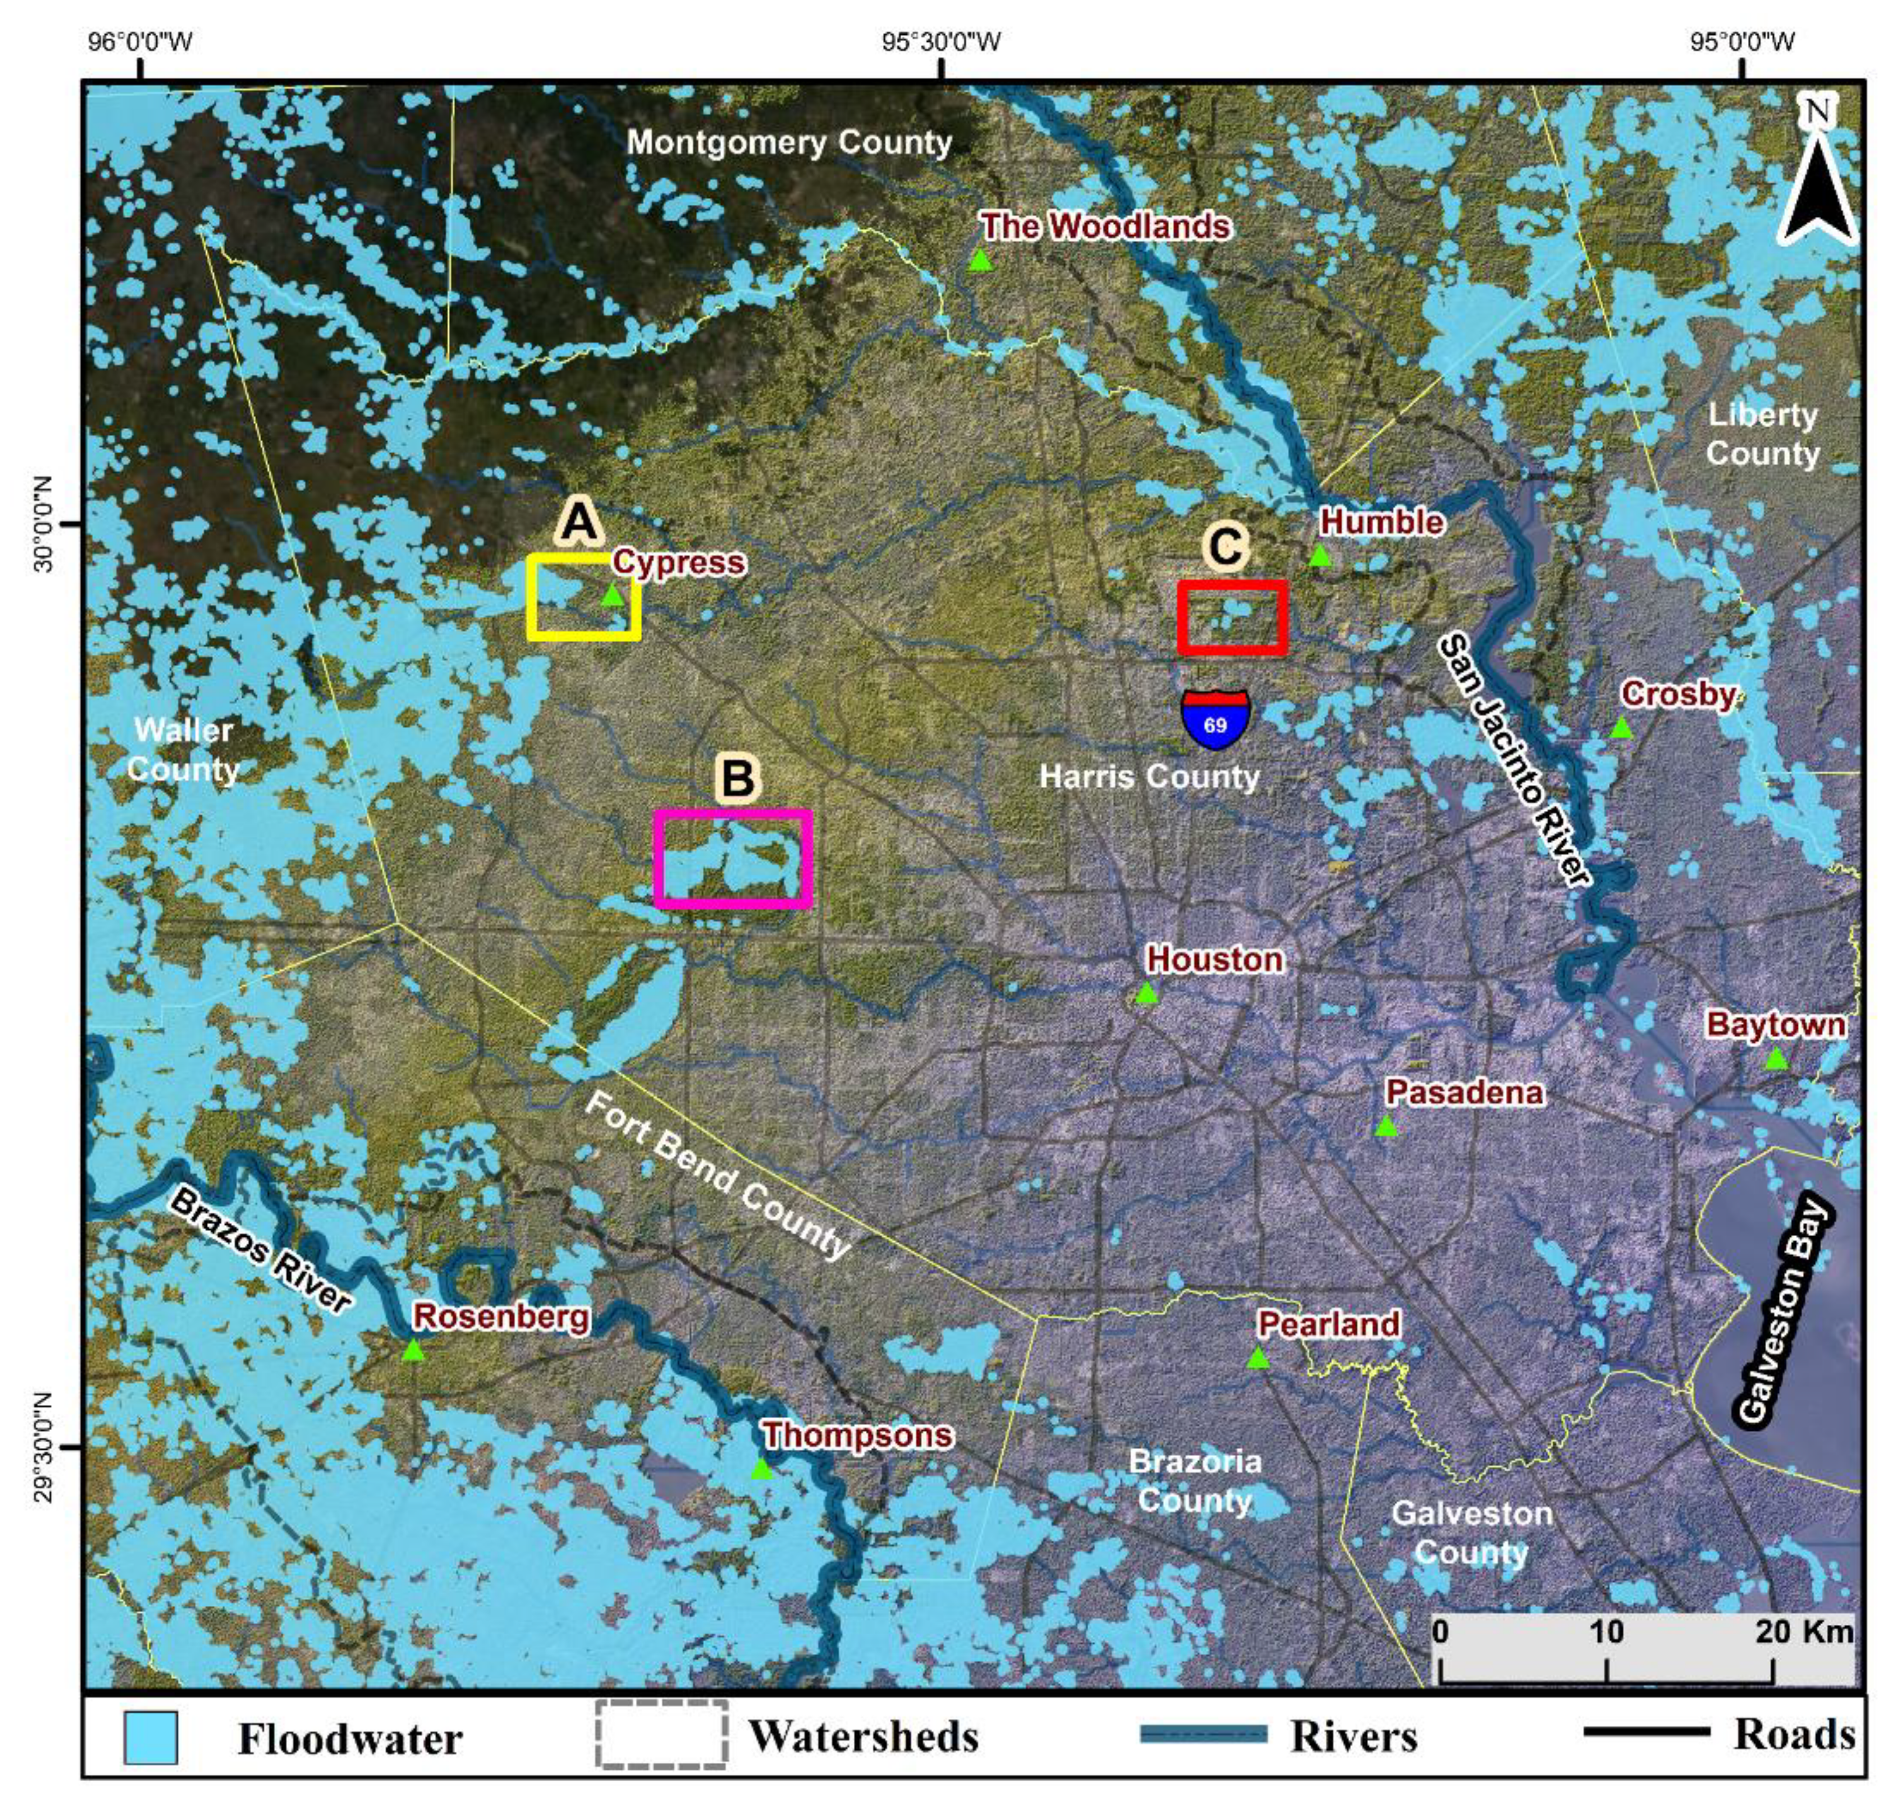
1.1. Study Area
1.2. Floodwater Delineation Approaches and Possible Limitations


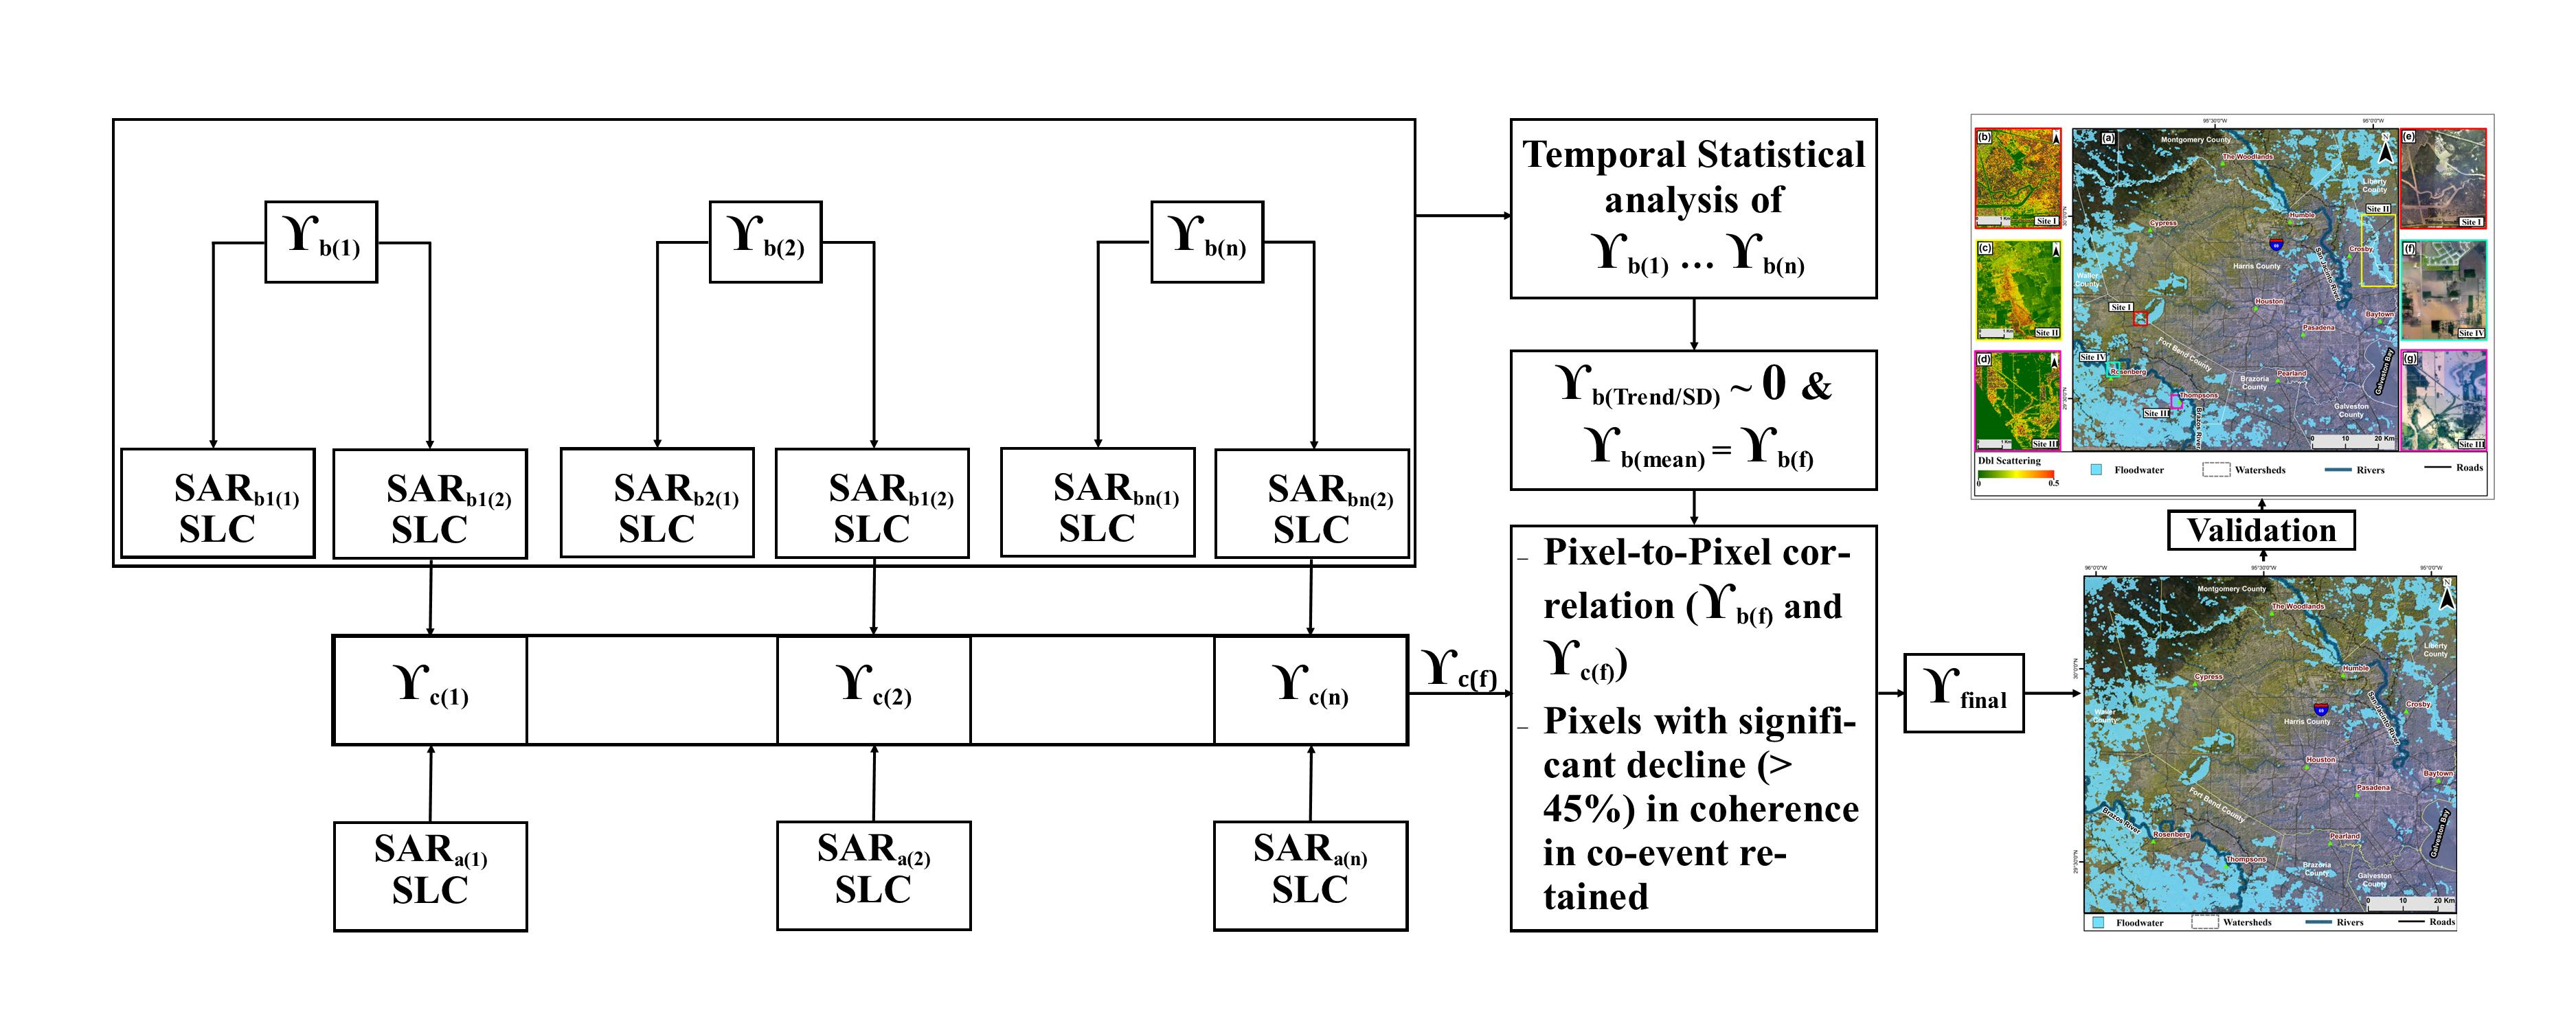
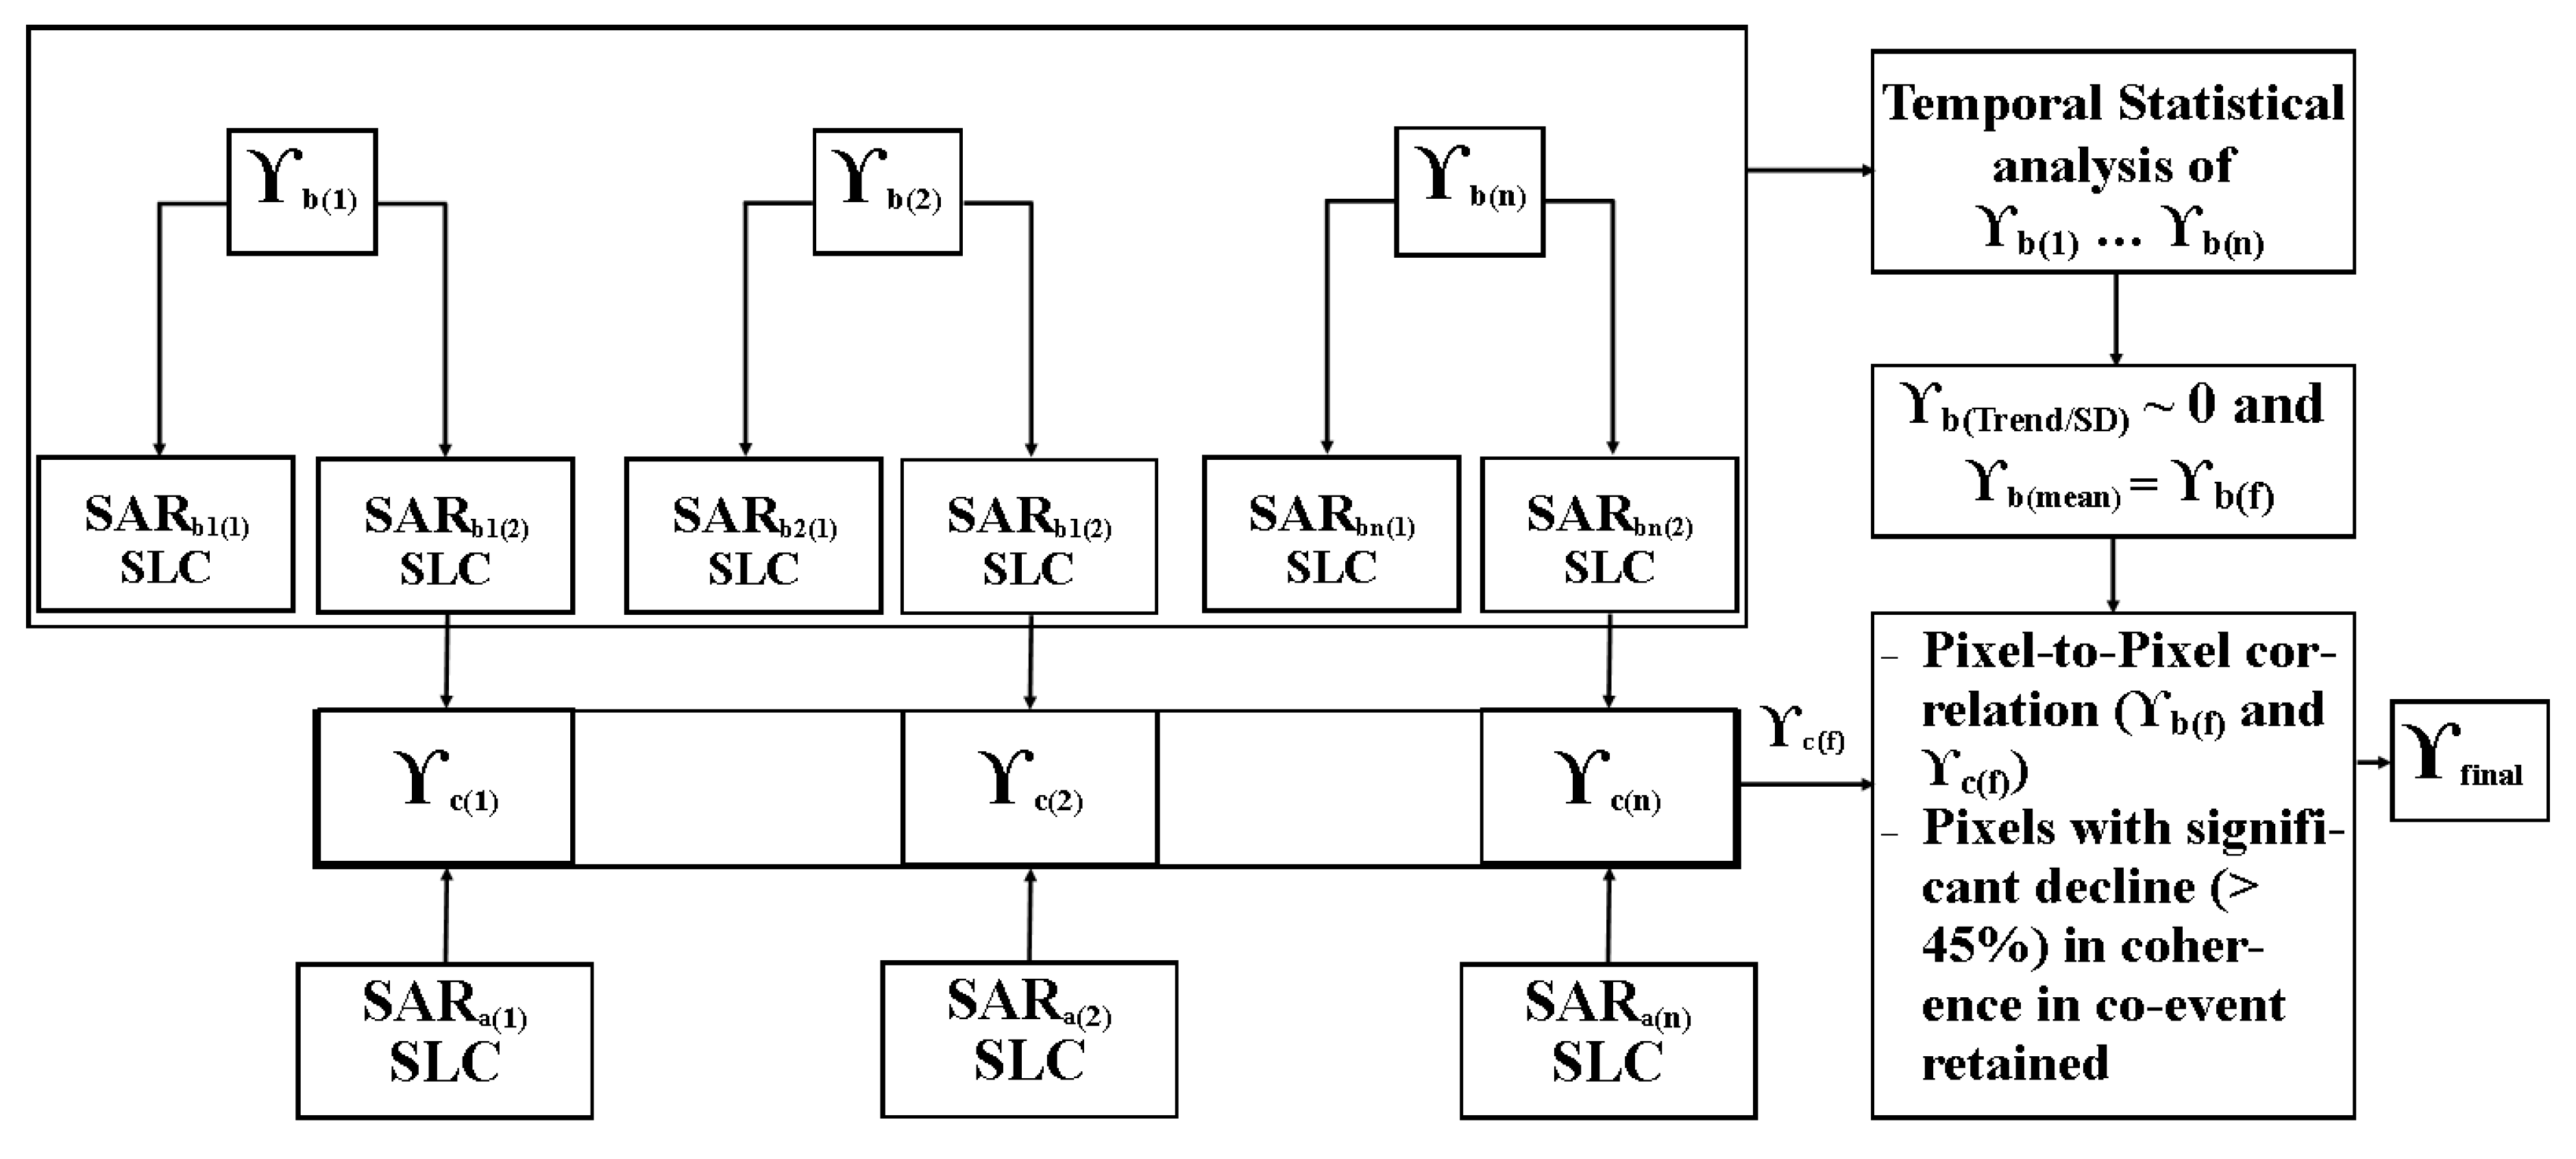
2. Materials and Methods
3. Results
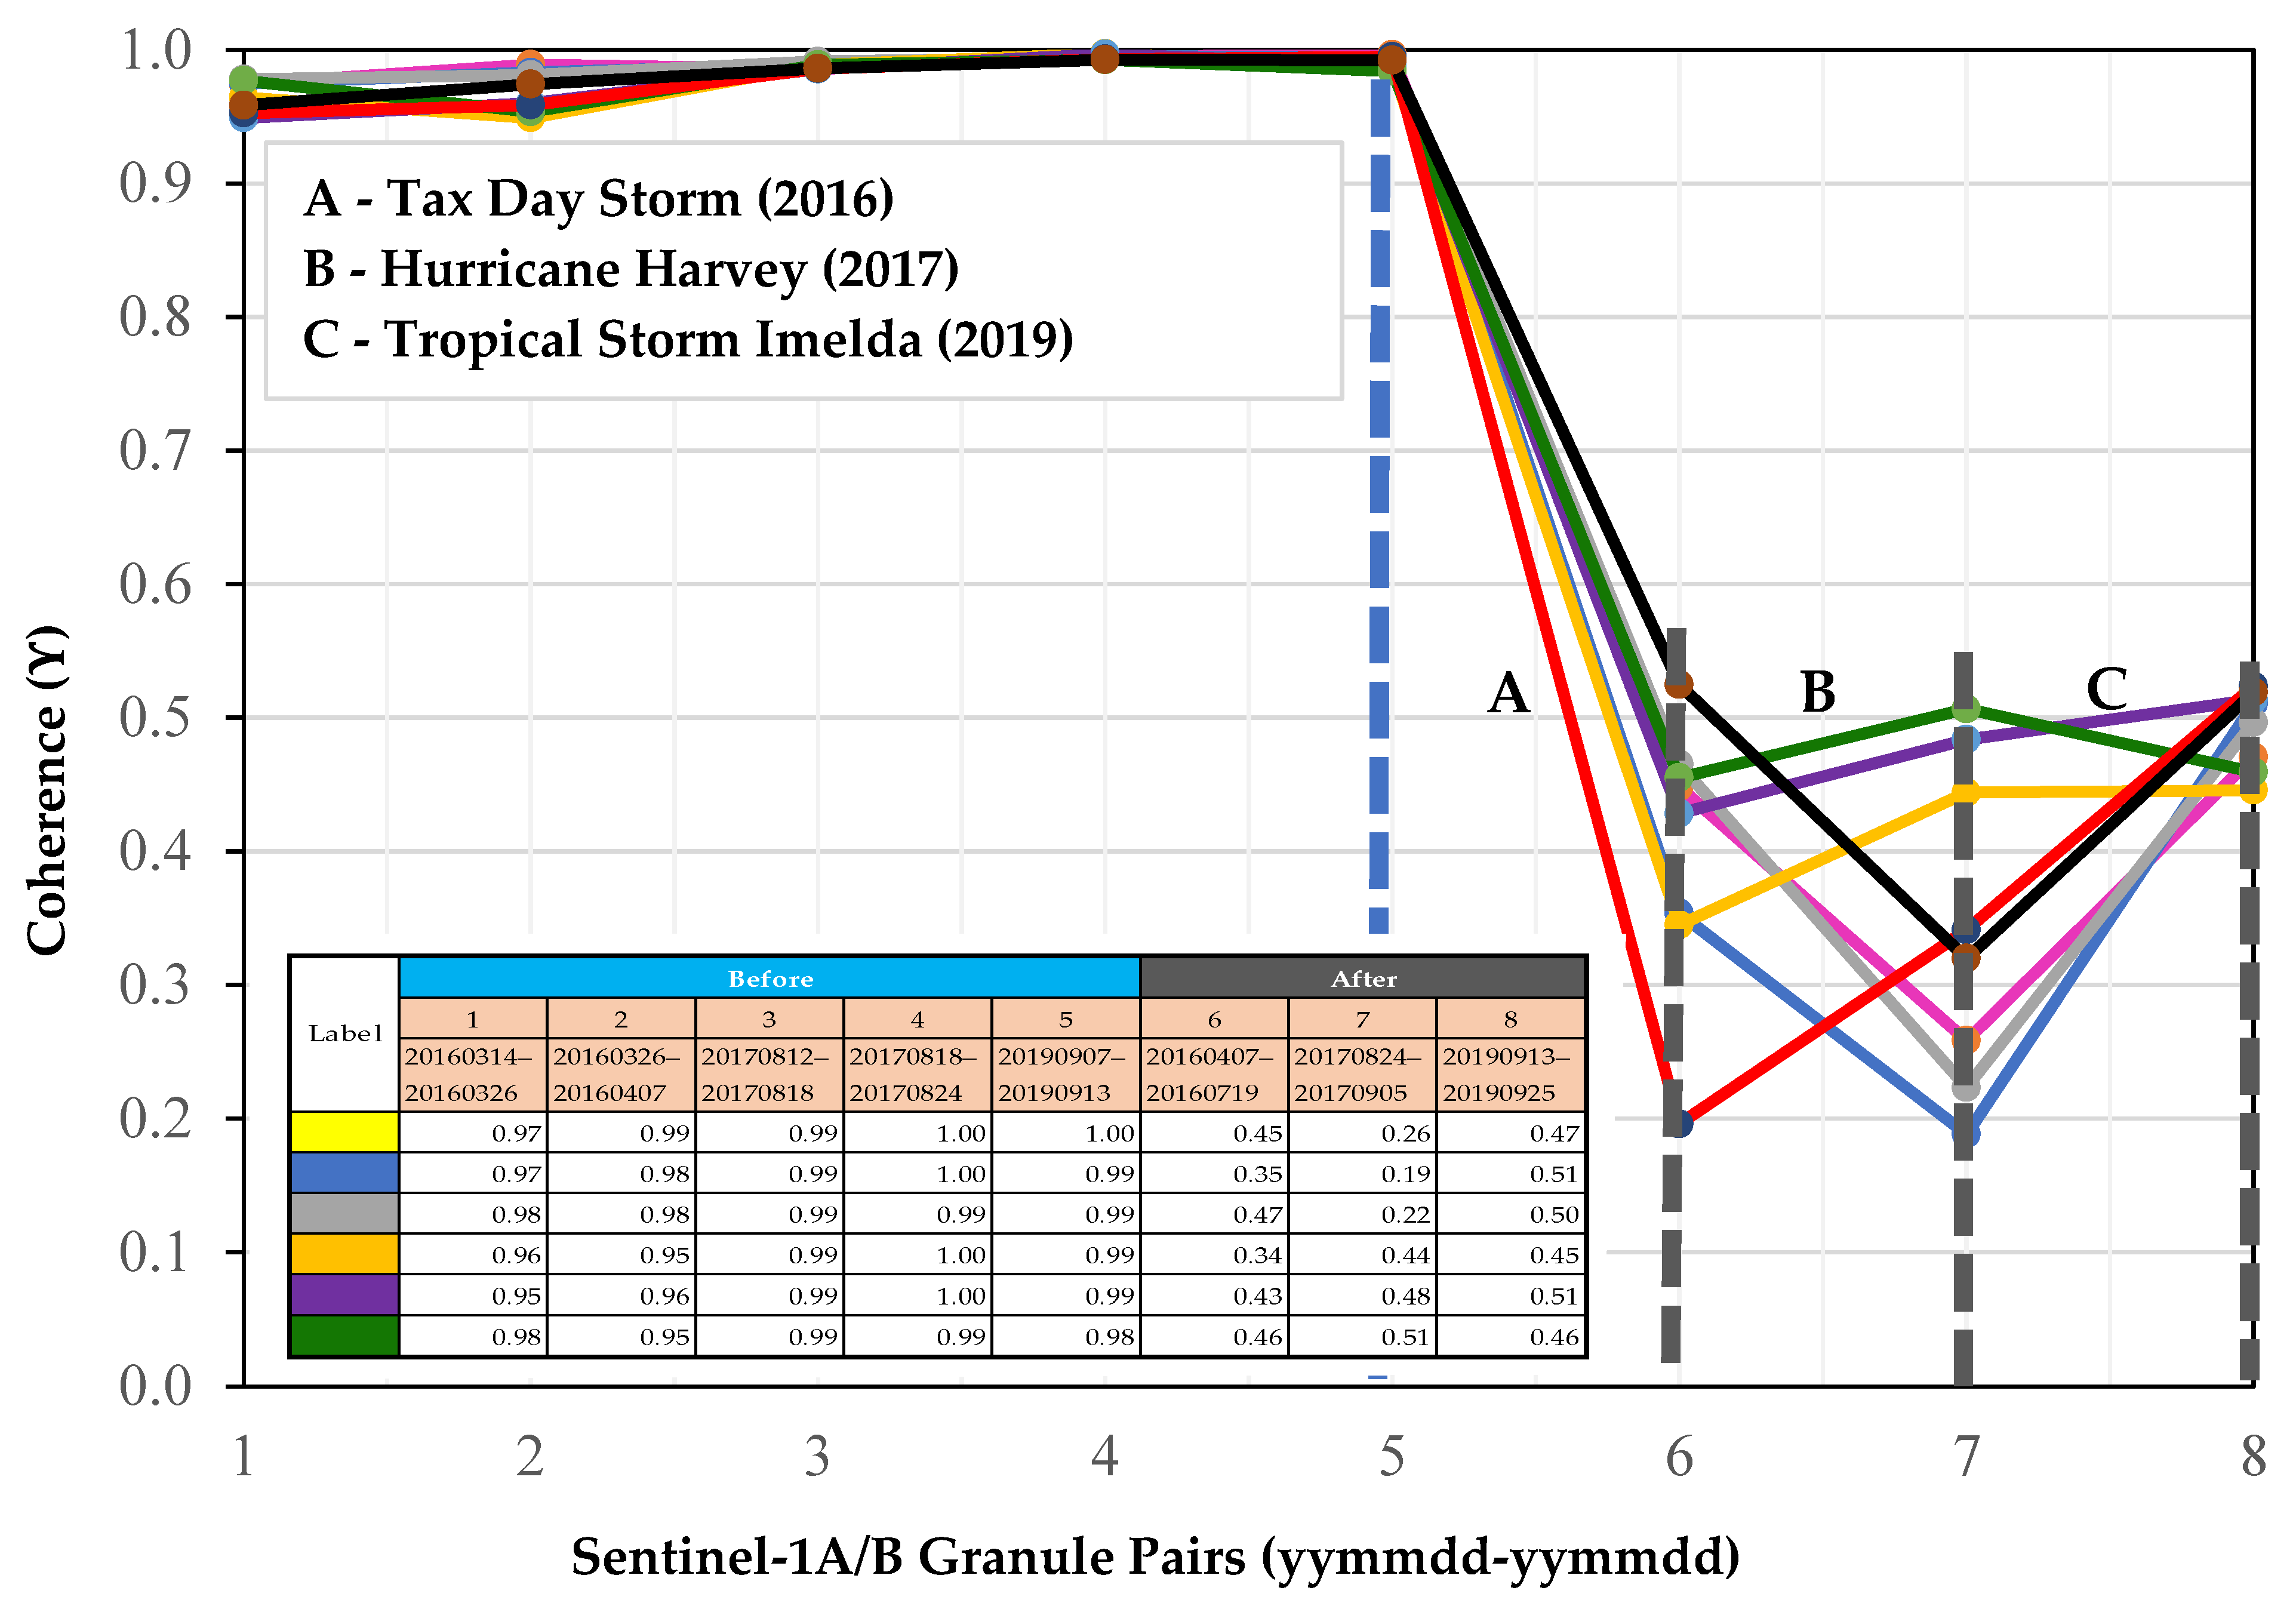
3.1. Sentinel-1 SAR-based Flood Mapping
3.1.1. The Tax Day Storm and Hurricane Harvey Flood Events
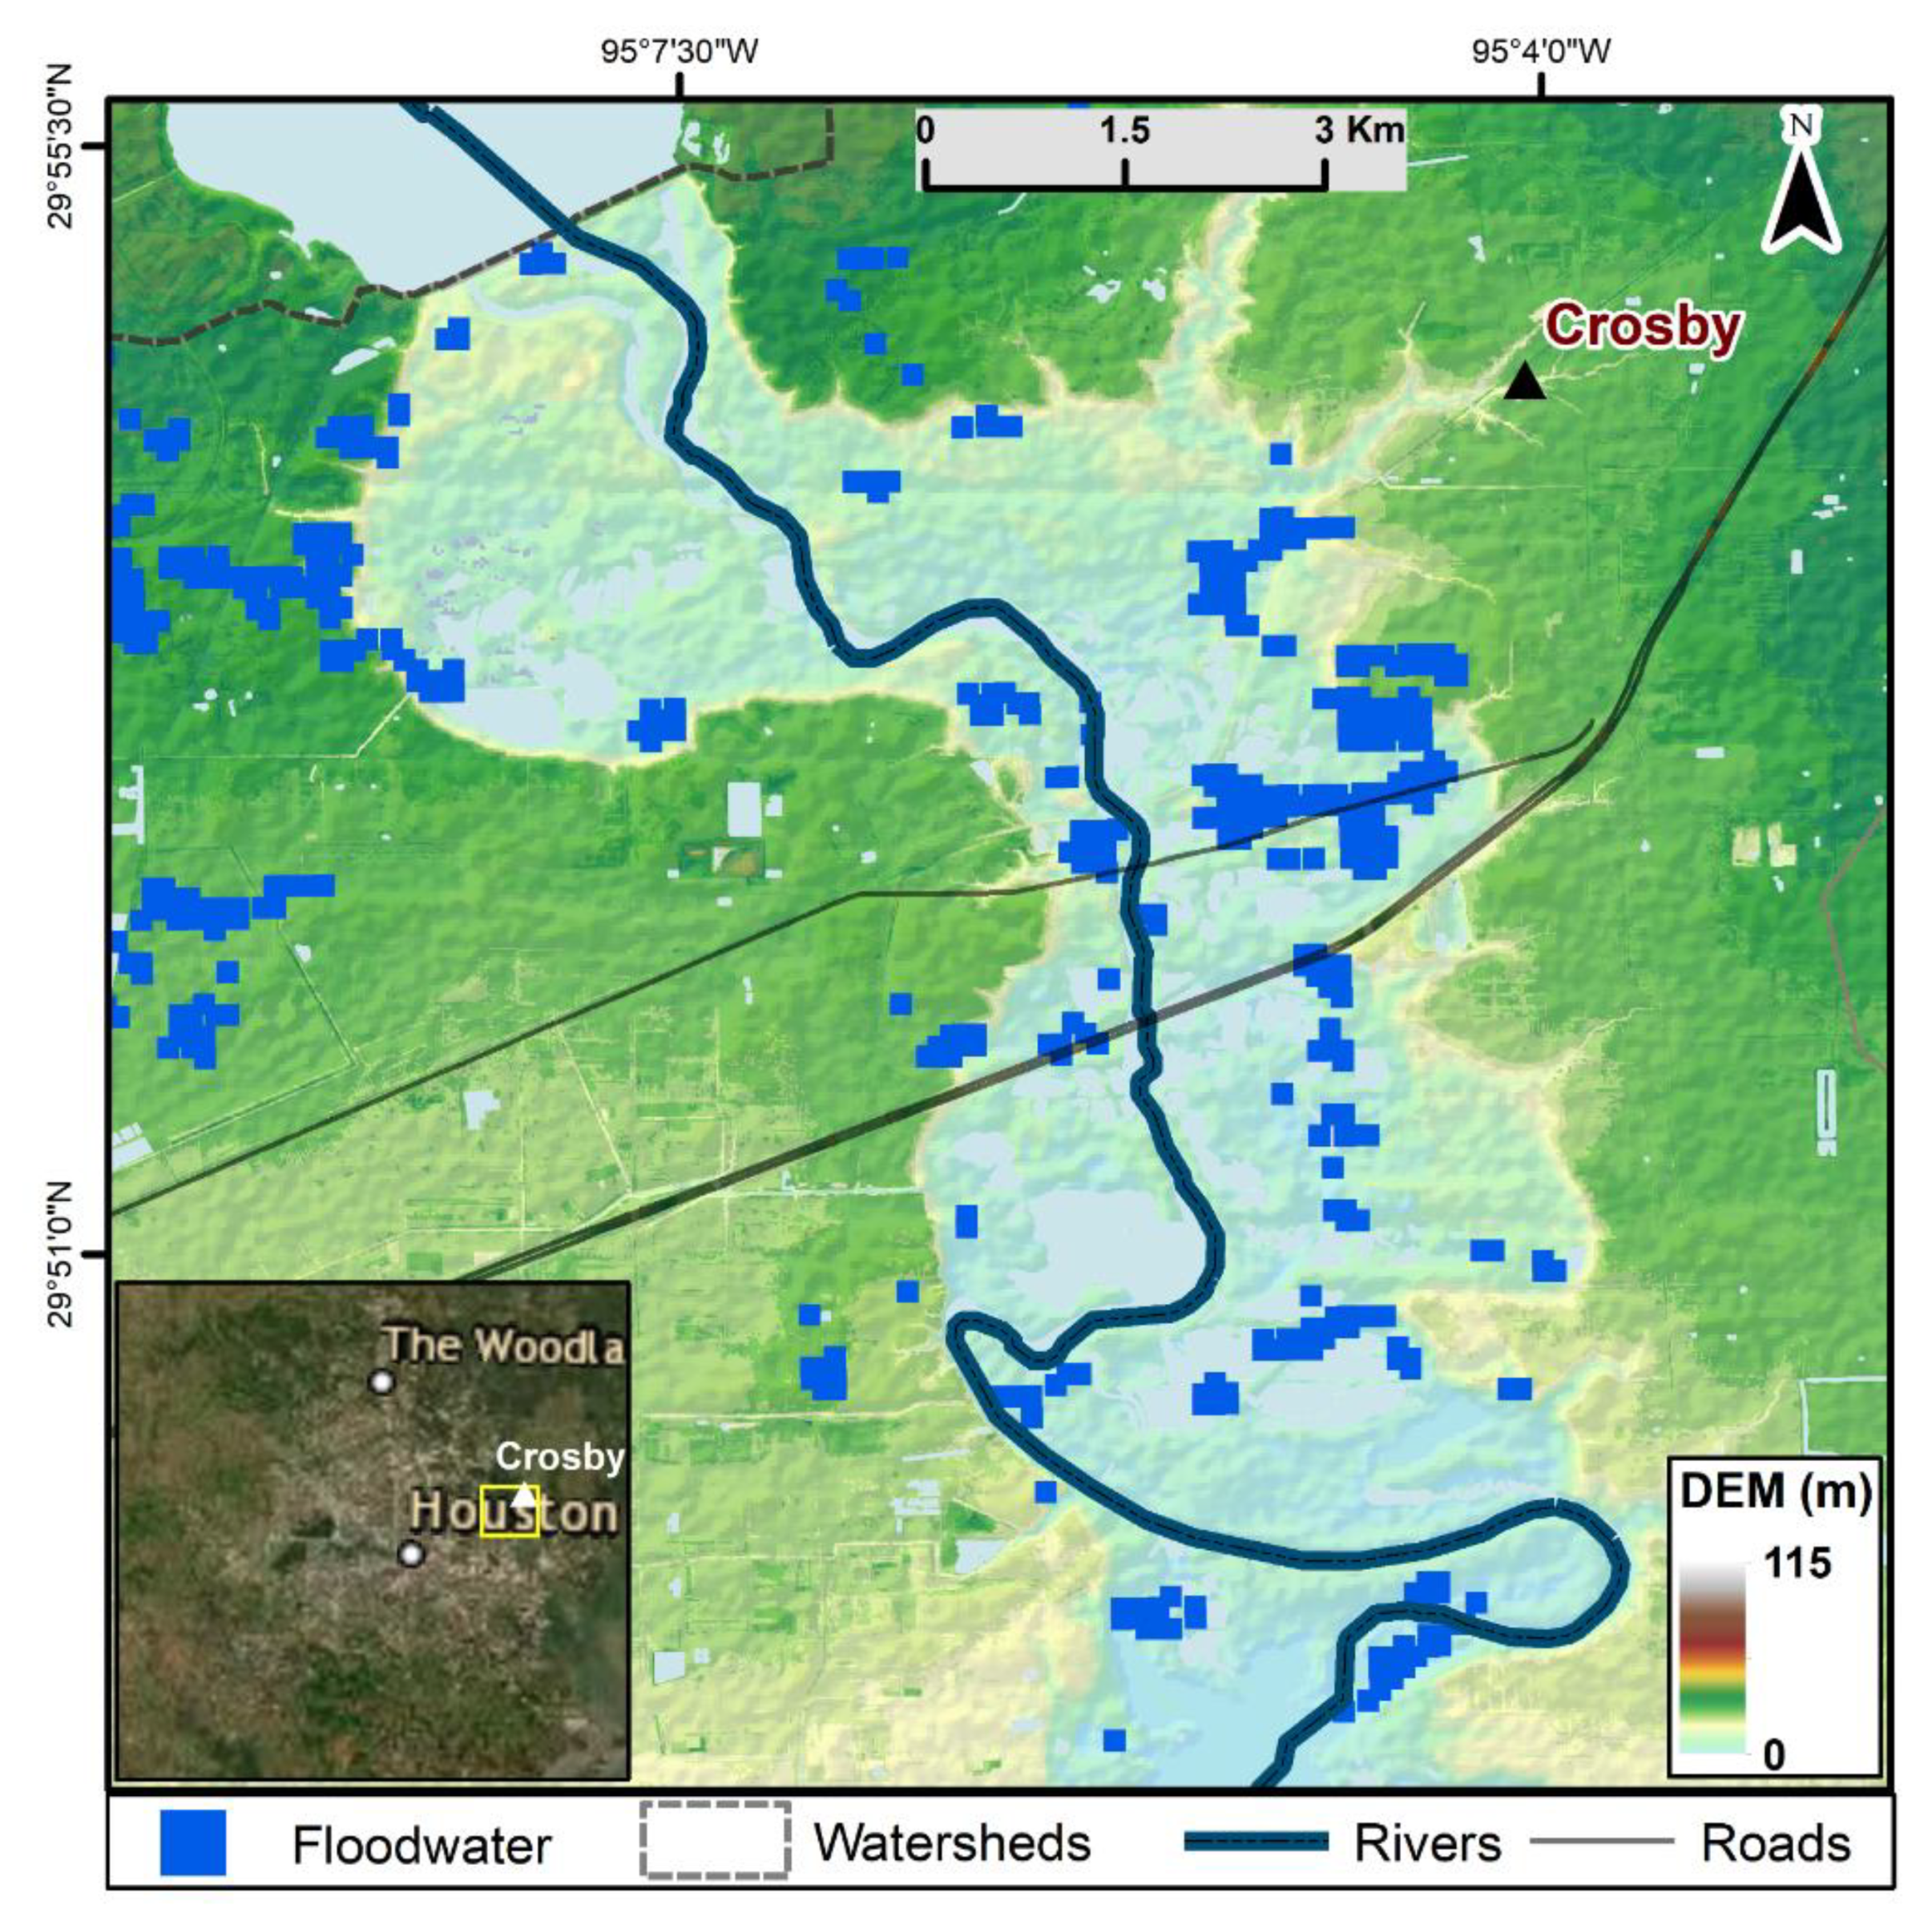
3.1.2. Tropical Storm Imelda Flood Event
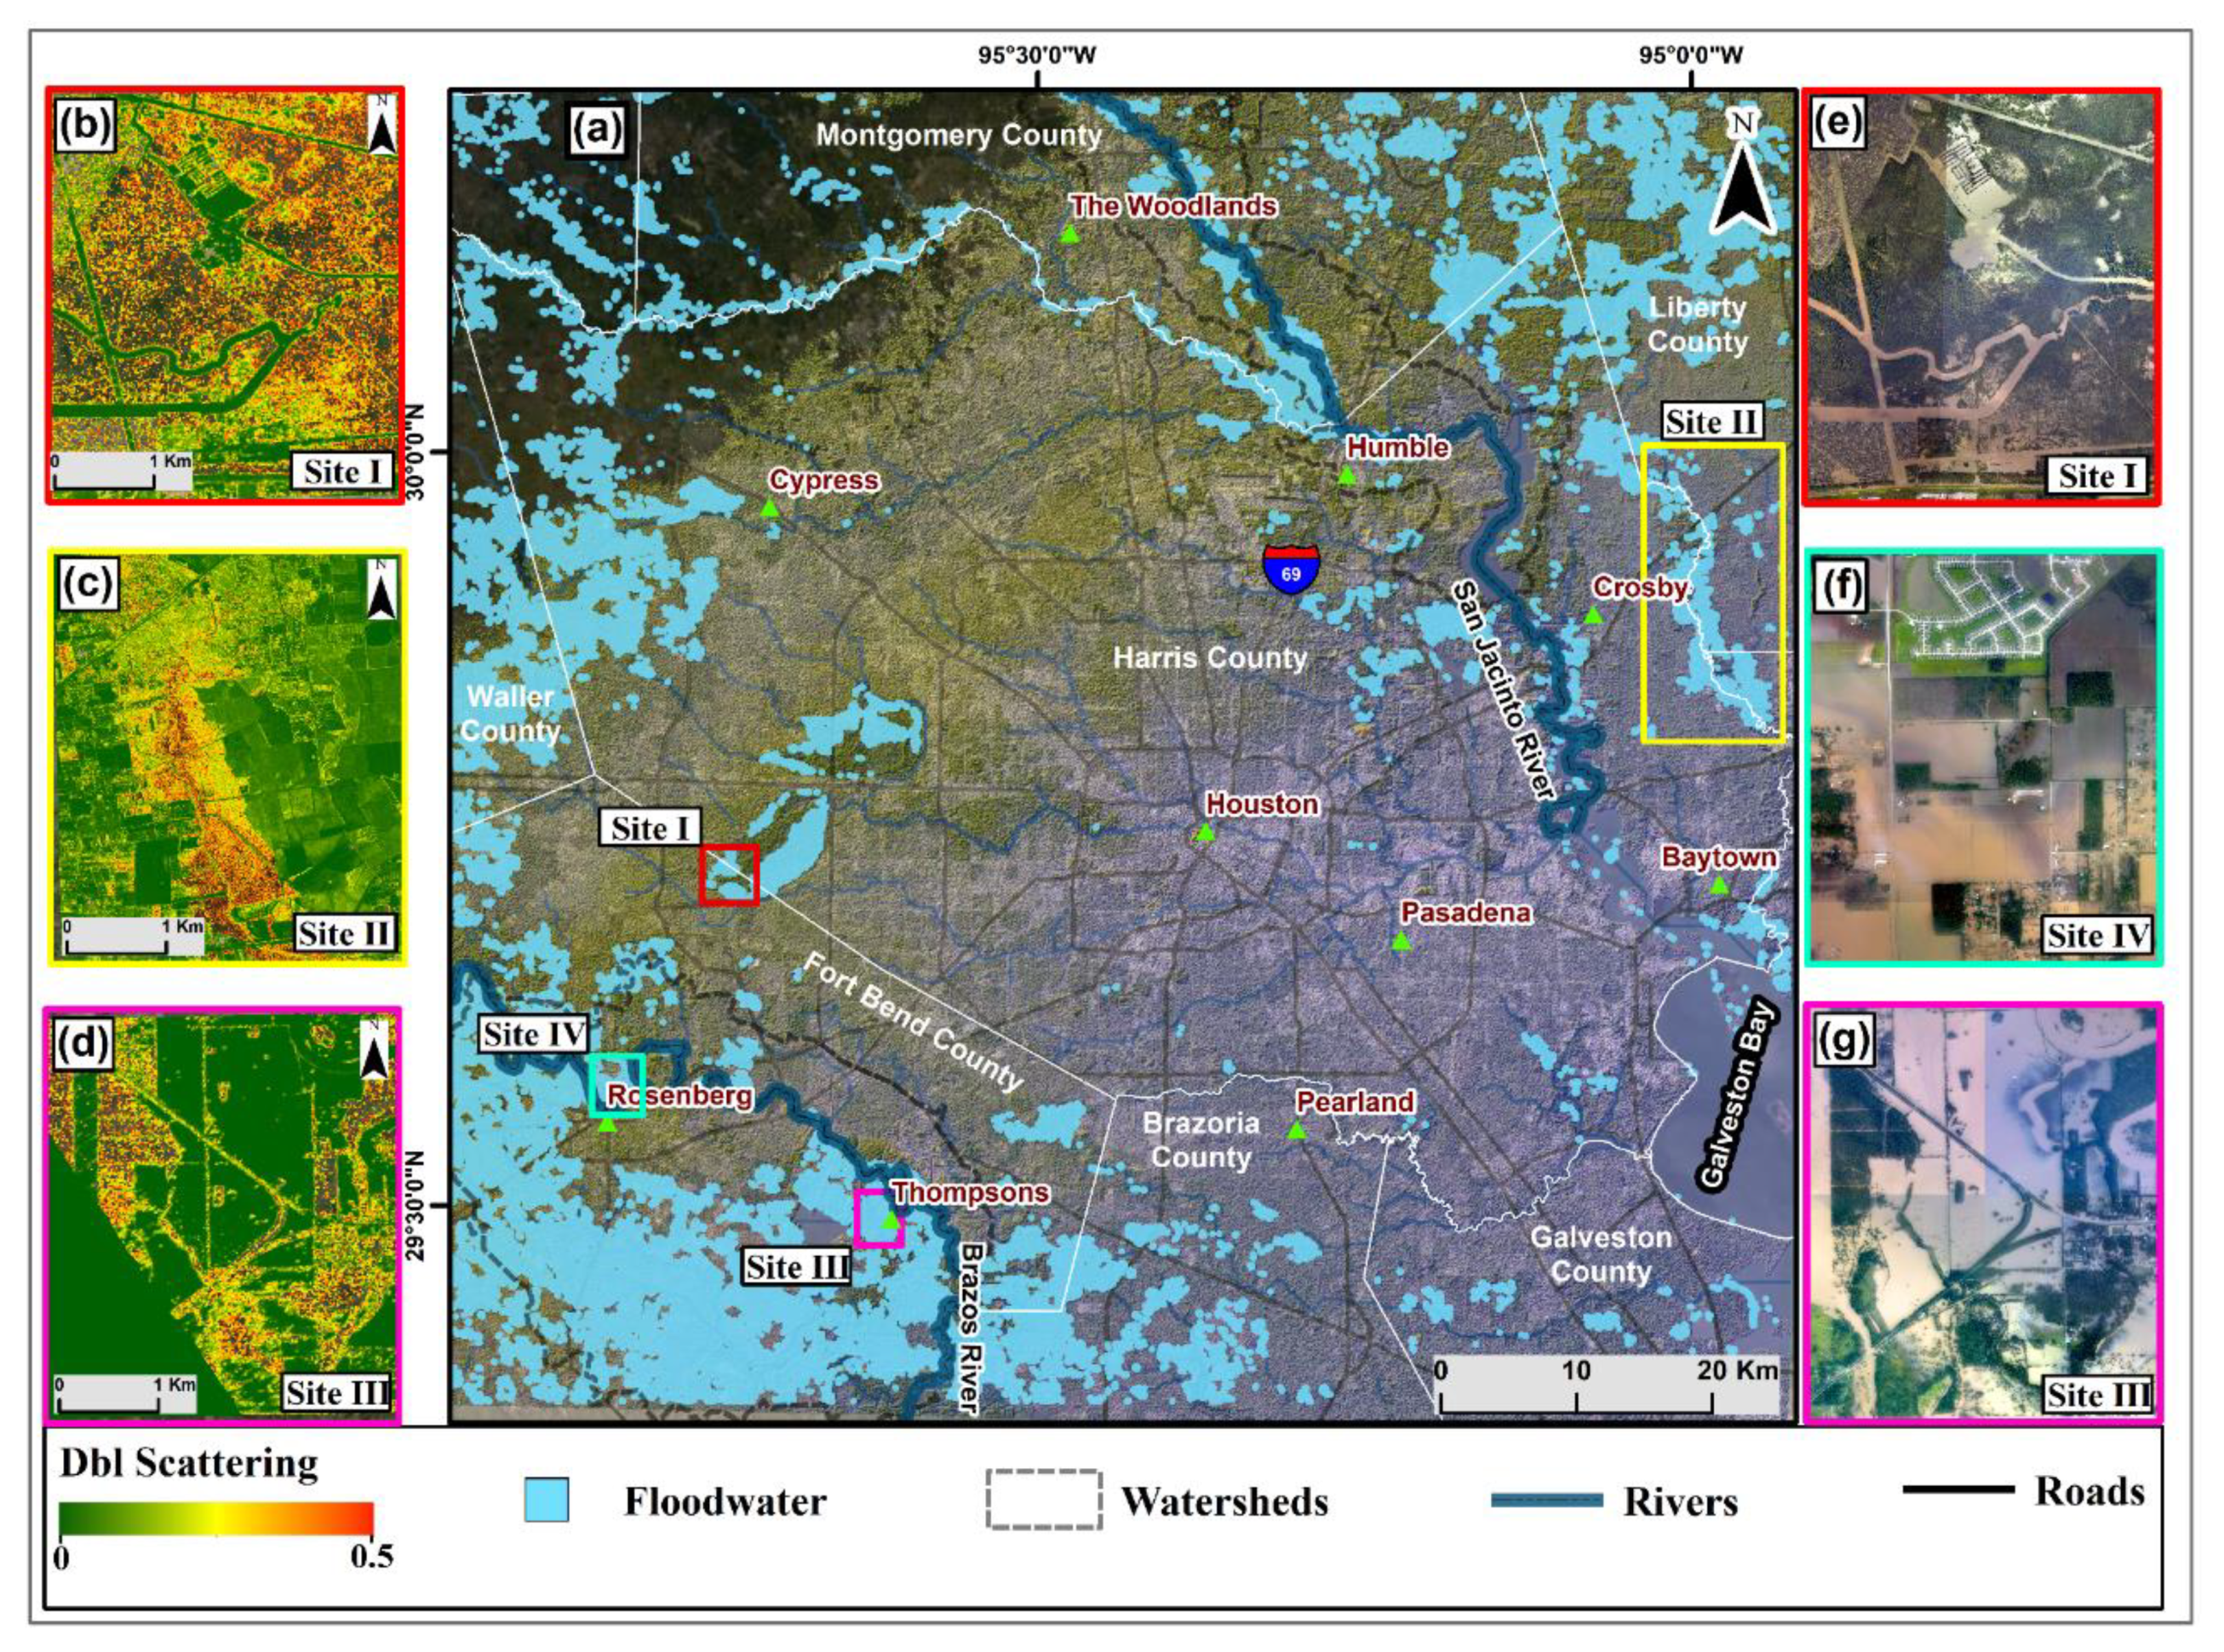
3.2. Validation
3.2.1. UAVSAR Data Classification
3.2.2. NOAA Aerial Imagery
4. Discussion
5. Conclusions
Author Contributions
Funding
Acknowledgments
Conflicts of Interest
References
- Hunter, L.M. Migration and Environmental Hazards. Popul. Environ. 2005, 26, 273–302. [Google Scholar] [CrossRef] [PubMed]
- UNISDR. Terminology on Disaster Risk Reduction. 2009. Available online: https://www.unisdr.org/files/12659_UNISDRevaluation2009finalreport.pdf (accessed on 18 August 2020).
- Motha, R.P. The Impact of Extreme Weather Events on Agriculture in the United States. In Challenges and Opportunities in Agrometeorology; Springer Science and Business Media LLC: Berlin/Heidelberg, Germany, 2011; pp. 397–407. [Google Scholar]
- Powell, J.; Reinhard, S. Measuring the effects of extreme weather events on yields. Weather. Clim. Extremes 2016, 12, 69–79. [Google Scholar] [CrossRef]
- NOAA NCEI. Billion-Dollar Weather & Climate Disasters 1980–2020. 2020. Available online: https://www.ncdc.noaa.gov/billions/events.pdf (accessed on 18 August 2020).
- Bouwer, L.M. Have Disaster Losses Increased Due to Anthropogenic Climate Change? Bull. Am. Meteorol. Soc. 2011, 92, 39–46. [Google Scholar] [CrossRef]
- Emanuel, K. Assessing the present and future probability of Hurricane Harvey’s rainfall. Proc. Natl. Acad. Sci. USA 2017, 114, 12681–12684. [Google Scholar] [CrossRef] [PubMed]
- Guerriero, L.; Ruzza, G.; Calcaterra, D.; Di Martire, D.; Guadagno, F.M.; Revellino, P. Modelling Prospective Flood Hazard in a Changing Climate, Benevento Province, Southern Italy. Water 2020, 12, 2405. [Google Scholar] [CrossRef]
- USGCRP. Impacts, Risks, and Adaptation in the United States: Fourth National Climate Assessment, Volume II: Report-in-Brief. In Fourth National Climate Assessment. 2018. Available online: https://nca2018.globalchange.gov/chapter/24/ (accessed on 26 August 2020).
- Fiaschi, S.; Tessitore, S.; Bonì, R.; Di Martire, D.; Achilli, V.; Borgstrom, S.; Ibrahim, A.; Floris, M.; Meisina, C.; Ramondini, M. From ERS-1/2 to Sentinel-1: Two decades of subsidence monitored through A-DInSAR techniques in the Ravenna area (Italy). GISci. Remote Sens. 2017, 54, 305–328. [Google Scholar] [CrossRef]
- Yang, Z.; Wang, T.; Leung, R.; Hibbard, K.; Janetos, T.; Kraucunas, I.P.; Rice, J.; Preston, B.L.; Wilbanks, T. A modeling study of coastal inundation induced by storm surge, sea-level rise, and subsidence in the Gulf of Mexico. Nat. Hazards 2014, 71, 1771–1794. [Google Scholar] [CrossRef]
- Abidin, H.Z.; Andreas, H.; Gumilar, I.; Wibowo, I.R.R. On correlation between urban development, land subsidence and flooding phenomena in Jakarta. Proc. Int. Assoc. Hydrol. Sci. 2015, 370, 15–20. [Google Scholar] [CrossRef]
- Eggleston, J.; Pope, J.P. Land subsidence and relative sea-level rise in the southern Chesapeake Bay region. Circular 2013, 1392, 30. [Google Scholar] [CrossRef]
- Miller, M.M.; Shirzaei, M. Land subsidence in Houston correlated with flooding from Hurricane Harvey. Remote Sens. Environ. 2019, 225, 368–378. [Google Scholar] [CrossRef]
- Blake, E.S.; Zelinsky, D.A. National Hurricane Center Tropical Cyclone Report. Hurricane Harvey. AL092017. 2018. Available online: https://www.nhc.noaa.gov/data/tcr/AL092017_Harvey.pdf (accessed on 26 August 2020).
- Risser, M.D.; Wehner, M.F. Attributable Human-Induced Changes in the Likelihood and Magnitude of the Observed Extreme Precipitation during Hurricane Harvey. Geophys. Res. Lett. 2017, 44. [Google Scholar] [CrossRef]
- Collins, T.W.; Grineski, S.E.; Chakraborty, J.; Flores, A.B. Environmental injustice and Hurricane Harvey: A household-level study of socially disparate flood exposures in Greater Houston, Texas, USA. Environ. Res. 2019, 179, 108772. [Google Scholar] [CrossRef] [PubMed]
- Kimmelman, M. Lessons from Hurricane Harvey: Houston’s Struggle is America’s Tale. New York Times 2017. Available online: https://www.nytimes.com/interactive/2017/11/11/climate/houston-flooding-climate.html (accessed on 26 August 2020).
- Lozano, J.A. No Severe Impacts from Imelda as It Moves through Texas. 2019. Available online: https://apnews.com/8bd488fd53b54f979763e8929f8d3070 (accessed on 18 September 2020).
- Pasch, R.J.; Roberts, D.P.; Blake, E.S. The 2019 Atlantic Hurricane Season: An Active and Destructive Year. Weatherwise 2020, 73, 32–39. [Google Scholar] [CrossRef]
- Burnett, J. Flash Floods in Texas; Texas A&M University Press: College Station, TX, USA, 2008. [Google Scholar] [CrossRef]
- Hakkenberg, C.; Dannenberg, M.; Song, C.; Ensor, K. Characterizing multi-decadal, annual land cover change dynamics in Houston, TX based on automated classification of Landsat imagery. Int. J. Remote Sens. 2018, 40, 693–718. [Google Scholar] [CrossRef]
- Zhang, W.; Villarini, G.; Vecchi, G.A.; Smith, J.A. Urbanization exacerbated the rainfall and flooding caused by hurricane Harvey in Houston. Nat. Cell Biol. 2018, 563, 384–388. [Google Scholar] [CrossRef]
- Joyce, K.E.; Wright, K.C.; Samsonov, S.V.; Ambrosia, V.G. Remote sensing and the disaster management cycle. In Advances in Geoscience and Remote Sensing; IntechOpen: London, UK, 2009; pp. 317–346. [Google Scholar]
- Zhang, F.; Zhu, X.; Liu, D. Blending MODIS and Landsat images for urban flood mapping. Int. J. Remote Sens. 2014, 35, 3237–3253. [Google Scholar] [CrossRef]
- Bell, J.; Molthan, A. Evaluation of approaches to identifying hail damage to crop vegetation using satellite imagery. J. Oper. Meteorol. 2016, 4, 142–159. [Google Scholar] [CrossRef]
- Bell, J.R.; Gebremichael, E.; Molthan, A.L.; Schultz, L.A.; Meyer, F.J.; Hain, C.R.; Shrestha, S.; Payne, K.C. Complementing Optical Remote Sensing with Synthetic Aperture Radar Observations of Hail Damage Swaths to Agricultural Crops in the Central United States. J. Appl. Meteorol. Clim. 2020, 59, 665–685. [Google Scholar] [CrossRef]
- Goffi, A.; Stroppiana, D.; Brivio, P.A.; Bordogna, G.; Boschetti, M. Towards an automated approach to map flooded areas from Sentinel-2 MSI data and soft integration of water spectral features. Int. J. Appl. Earth Obs. GeoInf. 2020, 84, 101951. [Google Scholar] [CrossRef]
- Jedlovec, G.J.; Nair, U.; Haines, S.L. Detection of Storm Damage Tracks with EOS Data. Weather Forecast. 2006, 21, 249–267. [Google Scholar] [CrossRef]
- Molthan, A.L.; Jedlovec, G.; Carcione, B. NASA satellite data assist in tornado damage assessments. EOS 2011, 92, 337–339. [Google Scholar] [CrossRef]
- Notti, D.; Giordan, D.; Caló, F.; Pepe, A.; Zucca, F.; Galve, J.P. Potential and Limitations of Open Satellite Data for Flood Mapping. Remote. Sens. 2018, 10, 1673. [Google Scholar] [CrossRef]
- Peng, B.; Meng, Z.; Huang, Q.; Wang, C. Patch Similarity Convolutional Neural Network for Urban Flood Extent Mapping Using Bi-Temporal Satellite Multispectral Imagery. Remote Sens. 2019, 11, 2492. [Google Scholar] [CrossRef]
- Dao, P.D.; Liou, Y.-A.; Chou, C.-W. Detection of flood inundation regions with Landsat/MODIS synthetic data. In Proceedings of the International Symposium on Remote Sensing, Tainan, Taiwan, 22–24 April 2015. [Google Scholar]
- Chignell, S.M.; Anderson, R.S.; Evangelista, P.; Laituri, M.; Merritt, D.M. Multi-Temporal Independent Component Analysis and Landsat 8 for Delineating Maximum Extent of the 2013 Colorado Front Range Flood. Remote Sens. 2015, 7, 9822–9843. [Google Scholar] [CrossRef]
- Bouaraba, A.; Younsi, A.; Aissa, A.B.; Acheroy, M.; Milisavljević, N.; Closson, D. Robust techniques for coherent change detection using cosmo-skymed SAR images. Prog. Electromagn. Res. M 2012, 22, 219–232. [Google Scholar] [CrossRef]
- Barrett, B.W.; Dwyer, E.; Whelan, P. Soil Moisture Retrieval from Active Spaceborne Microwave Observations: An Evaluation of Current Techniques. Remote Sens. 2009, 1, 210–242. [Google Scholar] [CrossRef]
- Pulvirenti, L.; Chini, M.; Pierdicca, N.; Boni, G. Use of SAR Data for Detecting Floodwater in Urban and Agricultural Areas: The Role of the Interferometric Coherence. IEEE Trans. Geosci. Remote Sens. 2016, 54, 1532–1544. [Google Scholar] [CrossRef]
- Toselli, F. Applications of Remote Sensing to Agrometeorology: Proceedings of a Course Held at the Joint Research Centre of the Commission of the European Communities in the Framework of the Ispra-Courses, Ispra, Varese, Italy, 6–10 April 1987; Springer Science & Business Media: Berlin/Heidelberg, Germany, 2013. [Google Scholar]
- Walker, J.P.; Houser, P.R.; Willgoose, G.R. Active microwave remote sensing for soil moisture measurement: A field evaluation using ERS-2. Hydrol. Process. 2004, 18, 1975–1997. [Google Scholar] [CrossRef]
- Lu, C.-H.; Ni, C.-F.; Chang, C.-P.; Yen, J.-Y.; Chuang, R.Y. Coherence Difference Analysis of Sentinel-1 SAR Interferogram to Identify Earthquake-Induced Disasters in Urban Areas. Remote Sens. 2018, 10, 1318. [Google Scholar] [CrossRef]
- Vreugdenhil, M.; Wagner, W.; Bauer-Marschallinger, B.; Pfeil, I.; Teubner, I.; Rudiger, C.; Strauss, P. Sensitivity of Sentinel-1 Backscatter to Vegetation Dynamics: An Austrian Case Study. Remote Sens. 2018, 10, 1396. [Google Scholar] [CrossRef]
- Tsyganskaya, V.; Martinis, S.; Marzahn, P.; Ludwig, R. Detection of Temporary Flooded Vegetation Using Sentinel-1 Time Series Data. Remote Sens. 2018, 10, 1286. [Google Scholar] [CrossRef]
- Zin, W.W.; Kawasaki, A.; Takeuchi, W.; San, Z.M.L.T.; Htun, K.Z.; Aye, T.H.; Win, S. Flood Hazard Assessment of Bago River Basin, Myanmar. J. Disaster Res. 2018, 13, 14–21. [Google Scholar] [CrossRef]
- Yang, L.; Jin, S.; Danielson, P.; Homer, C.; Gass, L.; Bender, S.M.; Case, A.; Costello, C.; Dewitz, J.; Fry, J.; et al. A new generation of the United States National Land Cover Database: Requirements, research priorities, design, and implementation strategies. ISPRS J. Photogramm. Remote Sens. 2018, 146, 108–123. [Google Scholar] [CrossRef]
- Boryan, C.G.; Yang, Z.; Sandborn, A.; Willis, P.; Haack, B. Operational Agricultural Flood Monitoring with Sentinel-1 Synthetic Aperture Radar. In Proceedings of the IGARSS 2018—2018 IEEE International Geoscience and Remote Sensing Symposium, Valencia, Spain, 22–27 July 2018; pp. 5831–5834. [Google Scholar]
- Oon, A.; Ngo, K.D.; Azhar, R.; Ashton-Butt, A.; Lechner, A.M.; Azhar, B. Assessment of ALOS-2 PALSAR-2L-band and Sentinel-1 C-band SAR backscatter for discriminating between large-scale oil palm plantations and smallholdings on tropical peatlands. Remote Sens. Appl. Soc. Environ. 2019, 13, 183–190. [Google Scholar] [CrossRef]
- Refice, A.; Capolongo, D.; Pasquariello, G.; DaAddabbo, A.; Bovenga, F.; Nutricato, R.; Lovergine, F.P.; Pietranera, L. SAR and InSAR for Flood Monitoring: Examples With COSMO-SkyMed Data. IEEE J. Sel. Top. Appl. Earth Obs. Remote Sens. 2014, 7, 2711–2722. [Google Scholar] [CrossRef]
- El Hajj, M.; Baghdadi, N.; Bazzi, H.; Zribi, M. Penetration Analysis of SAR Signals in the C and L Bands for Wheat, Maize, and Grasslands. Remote Sens. 2019, 11, 31. [Google Scholar] [CrossRef]
- Plank, S.; Jüssi, M.; Martinis, S.; Twele, A. Mapping of flooded vegetation by means of polarimetric Sentinel-1 and ALOS-2/PALSAR-2 imagery. Int. J. Remote Sens. 2017, 38, 3831–3850. [Google Scholar] [CrossRef]
- Chini, M.; Hostache, R.; Pelich, R.; Matgen, P.; Pulvirenti, L.; Pierdicca, N. Probabilistic Urban Flood Mapping Using SAR Data. In Proceedings of the IGARSS 2019—2019 IEEE International Geoscience and Remote Sensing Symposium, Yokohama, Japan, 28 July–2 August 2019; pp. 4643–4645. [Google Scholar]
- Dasgupta, A.; Grimaldi, S.; Ramsankaran, R.; Pauwels, V.R.N.; Walker, J.P.; Chini, M.; Hostache, R.; Matgen, P. Flood Mapping Using Synthetic Aperture Radar Sensors From Local to Global Scales. In Geomagnetically Induced Currents from the Sun to the Power Grid; Wiley: Hoboken, NJ, USA, 2018; pp. 55–77. [Google Scholar]
- Giustarini, L.; Hostache, R.; Matgen, P.; Schumann, G.J.-P.; Bates, P.D.; Mason, D.C. A Change Detection Approach to Flood Mapping in Urban Areas Using TerraSAR-X. IEEE Trans. Geosci. Remote Sens. 2013, 51, 2417–2430. [Google Scholar] [CrossRef]
- Veljanovski, T.; Lamovec, P.; Pehani, P.; Oštir, K. Comparison of three techniques for detection of flooded areas on ENVISAT and RADARSAT-2 satellite images. In Gi4DM 2011—GeoInformation for Disaster Management; Springer: Berlin/Heidelberg, Germany, 2011. [Google Scholar]
- Clement, M.; Kilsby, C.; Moore, P. Multi-temporal synthetic aperture radar flood mapping using change detection. J. Flood Risk Manag. 2018, 11, 152–168. [Google Scholar] [CrossRef]
- Nico, G.; Pappalepore, M.; Pasquariello, G.; Refice, A.; Samarelli, S. Comparison of SAR amplitude vs. coherence flood detection methods—A GIS application. Int. J. Remote Sens. 2000, 21, 1619–1631. [Google Scholar] [CrossRef]
- Sanyal, J.; Lu, X.X. Application of Remote Sensing in Flood Management with Special Reference to Monsoon Asia: A Review. Nat. Hazards 2004, 33, 283–301. [Google Scholar] [CrossRef]
- Abdelfattah, R.; Nicolás, J. Interferometric Synthetic Aperture Radar Coherence Histogram Analysis for Land Cover Classification. In Proceedings of the 2006 2nd International Conference on Information & Communication Technologies, Damascus, Syria, 24–28 April 2006; Volume 1, pp. 343–348. [Google Scholar]
- De Macedo, K.A.C.; Shiroma, G.H.X.; Wimmer, C.; Moreira, J.R.; Bradar, S.A.; De Macedo, K.A.C. Monitoring under foliage with airborne SAR. In Proceedings of the 2015 IEEE Radar Conference, Arlington, VA, USA, 10–15 May 2015; pp. 499–503. [Google Scholar]
- Newey, M.; Barber, J.; Benitz, G.; Kogon, S. False alarm mitigation techniques for SAR CCD. In Proceedings of the 2013 IEEE Radar Conference (RadarCon13), Ottawa, ON, Canada, 29 April–3 May 2013; pp. 1–6. [Google Scholar]
- Oishi, N.; Tsuchida, M.; Wakayama, T.; Hasegawa, H.; Okada, Y. A coherence improvement technique for coherent change detection in SAR interferometry. In Proceedings of the 2009 European Radar Conference (EuRAD), Rome, Italy, 30 September–2 October 2009; pp. 278–281. [Google Scholar]
- Scheuchl, B.; Ullmann, T.; Koudogbo, F. Change detection using high resolution Terrasar-X data preliminary results. Int. Arch. Photogramm Remote Sens. Spat. Inf. Sci. 2009, 38, 5–10. Available online: http://www.isprs.org/proceedings/xxxviii/1_4_7-W5/paper/Scheuchl-185.pdf (accessed on 2 September 2020).
- Al-Sharif, A.A.A.; Pradhan, B.; Hadi, S.J.; Mola, N. Revisiting Methods and Potentials of SAR Change Detection; Lecture Notes in Engineering and Computer Science, 3 LNECS; Newswood Limited: Hong Kong, China, 2013; pp. 2231–2237. [Google Scholar]
- Scotti, V.; Giannini, M.; Cioffi, F. Enhanced flood mapping using synthetic aperture radar (SAR) images, hydraulic modelling, and social media: A case study of Hurricane Harvey (Houston, TX). J. Flood Risk Manag. 2020, e12647. [Google Scholar] [CrossRef]
- Chen, F.; Masini, N.; Yang, R.; Milillo, P.; Feng, D.; Lasaponara, R. A Space View of Radar Archaeological Marks: First Applications of COSMO-SkyMed X-Band Data. Remote Sens. 2015, 7, 24–50. [Google Scholar] [CrossRef]
- Danklmayer, A.; Chandra, M. Precipitation induced signatures in SAR images. In Proceedings of the European Conference on Antennas and Propagation, EuCAP 2009, Berlin, Germany, 23–27 March 2009; pp. 3433–3437. [Google Scholar]
- Hogenson, K.; Arko, S.A.; Buechler, B.; Hogenson, R.; Herrmann, J.; Geiger, A. Hybrid Pluggable Processing Pipeline (HyP3): A Cloud-Based Infrastructure for Generic Processing of SAR Data; AGU Fall Meeting Abstracts; American Geophysical Union: Washington, DC, USA, 2016. [Google Scholar]
- Wegmuller, U.; Santoro, M.; Werner, C.; Cartus, O. On the Estimation and Interpretation of Sentinel-1 TOPS InSAR Coherence. In Proceedings of the Fringe 2015: Advances in the Science and Applications of SAR Interferometry and Sentinel-1 InSAR Workshop, Frascati, Italy, 23–27 March 2015. [Google Scholar] [CrossRef]
- Just, D.; Bamler, R. Phase statistics of interferograms with applications to synthetic aperture radar. Appl. Opt. 1994, 33, 4361–4368. [Google Scholar] [CrossRef]
- Washaya, P.; Balz, T.; Mohamadi, B. Coherence Change-Detection with Sentinel-1 for Natural and Anthropogenic Disaster Monitoring in Urban Areas. Remote Sens. 2018, 10, 1026. [Google Scholar] [CrossRef]
- Kim, S.-W.; Wdowinski, S.; Amelung, F.; Dixon, T.H.; Won, J.-S. Interferometric Coherence Analysis of the Everglades Wetlands, South Florida. IEEE Trans. Geosci. Remote Sens. 2013, 51, 5210–5224. [Google Scholar] [CrossRef]
- Wei, M.; Sandwell, D. Decorrelation of L-Band and C-Band Interferometry over Vegetated Areas in California. IEEE Trans. Geosci. Remote Sens. 2010, 48, 2942–2952. [Google Scholar] [CrossRef]
- Ruzza, G.; Guerriero, L.; Grelle, G.; Guadagno, F.M.; Revellino, P. Multi-Method Tracking of Monsoon Floods Using Sentinel-1 Imagery. Water 2019, 11, 2289. [Google Scholar] [CrossRef]
- Fore, A.G.; Chapman, B.D.; Hawkins, B.P.; Hensley, S.; Jones, C.E.; Michel, T.R.; Muellerschoen, R.J. UAVSAR Polarimetric Calibration. IEEE Trans. Geosci. Remote Sens. 2015, 53, 3481–3491. [Google Scholar] [CrossRef]
- Pottier, E.; Ferro-Famil, L.; Allain, S.; Cloude, S.; Hajnsek, I.; Papathanassiou, K.; Moreira, A.; Williams, M.; Minchella, A.; LaValle, M.; et al. Overview of the PolSARpro V4.0 software. The open source toolbox for polarimetric and interferometric polarimetric SAR data processing. In Proceedings of the 2009 IEEE International Geoscience and Remote Sensing Symposium, Cape Town, South Africa, 12–17 July 2009; Volume 4, p. IV-936. [Google Scholar] [CrossRef]
- An, W.; Lin, M. A Reflection Symmetry Approximation of Multilook Polarimetric SAR Data and its Application to Freeman–Durden Decomposition. IEEE Trans. Geosci. Remote Sens. 2019, 57, 3649–3660. [Google Scholar] [CrossRef]
- Freeman, A.; Durden, S.L. Three-Component Scattering Model to Describe Polarimetric SAR Data; San Diego ’92; SPIE: Washington, DC, USA, 1993; Volume 1748, pp. 213–224. [Google Scholar] [CrossRef]
- Alijani, G.; Hasanlou, M.; Azizi, Z. Classifying UAVSAR Polarimetric Synthetic Aperture Radar (PolSAR) Imagery Using Target Decomposition Features. Multidiscip. Digit. Publ. Inst. Proc. 2018, 2, 333. [Google Scholar] [CrossRef]
- Chapman, B.; McDonald, K.; Shimada, M.; Rosenqvist, A.; Schroeder, R.; Hess, L. Mapping Regional Inundation with Spaceborne L-Band SAR. Remote Sens. 2015, 7, 5440–5470. [Google Scholar] [CrossRef]
- US Census Bureau. Population Density by County: 2010. Available online: https://www.census.gov/library/visualizations/2010/geo/population-density-county-2010.html (accessed on 10 August 2020).
- Yung, A.C.; Garcia, A.J. The October 1994 flood of Harris County, Texas. In From the Mountains to the Sea-Developing Local Capabilities, Proceedings of the Nineteenth Annual Conference of the Association of State Floodplain Managers; Portland, OR, USA, 22–26 May 1995; p. 3; Natural Hazards Research and Applications Information Center, University of Colorado: Boulder, CO, USA, 1995. [Google Scholar]
- Cheng, X.; Pinto, N.; Gong, J. Terrain radiometric calibration of airborne UAVSAR for forested area. Geo-Spat. Inf. Sci. 2012, 15, 229–240. [Google Scholar] [CrossRef]
- Duan, D.; Wang, Y. An Improved Algorithm to Delineate Urban Targets with Model-Based Decomposition of PolSAR Data. Remote Sens. 2017, 9, 1037. [Google Scholar] [CrossRef]
- NOAA. Hurricane Harvey: Emergency Response Imagery of the Surrounding Regions. 2017. Available online: https://storms.ngs.noaa.gov/storms/harvey/index.html#14/29.8092/-95.2037 (accessed on 18 June 2020).
- Bass, R.A.D.; O’Connor, B.; Perotin, M. A Summary of Findings from FEMA’s Mitigation Assessment Team Evaluation of Texas Coastal Communities Impacted by Hurricane Harvey. In Forensic Engineering 2018; American Society of Civil Engineers: Reston, VA, USA, 2018; pp. 833–845. [Google Scholar] [CrossRef]
- Davlasheridze, M.; Atoba, K.O.; Brody, S.; Highfield, W.; Merrell, W.; Ebersole, B.; Purdue, A.; Gilmer, R.W. Economic impacts of storm surge and the cost-benefit analysis of a coastal spine as the surge mitigation strategy in Houston-Galveston area in the USA. Mitig. Adapt. Strat. Glob. Chang. 2019, 24, 329–354. [Google Scholar] [CrossRef]
- Potter, L.B.; Hoque, N. Texas Population Projections, 2010 to 2050. Office of the State Demographer, 4. 2014. Available online: http://www.txenergypoverty.org/wp-content/uploads/2015/12/2014-11_ProjectionBrief.pdf (accessed on 9 September 2020).
- Kreitler, C.W. Fault Control of Subsidence, Houston, Texasa. Ground Water 1977, 15, 203–214. [Google Scholar] [CrossRef]
- DellaPenna, T.M.; Hoelscher, C.; Hill, L.; Al Mukaimi, M.E.; Knap, A. How tropical cyclone flooding caused erosion and dispersal of mercury-contaminated sediment in an urban estuary: The impact of Hurricane Harvey on Buffalo Bayou and the San Jacinto Estuary, Galveston Bay, USA. Sci. Total Environ. 2020, 748, 141226. [Google Scholar] [CrossRef]
- Potok, A.J. Study of the Relationship between Subsidence and Flooding; IAHS Publication (International Association of Hydrological Sciences): Wallingford, UK, 1991; pp. 389–395. [Google Scholar]
- Warren, J.P.; Jones, L.L.; Lacewell, R.D.; Griffin, W.L. External Costs of Land Subsidence Houston-Baytown Area. Am. J. Agric. Econ. 1975, 57, 450–455. [Google Scholar] [CrossRef]
- Al Mukaimi, M.E.; DellaPenna, T.M.; Williams, J.R. Enhanced land subsidence in Galveston Bay, Texas: Interaction between sediment accumulation rates and relative sea level rise. Estuarine Coast. Shelf Sci. 2018, 207, 183–193. [Google Scholar] [CrossRef]
- Dixon, T.H.; Amelung, F.; Ferretti, A.; Novali, F.; Rocca, F.; Dokka, R.; Sella, G.; Kim, S.-W.; Wdowinski, S.; Whitman, D. Subsidence and flooding in New Orleans. Nat. Cell Biol. 2006, 441, 587–588. [Google Scholar] [CrossRef] [PubMed]
- Kearns, T.J.; Wang, G.; Bao, Y.; Jiang, J.; Lee, D. Current Land Subsidence and Groundwater Level Changes in the Houston Metropolitan Area (2005–2012). J. Surv. Eng. 2015, 141, 05015002. [Google Scholar] [CrossRef]


| SAR Data Type | Flight Path | Perpendicular Baseline (m) | Temporal Baseline (Days) | Severe Weather Event | |
|---|---|---|---|---|---|
| Sentinel-1A/B SLC Granule Pairs (yyyymmdd) | 20160314–20160326 | Descending | 97.6625 | 12 | Tax Day storm |
| 20160326–20160407 | Descending | 14.3211 | 12 | ||
| 20160407–20160419 | Descending | –39.2588 | 12 | ||
| 20170812–20170818 | Descending | –55.1226 | 6 | Hurricane Harvey | |
| 20170818–20170824 | Descending | 79.709 | 6 | ||
| 20170824–20170905 | Descending | –20.2613 | 12 | ||
| 20190907–20190913 | Descending | 36.2323 | 6 | Tropical Storm Imelda | |
| 20190913–20190925 | Descending | 28.6556 | 12 | ||
| UAVSAR GRD Granules (yyyymmdd) | 20170902 (Brazos_14938) | Descending | Hurricane Harvey | ||
| 20170902 (sanjac_14939) | Descending | ||||
Publisher’s Note: MDPI stays neutral with regard to jurisdictional claims in published maps and institutional affiliations. |
© 2020 by the authors. Licensee MDPI, Basel, Switzerland. This article is an open access article distributed under the terms and conditions of the Creative Commons Attribution (CC BY) license (http://creativecommons.org/licenses/by/4.0/).
Share and Cite
Gebremichael, E.; Molthan, A.L.; Bell, J.R.; Schultz, L.A.; Hain, C. Flood Hazard and Risk Assessment of Extreme Weather Events Using Synthetic Aperture Radar and Auxiliary Data: A Case Study. Remote Sens. 2020, 12, 3588. https://doi.org/10.3390/rs12213588
Gebremichael E, Molthan AL, Bell JR, Schultz LA, Hain C. Flood Hazard and Risk Assessment of Extreme Weather Events Using Synthetic Aperture Radar and Auxiliary Data: A Case Study. Remote Sensing. 2020; 12(21):3588. https://doi.org/10.3390/rs12213588
Chicago/Turabian StyleGebremichael, Esayas, Andrew L. Molthan, Jordan R. Bell, Lori A. Schultz, and Christopher Hain. 2020. "Flood Hazard and Risk Assessment of Extreme Weather Events Using Synthetic Aperture Radar and Auxiliary Data: A Case Study" Remote Sensing 12, no. 21: 3588. https://doi.org/10.3390/rs12213588
APA StyleGebremichael, E., Molthan, A. L., Bell, J. R., Schultz, L. A., & Hain, C. (2020). Flood Hazard and Risk Assessment of Extreme Weather Events Using Synthetic Aperture Radar and Auxiliary Data: A Case Study. Remote Sensing, 12(21), 3588. https://doi.org/10.3390/rs12213588