Article

Influence of Urban Scale and Urban Expansion on the Urban Heat Island Effect in Metropolitan Areas: Case Study of Beijing–Tianjin–Hebei Urban Agglomeration

1
Institute of Geographic Sciences and Natural Resources Research, Chinese Academy of Sciences, 11A, Datun Road, Chaoyang District, Beijing 100101, China
2
Key Laboratory of Regional Sustainable Development Modeling, Chinese Academy of Sciences, Beijing 100101, China
3
College of Resource and Environment, University of Chinese Academy of Sciences, Beijing 100101, China
4
State Key Laboratory of Resources and Environmental Information System, Chinese Academy of Sciences, Beijing 100101, China
5
School of Geographic Sciences, East China Normal University, Shanghai 200241, China
*
Author to whom correspondence should be addressed.
Remote Sens. 2020, 12(21), 3491; https://doi.org/10.3390/rs12213491
Submission received: 28 September 2020 / Revised: 19 October 2020 / Accepted: 21 October 2020 / Published: 23 October 2020
(This article belongs to the Special Issue Integrating Remote Sensing and Urban Informatics)

Abstract

:
Global large-scale urbanization has a deep impact on climate change and has brought great challenges to sustainable development, especially in urban agglomerations. At present, there is still a lack of research on the quantitative assessment of the relationship between urban scale and urban expansion and the degree of the urban heat island (UHI) effect, as well as a discussion on mitigation and adaptation of the UHI effect from the perspective of planning. This paper analyzes the regional urbanization process, average surface temperature variation characteristics, surface urban heat island (SUHI), which reflects the intensity of UHI, and the relationship between urban expansion, urban scale, and the UHI in the Beijing–Tianjin–Hebei (BTH) urban agglomeration using multi-source analysis of data from 2000, 2005, 2010, and 2015. The results show that the UHI effect in the study area was significant. The average surface temperature of central areas was the highest, and decreased from central areas to suburbs in the order of central areas > expanding areas > rural residential areas. From the perspective of spatial distribution, in Beijing, the southern part of the study area, the junction of Tianjin, Langfang, and Cangzhou are areas with intense SUHI. The scale and pace of expansion of urban land in Beijing were more than in other cities, the influencing range of SUHI in Beijing increased obviously, and the SUHI of central areas was most intense. The results indicate that due to the larger urban scale of the BTH urban agglomeration, it will face a greater UHI effect. The UHI effect was also more significant in areas of dense distribution in cities within the urban agglomeration. Based on results and existing research, planning suggestions are proposed for central areas with regard to expanding urban areas and suburbs to alleviate the urban heat island effect and improve the resilience of cities to climate change.

Graphical Abstract

1. Introduction

With the rapid development of urbanization, more serious ecological and environmental problems will occur. The demand for built-up and residential land is increasing, and urban land keeps expanding by occupying another land [1]. By 2030, more than 1.2 million km2 of land is projected to convert to new urban areas, which is nearly twice of urban areas in 2000, and the half of expansion will be concentrated in Asia [2]. Similarly, another 2.5 billion people will reside in urban areas, and the total proportion of the urban population will reach 68% by 2050, and most of them in cities in Asia and Africa, according to UN [3]. Cities, particularly cities in developing countries, are facing challenges for sustainable development in the future [4,5]. Although cities account for less than 2% of the Earth’s surface, intense activities result in 78% of the world’s energy consumed by cities and more than 60% of greenhouse gas emissions produced from them [6]. This has also intensified the trend of global warming, and the degree and frequency of extreme high-temperature weather [7]. Urban expansion is affected by physical factors, socioeconomic factors, neighborhood factors, and land-use policy and urban planning factors, and the effects of these factors change along with place and the process of development [8,9,10,11]. Due to increased impervious surfaces, decreased albedo, and increased heat conduction and heat capacity, urban areas have higher heat storage in the daytime, resulting in the urban heat island (UHI) effect, which aggravates urban air pollution and affects human health [12,13,14,15,16,17,18,19,20,21,22]. Cities are not only an important factor leading to climate change, but are also affected by climate change [23,24]. The SDGs set by the 2030 Agenda for Sustainable Development propose goal 11 involving creating green public spaces, and improving urban planning and management to make cities sustainable, safe, and resilient [25]. Therefore, it is of great scientific significance to study the impact of urban expansion on the UHI effect to improve the adaptability and resilience of cities to climate change.
Commonly, research is focused on the impact of urban expansion on surface temperature. Earlier, some scholars discussed the causes of the UHI effect [26], the influencing factors of temporal and spatial differentiation [27], and evaluation methods of the UHI effect [28]. At present, many studies use remote sensing images to explore the relationship between the alteration of land cover types caused by urban expansion and rising surface temperature or the intensity change of the heat island effect, indicating that the increased demand for urban land is related to the UHI [22,29,30,31,32,33]. Other studies focus on the impact of land type transformation on land surface temperature (LST) [19], and the moving track of urban centroid is consistent with that of surface urban heat island (SUHI), and on urbanization having an impact on the climate of marginal areas [34,35]. In addition, some scholars have studied the impact of special urban land-use on UHI and the impact of land cover types on the atmospheric heat island effect [36,37]. Based on the method of numerical simulation, some scholars have studied and predicted the relationship between urban expansion and the UHI effect in different seasons [21,38,39]. In addition, some scholars have developed a high spatial resolution spatiotemporal heat island model, which provides a strong basis for thermal exposure assessment [40]. In a word, urban expansion is the main driving factor of farmland and forest shrinkage. The land surface change caused by urbanization can greatly change the urban thermal environment and further lead to changes in the UHI effect [38,41].
Previous research further studied the influence of the urban expansion mode on the UHI effect, and explored the relationship between the UHI effect and urban scales, urban areas, expansion modes, and urban forms [42,43,44,45,46]. The results showed that urban densification within limits can effectively control the expansion rate of UHI and adjust its scope and intensity [47,48]. Based on the study of cities in Europe, the impact of urban scale on the heat island effect is the largest, compactness is the second factor, and the impact of urban extension is the smallest [49]. The shielding effect of high-rise buildings [50] and urban continuity [17] can reduce the intensity of UHI.
The time evolution of urbanization affects the temperature tendency on multiple scales. On the global scale, the overall trend of urbanization affecting temperature change is relatively consistent, yet for countries with different development situations, and even in different regions of the same country, the variation range of the UHI effect caused by urban expansion is quite different, mainly because the increase of the urban built environment and activity density is not infinite when buildings exceed a certain scale [38,51,52]. With urban development, in some cases, the temperature remained unchanged in existing urban areas, while increased temperature only occurred in newly urbanized areas [53,54]. During urban expansion in the eastern part of the United States, the effect of annual average temperature rise in newly expanded urban areas is greater than that in the central areas [55]. That is to say, the temperature in the central areas does rise, but with only a small change, ranging from 0.3 to 2 °C [56,57]. The UHI behaves similarly, that is, the temperature rise is higher in newly urbanized areas than in existing areas [58].
Mitigation measures for UHI are mostly derived from the impact of landscape patterns, land cover, and utilization on UHI [59]. It is generally believed that elements of the natural landscape (such as forests, water bodies, and wetlands) play an important role in alleviating high temperatures [60,61,62,63,64,65,66]. On the contrary, elements of the urban landscape, such as built-up land and poor land, increase the temperature in the thermal environment [63]. However, the impact of the same land cover type on different urban thermal environments differs. Therefore, it is necessary to consider the local conditions and the function allocation of land cover when cities are attempting to alleviate the urban heat island effect [12,20,41,67,68]. In addition, some scholars have found that the natural life cycle of green plants usually increases the variability of seasonal UHI, so the effect on mitigating UBI still needs further study [17,20].
The impact of urban expansion on the UHI of cities in China has been widely recognized. However, current research is mainly focused on individual large cities in scale, while research on urban agglomerations is mostly focused on the macroscopic analysis and comparison of spatiotemporal changes. In fact, urban agglomerations contain cities with different development stages, in particular, the development difference within the Beijing–Tianjin–Hebei (BTH) urban agglomeration is more significant than other urban agglomerations. The analysis and study of UHI in urban agglomerations needs a more detailed scale to reflect the environmental status of cities at different stages and then put forward appropriate urban planning suggestions. For these research purposes, this study estimated and simulated the UHI effect of the BTH region with urban expansion using land-use data and the LST product with 1km spatial resolution from 2000, 2005, 2010, and 2015. The built-up land was divided into central, expanding, unchanged rural residential, and new rural residential areas to compare the temperature characteristics of urban land and suburbs. The surface urban heat island (SUHI) effect was calculated based on rural comparison values to analyze the spatiotemporal variation of the UHI intensity in the BTH region. Then, four typical cities were selected to analyze the temperature difference change with the distance from the city center to the suburbs. Based on the results and relevant research, adaptation strategies of city planning for central areas, expanding areas, and suburbs are proposed in the discussion.

2. Materials and Methods

2.1. Research Area

The BTH urban agglomeration is located in eastern China (Figure 1). The region has complex and diverse landforms: The north and northwest are mainly covered with grassland and forest, due to the distribution of mountains and plateau, the southeast is mainly plain, which is the main farmland distribution area, and the east is coastal. As one of the three major urban agglomerations in China and an area with relatively grouped economic activities and population, the population of the region has reached 110 million, and its total gross domestic product (GDP) accounts for 8.5% of the country. The region includes Beijing and Tianjin, two municipalities directly under the central government, and 11 prefecture-level cities in Hebei Province, with a total area of 21.6 × 10⁵ hectares, accounting for 2.25% of the country’s total area. In this study, the cities in the region are divided into northern, central, and southern parts (shown in the right panel of Figure 1) for further calculation of SUHI. The research on urban expansion and the UHI effect in the region contributes to regional sustainable development, and the formulation of corresponding mitigation measures for climate change to improve urban adaptability.

2.2. Land-Use Data

Land-use data were collected from raster data with a spatial resolution of 1000 m from2000, 2005, 2010, and 2015, mainly provided by the Resource and Environment Data Cloud (RESDC) platform from the Chinese Academy of Science (CAS) (http://www.resdc.cn/). According to the classification system of RESDC, the original land-use types are classified into seven categories: Farmland, forest, grassland, water, built-up land, unused land, and ocean; and there are also 25 types of secondary classification (Supplementary Table S1). Because the ocean is mostly concentrated in the eastern regions, which accounts for a small proportion of the study area, this study focuses on the analysis of farmland, forest, grassland, water, built-up land, and unused land. The urban zoning map is from the website of the National Geomatics Center of China (http://ngcc.sbsm.gov.cn/ngcc/).

2.3. Remote Sensing Data of Land Surface Temperature

The temperature data of the BTH region is from MOD11A2 version 6 provided by NASA (https://ladsweb.modaps.eosdis.nasa.gov/search/order/1/MOD11A2--6). NASA provides two products, daily and 8-day per-pixel land temperature and emissivity with 1km spatial resolution. The 8-day compositing period is the exact ground track repeat period of the Terra and Aqua platforms. The product adopts the atmospheric column water vapor and lower boundary air surface temperature to achieve high-quality retrievals [69]. The emissivity in this product is estimated based on land cover types (MCDLC1KM) using a split-window algorithm, and the MCDLC1KM data are produced every three years [70]. This product can provide data from 18 February 2000 to the present, and the 8-day average temperature of MOD11A2 corresponds to the resolution of land-use data of the BTH region. Considering the available land-use data, we chose the daytime range of the 8-day product for2000, 2005, 2010, and 2015 and calculated the annual average temperature of each year. The data are converted from Kelvin to Celsius (°C).

2.4. Surface Urban Heat Island Effect (SUHI)

The SUHI reflects the intensity of the heat island effect in different areas. Due to the lack of a unified method to determine rural comparison values, existing studies take the temperature of the rural residential or farmland areas as the rural comparison value [24,61]. Considering the BTH region includes multiple cities, this research divided it into the northern (Beijing, Zhangjiakou, Chengde, Qinhuangdao), central (Tianjin, Baoding, Langfang, Tangshan, Cangzhou), and southern (Shijiazhuang, Hengshui, Xingtai, Handan) parts and calculated the rural comparison value of each one using the following equation:
T r = 1 n m = 1 n T m
where T r is the mean surface temperature of rural residential pixels, T m is the surface temperature of rural residential pixel m , and n is the total number of rural residential pixels. Table 1 shows the number of rural residential pixels of the northern, central, and southern parts in 2000, 2005, 2010, and 2015.
The SUHI of each pixel was calculated using the following equation:
S U H I i = T i T r
where S U H I i is SUHI of each pixel i , T i is the surface temperature of each pixel i , and T r is the mean surface temperature of rural residential pixels.
Referring to existing studies, the standard grades of SUHI for cities are different, due to different study scales and time series, and the comparison value calculated by different objects also has an impact on the SUHI of pixels [34,71,72]. Results based on Equation (2) show that the temperature difference of each part varies from −15.4. to 8.9 °C, and most of temperature difference is below 5.5 °C (Supplementary Table S2). Referring to the division standard from relevant studies [34,71] and the average temperature difference of BTH (Supplementary Figure S1), SUHI in this study was divided into six grades (Table 2).
In addition to the study of the entire BTH region, it is also necessary to discuss the spatiotemporal changes of the UHI effect at a city level. To analyze the variation of temperature difference with the change of distance from the city center (Section 3.3), we determine the radius of each circle from the city center to suburbs in selected cities. The mean temperature difference within a certain radius was calculated using the following equation:
C t = 1 n i = 1 n ( T C i T r )
where C t is the mean temperature difference within a radius, T C i is the surface temperature of pixel i within the radius, T r is the rural comparison value of the northern, central or southern part that the radius belongs to, and n is the total number of pixels i within the radius.

3. Results

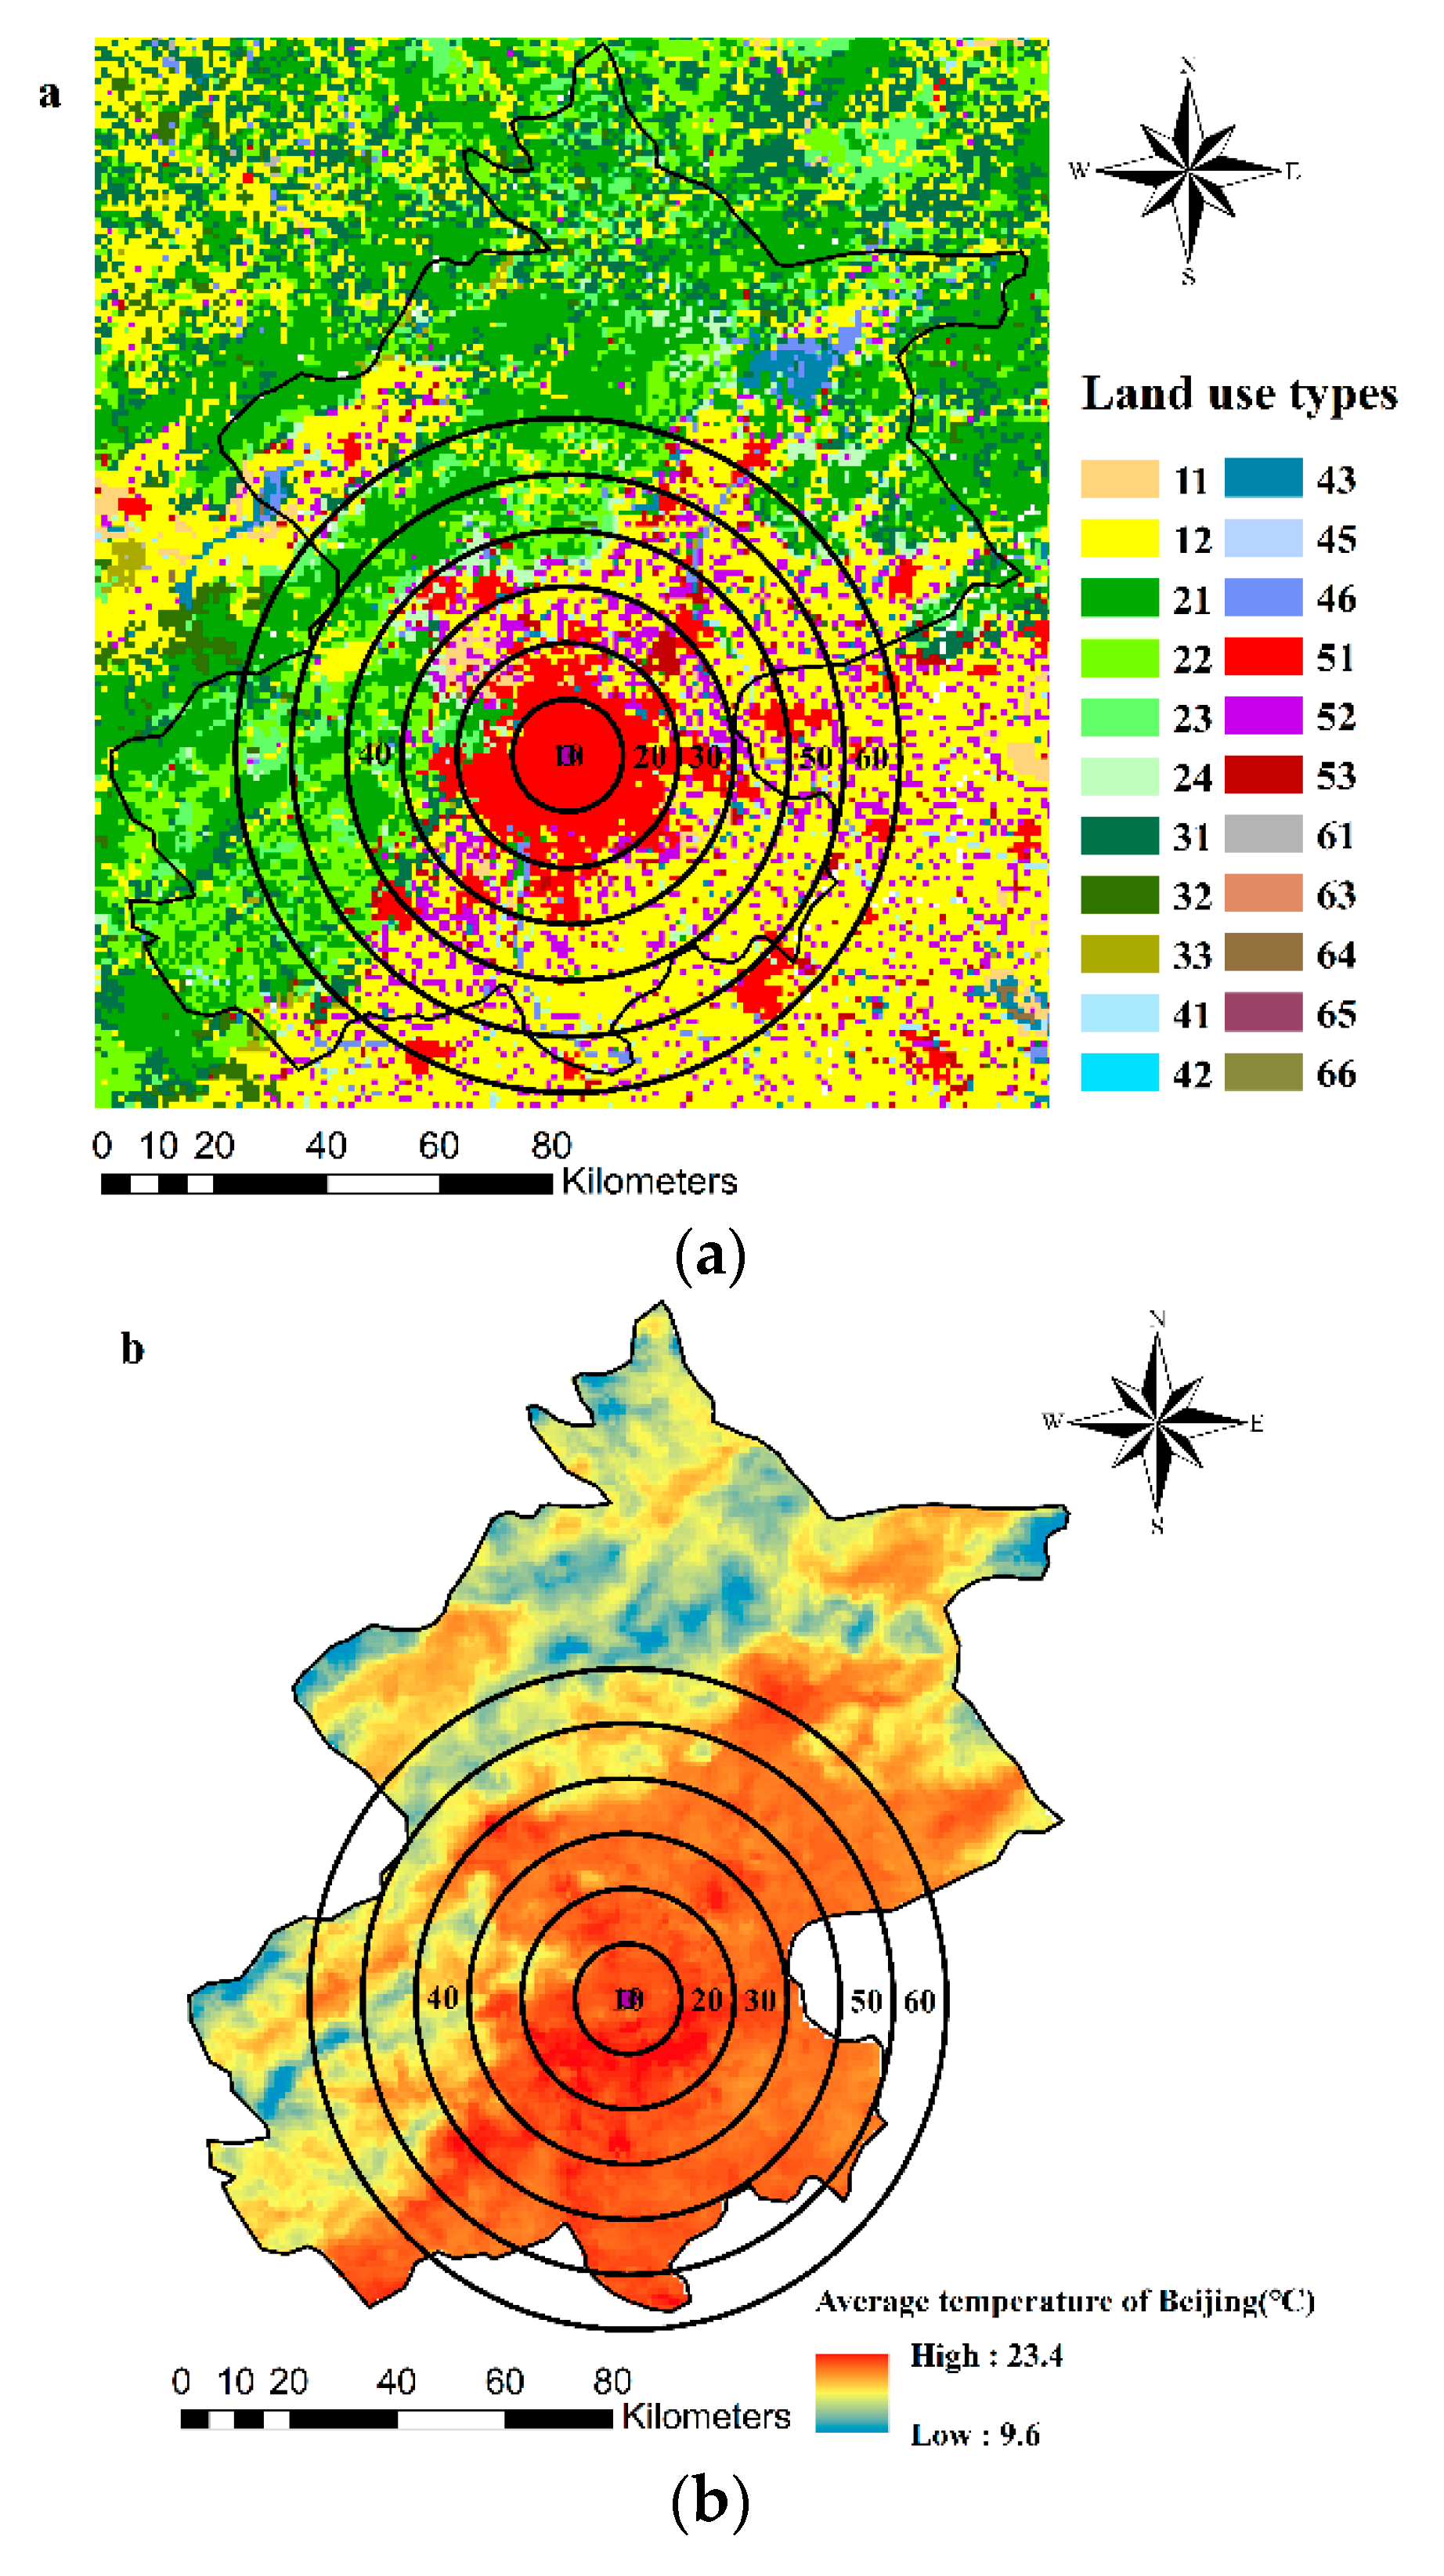
3.1. Expansion and Average Temperature of Built-up Land

Figure 2a shows unchanged land-use distribution and areas changed from other types comparing 2000 with2015. The northern and western parts of the study area are mainly covered by forest and grassland. Farmland is distributed in the southeast of the region and the northwest of Zhangjiakou. Built-up land is centralized in the central areas of each city. From 2000 to 2015, built-up land increased from 3491 to 5003 km2. The area of built-up land that is transferred from other land-use types was 2877 km2, most of which was from farmland. The area of farmland, forest, grassland, water, and unused land transferred from other land types was 446 km2, 118 km2, 35 km2, 273 km2, and 22 km2, respectively (Supplementary Figure S2). The expanded parts of built-up land distributed outward around the city center and transferred areas of other land-use types were scattered and discontinuous in the whole region (Supplementary Figure S3).
The subclassification of built-up land includes urban land, rural residential areas, and other built-up land (Supplementary Table S1). The proportion of other built-up land was relatively smaller, so it was ignored in this study. To further explore the temperature characteristics of built-up land, urban land and rural residential areas in 2000 were taken as central and unchanged rural settlement areas, and the increased parts by 2015 were taken as expanded and new rural residential areas, respectively. Figure 2b shows the 4-year annual average temperature of the four types of built-up land. The expanded and new rural residential areas were mainly around the central areas. The average annual temperature of the central areas was 22.0 °C, which was the highest among the four types. The average annual temperature of expanded, unchanged rural residential, and new rural residential areas was 21.4, 21.2, and 21.2 °C, respectively, indicating a lower average temperature in rural than urban areas, but no significant difference between unchanged and new rural residential areas. From the temporal variation, the temperature difference between central and expanded areas decreased significantly from nearly 1 °C in 2000 to about 0.3 °C in 2015, indicating a more rapid increase in temperature in expanded areas, due to urban expansion (Figure 3).

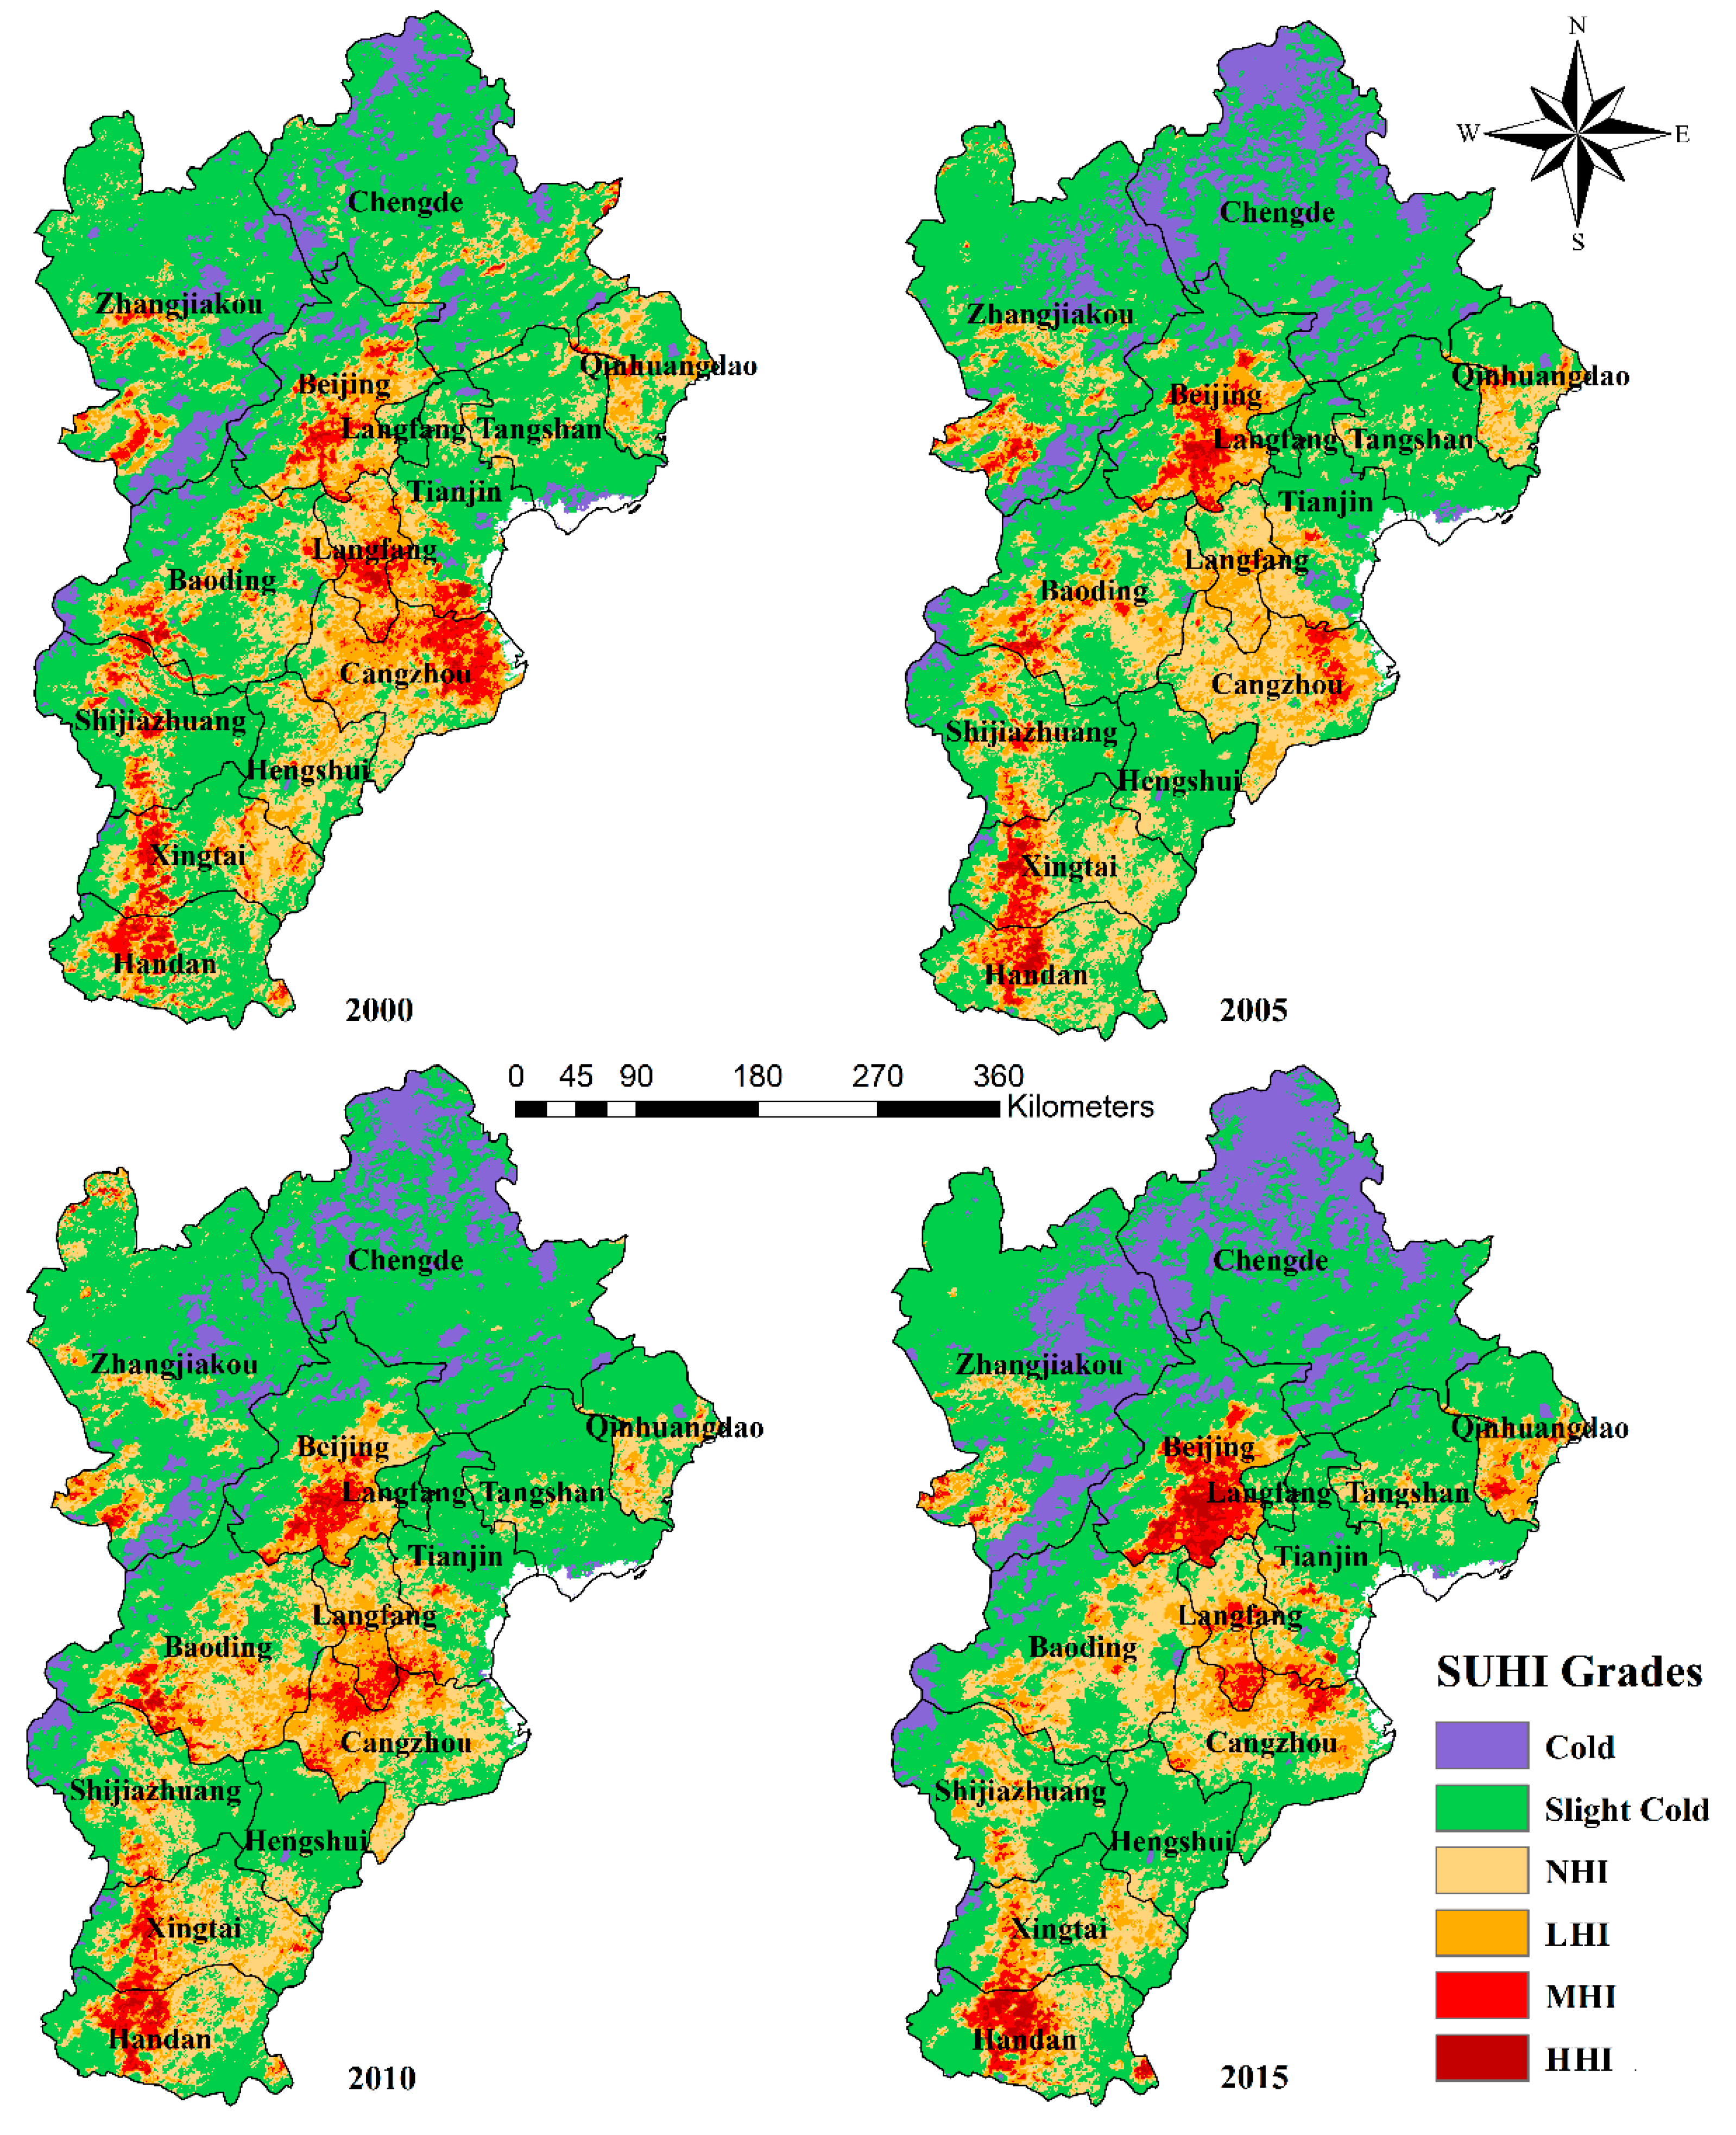
3.2. Spatiotemporal Changes of SUHI

Based on the difference between pixels and the rural comparison value of the northern, central, and southern parts, the spatiotemporal variation of SUHI was obtained, as shown in Figure 4. With relatively small urban land area and high coverage with forest and grassland, the majority of Chengde and Zhangjiakou showed a cold or a slightly cold effect, although small areas presented an MHI effect in the south of Zhangjiakou. The most obvious heat island effect occurred in Beijing, Shijiazhuang, Xingtai, Handan, and the junction of Tianjin, Langfang, and Cangzhou. Beijing has the largest urban land area and the most obvious expansion, accompanied by a large population influx from 2000 to 2015, so the range of the heat island effect increased significantly. The grade of SUHI of central areas changed from mostly MHI to mostly HHI, and the areas of HHI also increased obviously in Beijing. The MHI and HHI areas extended outward from the city center of Beijing during 2000–2015.
The heat island effect of Langfang, Cangzhou, and their junction with Tianjin tended to weaken. The MHI and HHI area was wide and concentrated in the middle of Langfang and the northeast of Cangzhou. However, the SUHI grade gradually decreased to the MHI effect, and the range of influence of the MHI effect also narrowed in the junction of the three cities. The southern region experienced an obvious heat island effect, which was distributed in Shijiazhuang, Xingtai, and Handan in a north–south strip. In 2000, the heat island effect of the Shijiazhuang city center was strong, and then gradually weakened. From 2000 to 2015, the MHI effect in Xingtai and Handan was particularly obvious, while the range narrowed down to Handan, and that area also decreased. Comparing the level and scope of SUHI, cities with larger and continuous urban areas showed a higher intensity of UHI effect. From the perspective of regional scale in the BTH urban agglomeration, areas with dense distribution of cities, such as the junction of Langfang, Cangzhou, and Tianjin and the southern area with Shijiazhuang, Xingtai, and Handan, also presented obvious SUHI.

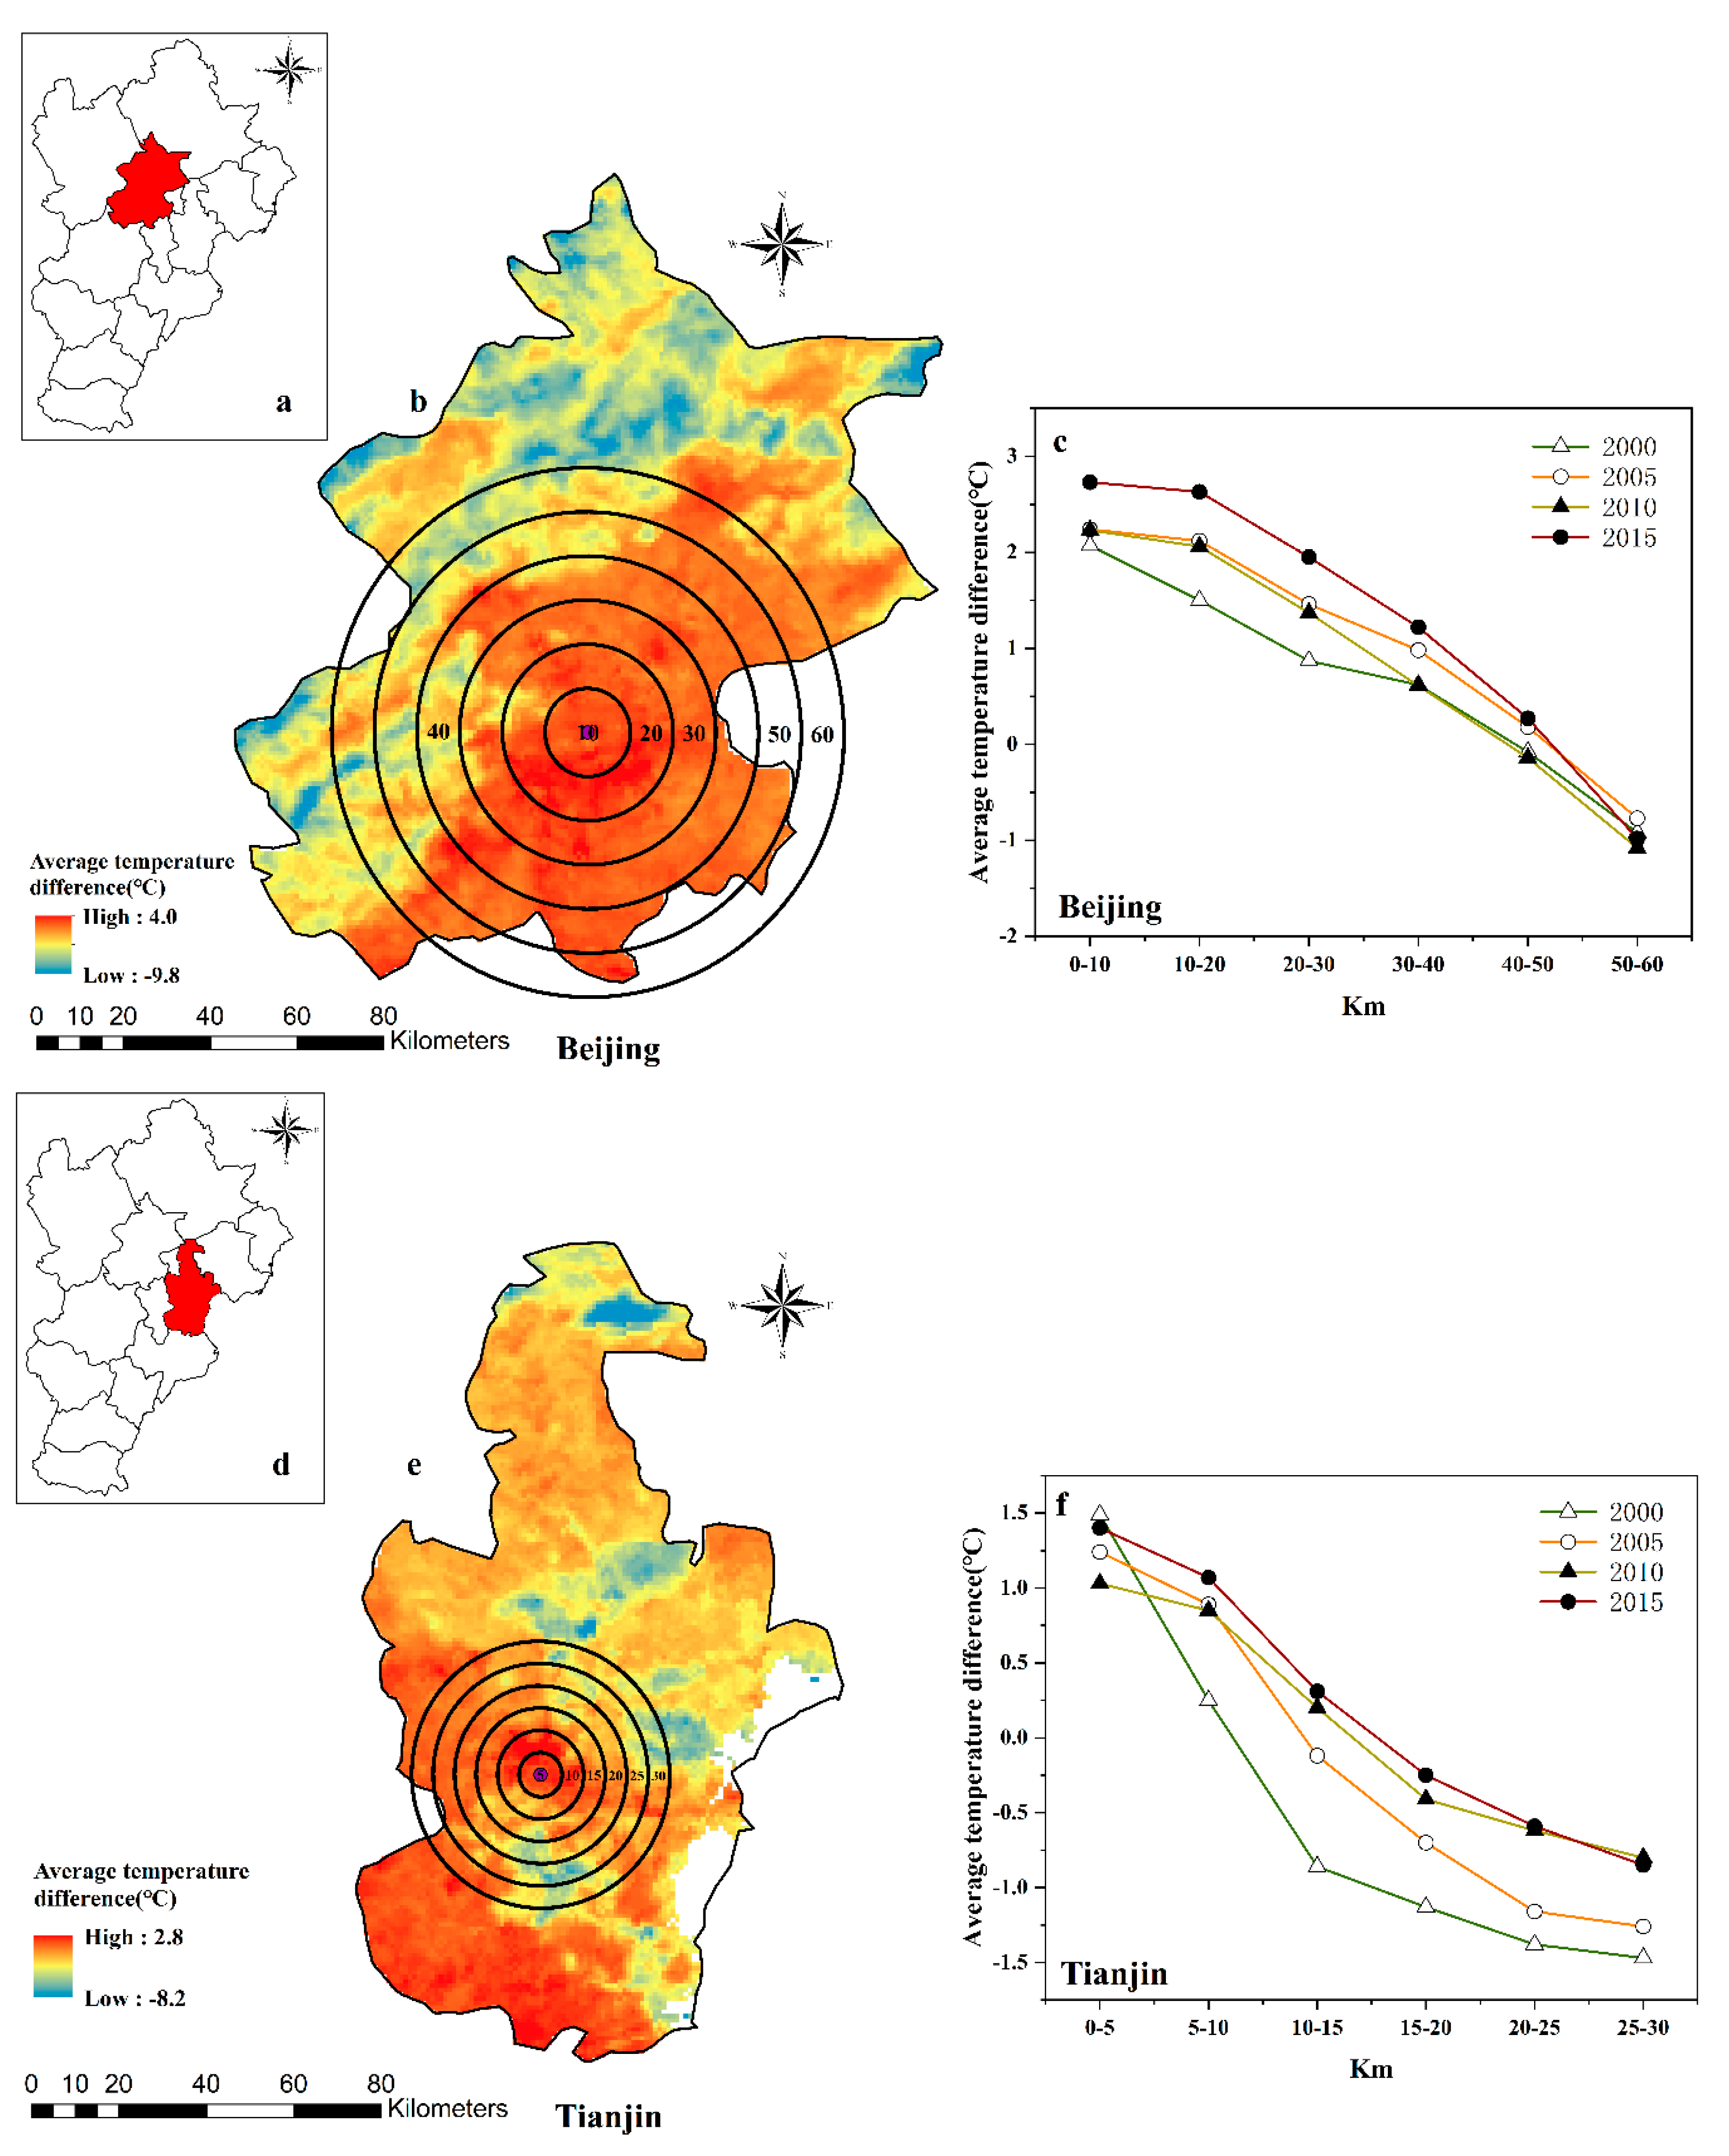
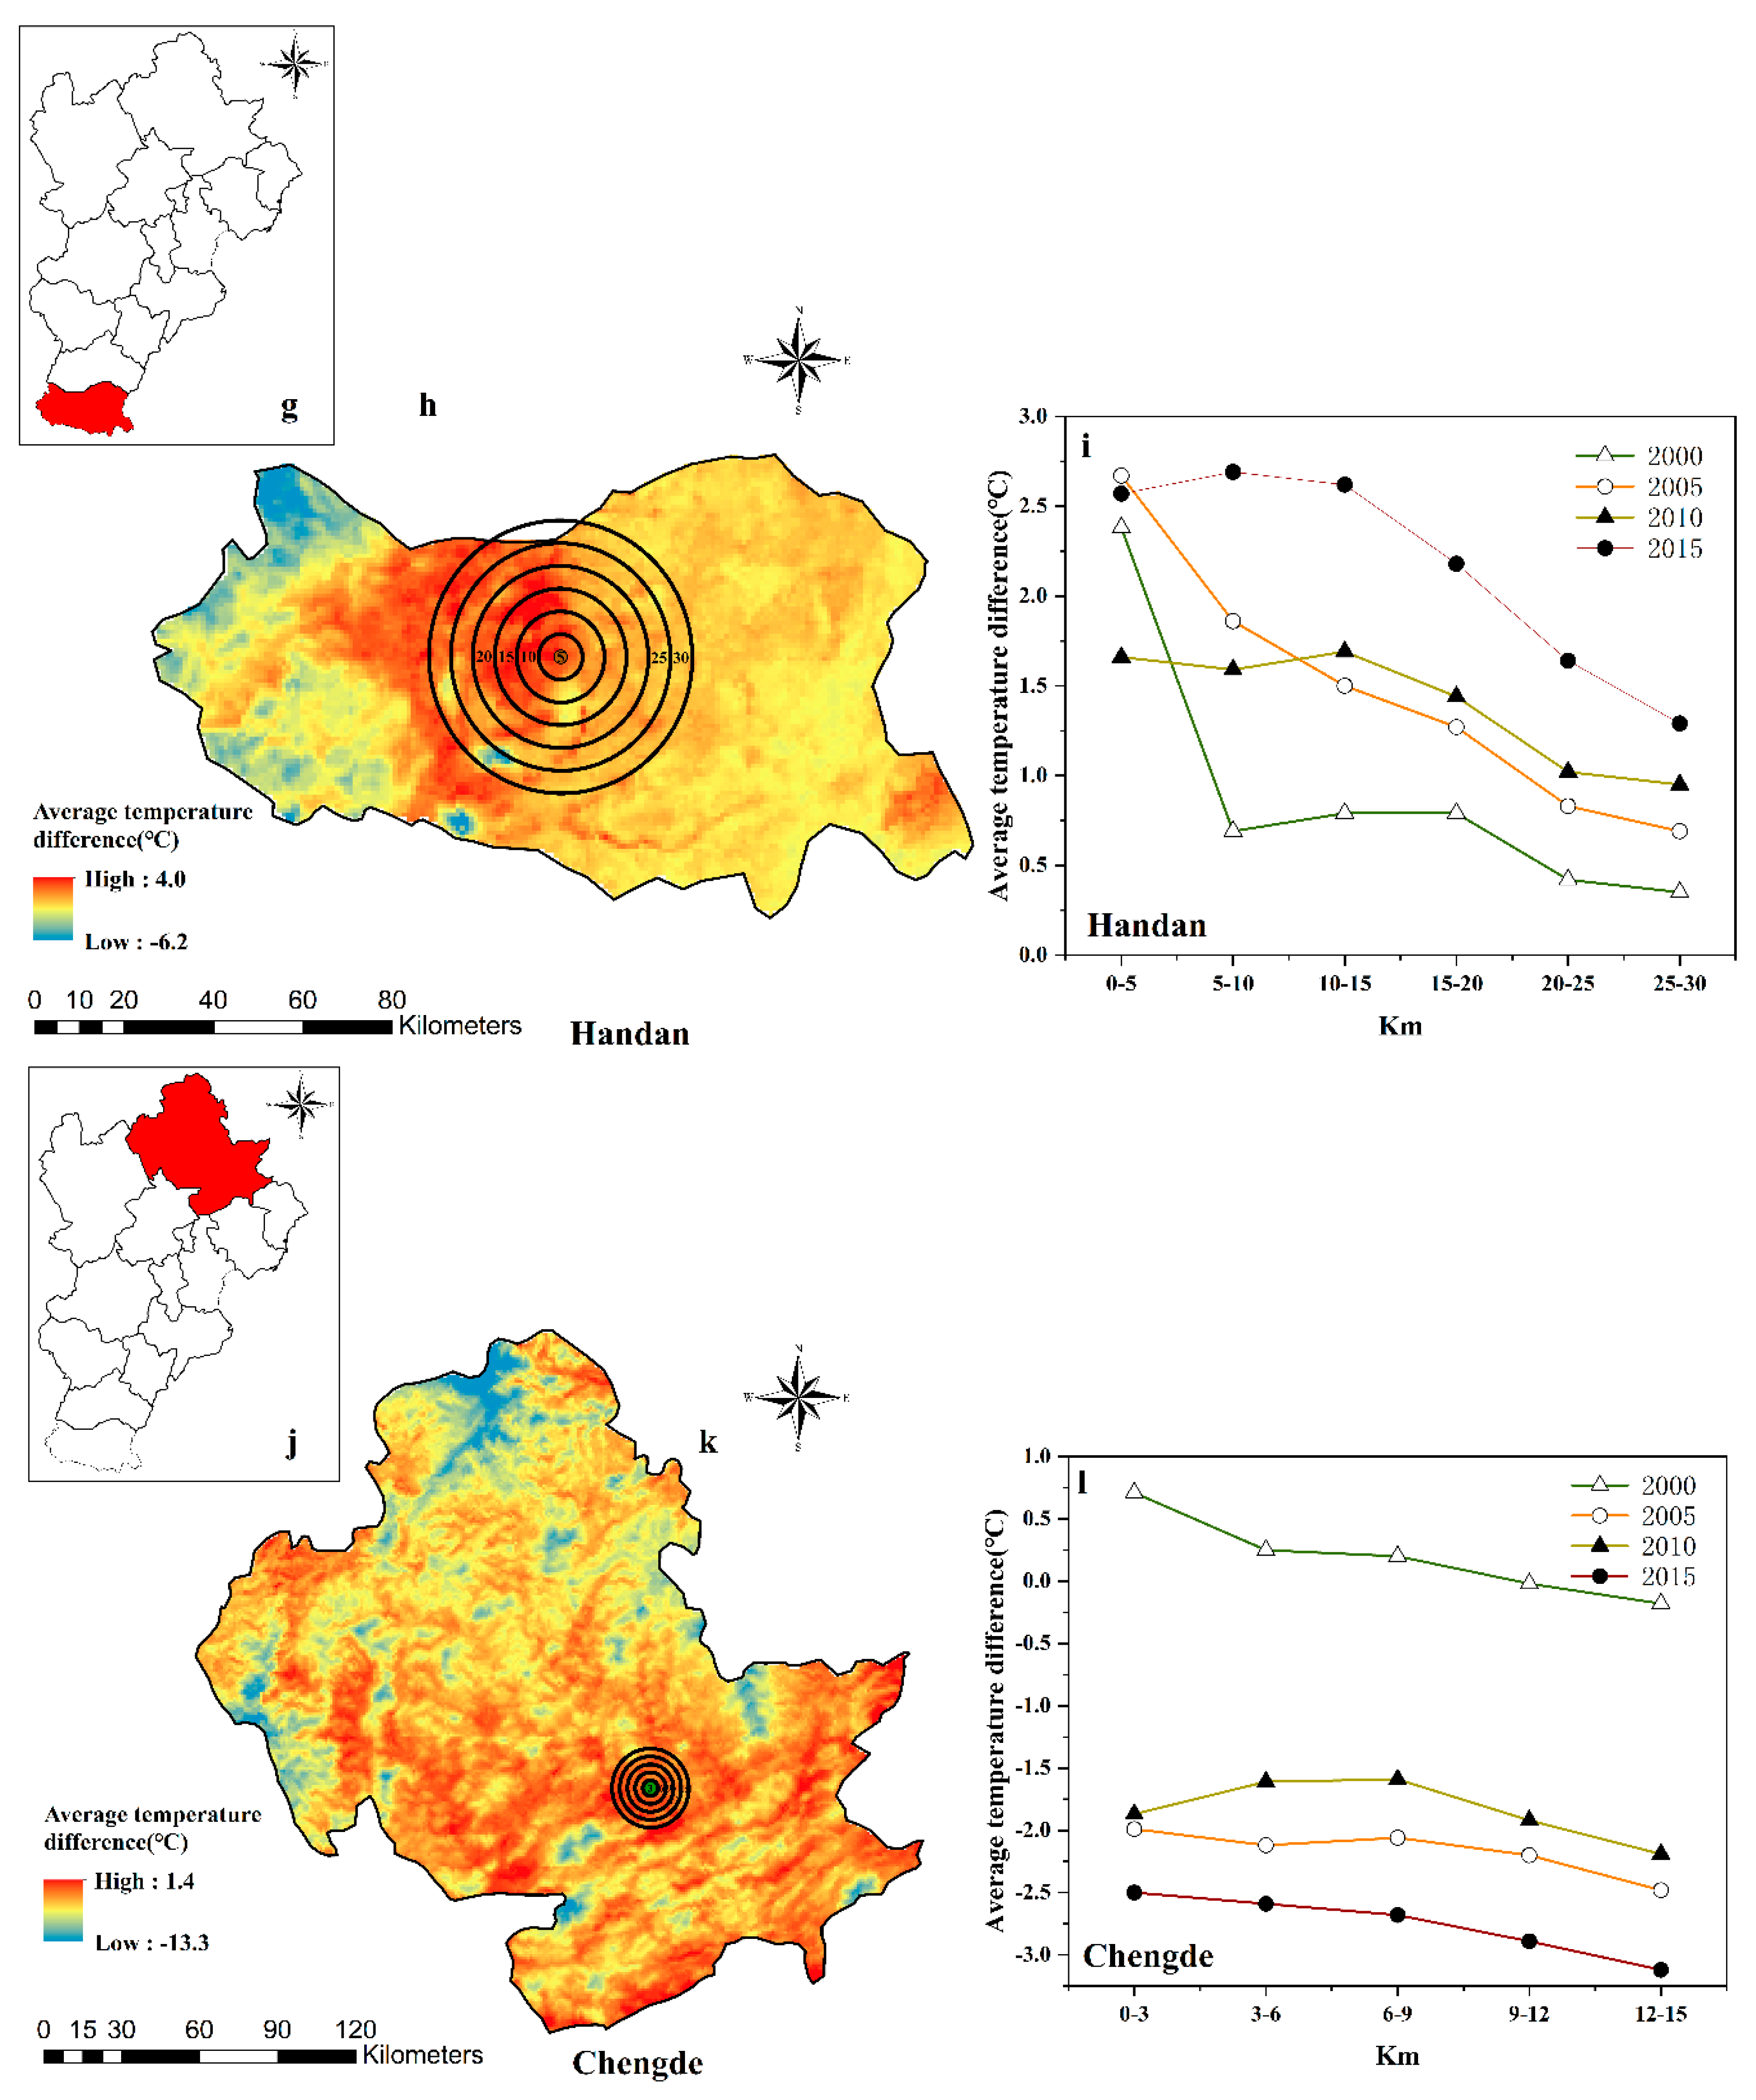
3.3. Spatiotemporal Variation of Temperature Difference of Typical Cities

To further analyze the spatial variation of temperature differences based on comparative values, Beijing, Tianjin, Handan, and Chengde were selected as typical cities to analyze the variation of average temperature difference with distance from the city center (Figure 5a,d,g,j). Based on Equation (2), the annual temperature difference was obtained, the average temperature difference of 2000, 2005, 2010, and 2015 of the four cities was calculated, and the results are shown in the left panels of Figure 5. The radius from the city center to the edge of urban land of Beijing, Tianjin, Handan, and Chengde was nearly 20 km, 15 km, 8 km, and 5 km, respectively. The range of circles of each city was determined as follows: Six circles in Beijing with 10 km distance each, six circles in Tianjin with 5 km distance, six circles in Handan with 5 km distance, and five circles in Chengde with 3 km distance (Figure 5b,e,h,k). The average temperature difference of a circle was calculated by Equation (3). The average temperature difference of each circle of the four cities in 2000, 2005, 2010, and 2015 are shown in the right panel of Figure 5 (Figure 5c,f,i,l). The x-axis refers to the distance of each circle from the city center, and the y-axis refers to the average temperature difference of each circle. Because the outermost circle of Beijing includes a high proportion of grassland and forest in the mountains of the northwest, the average temperature was below that of rural residential areas, so the average temperature difference was negative (Supplementary Figure S4). Similar to Beijing, the outer three circles of Tianjin include water, and circles of Chengde are almost covered with forest and grassland, which resulted in negative temperature differences.
The intensity and variation of the heat island effect in different circles are reflected by the temperature difference; generally, a greater value indicates a more obvious UHI effect in the circle. Comparing the value of each circle, the average temperature difference obviously decreased with the distance from the city center of Beijing. According to the SUHI classification in Table 2, the 20 km radius from the center of Beijing is almost in the range of the MUHI effect from 2005 to 2015. From the perspective of an annual change, the results show that the temperature difference of each circle was greater in 2005 than in 2000. However, the temperature difference in 2010 showed a decreasing trend, which was lower than that in 2005, and circles exceeding 30km from the city center were lower than in 2000. The average temperature difference of each circle of Beijing in 2015 increased significantly, exceeding that in 2000, 2005, and 2010. Moreover, the inter-annual change trend was 2015 > 2005 > 2010 > 2000 within 40 km, and the variation range of temperature difference was larger than that 40 km away, which shows that the heat island effect became stronger in the area near the city center from 2000 to 2015.
The temperature differences along the circles in Tianjin show a decreasing trend with distance from the city center. The trend of temperature difference of the circle within 5 km was 2000 > 2015 > 2005 > 2010; within 5–10 km it was 2015 > 2005 > 2010 > 2000; and 10 km away it was 2015 > 2010 > 2005 > 2000. The variation of temperature difference of circles within 0–15 km of Handan fluctuated. It was higher in the 5–10 km and 10–15 km circles in 2000, 2010, and 2015 than in the circle near the city center, indicating that this area had higher temperatures and a more obvious heat island effect. The temperature difference of circles exceeding 15 km decreased, and the interannual variation trend was 2015 > 2010 > 2005 > 2000. There was no obvious heat island effect in Chengde. Except for 2000, the average temperature difference of each circle was below 0 degree in Chengde—but it was basically in line with the trend of the highest temperature in the city center and decreasing outward. The temperature difference trend compared with rural residential areas was 2015 > 2005 > 2010 > 2000, showing a colder trend.

4. Discussion

Based on the results of urban expansion and SUHI intensity using the land-use data and surface temperature to explore surface temperature change with the change of land-use type, Beijing showed the most obvious change in the study area. The land-use cover of Beijing in 2015 is shown in Figure 6a, and the average surface temperature is shown in Figure 6b; the change of land-use types and the average temperature of each circle is shown in Figure 6c. The average surface temperature in Figure 6b was calculated by the base data of the annual average surface temperature of 2000, 2005, 2010, and 2015. The average temperature of each circle of the y-axis of Figure 6c was calculated using pixel values in Figure 6b. According to the proportion of land-use type in different circles (Figure 6a), the x-axis of Figure 6c was defined as central areas within 20 km, expanded areas within 20–30 km, rural residential areas within 30–40 km, and suburbs within 40–60 km. Extending from central areas to suburbs, the mean surface temperature decreased from 21.72 °C to 18.5 °C, and there is an obvious difference between the two areas. Central areas face a greater UHI effect and the possibility of heatwaves occurring. The increased UHI effect will bring more risks to social and economic losses with high population density and dense commercial activities in central areas, so that is the key area to promote the mitigation of the effect. The UHI effect in expanding areas is expected to be lower; however, affected by population increase and urban construction, the temperature difference between expanding and central areas gradually decreases, and it is important to prevent intensification of the heat island effect in expanding areas. Suburbs usually have more vegetation coverage, which plays an important role in urban ecosystem maintenance and mitigation of the heat island effect.
Population and economic development intensity are relatively high in central areas. Studies have shown that population and economic activity lead to anthropogenic heating, and the heat island effect is usually strongest in central urban areas [73]. Continuous heating brings serious risks to the health of residents and economic development [24,74]. The high temperature in summer leads to diseases in the elderly and children [75,76,77]. Cooling equipment is constantly added to overcome the high-temperature environment, which increases the cost of economic operation. Developing adaptation strategies for UHI and climate change to improve the resilience of cities has been considered as the future direction of city planning. Relevant studies have proposed mitigation strategies for the UHI effect based on quantitative comparisons of the temperature with and without cooling measures. From the results of studies in cities listed in Table 3, the common view is that special materials used in buildings to increase albedo and adding green spaces and wetlands in cities are effective ways to reduce temperature or save energy [78,79,80,81,82,83,84,85,86,87]. Combined with the results of SUHI in Section 3.2 and Beijing UHI showing a significant temperature decrease in vegetation areas, green space is an accepted mitigation strategy, but the focus differs in different areas in cities.
The results of SUHI show that different degrees of the UHI effect exist in central areas of cities in the BTH region. However, the heat island effect in Chengde is not obvious, due to the low average temperature caused by natural factors, such as land-use cover and elevation, most cities in the region show different degrees of heat island effect. Central areas usually have dense population and buildings, and there are problems with old buildings and narrow blocks. Referring to studies on mitigating the UHI effect in London, Seoul, and Nagoya, small gardens and small wooded green spaces can reduce the temperature in the area effectively, and are appropriate even in parking lots in central areas that do not have large areas for increased green spaces [78,85,86]. Moreover, for dense and old buildings, it is recommended to change black to white roofs to increase the albedo, or green roofs to reduce the absorbed solar energy, and then reduce indoor temperature [80,83,84]. Simultaneously, referring to Tokyo, recycling water resources is a simple and economical way to reduce road surface temperature [81]. For expanding areas, although the UHI effect is weaker than in central areas, with the acceleration of urban construction, the improvement of infrastructure, the migration of population, and the settlement of enterprises, the temperature will rise with additional economic activities. Different from central areas, expanding areas should take mitigation measures against rising temperatures as an indispensable part of planning. For example, planning can restrict approval to the development of urban land, formulate environmental and energy-saving standards for buildings, and allocate green, residential, industrial, and commercial land reasonably to reduce the impact of human activities. Suburbs are green barriers to urban areas and the main areas for eco-tourism development. Although there is no obvious UHI effect in the suburbs, measures of preventing ecological damage are necessary to maintain their important role in the mitigation of climate change.
Mitigating the UHI effect and reducing the occurrence of extreme weather, such as high temperature and heatwaves, mainly depends on controlling human activities. Promoting a reasonable urbanization mode is the main solution. Transferring from scale development to people-oriented urbanization mode [88,89,90], setting up different dimensions of planning from the community to the city level, and guiding the green consumption mode to reduce residential energy consumption and economic growth is the direction of future planning for improving adaptability to climate change.

5. Conclusions

With combined land-use and surface temperature data, we analyzed the spatiotemporal characteristics of urban land expansion and the heat island effect in the BTH urban agglomeration. There was an obvious increase in urban land around the central area during the 2000–2015 period. Compared with the built-up land, the average temperature of the central area was higher than that of expanding and rural areas, but the temperature difference between expanding and central areas obviously narrowed. The intensity of SUHI showed significant spatial change patterns. SUHI in Beijing was the largest, and the temperature differences decreased with the extension outward from the center. The intensity of SUHI in the junction of Langfang, Cangzhou, and Tianjin showed a decreasing trend compared to 2000. Intense SUHI occurred in the southern part of the BTH region, but the areas narrowed to Handan in 2015. The average temperature difference between the circles of Beijing, Tianjin, and Chengde decreased outward from the central area. With the expansion of urban areas, the UHI effect became more obvious in the central area. Based on the results and existing research, cool roofs, green spaces, and wetlands are recognized as some of the effective measures to reduce the temperature. However, for city planning, central areas, expanding areas, and suburbs need specific and suitable mitigation measures to improve their resilience to the UHI effect.
Comparing the existing studies, this study not only provides results of SUHI of the region, but also reflects the spatiotemporal variation characteristics of urban expansion and the UHI effect of cities at different development levels. For city planning, this study emphasizes the spatial circles of cities when analyzing the urban heat island effect through the division of central areas, expanding areas, and suburbs, which provides an important perspective for policymakers and planners to pay attention to specific planning in different spatial areas to improve the sustainability, and resilience of the whole city. There are also limitations existing in this study for the lack of quantitative analysis of mitigation measures for the UHI effect, and the resolution of data needs to be improved. The inclusion of a quantitative analysis of one measure in a future study would be worthwhile. In addition, although we investigated the urban expansion has an obvious effect on LST, the corresponding relation will be more clearly to show the effects of urban expansion on LST. Therefore, future work on establishing a quantitative evaluation model for the effects of urban expansion on LST is recommended.

Supplementary Materials

The following are available online at https://www.mdpi.com/2072-4292/12/21/3491/s1, Table S1: Classification system of land use from RESDC, CAS; Table S2: Temperature difference of each part based on Formula (2); Figure S1: Average surface temperature during the period 2000-2015 of Beijing-Tianjin-Hebei region; Figure S2: Areas of lands that transferred to farmland, forest, grassland, water, built-up land and unused land; Figure S3. Spatial distribution of lands that transferred to farmland, forest, grassland, water, built-up land, and unused land.

Author Contributions

M.C. supervised conceptualization, designed the research framework, wrote part of the contents, and read and approved the final manuscript. Y.Z. (Yuan Zhou) prepared the original draft and processed the data. M.H. provided the data, processed the data, wrote part of contents, and read and approved the final manuscript. Y.Z. (Yaliu Zhou) wrote part of the contents. The insightful and constructive comments of anonymous reviewers are appreciated. All authors have read and agreed to the published version of the manuscript.

Funding

This research (include APC) was funded by National Natural Science Foundation of China, grant number 41822104, 41671125 and 41930651; the Chinese Academy of Sciences Basic Frontier Science Research Program from 0 to 1 Original Innovation Project, grant number ZDBS-LYDQC005; the Strategic Priority Research Program of the Chinese Academy of Sciences, grant number XDA23100301; the Youth Innovation Promotion Association of the Chinese Academy of Science, grant number 2017072.

Acknowledgments

The insightful and constructive comments of anonymous reviewers are appreciated.

Conflicts of Interest

The authors declare no competing financial interest.

References

  1. Lambin, E.F.; Meyfroidt, P. Global land use change, economic globalization, and the looming land scarcity. Proc. Natl. Acad. Sci. USA 2011, 108, 3465–3472. [Google Scholar] [CrossRef] [PubMed] [Green Version]
  2. Seto, K.C.; Guneralp, B.; Hutyra, L.R. Global forecasts of urban expansion to 2030 and direct impacts on biodiversity and carbon pools. Proc. Natl. Acad. Sci. USA 2012, 109, 16083–16088. [Google Scholar] [CrossRef] [PubMed] [Green Version]
  3. DESA, UN. World Urbanization Prospects: The 2018 Revision; United Nations: New York, NY, USA, 2019. [Google Scholar]
  4. Abubakar, I.R.; Aina, Y.A. The prospects and challenges of developing more inclusive, safe, resilient and sustainable cities in Nigeria. Land Use Policy 2019, 87, 104105. [Google Scholar] [CrossRef]
  5. Wang, X.; Shi, R.; Zhou, Y. Dynamics of urban sprawl and sustainable development in China. Socio-Econ. Plan. Sci. 2020, 70, 100736. [Google Scholar] [CrossRef]
  6. UN-Habitat. Annua Progress Report 2019; UN-Habitat: Nairobi, Kenya, 2020. [Google Scholar]
  7. Pfleiderer, P.; Schleussner, C.-F.; Kornhuber, K.; Coumou, D. Summer weather becomes more persistent in a 2 °C world. Nat. Clim. Chang. 2019, 9, 666–671. [Google Scholar] [CrossRef]
  8. Seto, K.C.; Fragkias, M.; Guneralp, B.; Reilly, M.K. A meta-analysis of global urban land expansion. PLoS ONE 2011, 6, e23777. [Google Scholar] [CrossRef]
  9. Li, X.; Zhou, W.; Ouyang, Z. Forty years of urban expansion in Beijing: What is the relative importance of physical, socioeconomic, and neighborhood factors? Appl. Geogr. 2013, 38, 1–10. [Google Scholar] [CrossRef]
  10. Gao, J.; Wei, Y.D.; Chen, W.; Chen, J. Economic transition and urban land expansion in Provincial China. Habitat Int. 2014, 44, 461–473. [Google Scholar] [CrossRef]
  11. Deng, X.; Huang, J.; Rozelle, S.; Uchida, E. Growth, population and industrialization, and urban land expansion of China. J. Urban Econ. 2008, 63, 96–115. [Google Scholar] [CrossRef]
  12. Li, J.; Song, C.; Cao, L.; Zhu, F.; Meng, X.; Wu, J. Impacts of landscape structure on surface urban heat islands: A case study of Shanghai, China. Remote Sens. Environ. 2011, 115, 3249–3263. [Google Scholar] [CrossRef]
  13. Zhou, W.; Huang, G.; Cadenasso, M.L. Does spatial configuration matter? Understanding the effects of land cover pattern on land surface temperature in urban landscapes. Landsc. Urban Plan. 2011, 102, 54–63. [Google Scholar] [CrossRef]
  14. Piringer, M.; Grimmond, C.S.B.; Joffre, S.M.; Mestayer, P.; Middleton, D.R.; Rotach, M.W.; Baklanov, A.; De Ridder, K.; Ferreira, J.; Guilloteau, E.; et al. Investigating the Surface Energy Balance in Urban Areas—Recent Advances and Future Needs. Water Air Soil Pollut. Focus 2002, 2, 1–16. [Google Scholar] [CrossRef]
  15. Piringer, M.; Joffre, S.; Baklanov, A.; Christen, A.; Deserti, M.; De Ridder, K.; Emeis, S.; Mestayer, P.; Tombrou, M.; Middleton, D.; et al. The surface energy balance and the mixing height in urban areas—Activities and recommendations of COST-Action 715. Boundary-Layer Meteorol. 2007, 124, 3–24. [Google Scholar] [CrossRef]
  16. Zhang, H.; Qi, Z.-F.; Ye, X.-Y.; Cai, Y.-B.; Ma, W.-C.; Chen, M.-N. Analysis of land use/land cover change, population shift, and their effects on spatiotemporal patterns of urban heat islands in metropolitan Shanghai, China. Appl. Geogr. 2013, 44, 121–133. [Google Scholar] [CrossRef]
  17. Fu, P.; Weng, Q. A time series analysis of urbanization induced land use and land cover change and its impact on land surface temperature with Landsat imagery. Remote Sens. Environ. 2016, 175, 205–214. [Google Scholar] [CrossRef]
  18. Peng, J.; Xie, P.; Liu, Y.; Ma, J. Urban thermal environment dynamics and associated landscape pattern factors: A case study in the Beijing metropolitan region. Remote Sens. Environ. 2016, 173, 145–155. [Google Scholar] [CrossRef]
  19. Debbage, N.; Shepherd, J.M. The urban heat island effect and city contiguity. Comput. Environ. Urban Syst. 2015, 54, 181–194. [Google Scholar] [CrossRef]
  20. Tran, D.X.; Pla, F.; Latorre-Carmona, P.; Myint, S.W.; Caetano, M.; Kieu, H.V. Characterizing the relationship between land use land cover change and land surface temperature. ISPRS J. Photogram. Remote Sens. 2017, 124, 119–132. [Google Scholar] [CrossRef] [Green Version]
  21. Argüeso, D.; Evans, J.P.; Fita, L.; Bormann, K.J. Temperature response to future urbanization and climate change. Clim. Dyn. 2013, 42, 2183–2199. [Google Scholar] [CrossRef]
  22. Nurwanda, A.; Honjo, T. Analysis of Land Use Change and Expansion of Surface Urban Heat Island in Bogor City by Remote Sensing. ISPRS Int. J. Geo-Inf. 2018, 7, 165. [Google Scholar] [CrossRef] [Green Version]
  23. Mora, C.; Spirandelli, D.; Franklin, E.C.; Lynham, J.; Kantar, M.B.; Miles, W.; Smith, C.Z.; Freel, K.; Moy, J.; Louis, L.V.; et al. Broad threat to humanity from cumulative climate hazards intensified by greenhouse gas emissions. Nat. Clim. Chang. 2018, 8, 1062–1071. [Google Scholar] [CrossRef]
  24. Tan, J.; Zheng, Y.; Tang, X.; Guo, C.; Li, L.; Song, G.; Zhen, X.; Yuan, D.; Kalkstein, A.J.; Li, F. The urban heat island and its impact on heat waves and human health in Shanghai. Int. J. Biometeorol. 2010, 54, 75–84. [Google Scholar] [CrossRef]
  25. United Nations. The Sustainable Development Goals Report 2020; United Nations: New York, NY, USA, 2020. [Google Scholar]
  26. Tran, H.; Uchihama, D.; Ochi, S.; Yasuoka, Y. Assessment with satellite data of the urban heat island effects in Asian mega cities. Int. J. Appl. Earth Observ. Geoinf. 2006, 8, 34–48. [Google Scholar] [CrossRef]
  27. Hart, M.A.; Sailor, D.J. Quantifying the influence of land-use and surface characteristics on spatial variability in the urban heat island. Theor. Appl. Climatol. 2008, 95, 397–406. [Google Scholar] [CrossRef]
  28. He, J.F.; Liu, J.Y.; Zhuang, D.F.; Zhang, W.; Liu, M.L. Assessing the effect of land use/land cover change on the change of urban heat island intensity. Theor. Appl. Climatol. 2007, 90, 217–226. [Google Scholar] [CrossRef]
  29. Kardinal Jusuf, S.; Wong, N.H.; Hagen, E.; Anggoro, R.; Hong, Y. The influence of land use on the urban heat island in Singapore. Habitat Int. 2007, 31, 232–242. [Google Scholar] [CrossRef]
  30. Chen, X.-L.; Zhao, H.-M.; Li, P.-X.; Yin, Z.-Y. Remote sensing image-based analysis of the relationship between urban heat island and land use/cover changes. Remote Sens. Environ. 2006, 104, 133–146. [Google Scholar] [CrossRef]
  31. Xu, H.; Ding, F.; Wen, X. Urban Expansion and Heat Island Dynamics in the Quanzhou Region, China. IEEE J. Sel. Top. Appl. Earth Observ. Remote Sens. 2009, 2, 74–79. [Google Scholar] [CrossRef]
  32. Su, W.; Gu, C.; Yang, G. Assessing the Impact of Land Use/Land Cover on Urban Heat Island Pattern in Nanjing City, China. J. Urban Plan. Dev. 2010, 136, 365–372. [Google Scholar] [CrossRef]
  33. Thanh Hoan, N.; Liou, Y.-A.; Nguyen, K.-A.; Sharma, R.; Tran, D.-P.; Liou, C.-L.; Cham, D. Assessing the Effects of Land-Use Types in Surface Urban Heat Islands for Developing Comfortable Living in Hanoi City. Remote Sens. 2018, 10, 1965. [Google Scholar] [CrossRef] [Green Version]
  34. Tu, L.; Qin, Z.; Li, W.; Geng, J.; Yang, L.; Zhao, S.; Zhan, W.; Wang, F. Surface urban heat island effect and its relationship with urban expansion in Nanjing, China. J. Appl. Remote Sens. 2016, 10, 026037. [Google Scholar] [CrossRef] [Green Version]
  35. Zullo, F.; Fazio, G.; Romano, B.; Marucci, A.; Fiorini, L. Effects of urban growth spatial pattern (UGSP) on the land surface temperature (LST): A study in the Po Valley (Italy). Sci. Total Environ. 2019, 650, 1740–1751. [Google Scholar] [CrossRef] [PubMed]
  36. Rinner, C.; Hussain, M. Toronto’s Urban Heat Island—Exploring the Relationship between Land Use and Surface Temperature. Remote Sens. 2011, 3, 1251–1265. [Google Scholar] [CrossRef] [Green Version]
  37. Sheng, L.; Lu, D.; Huang, J. Impacts of land-cover types on an urban heat island in Hangzhou, China. Int. J. Remote Sens. 2015, 36, 1584–1603. [Google Scholar] [CrossRef]
  38. Zhan, J.; Huang, J.; Zhao, T.; Geng, X.; Xiong, Y. Modeling the Impacts of Urbanization on Regional Climate Change: A Case Study in the Beijing-Tianjin-Tangshan Metropolitan Area. Adv. Meteorol. 2013, 2013, 849479. [Google Scholar] [CrossRef] [Green Version]
  39. Gao, Z.; Hou, Y.; Chen, W. Enhanced sensitivity of the urban heat island effect to summer temperatures induced by urban expansion. Environ. Res. Lett. 2019, 14, 094005. [Google Scholar] [CrossRef] [Green Version]
  40. Shi, Y.; Katzschner, L.; Ng, E. Modelling the fine-scale spatiotemporal pattern of urban heat island effect using land use regression approach in a megacity. Sci. Total Environ. 2018, 618, 891–904. [Google Scholar] [CrossRef]
  41. Hu, Y.; Jia, G. Influence of land use change on urban heat island derived from multi-sensor data. Int. J. Climatol. 2010, 30, 1382–1395. [Google Scholar] [CrossRef]
  42. Oke, T.R. City size and the urban heat island. Atmos. Environ. Pergamon Press 1973, 7, 769–779. [Google Scholar] [CrossRef]
  43. Qiao, Z.; Tian, G.; Zhang, L.; Xu, X. Influences of Urban Expansion on Urban Heat Island in Beijing during 1989–2010. Adv. Meteorol. 2014, 2014, 187169. [Google Scholar] [CrossRef] [Green Version]
  44. Lemonsu, A.; Viguié, V.; Daniel, M.; Masson, V. Vulnerability to heat waves: Impact of urban expansion scenarios on urban heat island and heat stress in Paris (France). Urban Clim. 2015, 14, 586–605. [Google Scholar] [CrossRef]
  45. Tan, M.; Li, X. Quantifying the effects of settlement size on urban heat islands in fairly uniform geographic areas. Habitat Int. 2015, 49, 100–106. [Google Scholar] [CrossRef]
  46. Li, X.; Zhou, Y.; Asrar, G.R.; Imhoff, M.; Li, X. The surface urban heat island response to urban expansion: A panel analysis for the conterminous United States. Sci. Total Environ. 2017, 605–606, 426–435. [Google Scholar] [CrossRef]
  47. Stone, B.; Rodgers, M.O. Urban Form and Thermal Efficiency:How the Design of Cities Influences the Urban Heat Island Effect. J. Am. Plan. Assoc. 2001, 67, 186–198. [Google Scholar] [CrossRef]
  48. Zhao, M.; Cai, H.; Qiao, Z.; Xu, X. Influence of urban expansion on the urban heat island effect in Shanghai. Int. J. Geogr. Inf. Sci. 2016, 30, 2421–2441. [Google Scholar] [CrossRef]
  49. Zhou, B.; Rybski, D.; Kropp, J.P. The role of city size and urban form in the surface urban heat island. Sci. Rep. 2017, 7, 4791. [Google Scholar] [CrossRef] [PubMed]
  50. Zhou, X.; Chen, H. Impact of urbanization-related land use land cover changes and urban morphology changes on the urban heat island phenomenon. Sci. Total Environ. 2018, 635, 1467–1476. [Google Scholar] [CrossRef]
  51. Oke, T.R. The energetic basis of the urban heat island. Q. J. Royal Meteorol. Soc. 1982, 108, 1–24. [Google Scholar] [CrossRef]
  52. Paranunzio, R.; Ceola, S.; Laio, F.; Montanari, A. Evaluating the Effects of Urbanization Evolution on Air Temperature Trends Using Nightlight Satellite Data. Atmosphere 2019, 10, 117. [Google Scholar] [CrossRef] [Green Version]
  53. Coutts, A.M.; Beringer, J.; Tapper, N.J. Investigating the climatic impact of urban planning strategies through the use of regional climate modelling: A case study for Melbourne, Australia. Int. J. Climatol. 2008, 28, 1943–1957. [Google Scholar] [CrossRef]
  54. Walter, A.; Brienen, S.; Früh, B.; Trusilova, K.; Masson, V.; Pigeon, G.; Becker, P. Implementation of an Urban Parameterization Scheme into the Regional Climate Model COSMO-CLM. J. Appl. Meteorol. Climatol. 2013, 52, 2296–2311. [Google Scholar] [CrossRef]
  55. Lin, Y.; Liu, A.; Ma, E.; Li, X.; Shi, Q. Impacts of Future Urban Expansion on Regional Climate in the Northeast Megalopolis, USA. Adv. Meteorol. 2013, 2013, 362925. [Google Scholar] [CrossRef]
  56. Zhang, H.; Hanaki, K.; Sato, N.; Aramaki, T. Use of modified RAMS to simulate current and near future thermal Environment of ChongQing, China. In Proceedings of the 86th AMS Annual Meeting, Atlanta, Georgia, 31 January 2006; pp. 8–10. [Google Scholar]
  57. Chen, H.; Zhang, Y. Sensitivity experiments of impacts of large-scale urbanization in East China on East Asian winter monsoon. Chin. Sci. Bullet. 2012, 58, 809–815. [Google Scholar] [CrossRef] [Green Version]
  58. Wang, J.; Huang, B.; Fu, D.; Atkinson, P.M.; Zhang, X. Response of urban heat island to future urban expansion over the Beijing–Tianjin–Hebei metropolitan area. Appl. Geogr. 2016, 70, 26–36. [Google Scholar] [CrossRef]
  59. Dai, Z.; Guldmann, J.-M.; Hu, Y. Spatial regression models of park and land-use impacts on the urban heat island in central Beijing. Sci. Total Environ. 2018, 626, 1136–1147. [Google Scholar] [CrossRef]
  60. Sun, R.; Chen, L. How can urban water bodies be designed for climate adaptation? Landsc. Urban Plan. 2012, 105, 27–33. [Google Scholar] [CrossRef]
  61. Sun, R.; Chen, A.; Chen, L.; Lü, Y. Cooling effects of wetlands in an urban region: The case of Beijing. Ecol. Indic. 2012, 20, 57–64. [Google Scholar] [CrossRef]
  62. Zhang, X.; Zhong, T.; Feng, X.; Wang, K. Estimation of the relationship between vegetation patches and urban land surface temperature with remote sensing. Int. J. Remote Sens. 2009, 30, 2105–2118. [Google Scholar] [CrossRef]
  63. Streutker, D. Satellite-measured growth of the urban heat island of Houston, Texas. Remote Sens. Environ. 2003, 85, 282–289. [Google Scholar] [CrossRef]
  64. Zhou, W.; Qian, Y.; Li, X.; Li, W.; Han, L. Relationships between land cover and the surface urban heat island: Seasonal variability and effects of spatial and thematic resolution of land cover data on predicting land surface temperatures. Landsc. Ecol. 2013, 29, 153–167. [Google Scholar] [CrossRef]
  65. Bokaie, M.; Zarkesh, M.K.; Arasteh, P.D.; Hosseini, A. Assessment of Urban Heat Island based on the relationship between land surface temperature and Land Use/ Land Cover in Tehran. Sustain. Cities Soc. 2016, 23, 94–104. [Google Scholar] [CrossRef]
  66. Estoque, R.C.; Murayama, Y.; Myint, S.W. Effects of landscape composition and pattern on land surface temperature: An urban heat island study in the megacities of Southeast Asia. Sci. Total Environ. 2017, 577, 349–359. [Google Scholar] [CrossRef] [PubMed]
  67. Masson, V.; Lion, Y.; Peter, A.; Pigeon, G.; Buyck, J.; Brun, E. “Grand Paris”: Regional landscape change to adapt city to climate warming. Clim. Chang. 2012, 117, 769–782. [Google Scholar] [CrossRef] [Green Version]
  68. Ali, J.M.; Marsh, S.H.; Smith, M.J. A comparison between London and Baghdad surface urban heat islands and possible engineering mitigation solutions. Sustain. Cities Soc. 2017, 29, 159–168. [Google Scholar] [CrossRef] [Green Version]
  69. Wan, Z.; Zhang, Y.; Zhang, Q.; Li, Z.L. Quality assessment and validation of the MODIS global land surface temperature. Int. J. Remote Sens. 2004, 25, 261–274. [Google Scholar] [CrossRef]
  70. Burdun, I.; Sagris, V.; Mander, Ü. Relationships between field-measured hydrometeorological variables and satellite-based land surface temperature in a hemiboreal raised bog. Int. J. Appl. Earth Observ. Geoinf. 2019, 74, 295–301. [Google Scholar] [CrossRef]
  71. Liu, Y.; Fang, X.; Xu, Y.; Zhang, S.; Luan, Q. Assessment of surface urban heat island across China’s three main urban agglomerations. Theor. Appl. Climatol. 2018, 133, 473–488. [Google Scholar] [CrossRef]
  72. Lu, L.; Weng, Q.; Xiao, D.; Guo, H.; Li, Q.; Hui, W. Spatiotemporal Variation of Surface Urban Heat Islands in Relation to Land Cover Composition and Configuration: A Multi-Scale Case Study of Xi’an, China. Remote Sens. 2020, 12, 2713. [Google Scholar] [CrossRef]
  73. Liu, Z.; Anderson, B.; Yan, K.; Dong, W.; Liao, H.; Shi, P. Global and regional changes in exposure to extreme heat and the relative contributions of climate and population change. Sci. Rep. 2017, 7, 43909. [Google Scholar] [CrossRef]
  74. Zander, K.K.; Botzen, W.J.W.; Oppermann, E.; Kjellstrom, T.; Garnett, S.T. Heat stress causes substantial labour productivity loss in Australia. Nat. Clim. Chang. 2015, 5, 647–651. [Google Scholar] [CrossRef]
  75. Xu, Z.; Liu, Y.; Ma, Z.; Toloo, G.; Hu, W.; Tong, S. Assessment of the temperature effect on childhood diarrhea using satellite imagery. Sci. Rep. 2014, 4, 5389. [Google Scholar] [CrossRef] [PubMed] [Green Version]
  76. Liss, A.; Wu, R.; Chui, K.K.H.; Naumova, E.N. Heat-Related Hospitalizations in Older Adults: An Amplified Effect of the First Seasonal Heatwave. Sci. Rep. 2017, 7, 39581. [Google Scholar] [CrossRef] [PubMed]
  77. Wang, M.; Yan, X.; Liu, J.; Zhang, X. The contribution of urbanization to recent extreme heat events and a potential mitigation strategy in the Beijing–Tianjin–Hebei metropolitan area. Theor. Appl. Climatol. 2013, 114, 407–416. [Google Scholar] [CrossRef]
  78. Doick, K.J.; Peace, A.; Hutchings, T.R. The role of one large greenspace in mitigating London’s nocturnal urban heat island. Sci. Total Environ. 2014, 493, 662–671. [Google Scholar] [CrossRef] [PubMed]
  79. Oliveira, S.; Andrade, H.; Vaz, T. The cooling effect of green spaces as a contribution to the mitigation of urban heat: A case study in Lisbon. Build. Environ. 2011, 46, 2186–2194. [Google Scholar] [CrossRef]
  80. Wang, Y.; Berardi, U.; Akbari, H. Comparing the effects of urban heat island mitigation strategies for Toronto, Canada. Energy Build. 2016, 114, 2–19. [Google Scholar] [CrossRef]
  81. Yamagata, H.; Nasu, M.; Yoshizawa, M.; Miyamoto, A.; Minamiyama, M. Heat island mitigation using water retentive pavement sprinkled with reclaimed wastewater. Water Sci. Technol. 2008, 57, 763–771. [Google Scholar] [CrossRef]
  82. Amani-Beni, M.; Zhang, B.; Xie, G.-d.; Xu, J. Impact of urban park’s tree, grass and waterbody on microclimate in hot summer days: A case study of Olympic Park in Beijing, China. Urban For. Urban Green. 2018, 32, 1–6. [Google Scholar] [CrossRef]
  83. Susca, T.; Gaffin, S.R.; Dell’osso, G.R. Positive effects of vegetation: Urban heat island and green roofs. Environ. Pollut. 2011, 159, 2119–2126. [Google Scholar] [CrossRef]
  84. Rosenfeld, A.H.; Akbari, H.; Bretz, S.; Fishman, B.L.; Kurn, D.M.; Sailor, D.; Taha, H. Mitigation of urban heat islands: Materials, utility programs, updates. Energy Build. 1995, 22, 255–265. [Google Scholar] [CrossRef]
  85. Park, J.; Kim, J.-H.; Lee, D.K.; Park, C.Y.; Jeong, S.G. The influence of small green space type and structure at the street level on urban heat island mitigation. Urban For. Urban Green. 2017, 21, 203–212. [Google Scholar] [CrossRef]
  86. Onishi, A.; Cao, X.; Ito, T.; Shi, F.; Imura, H. Evaluating the potential for urban heat-island mitigation by greening parking lots. Urban For. Urban Green. 2010, 9, 323–332. [Google Scholar] [CrossRef]
  87. Du, H.; Song, X.; Jiang, H.; Kan, Z.; Wang, Z.; Cai, Y. Research on the cooling island effects of water body: A case study of Shanghai, China. Ecol. Indic. 2016, 67, 31–38. [Google Scholar] [CrossRef]
  88. Chen, M.; Gong, Y.; Lu, D.; Ye, C. Build a people-oriented urbanization: China’s new-type urbanization dream and Anhui model. Land Use Policy 2019, 80, 1–9. [Google Scholar] [CrossRef]
  89. Chen, M.; Liu, W.; Lu, D. Challenges and the way forward in China’s new-type urbanization. Land Use Policy 2016, 55, 334–339. [Google Scholar] [CrossRef]
  90. Chen, M.; Ye, C.; Lu, D.; Sui, Y.; Guo, S. Cognition and construction of the theoretical connotations of new urbanization with Chinese characteristics. J. Geogr. Sci. 2019, 29, 1681–1698. [Google Scholar] [CrossRef] [Green Version]
Figure 1. Beijing–Tianjin–Hebei (BTH) urban agglomeration, with its location in China, shown in red in the left panel; the right panel shows the cities in the region. To further explore surface urban heat island (SUHI), the area was divided into three parts: Beijing, Zhangjiakou, Chengde, and Qinhuangdao in the northern part, shown in green; Tianjin, Langfang, Baoding, Tangshan, and Cangzhou in the central part, shown in blue, Shijiazhuang, Hengshui, Xingtai, and Handan in the southern part, shown in pink.
Remotesensing 12 03491 g001
Figure 2. Land-use and transfer from 2000 to 2015 and an annual average temperature of land-use types. (a) Land-use change comparing 2000 and 2015; unchanged land-use cover, shown in a light color, and land changed to other land-use types, shown in a bright color. (b) Built-up land was divided into four types: Central, expanded, unchanged rural residential, and new rural residential areas, and the average temperature of the four types during 2000–2015 is shown.
Remotesensing 12 03491 g002
Figure 3. Temperature difference between central and expanded areas in 2000, 2005, 2010, and 2015, with values of 2000, 2005, 2010, and 2015 is 0.96, 0.55, 0.40, and 0.25 °C, respectively.
Remotesensing 12 03491 g003
Figure 4. Spatiotemporal variation of SUHI in the BTH region in 2000, 2005, 2010, and 2015. Cold and slight clod refer to cold effect with temperature below comparison value; NHI refers to no heat island effect with a temperature above comparison value within 1 °C; LHI refers to light heat island effect with a temperature above comparison value within 1–2 °C; MHI refers to medium heat island effect with a temperature above comparison value within 2–3 °C; HHI refers to high heat island effect with a temperature above comparison value more than 3 °C.
Remotesensing 12 03491 g004
Figure 5. Temperature differences of different circles of typical cites. (a,d,g,j) Location of typical cities. (b,e,h,k) The average temperature difference and range and numbers of circles in Beijing, Tianjin, Handan, and Chengde, respectively. (c,f,i,l) The average temperature difference of each circle in the four cities in 2000, 2005, 2010, and 2015.
Remotesensing 12 03491 g005aRemotesensing 12 03491 g005b
Figure 6. (a) Land-use of Beijing in 2015. Detail of legend refers to Table S1. (b) Average surface temperature in Beijing during 2000–2015, varying from 9.6 to 22 °C. (c) UHI effect mode based on land-use and surface temperature of Beijing; classification of x-axis based on the circles of (a), the value of y-axis calculated by the circles of (b).
Remotesensing 12 03491 g006aRemotesensing 12 03491 g006b
Table 1. The number of rural residential pixels.
Region2000200520102015
Northern2183227022722334
Central5682572457485826
Southern3855386938863938
Table 2. Standard grades of surface urban heat island (SUHI).
GradeClassification standard of SUHI (°C)Significance
1<−5Cold
2−5–0Slight Cold
30–1NHI
41–2LHI
52–3MHI
6>3HHI
Note: Cold, low-temperature zone; slight cold, slightly low-temperature zone; NHI, no heat island effect; LHI, low heat island effect; MHI, medium heat island effect; HHI, high heat island effect.
Table 3. Adaptation strategies for cities proposed by relevant studies.
Study areaQualitative resultsAdaptation strategy
LondonMean temperature reduction of Kensington Gardens was 1.1 °C in the summer months, and maximum was 4 °C on some nights.Use small wooded green spaces and include wider forms of urban greening, including green roofs and cool pavements [78].
LisbonAverage park cool island (PCI), referring to maximum difference between values inside and outside gardens, varied between 3.9 and 5.7 °C.Green areas are a mitigation measure of the effects of UHI and global warming [79].
TorontoAverage cool roof surface temperature of high-rise and detached areas decreased by 9.6 and 11.3 °C, respectively, on a summer day.Additional cost of cool roofs is low, and they can reduce indoor temperature and building energy consumption [80].
TokyoRode surface temperature is reduced by 8 and 3 °C in the day and night, respectively, by sprinkling reclaimed wastewater.Sprinkling reclaimed wastewater on water-retentive pavement can effectively mitigate UHI [81].
BeijingTrees, grass, and water bodies in Olympic Park reduce air temperature on average 0.48–1.12 °C compared to bare areas during the day, and monthly average temperature near wetlands was lowered by about 0.37–1.15 °C.More trees combined with short plants or grasses beneath trees, appropriate irrigation regimes for grassland, and urban wetland restoration are necessary [82].
New York CityDuring summer, the white roof permits the surface to reflect back a large amount of energy, and the green roof reduces the heat fluxes through the roof, and both reached lower temperatures than the black roof.Change black roofs to green and white roofs in cities [83].
Sacramento, Florida, and New MexicoAverage albedo of developed areas increased from 0.13 to 0.26 and peak summer temperature was reduced by 2 to 4 °C according to this simulation.Use cool roof material when refinishing and roll white chips into the top surface of the pavement to increase albedo [84].
SeoulAverage temperature of blocks with more small green spaces was about 1 °C lower than blocks with fewer small green spaces.Small green areas can effectively reduces the UHI effect [85].
NagoyaLST of grids with 30% trees and 70% grass was reduced by 3.195 °C (spring) and 3.987 °C (summer), which is better cooling than grids with 100% grass.Vegetation cover has an important role in mitigating UHI. Planning for green parking lots with stronger cooling effects [85].
ShanghaiMean temperature of the water landscape is 37.61 °C, lower than the average temperature within the outer ring road (40.7 °C) during the day.Appropriate design of the water landscape can maintain the maximum effect of micro-climate adjustment [87].
Publisher’s Note: MDPI stays neutral with regard to jurisdictional claims in published maps and institutional affiliations.

