Abstract
The present study deals with the morphometric quantification of erosion and illustrates the uplift component triggered by denudation (isostasy) in the growth and evolution of a rising orogeny by the application of Airy isostasy concepts. The Gibraltar Arc, located in the Western–Central sector of the Betic Cordillera, developed an exceptional geological scenario during the Messinian Salinity Crisis since the thin emerged fringe of the uprising Cordillera disconnected the Atlantic and Mediterranean basins, generating a relevant misbalance and asymmetry in the fluvial erosion between the two slopes of the emergent orogeny. Our analysis was applied to 50 individual drainage basins (spatial isostatic units) in the Western–Central Betic Cordillera, allowing us to obtain individual and bulk estimates for these isostatic parameters. GIS-based numerical estimations were obtained using LiDAR Digital Elevation Models (DEMs) provided by the Spanish Geographical Institute and reconstructed pre-incision surface models obtained from proxy paleo-elevation data, estimated from stratigraphic and geomorphological littoral to shallow marine markers. The obtained values for geophysical relief, denudation plates, erosion/uplift rates and computed accumulated uplift (245–407 ±20 m) are higher for the ancient Mediterranean slope of the orogen. On the contrary, the Atlantic slope presents an accumulated uplift of only 138–236 ±20 m, indicating the strong control of the ancient Messinian Atlantic–Mediterranean water divide. The temporal study of erosion indicates that most of the difference in uplift in the Mediterranean slope was achieved during or soon after the Messinian Salinity Crisis, resulting in mean uplift rates of 0.21 mm/y, but practically null (0.01 mm/y) for the Atlantic slope. The comparison of the geophysical relief models with proxy paleo-elevation data allowed us to assess the current state of the denudation process in the range. The results indicate that, towards the west of the range denudation compensated elevation, and is actively back-feeding isostatic rebound. Therefore, the contribution of external processes to mountain range elevation through isostasy is quantitatively estimated using elevation data. In this case, a relevant part of the surface uplift (50-55%) is undertaken by the orogen. Ultimately, the Messinian Salinity Crisis-related isostatic response to differential denudation may be behind the quaternary westward tilting of Iberia, causing more than 70% of the Peninsula to drain towards the Atlantic.
1. Introduction
Long-term calculation of the bulk eroded volume in mountain ranges mostly relies on estimates based on, i.e., thermocronology as a proxy of orogen uplift, e.g., [1,2,3]. The estimation of erosion/uplift rates mainly came either from functional relationships, e.g., [4,5], or from cosmogenic dating of key landforms, allowing us to interpolate mean rates through time, e.g., [6,7,8,9,10]. In addition, the estimation of the final sedimentary budgets in the adjacent marine basins allows us to assess the interchanging erosion and sedimentary inputs and outputs (sedimentary budget) between upraised source areas and sedimentary basins [11,12,13]. However, based on analyses successfully tested in volcanic islands [14], in combination with methods based on the recognition of geomorphic markers as proxies for former paleo-elevations [15,16,17], innovative approaches to reconstruct the pre-denudation scenarios in mountain ranges have been developed based on Airy isostasy and geophysical relief, e.g., [18]. These approaches allow us to quantify the total volume of eroded material and the total amount of uplift by comparison with the actual topography.
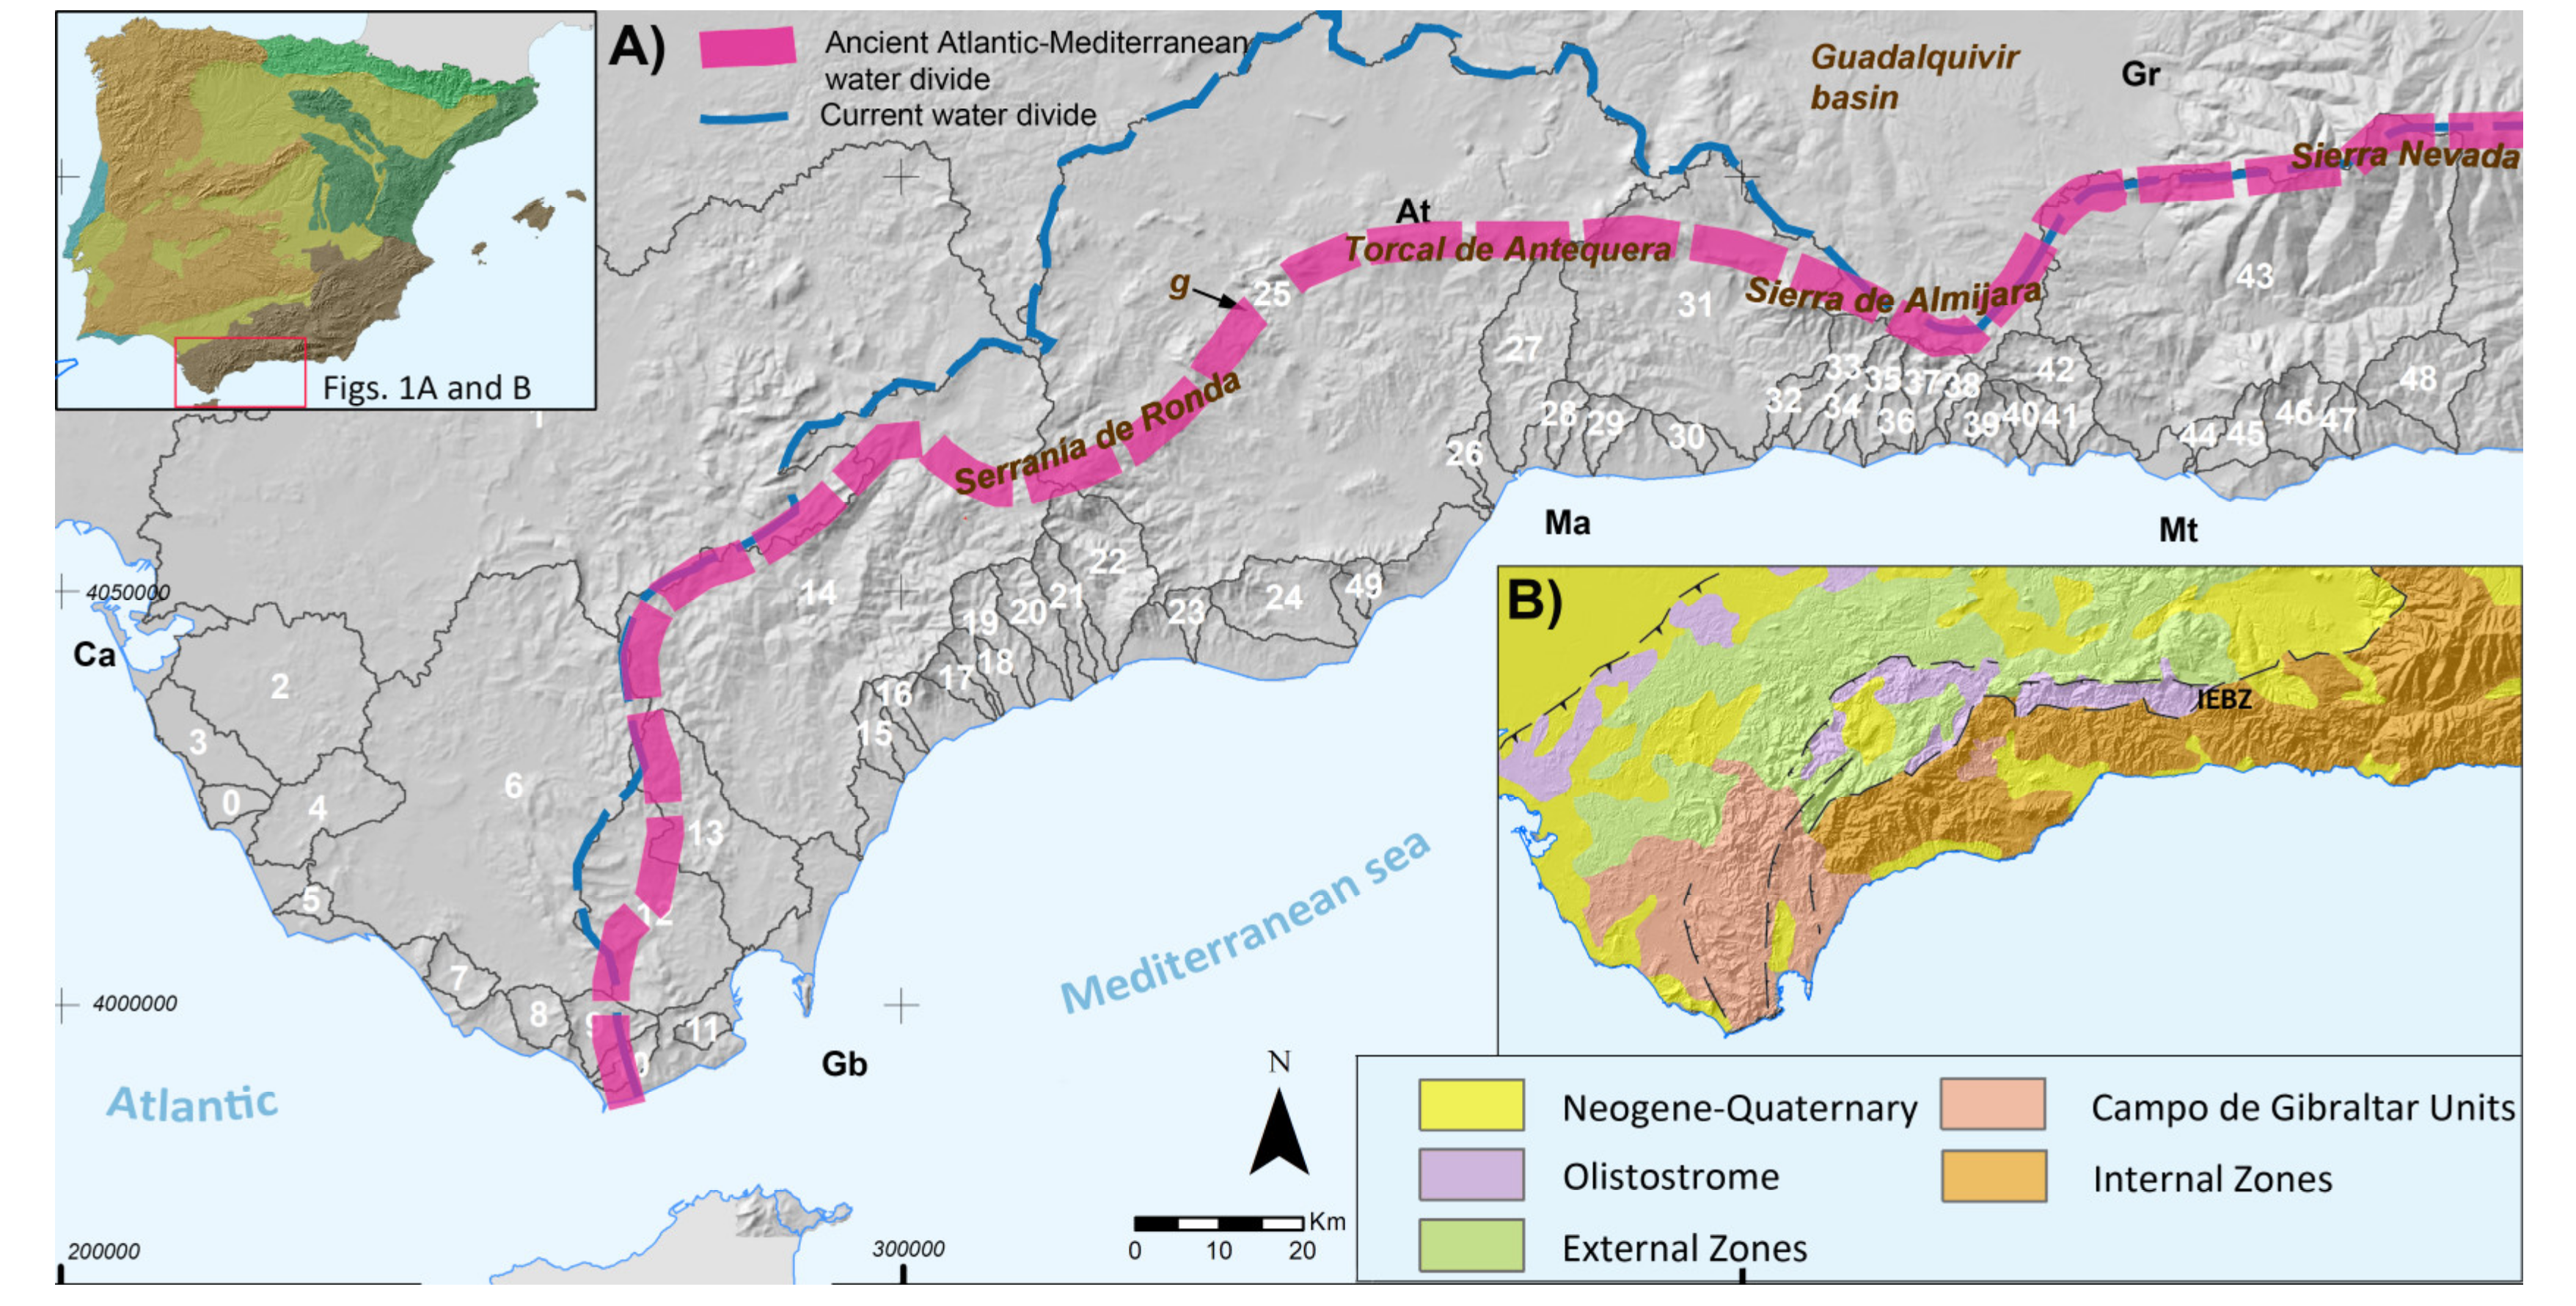
This is the case for the Western–Central Betic Cordillera (WCBC), an arcuate mountain range c. 300 km long (i.e., Gibraltar Arc; Figure 1A), with particular paleogeographic evolution linked to the emergence of the Betic Cordillera during the Late Messinian, which triggered the separation of the Atlantic and Mediterranean basins, promoting the “Messinian Salinity Crisis” in the Mediterranean (MSC) [19,20,21,22,23] and the later catastrophic Zanclean flooding, e.g., [24,25,26]. This unique geological catastrophe has been revealed as a valuable scenario to explore large-scale mountain erosion and related onshore uplift rates during a well-delimited geological time interval, e.g., [17,27,28].
Figure 1.
(A) Location of the 50 studied drainage basins (numbered from 0 to 49) within the Gibraltar Arc (Western–Central Betic Cordillera) highlighting the estimated location of the Messinian Atlantic–Mediterranean water divide (purple dashed line) (B) Geology of the more relevant geological units in the studied area (Western–Central Betic Cordillera (WCBC)). At: Antequera, Ca: Cádiz, Gb: Gibraltar, Gr: Granada, Ma: Málaga, Mt: Motril, g locates the Guadalhorce strait.
One of the consequences predicted and partially explored along with the MSC at the Mediterranean scale is regional isostatic uplift along the basin margins due to the evolving mass balance between source areas and basins [29]. The Gibraltar Arc, located in the western edge of the Mediterranean basin, underwent an important asymmetry in the base level erosion and therefore on the fluvial incision, enhanced in the Mediterranean slope (Figure 2) [15,17]. The relevant drawdown occurred during the MSC, leading to a noticeable enlargement of the previously small fluvial basins around the Mediterranean with the removal of millions of cubic meters of rocks, resulting in the overall uplift of the Betic Cordillera and the rapid continentalization of the existing small marine basins [28], which was nearly completed in the studied area during the Late Zanclean period [27,30]. The distribution of late Tortonian–early Messinian shallow marine sequences and related geomorphological markers (mainly uplifted abrasion surfaces) around the Atlantic and Mediterranean slopes of the Betic orogen indicates an important differential uplift between both slopes, as shown by a study of one of the largest fluvial basins in the area, that of the Guadalhorce basin [28]. The preliminary analysis of the area suggests that Late Neogene sea level markers are nowadays at elevations of 1.300–900 m above the sea level in the Mediterranean slope (Sierra Nevada), but below 200 m in the Atlantic zone, suggesting a dramatic E–W asymmetric uplift along the entire Gibraltar Arc [20,28,30,31], and maybe throughout the whole Mediterranean–Atlantic water divide within the Iberian Peninsula (Figure 1) [15].
This paper presents the results of an analysis of the erosion volumes and rates on 50 individual drainage basins around the Gibraltar Arc to calculate the isostatic response from erosional unloading according to the Airy isostasy (Figure 1A). The bulk amount of denudation was calculated in a GIS environment using map algebra based on the analysis of Digital Elevation Models (DEMs). The used methodologies improve previous methods to reconstruct proxy-based pre-incision surfaces in drainage basins [14,16] and are applied to the large-scale analysis of mountain ranges. The study is based on the calculation of the geophysical relief (GR) of [18] and the application of Airy-derived isostatic functions to evaluate the theoretical isostatic response (uplift) to erosional unloading by taking into account crustal parameters commonly considered for this zone of the Betic Cordillera [16]. The comparison between the calculated pre-incision topography before the MSC and the present erosional landscape allowed us to evaluate the eroded rock volume for each analyzed basin along the Gibraltar Arc. The obtained data not only allowed us to estimate the differential distribution of uplift within the Betic Cordillera, but also the bulk isostatic response of the whole orogen.
As a final point, the application of a GIS-based method to reconstruct the pre-MSC paleogeoid around the Gibraltar Arc based on proxy paleo-elevation data [28] allowed us to build a spatial uplift model of the zone from late Messinian to present. The comparison of the theoretical uplift resulting from erosional unload with the obtained paleogeoid models accounts for the whole vertical uplift of the Betic orogen achieved since the late Messinian. These uplift value assessments not only evidence the current state of the denudation around the Gibraltar Arc, but also the impact of this unique geological process (MCS) on the subsequent Plio-Quaternary evolution of the drainage in the Betic orogen and the whole Iberian Peninsula.
2. Geodynamic Setting
The Gibraltar Arc is an arcuate mountain range c. 300-km long and c. 60-km wide, defining the Western–Central zone of the Betic Cordillera (WCBC). Summit elevations decline from NE to SW, from maximum values of 3479 m a.s.l. in Sierra Nevada (Granada) to 2000–1500 m in the Almijara, Torcal de Antequera (Málaga) and Grazalema ranges, to near 200-400 m in the environs of the Gibraltar Strait (Cádiz; Figure 1). The range is dissected by numerous drainage basins mainly flowing to the Mediterranean, of which the 50 largest ones have been analyzed. The main river basins (>100 km2) are those of the Guadiaro (24), Guadalfeo (43), Vélez (31) and Guadalhorce (25) on the Mediterranean side and the Guadalete basin (1) on the Atlantic one (Figure 1).
The Cenozoic convergence between Africa and Iberia led to the formation of an arcuate orogen, the Gibraltar Arc, e.g., [32,33], defined by the orogenic nappe stacking of pre-Cenozoic materials and the emplacement of Eocene to Miocene syn-orogenic flysch and olistostromic units (Figure 1B and Figure 2). In the central sector of the range, roughly oriented NE–SW arcuate and elongated ridges are mainly made up of Mesozoic Subbetic materials overthrusted by the syn-orogenic units [31,34] (Figure 1B). These ridges constituted the ancient Late Neogene water divide between the Atlantic and Mediterranean basins (Figure 1A and Figure 2), as indicated by several paleogeographic reconstructions [17,22,23]. Along this ancient water divide were the last known gateways connecting the Atlantic and the Mediterranean (Guadalhorce strait) before the eventual emergence of the Betic orogen in the zone triggering the MSC event, e.g., [23,35,36]. As can be noticed from Figure 1A, the present water divide retreated to the west, promoting important fluvial captures from the Mediterranean slope [28] and probably the eventual reconnection of the Atlantic and Mediterranean basins [26].
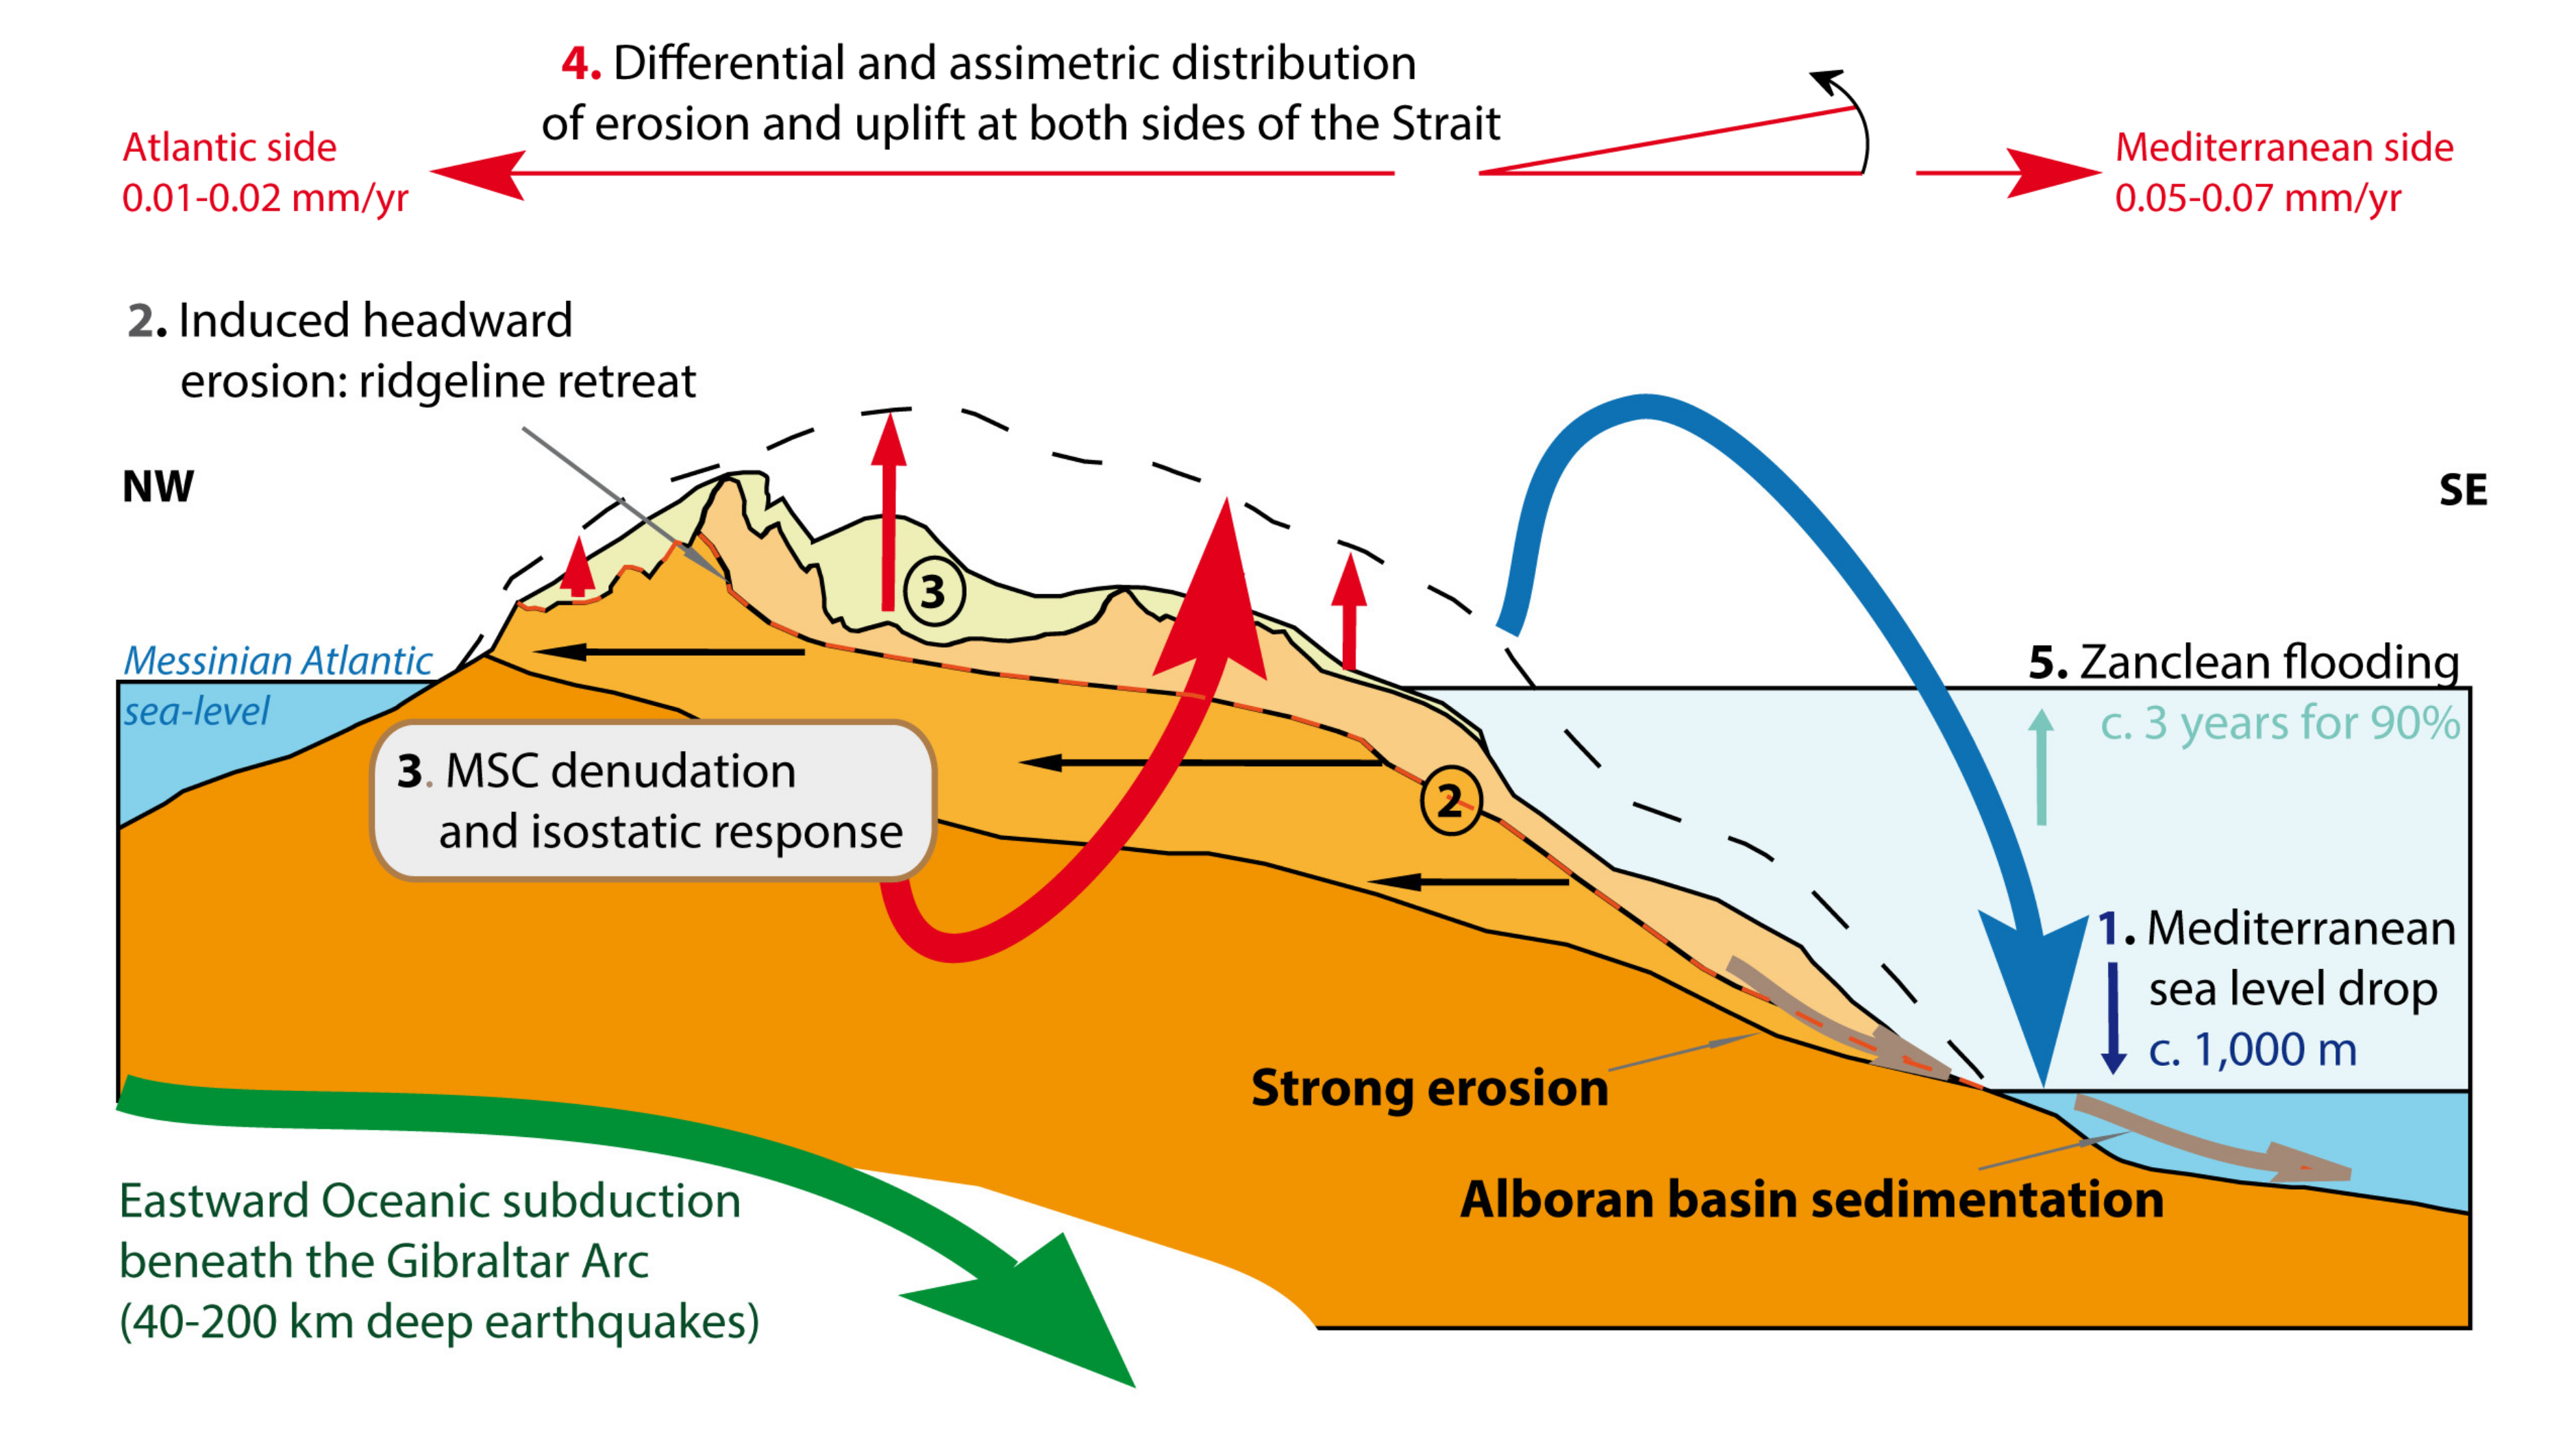

Figure 2.
Not to scale conceptual model illustrating the interaction of the main geodynamic processes studied. The extreme sea level fluctuation (1) in the Mediterranean due to the Messinian Salinity Crisis (MSC) led to headward erosion, canyon development and ridgeline retreat (2). This denudation triggered an important isostatic response (3) differentially distributed on both sides of the Messinian water divide (4). After the Zanclean catastrophic flooding (5) the asymmetric denudation in the orogen was consolidated. Erosion, sedimentation and uplift rates refer to the northern segment of the Gibraltar Arc during the last 5,33+0,67 Ma, updated from [15] (TOPOMED Project) and [27,28]. The theoretical oceanic subduction beneath the Gibraltar Arc, proposed by some authors, is also indicated [37,38].

Figure 2 summarizes the more relevant processes involved in the Gibraltar Arc during and soon after the MSC. The closure of the Gibraltar strait and the subsequent drawdown of the Mediterranean Sea (c. 1000 m) induced a strong fluvial headward erosion, transferring an important volume of rocks from the continent to the Alborán basin, e.g., [25,27]. Headward erosion triggered a significant WNW retreat of the original Messinian water divide, in some cases c. 25 km [28] (see Figure 1), strongly contributing to the accelerated denudation and uplift of the emerging Betic Cordillera. Drawdown related to the offshore water unload during the desiccation of the Mediterranean, see [29], combined with the strong denudation onshore is expected to result in a rapid isostatic rebound in the Gibraltar Arc from the initiation of the MSC 5.96 Ma ago. The duration of the MSC (c. 600 ka) is equivalent to the Middle Pleistocene (Chibanian Period) time span, and—when considering the post-glacial isostatic processes around the globe during the last 11 ka—one can expected uplift rates up to 10 mm/y around the Mediterranean for the onset of the MSC period with an accumulated uplift above 100 m in the Mediterranean slope. After the Zanclean flooding, backfeeding of the headward erosion in an ongoing rising mountain range continued with its denudation, water divide retreat and a progressively buffered isostatic rebound of the orogen. Differential denudation in the Atlantic and Mediterranean slopes of the rising Betic Cordillera induced a differential isostatic response, as checked in the Gualdalhorce river basin [17], and hence the regional tilting of the whole area towards the W–NW (Figure 2). As we will see, the overall process of regional tilting may be behind the historically noticed westward tilting of the Iberian Peninsula [39,40], generating the drainage asymmetry between the Atlantic and Mediterranean slopes (Figure 1).
To illustrate the bulk accumulated uplift in the zone during the last 9 m.a. (since the late Tortonian) it is worth noting that late Tortonian–early Messinian shallow marine deposits can now be found at different elevations across the entire range. For instance, at 1.300 m in Sierra Nevada or at 1.200 m in the Tejeda Range, this implies mean uplift rates of about 0.2–0.3 mm/y after the Tortonian [20,31]. In the Guadalhorce basin (Málaga) late Tortonian littoral deposits and related geomorphic markers can be found at present elevations of c. 890 m, also implying significant surface uplift for this zone, c. 0.09–0.18 mm/y [17,28,30]. Towards the SW, similar late Tortonian sequences are found at lower elevations, even less than 200–100 m near the Gibraltar Strait axis. This E–W decreasing trend of the bulk accumulated uplift runs parallel with the overall elevation trend of the mountain range, which also decreases to the west. GPS data indicate that this sector of the Betic Cordillera is still the more mobile zone in the Iberian Peninsula, reaching c. 3–5 mm/y of westward displacement in the Gibraltar Arc, e.g., [41].
3. Methodology
The 50 studied basins occupy an area of c. 40,000 km2, limited by the Guadalquivir drainage basin to the north, the Sierra Nevada mountain range to the east, and the Atlantic Ocean and the Mediterranean Sea towards the south (Figure 1). The estimation of removed rock volumes followed modified mathematical approaches proposed in [14,15], whilst the calculation of the geophysical relief and isostatic response mainly relied on known Airy-based equations and methods [14,16]. The construction of the uplift model for the Gibraltar Arc follows the methodological workflow published by [28] for the Guadalhorce basin, but now extended to the whole 50 major drainage basins existing in the zone. The map algebra used in this study has been computed under a GIS Environment (ESRI ArcGis v. 10.7) by means of simple routines and algorithms. Due to the large size of the study area, a Digital Elevation Model (DEM) with a pixel size of 40 m was used as the base map for all the digital analyses. The DEM was obtained from the Spanish Geographical Institute (Centro Nacional de Información Geográfica, CNIG) by interpolation with 40-m pixel LiDAR data gathered with a digital high-resolution camera equipped with a panchromatic sensor and 4 multispectral sensors, flight positioned with GPS and an inertial navigation system IMU. All maps are provided in a projected ETRS89 UTM Zone 30N coordinate system.
3.1. Estimating the Amounts of Erosion Throughout the Gibraltar Arc
To estimate the amount of post-MSC erosion in the studied zone, we used individual drainage basins as reference spatial units for map algebra (Figure 1). Drainage basins are classically considered in erosion studies focused on relief development as representative functional units linked to erosion processes [14,16,18,28].
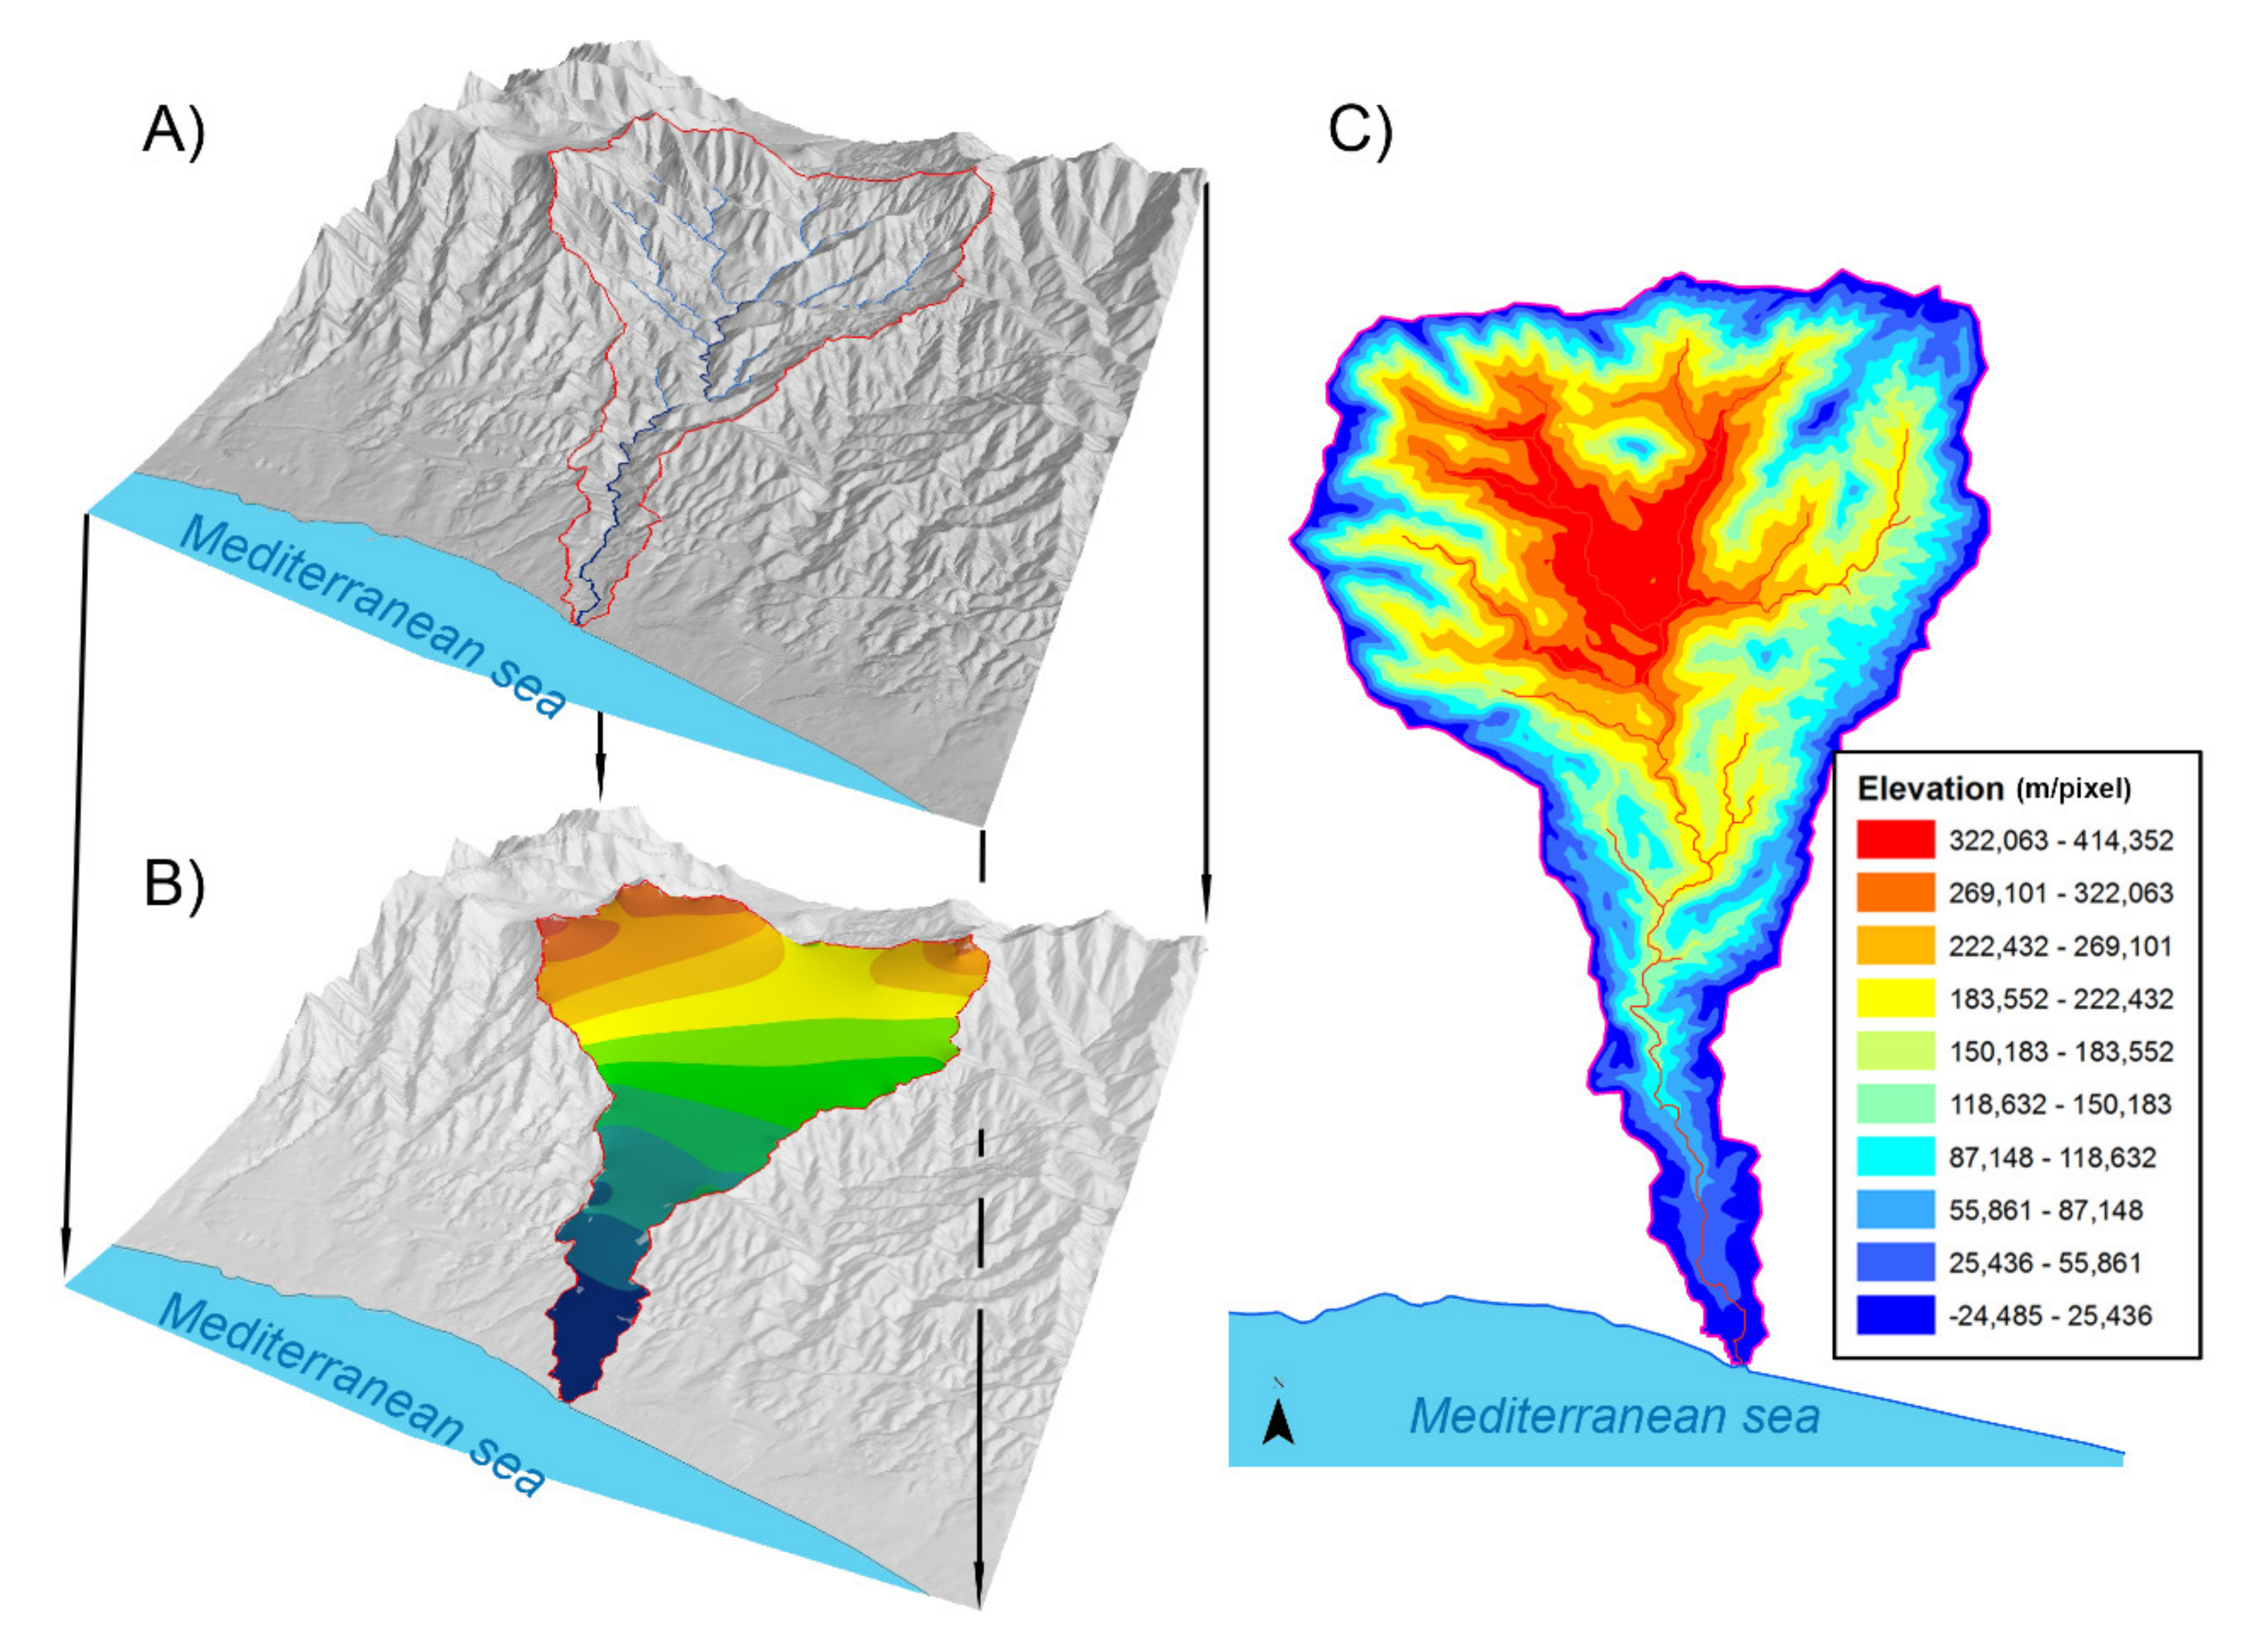
As a first step, the delimitation of the drainage basins in a GIS environment was conducted (Figure 3A and Figure 1). The largest ones are those of the Guadalete (1), Barbate (6), Guadiaro (14), Guadalhorce (25), Vélez (31) and Guadalfeo (43) rivers (Figure 1B), completing a total of 50 basins. For simplification, the smallest basins (<15 km2) were discarded from the analysis. These are typically small intervening river basins flowing directly to the sea, located between the largest ones, whose eroded rock volumes are not significant for the analysis (Figure 1B).
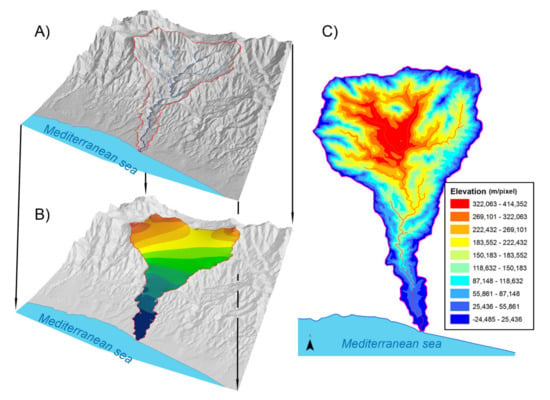
Figure 3.
Methodology applied in this work to obtain the pre-incision surface (ridgeline surface), the amount of denudation for each river basin and the gr models and data. The process involves three steps: (A) defining the limits of the fluvial basins, i.e., delimiting the ridgeline; (B) a tension spline interpolation, flat to slightly concave upwards from the 3D shape of the ridgeline, defining the pre-incision surface; (C) the subtraction of the pre-incision surface minus the Digital Elevation Model (DEM), resulting in a raster gr model (denudated rock mass in m by pixel). In this case, the central parts of the basin, in red, account for most of the erosion and hence the gr. Models correspond to fluvial basin number 23.
The second step (Figure 3B) implies the calculation of a pre-incision surface from proxy geological data to obtain a theoretical DEM before the fluvial dissection of the zone (here called the “ridgeline surface”). Subtracting this initial surface from the present topography allows us to calculate the total eroded rock volume in each analyzed basin (Figure 3C). The obtained ridgeline surface models should envelope the present ridgelines and overlie all existing internal reliefs within an individual basin. This approach is founded in previous works, but applied here in 3D analysis [14,15]. From a GIS procedure, the ridgeline surface is obtained by extracting the nodes of the polylines defining each basin ridgeline, transforming them into point features containing their corresponding elevation data (i.e., obtained from the DEM) and interpolating a continuous raster model of the pre-incision surface. We have used a tense spline interpolation, which offered the best results for this type of study, e.g., [28,42]. Following these authors, the resulting surface models should not be convex upwards in order not to exaggerate the amount of denudation, since flat to slightly concave upwards surfaces are preferred. However, in basins that are topographically complex because of their morphology, geological evolution, recent volcanism and/or tectonics, such as the Guadiaro, Guadalhorce or Guadalfeo (14, 25 and 43, respectively, in Figure 4A), some reliefs protrude the obtained ridgeline surfaces. In these cases, elevation points were added at these bulging zones to guide the modeling processes and to ensure that the final ridgeline surface model completely overlies all internal reliefs, e.g., [14]. Typically, this can take few iteration steps. A subtraction of the DEM minus the ridgeline surface offers accurate information on the distance between models and hence the degree of form fitting reached along the modeling process. This method assumes that erosion in the ridges is not significant and, as a result, the computed erosion values are conservative. Once the ridgeline surface is obtained, the total eroded volume can be straightforwardly calculated in most GIS environments (Figure 3C).
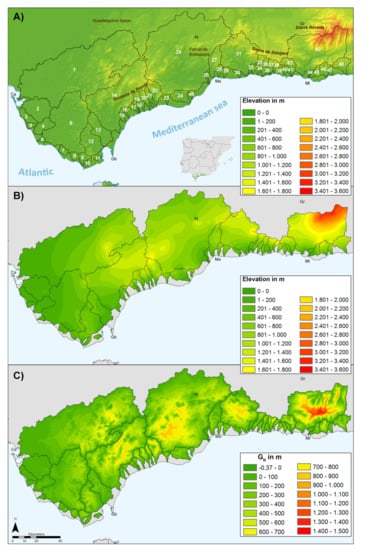
Figure 4.
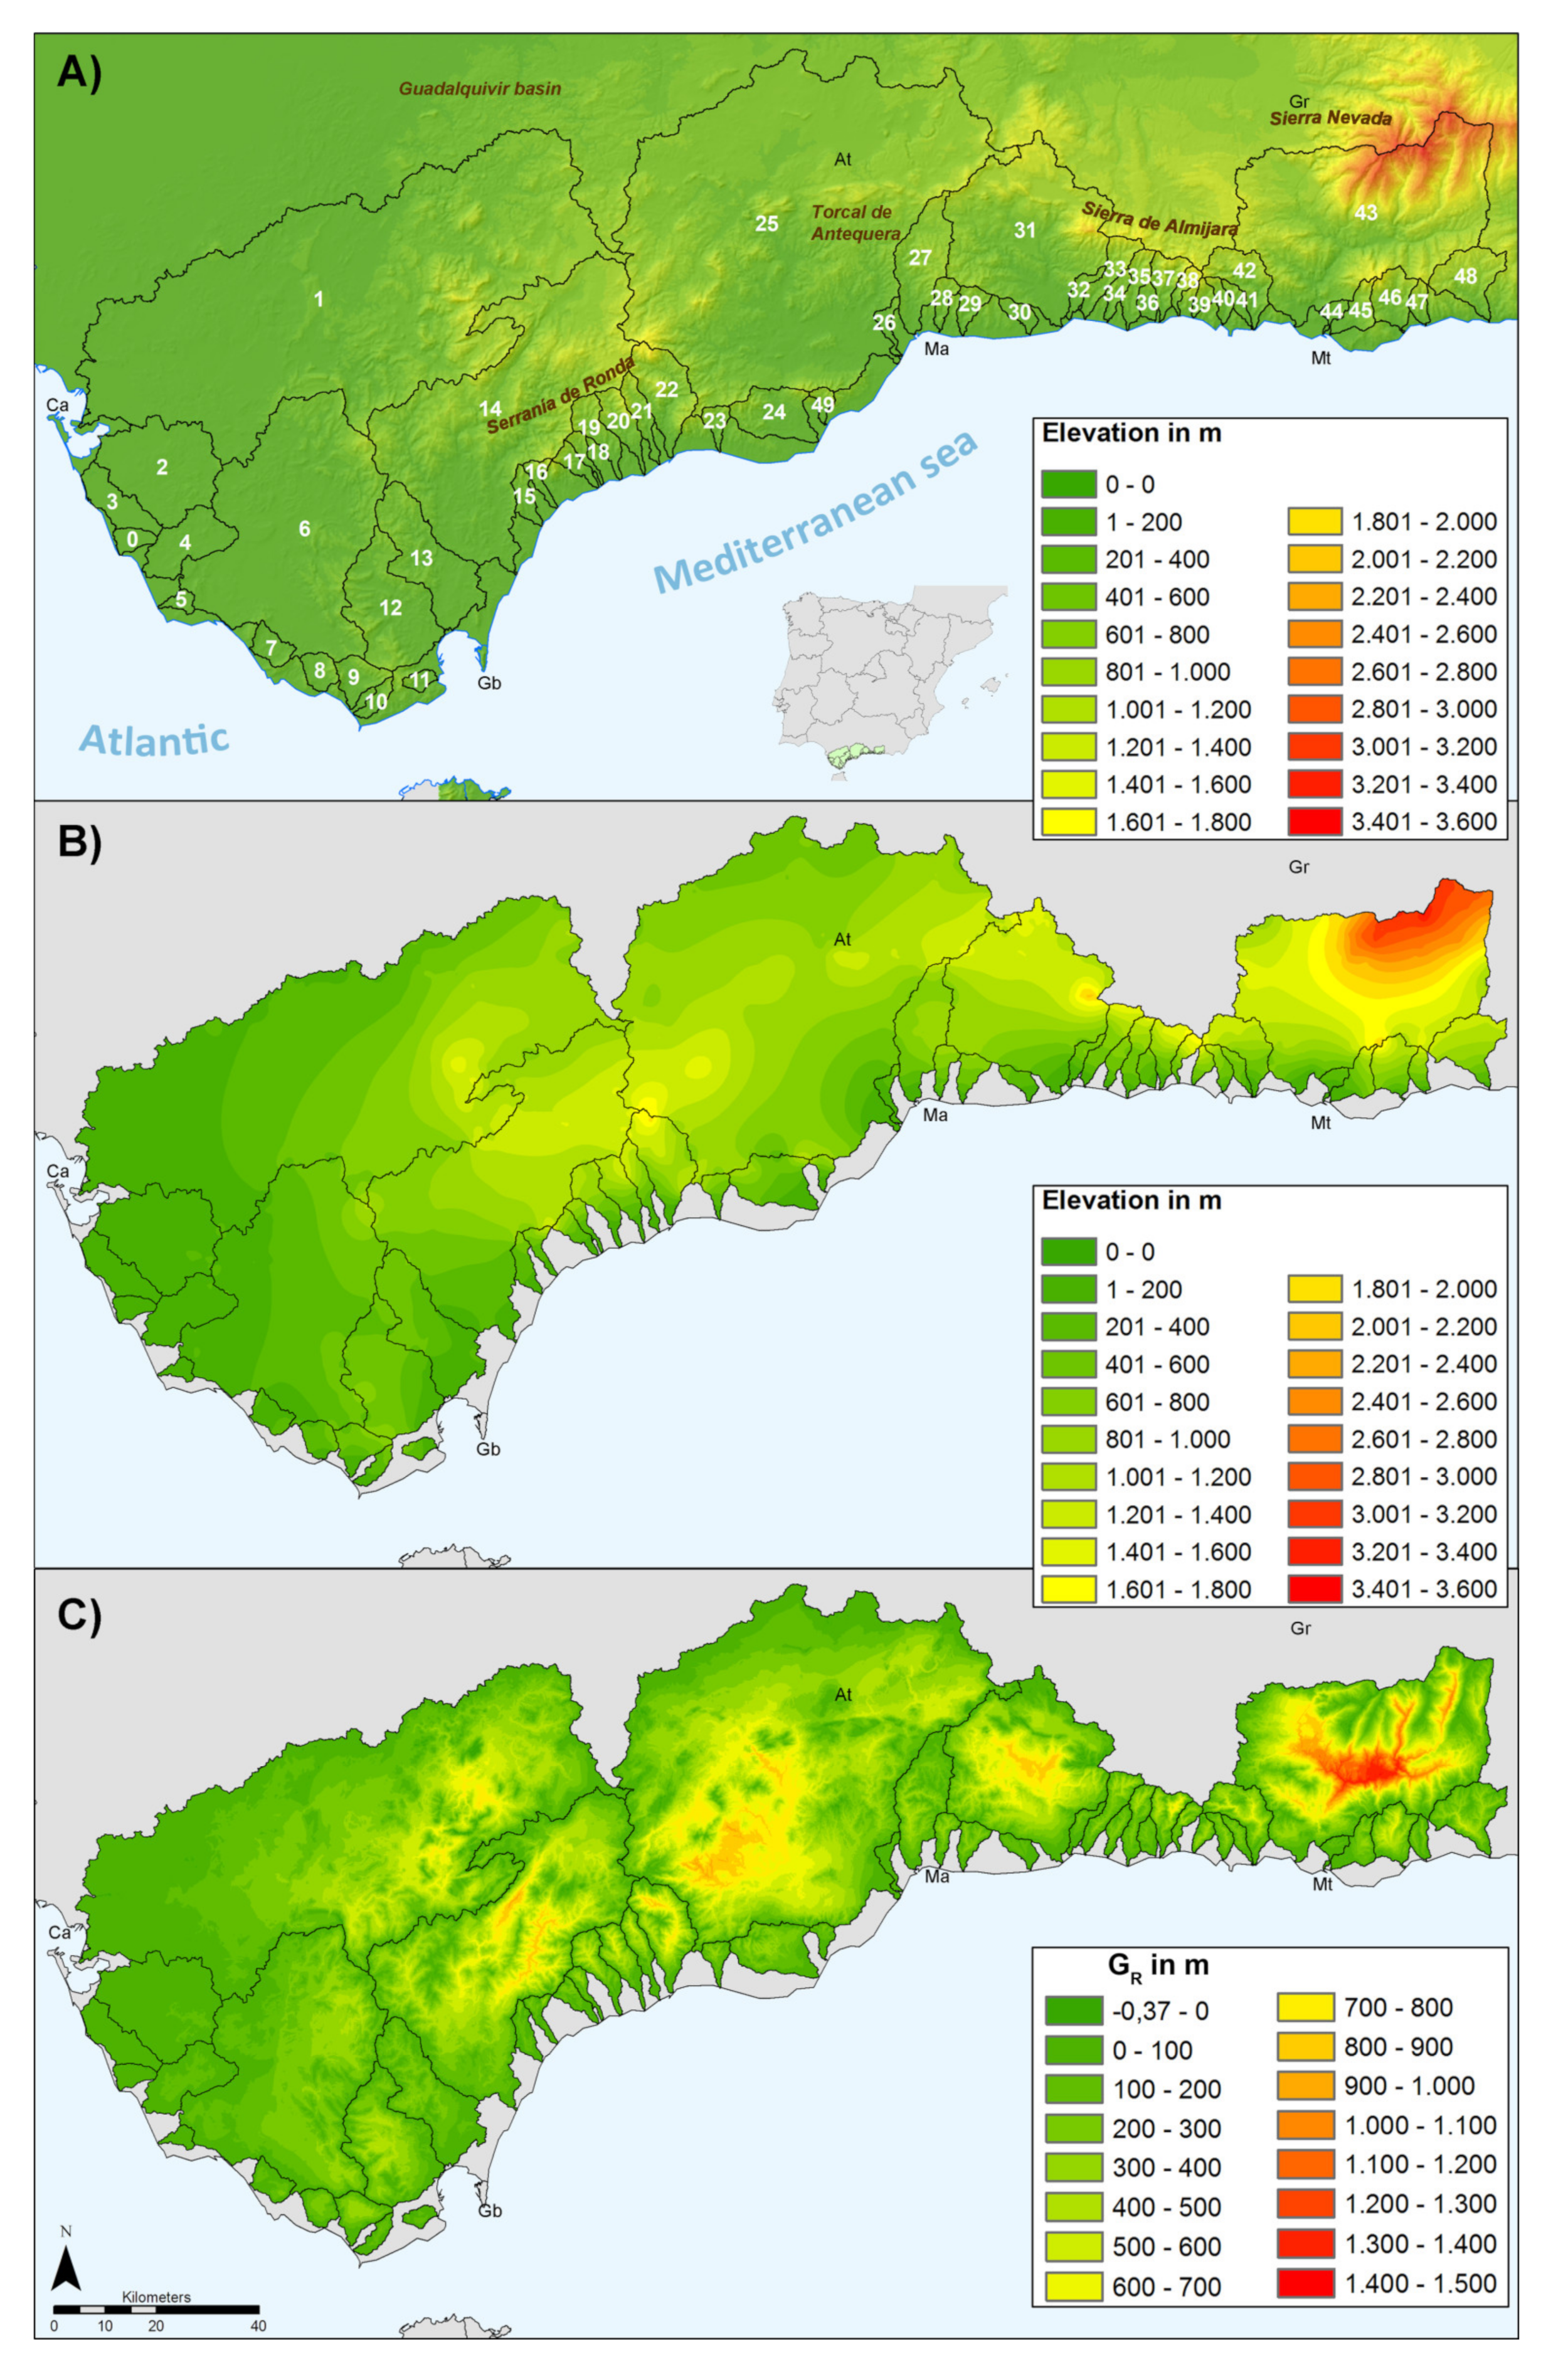
Denudation related models for the WCBC. (A) Current hypsometric distribution, (B) obtained ridgeline surface and (C) geophysical relief model showing a continuous distribution of pixel size. At: Antequera, Ca: Cádiz, Gb: Gibraltar, Gr: Granada, Ma: Málaga, Mt: Motril.
3.2. Calculating the Geophysical Relief and Isostatic Response
The geophysical relief (GR) is defined as the result of dividing the total eroded volume by the total area of a single drainage basin (GR = m3/m2). Thereafter, this is equivalent to the thickness, in meters, of the theoretical plate of denudated material by fluvial erosion in each basin [18].
The raster-based analysis undertaken in this study allows us to obtain (Figure 3C) not only the overall GR value for each drainage basin, but also a continuous distribution of this parameter (denudated rock mass) in meters for spatial units of pixel size. In the first case, the value comes from the computation of the total volume between the ridgeline surface and the present topography, and in the second from the subtraction of the ridgeline surface minus the present topographic DEM pixel by pixel—a continuous GR model for the whole Gibraltar Arc.
Surface uplift triggered by erosional unloading can be calculated by applying straightforward Airy-derived isostatic functions (i = ρc/ρm), where ρc is the density of the crustal eroded material and ρm the density at the depth of compensation around the Moho. For instance, the use of standard values for ρc (2.67 g/cm3) and ρm (3.33 g/cm3) indicates that the amount of uplift (i) per unit of denudation in meters is generally slightly less than the depth of fluvial dissection per unit area [43] of 0.874 m of uplift per meter of denudation.
3.3. Calculating the Overall Uplift Model Since the Late Tortonian–Early Messinian
In order to calculate the overall uplift in the mountain range from the pre-MSC situation to the present, we have used bathymetric and topographic proxies of the present shape of what, during the late Tortonian–early Messinian, was flat and represented the sea level surface (geoid). This modeling procedure [28] allows us to obtain the present geometry of the surface, accumulating all vertical changes and deformations from the late Tortonian–early Messinian [28], labeled by these authors as the sea level Present Distribution Model (PDM). After subtracting the eustatic component in elevation (from existing sea level models), the remaining vertical deviations from the horizontal fairly depict the bulk vertical changes in the late Tortonian–early Messinian geoid (i.e., a deformed paleogeoid surface).
In summary, the method consists of the collection of proxy paleo-elevation data, estimated from stratigraphic and geomorphological littoral to shallow marine markers [28]. Then, for all late Tortonian–early Messinian sediments mapped in the studied area, a proxy paleobathymetric value in meters is assumed, which is dependent on the facies record of the sediments and its depositional environment. Subtracting these paleobathymetric values from their present topographic elevation provides the accumulated uplift, pixel by pixel, for the selected time period [28].
The subsequent interpolation of the set of gathered pixel data allows us to reconstruct a continuous raster surface, accounting for all changes in elevation. The authors in [28] proposed a simple but operative approach for the area, in which—for shallow markers (e.g., littoral sediments and landforms)—this proxy elevation is ± 0 m, assuming that, during the sedimentation, they were at sea level. For deeper markers (e.g., basinal marls), the proxy elevation is +20, assuming a paleobathymetry of -20 m. In the case of the geomorphic proxies, most of them corresponding to the upraised littoral wave-cut platform carved in the Atlantic slope during the late Tortonian and early Messinian (two levels) (Figure 5), an estimated proxy elevation of -5 m is assumed [28].
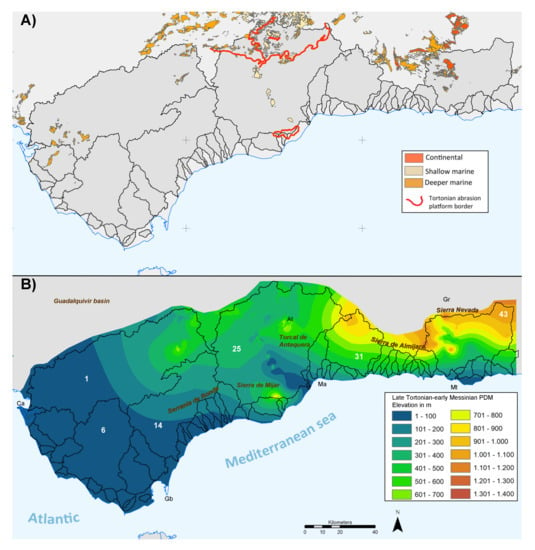
Figure 5.
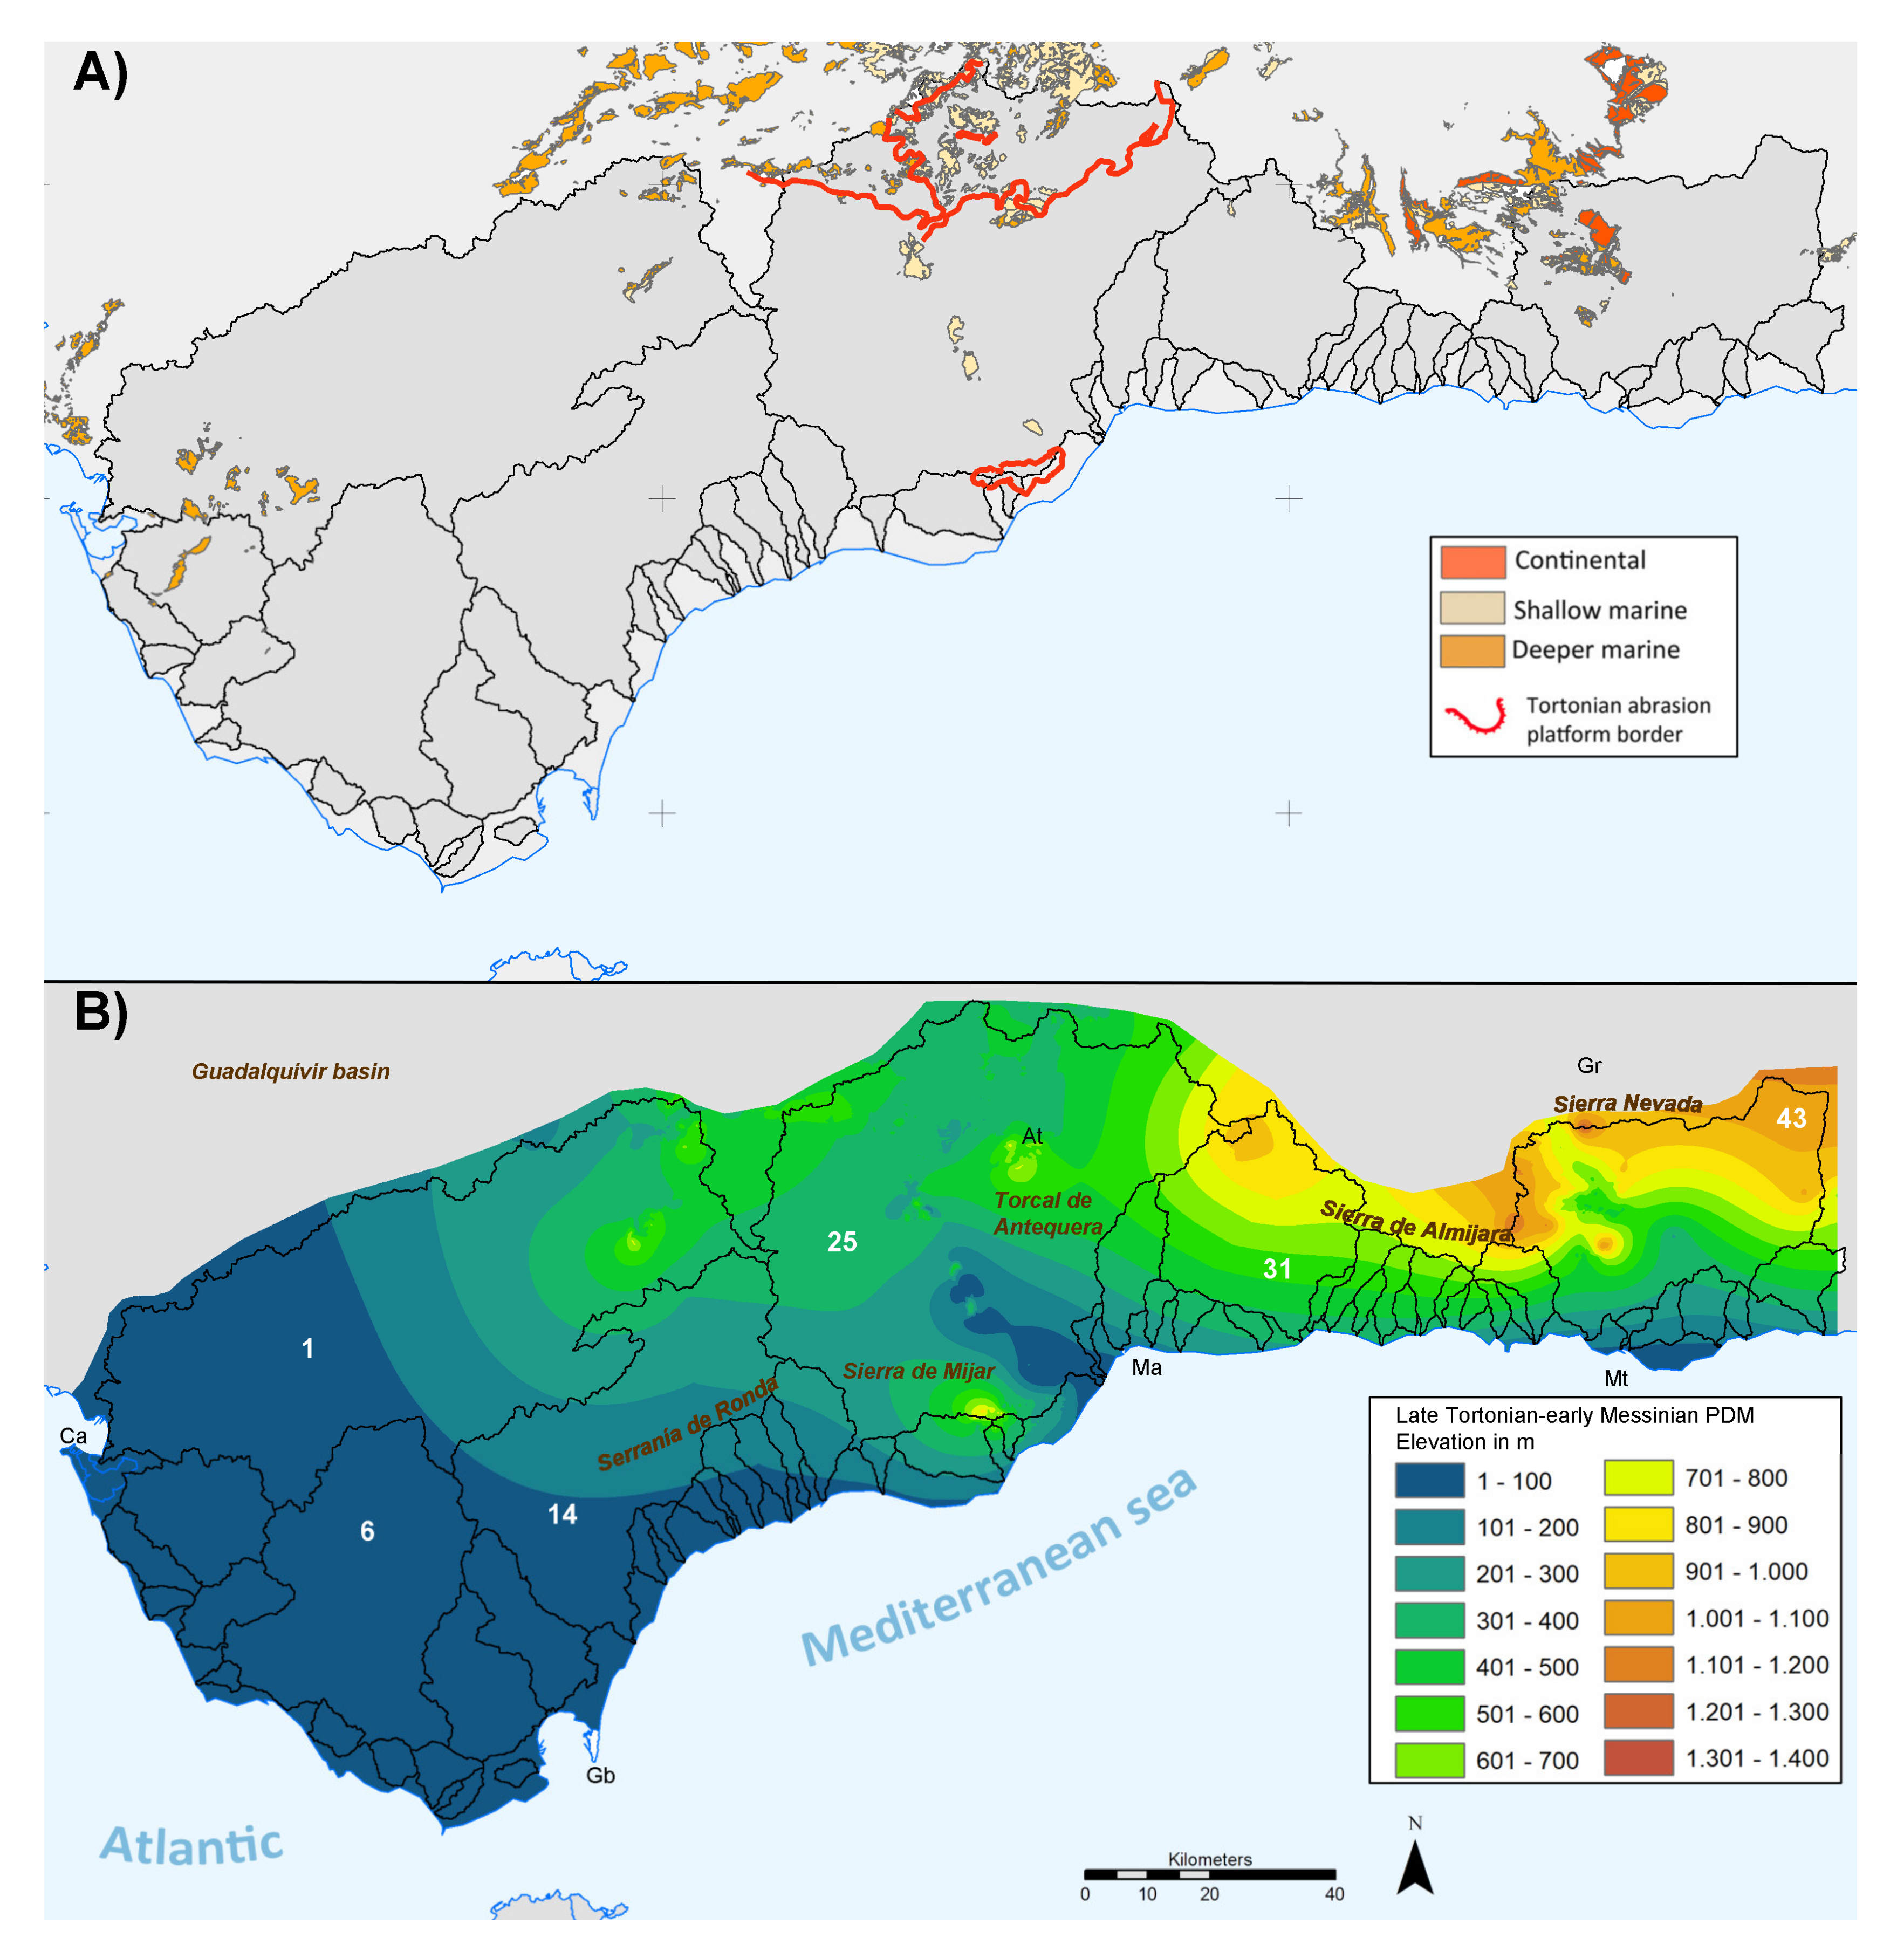
Late Tortonian-early Messinian Paleogeoid Present Distribution Model (PDM): (A) Tortonian sedimentary sequences and geomorphic markers used as elevation proxies (see [28,30]) and (B) the resulting proxy-based model of the Tortonian Paleogeoid PDM for the whole WCBC. At: Antequera, Ca: Cádiz, Gb: Gibraltar, Gr: Granada, Ma: Málaga, Mt: Motril.
From a GIS procedure, the nodes of the polylines defining the stratigraphic contacts of the Tortonian sequences, or delimiting the abrasion surface, are used as point elevation data to interpolate the late Tortonian–early Messinian sea level PDM model [28]. These simple paleo-elevation proxies have a sufficient resolution, since most of the data proxies are collected from GIS databases at 1:50.000 scale, whilst the models and maps presented in this study are at a c. 1:500.000 scale, thus minimizing the uncertainties and errors. Stratigraphic data were gathered from the digital Geological Map of Spain 1:50.000 (GEODE project; www.igme.es), a continuous shapefile database from the Spanish Geological Survey (IGME), revised and updated for this study. Shapefiles were edited when necessary to include modifications imposed by field work and bibliographic-related updates, mainly to incorporate new or refined unit dating. The geomorphic markers are mainly made up of the remnants of the outstanding erosion surface carved in the frontal olistostrome materials of this zone of the Betic Cordillera; see [28] for a detailed description. This geomorphic surface outcrops more than 100 km in a roughly E–W direction, parallel to the ancient Atlantic slope of the Betic Cordillera throughout the studied area. At present, this extensive flat landform, in some places more than 25-km wide (Figure 5A), is slightly dipping to the W–SW, indicating post-Tortonian tilting. In the Mijas range, near Málaga, recently described erosion surfaces, interpreted as late Tortonian in age (abrasion platform AP-0 in [30]), were also incorporated into our model. The corrections of eustatic variations have been made by means of the use classic sea level curves [44] refined for the studied area [45].
4. Results
4.1. Quantification of the Erosion and Distribution of the GR
Figure 4B shows the obtained ridgeline surface model for the studied area. The ridgeline surface (i.e., the pre-incision surface) clearly follows the overall topography of the studied area with the highest elevations in Sierra Nevada to the east (c. 3600 m), which progressively decrease towards the west close to the Atlantic littoral. From N to S, the occurrence of the arcuate ranges defining the central sector of the Gibraltar Arc force the ridgeline surface to reach elevations of about 1400-1800 m in large sectors of the range. However, there is a clear dissymmetry in the relief between the northern (low relief) and southern (high relief) slopes of the Betic Cordillera in the zone, which resembles a large topographic step between the Atlantic and Mediterranean slopes of the Cordillera (Figure 4A).
Table 1 offers the values of the total eroded rock volumes for each analyzed drainage basin. In general, there is a direct relationship between the volume of eroded material and the basin size. Some large basins display stronger denudation values—for instance, basins 1, 6, 14, 25, 31 and 43 present quite significant values of erosion, from 1151 to 271 km3. However, in spite of their large size (3400 to 1285 km2), basins 1 and 6 on the Atlantic side offer very modest values of denudation (702 to 220 km3). This also happens with other smaller Atlantic basins like numbers 2 and 4 (Table 1). In contrast, it is remarkable that all large basins (>3000 km2) draining to the Mediterranean, such as the Guadalhorce (25), Guadalfeo (43), Guadiaro (14) and Vélez (31) river basins, present significant volumes of eroded materials (601 km3 to 1151 km3), regardless of their size (Table 1). Moreover, these large Mediterranean basins show a complex spatial distribution of the denudation (Figure 4C) with southern sectors deeply dissected and northern sectors barely incised by the present fluvial network. This erosional segmentation is clearly linked to the ancient Atlantic–Mediterranean water divide, reflecting more recent fluvial capture processes from the Mediterranean slope after the Zanclean period [17,28]. This is also reflected in the spatial distribution of the eroded material along the studied zone of the Gibraltar Arc. The bulk eroded rock volume is of 3853.76 km3, but 2883,59 Km3 (75%) flowed to the Mediterranean (Alboran basin) and 970.17 km3 (25%) to the Atlantic (Gulf of Cadiz) (Table 1).

Table 1.
Geophysical relief, total eroded volume, area, mean elevation and uplift calculated for each fluvial basin in the study area. Note that basins 0–10 currently drain to the Atlantic Ocean and 11–49 to the Mediterranean Sea.
In relation to the geophysical relief (GR), the obtained continuous surface model was calculated by subtracting the overall ridgeline surface model from the present topographic DEM (Figure 4A,B). The mean GR result for the entire studied area is 152.55 m (Table 1). The resulting model offers GR values ranging from 0 to c. 1400 m, visibly increasing towards the E–NE (Figure 4C). Maximum GR values are found in the Guadalfeo basin (43) and the area displaying minimum GR values is located on the Atlantic side, with GR values between 100 and 400 m. Moreover, the regional picture clearly shows a differential distribution of GR values at both slopes of the Gibraltar Arc. On the Mediterranean side, there are wide areas exceeding GR values of 500 m, with maximum values of about 1200-1400 m. On the contrary, on the Atlantic side, smaller GR values from 100 to 400 m are dominant, and only the Guadalete basin (nº 1) reaches significant t GR values close to 800 m (Table 1). A similar picture arises when considering individual drainage basins at both slopes of the Gibraltar Arc.
4.2. Isostatic Uplift Calculation for the WCBC
As described in the methodological section, the straightforward method applied here to obtain uplift, the “Isostatic Constant” of [43], implies a direct positive correlation with geophysical relief or bulk denudation. Therefore, the spatial distribution and trends of uplift in the range are equivalent to those described for the GR parameter in Section 4.1. The computed surface uplift due to the erosional unloading is 133.33 ± 20 m for the whole studied sector of the Gibraltar Arc (WCBC) since the onset of the MSC. It is noteworthy that the basins accounting for the largest amount of uplift are typically small river basins in the Mediterranean realm with values ranging from 205 to 392 m (basins 42, 44, 45, 46, 48 and 49), and also the Guadalfeo basin (43) with a large area and 208.84 m of uplift. The basins showing the smaller values are in the Atlantic slope and, for instance, basins 1–3 present very small uplift values of a few meters (3.75 to 27.61 m). Therefore, the highest values are clearly located towards the E, in the Sierra Nevada range, in other words, the highest elevated point of the Iberian Peninsula (Mulhacén Peak 3482 m).
4.3. Proxy-Based Uplift Model for the WCBC
Figure 5A shows the proxy paleo-elevation data used to obtain the late Tortonian–early Messinian PDM (Figure 5B), which assembles all vertical changes occurred in the Gibraltar Arc to the present. As in the case of the GR, the obtained PDM shows a variable uplift distribution throughout the range. The PDM shows that the bulk accumulated uplift trends decrease westwards, running parallel to the present elevation trend within the range. Maximum uplift is accumulated to the east in Sierra Nevada, where late Tortonian littoral sediment outcrops are found at an elevation of c. 1300 m above sea level [31]. Surface uplift gradually decreases westward towards the Atlantic slope, where ample littoral sectors between Cadiz and Gibraltar present very small accumulated uplift (<100 m; Table 1). The central part of the studied area displays the more complex PDM surface model (Figure 6B). In this area, uplift increases from S to N, but at the northern edge of the modeled surface, uplift slightly declines towards the ancient Atlantic littoral zone. However, the Nijar range and the central part of the Gibraltar Arc display scattered highs and lows (Figure 6B), evidencing the complex paleogeography of an orogen emerging from the sea (paleoislands), as shown by the paleogeographical models obtained for the Malaga and Torcal de Antequera range in previous studies [28].
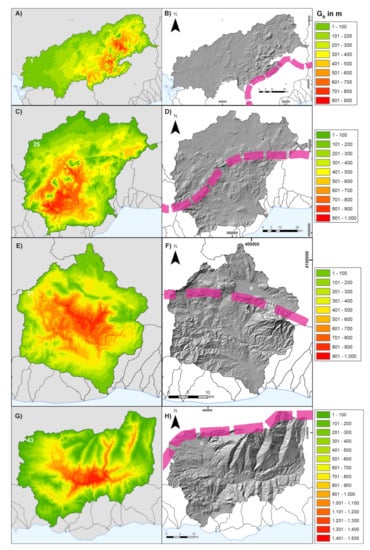
Figure 6.
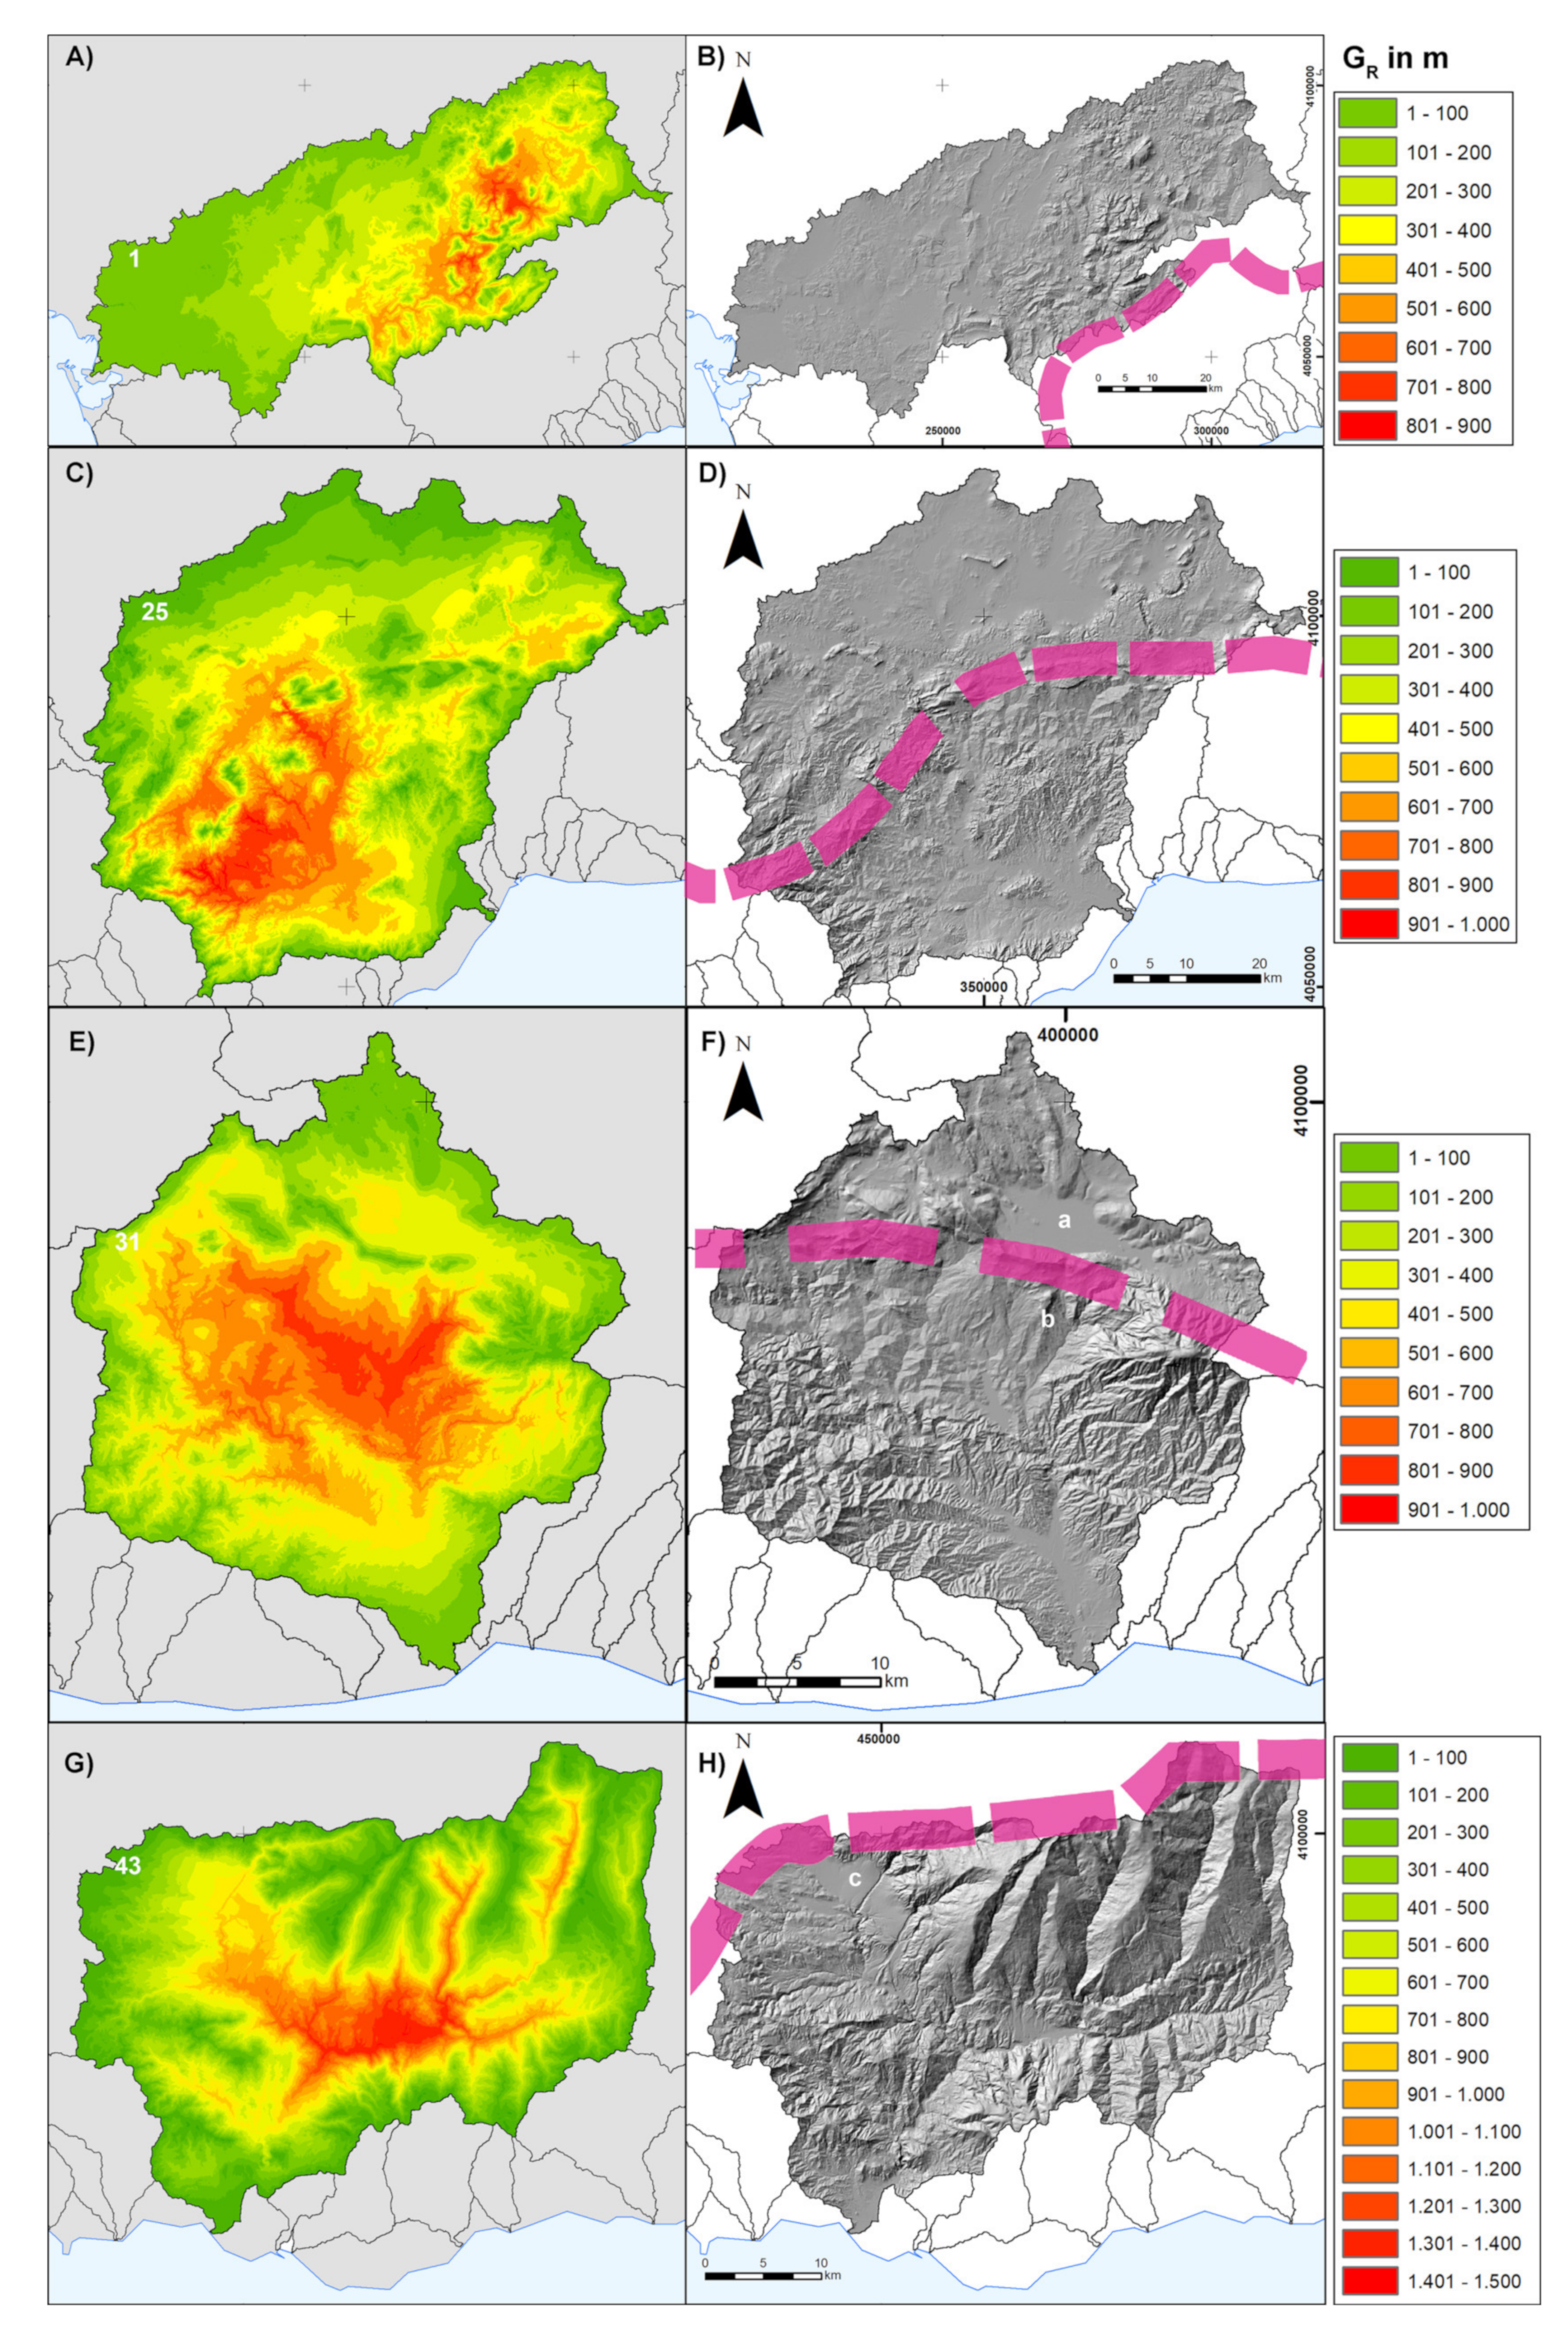
Continuous geophysical relief model (in m) and corresponding hill shade model of the following basins (A,B)) Guadalalete river (code 1), (C,D)) Guadalhorce river (code 25), (E,F)) Vélez river (code 31) and (G,H)) Guadalfeo river (code 43). In magenta the location of the MSC water divide. a) Zafarraya polje, b) Mesa de Zalía tufa and c) Padul–Nigüelas basin.
The PDM surface (Figure 5B) depicts the accumulated uplift by this rising orogen since the late Tortonian–early Messinian onwards, that is, from the onset of the emergence of the Betic Cordillera in the zone and the eventual disconnection of the Atlantic and Mediterranean basin to the closure of the Mediterranean basin. Later, we will compare the results of theoretical uplift triggered by erosional unloading (isostatic values from pre-incision surfaces) to uplift values related to the proxy computation of Paleogeoid deformation from a pre-generalized denudation. At this point, is relevant to note that both kinds of models (PDM and Paleogeoid) result from quite different conceptual and theoretical approaches.
5. Discussion
5.1. Denudation and GR Distribution for the Individual Fluvial Basins
Following [18], drainage basins are functional units featuring erosional processes within an orogen. In the studied area, the distribution of GR displays a complex spatial distribution, especially in the largest basins of the Mediterranean slope (e.g., the 25 Guadalhorce, 43 Guadalfeo, 14 Guadiaro and 31 Velez), illustrating patterns of drainage development and the evolution of denudation throughout the range. The large dissymmetry between the Atlantic and Mediterranean slopes of the range for all the computed surface models highlights the principal role played by the MSC in the whole Betic Cordillera.
The Guadalhorce basin (25) is the largest drainage basin in the back-arc zone of the Gibraltar Strait (Figure 1), accumulating a relevant part of the erosion triggered by the MSC due to its size. The GR model of the Guadalhorce basin evidences that major denudations (higher GR values) are concentrated in the southern half of the basin (Figure 6C,D), to the south of the ancient Atlantic–Mediterranean water divide and exposed to the relevant sea level fall that occurred during the MSC [23]. In the southern zone of the basin, a fluvial incision followed an overall NW–SE direction imposed by the geological structure of the zone and, consequently, denudations appeared as linear features with similar orientations in the GR model (Figure 6C). The computed GR values in the Mediterranean slope reach a maximum close to 900 m (concentrated in the gorges zone), but mean GR values of c. 400–500 m are widely extended in this side. On the contrary, the northern sector of the Guadalhorce basin has lower GR values of c. 250 m. The asymmetry in the fluvial dissection within this particular basin (Figure 6D) evidences the younger fluvial capture of the northern half of the basin during post-Pliocene times, draining—up to that time—towards the Atlantic [28]. Considering these two paleogeographical sectors of the Guadalhorce basin, the northern denudation plate is of 281.16 m (538.51 km3/ 1972.70 km2), whilst the southern one is of 442.06 m (611.99 km3/ 1465.95 km2). This asymmetry in the mean denudation values points out that about 61% of the fluvial erosion was concentrated in the old Mediterranean slope of the basin. Since the gigantic imbalance between the Mediterranean and Atlantic erosional base levels in the zone only occurred during the MSC, it seems logical to assign the main part of the evaluated disbalance in erosion, denudation and geophysical relief to that period.
Adjacent to the Guadalhorce basin, the Guadiaro (14) and the Vélez (31) basins also show similar north–south asymmetry in their GR values (Figure 6E–F for the Vélez basin; Table 2). Tis is also related to the partitioning of the denudation along the ancient Atlantic–Mediterranean water divide. However, whilst, in the Guadalhorce basin, both realms (ancient Atlantic and Mediterranean slopes) show evenly distributed areas, in these two other basins, the Atlantic realm is clearly small (Figure 6E–F for the Vélez basin), but still showing quite lower GR values (<200 m). In the case of the Guadiaro basin, a relatively flat area (20x12 km) north of Ronda shows little overall fluvial incision despite the recent fluviokarstic capture of the area from the Mediterranean slope [46]. This capture process allowed the formation of an impressive gorge throughout the locality of Ronda, known as the “El Tajo de Ronda”. Tobaceous platforms at the base of this urban gorge are dated to 95,500 BP (MIS 5), postdating the capture of the area [47,48]. In the case of the Vélez basin, there is not a true process of fluvial piracy, since the northern sector of this basin is constituted by the Zafarraya polje, one of the largest functional karstic depressions (150 km2) within the Betic Cordillera, e.g., [49], which can be considered as a surface gap of the drainage connectivity in this sector of the range (Figure 6F). However, thick tuffaceous formations south of the poljé within the Mediterranean slope (Mesa de Zalia; Figure 6F) indicate south-directed subsurface drainage dating between 80,000 and 127,000 B.P. [47], pointing again to a last interglacial age (MIS 5) as the minimum age for the initial subsurface capture of this basin (not completed at surface).

Table 2.
Geophysical relief, total eroded volume and related data for individual basins crosscut by the MSC water divide and for each paleogeographic domain, Atlantic or Mediterranean, also separated by the MSC water divide.
The GR models for the Guadiaro (14) and Velez (31) basins show a similar pattern in fluvial incision to that shown by the Guadalhorce basin (Figure 4C). In all these cases, drainage dissection follows an overall NW–SE direction imposed by the arcuate structure of the Cordillera in this sector. In both cases, GR values of the southern sector (Mediterranean slope) are nearly double those recorded in the northern sectors (Atlantic slope) (Table 2; Figure 6E–F). These morphometric relationships also highlight the relevance of the MSC in the fluvial dissection and enhanced fluvial unloading of this area.
The Guadalfeo basin (43) is one of the largest (1296 km2) in the studied area (WCBC), constituting the easternmost basin analyzed in this work since, from this zone, the Eastern Betic Cordillera starts. This basin shows the largest GR values of all the studied zones (Figure 6G–H), mainly linked to the impressive gorges developed within its central zone and the southern slopes of Sierra Nevada with c. 1500 m of denudation (Table 2). This basin, draining to the Mediterranean during the MSC [20,23,50], does not show any relevant asymmetry in the erosion and no relevant Mediterranean fluvial capture process can be depicted. However, the presence of outcropping Plio-Pleistocene endorheic continental sequences (Padul–Nigüelas basin) located in the northernmost part of the Guadalfeo basin evidence a small amount of fluvial piracy [51]. As in the case of the Velez basin, the northernmost part of the Guadalfeo basin is still endorheic [52,53], decoupling surface drainage between the Atlantic and Mediterranean slope. However, and as also recorded in the adjacent Granada and Guadix-Baza basins draining towards the Guadiana basin (to the Atlantic), the dominant processes in these zones since the middle Pleistocene has been the aggressive fluvial capture of the Atlantic slope against the Mediterranean one, e.g., [54]. Similar aggressive processes of the Duero basin (Atlantic) against the Ebro basin (Mediterranean) have been recently proposed for central Spain [55]. Consequently, seems that the northern zone of the studied area constitutes the knickpoint between the erosive competition of the Atlantic and Mediterranean slopes of the Iberian Peninsula after the MSC.
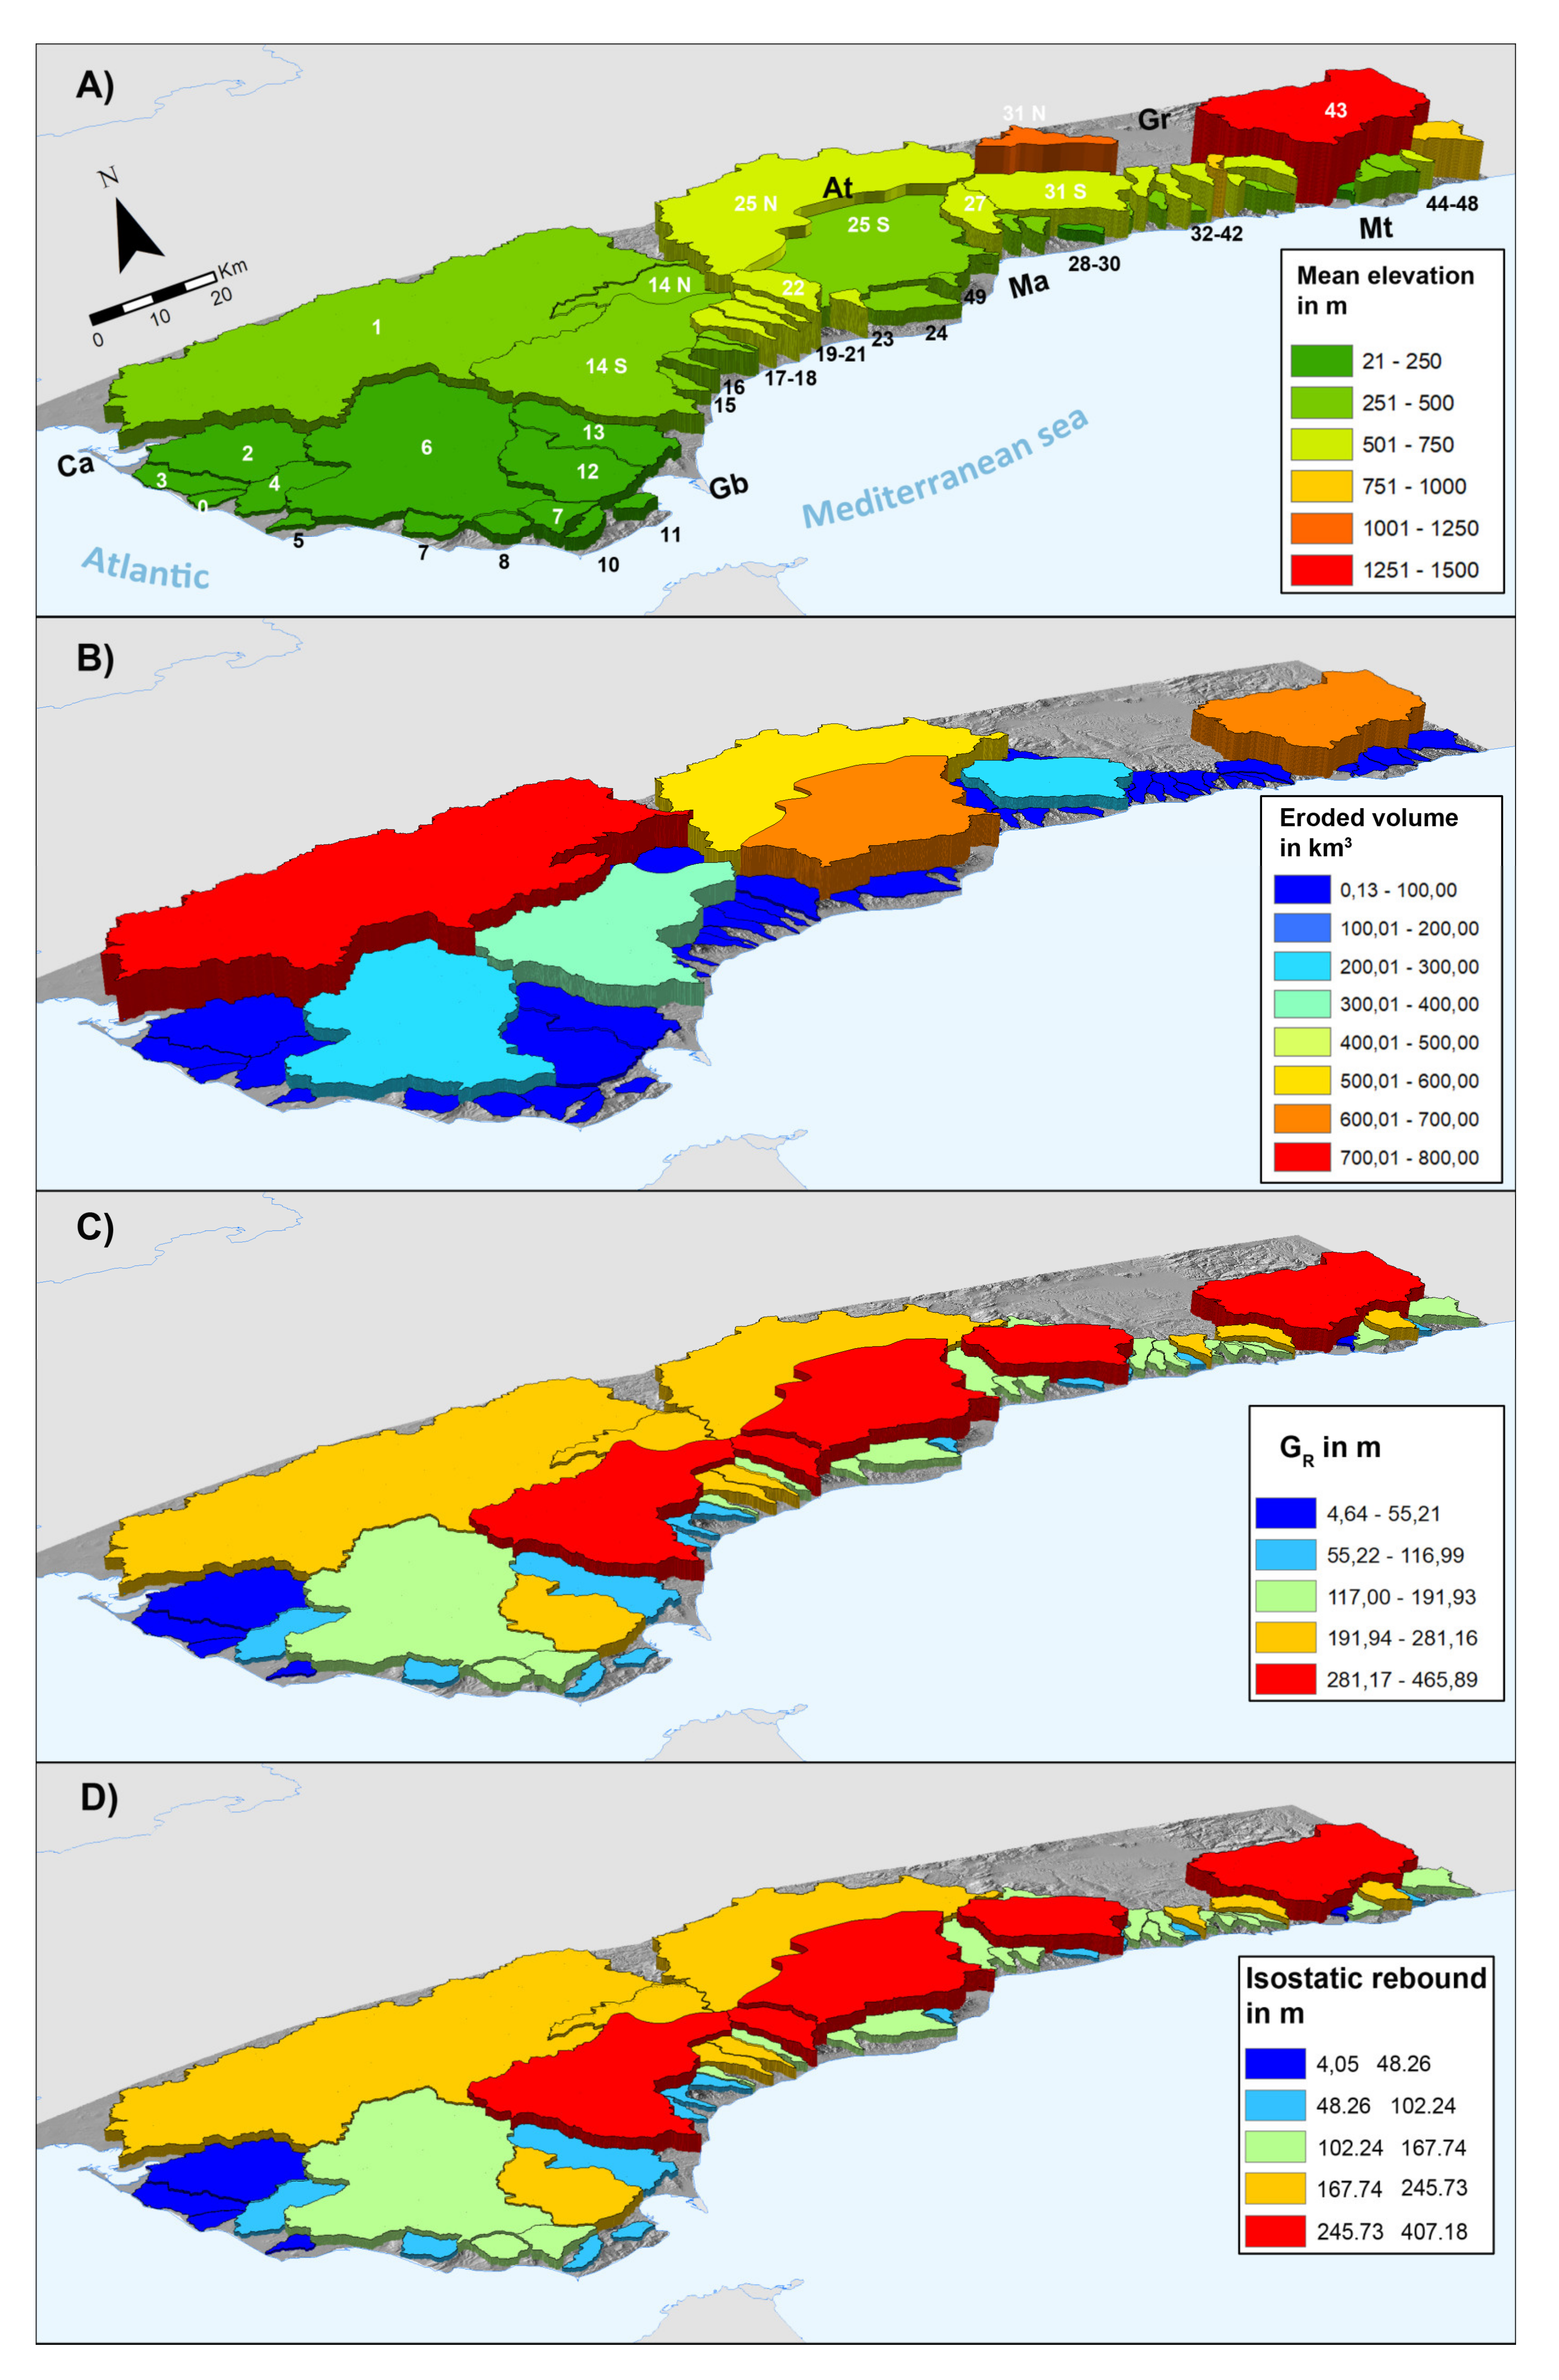
The rest of the small basins draining to the Mediterranean also show a differentiation in their GR values in relation to the ancient water divide, also showing clearly larger values for the Mediterranean slope (see Table 1 and Figure 7C).
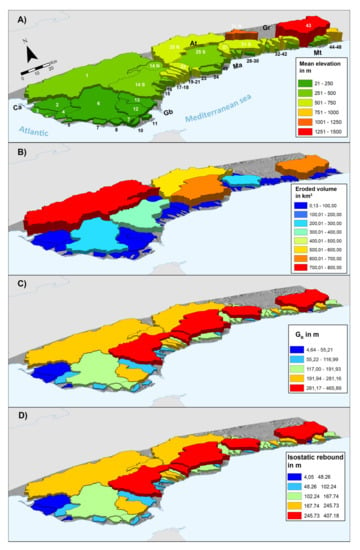
Figure 7.
Three-dimensional view bar diagrams of the studied area where the base of the bar is the limit of the fluvial basin and the height is the value of (A) mean elevations of the actual fluvial basins, (B) total volume of eroded material in km3, (C) thickness of denudation plates (GR values ), and (D) isostatic uplift (in m) caused by erosional unloading. Note that basins 25, 14 and 31 are separated in two sectors across the MSC water divide to evidence its relevance in the denudation process. At: Antequera, Ca: Cádiz, Gb: Gibraltar, Gr: Granada, Ma: Málaga, Mt: Motril.
In contrast, the GR distributions in the Mediterranean basins strongly contrast with those in the Atlantic slope, north of the ancient water divide of the Cordillera. The Guadalete basin (basin 1; Figure 6A–B) accounts for one of the largest amounts of volume eroded (702.80 km3) in the Gibraltar arc; however, due to its large size, the resulting GR values (207.04 m) and isostatic response (167.51 m) are quite moderate. Consistently, this basin does not show relevant fluvial incision, which is typically concentrated eastwards along the present ridgeline of the Gibraltar Arc.
5.2. Spatial and Temporal Evolution of the Isostatic Response to Erosional Unloading for the WCBC
In the Guadalhorce (25), Vélez (31), Guadiaro (14) and adjacent basins, differential erosional unloading and uplift have occurred since the MSC. Pliocene post-Zanclean sequences are located nowadays at c. 100 m a.s.l. near the Mediterranean coast [28]. Here, and by applying Airy isostasy, i.e., [43], calculating uplift rebound due to erosional unloading offers mean uplift values of 236.85 ± 20 m in the northern sector and of 372.40 ± 20 m in the southern sector (Table 2). Those values are similar to the accumulated surface uplift computed from paleogeoid models (c. 345 m), as calculated for the Guadalhorce basins by [28]. It is notable that the late Tortonian to early Messinian littoral sediments in the zone are presently located at elevations between 400 and 700 m [31] and littoral geomorphologic markers are also at 650-700 m above sea level [28] (Figure 5). Then, when comparing the computed values of uplift obtained here (c. 370 m) with the bulk uplift of the area coming from upraised Late Neogene stratigraphic markers and landforms in the zone (400–700 m), it seems quite evident that near 45–55% of the uplift was triggered by erosional unloading. Airy isostasy for the Guadalfeo basin (43) results in some 392.48 ± 20 m of uplift (Table 1), also compatible with the late Tortonian–early Messinian shallow marine deposits currently located at c. 1.300 m in Sierra Nevada and the overall increase in the actual elevation of the range towards the E.
Since sea level is supposed to be uniform at both slopes of the Betic Cordillera after the Zanclean refilling of the Mediterranean, e.g., [26], the asymmetry in uplift values for the two sectors of the Guadalhorce basin is a clear consequence of the stronger erosional rock removal caused by the sea level fall during the MSC. Then, the difference in the isostatic uplift between the Mediterranean (372.40 ± 20 m) and Atlantic (236.85 ± 20 m) slopes can be mainly attributed to MSC erosion. The difference in the surface uplift between both slopes (c. 135 ± 20 m) indicates uplift rates of about 0.21 mm/y in the Mediterranean slope and virtually null in the Atlantic one during this period. These rates fit well with those estimated by other authors using different approaches for the whole Cordillera and of 0.05 mm/y, decreasing to 0.02 mm/y towards the Gibraltar Strait [27].
For the WCBC, the total volume of eroded materials (late Tortonian–early Messinian to Present) accounts for 3853.76 km3 (Table 1). For comparison purposes, it is worth noting that the total volume of the studied area from 0 m above sea level to its present elevation occupies 6880.67 km3, that is, the total eroded volume from the late Tortonian–early Messinian to the present represents 56% of the current relief of the range in the studied area. In accordance, the mean elevation of the individual drainage basin is 441.38 m, while the mean GR result is 593.15 m. This means that the denudation plate corresponding to the whole set of basins is 34.38% larger than their present average elevation (Figure 7).
At the scale of the range (Table 2) the mean GR value for the northern side of the range (ancient Atlantic slope) is 123.21, while it is 182.44 m for the southern ancient Mediterranean slope, again characterizing the asymmetric denudation along the Betic orogen (Figure 7). Despite the different amounts of eroded volume and the different mean elevations for each individual basin (Figure 7A,B and Table 2), those located in the ancient Mediterranean slope display quite significantly greater individual GR values (281–465 m for the largest basins) than those located in the Atlantic slope (<281 m) (Figure 7C).
In the same way, the spatial distribution of uplift in the WCBC shows a comparable pattern to that of the resulting geophysical relief (GR), with maximum values in the range of 245–407 ± 20 m, always in the Mediterranean slope. Uplift in the Atlantic slope is smaller, with values ranging from 138 to 236 ± 20 m. These differences are also noticeable even for the smaller basins with larger individual uplift values in the Mediterranean slope (c. 50 to 150 ± 20 m) compared to the Atlantic one (c. 3 to 130 ± 20 m). Considering the mean values of uplift for the ancient paleogeographic sectors, again, the Atlantic side (99,69 ± 20 m) offers smaller values than the Mediterranean one (153.69 ± 20 m). Accordingly, the present mean elevations (m a.s.l.) for each paleogeographic sector of the range also display clear asymmetry for the ancient Atlantic (359.17 m) and Mediterranean (596.76 m) sectors (Table 2). The erosional, uplift and present elevation asymmetry displayed by the two slopes of the Betic orogen from the individual basin scale to the mean values of the ancient paleogeographic sectors reinforce the idea that differential denudation during the MSC strongly conditioned the further paleogeographical evolution and erosion patterns of the orogen.
After the MSC erosion, Pliocene to Quaternary fluvial dissection re-shaped the Late Neogene landscape in the old Mediterranean slope, generating the existing impressive gorges and the subsequent capture of different sectors of the old Atlantic slope of the range. For the studied basins, there is a kind of spatial and temporal organization of the piracy process which appears to progress from west to east. In the west, the headwaters of the Guadiaro (24) and Guadalhorce (25) basin were captured during the Pleistocene [28], whilst the Vélez (31) and Guadalfeo (43) basins still present significant surface drainage gaps around the Late Neogene water divide.
5.3. Erosional Compensation in the WCBC
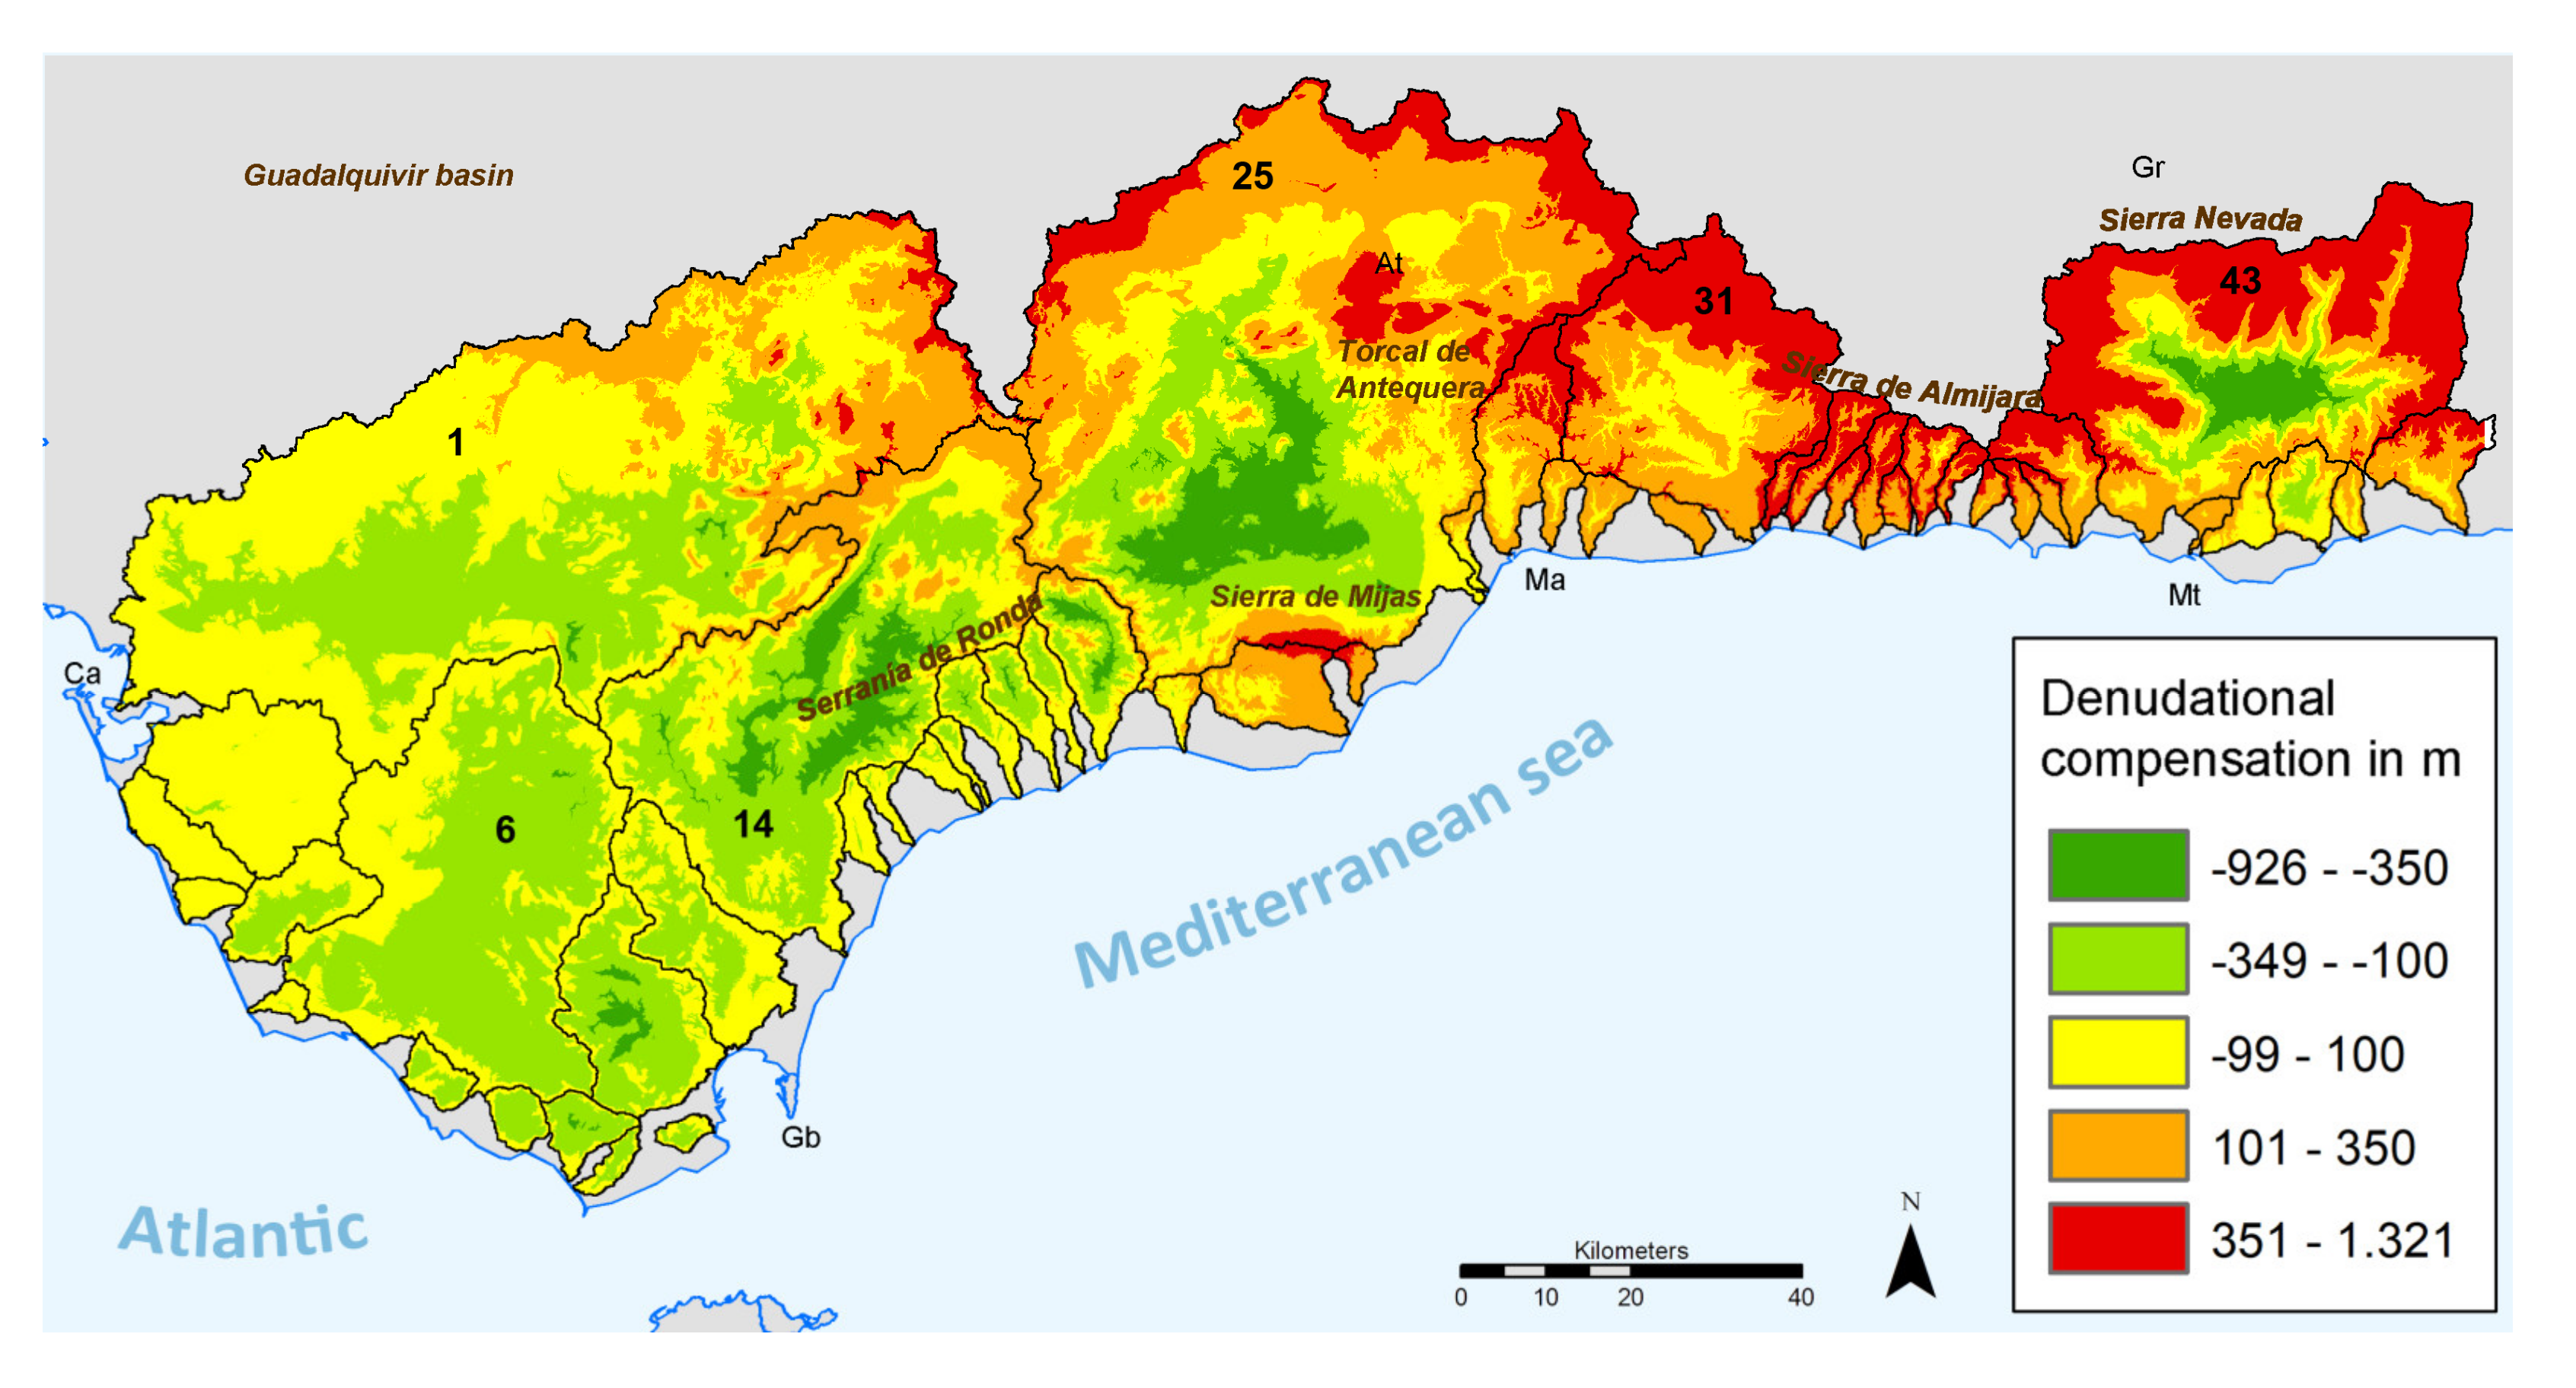
The GR surface model (Figure 3C) can be transformed in the corresponding isostatic rebound (m of uplift per meter of denudation) by applying the Airy isostasy, e.g., [18] offering a continuous model of the surface uplift triggered by erosional unloading. If the resulting model is subtracted from the late Tortonian–early Messinian PDM, we obtain the current total amount of elevation for that given time interval (Figure 8). The surface model displayed in Figure 8 is divided in five elevation intervals based on the statistical distribution of the data: a) the −100 to 100 m interval (yellow) identifies the compensated areas in which both models show approximately the same results; b) the < −100 m interval (green) indicates the overcompensated areas in which erosion is still active and denudation is larger than total uplift; c) the > 100 m (red) interval indicates the undercompensated areas in which erosion has still not compensated the total uplift in the area since the MSC. Note that overcompensated areas mark the places where uplift is backfeeding denudation and renewed isostatic rebound in a sort of dynamic equilibrium, controlling the evolution of the topography and the relief.
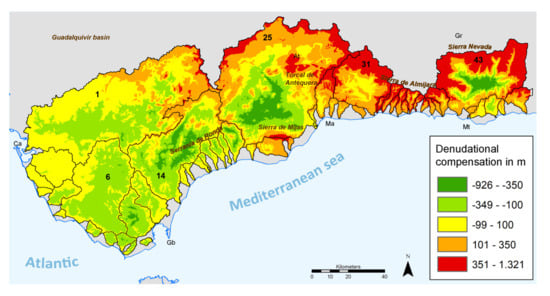
Figure 8.
Result of the subtraction of the late Tortonian–early Messinian PDM (accounting for all vertical elevations since that time onwards) minus the overall isostatic model (Airy isostasy calculated from RG). From a denudational standpoint, yellow zones are compensated, green zones overcompensated and red undercompensated. Categories are separated based on a statistical distribution of the model values (Natural Jenks distribution: five classes). At: Antequera, Ca: Cádiz, Gb: Gibraltar, Gr: Granada, Ma: Málaga, Mt: Motril.
In the studied area, the resulting comparison model shows a widespread dominance of compensated and overcompensated zones in the W and SW sectors (Figure 8). On the contrary, undercompensated areas dominate in the N and NE sector around Sierra Nevada, the most uplifted zone of the whole Betic Cordillera. In the central part of the studied area (basins 14 and 25), some protruding paleoreliefs along the ancient Messinian water divide (Serranía de Ronda, Torcal de Antequera, Lijar and Grazalema ranges) are still compensating, displaying red and orange colors (Figure 8). These undercompensated paleoreliefs are older than the onset of the MSC, and were working as emergent islands shortly before the Atlantic–Mediterranean disconnection [28]. Southwards, the Sierra de Mijas shows important values of post late Tortonian uplift, indicating, in this case, under-compensation, mainly due to local tectonic uplift [31]. In general, the larger basins display compensation in their central areas, but this progressively decreases towards the ridgeline areas, as is the case of the Guadalhorce (25), Vélez (31) and Guadafeo (43) basins. However, a similar pattern occurs in the small basins in the western zone, which are totally undercompensated (Figure 8), indicating that the process is regional and independent of the scale. In contrast, the entire eastern sector is clearly overcompensated and only the ridgeline between the Guadiaro basin (14) and the Guadalete (1) basins is still compensating, showing that the ridgeline areas are the last zones to reach the isostatic compensation.
For the whole range, the lack of denudational compensation in the north and east of the range is probably the triggering cause of the recent captures of the northernmost sectors of the Guadalhorce, Guadalfeo, Vélez and Guadiaro rivers. The crossover of the surface models of Geoid deformation (PDM) and the geophysical relief distribution indicate that the present relief of a mountain range can be interpreted in terms of the denudational state of an orogeny. Both surface models (PDM and GR) came from quite different theoretical approaches and hold different geological meanings; however, they form good theoretical relationships and correlations, emerging as reliable geospatial tools to quantitatively analyze the topographic evolution of an orogen.
5.4. Regional Implications for the Iberian Peninsula
In previous sections, we highlighted the important asymmetry of the Betic Cordillera, regarding the differential denudation, uplift and present elevation between the Atlantic and Mediterranean slopes of the orogeny. This asymmetry was mainly achieved during the MSC, when erosional base levels on both sides of the orogen were unproportioned at a nearly kilometric scale. However, once generated, the asymmetry the erosional disbalance was sustained during the following Plio-Quaternary evolution of the area, producing an important clastic sedimentation towards the Alboran Sea [27]. Under this geological scenario, isostasy due to erosional unloading of the Cordillera sustained differential uplift [17], hence the regional tilting of the whole area towards the W–NW (Figure 2). This regional tilting will affect not only the Betic Cordillera, but also the whole Mediterranean slope of the Iberian Peninsula and might be behind the historically reported westward tilting of the Iberian Peninsula [55,56]. In fact, the continental divide of Iberia shows a clear asymmetric pattern with the Quaternary water divide anomalously placed to the east, facilitating the drainage of about 70% of the territory towards the Atlantic. In this scenario, regional tilting assisted the Atlantic capture of the Late Neogene basins of the central part of the peninsula (Duero, Tagus, Guadiana and Guadalquivir). Only the Ebro Basin flows to the Mediterranean, since was the only large drainage basin captured soon before or during the MSC [55,56]. The westward tilting of Iberia has been currently evaluated from 0.12 to 0.08 degrees in DEM analyses of Plio-Quaternary markers, e.g., [57,58]. These values of tilting can be easily assumed from the differential uplift evaluated for the studied area and are sufficient to favor the Atlantic drainage of most of the territory (see Fig, 1). The present study suggests that the differential erosion that occurred during the MSC had a deep impact on the former topographic and geomorphologic evolution of the whole Iberian Peninsula. The Gibraltar Back Arc represents a critical area in the Atlantic–Mediterranean linking zone that is not comparable with any other zone of the Mediterranean basin affected by the MSC and is exceptionally sensitive to drainage erosion.
6. Conclusions
This work offers a complete GIS-based methodology for the assessment of the total volume of eroded material in a mountain range, based on previous proposals [14,16,28]. We also show how paleogeoid reconstructions (PDM models) obtained from stratigraphic and geomorphological markers can be applied to a mountain range, allowing us to evaluate the total uplift undergone by the orogen for a given time interval. The results, in the form of DEMs for the study area or disaggregated in partial evaluations for individual fluvial basins (erosional functional units), allow us to reconstruct some relevant geo-parameters: geophysical relief (GR), surface uplift, eroded rock volume and isostatic response to erosional unloading.
Our results indicate that, for the WCBC, in a transect of more than 200 km along the Betic Cordillera, the spatial distribution of the geophysical relief and subsequent isostatic uplift is strongly constrained by the ancient Messinian Atlantic–Mediterranean water divide. Higher values of uplift always occur in the ancient Mediterranean slope (245–407 ± 20 m), whilst the Atlantic side records smaller values (138–236 ± 20 m). This asymmetry is the primary effect of the stronger rock removal in the Mediterranean slope, produced by the sharp sea level drop linked to the MSC. The mean uplift generated during the MSC and after the Zanclean refilling of the Mediterranean is of 135 ± 20 m, offering rates of 0.21 mm/y for the Mediterranean slope and practically null (0.01 mm/y) in the Atlantic.
The total eroded rock volume from the late Messinian to the present (3853.76 km3) represents 56% of the current relief of the range in the studied area. This entails some 6281 km3 of sediment production, of which 4700 km3 were drained to the Alboran basin (Mediterranean).
This work evidences that isostatic uplift caused by erosional unloading in the Gibraltar Back Arc (WCBC) is one of the main processes controlling the landscape evolution and topographic elevation during and after the MSC and up to the present day. The results clearly indicate that uplift triggered by erosional unloading (isostatic rebound) is partitioned along the range and can achieve around 50-55% of the total recorded uplift. This explains why fluvial basins on both sides of the late Neogene water divide show different mean elevations (larger in the Mediterranean slope) and the northwards retreat of the outstanding ridgeline, in some cases more than 25 km inland. The identified major isostatic rebound in the WCBC is not considered in most tectonic evolutive models for the Betic orogen, with many assuming that most of the elevation was of tectonic origin. However, one of the first published works identifying isostatic–tectonic slip partitioning in a fault (the Baza Fault, also within the Betics; [16]) found that almost 13% of the fault throw responded exclusively to denudational isostatic rebound during the late Pleistocene–Holocene, that is, a total of 15 ±2 m of uplift, with rates up to 0.31 mm/y, even larger that the rates obtained in this work (0.21 mm/y) from the Plio-Quaternary. This is significant, because the occurrence of partitioning slip on individual faults may indicate that regional uplift can also be accommodated along faults, allowing for important variations in differential uplift over relatively short distances.
The comparison of the calculated Airy isostatic response model with the late Messinian PDM (overall uplift response) offers suggestive results: 1) it identifies the areas of the range that are in almost isostatic equilibrium (most of the west sector of the studied zone) and where erosional process are fed back by ongoing isostatic uplift (undercompensated areas); 2) it illustrates how the erosional feedback process initiates in the central parts of the individual basins and progresses outwards to the ridgelines, which are the latest zones to reach equilibrium; 3) the models identify some protruding paleoreliefs and large parts of the most elevated areas (around Sierra Nevada) are the zones in which erosion is now actively taking place (over- and undercompensated zones); 4) the models also explain the northward captures of the Mediterranean rivers and their relative timing, since the process progresses from west (older) to east (younger), in accordance with the evolution of the erosion state, and is dominantly in equilibrium towards the W, while it is overcompensated and undercompensated to the E.
The overall isostatic response seems to be quite interconnected with the external processes eventually driving an important part (50-55 %) of the surface uplift undergone by the orogen. However, the lessons learned in this work indicate that the singular geological scenario generated by the MSC in the Atlantic–Mediterranean linking zone (Gibraltar Arc) favored increasing differential erosion and differential uplift along the rising Betic orogen, triggering the westwards tilting of the area and, ultimately, the westwards tilting of the Iberian Peninsula. This process not only conditioned the subsequent topographic evolution of the Betic Cordillera, but also that of the entirety of central Spain, facilitating the Atlantic capture of the old endorheic Neogene basins.
Author Contributions
The main contributions are as follows: conceptualization was performed by P.G.S. and J.E. The methodology was developed by J.E. and P.G.S. Formal analysis and investigation were carried out by J.E., P.G.S. and A.M.M.-G. The writing and preparation of the original draft were conducted by J.E. and P.G.S. and the review and editing of the final manuscript was performed by J.E., P.G.S. and A.M.M.-G.; funding was acquired by P.G.S. All authors have read and agreed to the published version of the manuscript.
Funding
This study was funded by the MINECO-FEDER Spanish research projects CGL2015-67169-P (QTETCSPAIN-USAL) and the 2009-2012 EUROCORES-TOPOMED PROGRAM through the Spanish research project CGL2008-03474-E/BTE (CSIC), produced by the USAL TopoMed—Spain Onshore Research Group.
Acknowledgments
Authors want to sincerely acknowledge the work of the reviewers in the manuscript with special thanks to J.V Pérez Peña, editor of the volume.
Conflicts of Interest
The authors declare no conflict of interest.
References
- Rahl, J.M.; Ehlers, T.A.; van der Pluijm, B.A. Quantifying transient erosion of orogens with detrital thermochronology from syntectonic basin deposits. Earth Planet. Sci. Lett. 2007, 256, 147–161. [Google Scholar] [CrossRef]
- Herman, F.; Seward, D.; Valla, P.G.; Carter, A.; Kohn, B.; Willett, S.D.; Ehlers, T.A. Worldwide acceleration of mountain erosion under a cooling climate. Nature 2013, 504, 423–426. [Google Scholar] [CrossRef] [PubMed]
- Sueoka, S.; Tsutsumi, H.; Tagami, T. New approach to resolve the amount of Quaternary uplift and associated denudation of the mountain ranges in the Japanese Islands. Geosci. Front. 2016, 7, 197–210. [Google Scholar] [CrossRef]
- Montgomery, D.R.; Brandon, M.T. Topographic controls on erosion rates in tectonically active mountain ranges. Earth Planet. Sci. Lett. 2002, 201, 481–489. [Google Scholar] [CrossRef]
- Montgomery, D.R. Predicting landscape-scale erosion rates using digital elevation models. Comptes Rendus Geosci. 2003, 335, 1121–1130. [Google Scholar] [CrossRef]
- Brook, E.; Brown, E.; Kurz, M.; Ackert, R.; Raisbeck, G.; Yiou, F. Constraints on age, erosion, and uplift of Neogene glacial deposits in the Transantarctic Mountains determined from in situ cosmogenic 10Be and 26Al. Geology 1995, 23, 1063–1066. [Google Scholar] [CrossRef]
- Brown, E.; Stallard, R.; Larsen, M.; Raisbeck, G.; Yiou, F. Denudation rates determined from the accumulation of in situ-produced 10Be in the luquillo experimental forest, Puerto Rico. Earth Planet. Sci. Lett. 1995, 129, 193–202. [Google Scholar] [CrossRef]
- Norton, K.; Blanckenburg, F.; DiBiase, R.; Schlunegger, F.; Kubik, P. Cosmogenic 10Be-derived denudation rates of the Eastern and Southern European Alps. Int. J. Earth Sci. 2011, 100, 1163–1179. [Google Scholar] [CrossRef]
- Olivetti, V.; Cyr, A.J.; Molin, P.; Faccenna, C.; Granger, D.E. Uplift history of the Sila Massif, southern Italy, deciphered from cosmogenic 10Be erosion rates and river longitudinal profile analysis. Tectonics 2012, 31, TC3007. [Google Scholar] [CrossRef]
- De Quay, G.S.; Roberts, G.G.; Rood, D.H.; Fernandes, V.M. Holocene uplift and rapid fluvial erosion of Iceland: A record of post-glacial landscape evolution. Earth Planet. Sci. Lett. 2019, 505, 118–130. [Google Scholar] [CrossRef]
- Dietrich, W.E.; Dunne, T. Sediment budget for a small catchment in mountainous terrain. Z. Geomorphol. 1978, 29, 191–206. [Google Scholar]
- Khulemann, J.; Frisch, W.; Dunkl, I.; Székely, B. Quantifying tectonic versus erosive denudation by the sediment budget: The Miocene core complexes of the Alps. Tectonophysics 2001, 330, 1–23. [Google Scholar] [CrossRef]
- Walsh-Kennedy, S.; Aksu, A.E.; Hall, J.; Hiscott, R.N.; Yaltırak, C.; Çifçi, G. Source to sink: The development of the latest Messinian to Pliocene–Quaternary Cilicia and Adana Basins and their linkages with the onland Mut Basin, eastern Mediterranean. Tectonophysics 2014, 622, 1–21. [Google Scholar] [CrossRef]
- Menéndez, I.; Silva, P.G.; Martín-Betancor, M.; Pérez-Torrado, F.J.; Guillou, H.; Scaillet, S. Fluvial dissection, isostatic uplift, and geomorphological evolution of volcanic islands (Gran Canaria, Canary Islands, Spain). Geomorphology 2008, 102, 189–203. [Google Scholar] [CrossRef]
- Silva, P.G.; Ribó, A.; Martín-Betancour, M.; Huerta, P.; Perucha, M.A.; Zazo, C.; Goy, J.L.; Dabrio, C.J.; Bardají, T. Relief production, uplift and active tectonics in the Gibraltar arc (South Spain) from the Late Tortonian to the present. In Proceedings of the 2nd INQUA-IGCP-567, Corinto, Greece, 19–24 September 2011; Grützner, C., Pérez-López, R., Fernández Steeger, T., Papanikolaou, I., Reicherter, K., Silva, P.G., Vött, A., Eds.; pp. 227–230, ISBN 978-960-466-093-3. [Google Scholar]
- Fernández-Ibañez, F.; Pérez-Peña, J.V.; Azor, A.; Soto, J.I.; Azañon, J.M. Normal faulting driven by denudational isostatic rebound. Geology 2010, 38, 643–646. [Google Scholar] [CrossRef]
- Elez, J.; Silva, P.G.; Huerta, P.; Martínez-Graña, A. Isostatic compensation in the Western Betic Cordillera (South Spain) caused by erosional unloading from the Messinian to the present: The Emergence of an Orogen. Geogaceta 2018, 64, 103–106. [Google Scholar]
- Small, E.E.; Andersson, R.A. Pleistocene relief production in Laramide mountain ranges. Geology 1998, 26, 123–136. [Google Scholar] [CrossRef]
- Hsü, K.J.; Montadert, L.; Bernoulli, D.; Cita, M.B.; Erickson, A.; Garrison, R.E.; Kidd, R.B.; Mélières, F.; Müller, C.; Wright, R. History of the Mediterranean salinity crisis. Nature 1977, 267, 399–403. [Google Scholar] [CrossRef]
- Braga, J.C.; Martín, J.M.; Quesada, C. Patterns and average rates of late Neogene-Recent uplift of the Betic Cordillera, SE Spain. Geomorphology 2003, 50, 3–26. [Google Scholar] [CrossRef]
- Mattei, M.; Cifelli, F.; Martín Rojas, I.; Crespo Blanc, A.; Comas, M.; Faccenna, C.; Porreca, M. Neogene tectonic evolution of the Gibraltar Arc: New paleomagnetic constrains from the Betic chain. Earth Planet. Sci. Lett. 2016, 250, 522–540. [Google Scholar] [CrossRef]
- Martín, J.M.; Puga, J.; Aguirre, J.; Braga, J.C.; Betzler, C. Miocene Atlantic-Mediterranean seaways in the Betic Cordillera (southern Spain). Rev. Soc. Geológica España 2014, 27, 175–186, ISSN 0214-2708. [Google Scholar]
- Flecker, R.; Krijgsman, W.; Capella, W.; de Castro Martíns, C.; Dmitrieva, E.; Mayser, J.P.; Marzocchi, A.; Modestou, S.; Ochoa, D.; Simon, D.; et al. Evolution of the Late Miocene Mediterranean–Atlantic gateways and their impact on regional and global environmental change. Earth-Sci. Rev. 2015, 150, 365–392. [Google Scholar] [CrossRef]
- Blanc, P.L. Improved modelling of the Messinian Salinity Crisis and conceptual implications. Palaeogeogr. Palaeoclimatol. Palaeoecol. 2006, 238, 349–372. [Google Scholar] [CrossRef]
- García-Castellanos, D.; Estrada, F.; Jiménez-Munt, I.; Gorini, C.; Fernández, M.; Vergés, J.; De Vicente, R. Catastrophic flood of the Mediterranean after the Messinian salinity crisis. Nature 2009, 462, 778–781. [Google Scholar] [CrossRef]
- Micallef, A.; Camerlenghi, A.; Garcia-Castellanos, D.; Cunarro Otero, D.; Gutscher, M.A.; Barreca, G.; Spatola, D.; Facchin, L.; Geletti, R.; Krastel, S.; et al. Evidence of the Zanclean megaflood in the eastern Mediterranean Basin. Sci. Rep. 2018, 8(1078), 1–8. [Google Scholar] [CrossRef]
- Iribarren, L.; Vergés, J.; Fernandez, M. Sediment supply from the Betic–Rif orogen to basins through Neogene. Tectonophysics 2009, 475, 68–84. [Google Scholar] [CrossRef]
- Elez, J.; Silva, P.G.; Huerta, P.; Perucha, M.A.; Civis, J.; Roquero, E.; Rodríguez-Pascua, M.A.; Bardají, T.; Giner Robles, J.L.; Martínez Graña, A. Quantitative paleotopography and paleogeography around the Gibraltar Arc (South Spain) during the Messinian Salinity Crisis. Geomorphology 2016, 275, 26–45. [Google Scholar] [CrossRef]
- Govers, R.; Meijer, P.; Krijgsman, W. Regional isostatic response to Messinian Salinity Crisis events. Tectonophysics 2009, 463, 109–129. [Google Scholar] [CrossRef]
- Guerra-Merchán, A.; Francisco Serrano, J.; García-Aguilar, M.; Sanz de Galdeano, C.; Ortiz, J.E.; Torres, T.; Sánchez-Palencia, Y. The Late Cenozoic landscape development in the westernmost Mediterranean (southern Spain). Geomorphology 2019, 327, 456–471. [Google Scholar] [CrossRef]
- Sanz de Galdeano, C.; Alfaro, P. Tectonic significance of the present relief of the Betic Cordillera. Geomorphology 2004, 63, 175–190. [Google Scholar] [CrossRef]
- Dewey, J.F.; Helman, M.L.; Knott, S.D.; Turco, E.; Hutton, D.H.W. Kinematics of the western Mediterranean. In Alpine Tectonics, Special Publication of the Geological Society; Coward, M.P., Dietrich, D., Park, R.G., Eds.; Geological Society: London, UK, 1989; Volume 45, pp. 265–283. [Google Scholar] [CrossRef]
- Luján, M.; Crespo-Blanc, A.; Balanyá, J.C. The Flysch Trough thrust imbricate (Betic Cordillera): A key element of the Gibraltar Arc orogenic wedge. Tectonics 2006, 25, TC6001. [Google Scholar] [CrossRef]
- Crespo-Blanc, A.; Campos, J. Structure and kinematics of the South Iberian paleomargin and its relationship with the Flysch Trough units: Extensional tectonics within the Gibraltar Arc fold and thrust belt (western Betics). J. Struct. Geol. 2001, 23, 1615–1630. [Google Scholar] [CrossRef]
- Schoorl, J.M.; Veldkamp, A. Late Cenozoic landscape development and its tectonic implications for the Guadalhorce valley near Álora (Southern Spain). Geomorphology 2003, 50, 43–57. [Google Scholar] [CrossRef]
- Corbí, H.; Lancis, C.; García-García, F.; Pina, J.A.; Soria, J.M.; Tent-Manclús, J.E.; Viseras, C. Updating the marine biostratigraphy of the Granada Basin (central Betic Cordillera). Insight for the Late Miocene palaeogeographic evolution of the Atlantic–Mediterranean seaway. Geobios 2012, 45, 249–263. [Google Scholar] [CrossRef]
- Morales, J.; Serrano, I.; Jabaloy, A.; Galindo-Saldivar, J.; Zhao, D.; Torcal, F.; Vidal, F.; Gonzalez-Lodeiro, F. Active continental subduction beneath the Betic Cordillera and Alboran Sea. Geology 1999, 27, 735–738. [Google Scholar] [CrossRef]
- Balanyá, J.C.; Crespo-Blanc, A.; Díaz-Azpiroz, M.; Expósito, I.; Torcal, F.; Pérez-Peña, V.; Booth-Rea, G. Arc-parallel vs back-arc extension in the Western Gibraltar Arc: Is the Gibraltar forearc still active? Geol. Acta 2012, 10, 249–263. [Google Scholar] [CrossRef]
- Alia Medina, M.; Portero, J.M.; Martín Escorza, C. Evolución Geotectónica de la región de Ocaña (Toledo) durante el Neógeno y el Cuaternario. Boletín Real Socieda Hist. Nat. 1973, 71, 9–20. [Google Scholar]
- Aguirre, E.; Díaz Molina, M.; Pérez González, A. Datos Paleontológicos y fases tectónicas en el Neógeno de la Meseta Sur Española. Trab. Neógeno-Cuatern. 1979, 5, 7–29. [Google Scholar]
- Ruano, P.; da Silva Fernandes, R.M. Active Deformation in the Iberian Peninsula from Geodetic Techniques. In The Geology of Iberia: A Geodynamic Approach; Quesada, C., Oliveira, J.T., Eds.; Springer: Brandemburg, Germany, 2019; Volume 5, pp. 5–10. ISBN 978-3-030-10398-9. [Google Scholar]
- Hutchinson, M.F.; Xu, T.; Stein, J.A. A recent progress in the ANUDEM elevation gridding procedure. In Proceedings of the Geomorphometry 2011, Redlands, CA, USA, 7–9 September 2011; Hengl, T., Evans, I., Wilson, J., Gould, M., Eds.; pp. 19–22. [Google Scholar]
- Gilchrist, A.R.; Summerfield, M.A.; Cockburn, H.A.P. Landscape dissection, isostatic uplift, and the morphologic development of orogens. Geology 1994, 22, 963–966. [Google Scholar] [CrossRef]
- Haq, B.U.; Hardenbol, J.; Vail, P.R. Chronology of fluctuating sea level since the Triassic. Science 1987, 235, 1156–1167. [Google Scholar] [CrossRef]
- Guerra-Merchán, A.; Serrano, F.; Hlila, R.; El Kadiri, K.; Sanz de Galdeano, C.; Garcés, M. Tectono-sedimentary evolution of the peripheral basins of the Alboran Sea in the arc of Gibraltar during the latest Messinian-Pliocene. J. Geodyn. 2014, 77, 158–170. [Google Scholar] [CrossRef]
- Lechuga Manzano, I.; Gracia Prieto, F.J.; Suma, A.; De Cosmo, P.D. Fases de captura fluviokárstica e incisión del sistema Gaduares-Hundidero-Gato (Serranía de Ronda, provincias de Cádiz y Málaga). Comprendiendo el relieve: Del pasado al futuro. In Proceedings of the XV Reunión Nacional de Geomorfología, Málaga, Spain, 22–25 June 2016; Duran Valsero, J.J., Montes Santiago, M., Robador Moreno, A., Salazar Rincón, A., Eds.; pp. 631–638. [Google Scholar]
- Durán, J.J. Los Sistemas Kársticos de la Provincia de Málaga y su Evolución: Contribución al Conocimiento Paleoclimático del Cuaternario en el Mediterráneo Occidental. Ph.D. Thesis, Universidad Complutense de Madrid, Madrid, Spain, 1996; 404p. [Google Scholar]
- Rodrigo Comino, J.; Senciales González, J.M. Las plataformas travertínicas y tobáceas de la provincia de Málaga (España). Baetica Estud. Artegeografía Hist. 2012, 34, 83–102, ISSN 0212-5099. [Google Scholar]
- Fernández-García, C.; Ruano, P. Caracterización de la geometría del Polje de Zafarraya a partir de prospección gravimétrica (Cordillera Bética). Geogaceta 2016, 59, 67–70. [Google Scholar]
- Hüsing, S.K.; Oms, O.; Agustí, J.; Garcés, M.; Kouwenhoven, T.J.; Krijgsman, W.; Zachariasse, W.J. On the late Miocene closure of the Mediterranean-Atlantic gateway through the Guadix basin (southern Spain). Palaeogeogr. Palaeoclimatol. Palaeoecol. 2010, 291, 167–179. [Google Scholar] [CrossRef]
- Calvache, M.L.; Viseras, C.; Fernandez, J. Controls on fan development-evidence from fan morphometry and sedimentology; Sierra Nevada, SE Spain. Geomorphology 1997, 21, 69–84. [Google Scholar] [CrossRef]
- Alfaro, P.; Galindo-Zaldívar, J.; Jabaloy, J.; López-Garrido, A.C.; Sanz de Galdeano, C. Evidence for the activity and paleoseismicity of the Padul fault (Betic Cordillera, southern Spain). Acta Geol. Hisp. 2001, 36, 283–295. [Google Scholar]
- Delgado, J.; Alfaro, P.; Galindo-Zaldivar, J.; Jabaloy, A.; López-Garrido, A.C.; Sanz de Galdeano, C. Structure of the Padul-Nigüelas Basin (S Spain) from H/V ratios of ambient noise: Application of the method to study peat and coarse sediments. Pure Appl. Geophys. 2002, 159, 2733–2749. [Google Scholar] [CrossRef]
- García Tortosa, F.J.; Sanz de Galdeano, C.; Alfaro, P.; Jiménez Espinosa, R.; Jiménez Millán, J.; Lorite Herrera, M. Nueva evidencia sobre la edad del tránsito endorreico-exorreico de la cuenca de Guadix-Baza. Geogaceta 2009, 44, 211–214. [Google Scholar]
- Struth, L.; García-Castellanos, D.; Viaplana-Muzas, M.; Vergés, J. Drainage network dynamics and knickpoint evolution in the Ebro and Duero basins: From endorheism to exorheism. Geomorphology 2018, 327, 554–571. [Google Scholar] [CrossRef]
- García-Castellanos, D.; Vergés, J.; Gaspar Escribano, J.; Cloething, S. Interplay between tectonics, climate, and fluvial transport during the Cenozoic evolution of the Ebro Basin (NE Iberia). J. Geophys. Res. 2003, 108, 2347. [Google Scholar] [CrossRef]
- Casas-Sainz, A.M.; de Vicente, G. On the tectonic origin of Iberian topography. Tectonophysics 2009, 474, 214–235. [Google Scholar] [CrossRef]
- López-Fernández, C.; Llana-Fúnez, S.; Fernández-Viejo, G.; Domínguez-Cuesta, M.J.; Díaz-Díaz, L.M. Comprehensive characterization of elevated coastal platforms in the north Iberian margin: A new template to quantify uplift rates and tectonic patterns. Geomorphology 2020, 364, 107242. [Google Scholar] [CrossRef]
Publisher’s Note: MDPI stays neutral with regard to jurisdictional claims in published maps and institutional affiliations. |
© 2020 by the authors. Licensee MDPI, Basel, Switzerland. This article is an open access article distributed under the terms and conditions of the Creative Commons Attribution (CC BY) license (http://creativecommons.org/licenses/by/4.0/).

