Article

Changing Patterns of Lakes on The Southern Tibetan Plateau Based on Multi-Source Satellite Data

1
School of Geography and Remote Sensing, Guangzhou University, Guangzhou 510006, China
2
Key Laboratory of Watershed Geographic Sciences, Nanjing Institute of Geography and Limnology, Chinese Academy of Sciences, Nanjing 210008, China
3
Guangdong Key Laboratory of Integrated Agro-Environmental Pollution Control and Management, Institute of Eco-Environmental and Soil Sciences, Guangdong Academy of Sciences, Guangzhou 510650, China
4
National-Regional Joint Engineering Research Center for Soil Pollution Control and Remediation in South China, Guangzhou 510650, China
5
State Key Laboratory of Environmental Criteria and Risk Assessment, Chinese Research Academy of Environmental Sciences, Beijing 100012, China
6
Guangdong Key Laboratory of Ocean Remote Sensing, South China Sea Institute of Oceanology, Chinese Academy of Sciences, Guangzhou 510301, China
*
Author to whom correspondence should be addressed.
Remote Sens. 2020, 12(20), 3450; https://doi.org/10.3390/rs12203450
Submission received: 13 August 2020 / Revised: 13 October 2020 / Accepted: 15 October 2020 / Published: 20 October 2020
(This article belongs to the Special Issue Remote Sensing in Hydrology and Water Resources Management)

Abstract

:
More than 1100 lakes covering an area greater than 4500 km2 are located on the Tibetan Plateau, and these lakes are important regulators of several large and famous rivers in Asia. The determination of hydrological changes that have occurred in these lakes can reflect climate change and supply scientific data to plateau environmental research. Data from high frequency (moderate-resolution imaging spectro-radiometer) MODIS images, altimetry, and the Hydroweb database collected during 2000–2015 were integrated in this study to delineate the detailed hydrological changes of 15 lakes in three basins—Inner Basin, Indus Basin, and Brahmaputra Basin—on the southern Tibetan Plateau. Seven of the 10 lakes in the Inner Basin presented increasing trends with various intensities, and the increasing rates in the area of four lakes (Nam Co, Selin Co, Zhari-namco, and Ngangze) were 1.62, 28.81, 2.27, and 3.70 km2/yr, respectively. The yearly increases in volume of the four lakes were 3.6, 9.44, 6, and 2.36 km3, respectively. A water balance equation was established for the four lakes based on lake volume changes to illustrate the contributions of precipitation, ground runoff, evaporation, and other factors. The results revealed that surface runoff was the major contributor to expansion, and lake surface evaporation was almost 2.76–3.86 times that of lake surface precipitation. The two lakes in Indus Basin, Rakshastal and Mapam Yumco, presented a slight retreat. As a representative of Brahmaputra Basin, Yamzho Yumco underwent a retreat of –3.49 km2/yr in area, –0.39 m/yr in level, and –0.19 km3/yr in volume. Decreasing precipitation, increasing evaporation, and the operation of a hydrological project were the main causes of its constant retreat.

Graphical Abstract

1. Introduction

Hydrologic changes in lakes reflect the comprehensive influences of climate, land-surface processes, and human activities on the water cycle and ecosystem. As the world’s highest and largest plateau, the Tibetan Plateau (TP) is located at 26°00′N–39°47′N, 73°19′E–104°47′E in Central and East Asia. The area of this plateau is approximately 2.5 million km2, with an average elevation of higher than 4500 m. The TP is known as the “Water tower of Asia”, and it is the source of several large rivers, such as the Yellow River, Yangtze River, Ganges River, India River, Brahmaputra River, and so on, providing domestic water supply for hundreds of millions of populations. On the TP, the number of lakes greater than 1 km2 in size is nearly 1100, and the total area of these lakes is nearly 45,000 km2. Due to the remoteness and harsh environment of the TP, the intensity of agricultural and industrial activities is low. Therefore, the hydrologic changes of lakes on the plateau can be treated as a sensitive indictor of climate change. Many researchers have studied the changes in lakes on the plateau. The research has reported that lakes greater than 10 km2 in size on the plateau showed an increasing trend during the last decade, and the total area increased from 37,111 to 40,015 km2, at a rate of 7.82% [1]. The water level of the two largest lakes in the central Tibet, Nam Co and Selin Co, has risen by 4.37 m and 2.03 m, respectively, in the last decade [2]. The lake volume in the Inner Basin on the TP increased at a rate of 7.72 Gt/yr during 2003–2009, mainly due to precipitation contribution and glacier mass loss [3]. These research results were mostly based on remote sensing techniques as the gauged observations on the plateau were very limited. There are only several hydrological stations in the large Tibetan region, and these stations present a decentralized and punctate distribution. Satellite data play an important role in delineating the hydrologic changes of these plateau lakes with high efficiency and at a low cost [4,5].
Altimeter data have been widely used to continuously monitor water level changes [6,7]. Starting from the 1990s, there are 30 years of altimeter data covering the globe with a frequency of 10–30 days. This includes Topex/Poseidon (T/P), Jason, ENVIromental SATellite (Envisat), Ice, Cloud and Land Elevation Satellite (ICESat), and Geosat Follow on (GFO) data. T/P data collected during 1992–2002 were applied to the six largest lakes in China [8]. Zheng et al. [9] used T/P and Envisat data during 1992–2010 to monitor water level changes of Hulun Lake in northeast China and found that the lake presented a decreasing trend. T/P data collected during 1992–1999 were applied on rivers with a width of more than 1 km in the Amazon watershed [7]. ICESat data collected during 2003–2009 were employed on 56 lakes in China, showing different change patterns of lake surface level [10]. At present, there are four kinds of water level databases for large rivers, lakes, and reservoirs that are derived from altimeter data: the Database for Hydrological Time Series of Inland Waters (DAHITI) [11], the Global Reservoir and Lake Monitor (GRLM) [12], the River Lake Hydrology product (RLH) [13], and the Hydroweb [14].
Remotely sensed images are able to capture lake area fluctuations occurring over short periods or decades. Multi-source remote sensing images were employed to delineate the monthly spatial distribution of global land surface water bodies in 1993–2004 [15,16]. Feng et al. [17] used moderate-resolution imaging spectro-radiometer (MODIS) images to monitor dynamic changes in Poyang Lake in 2000–2010 and found that the area in the wet season was four times of that in the dry season. Sun et al. [1] used MODIS images to study the inundation changes of more than 600 large lakes in China in 2000–2010.
Some researches have combined altimeter data and satellite images to study volume changes of inland water bodies. Water mass changes of the Negro River basin were revealed by synthetic aperture radar (SAR), T/P and in situ water level observations [18]. ICESat data and Landsat images were used in conjunction to construct area-level curves for 30 lakes on the TP to study their volume changes and the result showed that there was an increase in water volume of 92.43 km3 for the 30 lakes from the 1970s to 2011 [19]. Cai et al. [20] constructed the area-volume models for 128 lakes and 108 reservoirs in Yangtze River watershed according to gauged measurements and MODIS images, and found that 53.91% of lakes were shrinking, while the reservoirs were expanding. Sun et al. [21] used water level data derived from altimeter data to construct the bottom topography of the Aral Sea and obtained its water volume changes. Medina et al. [22] applied gauged water level measurements, and Envisat and Advanced SAR images to estimate storage changes in Lake Izabal. In addition, Gravity Recovery and Climate Experiment (GRACE) data were applied to the temporal-spatial terrestrial water mass changes [23].
At present, detailed changes in the level, area and storage of lakes on the southern TP have not been clear. An illustration of seasonal and inter-annual hydrological changes of the main lakes on the southern TP would be beneficial to improve the understanding of water cycles and the climate changes occurring on the TP. As altimeter data are in the form of footprints and are obtained by recording values along sparse ground tracks, the derivation of level fluctuations for lakes in the large southern TP areas requires several kinds of altimeter data to be combined. In addition, high frequency remotely sensed images are capable of capturing the dynamics of lakes in a short period of time. This paper used the aforementioned altimeter data and MODIS images to illustrate the dynamics of 15 lakes greater than 100 km2 in size on the southern TP, and the contributions of climate factors were discussed for the lakes with obvious changes. The results may serve as important information for land-surface process models and may be used in plateau researches.

2. Study Area

The environment of the TP is very harsh due to the high altitude. It has dry and thin air, strong solar radiation, and low temperatures. The climate of the TP varies greatly from region to region because of the complex terrain. The annual average temperature is 20 °C in the warm and humid southeast, while it drops to below −6 °C in the cold and dry northwest. The annual precipitation ranges from 100 to 1300 mm, decreasing from southeast to northwest. The studied area is bordered to the east by the Tanggula Mountains and to the south by the Himalayan range, and the Brahmaputra River is also in this region. The elevation is higher than 4000 m and several large glaciers are distributed in the surrounding high mountains.
The researched 15 lakes are located in three basins on the southern TP. Ten lakes including Selin Co and Nam Co are located in the Inner Basin, which occupies 70% of the area of the TP. The Inner Basin is located in the Qiangtang steppe and has a semi-arid climate. The average temperature of the Inner Basin is about 0–2 °C, and the annual rainfall is 150–200 mm. Two lakes, Mapam Yumco and Rakshastal, are in the Hindu Basin and the other three lakes, including Yamzho Yumco, are in the Brahmaputra Basin. Nam Co, Selin Co, and Yamzho Yumco are known as the “Three holy lakes” on the TP. All of the 15 lakes are greater than 100 km2 in size. Selin Co and Nam Co are the two largest lakes; they are greater than 1800 km2 in size. Selin Co is a Tectonic lake, with an open lakeside and dense water plants, and it is the main region for livestock. Selin Co has shown continuous expansion and has been the largest lake on the TP since 2003 [1]. Nam Co is the highest lake in the world with an elevation of around 4725 m. It is close to Tanggula Mountain and its southern shoreline is parallel to the Tanggula ridge. The area of Zhari-namco is nearly 1000 km2 in size. Yamzho Yumco lies 10 km south of the Brahmaputra River. Yamzho Yumco and several small lakes around it are considered to be the largest group of lakes on the southern TP. The west two adjacent lakes, Mapam Yumco and Rakshastal, are between two high mountains—the Gangdise Mountains (5500 m) and Namunani peak (7728 m)—where mountain glaciers are widely distributed. Therefore, the water supply from melted glaciers or snow is very rich for these two lakes. The spatial distribution of the 15 lakes is shown in Figure 1, and characteristics of the lakes are listed in Table 1.

3. Data and Methods

3.1. Data

3.1.1. MODIS Images

Long-term and high frequency MODIS images have been widely used to monitor dynamic changes in land cover [1]. The level 3, 8-day composited product MOD09A, with 500 m resolution, was downloaded from the Earth Observing System (https://reverb.echo.nasa.gov/reverb/). The product was atmospheric corrected and consisted of 7 bands (0.648–2.130 μm). As the fifth band (centered at 1.24 μm) contained stripe noises, it was excluded from the data processing. The data used in this research started on the 49th day of the year 2000 (2000-049) and ended on the 361st day of the year 2015 (2015-361). It was worth mentioning that, in some images, lakes were covered by thick clouds or snow, or were frozen, especially in winter seasons. In these cases, lake boundaries were not easy to distinguish. Therefore, these kinds of images were discarded from the following process. The largest available number of images was 573, for Yamzho Yumco, while the smallest was 322, for Nam Co. The detailed information about the start/end dates and the numbers of available series for each lake is listed in Table 2.

3.1.2. Altimeter Data

The applications of T/P and Jason series were very extensive due to their short revisiting periods (10 days). However, the interval between the adjacent ground tracks of these altimeter data is very large, around 1 km. Thus, less data were available for the 15 studied lakes and only Envisat and ICESat were used in this research. Envisat carried a radar altimeter. The radar altimeter sent microwave pulses and was able to carry on monitoring under various weather conditions. As a successor of the European Remote Sensing satellites (ERS), Envisat was launched in March 2002 by the European Space Agency (ESA). Envisat revisited the same cycle over 35 days, covering a latitude of ±81.5 degrees, with a footprint of around 2–10 km in diameter. Envisat RA-2 Geographical Data Records (GDR) were used in this research. ICESat sent laser pulses and was easily interfered by clouds. ICESat was launched in January 2003 and stopped working in 2009. ICESat covered a latitude of ±86 degrees, and the diameter of its ground footprint was only 70 m. The frequency of ICESat data was about 3–4 months. The product Global Land Surface Altimetry Data (GLA14) was downloaded from the National Snow and Ice Data Center (NSIDC). Fourteen lakes were covered by Envisat data and 12 lakes were covered by ICESat data, as Table 2 shows.

3.1.3. Hydroweb

Hydroweb is a database created by LEGOS/GOHS (Laboratoire d’Études en Géophysique et Océanographie Spatiale/Equipe Geodesie, Oceanograhie et Hydrologie Spatiale), which combines T/P, Jason-1, Jason-2, Envisat, and GFO altimetry data to present the water level of 150 large global lakes/reservoirs [14]. The available period in the database is from the 1990s until the present. Compared with gauged data, the derived accuracy of the water surface for lakes/reservoirs is 5–24 cm. Seven of the studied lakes were included in this database, as shown in Table 2.

3.1.4. Meteorological Data

The daily gauged precipitation, evaporation, and temperature data of the southern TP during the studied period were obtained from the China Meteorological Data Sharing Service System (http://cdc.cma.gov.cn/). There are 19 metrological stations in the study area, and the spatial distributions of them are shown in Figure 1. To match the hydrological results of this study, daily metrological data were accumulated into a monthly scale format. The monthly precipitation for the whole study area was estimated by kriging interpolation of the measured data. In addition, Global Land Data Assimilation System (GLDAS) data (https://ldas.gsfc.nasa.gov/gldas) collected monthly in 2000–2015 were downloaded to estimate the land evaporation in sub-basins.

3.2. Method

3.2.1. Inundation Extraction

Water indexes such as the normalized differenced water index (NDWI), modified NDWI (MNDWI), and automated water extraction index (AWEI) were not suitable for use in this research, as their key thresholds were easily influenced by imaging environments, such as aerosol interference and viewing geometry [17]. The use of various suitable thresholds was not practical. Therefore, an accurate water–land discriminating method was applied in this research. In the procedure, accurate and automatic extraction of training data was firstly carried out for each image, and then the images were classified by the support vector machine (SVM) classifier [24]. Finally, surface inundations of the 15 lakes were extracted according to their spatial locations [21]. With respect to the training data selection, six rules were constructed to select initial training data for six classes: water bodies, bare soil (including urban area), vegetation, ice, snow, and clouds. Then, the initial training samples were refined based on an iterative procedure integrating the k-means algorithm and the AWEI, whose threshold is more stable and fluctuates in a smaller range than those of NDWI and MNDWI. As the threshold of AWEI was suggested to be around −0.15 to 0.045 [25], the threshold of water clusters in the proposed method was determined to be −0.1. Taking the initial water training samples as an example, in each iteration process, the samples were divided into 10 clusters, and the AWEI of each cluster was computed. If the AWEI of a cluster was greater than −0.1, then this cluster was considered to be a typical water training set. If not, this cluster was continuously divided into 10 clusters by k-means, and the corresponding AWEIs of newly created sub-clusters were calculated for the following assessment. Ten iterations of this process were performed. When the iterations ended, if the AWEI of some sub-cluster was still less than −0.1, it was removed from the water training sets. For other non-water training data, the procedure was similar, except that the AWEI had to be less than −0.1 and the outliers were removed from non-water training data at the end of the iterations. This automatic water extraction method was used in high-frequency water surface delineations of the Aral Sea and Poyang Lake in 2000–2015. The omission errors were 0.9%–1.5% and commission errors were 2.94%–4.23% [21].

3.2.2. Water Level

An altimeter assembled on a satellite sends a series of pulses and receives reflected signals. Therefore, the distance between the satellite and water surface can be derived by counting the time taken for the pulses to return. The altitude represents the orbit height of the satellite and the range indicates the distance between altimeters and the water surface. The height of the water surface relative to some referenced ellipsoid is equal to the altitude minus the range [26]. The influences of the solid earth tide and pole tide need to be removed, as shown in Formula (1). In addition, the range needs to include various environmental and geophysical corrections, as listed in Formula (2).
Sea Surface Height = Altitude − Corrected Range − Solid earth tide − Pole tide
Corrected Range = Range + Wet troposphere correction + Dry troposphere correction + Ionosphere correction
Envisat and ICESat data were processed based on the above formulas. It is worth mentioning that the Ice-1 retracking algorithm was chosen to process the Envisat RA-2 product as it had higher accuracy when deriving the range [9]. Dry and wet troposphere corrections were derived based on the European Centre for Medium-Range Weather Forecasts (ECMWF) model, and the ionosphere correction was derived from the electron content from the Global Ionosphere Maps (GIM). The processing of the ICESat GLA14 product was similar to that applied by Zhang et al. [2].
Altimeter data were in the form of footprints and the measured values were recorded along the ground tracks of the altimeter. As lakes may undergo dynamics, footprints may fall on the lakeside when a lake had a small extent as Figure 2 shows. To remove the contamination of land signals, only footprints falling on the lake surface were filtered by the coastline on the same date. Therefore, the high frequency lake boundaries created in Section 3.2.1 were applied as filters. Then, the 3-sigma rule was applied to remove outliers from the filtered results, and the mean value of the remaining results was calculated to represent the lake surface elevation on a particular day. Finally, the daily results were cumulated to obtain the time series water level of each lake. The reference ellipsoid used for the ICESat data was Topex/Poseidon, while Envisat used the World Geodetic System 84 (WGS84) as a reference. Thus, ICESat data were converted to the WGS84 reference to maintain consistency.
System differences existed between different altimeters in the orbit height, orbit inclination, and revisit period. There were also some differences between Hydroweb outcomes and the two derived altimetry results. Therefore, for lakes covered by two or three kinds of water level source, it was necessary to transform the water level results into one base value to create a long-term series. Correlations between different kinds of results were constructed to accomplish this goal.
A correlation was first constructed based on results obtained during overlapping periods. The correlation of two kinds of water results was considered to be credible only when more than 10 pairs of data were present during overlapping periods and the R2 value of the correlation was greater than 0.88. In this case, the altimeter results were converted to the base value of the results with the longest time range to create a more intensive level series. If the R2 value was less than 0.88, the level results with the longer time span were chosen for the next step of the analysis. The available altimeter and Hydroweb data for the 15 lakes are presented in Table 2. Seven lakes with ID numbers 13, 14, 15, 2, 3, 4, and 5 were all covered by all the three sources. Lakes with ID numbers 1, 6, 7, and 9 were covered by both ICESat and Envisat data. As the number of overlapping records between Envisat and ICESat data was less than 10 for these four lakes, only Envisat results were used. Lakes Rakshastal and Shuru Co were only covered by Envisat series, and the levels of Daggayai Co and Pegu Cao were only covered by ICESat data.
Figure 3 displays the three sources of lake level results for Selin Co, Nam Co and Tangra-yumco. The ICESat results were usually 2 m higher than those from the other two datasets. Selin Co had more ICESat- and Envisat-derived results, and the three sources of lake level data had consistent fluctuations. The correlation between ICESat results and Hydroweb had an R2 value of 0.96. The R2 value for the comparison between the Hydroweb and Envisat results was 0.92. For Selin Co, as the correlations between altimeter data and Hydroweb were strong, altimeter results were converted to the Hydroweb base to make the data dense. There were few available altimeter results for Nam Co and Tang-ro Yum Co, and the R2 values between the altimeter results and Hydroweb were around 0.80–0.96, as shown in Figure 3. As the threshold of R2 was defined as 0.88 in this research, for Nam Co, only the ICEsat lake level data were converted to the Hydroweb base due to the high R2 value of 0.96. For Tangra-yumco, only the Envisat results were converted to the Hydroweb base due to the R2 value of 0.89. The water level results of the other lakes were also determined based on correlations among the three datasets.

3.2.3. Lake Storage Changes

The variation in lake storage can be estimated according to the pairs of lake level and area data when the lake is assumed to be a conical frustum [9,27,28]. In this research, the changes in lake storage were derived from the changes in level and area, as shown in Formula (3).
Δ V   =   1 3 ( H 2 H 1 ) × ( A 1 + A 2 + A 1 × A 2 )
where Δ V means the changed lake storage from one state with level H 1 and area A 1 to another state with level H 2 and area A 2 .
It is worth mentioning that lakebeds on the southern TP have been less influenced by human actions, such as dredging activities. Therefore, changes in the lake bottom topography can be ignored. In the study of lake volume changes, the bottom topography under the smallest extent in 2000–2015 was assumed to be unchanged. In addition, for each lake, the area and level time series data were of different lengths. The amount of water level data was less than that of inundation results, and hence the length of storage time series depended on matched results between the water level and area series.

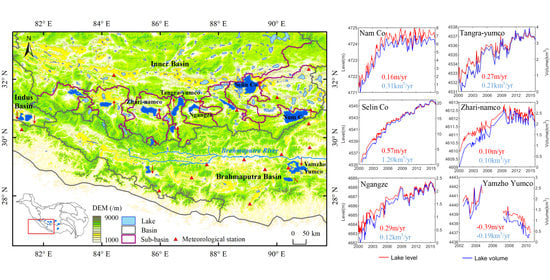
4. Results and Analysis

4.1. Fluctuation of the Water Surface

Water surface fluctuations of the studied 15 lakes showed different patterns of change: expansion, retreat, and no obvious change. Usually, lakes in the same basin presented similar trends as presented in Figure 1. Table 3 presents the information about inundation changes for the 15 lakes. Figure 4 shows the dynamic changes of the five lakes with obvious changes. The first left column is the overlapped results of the available series of lake surfaces, showing the inundated frequencies with the range from 1 to 580. The light yellow shows rarely inundated regions and dark blue indicates frequently inundated regions. The second column presents changes in the bank during the research period. The third and fourth columns display large views of some special changed regions of the lakes, and the curve plots present the area changes in each lake that occurred in 2000–2015.
In the Inner Basin, seven of the ten lakes underwent obvious expansions with various intensities. Two lakes Ngangla-ringco and Daggayai Co showed no obvious changes, and Gyaring Co showed a slight retreat with a rate of −0.16 km2/yr. Ngangze Co, Zhari-namco, Nam Co, and Selin Co had increasing rates of greater than 1.60 km2/yr.
Nam Co had maximum and minimum areas of 2042.48 km2 and 1889.21 km2, which occurred in October 2008 and July 2000, respectively. The lake gradually increased at a rate of 11.26 km2/yr from 2000 to 2005 and presented no apparent variability in the following years (Figure 4a). The rate in 2000–2015 was 1.62 km2/yr. The lake is shaped from northeast to southwest, and its southeast bank is restricted by ranges. Therefore, it enlarged towards the west and east (Figure 4a), especially in the year 2005. December until the next July was the dry season, and the inundated area was usually the smallest in July. Then, the area began to increase from August and reached its maximum in November.
Selin Co underwent significant expansion at a fast rate of 29.87 km2/yr in 2000–2010, and then the expansion intensity dropped, causing the rate to decrease to 6.45 km2/yr in 2011–2015. The annual average area increased by 456 km2, from 1863.92 km2 in 2000 to 2319.53 km2 in 2015. The minimum area was 1805.71 km2 in June 2000 and the maximum area was 2377.99 km2 in November 2013. There was no apparent seasonality for Selin Co as it underwent a continuous expansion throughout all studied years, though this occurred in winter seasons. Boundary changes in Figure 4b show that Selin Co expanded toward the north and southeast, where Selin Co has flat and open terrain and prosperous grasslands for animal husbandry. Rapid expansion of this region occurred in 2006 and 2010.
Zhari-namco had a clear increasing trend of 2.27 km2/yr and its changing pattern showed stage differences. Its largest area was 1019.84 km2 in February 2010 and its smallest area was 940.85 km2 in April 2000. Zhari-namco presented an increasing pattern in 2000–2010 and the average annual area increased from 955.83 km2 in 2000 to 997.07 km2 in 2010, with a rate of 4.01 km2/yr. Then, the lake began retreating, with the mean area being around 990 km2 and the corresponding decreasing trend being −1.77 km2/y in 2011–2015. The north and south regions of the lake are restricted by rift zones, leading to lake banks being parallel to several large ranges. Therefore, the expansion mainly appeared in the west portion (Figure 4c). Zhari-namco showed apparent inter-month variability. The little expansion usually occurred in April–July and then the lake began expanding, reaching its largest size in October. From November to April, the inundated area gradually decreased.
Ngangze Co had an obvious expanding trend of 3.70 km2/yr. The maximum area was 470.75 km2 in March 2015, the minimum area was 385.05 km2 in April 2000, and the average area in the studied period was 427.55 km2. Ngangze Co is located in an alluvial fan with alkaline land. Several large feeding rivers flow into the western and southern parts of the lake. The lake showed great enlargements toward the west, south and southeast (Figure 4d). Rapid expansion occurred in 2008–2011, causing the area to enlarge to 18.467 km2. The intra-seasonal variability indicated that the smallest inundated area occurred in April and then the area extent gradually increased and reached the largest size in October. After that, the lake area remained stable and then began shrinking until the next February.
The other three lakes in the Inner Basin showed similar seasonal patterns during the studied period. April–July was the dry season when the area tended to be small, while the lakes were in better situations from September to the next March. Tangra-yumco showed an increasing pattern with fluctuations, and had a slight changing trend of 0.61 km2/yr. The maximum area was 848.33 km2 in March 2011, and the minimum area was 792.52 km2 in August 2001. Taro Co and Shuru Co had small increasing trends, as shown in Table 1.
Three lakes in the Brahmaputra Basin showed similar seasonal characteristics, while they presented big differences in their changing trends. Yanzho Yumco presented fluctuations and had an overall contraction. In 2000–2005, Yamzho Yumco presented a fluctuating expansion, and the area increased from 498.80 km2 to 539.81 km2, at a rate of 7.61 km2/yr. Then, its area decreased from 513.08 to 485.99 km2, at a rate of −3.42 km2/yr in 2006–2015. The total rate of the decreasing trend was −3.27 km2/yr. The largest area was 587.09 km2 in October 2004 and the smallest was 402.49 km2 in June 2015. As Yamzho Yumco is surrounded by mountains, its inundation extent was restricted by terrain, resulting in complex shapes with several tributaries (Figure 4e). Yumzho Yumco endured a retreat in all directions in 2015, and some of the tributaries dried up. In terms of seasonality, Yamzho Yumco remained stable in January–April, when it tended to be in frozen state. It began retreating from May and reached its minimum size in July. Then, it increased from August to October and began decreasing again in November. In general, Pegu Co remained stable with a slight decreasing trend. The maximum area of Pegu Co was 274.55 km2 in November 2005, and the minimum area was 254.8 km2 in April 2009. The inundation extent after 2006 was less than that of the early years. Smaller areas were usually present in July, and larger surface areas appeared in October. The small lake Puma Yumco showed no apparent change and was almost stable with an area of around 280 km2 during the 16 years.
Two lakes in Indus Basin, Rakshastal and Puma Yumco endured slight retreats. Rakshastal had an annual decreasing rate of −0.32 km2/a. The minimum area was 233.33 km2 in June 2008 and the maximum inundation was 259.95 km2 in September 2000. The average area in 2010–2015 was about 5 km2 smaller than that of the period 2000–2010. The size of Puma Yumco fluctuated with no obvious trend, and its area dropped by 23 km2 during the studied period. The seasonal performances of Rakshastal and Puma Yumco were similar to that of Yamzho Yumco.

4.2. Lake Level and Volume

Figure 5 presents the lake level and volume changes of 12 lakes with a series of data collected during the studied period. Three lakes—Rakshastal, Puma Yumco, and Daggayai Co—did not have any matched records to create volume change curves. Seven lakes (lake IDs 13, 14, 15, 2, 3, 4, and 5) were covered by three sources of water level data. Therefore, they had more level and volume records.
Nam Co had 158 records of the lake level and 83 records of the lake volume. Nam Co presented a rapid increase in 2000–2005 and then remained stable in the following years. The level rose by 2.5 m and the volume increased from 1.03 to 6.13 km3 in 2000–2005, at respective rates of 0.16 m/yr and 0.31 km3/yr. Then, the lake remained stable, with the level and volume being around 4724.49 m and 5.71 km3 in 2006–2015. The inundated area showed no obvious seasonal patterns. The lake had low volumes in April and July, with large variations, and it remained in a similar state in other months.
Selin Co had 251 level records and 129 volume records on the monthly scale. Selin Co gradually rose by around 10 m in 2000–2015 with a change rate of 0.57 m/yr. The highest level, 4545.74 m, occurred in April 2015 and the lowest level, 4535.37 m, occurred in May 2000. Storage of Selin Co rose by 20.91 km3 during the studied period at a rate of 1.19 km3/yr. The seasonal pattern of Selin Co showed no obvious fluctuations. The monthly water level and volume data had respective standard deviations of around 2.00–2.69 m and 4.26–6.32 km3. From summer to autumn, the lake presented great variations, while from winter to spring, it showed small differences.
Tangra-yumco had 133 level records and 101 volume records on the monthly scale. The level and volume gradually increased with seasonal fluctuations from year to year with rates of 0.27 m/yr and 0.21 km3/yr, respectively. The level rose from 4531.96 to 4537.57 m and the volume increased by 3.14 km during the research period. Monthly deviations of level and volume were around 1.17–1.64 m and 0.76–1.55 km3, respectively.
Ngangla-ringco had 107 records of level and 72 records of volume from October 2002 to December 2015, and the data for 2005–2006 was missing. The lake level and storage showed great fluctuations, with no clear changing trends. The average lake level in 2007–2015 was 4715.09 m, generally 20 cm higher than that of the first few years. The change in volume in 2007–2015 was about 0.10 km3 greater than that in former years. The seasonal changing pattern of the water level was similar to the area fluctuations. June usually had the lowest surface level and volume. The level rose in July–October, and then remained in a stable state until the next March. Monthly standard deviations of level and storage had respective values of 0.216 m and 0.08 km3.
Taro-co had 55 level records and 47 volume records from November 2003 to November 2015. There were only 1–2 records for the years 2003–2009. Slight increasing trends of 0.092 m/yr and 0.045 km3/yr were indicated according to the records. The level gradually rose from 2002 to 2008, with the highest level, 4567.43 m, occurring in November 2008. The corresponding increase in volume was 0.93 km3. Then, the lake showed no obvious fluctuations in the following years. High levels accompanied by small deviations usually occurred from July to October. Low levels with large standard deviations occurred from March to June.
Zhari-namco presented a clear increasing trend in lake level with a rate of 0.10 m/yr. The level increased in 2000–2007 with a great rate of 0.21 m/yr, from 4609.95 m in March 2000 to 4611.94 m in April 2007. The records for 2008 were missing and after 2009, the lake fluctuated at around 4612.31 m with no obvious changing trend since then. The volume had a similar changing pattern to the water level, rising by 2.21 km3 in the 16 year period, at a rate of 0.10 km3/yr. The high levels in August–October had little variation and the low levels from December to the next March usually fluctuated severely. Monthly deviations in the level and volume were around 0.23–0.85 m and 0.29–0.87 km3, respectively.
Ngangze had 308 lake level results and 113 volume results. The lake had apparent increasing trends in level and volume with respective rates of 0.29 m/yr and 0.117 km3/yr. The level rose by around 6 m and the value change increased by 1.89 km3 in the analyzed period. The highest level and increase in volume were 4688.67 m and 2.33 km3, respectively, occurring in 2015. The lowest values were 4682.81 m and 0 km3, and these occurred in 2000.
For lakes with IDs 1, 6, 7, and 9, only Envisat derived results were available for this study, and Envisat data were missing for 2005–2006. Therefore, the lake level results of the three lakes were only available for seven years. Mapam Yumco had 53 water level results, from August 2002 to October 2010, with about 6–10 records in each year. Mapam Yumco had a slight decreasing trend with a rate of −0.09 m/yr for the lake level and −0.03 km3/yr for the volume. The annual average level and volume after the year 2007 were about 0.20 m and 0.14 km3 lower than those of the first few years, as shown in Figure 5. Mapam Yumco showed large fluctuations in different months, and from September to December, it presented little deviation. Yumzho Yumco had 45 lake level records and 40 volume records. Before 2005, the water level and volume fluctuated. The lake had a slight increase from 4440.34 m in June 2002 to 4442.11 m in August 2004. In 2007–2010, YumzhoYumco experienced a constant retreat. The mean level and volume in the years after 2007 had respective values of 2.01 m and 1.06 km3 lower than in the first few years. On the whole, the lake level dynamically dropped from more than 4442 m to 4436.92 m at a rate of −0.39 m/yr. The volume change decreased from 1.64 km3 in 2002 to 0.30 km3 in 2010 at a rate of −0.19 km3/yr. Regarding seasonal patterns, lake levels in each month were similar except in October when the lake was about 1.52 m higher in level and 0.85 km3 higher in volume than in other months.
Gyaring Co only had five lake level records available in two years—2002 and 2010—and it rose from 4646.79 m in 2002 to 4648.36 m in 2010, with the volume increasing by 0.64 km3. Shuru Co only had three level records derived from Envisat data, and the time span was from 2002 to 2003. Fluctuations in the level were in agreement with the area variations. For Shuru Co, the increased values were 0.31 m and 0.06 km3, respectively. Pegu Co was only covered by ICESat data, and only four records of the lake level were available in the years 2003 and 2008. Level changes coincided with the area. Pegu Co dropped from 4552.81 m in 2003 to 4552.34 m in 2008, with the volume decreasing by 0.13 km3.

5. Discussion

5.1. Accuracy Assessment

To check the accuracy of the lake surface results, six series of 30 m interpreted results of the studied lakes based on Landsat images from the years 2000, 2005, 2010, 2013, 2014, and 2015 were collected. The accuracy of the interpreted lake maps was 96% [29]. To ensure images were consistent with acquisition dates, MODIS results from the nearest dates to the 30 m Landsat results were chosen. Theoretically, for 15 lakes, 90 results could be selected in the six years for comparison. As there was some mismatch between the acquisition dates of the Landsat and MODIS images, 75 pairs of data were finally determined to assess the accuracy. Figure 6 shows that the correlation between MODIS results and interpretation results was high with an R2 value of 0.99. The 30 m results were higher, as Landsat images can clearly delineate the trivial transition of coastlines. Boundary differences between the two sets of results for some respective lakes are shown in Figure 6. The area differences were between 2.83% and 3.56%, which meant the research results were convincing and can be used to study lake inundation changes.
Water levels of more than 50 major lakes on the TP from 2000 to 2017 were presented in [30], and nine studied lakes of this research were included. Long time series of the water levels of the nine common lakes were respectively compared and the correlations were around 0.91–0.99. Usually, larger lakes had higher correlation coefficients. Moreover, daily gauged water level observations of Zhari-namco in 2010–2015 were obtained. The in situ data did not represent the real water level and only captured level fluctuations relative to the mean value of each year, around 0.1–0.8 m as shown in Figure 7. For Zhari-namco, the derived results and matched the in situ lake level fluctuations well. The lake level results in this paper had a high degree of accuracy and were able to reflect lake dynamics.

5.2. Driving Forces

Based on climate data and collected materials, driving forces were analyzed on four expanded and one retreating lakes as their obvious changes.
The four expanded lakes—Nam Co, Selin Co, Zhari-namco, and Ngangze—were in small enclosed sub-basins, as shown in Figure 1. As the interference from human actions can be ignored, the water balance equation considering precipitation, ground runoff, evaporation, and other factors such as glacier and snow meltwater was established for them. The equation is as follows:
A t × P E + R + W + V t = V t + 1
where A t is the area of the studied lake at time t,   P is the corresponding precipitation, and thus A t × P is the equivalent volume of rainfall on the lake surface. E is the evaporation on the lake surface. R is the accumulated ground runoff that is determined as precipitation minus evaporation over land in the sub-basin. Regarding ground runoff, as there were several other lakes in each sub-basin, the ground runoff allocated to a studied lake was determined according to the area ratios among lakes in one sub-basin. The area ratios of the four expanded lakes—Nam Co, Selin Co, Ngangze, and Zhari-namco—were 99.57%, 85.00%, 99.43%, and 85.70%, respectively. W is an overall supplement that is made up of other components: glacier meltwater, snow water, permafrost, and some groundwater outflow. When W is negative, it indicates that W is the outflow. V t and V t + 1 represent the lake storage at two moments. The net precipitation was defined as the precipitation minus evaporation over the lake surface, and then with the allocated ground runoff in the sub-basin ( A t × P E + R ). In most years, the net precipitation was usually less than 0 due to the strong land evaporation on the southern TP. In addition, the infiltration of each lake was ignored.
Daily precipitation and evaporation measurements were transformed to the monthly frequency to match the water level and volume changes data. Then, the monthly precipitation in the whole study area was determined according to kriging interpolation of gauged observations on 19 nearby stations. The land evaporation of each sub-basin in 2000–2015 was extracted from GLDAS, which was on the monthly scale and had a resolution of 1°. The evaporation of each lake was estimated from the nearest in situ station according to the Penman–Monteith equation, which was illustrated in detail in [31]. Based on several variables and lake volume changes, the W of each lake was derived from the water balance equation.
For the four sub-basins, the precipitation showed no obvious changing patterns and the land evaporation increased with a slight trend during 2000–2015. The storages of the four lakes increased, while the net precipitation decreased over the studied period in Figure 8. This implied that besides precipitation supplements, the contribution of W increased. As Figure 8 shows, the annual average lake volume of Nam Co experienced an expansion with a rate of 0.29 km3/yr. The volume rose rapidly, increasing by 5.11 km3 in 2000–2005 and then was maintained at around 5.71 km3 after 2005. The land evaporation in its basin increased at a rate of 0.04 km3/yr and the highest was 3.60 km3 in 2011. The contribution of the yearly net precipitation was less than 0. It fluctuated and decreased from −0.31 km3 in 2000 to −3.27 km3 in 2015 at a rate of −0.14 km3/yr. From the view of water balance, the yearly supplement of W increased from 1.00 to 3.00 km3 during the study period, with a mean value of 1.68 km3 in 2000–2015.
Selin Co endured a rapid increase in the lake volume at a rate of 1.22 km3/yr. The net precipitation gradually decreased with a slight fluctuation from 2.47 km3 in 2000 to −2.90 km3 in 2015. The land evaporation in its basin increased at a rate of 0.07 km3/yr and the highest was 9.04 km3 in 2011. The contribution of W fluctuated from −3.17 to 3.27 km3, with a mean value of 0.08 km3. The negative value of W indicated that some outflow existed in the watershed.
The increased intensity of Zhari-namco was less than that of Selin Co. Zhari-namco had a slight change of 0.14 km3/yr, and the volume rose by 2.19 km3 over the 16 year period. The net precipitation fluctuated with average and variation values of 1.66 km3 and 0.72 km3, respectively. The highest net precipitation was 0.97 km3 in 2002 and the lowest was −1.56 km3 in 2015. Negative net precipitation indicated that evaporation induced outflow was more than precipitation induced inflow. As the lake storage fluctuated, the supplement of W was around −0.50 to 1.68 km3, with a mean value of 0.42 km3.
Ngangze also expanded gradually and the volume increased by 1.89 km3 at a rate of 0.12 km3/yr. The net precipitation presented a decreasing tendency with a slight fluctuation in the years 2007, 2008, and 2014. The highest net precipitation was 0.56 km3 in 2008, and the average annual value was −0.16 km3. As the average annual variation in the lake volume was 1.15 km3, the average yearly contribution of W was 0.32 km3 during the study period.
Yearly quantitative supplements of several components for the four lakes are shown in Table 4. The evaporated lake water was usually 2.5–3.5 times that of lake surface rainfall, and precipitation induced runoff was the main cause for lake expansion. The low W of Selin Co implied that precipitation supplied most in its expansion and some sources of outflow, such as groundwater flow existed to counterbalance the feed.
Yamzho Yumco is an inland lake, and its supplements are snow meltwater, spring water, and precipitation induced surface runoff. Lake surface evaporation is usually greater than precipitation. As there is a hydrological project in the basin, the water balance equation is not suitable for Yamzho Yumco. The analysis of the effects of climate variables on lake retreat, fluctuations of yearly precipitation, lake surface evaporation, and temperature, in 2000–2015, derived from five nearby metrological stations, are presented in Figure 9.
The annual precipitation presented variations in 2000–2015. The mean value of the five stations decreased at a rate of −7.56 mm/yr. The average precipitation in the years 2005, 2009, and 2015 was less than 300 mm, lower than in adjacent years. The yearly lake surface evaporation was derived from gauged variables using the Penman–Monteith equation, and the mean value was around 1143–1539 mm, showing a slight increasing trend of 14.26 mm/yr over the studied period (Figure 9b). Lake surface evaporation was lower in 2011 than in the adjacent years. Temperature changes of the five stations showed similar patterns with no obvious trends. The five temperature curves presented certain gradients, and higher values occurred in the years 2009 and 2010. The average annual temperature of the five stations was around 6.89–8.38 °C.
Yamzho Yumco had a decrease in annual average volume from 1.79 km3 in 2002 to 0.28 km3 in 2010. The value of evaporation minus precipitation on the lake surface increased from 0.16 km3 in 2000 to 0.48 km3 in 2015 at a rate of 0.01 km3/yr. The annual inflow to Yamzho Yumco was 0.95 km3, which was nearly equal to the evaporation over the lake surface, and this was capable of allowing the lake to maintain a stable state. However, a hydropower station was established in the year 1998 with yearly lake water consumption of 0.18 km3. The project broke the lake balance and became a major contributor to lake retreat. Some research has pointed out that the water level increase before 2005 was mainly caused by precipitation and surface runoff, though human activities had a negative effect [32]. After 2005, fluctuations in precipitation, evaporation, and temperature were not in agreement with lake dynamic changes, and climate factors were not able to fully explain the cause of lake contraction. With increasing evaporation and aggravating influences of the hydropower project, YamzhoYumco experienced a drastic retreat. In addition to metrological factors, glacier/snow cover also contributed to lake volume variation. With an increasing temperature and the retreat of glaciers, potential supplements of meltwater will decrease, and then the lake will be at a risk of constant recession.

6. Conclusions

Several findings were obtained from the analysis of hydrological changes of 15 lakes on the southern TP. Lakes in the Inner basin usually underwent expansion with rates from 0.17 to 29.87 km2/yr between 2000 and 2015, especially Selin Co, Nam Co, Ngangze, and Zhari-namco. For the four lakes, with the aid of volume changes, contributions of the driving factors were derived based on the water balance equation. The precipitations in sub-basins presented no clear changes, while the land evaporations increased slightly. The negative effect of lake surface evaporation was almost 2.76–3.88 times that of lake surface precipitation. Surface runoff was the main cause of lake expansion, while it decreased over the studied period, and this implied that the contributions from other factors, such as snow/glacier meltwater, permafrost increased. Two lakes in the Indus Basin experienced retreats. Three lakes in the Brahmaputra Basin showed different changing trends. Yamzho Yumco endured a considerable retreat, and climate factors were not enough to explain this. Actually, the hydrological project has been a major cause of lake level decline since 2005. With increasing evaporation, decreasing glacier meltwater, and the constant effect of the hydropower station, the situation of Yamzho Yumco will get worse.
In this research, MODIS images were selected to document inundation changes as this instrument scanned the earth two times a day. Some other high-resolution measurements were discarded as they had low frequent observations, such as the widely applied Landsat images (30 m). Discarding the scenes contaminated by clouds or snow, the available Landsat images were few, lowing the density of lake storage data. The usable MODIS images can guarantee at least one measurement available in a month. As our aim was to study lake hydrological changes on annual and monthly scales, such frequency of observations was adequate. In addition, high frequency of lake area data derived from MODIS images can match more lake level data.
Regarding driving forces, some researches have tried to analyze the impact of climate and land cover change on lake fluctuations on the TP. However, only the correlation analysis was carried out between independent variables and hydrologic traits. Hydrologic models such as Soil and Water Assessment Tool (SWAT) and Variable Infiltration Capacity (VIC) [33,34] can simulate hydrological processes of lakes or basins and illustrate the driving forces of lake dynamics, while sufficient measured variables is a key prerequisite. Therefore, hydrological models are not practical on the TP due to the insufficient gauged measurements. In contrast, the water balance equation applied in this research can quantitatively derive contributions of precipitation, lake surface evaporation, land evaporation, surface runoff, and other factors. The results have implications to assess the effect of climate change and glacier retreat and it is possible to perform the same task in other enclosed basins.
In addition, three hydrological traits were presented with high levels of accuracy. Therefore, the procedure employed in this paper can be expanded to other lakes without in situ observations. The high frequency and long series of lake coastlines can be treated as contours of lake bathymetry. The lake’s bottom topography can be derived based on these contours, especially for the lakes endured large dynamics, such as Selin Co. On the whole, this research obtained changing details and quantified potential contributors to lakes on the southern TP. The results can help us to better understand the regional water cycle and climate change on the TP that have occurred in this century and also can be a foundation for hydrologic modelling of the TP.

Author Contributions

Writing—original draft, F.S.; writing—review and editing, F.S.; supervision, R.M. and B.H.; validation, X.Z., Y.Z., S.Z., and S.T. All authors have read and agreed to the published version of the manuscript.

Funding

This work was supported by the National Natural Science Foundation of China (grant No. 42001353), the Scientific Program of Guangzhou University (grant Nos. YG2020019 and SJ201911), the Open Research Fund Program of Guangdong Key Laboratory of Ocean Remote Sensing (South China Sea Institute of Oceanology Chinese Academy of Sciences) (grant No. 2017B030301005-LORS2006), and the Project of Science and Technology Development of Guangdong Academy of Sciences (grant No. 2020GDASYL-20200102013).

Conflicts of Interest

The authors declare that they have no known competing financial interests or personal relationships that could have appeared to influence the work reported in this paper.

References

  1. Sun, F.; Zhao, Y.; Gong, P.; Ma, R.; Dai, Y. Monitoring dynamic changes of global land cover types: Fluctuations of major lakes in China every 8 days during 2000–2010. Chin. Sci. Bull. 2014, 59, 171–189. [Google Scholar] [CrossRef]
  2. Zhang, G.; Xie, H.; Yao, T.; Kang, S. Water balance estimates of ten greatest lakes in China using ICESat and Landsat data. Chin. Sci. Bull. 2013, 58, 3815–3829. [Google Scholar] [CrossRef] [Green Version]
  3. Zhang, G.; Yao, T.; Shum, C.K.; Yi, S.; Yang, K.; Xie, H.; Feng, W.; Bolch, T.; Wang, L.; Behrangi, A. Lake volume and groundwater storage variations in Tibetan Plateau’s endorheic basin. Geophys. Res. Lett. 2017, 44, 5550–5560. [Google Scholar] [CrossRef]
  4. Alsdorf, D.E.; Rodríguez, E.; Lettenmaier, D.P. Measuring surface water from space. Rev. Geophys. 2007, 45. [Google Scholar] [CrossRef]
  5. Smith, L.C. Satellite remote sensing of river inundation area, stage, and discharge: A review. Hydrol. Process. 1997, 11, 1427–1439. [Google Scholar] [CrossRef]
  6. Birkett, C.M. The contribution of TOPEX/POSEIDON to the global monitoring of climatically sensitive lakes. J. Geophys. Res. Oceans. 1995, 100, 25179–25204. [Google Scholar] [CrossRef]
  7. Birkett, C.M.; Mertes, L.; Dunne, T.; Costa, M.H.; Jasinski, M.J. Surface water dynamics in the Amazon Basin: Application of satellite radar altimetry. J. Geophys. Res. Atmos. 2002, 107, 21–26. [Google Scholar] [CrossRef]
  8. Hwang, C.; Peng, M.; Ning, J.; Luo, J.; Sui, C. Lake level variations in China from TOPEX/Poseidon altimetry: Data quality assessment and links to precipitation and ENSO. Geophys. J. Int. 2005, 161, 1–11. [Google Scholar] [CrossRef] [Green Version]
  9. Zheng, J.; Ke, C.; Shao, Z.; Li, F. Monitoring changes in the water volume of Hulun Lake by integrating satellite altimetry data and Landsat images between 1992 and 2010. J. Appl. Remote Sens. 2016, 10, 16029. [Google Scholar] [CrossRef]
  10. Wang, X.; Gong, P.; Zhao, Y.; Xu, Y.; Cheng, X.; Niu, Z.; Luo, Z.; Huang, H.; Sun, F.; Li, X. Water-level changes in China’s large lakes determined from ICESat/GLAS data. Remote Sens. Environ. 2013, 132, 131–144. [Google Scholar] [CrossRef]
  11. Schwatke, C.; Dettmering, D.; Bosch, W.; Seitz, F. DAHITI – an innovative approach for estimating water level time series over inland waters using multi-mission satellite altimetry. Hydrol. Earth Syst. Sci. 2015, 19, 4345–4364. [Google Scholar] [CrossRef] [Green Version]
  12. Birkett, C.; Reynolds, C.; Beckley, B.; Doorn, B. From Research to Operations: The USDA Global Reservoir and Lake Monitor; Coastal Altimetry; Springer: Berlin/Heidelberg, Germany, 2011; pp. 19–50. [Google Scholar]
  13. Berry, P.A.M.; Wheeler, J.L. JASON2-ENVISAT Exploitation—Development of Algorithms for the Exploitation of JASON2-ENVISAT Altimetry for the Generation of a River and Lake Product; Product Handbook v3.5; De Montfort University: Leicester, UK, 2009. [Google Scholar]
  14. Crétaux, J.; Jelinski, W.; Calmant, S.; Kouraev, A.; Vuglinski, V.; Bergé-Nguyen, M.; Gennero, M.; Nino, F.; Del Rio, R.A.; Cazenave, A. SOLS: A lake database to monitor in the Near Real Time water level and storage variations from remote sensing data. Adv. Space Res. 2011, 47, 1497–1507. [Google Scholar] [CrossRef]
  15. Prigent, C.; Papa, F.; Aires, F.; Rossow, W.B.; Matthews, E. Global inundation dynamics inferred from multiple satellite observations, 1993–2000. J. Geophys. Res. Atmos. 2007, 112. [Google Scholar] [CrossRef]
  16. Papa, F.; Prigent, C.; Aires, F.; Jimenez, C.; Rossow, W.B.; Matthews, E. Interannual variability of surface water extent at the global scale, 1993–2004. J. Geophys. Res. Atmos. 2010, 115. [Google Scholar] [CrossRef]
  17. Feng, L.; Hu, C.; Chen, X.; Li, R.; Tian, L.; Murch, B. MODIS observations of the bottom topography and its inter-annual variability of Poyang Lake. Remote Sens. Environ. 2011, 115, 2729–2741. [Google Scholar] [CrossRef]
  18. Frappart, F.; Seyler, F.; Martinez, J.; León, J.G.; Cazenave, A. Floodplain water storage in the Negro River basin estimated from microwave remote sensing of inundation area and water levels. Remote Sens. Environ. 2005, 99, 387–399. [Google Scholar] [CrossRef] [Green Version]
  19. Song, C.; Huang, B.; Ke, L. Modeling and analysis of lake water storage changes on the Tibetan Plateau using multi-mission satellite data. Remote Sens. Environ. 2013, 135, 25–35. [Google Scholar] [CrossRef]
  20. Cai, X.; Feng, L.; Hou, X.; Chen, X. Remote sensing of the water storage dynamics of large lakes and reservoirs in the Yangtze River Basin from 2000 to 2014. Sci. Rep.-UK 2016, 6, 36405. [Google Scholar] [CrossRef] [Green Version]
  21. Sun, F.; Ma, R. Hydrologic changes of Aral Sea: A reveal by the combination of radar altimeter data and optical images. Ann. GIS 2019, 25, 247–261. [Google Scholar] [CrossRef] [Green Version]
  22. Medina, C.; Gomez-Enri, J.; Alonso, J.J.; Villares, P. Water volume variations in Lake Izabal (Guatemala) from in situ measurements and ENVISAT Radar Altimeter (RA-2) and Advanced Synthetic Aperture Radar (ASAR) data products. J. Hydrol. 2010, 382, 34–48. [Google Scholar] [CrossRef]
  23. Swenson, S.; Wahr, J. Monitoring the water balance of Lake Victoria, East Africa, from space. J. Hydrol. 2009, 370, 163–176. [Google Scholar] [CrossRef]
  24. Vapnik, V. Estimation of Dependences Based on Empirical Data; Springer Science & Business Media: New York, NY, USA, 2006. [Google Scholar]
  25. Feyisa, G.L.; Meilby, H.; Fensholt, R.; Proud, S.R. Automated Water Extraction Index: A new technique for surface water mapping using Landsat imagery. Remote Sens. Environ. 2014, 140, 23–35. [Google Scholar] [CrossRef]
  26. Bronner, E.; Guillot, A.; Picot, N.; Noubel, J. SARAL/AltiKa products handbook. Tech. Rep. CNES SALP-MU-M-OP-15984-CN 2013, 2, 1–76. [Google Scholar]
  27. Liu, Y.; Yue, H. Estimating the fluctuation of Lake Hulun, China, during 1975–2015 from satellite altimetry data. Environ. Monit. Assess. 2017, 189, 1–16. [Google Scholar] [CrossRef]
  28. Zhang, G.; Chen, W.; Xie, H. Tibetan Plateau’s lake level and volume changes from NASA’s ICESat/ICESat-2 and Landsat Missions. Geophys. Res. Lett. 2019, 46, 13107–13118. [Google Scholar] [CrossRef]
  29. Zhang, G.; Yao, T.; Xie, H.; Zhang, K.; Zhu, F. Lakes’ state and abundance across the Tibetan Plateau. Chin. Sci. Bull. 2014, 59, 3010–3021. [Google Scholar] [CrossRef]
  30. Li, X.; Long, D.; Huang, Q.; Han, P.; Zhao, F.; Wada, Y. High-temporal-resolution water level and storage change data sets for lakes on the Tibetan Plateau during 2000–2017 using multiple altimetric missions and Landsat-derived lake shoreline positions. Earth Syst. Sci. Data Discuss. 2019, 11, 1603–1627. [Google Scholar] [CrossRef] [Green Version]
  31. Allen, R.G.; Pereira, L.S.; Raes, D.; Smith, M. Crop Evapotranspiration-Guidelines for Computing Crop Water Requirements-FAO Irrigation and Drainage paper 56; Food and Agriculture Organization of the United Nations: Rome, Italy, 1998. [Google Scholar]
  32. Sang, Y.F.; Chen, D.; Gong, T. What Caused the Decline of Water Level of Yamzho Yumco During 1975–2012 in the Southern Tibetan Plateau? J. Geophhys Res-Atmos. 2020, 125, e31121. [Google Scholar] [CrossRef]
  33. Biancamaria, S.; Lettenmaier, D.P.; Pavelsky, T.M. The SWOT mission and its capabilities for land hydrology. Surv. Geophys. 2016, 37, 307–337. [Google Scholar] [CrossRef] [Green Version]
  34. Xie, Z.; Yuan, F.; Duan, Q.; Zheng, J.; Liang, M.; Chen, F. Regional parameter estimation of the VIC land surface model: Methodology and application to river basins in China. J. Hydrometeorol. 2007, 8, 447–468. [Google Scholar] [CrossRef] [Green Version]
Figure 1. Spatial distribution of the 15 studied lakes and watersheds, paths of Ice, Cloud, and Land Elevation Satellite (ICESat) and ENVIromental SATellite (Envisat) altimeter data and metrological stations in the study area. Symbols near lake ID numbers indicate trends in the area. Up arrows indicate increases, down arrows indicate decreases, and N means no obvious change.
Remotesensing 12 03450 g001
Figure 2. ICEsat and Envisat ground tracks on Selin Co. The green circles cover some altimeter footprints fell on the lakeside in 2000, while on the lake surface in 2015.
Remotesensing 12 03450 g002
Figure 3. Comparisons among three different sources of lake level results collected in 2000–2015 for Nam Co, Selin Co, and Tangra-yumco.
Remotesensing 12 03450 g003
Figure 4. Area dynamics and inundation frequencies of Namu Co (a), Selin Co (b), Zhari-namco (c), Ngangze Co (d), and Yamzho Yumco (e) in 2000–2015.
Remotesensing 12 03450 g004
Figure 5. Lake level series (red lines) and volume changes (blue lines) of the studied lakes in 2000–2015. The number before the lake name is the lake ID.
Remotesensing 12 03450 g005
Figure 6. Comparisons between 30 m interpretation products and the extracted results based on MODIS images.
Remotesensing 12 03450 g006
Figure 7. Comparisons between studied results and gauged records of Zhari-namco.
Remotesensing 12 03450 g007
Figure 8. Net precipitation and lake volume changes on the yearly scale of Nam Co (a), Selin Co (b), Zhari-namco (c), and Ngangze (d) from 2000 to 2015.
Remotesensing 12 03450 g008
Figure 9. Annual precipitation (a), lake surface evaporation (b), and mean temperature (c), in 2000–2015, derived from five metrological stations near Yamzho Yumco. The different color lines in the three charts represent variables of different stations.
Remotesensing 12 03450 g009
Table 1. Characteristics of the studied lakes on the southern Tibetan Plateau (TP).
Lake IDNameLongitude 1 (°)Latitude 1 (°)Area (km2)Level (m)
1Mapam Yumco81.42 30.75 401.47 4585.39
2Ngangla-ringco83.09 31.56 485.83 4715.03
3Taro Co84.12 31.13 473.50 4566.77
4Zhari-namco85.62 30.91 985.65 4612.48
5Ngangze87.15 31.03 437.03 4683.00
6Gyaring Co88.31 31.13 460.44 4648.23
7Yamzho Yumco90.65 28.88 506.84 4439.36
8Rakshastal81.25 30.66 247.24 4572.00
9Puma Yumco90.38 28.57 281.75 5017.28
10Daggayai Co85.72 29.85 101.36 5143.80
11Shuru Co86.41 30.27 200.64 4714.95
12Pegu Co85.60 28.90 264.95 4580.00
13Nam Co90.66 30.72 1971.81 4723.64
14Selin Co88.95 31.76 2192.24 4542.59
15Tangra-yumco86.60 31.06 817.60 4535.83
1 The pairs of longitude and latitude values indicate the geometric centers of the lakes.
Table 2. Detailed information about Area and Level series data for the studied lakes.
Lake IDAreaLevel
Number of SeriesTime RangeData Source 2Number of SeriesTime Range
HydrowebEnvisatICESat
13692000/3/5–2015/12/17 532002/8/12–2010/10/3
24062000/2/26–2015/12/171072002/10/19–2015/12/7
35012000/2/26–2015/12/17552003/11/1–2015/12/27
45002000/3/5–2015/12/172562000/3/6–2015/12/23
54112000/3/5–2015/12/173082000/1/6–2015/12/23
64652000/3/5–2015/12/17 122002/7/15–2011/12/18
75732000/2/18–2015/12/17 452002/6/17–2010/7/5
83662000/5/16–2015/12/17 32002/7/30–2003/4/1
93952000/2/18–2015/12/17 202002/7/12–2012/3/20
103692000/2/26–2015/12/17 142010/11/20–2012/3/13
114452000/2/26–2015/12/17 32002/8/6–2003/11/17
124992000/2/26–2015/12/17 42003/3/24–2008/12/2
133222000/2/18–2015/12/171582000/1/9–2015/12/8
144532000/4/6–2015/12/172512000/5/16–2015/12/30
154102000/2/26–2015/12/171332000/1/18–2015/12/17
2 √ indicates the lake was covered by some kind of water level data.
Table 3. Inundation changes of the studied lakes 3.
Lake ID.123456789101112131415
Lake NameMapam YumcoNgangla-RingcoTaro CoZhari-NamcoNgangzeGyaring CoYamzho YumcoRakshastalPuma YumcoDaggayai CoShuru CoPegu CoNam CoSelin CoTangra-Yumco
BasinIndusInnerInnerInnerInnerInnerBrahmaputraIndusBrahmaputraInnerInnerBrahmaputraInnerInnerInner
Max area (km2)/Date413.43514.54484.71019.84470.75479.55587.09259.95296.23109.69206.5274.552042.482377.99848.33
2006/11/12008/12/262009/3/62010/2/22015/3/222004/10/312004/10/312000/9/292015/11/12009/1/252002/1/92005/11/172008/10/312013/11/12011/3/14
Min area (km2)/Date390.68461.95463.02940.85384.24439.19402.49233.33268.1191.87194.05254.81889.211805.71792.52
2010/5/252002/6/102014/6/262000/4/302000/7/192008/6/12015/6/102008/6/172005/7/282015/7/42008/9/292009/4/152000/7/112000/6/172001/8/21
Changing rate (km2/yr)–0.10No change0.152.273.70−0.16−3.49−0.36No changeNo change0.05−0.181.6228.810.61
p-value < 0.05YNYYYYYYNNYYYYY
3 Columns filled in the same color indicate that the lakes are in the same basin.
Table 4. Yearly contribution of components to the water balance equation.
LakePrecipitation (km3)Runoff (km3)Evapotranspiration (km3)W (km3)
Nam Co0.913.522.511.68
Selin Co0.9411.463.040.08
Zhari-namco0.286.371.070.42
Ngangze0.122.360.440.32
Publisher’s Note: MDPI stays neutral with regard to jurisdictional claims in published maps and institutional affiliations.

