Review

Advances in Remote Sensing Technology, Machine Learning and Deep Learning for Marine Oil Spill Detection, Prediction and Vulnerability Assessment

by
Shamsudeen Temitope Yekeen
and
Abdul-Lateef Balogun
*
Geospatial Analysis and Modelling (GAM) Research Laboratory, Department of Civil and Environmental Engineering, Universiti Teknologi PETRONAS (UTP), Seri Iskandar 32610, Perak, Malaysia
*
Author to whom correspondence should be addressed.
Remote Sens. 2020, 12(20), 3416; https://doi.org/10.3390/rs12203416
Submission received: 28 August 2020 / Revised: 21 September 2020 / Accepted: 21 September 2020 / Published: 18 October 2020
(This article belongs to the Special Issue Remote Sensing Applications in Coastal Environment)

Abstract

:
Although advancements in remote sensing technology have facilitated quick capture and identification of the source and location of oil spills in water bodies, the presence of other biogenic elements (lookalikes) with similar visual attributes hinder rapid detection and prompt decision making for emergency response. To date, different methods have been applied to distinguish oil spills from lookalikes with limited success. In addition, accurately modeling the trajectory of oil spills remains a challenge. Thus, we aim to provide further insights on the multi-faceted problem by undertaking a holistic review of past and current approaches to marine oil spill disaster reduction as well as explore the potentials of emerging digital trends in minimizing oil spill hazards. The scope of previous reviews is extended by covering the inter-related dimensions of detection, discrimination, and trajectory prediction of oil spills for vulnerability assessment. Findings show that both optical and microwave airborne and satellite remote sensors are used for oil spill monitoring with microwave sensors being more widely used due to their ability to operate under any weather condition. However, the accuracy of both sensors is affected by the presence of biogenic elements, leading to false positive depiction of oil spills. Statistical image segmentation has been widely used to discriminate lookalikes from oil spills with varying levels of accuracy but the emergence of digitalization technologies in the fourth industrial revolution (IR 4.0) is enabling the use of Machine learning (ML) and deep learning (DL) models, which are more promising than the statistical methods. The Support Vector Machine (SVM) and Artificial Neural Network (ANN) are the most used machine learning algorithms for oil spill detection, although the restriction of ML models to feed forward image classification without support for the end-to-end trainable framework limits its accuracy. On the other hand, deep learning models’ strong feature extraction and autonomous learning capability enhance their detection accuracy. Also, mathematical models based on lagrangian method have improved oil spill trajectory prediction with higher real time accuracy than the conventional worst case, average and survey-based approaches. However, these newer models are unable to quantify oil droplets and uncertainty in vulnerability prediction. Considering that there is yet no single best remote sensing technique for unambiguous detection and discrimination of oil spills and lookalikes, it is imperative to advance research in the field in order to improve existing technology and develop specialized sensors for accurate oil spill detection and enhanced classification, leveraging emerging geospatial computer vision initiatives.

Graphical Abstract

1. Introduction

Oil spills are a global phenomenon that have been increasing with the rise in oil consumption [1]. Rapid world population growth [2], industrialization, and modern transportation have increased the demand for oil, which has escalated the occurrence of oil spills. Examples of oil spill incidents, which cut across diverse geographical locations, include the Canada Atlantic Empress between (2,100,000–2,400,000 Barrels), South African ship tank fire of Castillo De Bellver (1,850,000 Barrels), Mexico Ixtoc (3,300,000 Barrels), and Persian Gulf Iran–Iraq War (1,900,000 Barrels) [3]. Pipeline leakage, accidents arising from system failure, vandalism, human error [4], shipwreck, and collision are the major causes of oil spills. These result in severe ecological and economic disasters [5] which are exemplified by the cost of crude oil loss, cleaning costs, impact research funding, and rehabilitation costs. Lynch [6] reported the loss of 4.9 million barrels of crude oil and $68 billion incurred for environmental cleaning after the BP Deepwater Horizon oil spill at the Gulf of Mexico. Over $17 billion worth of natural resources were damaged [7], loss of environmental resources estimated at $37 billion was recorded [8], and tens of billions of USD were charged as fine and research funding following the disaster [9,10]. On the other hand, ecological problems include water pollution [11], shoreline, and beach contamination, which accounted for the loss of 5268 organisms after the Puerto Rico 1994 oil spill [12]. Marine invertebrate habitat degradation, oiling and smothering of individuals, interruption of food web and toxicity [13,14], sub-lethal, and mortality of marine birds [15,16,17] have also been documented. Further, loss of marine mammals and vegetation have been reported [18,19,20]. The severity of these hazards is aggravated by the slow response to oil spill disasters. Rapid response to oil spills prevents indiscriminate spread and minimizes likely consequences [21,22,23,24].
Attending to oil spills rapidly requires accurate identification of the location and extent of the spills, and several studies have been carried out to accomplish this [25,26,27]. Before the 1960s, traditional on-site monitoring methods were prominent in identifying oil spills [28]. However, this approach posed risks ranging from direct contact with oil to other site hazards. In addition, it was impossible to measure the extent of oil spills using this technique [25]. Ocean surveillance systems, comprising aircraft and coastguard forces, were later introduced to provide reliable and accurate monitoring. Although highly effective, its application is limited due to the high cost of acquiring data for larger areas [29,30]. Nonetheless, simple still and video photography were still common in the past although limited by short distance cover [31]. Hence, the need for larger area coverage technology such as remote sensing which is widely used today [32].
Remote sensing is the ability to acquire data from an object without physical contact [33,34]. The principle behind oil spill remote sensing monitoring was first established by Estes and Senger [35], stating the significance of aerial data for its application. Remote sensing uses sensors (optical and microwave) for data acquisition. Optical sensors utilize visible length and infrared rays while microwave sensors use longer wavelengths that receive microwaves. Both sensors have been applied to oil spill detection, but microwave sensors enjoy broader usage due to the ability to capture data at any time of the day and under any weather condition without being affected by cloud cover [25,30,36,37]. This explains the widespread adoption of Radar microwave technology for oil spill detection [28,38,39,40,41]. In identifying oil spills in water bodies, the satellites emit microwave and detect the reflected wave in return. This process reduces the energy returned to the satellites, causing it to appear as a black spot in the imagery [42] because of the visco elastic features of oil which suppress the wave growth and increase the wave dissipation [43]. However, the dark spots that appear on the SAR imageries from radar sensors are not exclusively oil spills. They could also be indicators of low wind areas, natural films, wind front areas, wind shadow at areas close to island, rain cells, current shear zones, ship wake [44], grease ice, algae blooms, and weed beds [40,45], which are termed lookalikes.
To eliminate false positive identification, different methods have been used to distinguish oil spills from lookalikes. Fiscella et al. [46], Guo and Zhang [47], and Frate et al. [48] used texture and gray attribute and frequency domain, which considers geometric attribute and shapes in its classification. The threshold segmentation method that entails forecolor and background color distinction for dark spot detection and the use of threshold values to segregate oil spill from lookalikes has also been implemented [49]. However, challenges remain in clearly distinguishing oil spills from lookalikes because most of the existing methods such as traditional machine learning models, statistical models, and clustering models cannot adequately perform this classification.
Further, predicting the trajectory of oil spill is valuable in classifying the vulnerability of surrounding areas and prompt and accurate delineation of vulnerable areas is essential for decision making in disaster risk reduction. Several mathematical models based on Lagrangian particle works have been developed for this purpose but the ability to provide clear risk information with respect to the potential flow of the spilled oil is limited [50,51,52,53]. Recent advances in spatial data science, remote sensing technology and digitalization, particularly novel machine learning and deep learning algorithms, offer new opportunities to improve existing processes and address the challenges of oil spill disaster. The potential benefits of these emerging technologies have been widely projected, yet the available evidence remains limited. Many existing review studies do not include an updated review of various automated techniques, particularly novel digitalization approaches, for discriminating, detecting, and classifying oil spills from false positive elements in remote sensing imageries. Further, reviews of trajectory modeling, which is an important component of oil spill decision support systems, are limited.
Therefore, this paper aims to address this gap by undertaking a state-of-the-art review, covering the broad range of remote sensing oil spill detection, classification, and vulnerability assessment. We highlight the conceptual principles of the different remote sensing technologies for oil spill detection and the capability of novel digitalization tools for effective oil spill detection and trajectory modeling. The paper also identifies the various challenges confronting oil spill management. Consequently, the review distills what has and what has not been achieved, providing evidence-based basis for future research initiatives which is essential to addressing existing gaps in the literature in order to enhance oil spill disaster response and management utilizing remote sensing, machine learning, and deep learning algorithms.

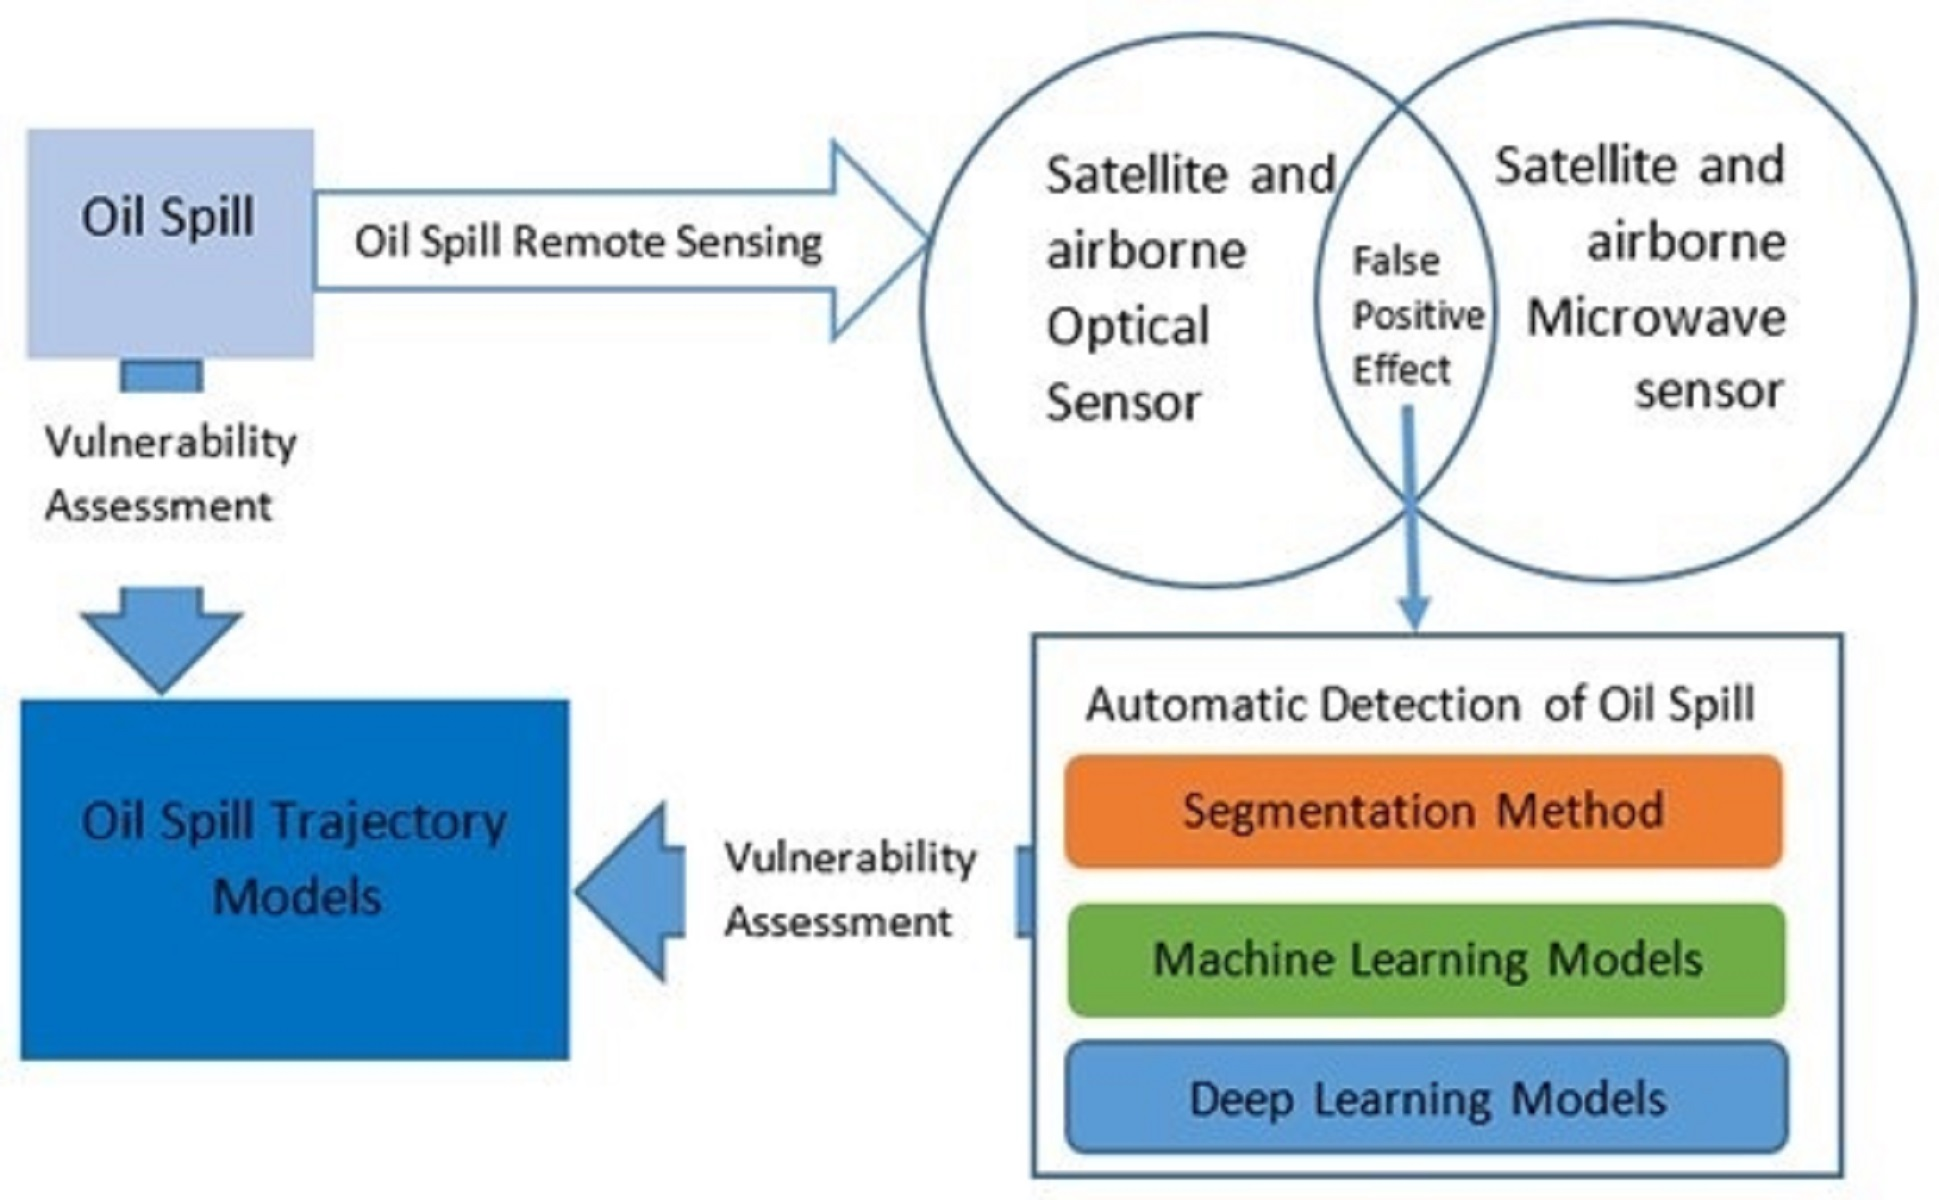
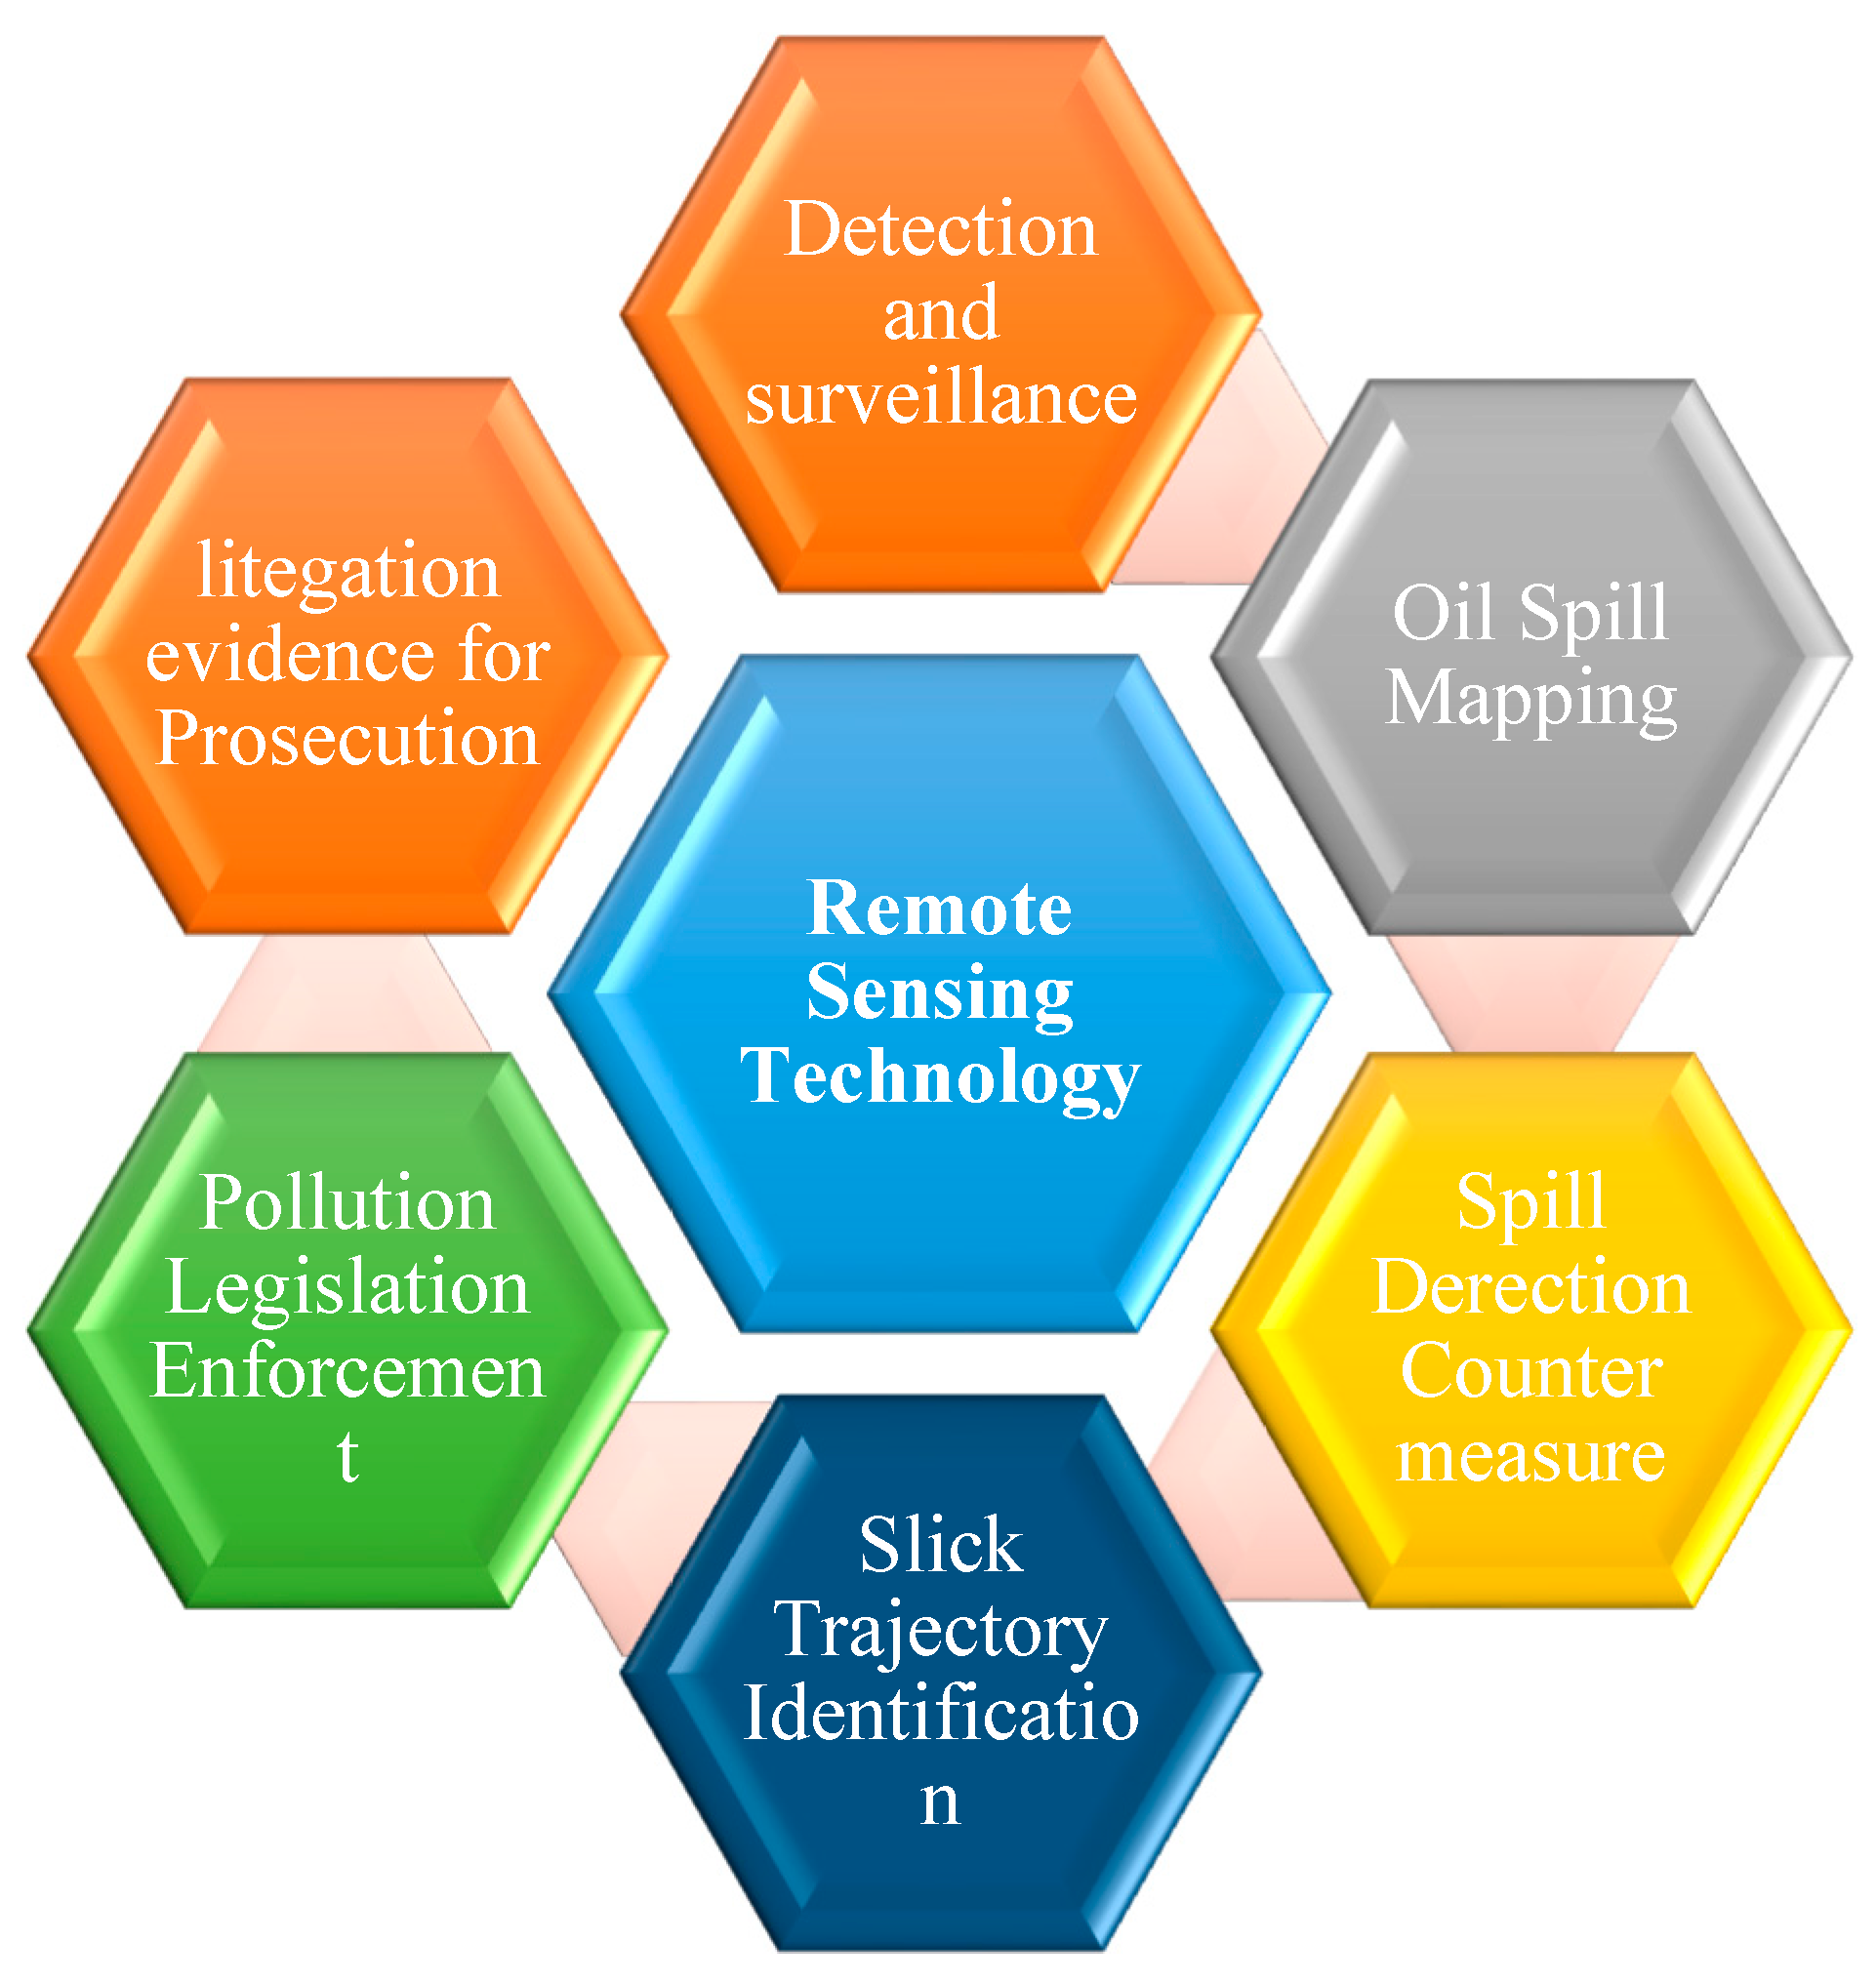
2. Remote Sensing in Oil Spill Management

The emergence of numerous sensors over the years has improved the application of remote sensing for oil spill management, as illustrated in Figure 1 [25,30,31,54,55].
Generally, the appearance of oil slicks in water bodies varies from sensors. For example, oil spill detection in water bodies in SAR is based on the principle that oil on water surfaces decrease backscattering, thereby forming a dark spot that is different from the brightness of other surrounding areas [37]. This differs from other sensors (e.g., optical sensors) because the reflectance, absorbance, and contrast between oil and water change based on prevailing weather, oil type, and weathering reaction [25,56,57]. Remote sensing instruments for oil spills include video and photography, thermal infrared imaging, spectrometers, airborne optical, microwave, laser fluorosensors, and satellite or airborne optical and microwave sensors [58]. While spaceborne remote sensing has a higher efficiency for large area coverage, airborne surveillance is less efficient because of the limited area coverage. Comparatively, the latter is more suitable and efficient for identification of source, type, thickness, and extent of oil spills with higher spatial resolution [10,59,60,61] unlike the former with a lower spatial and temporal resolution but useful for monitoring remote areas. In the following sections, different oil spill detection sensors are reviewed, stating the underlying principles, advantages, and limitations of each sensor. Case studies that provide empirical perspectives on the different sensors are also examined.

2.1. Optical Remote Sensing

Optical sensors depend on externally emitted electromagnetic radiation (e.g., sun) due to its inability to support self-reflection [60]. It uses the light absorption theory, scattering, and reflection because of the different physical and chemical changes that occur after oil spill that affect its visualization as the thickness changes [62,63], and the prevailing atmospheric weather conditions [64,65]. Optical remote sensing for oil spill detection can be airborne or satellite based, and the thickness of the oil floating on water continues to change therein until it reaches 0.1 mm or less [66].

2.1.1. Optical Airborne Remote Sensing

Visible Spectrum Optical Remote Sensing

Historically, since the 1970s, visible scanners and thermal infrared have been widely used in the visible region of the spectrum due to their availability and easy identification of oil spills [58,67]. Charge-coupled device (CCD) was later developed because of its ability to provide more sensitive and selective oil spill information in the water [68,69]. For oil spill detection, the presence of moderate surface reflectance, difference, and absence of absorption in the visible region is an indicator of oil on water [25]. The reflection ranges between 480-570nm [70] with a strong reflectance and transmittance wavelengths. Generally, contrasts in oil on water surfaces are affected in two ways which can either be positive or negative depending on the viewing geometry and wind [71]. First, the sun-glint effect enhances the contrast of the non-observable oil due to wave-damping effect [72]. The second effect is the difference between the optical properties of oil and water, which are mostly characterized by high absorption in blue wavelengths [73]. Different studies have used the combination of sun glint and optical property differences for the characterization and classification of oil spills and waterbodies [56,60,74].
To improve the contrast of oil in video cameras, filters are used but their success has been limited by lack of positive discrimination. The improvement in the sensor technology led to the development of hyperspectral sensors such as the Airborne Visible/Infrared Imaging Spectrometer (AVIRIS) and Airborne Imaging Spectrometer for Applications (AISA). Hyperspectral imaging, with its high spectral resolution and large amount of data information, has become a leading technology in remote sensing applications [75]. It can acquire very narrow bands at several wavelengths in the visible, near-infrared, mid-infrared, and thermal infrared bands. Advancements in hyperspectral technology has enabled its application to oil spills detection too, showing great potential in quantitatively monitoring oil film types, areas, and oil spill volumes thereby making up for the deficiency of the existing sensors. This sensor has been applied in different oil spill disasters (Figure 2) such as the Deepwater Horizon oil spill [25,60] and Exxon Verdex Oil spill [37].

Infrared (IR) Remote Sensing

The thickness of oil increases the level of solar radiation absorption and re-emits thermal energy in form of radiation within the long-wave region of 8–14μm [31,58]. The appearance of oil varies in infrared images. For example, thick oil appears hot; moderately thick appears cool; and thin slick is mostly glossy or not seen because the minimum detectable layer is 2–70 μm. Differences between oil and water are distinct in a thermal infrared region since oil has a lower emissivity than water, making it a much different spectral signature than water [76]. This enhances the suitability of infrared remote sensing for the identification of oil thickness level as well as in situ identification of the oil spill origin [77]. A draw-back of this technique is that elements such as seaweed, shoreline, and other lookalikes have similar radiation with oil, giving room for false positive results. Studies (e.g., [77,78,79,80,81,82]) have used infrared airborne images for the detection of oil spills. Although oil spills were identified from the acquired imageries, the presence of lookalikes was a major limitation. However, statistical and machine learning models have been incorporated for the classification of the oil spill and lookalikes for better decision making, as illustrated in Figure 3 from the study in [83].

Near-Infrared (NIR) Remote Sensing

NIR airborne data have been widely applied in the detection of oil spills [79,84,85,86] and classification of oil slicks [87,88]. Spectral appearance of slicks in NIR are displayed differently in all ranges, with the highest variance in the 2–2.5 μm reflectance region, which makes the identification of oil spills challenging. The major spectral features that indicate the presence of oil slicks are the fundamental C-H stretching and bending vibration bands [79]. The near 1720–1730 and 1750–1760 nm with the addition of band near 2370 nm and second overtones near 1190–1210 nm are features capable of indicating oil slick in NIR [60,89,90]. Hörig et al. [91] observed the differences in the oil spill affected and the non-affected sand areas at 1730–2310 nm spectral feature in HyMap data. Similarly, Kühn et al. [92] developed an oil index using 1705, 1729, and 1741 nm radiance from HyMap.

Ultraviolet (UV) Sensor

The use of ultraviolet scanners for oil spill detection is based on the principle that the presence of oil in water bodies increase the reflectivity of water surfaces [93]. Being an optical sensor scanner, the presence of sunlight reflection at 0.32–0.38 µm region indicates the presence of oil in water. Due to the high reflectance of oil in water when using UV, very thin oil slick has reflectance which can be mapped when the sheens/slick is less than 0.1 μm [25,31,55,58,94]. However, when the micron is higher than 10 UV, scanners are unable to detect oil thickness [95] and can make a false detection in the presence of wind sheen, sun glints, and seaweed. The interference in UV and infrared images are different but the combination of the two gives an improved result for oil spill detection [58].

2.1.2. Optical Satellite Remote Sensing

The use of optical satellites for oil spill detection in place of airborne sensors has been limited due to the timing and frequency of the overpass [25,60]. For example, during the Exxon Valdex spill, within a month, only a day satellite imagery was acquired for the monitoring of oil [25]. Optical satellites are affected by cloud cover, bad weather, and absence of sunlight [96,97,98]. In addition, the processing of datasets from optical satellites requires more time, which could delay emergency response to oil spills.
With advances in remote sensing technology, satellites such as medium resolution satellites (MODIS) were utilized for oil spill detection to reduce the long-time observation interval to about three days [25]. Although other high spatial resolution optical sensors (e.g., SPOT and IKONOS) are also available, these are expensive, have few spectral channels and low temporal resolution, and are unable to provide daily observation data [3,36,37,60,99]. MODIS satellite has a moderate resolution band of 250–1000 m, and it is usually used during the day due to its ability to utilize illumination from sunlight [73]. However, the lower resolution makes it difficult to identify 200 m long oil slicks due to its coarse nature [73]. It is affected by cloud cover but its ability to provide multiple wavelengths gives more information to discriminate slicks caused by algae [30,100]. In addition, the availability of sun glint affects the appearance of oil spills. Hu et al. [101] examined the potential of MODIS in the identification of oil spills in marine environment by comparing its result with SAR imagery. Oil slick was identified on a 500-m resolution band blue and green at 469–555 nm and at the short-wave bands of 1240 and 2130 nm, highlighting the high potential of MODIS. However, the presence of freshwater runoff and surfactants from phytoplankton blooms affects the ability to distinguish between oil spills and lookalikes. Similarly, the study of Srivastava and Singh [102] used 250- and 500-m resolution MODIS imagery, revealing that oil spills are better identified from the shorter wavelengths of the visible channel and seen at bands 3, 2, and 1 at 645, 555, and 469 nm, respectively. In addition, Sun et al. [73] used MODIS for the detection of large size oil slick (1000 m) long at the early period of the oil spill near the damaged platform at the Gulf of Mexico, suggesting that MODIS is better for large size oil spill detection.
Other multispectral optical satellites such as thematic images (30 m) of Landsat satellites, which perform observations every 16 days, are also being used to monitor marine oil spills. The National Oceanic and Atmospheric Administration’s (NOAA) weather satellite Advanced Very-High-Resolution Radiometer (AVHRR) image, which has a high temporal resolution, can be monitored four times a day in a certain sea area [60]. However, its spatial resolution (1.1 km) is low. For oil spill detection in water, the middle infrared (MIR) and thermal infrared (TIR) can indicate the presence of oil spill because the presence of oil in water shows a distinctly different spectral signature [103]. Oil spills are detected by identifying the difference in the thermal contrast between the emissivity of the oil slick and the background. The period of image acquisition in the day has a direct influence on the capability of the sensor’s oil spill detection because it has higher brightness temperature during the day than at night. This is because of the heat capacities of water and oil as well as change in surface tension that reduces the heat transfer across the air-sea interface [104]. Consequently, the appearance of water containing spilled oil is brighter during the day than ordinary water with a reduction between 2 K (in AVHRR channel 3) and 3 K (in AVHRR channel 5). To achieve a desirable output, studies have combined the two satellites to complement each other. Nonetheless, very thin sheens of oil slicks at 20 μm are not detectable because they are affected by sea surface temperature [60]. Ning et al. [32], Su et al. [105], and Nie and Zhang [106] adopted this sensor for oil spill detection. Examples of applied optical remote sensing imagery are indicated in Figure 4 as adopted from [60].
In 2015, the European Space Agency (ESA) lunched the multispectral Sentinel-2 satellite to aid the operational activities of the Copernicus Program. The satellite comprises 13 spectral bands. The near infrared bands have a spatial resolution of 10 m while the spatial resolutions of the red-edge/short wave infrared band and the atmospheric correction band are 20 and 60 m, respectively [107,108] (see Figure 5). Nezhad et al. [108] indicated that oil slick can be detected at the wavelengths of 400 and 1400 μm. Nonetheless, the application of this sensor to marine oil spill detection is still limited. This could be because of cloud cover and non-detection of thin slick which affects the data sensor, as detailed by Kolokoussis and Karathanassi [109] and Setiani and Ramdani [110].

2.2. Microwave Airborne and Satellite Remote Sensing

The use of microwave sensors for marine pollution monitoring, especially oil spill detection, has received considerable attention due to its all-weather and all-day capability [30]. The presence of oil spills in water is measured through surface reflectance. Since the emissivity of water and oil are different at 0.4 and 0.8 μm, respectively, active remote sensing can determine this difference for detection of oil spill. Synthetic Aperture Radar (SAR) and Side-Looking Airborne Radar (SLAR) are examples of active sensors used in oil spill detection. SAR (<1 m) has a higher spatial resolution than SLAR (<10 m), is less expensive, and is often used for airborne remote sensing. Synthetic aperture technology is based on the principle of Doppler Effect, relying on short antennas to achieve high spatial resolution [76]. Its underlying concept is premised on the notion that oil in water reduce short gravity and capillary waves to shorter wavelengths which leads to a reduction in radar backscatter. This can mainly be caused by Bragg scattering from surface wave with similar wavelengths [111]. Over the years, different radar satellites have been launched with various configurations, frequency, and polarization that enable the performance of vital functions, including marine oil spill monitoring. Table 1 highlights the different radar satellites in use. Similar to passive sensors, the presence of biogenic elements such as seaweed and high waves indicate false positives of oil spill presence (lookalikes). In addition, SAR comprises both single and full polarization. The single polarimetric SAR has a large swath coverage and requires auxiliary information with large number of data samples for oil spill detection. The fully polarimetric SAR usually contain extra information for the measured scattering matrices, enabling the easy discrimination of oil spills from other ocean features [25,60].
Several studies have used SAR images for oil spill detection. Ivanov and Zatyagalova [94] used SAR satellite remote sensing data with the aid of GIS to identify oil spills in the sea of Okhotsk, the Caspian Sea, the Black Sea, and the Gulf of Thailand and concluded that these tools are capable of providing information to aid the understanding of oil spillage in the marine environment. Kostianoy et al. [112], in a study on satellite remote sensing of oil spill pollution in the southeastern Baltic Sea, identified oil spill area of about 20.33 km2 using SAR Imagery of ERS-2. Gallego et al. [113], in a study on segmentation of oil spills on side-looking airborne radar imagery with auto encoders, indicated that SLAR satellite images acquired from the placing of 2 SAR antennas on an aircraft are capable of detecting oil spill. Other studies (e.g., [29,61,114,115,116,117]) have also recorded successes in the application of microwave remote sensing for oil spills detection. However, similar to other sensors, the similarity in the visual appearance of oil slick with other lookalikes limits its application, as illustrated in Figure 6.

3. Automatic Detection Techniques for Distinguishing Oil Spills from Lookalikes

Different methods exist for oil spill detection, but, due to variations in oil spill incidents, there is no single most appropriate method [5]. To address the complexity in oil spill detection because of lookalikes in satellite imageries, different techniques have emerged. These methods, which include the use of graph representative [118], statistical based model [119], and clustering model [120], are based on threshold value and generally comprise of three stages: (1) dark spot oil spill region detection and identification from background; (2) feature extraction from identified dark spots; and (3) classification of features to oil slick and lookalikes [30,45]. Recently, the ubiquity of digitalization tools such as machine learning models (e.g., traditional classifiers, neural network, auto encoders, and deep learning convolutional neural network) is being leveraged to improve the oil spill detection and classification process. Details of these emerging digital trends are presented in the following section.

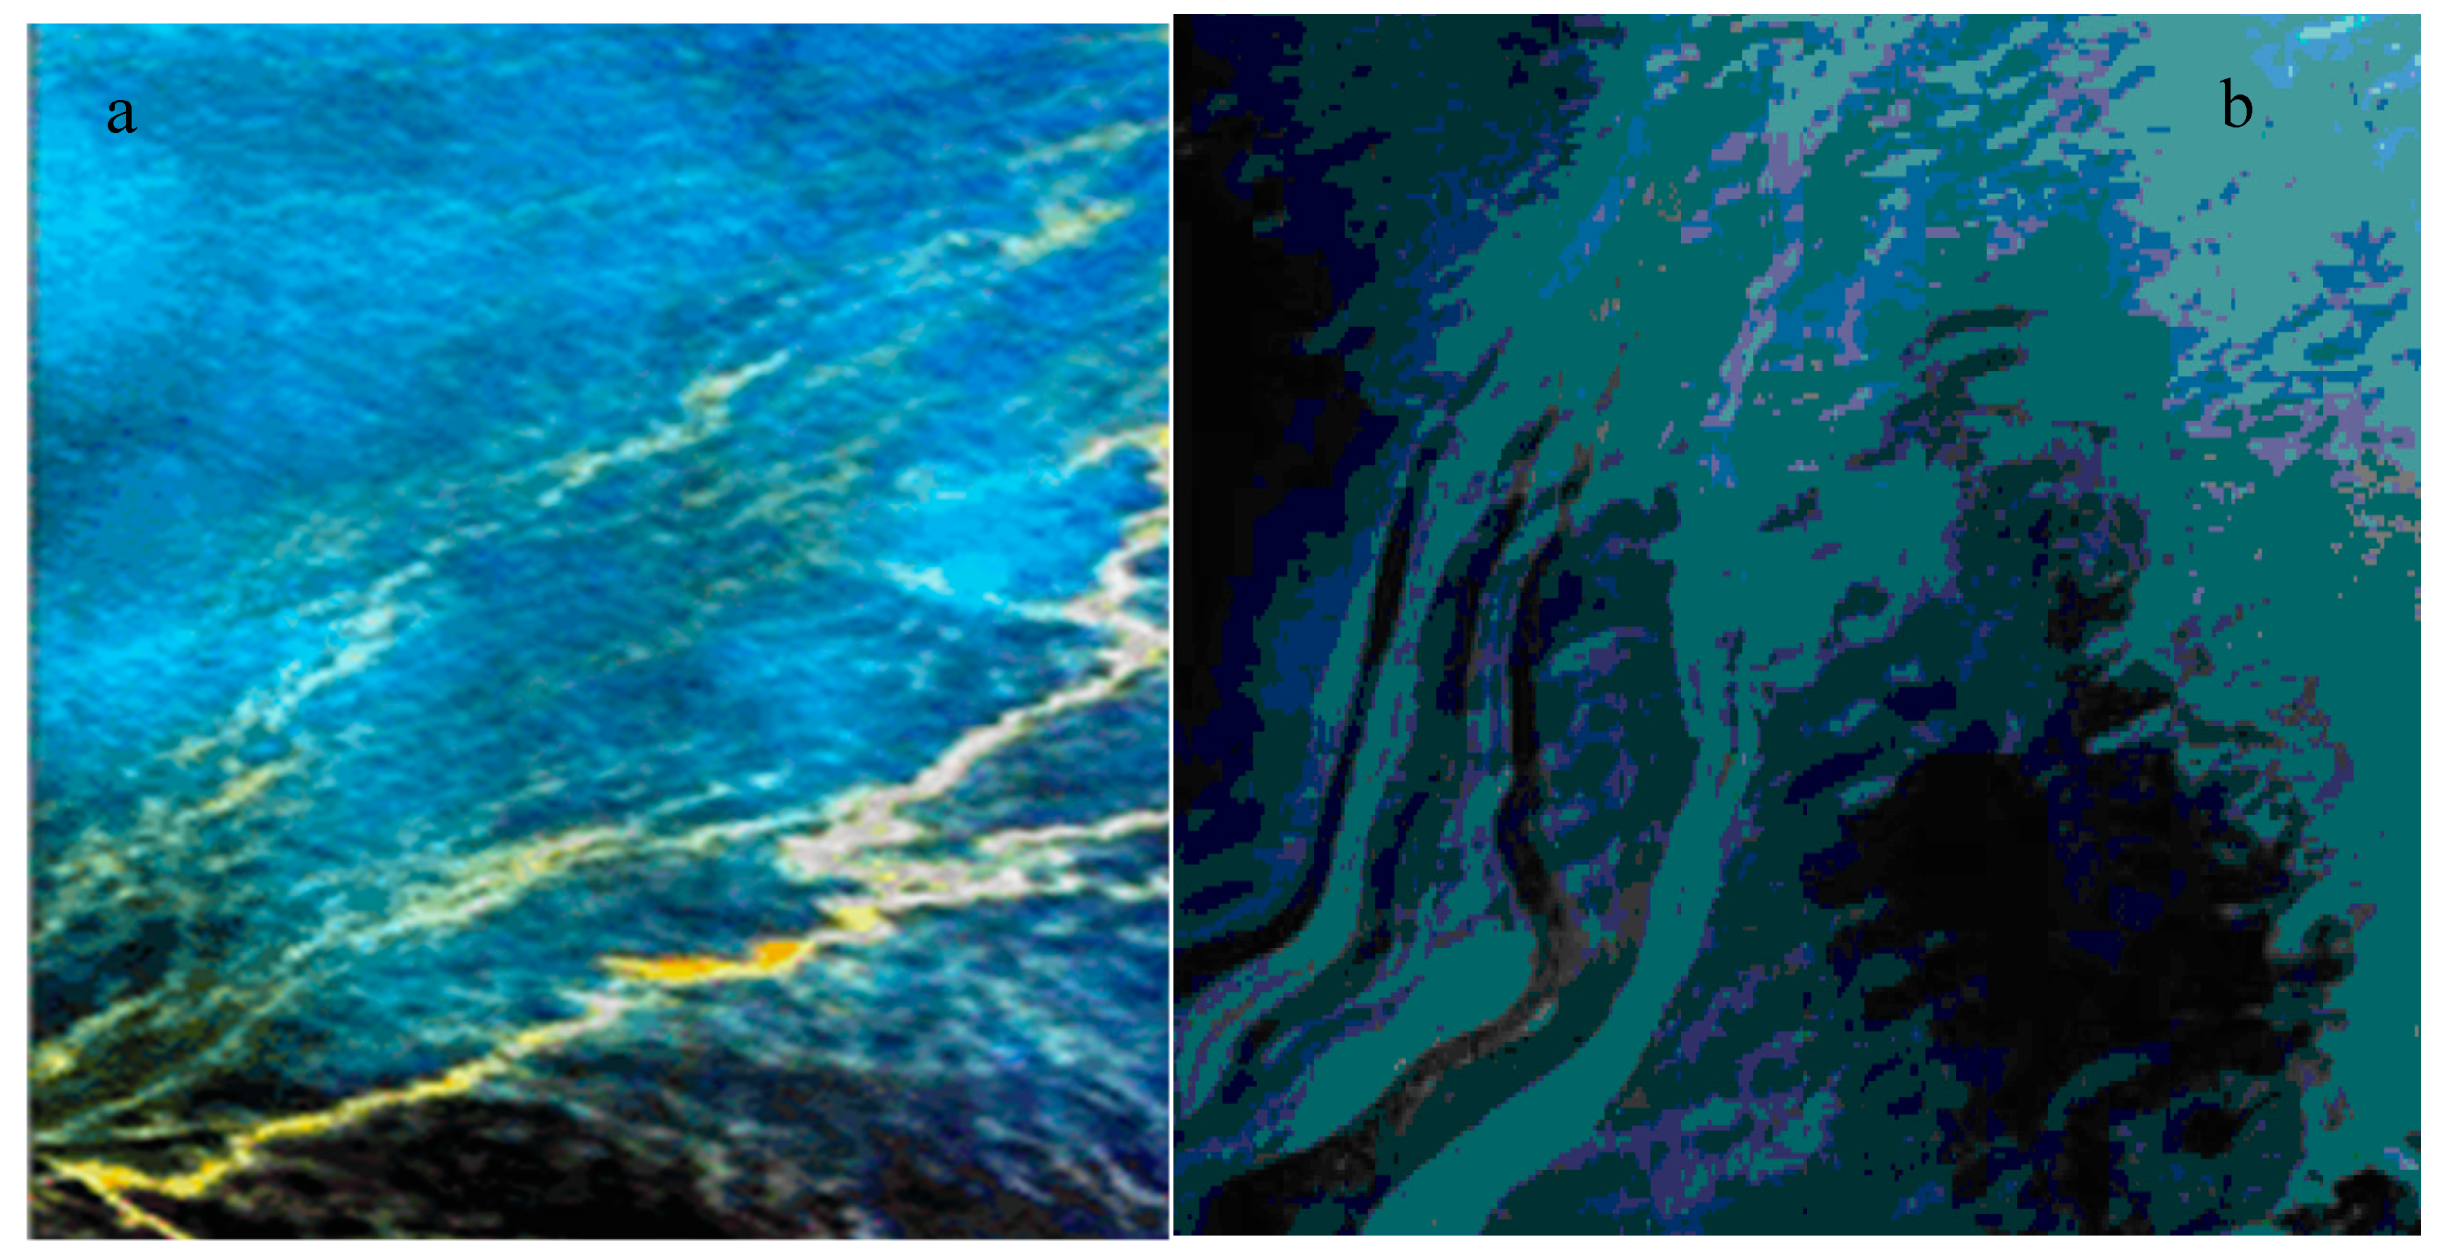
3.1. Image Segmentation Technique

Image segmentation is the process of dividing images into different regions of objects under consideration or interest [121]. The method converts images into highly contrasting levels, making it easier to examine and analyze isolated regions. It also requires lesser computation than other methods [122]. The thresholding and segmentation methods are used for the identification of oil spills represented as dark spots in satellite images due to the low level of backscattering.

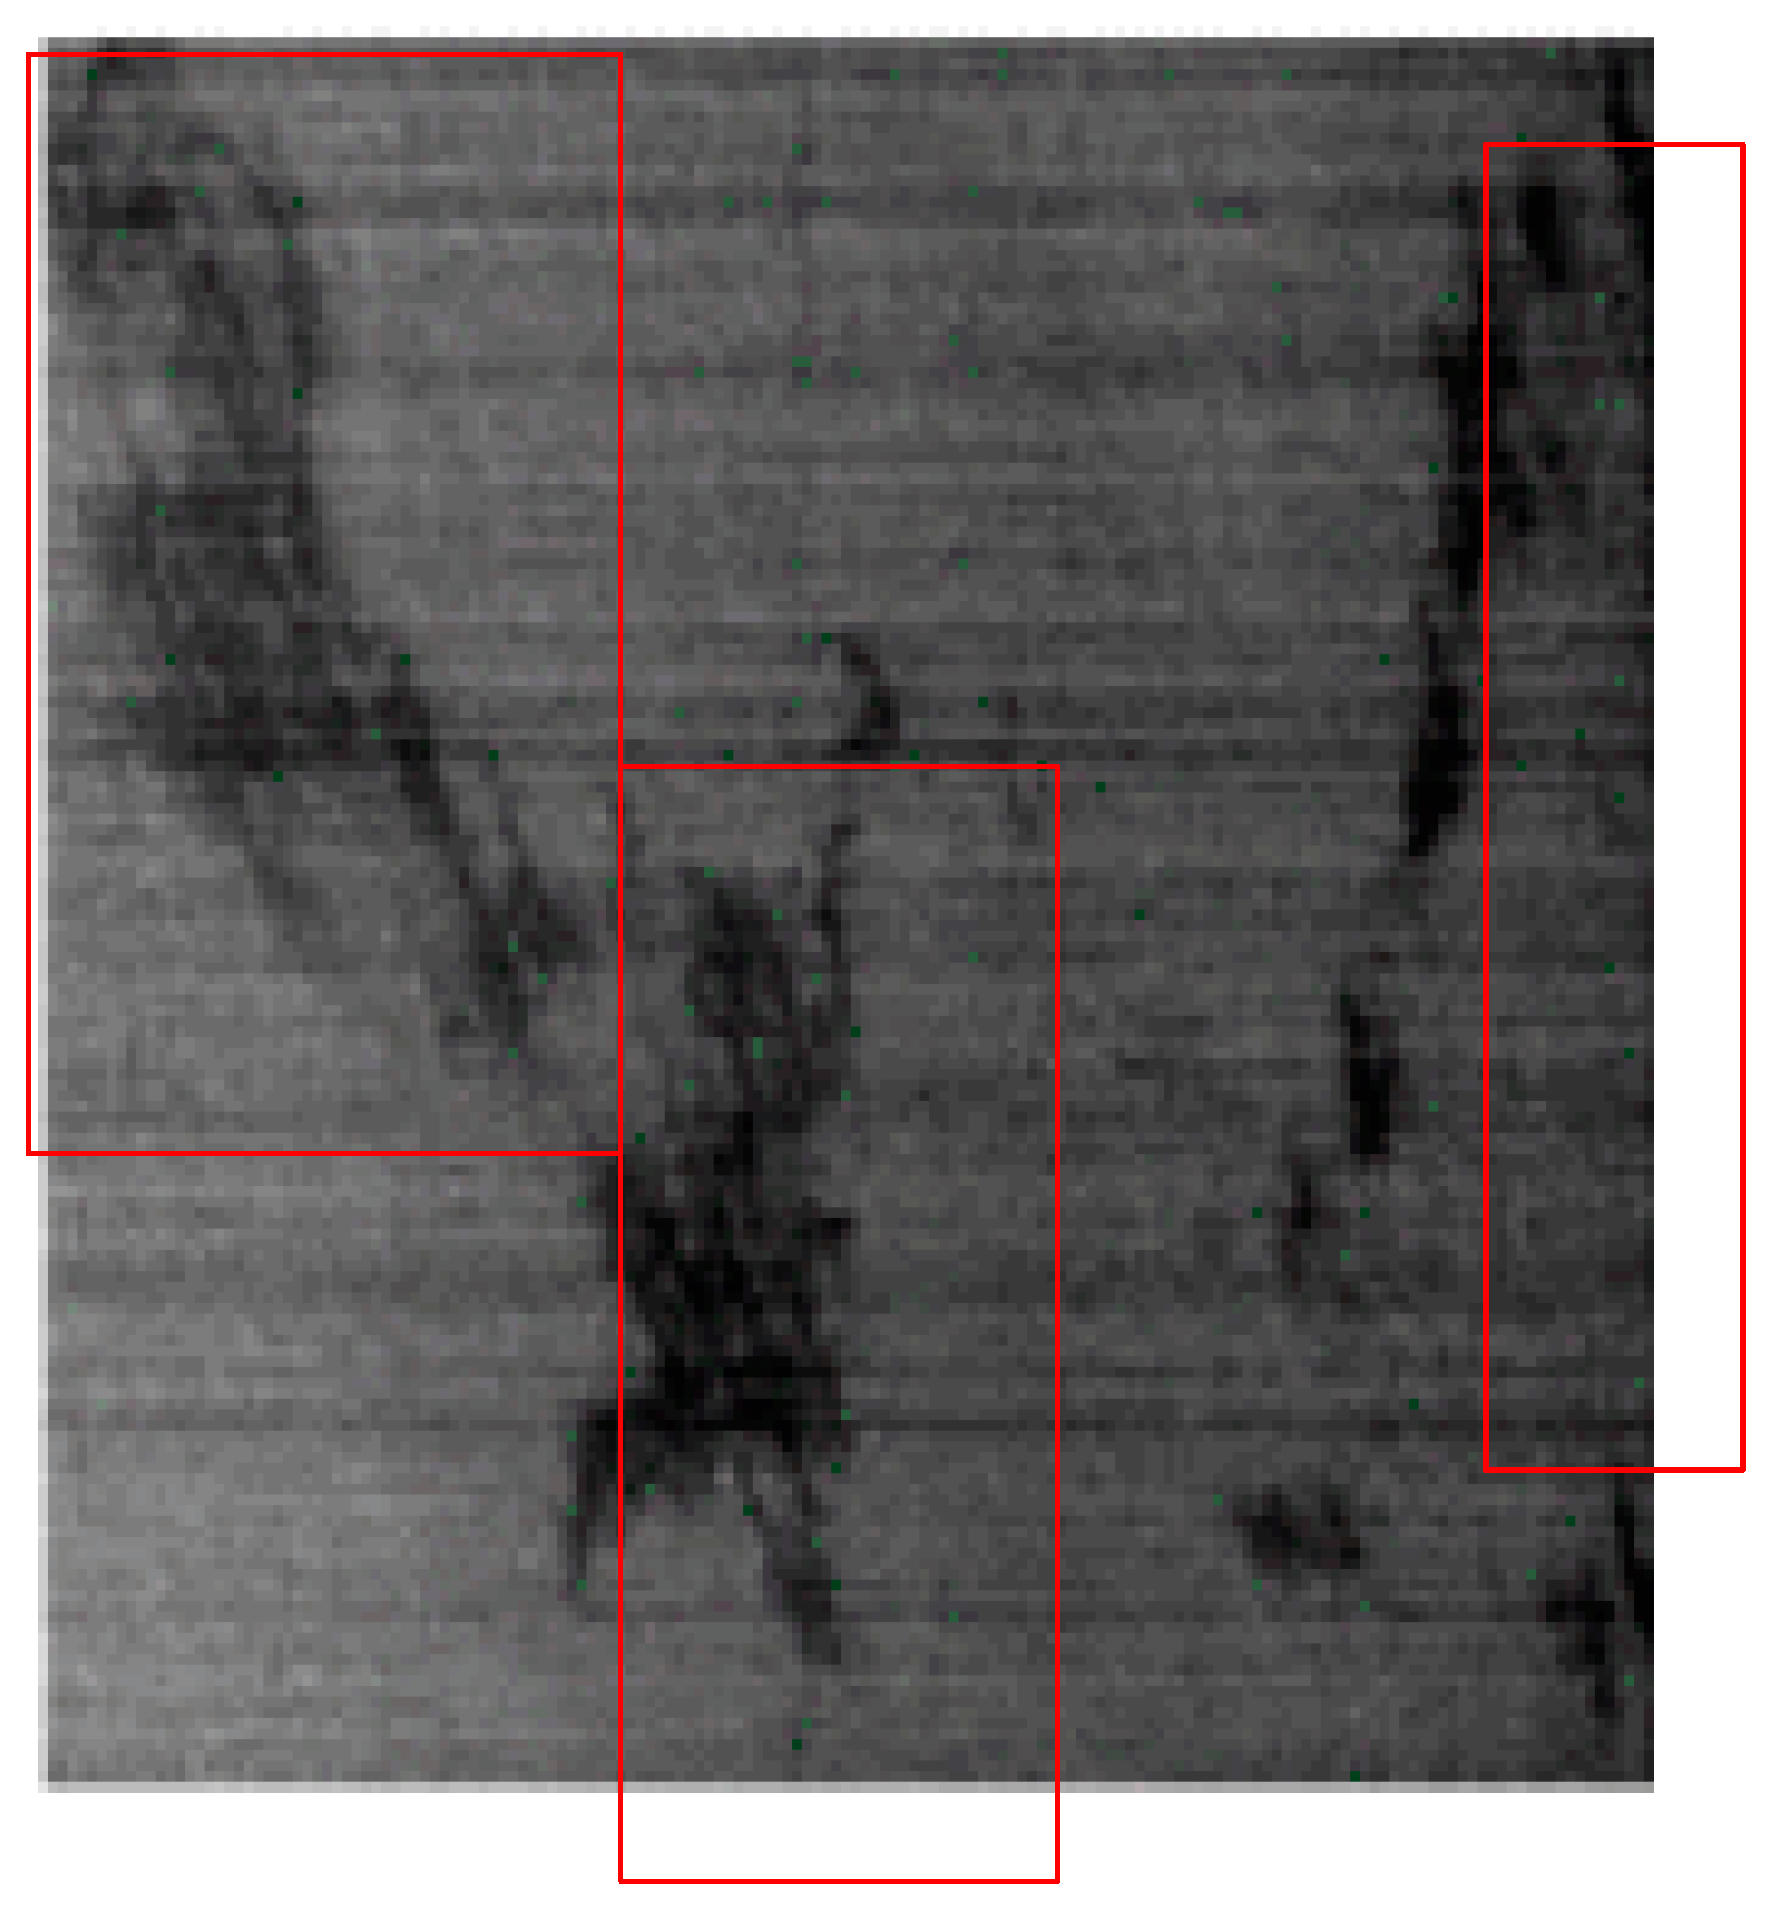
3.1.1. Dark Spot Detection

This stage of oil spill detection is fundamental because identifying the dark spot is essential for obtaining perfect feature extraction for classification [37]. Overtime, several methods have been adopted for the dark spot detection. Manual cropping of dark spot formation and the use of threshold-based techniques were applied in early segmentation studies wherein bimodal N * N pixels (in which N = 25 pixels) histogram was used [123,124,125]. Vyas et al. [126] adopted a two-step methodological approach for spot detection and extraction using global threshold for pre-processing and pixel sampling. Adaptive thresholding using a multiscale pyramid technique and a clustering step to distinguish oil from its surrounding has also been implemented [127,128]. Hysteresis thresholding developed by Canny [129] was used by the authors of Kanaa et al. [130,131,132,133,134]. Chen et al. [135] used energy minimization function for the preservation of oil spill segmentation edges which gives a better performance than DRLSE method in the exact and precise oil spill region contours. Chen et al. [136] used a pixel segmentation technique for oil spill detection and classical classification method for the elimination of false positives in detection. Alattas [122] used Gamma distribution based on minimum cross-entropy thresholding as a dichotomous class pixel (also known as bi-modal images) for the detection of oil spill. Other studies (e.g., [135]) have used a combination of threshold algorithm and canny algorithm in the identification of oil spill region edge with a considerable high edge detection accuracy. Mira et al. [137] used two mathematical segmentation approaches (graph technique and j-image representation technique). They established that the use of graph segmentation has high performance in the detection of oil spills but produces high percentage of false positive detection. Notably, the J-image segmentation generated a lower percentage of false positives despite its overall lower performance.
Although improvements in this area have been recorded, the absence of proper procedure on how to acquire the features is a major setback. Other detection methods include the use of statistical approaches such as wavelets [138] and QinetiQ’s algorithm [139]. Li et al. [140] used statistical K-distribution method with the aid of histogram values to identify areas of oil spill from dark spots in a satellite imagery. Despite the successes of these methods in identifying and preserving oil slick shape for feature extraction, their applications are limited when oil slicks are thin. In addition, these approaches are unable to distinguish between dark spots that are not oil slick since all dark spots are classified as oil slick.

3.1.2. Dark Spot Feature Extraction

The segmentation of the dark spots is followed by feature generation through the quantification of relevant attributes such as shape, size, backscattering, attenuation, and texture boundary [141]. Extracted features are grouped into three forms: geometric/shape feature, backscatter feature, and gradient feature [30,141]. Presently, there is no consensus on feature extraction procedures, evinced by the diverse feature selection approaches adopted by different researchers. Table 2 presents the commonly used feature extraction parameters. Some studies have used two features [142], and other studies adopted between eleven to fourteen features [46,48,143]. While Liu et al. [44] indicated that five features give better accuracy for oil spill and lookalikes selection, Topouzelis et al. [99] indicated that ten features are more appropriate. In addition, some other studies have successfully adopted the extraction of similar attributes for the classification of oil spills and lookalikes [141,144,145,146].
Since Dark spots in satellite imageries could be oil slicks or other elements (e.g., sea grass, internal waves, low wind speed area, and other biogenic films), image classification is essential to distinguish oil spills from these other elements (lookalikes). Over time, several models have been developed to accomplish this. Solberg et al. [130] used a statistical model to automatically distinguish oil spill and lookalikes from an adaptive threshold dark spot segmentation of dual polarization ENVISAT SAR satellite imagery, which established the reliability of using statistical methods for automatic oil spill detection. Utilizing polarization and geometric and texture feature fusion, Wu et al. [147] classified oil spill and lookalikes from dark objects observed on a polarized SAR image with a 95% accuracy. In addition, fuzzy logic was adopted by Liu et al. [44] using eight features selected through ANOVA for the classification of oil spill and lookalikes. An accuracy of 80.9% was obtained. The relatively lower accuracy is attributable to the small number of SAR images used twenty-six (26). Karathanassi et al. [148] used an object-based oriented fuzzy classification method on thirteen features to discriminate oil spill from lookalikes, obtaining an accuracy of 99.5% for the correct classification of oil spill and 98.8% for the classification of lookalikes. All affirmation methods are based on statistical approaches. However, comparison of the methods’ accuracies is challenging due to variations in the number and type of data used. Other studies (e.g., [149,150,151,152]) have also adopted object-based image analysis (OBIA) models in combination with fuzzy logic for marine oil spill detection with reported high accuracy. It is noteworthy that the increasing popularity of digitalization tools such as novel machine learning and deep learning algorithms in the fourth industrial revolution (IR 4.0) offer potentials to automate oil spill detection and enhance classification processes with higher accuracy.

3.2. Machine Learning for Oil Spill Detection

Machine learning is one of the major digitalization tools in the fourth industrial revolution [153]. It is an aspect of Artificial Intelligence (AI) that evolved from pattern recognition and computational learning theory, depending on pattern and inference for execution of tasks [154,155]. Machine learning models are increasingly being used to solve a wide range of complex problems, including oil spill detection on satellite images for prompt decision making [115]. Different from the image segmentation statistical method, ML models utilize traditional classifiers following a five-step approach compromising of: (1) dark spot identification; (2) feature extraction; (3) feature selection; (4) model training and validation; and (5) feature classification. To date, various traditional machine learning models have been applied for the detection of oil spills from satellite imageries. These models are used for pertinent tasks such as segmentation, feature extraction and classification of oil spill and lookalike. This include Support Vector Machine, Decision Tree, Random Forest, Boosted Decision Tree, and Artificial Neural Network.

3.2.1. Support Vector Machine (SVM)

SVM model was developed to identify a linear class boundary. It is underpinned by the structural risk minimization principle and Vapnik–Chervonenkis dimension principle that enables it to achieve a high accuracy with limited samples. The SVM model has been applied to oil spill detection due to its capability to handle high data dimensionality. For instance, Li and Zhang [156] used SVM model for the detection of oil slick and lookalike, indicating that lower sample data size enables higher accuracy when compared with ANN-based method. The study further concluded that utilizing a large sample data size reduces model training time. In addition, Mera et al. [115] used five different feature selection machine learning algorithms to detect oil spill from a satellite imagery, with the SVM’s recursive feature elimination achieving the highest accuracy and Cohen’s kappa coefficient of 87.1% and 74.06%, respectively. Wan and Cheng [157] implemented a three-step approach of pre-processing, dark spot detection, and analysis with the aid of object based classification and SVM model to classify oil spill dark spots in a SAR image and analyze the changes in the slick on the sea. Analysis of these studies indicate that the SVM can achieve optimum classification despite using limited training samples.

3.2.2. Decision Tree (DT)

Decision Tree (DT) is a classification and regression model that comprises several trees. Decision trees are efficient in multi-feature extraction and robust de-noising and removing outliers without overfitting [158]. DT has been well adopted for marine oil spill detection. This is evident in the study of Topouzelis and Psyllos [159] which indicated the ability of decision forest model to identify elements with higher importance in the detection of oil slick and lookalike, attaining a cumulative accuracy of 84.4% from nine features out of the twenty-five features assessed. Equally, Li et al. [160] used DT on spectroscopic images for oil spill detection with a high accuracy. In addition, Singha et al. [158] reported a higher automated accuracy for decision tree in the selection of features and classification of oil spill and lookalike. The higher accuracy of decision tree is based on its repeated division of a set of training data into smaller subsets based on the principle of testing one or more of the feature values. Unlike other machine learning models, DT does not depend on the assumption of a variable specific distribution or the independence of the variables from one another.

3.2.3. Random Forest (RF)

Random forest (RF) is an ensemble classification algorithm that uses a majority vote to predict classes based on the partition of data from multiple decision tree. This model was developed by Breiman [161]. RF generates multiple trees through the random sub-setting of a predefined number of variables to subdivide each node of the decision trees, and by bagging. RF algorithm for marine oil spill detection is based on multi-feature technique which has been proven to have a robust performance to noise and outliers without overfitting [162,163]. Tong et al. [164] implemented a three-step approach for the detection and classification of marine oil spill and lookalike, accomplishing an accuracy of 92.99% and 82.25% for Radarsat-2 and UAVSAR polarimetric SAR datasets, respectively. However, a higher percentage of the available studies on RF focus more on oil spill vegetation classification with limitation in marine oil spill detection [96,97,153].

3.2.4. Artificial Neural Network (ANN)

ANN is mostly applied to marine oil spill detection due to the ability to represent each morphological feature with input neurons, resulting in a reduced false positive detection. Ma et al. [165] applied ANN’s five step process for the classification of features after using principal component analysis (PCA) for dimensional reduction. Singha et al. [141] and Singha et al. [146] combined two different ANN models, using the first for the segmentation of oil spill spot and the second for classification of oil slick and lookalikes. While the former recorded 95.2% accuracy, the latter achieved 91.6% accuracy for oil spill detection. The variation in accuracies was due to the difference in the number of training images used. Following the three-stage oil spill detection approach, Topouzelis et al. [99] used two neural networks and ten feature selection attributes for the detection of dark spots and classification of oil spill and lookalikes. Accuracies of 94% for dark spot formation and 89% for oil spill and lookalikes classification were obtained. Insufficient data were a major limitation in this study. Comparative analyses of different methods have been documented in other studies. Karathanassi et al. [148] used neural network (NN) and a statistical correlation-based algorithm, Mahalanobis classification, for the classification of oil spill and lookalikes. The NN algorithm outperformed the statistical algorithm with a difference of 35%, 20%, 15%, and 30% for lookalikes, oil spill, land area, and sea surface, respectively. It is noteworthy that the above-mentioned studies have used either optical or microwave satellite sensor imageries. There is limited documentation of the use of other types of imageries, particularly airborne like Unmannered Ariel vehicle (UAV) and Sideward Looking Airborne Radar (SLAR) for oil spill detection.
Further advances in computer vision techniques have enabled the use of other AI algorithms (e.g., deep learning), which are more effective in individual class discrimination. Deep learning has begun to gain traction in oil spill detection tasks because of its higher accuracy and superior automation features.

3.3. Deep Learning

Deep learning models are based on the use of neural networks that contain units with certain activities and parameters [166,167]. The deep learning neuron comprises of several layers that transfer the input data to outputs with high level of progressive learning. Deep learning models include both supervised (e.g., convolutional neural network and recurrent neural network) and unsupervised algorithms (e.g., autoencoder and deep belief network) [168]. The recent application of deep learning models for marine oil spill detection is due to its increased success in various image classification tasks. Considering the complexity of oil spill and lookalike classification, DCNN is becoming widely used because of its ability to extract suitable features for classification. Similarly, Object Based Image Analysis (OBIA) is becoming more prominent since it can overcome the limitations of the pixel-based image classification models that assume that individual pixels are independent and are thus processed without any spatial consideration of surrounding pixels. Compared to pixel-based image classifiers, OBIA assumes spatial neighborhood property among pixels of an image. It combines different spectral, textual, and spatial features for the image classification [169]. However, determining the optimal scale for image segmentation and the suitable feature for classification remains a major challenge.
The multi-layer neuron present in the deep learning algorithm enables it to describe complex functions with higher accuracy than the shallow networks in the traditional machine learning models. Thus far, different deep learning models have been applied to marine oil spill detection with varying accuracy outcomes. For example, the gradient boosting model, which is embedded with a multi-layer network, enhances oil spill detection accuracy, especially in SAR images [150,170]. Other deep network models have been applied to oil spill detection using polarimetric synthetic aperture radar images. Chen et al. [171] used two deep learning algorithms (stacked auto encoder and deep belief network) to identify oil spills and categorize them into minerals, emulsion, and biological slicks during the Norwegian oil-on-water program of 2011. The study revealed that deep network has higher accuracy for oil spill detection than traditional ANN and SVM, irrespective of limited availability of data. Similarly, using unsupervised classification, Gallego et al. [113] utilized deep neural auto encoders to identify the oil spill point on a SLAR satellite image acquired from the placing of 2 SAR antennas on an aircraft and achieved 100% overall accuracy and an harmonic mean (F1) of 93.01% at the pixel level. Jiao et al. [5] used deep convolutional neural network on a non-satellite image from unmanned aerial vehicle (UAV) for the detection of oil spill and Otsu algorithm for the filtering of the detection, resulting in 57.2% reduction in cost in comparison to using traditional manual inspection.
In addition, there are attempts to use object detection techniques for processing images [5]. This dates to the introduction of the adaboost algorithm as a boosted cascade method for simple feature detection in 2001 [172]. Although the method has been applied to different areas such as agriculture, transportation, and medicine [173,174,175,176], its application to oil spill detection is limited. In one of the few documented studies, Krestenitis et al. [45] used semantic segmentation detection and deep convolutional neural network models for oil spill detection in a SAR imagery, concluding that the DeepLabv2 model out-performed other models in accomplishing the task. However, more recent instance segmentation models (e.g., Mask R-CNN) and semantic segmentation models (e.g., YOLO V2, V3, and V4) have performed better in object recognition, detection, and segmentation [173,174,175,176].

4. Oil Spill Trajectory Modeling for Vulnerability Assessment

Classification of vulnerable oil spill zones is important to improve decision support systems, reduce oil spill cleaning cost, and identify environmentally sensitive areas [15]. In the past, many oil spill vulnerability assessments were based on worst case, average and survey-based approaches. Castanedo et al. [177] considered socioeconomic, physical, and biological features of the Cantabrain coast to classify the area’s vulnerability to oil spill impacts into high, moderate, and low vulnerability levels. Depellegrin and Pereira [178] adopted similar procedures to classify vulnerable locations of 237km of the shoreline using physical and biological properties of the area, with consideration of shoreline sinuosity, orientation, and wave exposure. Azevedo et al. [179] developed a web-based GIS for the prediction of oil spill vulnerability based on the physical, socioeconomical, biological, and global vulnerability index of the intertidal area of the water body. Major shortcomings of these approaches are the absence of definite risk level of the coastal environment to different types of spills, such as pipeline leakage and spill intensity, and the possibility of uncertainty and subjectivity in experts’ opinions.
To overcome the limitations of the worst case, average and survey-based methods, and improve the accuracy and spontaneity of the prediction of oil spill movement pattern as a means of identifying vulnerable coastal and marine ecosystems, several mathematical models have been developed to date [180,181]. These models form the basis for developing computer programs such as ADIOS 2, Oil Spill Contingency and Response (OSCAR), General National Oceanic and Atmospheric Administration Operational Oil Modeling Environment (GNOME), Medslik-II, and Spill Impact Model Application Package (SIMAP) [182,183]. More recently, the semi-implicit cross-scale hydro-science integrated system model (SCHISM) which uses water surface elevations and currents for oil spill trajectory modeling has been developed [183]. After the occurrence of oil spill, several physical and chemical transformation processes take place. The models are structured upon Lagrangian methods that use random walk and random flight method [184,185] for surface and sub-surface modeling of these processes, including oil transportation. Trajectory models are either in 2D on the ocean surface which depends on the prevailing environmental factors such as wind and wave or 3D which enable the sub-surface weathering with the capability of ocean current. While the spilled oil is treated as a series of Lagrangian elements that are tracked based on time and space when the oil is at the surface, it is treated as droplets that are tracked based on size when the oil is at the subsurface [185]. Oil spill spread, evaporation, entrainment, emulsification, dissolution, biodegradation, photo-oxidation, and sedimentation are the principal trajectory processes that interact with each other for vulnerability assessment [15,185].
The hydrodynamics, metrological, environmental features, and oil properties play important roles in modeling the trajectory. The spreading equation for predicting oil spill trajectory was first developed by Fay [186], forming the basis of most spreading algorithms such as the thick slick of [187,188]. Other models, as documented by Elliott et al. [189], Johansen [190], and Galt and Overstreet [191], have been developed since then. These are based on the principle that the spread of oil depends on the oil viscosity and the breaking energy. The Fay [186] algorithm is appropriate for immediate oil spill spread modeling. Analytical models such as ADIOS and the recent OILTRANS model of Berry et al. [192] have also been used at various times.
Integration of the existing oil spill trajectory models have been found in the study of Gług and Wąs [182] that combined Lagrangian discrete particle algorithm with cellular automata for the modeling of oil spill spread using ocean wind, current, heterogeneous state of space and instability of time as conditioning parameters. With the aid of MEDSLIK II, Yu et al. [193] developed an oil spill risk assessment map of Chinese Bohai Sea using locally available oceanographic data for the prediction of oil spill trajectory which indicated five different coastal zones that were highly vulnerable to oil spill. Similarly, Chiu et al. [183] predicted oil spill trajectories using SCHISM and X-band Radar and established that schism model can perform accurate oil spill trajectory simulation using wind, surface elevations and ocean surface current as metrological parameters. Amir-Heidari and Raie [194] used wind (advection) and ocean current as metrological parameters for the creation of an active and passive decision support system (DSS) based on consequence modeling of GNOME for response planning for accidental oil spills in the Persian Gulf. To address the peculiarities of regions where snow and ice cover large sections of the water body, Nordam et al. [51] adapted the OSCAR model by using sea-ice velocity to predict the trajectory of oil spill. An evaluation of the three case studies revealed that the use of sea-ice velocity, ocean wind, wave, and current is not always feasible for predicting trajectory, especially when there is constraint by land. In addition, the quantification of oil droplet size distribution has not really been accurate in the present studies thereby affecting the oil spill transportation prediction. The applicability of these models is limited when the vertical and horizontal spreading are different, spatially, and temporally. In addition, modeling the dispersion above the edge of linear features like coastlines where the oil spill is concentrated at a point remains problematic. Further, not all the models enable integration with Geographical Information System (GIS) framework to aid better visual output and geo-statistical analysis.

5. Discussion

5.1. Remote Sensing for Oil Spill Detection

This study has described different remote sensing techniques used for oil spill monitoring. The remote sensing applications were divided into optical airborne, optical remote sensing satellite, microwave airborne, and microwave satellite. The distinctive difference between the optical and microwave remote sensing is the ability of the latter to work under any weather condition and period of the day as well as its larger area coverage, which the former is unable to do since it depends on sunlight; it is affected by cloud cover; and does not cover as much area as the microwave [195,196]. Analysis of the remote sensing techniques revealed that both optical and microwave sensors are affected by lookalike elements with similar visual representation as oil spills, leading to false positive detection of oil spills [15]. However, optical remote sensing imageries contain diagnostic spectral information that indicate the spectral band and value, distinguishing oil spills [197,198]. In addition, the use of airborne remote sensing is less efficient compared to the satellite observations in terms of area coverage. Thus, the airborne are more suitable and efficient for rapid identification of source, type, thickness, and extent of oil spills [199]. There are differences in the appearance of oil spills across the different sensors. For example, the presence of oil spill in optical airborne remote sensing at the visible area indicates high surface reflectance difference. It also indicates the absence of absorption with reflectance ranging from 480 to 570 nm. The appearance of oil in IR airborne sensors is based on the difference in oil and water that creates a distinct thermal infrared region due to the lower emissivity from oil than water. The appearance of oil in a NIR is based on the fundamental C-H stretching and bending vibration bands while UV depends on the sun reflection value to indicate the presence of oil slick. In the optical satellite, oil slick is identified on 500-m resolution blue and green bands at 469–555-nm and short-wave bands at 1240 and 2130 nm of MODIS. For the multispectral satellite, oil spills are detected by identifying the difference in the thermal contrast between the emissivity of the oil slick and the background. Oil spills are seen as dark spots in both the airborne and satellite microwave sensors which are measured through surface reflectance. However, the absence of specialized sensors for marine oil spill detection is evident in the literature, which indicates the need for further research in this area.
In determining the suitability of sensors for oil spill monitoring, the following criteria should be considered: resolution, cost, data collection and processing duration, spatial resolution, operational period, altitude, and weather dependency. As ascertained by the authors of Topouzelis [37,200], the width window of a typical oil spill does not exceed 10 m, which indicates that a sensor with 10-m resolution is more appropriate for oil spill detection. Table 3 characterizes different sensors for oil spill applications in literature. Analysis of Table 3 shows that operational ability at any time of the day is a crucial factor in the selection of sensors. While other sensors are affected by weather and cloud cover, radar sensors can be used at any time and under any weather condition [28,37,42,44,113,122,133]. This supports real time capturing of oil spill data and enables early decision making before the weathering process commences. Due to the urgent need for oil spill data to support rapid mapping and cleanup activities [37,54,200], and considering the higher spatial and temporal resolutions of airborne remote sensing in comparison to satellite remote sensing, optical airborne sensors are still being adopted [25,31,36,55,76,201]. However, for a synoptic capture of large areas of oil spills, satellite sensors are more appropriate [25,37,60].

5.2. Automatic Oil Spill Detection

The automated detection of marine oil spill has been conducted on different remote sensing images. For optimal performance, existing models (statistical, machine learning, and deep learning) are mostly applied on SAR microwave imageries more than other types of remote sensing imageries because of its high resolution and easy depiction of dark spots. The variation in the sizes of oil spills compound the selection of an appropriate oil spill detection method. However, over time, as illustrated in Table 4, there has been steady development in the detection methods starting with the segmentation process which comprises of three stages: darks spot identification, feature extraction, and feature classification [30,45]. For the dark spot detection, statistical methods that include hysteresis thresholding, adaptive thresholding, wavelets, and QinetiQ’s algorithm are mostly used although limited by the inability to discriminate between oil spill and lookalikes because they both form dark spots. Further, these methods are unable to detect oil spills when the slick is thin. The extraction of features after dark spot identification is based on the geometric, backscattering, and gradient features. The absence of clear guidelines and inconsistencies in the number of features extracted affects the outcome. While some studies have used just two features, some have used fourteen [46,48,143]. Some other studies have used similar extracted geometric, backscatter, and gradient features [141,144,145,146] and have been able to classify between oil spill and lookalikes based on that.
Feature classification, the last stage in the automatic oil spill detection process entails discriminating lookalikes from oil spill based on the extracted features. Statistical threshold method and fuzzy logic have been implemented for this purpose. A major drawback in current approaches is the inconsistency in the type and number of data which makes it difficult to undertake accuracy assessments of these methods. Digitalization, one of the megatrends in the fourth industrial revolution, has facilitated the use of machine learning models for oil spill management via the following techniques: dark spot identification; feature extraction and section; model training; model validation and feature classification. To date, different traditional machine learning models (e.g., SVM, DT, RF, and ANN) have been applied to marine oil spill detection with high accuracy. Out of the multitude, SVM and ANN have been mostly applied. SVM produces higher accuracy despite using fewer data while ANN can treat each oil spill feature as an independent neuron, reducing false positive error. Thus far, the different machine learning models applied have been limited to feed forward image classification. Support for the end-to-end trainable framework is generally lacking, limiting the accuracy of the models.
More recently, deep learning models, buoyed by advances in computer vision are being utilized for instance and semantic segmentation due to their strong feature extraction and autonomous learning capability. Unlike machine learning models, deep learning algorithms possess a high number of hidden layers that enable better data abstraction, prediction, generalization, and transferability. Evaluation of various deep learning architecture including deep belief network, auto-encoder, convolutional neural network (CNN), and recurrent neural network (RNN) indicates that CNN has a higher accuracy. This is because it supports both pixel-level classification and detects object categories independently. CNN’s higher accuracy in object recognition, detection, and segmentation as well as its ability to localize the instance under consideration which enables oil spill detection in complex scenarios (e.g., where oil spill and lookalike overlay each other) have been highlighted [169,202]. The CNN could be applied for both semantic and instance segmentation. However, limitations exist in the application of instance segmentation algorithms to oil spill detection. Nonetheless, recent studies suggest that considering other features in the sea (e.g., ship, water body, and land area) can enhance detection accuracy [169,202].

5.3. Oil Spill Trajectory Modeling for Vulnerability Assessment

The traditional use of experts’ opinion affects oil spill vulnerability assessment because it lacks real-time predictive capabilities and it has limited applicability to different scenarios of oil spill incidents such as pipeline leakage, vandalism, and tank wash. The transformation processes that occur immediately after oil spill is also not considered, limiting the accuracy of the method. Modern mathematical models, which are based on Lagrangian methods, enable both surface and sub-surface oil spill tracking and accurate and real-time prediction of oil spill movement for area vulnerability assessment.
Despite the successes of these mathematical models, accurate quantification of the size of oil droplets remains a challenge, limiting the accurate calculation of the uncertainty. Current models also use wind speed and ocean current without taking into consideration the tidal current exemplified by the rise and fall of sea level which affects the modeling of the oil spill trajectory. Further, the current models prevent oil spill dispersal above the edge of costal lines and frameworks for robust integration of trajectory models with geospatial technologies for better output, visualization, and geo-statistical analysis are still lacking. However, GNOME and MEDSLIK are exceptions since they work well with GIS for better visualization of oil spill pattern.

6. Lessons Learned

6.1. Remote Sensing

(1)
Remote sensing for oil spill monitoring and management can be divided into two broad categories (optical (active) and microwave (passive) sensors), which can be further classified into four subcategories: (optical and passive airborne; optical and passive satellites).
(2)
Appearance and thickness of oil spills in optical airborne remote sensing vary across sensors. For example, in the visible sensors, the presence of oil spill indicates high surface reflectance difference. In addition, absence of absorption in the visible region indicates the presence of oil on water with reflectance ranging 480–570 nm.
(3)
The appearance of oil in IN passive airborne sensor is based on the difference in oil and water that makes a distinct thermal infrared region due to the lower emissivity from oil than water.
(4)
The appearance of oil in a NIR is based on the fundamental C-H stretching and bending vibration bands while UV depends on the sun’s reflection value to indicate the presence of oil slick.
(5)
Improvements in the visible sensor hyperspectral remote sensing led to the emergence of AVIRIS and AISA, which have high signal to noise ratio and good spectral resolution.
(6)
The quantity of oil slick in water can be best measured with airborne NIR.
(7)
Passive satellite sensors for oil spill monitoring are mostly affected by cloud cover, bad weather, absence of sunlight, and limited ability to differentiate between lookalikes and oil slick.
(8)
Presently, active sensors are the most widely used remote sensing technology for oil spill detection due to its ability to operate under any weather condition. They detect oil spills from wind speeds within 2–10 ms−1. However, false positive appearance of lookalikes affects the reliability of these sensors.
(9)
To date, there is no single best remote sensing technique that can unambiguously and reliably detect oil spills without lookalikes.
(10)
Developing remote sensing technology that can detect oil spills without the appearance of lookalikes is a vital field of research that is worth exploring.

6.2. Automatic Oil Spill Detection

(1)
The deficiency of remote sensing technology in distinguishing oil slick from lookalikes necessitated the development of automatic detection models.
(2)
Image segmentation algorithms based on thresholding and machine learning/deep learning models are the major approaches for automatic detection of marine oil spills.
(3)
SVM and ANN machine learning models have been mostly applied for the classification of marine oil spill and lookalike.
(4)
The limitation of machine learning models to feed forward image classification with no support for the end-to-end trainable framework affects its accuracy.
(5)
Deep learning models’ strong feature extraction and autonomous learning capability enhance their performance and facilitates high accuracy in marine oil spill detection.
(6)
The application of instance segmentation models for rapid detection, recognition, and segmentation of oil spills from lookalikes are still limited.
(7)
The inclusion of other elements in the sea enhances model detection accuracy
(8)
The absence of verified database of oil spill images affects automated detection accuracy since present modeling approaches depend on either data augmentation or transfer learning on existing models to enhance the accuracy.

6.3. Oil Spill Trajectory Modeling for Vulnerability Assessment

(1)
The need for accurate and timely mapping of vulnerable locations inspired the development of different oil spill trajectory models.
(2)
Oil spill trajectory models use Lagrangian particles to indicate oil spill in water surfaces and sub-surfaces.
(3)
The available oil spill trajectory models comprise a series of algorithms which make it impossible for individual fate of Lagrangian particles to be processed independently.
(4)
Existing models do not support the quantification of uncertainty in the vulnerability prediction
(5)
Some of the existing models are limited in their integration with GIS, which hinders visualization of oil spill movement.
Although other reviews have been done on remote sensing for marine oil spill monitoring and management, such as those by Brekke and Solberg [30], Fingas and Brown [76], Robbe et al. [207], most only consider satellite remote sensing without assessing airborne remote sensing. Fingas and Brown [25], Topouzelis [37], Jha et al. [58], Leifer et al. [60], Fingas and Brown [208], and Fingas and Brown [209] reviewed both airborne and satellite sensors for marine oil spill monitoring but the present review presents a more comprehensive comparison of both sensors. In addition, existing studies do not include an updated review of various automated techniques, particularly emerging Artificial intelligence approaches for discriminating, detecting, and classifying oil spills from false positive elements in remote sensing imageries, which is implemented in this study. Further, reviews of trajectory modeling, which is an important component of oil spill decision support systems, are limited. Based on the foregoing, this is the first attempt in the literature, in the authors’ estimation, that undertakes a comprehensive review covering the broad spectrum of marine oil spill detection using remote sensing, machine learning, and deep learning, in addition to oil spill trajectory modeling and vulnerability assessment in the same study for marine oil spill management.

7. Conclusions and Future Outlook

Oil spills significantly affect the marine and terrestrial ecosystems and the rapid identification of spilled oil as well as accurate prediction of its trajectory to identify vulnerable locations is essential for disaster risk reduction and management. This review evaluates various remote sensing technologies that are used for the identification of oil spills in the marine environment. To understand the limitations of remote sensing devices, particularly the false positive visual representation of lookalikes in the imageries, several automatic oil detection models, including segmentation thresholding models, machine learning classifiers, and other emerging computer vision models, are systematically reviewed. The paper also provides a comprehensive overview of the opportunities and challenges of RS, ML, and DL in oil spill management in addition to trajectory prediction models. Based on the review, it is concluded that there is no single best remote sensing technique for unambiguous and accurate detection of oil spills, although active sensors are more widely used due to their ability to operate under any weather condition. However, the sensors are also affected by the false positive appearance of lookalikes. Different image segmentation techniques have been developed to overcome the limitations of remote sensing by automating the oil spill detection process, with SVM and ANN being the most utilized machine learning algorithms for classifying oil spills and lookalikes. Nonetheless, the accuracy of machine learning is limited by their restriction to feed forward image classification with no support for the end-to-end trainable framework. In contrast, deep learning models’ strong feature extraction and autonomous learning features enhance their accuracy in marine oil spill detection. For trajectory modeling, the vulnerability prediction models use tracking Lagrangian elements to predict surface and sub-surface oil spills. However, the models are unable to independently process individual fate of Lagrangian particles (oil splots). In addition, the available models do not support the quantification of uncertainty in the oil spill environment and effective integration with GIS platforms for accurate visualization of oil spill movement remains a challenge.
In the future, it is necessary to advance research to gain deeper insights on RS technology that can accurately detect and discriminate oil spills from lookalikes and improve oil spill classification leveraging machine learning and deep learning algorithms. In addition, the use of image fusion methods that can enable multi sensor images to provide better information to aid oil spill detection should be explored. Existing models are usually developed for unique applications to a particle image type. This prevents the general application of such models to different types of remote sensing images. With the aid of deep learning algorithms, it is imperative to develop a universal model that can detect marine oil spills from different remote sensing images. In addition, developing a repository for the storage of oil spill remote sensing images is essential to reduce the dependence of oil spill detection models on transfer learning which is currently necessitated by the limited availability of oil spill remote sensing images. Research to address uncertainties in Lagrangian models through the integration of oil droplet quantification with tidal current, taking into consideration spatiotemporal differences, should be pursued. It is equally important to develop a framework to enable better integration of trajectory models with GIS. Further, specialized sensors for oil spill pollution monitoring are essential to address the limitations of false positive identification, weather effects, and limited area coverage, in addition to the incorporation of emerging geospatial computer vision models for the detection of oil spill. To overcome limitations of existing generalized oil spill trajectory models, it is imperative to develop specialized models that are applicable to diverse oil spill scenarios, taking into consideration the peculiarity of each situation. The envisioned trajectory model should be compatible and easily integrated with geospatial models for optimal performance.

Author Contributions

Conceptualization, A.-L.B. and S.T.Y.; methodology, S.T.Y.; formal analysis, S.T.Y.; investigation, S.T.Y.; resources, A.-L.B.; data curation, S.T.Y.; writing—original draft preparation, S.T.Y.; writing—review and editing, A.-L.B. and S.T.Y.; visualization, S.T.Y.; supervision, A.-L.B.; project administration, A.-L.B.; and funding acquisition, A.-L.B. All authors have read and agreed to the published version of the manuscript.

Funding

This research was funded by the University Teknologi PETRONAS (UTP) Y-UTP Research Project Grant (015LC0-003).

Acknowledgments

The authors acknowledge the financial support from the University Teknologi PETRONAS (UTP) Y-UTP Research Project Grant (015LC0-003) and the valuable comments of the anonymous reviewers.

Conflicts of Interest

The authors declare no conflict of interest.

References

  1. Chen, J.; Zhang, W.; Wan, Z.; Li, S.; Huang, T.; Fei, Y. Oil spills from global tankers: Status review and future governance. J. Clean. Prod. 2019, 227, 20–32. [Google Scholar] [CrossRef]
  2. Yekeen, S.; Balogun, A.; Aina, Y. Early Warning Systems and Geospatial Tools: Managing Disasters for Urban Sustainability. In Sustainable Cities and Communities; Leal Filho, W., Azul, A.M., Brandli, L., Özuyar, P.G., Wall, T., Eds.; Springer International Publishing: Cham, Switzerland, 2019; pp. 1–13. [Google Scholar]
  3. Michel, J.; Fingas, M. Oil spills: Causes, consequences, prevention, and countermeasures. In Fossil Fuels; Research Planning, Inc.: Columbia, SC, USA, 2015. [Google Scholar]
  4. Pelta, R.; Carmon, N.; Ben-Dor, E. A machine learning approach to detect crude oil contamination in a real scenario using hyperspectral remote sensing. Int. J. Appl. Earth Obs. Geoinformation 2019, 82, 101901. [Google Scholar] [CrossRef]
  5. Jiao, Z.; Jia, G.; Cai, Y. A new approach to oil spill detection that combines deep learning with unmanned aerial vehicles. Comput. Ind. Eng. 2019, 135, 1300–1311. [Google Scholar] [CrossRef]
  6. Lynch, L.E. Statement by Attorney General Loretta E. Lynch on the Agreement in Principle with BP to Settle Civil Claims for the Deepwater Horizon Oil Spill. 31 March 2015. Available online: https://www.justice.gov/opa/pr/statement-attorney-general-loretta-e-lynch-agreement-principle-bp-settle-civil-claims (accessed on 29 November 2019).
  7. Bishop, R.C.; Boyle, K.J.; Carson, R.T.; Chapman, D.; Hanemann, W.M.; Kanninen, B.; Kopp, R.J.; Krosnick, J.A.; List, J.; Meade, N. Putting a value on injuries to natural assets: The BP oil spill. J. Sci. 2017, 356, 253–254. [Google Scholar] [CrossRef] [Green Version]
  8. Smith, L.C.; Smith, M.; Ashcroft, P. Analysis of environmental and economic damages from British Petroleum’s Deepwater Horizon oil spill. Alban. Law Rev. 2011, 4, 563–585. [Google Scholar] [CrossRef] [Green Version]
  9. Murphy, D.; Gemmell, B.; Vaccari, L.; Li, C.; Bacosa, H.P.; Evans, M.; Gemmell, C.; Harvey, T.; Jalali, M.; Niepa, T.H. An in-depth survey of the oil spill literature since 1968: Long term trends and changes since Deepwater Horizon. Mar. Pollut. Bull. 2016, 113, 371–379. [Google Scholar] [CrossRef]
  10. Cornwall, W. Deepwater Horizon: After the oil. Science 2015, 348, 22–29. [Google Scholar] [CrossRef]
  11. Nwachukwu, A.N.; Osuagwu, J.C. Effects of Oil Spillage on Groundwater Quality In Nigeria. Am. J. Eng. Res. AJER 2014, 3, 271–274. [Google Scholar]
  12. Mignucci-Giannoni, A. Assessment and rehabilitation of wildlife affected by an oil spill in Puerto Rico. Environ. Pollut. 1999, 104, 323–333. [Google Scholar] [CrossRef]
  13. Fingas, M. The Basics of Oil Spill Cleanup; CRC Press: Boca Raton, FL, USA, 2012. [Google Scholar]
  14. National Research Council. Oil in the Sea III: Inputs, Fates, and Effects; National Academies Press (US): Washington, DC, USA, 2003. [Google Scholar]
  15. Li, P.; Cai, Q.; Lin, W.; Chen, B.; Zhang, B. Offshore oil spill response practices and emerging challenges. Mar. Pollut. Bull. 2016, 110, 6–27. [Google Scholar] [CrossRef]
  16. Westerholm, D.A.; Rauch, S.D., III; Kennedy, D.M.; Basta, D.J. Deepwater Horizon oil spill: Final programmatic damage assessment and restoration plan and final programmatic environmental impact statement. In Natural Resources Science Plan 2011–2015; Springer: Berlin/Heidelberg, Germany, 2011. [Google Scholar]
  17. Piatt, J.F.; Lensink, C.J.; Butler, W.; Nysewander, D.R. Immediate Impact of the ‘Exxon Valdez’ Oil Spill on Marine Birds. Auk 1990, 107, 387–397. [Google Scholar] [CrossRef]
  18. Nevalainen, M.; Helle, I.; Vanhatalo, J.P. Estimating the acute impacts of Arctic marine oil spills using expert elicitation. Mar. Pollut. Bull. 2018, 131, 782–792. [Google Scholar] [CrossRef] [PubMed]
  19. Prabowo, A.R.; Bae, D.M. Environmental risk of maritime territory subjected to accidental phenomena: Correlation of oil spill and ship grounding in the Exxon Valdez’s case. Results Eng. 2019, 4, 100035. [Google Scholar] [CrossRef]
  20. Amir-Heidari, P.; Arneborg, L.; Lindgren, J.F.; Lindhe, A.; Rosén, L.; Raie, M.; Axell, L.; Hassellöv, I.-M. A state-of-the-art model for spatial and stochastic oil spill risk assessment: A case study of oil spill from a shipwreck. Environ. Int. 2019, 126, 309–320. [Google Scholar] [CrossRef] [PubMed]
  21. Grubesic, T.H.; Nelson, J.R.; Wei, R. A strategic planning approach for protecting environmentally sensitive coastlines from oil spills: Allocating response resources on a limited budget. Mar. Policy 2019, 108, 103549. [Google Scholar] [CrossRef]
  22. Fan, C.; Hsu, C.-J.; Lin, J.-Y.; Kuan, Y.-K.; Yang, C.-C.; Liu, J.-H.; Yeh, J.-H. Taiwan’s legal framework for marine pollution control and responses to marine oil spills and its implementation on T.S. Taipei cargo shipwreck salvage. Mar. Pollut. Bull. 2018, 136, 84–91. [Google Scholar] [CrossRef]
  23. Bullock, R.J.; Perkins, R.A.; Aggarwal, S. In-situ burning with chemical herders for Arctic oil spill response: Meta-analysis and review. Sci. Total. Environ. 2019, 675, 705–716. [Google Scholar] [CrossRef]
  24. Sardi, S.S.; Qurban, M.A.; Li, W.; Kadinjappalli, K.P.; Manikandan, K.P.; Hariri, M.M.; Al-Tawabini, B.S.; Khalil, A.B.; El-Askary, H. Assessment of areas environmentally sensitive to oil spills in the western Arabian Gulf, Saudi Arabia, for planning and undertaking an effective response. Mar. Pollut. Bull. 2019, 150, 110588. [Google Scholar] [CrossRef]
  25. Fingas, M.; Brown, C.E. Review of oil spill remote sensing. Mar. Pollut. Bull. 2014, 83, 9–23. [Google Scholar] [CrossRef] [Green Version]
  26. Ko, T.-J.; Hwang, J.-H.; Davis, D.; Shawkat, M.S.; Han, S.S.; Rodriguez, K.L.; Oh, K.H.; Lee, W.H.; Jung, Y. Superhydrophobic MoS2-based multifunctional sponge for recovery and detection of spilled oil. Curr. Appl. Phys. 2019, 20, 344–351. [Google Scholar] [CrossRef]
  27. Marghany, M. Chapter 13—Quantum immune fast spectral clustering for automatic detection of oil spill. In Synthetic Aperture Radar Imaging Mechanism for Oil Spills; Marghany, M., Ed.; Gulf Professional Publishing: Houston, TX, USA, 2020; pp. 243–267. [Google Scholar]
  28. Fan, J.; Zhang, F.; Zhao, D.; Wang, J. Oil Spill Monitoring Based on SAR Remote Sensing Imagery. Aquatic Proced. 2015, 3, 112–118. [Google Scholar] [CrossRef]
  29. Fustes, D.; Cantorna, D.; Dafonte, C.; Arcay, B.; Iglesias, A.; Manteiga, M. A cloud-integrated web platform for marine monitoring using GIS and remote sensing. Application to oil spill detection through SAR images. Futur. Gener. Comput. Syst. 2014, 34, 155–160. [Google Scholar] [CrossRef]
  30. Brekke, C.; Solberg, A.H. Oil spill detection by satellite remote sensing. Remote Sens. Environ. 2005, 95, 1–13. [Google Scholar] [CrossRef]
  31. Fingas, M.; Brown, C.E. Chapter 5—Oil Spill Remote Sensing. In Oil Spill Science and Technology, 2nd ed.; Fingas, M., Ed.; Gulf Professional Publishing: Boston, MA, USA, 2017; pp. 305–385. [Google Scholar]
  32. Ning, J.L.; Chen, Z.L.; Wang, C.Y.; Xie, W.J. Analysis of Marine Oil Spill Pollution Monitoring Based on Satellite Remote Sensing Technology. In IOP Conference Series: Materials Science and Engineering; IOP Publishing: Bristol, UK, 2018; Volume 392, p. 042045. [Google Scholar]
  33. Schott, J.R. Remote Sensing: The Image Chain Approach; Oxford University Press on Demand: Oxford, UK, 2007. [Google Scholar]
  34. Campbell, J.B.; Wynne, R.H. Introduction to Remote Sensing; Guilford Press: New York, NY, USA, 2011. [Google Scholar]
  35. Estes, J.; Senger, L. The multispectral concept as applied to marine oil spills. Remote Sens. Environ. 1971, 2, 141–163. [Google Scholar] [CrossRef]
  36. Fingas, M. Review of Oil Spill Remote Sensing Technologies; Spill Science: Edmonton, AB, Canada, 2015; p. 9. [Google Scholar]
  37. Topouzelis, K. Oil Spill Detection by SAR Images: Dark Formation Detection, Feature Extraction and Classification Algorithms. Sensors 2008, 8, 6642–6659. [Google Scholar] [CrossRef] [Green Version]
  38. Migliaccio, M.; Nunziata, F.; Gambardella, A. Polarimetric signature for oil spill observation. In Proceedings of the 2008 IEEE/OES US/EU-Baltic International Symposium, Tallinn, Estonia, 27–29 May 2008; pp. 1–5. [Google Scholar]
  39. Migliaccio, M.; Nunziata, F.; Buono, A. SAR Polarimetry for Effective Sea Oil Slick Observation. In Proceedings of the 2018 IEEE/OES Baltic International Symposium (BALTIC), Klaipeda, Lithuania, 12–15 June 2018; pp. 1–5. [Google Scholar]
  40. Solberg, A.H.S. Remote sensing of ocean oil-spill pollution. Proc. IEEE 2012, 100, 2931–2945. [Google Scholar] [CrossRef]
  41. Genovez, P.; Ebecken, N.F.F.; Freitas, C.; Bentz, C.; Freitas, R. Intelligent hybrid system for dark spot detection using SAR data. Expert Syst. Appl. 2017, 81, 384–397. [Google Scholar] [CrossRef]
  42. Cantorna, D.; Dafonte, C.; Iglesias, A.; Arcay, B. Oil spill segmentation in SAR images using convolutional neural networks. A comparative analysis with clustering and logistic regression algorithms. Appl. Soft Comput. 2019, 84, 105716. [Google Scholar] [CrossRef]
  43. Alpers, W.; Hühnerfuss, H. Radar signatures of oil films floating on the sea surface and the Marangoni effect. J. Geophys. Res. Space Phys. 1988, 93, 3642–3648. [Google Scholar] [CrossRef]
  44. PLiu, P.; Zhao, C.; Li, X.; He, M.; Pichel, W.G. Identification of ocean oil spills in SAR imagery based on fuzzy logic algorithm. Int. J.Remote Sens. 2010, 31, 4819–4833. [Google Scholar]
  45. Krestenitis, M.; Orfanidis, G.; Ioannidis, K.; Avgerinakis, K.; Vrochidis, S.; Kompatsiaris, I. Oil Spill Identification from Satellite Images Using Deep Neural Networks. Remote Sens. 2019, 11, 1762. [Google Scholar]
  46. Fiscella, B.; Giancaspro, A.; Nirchio, F.; Pavese, P.; Trivero, P. Oil spill detection using marine SAR images. Int. J. Remote Sens. 2000, 21, 3561–3566. [Google Scholar]
  47. Guo, Y.; Zhang, H.Z. Oil spill detection using synthetic aperture radar images and feature selection in shape space. Int. J. Appl. Earth Obs. Geoinformation 2014, 30, 146–157. [Google Scholar]
  48. Frate, F.D.; Petrocchi, A.; Lichtenegger, J.; Calabresi, G. Neural networks for oil spill detection using ERS-SAR data. IEEE Trans. Geosci. Remote Sens. 2000, 38, 2282–2287. [Google Scholar]
  49. Ping, W.; Guoqing, Y.; Yi, D.; Ying, L.; Wenjing, Y.; Yaoxin, S. Marine oil spill detection method research based on Envisat ASAR images. In Proceedings of the IET International Conference on Information Science and Control Engineering 2012 (ICISCE 2012), Shenzhen, China, 7–9 December 2012; pp. 1–4. [Google Scholar]
  50. Qiao, F.; Wang, G.; Yin, L.; Zeng, K.; Zhang, Y.; Zhang, M.; Xiao, B.; Jiang, S.; Chen, H.; Chen, G. Modelling oil trajectories and potentially contaminated areas from the Sanchi oil spill. Sci. Total Environ. 2019, 685, 856–866. [Google Scholar]
  51. Nordam, T.; Beegle-Krause, C.; Skancke, J.; Nepstad, R.; Reed, M. Improving oil spill trajectory modelling in the Arctic. Mar. Pollut. Bull. 2019, 140, 65–74. [Google Scholar] [PubMed]
  52. Bozkurtoğlu, Ş.N.E. Modeling oil spill trajectory in Bosphorus for contingency planning. Mar. Pollut. Bull. 2017, 123, 57–72. [Google Scholar]
  53. Abascal, A.J.; Sanchez, J.; Chiri, H.; Ferrer, M.I.; Cárdenas, M.; Gallego, A.; Castanedo, S.; Medina, R.; Alonso-Martirena, A.; Berx, B.; et al. Operational oil spill trajectory modelling using HF radar currents: A northwest European continental shelf case study. Mar. Pollut. Bull. 2017, 119, 336–350. [Google Scholar] [PubMed]
  54. Goodman, R. Overview and future trends in oil spill remote sensing. Spill Sci. Technol. Bull. 1994, 1, 11–21. [Google Scholar]
  55. Fingas, M. Oil Spill Science and Technology; Gulf Professional Publishing: Houston, TX, USA, 2016. [Google Scholar]
  56. Bulgarelli, B.; Djavidnia, S. On MODIS Retrieval of Oil Spill Spectral Properties in the Marine Environment. IEEE Geosci. Remote Sens. Lett. 2012, 9, 398–402. [Google Scholar]
  57. Andreou, C.; Karathanassi, V. Endmember detection in marine environment with oil spill event. In Proceedings of the Image and Signal Processing for Remote Sensing XVII, Prague, Czech Republic, 26 October 2011; International Society for Optics and Photonics: Bellingham, WA, USA, 2011; Volume 8180, p. 81800P. [Google Scholar]
  58. Jha, M.N.; Levy, J.; Gao, Y. Advances in Remote Sensing for Oil Spill Disaster Management: State-of-the-Art Sensors Technology for Oil Spill Surveillance. Sensors 2008, 8, 236–255. [Google Scholar] [CrossRef] [PubMed] [Green Version]
  59. Trieschmann, O.; Hunsaenger, T.; Tufte, L.; Barjenbruch, U. Data assimilation of an airborne multiple-remote-sensor system and of satellite images for the North Sea and Baltic Sea. Remote Sensing Ocean Sea Ice 2003, 5233, 51–61. [Google Scholar]
  60. Leifer, I.; Lehr, W.J.; Simecek-Beatty, D.; Bradley, E.; Clark, R.; Dennison, P.E.; Hu, Y.; Matheson, S.; Jones, C.E.; Holt, B.; et al. State of the art satellite and airborne marine oil spill remote sensing: Application to the BP Deepwater Horizon oil spill. Remote Sens. Environ. 2012, 124, 185–209. [Google Scholar] [CrossRef] [Green Version]
  61. Garcia-Pineda, O.; Staples, G.; Jones, C.E.; Hu, C.; Holt, B.; Kourafalou, V.; Graettinger, G.; Dipinto, L.; Ramirez, E.; Streett, D.; et al. Classification of oil spill by thicknesses using multiple remote sensors. Remote Sens. Environ. 2020, 236, 111421. [Google Scholar] [CrossRef]
  62. Zhong, Z.; You, F. Oil spill response planning with consideration of physicochemical evolution of the oil slick: A multiobjective optimization approach. Comput. Chem. Eng. 2011, 35, 1614–1630. (In English) [Google Scholar] [CrossRef]
  63. Lu, Y.; Li, X.; Tian, Q.; Zheng, G.; Sun, S.; Liu, Y.; Yang, Q. Progress in Marine Oil Spill Optical Remote Sensing: Detected Targets, Spectral Response Characteristics, and Theories. Mar. Geodesy 2013, 36, 334–346. [Google Scholar] [CrossRef]
  64. Shi, L.; Ivanov, A.Y.; He, M.; Zhao, C. Oil spill mapping in the western part of the East China Sea using synthetic aperture radar imagery. Int. J. Remote Sens. 2008, 29, 6315–6329. [Google Scholar] [CrossRef]
  65. Yin, Q.-Z.; Li, K.; Zhou, C.; Liu, C.; Chu, X.-M.; Zheng, J.; Yin, Q.-Z. Research on Oil Spill Monitoring Experiments Based on OFD-1 Oil Film Detector. In Proceedings of the 2012 2nd International Conference on Remote Sensing, Environment and Transportation Engineering; Institute of Electrical and Electronics Engineers (IEEE), Nanjing, China, 1–3 June 2012; pp. 1–4. [Google Scholar]
  66. Lu, Y.; Chen, J.; Bao, Y.; Han, W.; Li, X.; Tian, Q.; Zhang, X. Using HJ-1 satellite CCD data for remote sensing analysis and information extraction in oil spill scenarios. J. Sci. Sin. Inf. 2011, 41, 193–201. [Google Scholar]
  67. Wismann, V.; Gade, M.; Alpers, W.; Huhnerfuss, H. Radar signatures of marine mineral oil spills measured by an airborne multi-frequency radar. Int. J. Remote Sens. 1998, 19, 3607–3623. [Google Scholar] [CrossRef]
  68. Wang, D.; Gong, F.; Pan, D.; Hao, Z.; Zhu, Q. Introduction to the airborne marine surveillance platform and its application to water quality monitoring in China. Acta Oceanol. Sin. 2010, 29, 33–39. [Google Scholar] [CrossRef]
  69. Svejkovský, J.; Hess, M.; Muskat, J.; Nedwed, T.J.; McCall, J.; Garcia, O. Characterization of surface oil thickness distribution patterns observed during the Deepwater Horizon (MC-252) oil spill with aerial and satellite remote sensing. Mar. Pollut. Bull. 2016, 110, 162–176. [Google Scholar] [CrossRef]
  70. Boochs, F.; Kupfer, G.; Dockter, K.; Kühbauch, W. Shape of the red edge as vitality indicator for plants. Int. J. Remote Sens. 1990, 11, 1741–1753. [Google Scholar] [CrossRef]
  71. Lu, Y.; Sun, S.; Zhang, M.; Murch, B.; Hu, C. Refinement of the critical angle calculation for the contrast reversal of oil slicks under sunglint. J. Geophys. Res. Oceans 2016, 121, 148–161. [Google Scholar] [CrossRef] [Green Version]
  72. Sun, S.; Hu, C.; Feng, L.; Swayze, G.A.; Holmes, J.; Graettinger, G.; Macdonald, I.; Garcia, O.; Leifer, I. Oil slick morphology derived from AVIRIS measurements of the Deepwater Horizon oil spill: Implications for spatial resolution requirements of remote sensors. Mar. Pollut. Bull. 2016, 103, 276–285. [Google Scholar] [CrossRef] [PubMed]
  73. Sun, S.; Hu, C.; Garcia-Pineda, O.; Kourafalou, V.H.; Le Hénaff, M.; Androulidakis, Y. Remote sensing assessment of oil spills near a damaged platform in the Gulf of Mexico. Mar. Pollut. Bull. 2018, 136, 141–151. [Google Scholar] [CrossRef]
  74. Lu, Y.; Tian, Q.; Wang, X.; Zheng, G.; Li, X. Determining oil slick thickness using hyperspectral remote sensing in the Bohai Sea of China. Int. J. Digit. Earth 2013, 6, 76–93. [Google Scholar] [CrossRef]
  75. González, C.; Sánchez, S.; Paz, A.; Resano, J.; Mozos, D.; Plaza, A. Use of FPGA or GPU-based architectures for remotely sensed hyperspectral image processing. Integration 2013, 46, 89–103. [Google Scholar] [CrossRef]
  76. Fingas, M.; Brown, C.E. A Review of Oil Spill Remote Sensing. Sensors 2017, 18, 91. [Google Scholar] [CrossRef] [Green Version]
  77. Brown, C.W.; Lynch, P.F.; Ahmadjian, M. Applications of Infrared Spectroscopy in Petroleum Analysis and Oil Spill Identification. Appl. Spectrosc. Rev. 1975, 9, 223–248. [Google Scholar] [CrossRef]
  78. Fortes, F.; Ctvrtnícková, T.; Mateo, M.; Cabalín, L.; Nicolas, G.; Laserna, J. Spectrochemical study for the in situ detection of oil spill residues using laser-induced breakdown spectroscopy. Anal. Chim. Acta 2010, 683, 52–57. [Google Scholar] [CrossRef]
  79. Salisbury, J.W.; D’Aria, D.M.; Sabins, F.F. Thermal infrared remote sensing of crude oil slicks. Remote Sens. Environ. 1993, 45, 225–231. [Google Scholar]
  80. Pavlova, A.; Papazova, D. Oil-Spill Identification by Gas Chromatography-Mass Spectrometry. J. Chromatogr. Sci. 2003, 41, 271–273. [Google Scholar] [PubMed]
  81. Reddy, C.M.; Quinn, J.G. GC-MS analysis of total petroleum hydrocarbons and polycyclic aromatic hydrocarbons in seawater samples after the North Cape oil spill. Mar. Pollut. Bull. 1999, 38, 126–135. [Google Scholar]
  82. Khanna, S.; Santos, M.J.; Ustin, S.L.; Koltunov, A.; Kokaly, R.F.; Roberts, D.A. Detection of Salt Marsh Vegetation Stress and Recovery after the Deepwater Horizon Oil Spill in Barataria Bay, Gulf of Mexico Using AVIRIS Data. PLoS ONE 2013, 8, e78989. [Google Scholar]
  83. Jing, Y.; An, J.; Liu, Z. A Novel Edge Detection Algorithm Based on Global Minimization Active Contour Model for Oil Slick Infrared Aerial Image. IEEE Trans. Geosci. Remote Sens. 2011, 49, 2005–2013. [Google Scholar]
  84. Howari, F.M. Investigation of Hydrocarbon Pollution in the Vicinity of United Arab Emirates Coasts Using Visible and Near Infrared Remote Sensing Data. J. Coast. Res. 2004, 204, 1089–1095. [Google Scholar]
  85. Brown, C.W.; Alberts, J.J. Fiber Optic Sensor for Petroleum. Google Patents. U.S. Patent No 6,144,026, 20 November 2001. [Google Scholar]
  86. Lu, Y.; Tian, Q.; Wang, J.; Wang, X.; Qi, X. Experimental study on spectral responses of offshore oil slick. Sci. Bull. 2008, 53, 3937–3941. [Google Scholar]
  87. De Carolis, G.; Adamo, M.; Pasquariello, G. Thickness estimation of marine oil slicks with near-infrared MERIS and MODIS imagery: The Lebanon oil spill case study. In Proceedings of the 2012 IEEE International Geoscience and Remote Sensing Symposium, Munich, Germany, 22–27 July 2012; pp. 3002–3005. [Google Scholar]
  88. Clark, R.N.; Swayze, G.A.; Leifer, I.; Livo, K.E.; Lundeen, S.; Eastwood, M.; Green, R.O.; Kokaly, R.F.; Hoefen, T.; Sarture, C.; et al. A Method for Qualitative Mapping of Thick Oil Using Imaging Spectroscopy; United States Geological Survey: Reston, VA, USA, 2010.
  89. Clark, R.N. Spectroscopy of rocks and minerals, and principles of spectroscopy. Manual Remote Sens. 1999, 3, 2. [Google Scholar]
  90. Lammoglia, T.; de Souza Filho, C.R. Spectroscopic characterization of oils yielded from Brazilian offshore basins: Potential applications of remote sensing. Remote Sens. Environ. 2011, 115, 2525–2535. [Google Scholar]
  91. Hörig, B.; Kühn, F.; Oschütz, F.; Lehmann, F. HyMap hyperspectral remote sensing to detect hydrocarbons. Int. J. Remote Sens. 2001, 22, 1413–1422. [Google Scholar]
  92. Kühn, F.; Oppermann, K.; Hörig, B. Hydrocarbon Index—An algorithm for hyperspectral detection of hydrocarbons. Int. J. Remote Sens. 2004, 25, 2467–2473. [Google Scholar] [CrossRef]
  93. Alpers, W. Remote sensing of oil spills. In Maritime Disaster Management Symposium; Citeseer: New York, NY, USA, 2002; pp. 19–23. [Google Scholar]
  94. Ivanov, A.Y.; Zatyagalova, V.V. A GIS approach to mapping oil spills in a marine environment. Int. J. Remote Sens. 2008, 29, 6297–6313. [Google Scholar] [CrossRef]
  95. Grüner, K.; Reuter, R.; Smid, H. A new sensor system for airborne measurements of maritime pollution and of hydrographic parameters. GeoJournal 1991, 24, 103–117. [Google Scholar] [CrossRef]
  96. Ozigis, M.S.; Kaduk, J.D.; Jarvis, C.H. Mapping terrestrial oil spill impact using machine learning random forest and Landsat 8 OLI imagery: A case site within the Niger Delta region of Nigeria. Environ. Sci. Pollut. Res. 2019, 26, 3621–3635. [Google Scholar] [CrossRef] [PubMed] [Green Version]
  97. Ozigis, M.S.; Kaduk, J.D.; Jarvis, C.H.; da Conceição Bispo, P.; Balzter, H. Detection of oil pollution impacts on vegetation using multifrequency SAR, multispectral images with fuzzy forest and random forest methods. Environ. Pollut. 2019, 256, 113360. [Google Scholar] [CrossRef] [PubMed]
  98. Balogun, A.L.; Yekeen, S.T.; Pradhan, B.; Althuwaynee, O.F. Spatio-Temporal Analysis of Oil Spill Impact and Recovery Pattern of Coastal Vegetation and Wetland Using Multispectral Satellite Landsat 8-OLI Imagery and Machine Learning Models. Remote Sens. 2020, 12, 1225. [Google Scholar] [CrossRef] [Green Version]
  99. Topouzelis, K.; Karathanassi, V.; Pavlakis, P.; Rokos, D. Detection and discrimination between oil spills and look-alike phenomena through neural networks. ISPRS J. Photogr. Remote Sens. 2007, 62, 264–270. [Google Scholar] [CrossRef]
  100. Hu, C.; Müller-Karger, F.E.; Taylor, C.; Myhre, D.; Murch, B.; Odriozola, A.L.; Godoy, G. MODIS detects oil spills in Lake Maracaibo, Venezuela. Eos Trans. Am. Geophys. Union 2003, 84, 313–319. [Google Scholar]
  101. Hu, C.; Li, X.; Pichel, W.G.; Muller-Karger, F.E. Detection of natural oil slicks in the NW Gulf of Mexico using MODIS imagery. Geophys. Res. Lett. 2009, 36, L01604. [Google Scholar] [CrossRef]
  102. Srivastava, H.; Singh, T.P. Assessment and development of algorithms to detection of oil spills using MODIS data. J. Ind. Soc. Remote Sens. 2010, 38, 161–167. [Google Scholar] [CrossRef]
  103. Casciello, D.; Lacava, T.; Pergola, N.; Tramutoli, V. Robust Satellite Techniques for oil spill detection and monitoring using AVHRR thermal infrared bands. Int. J. Remote Sens. 2011, 32, 4107–4129. [Google Scholar] [CrossRef]
  104. Lo, C.P. Applied Remote Sensing; Burnt Mill; Longman: Harlow, UK; New York, NY, USA, 1986. [Google Scholar]
  105. Su, W.; Su, F.; Zhou, C.; Du, Y. Optical Satellite Remote Sensing Capabilities Analysis of the Marine Oil Spill. J. GeoInf. Sci. 2012, 14, 523–530. [Google Scholar] [CrossRef]
  106. Nie, W.; Zhang, X. Detecting Marine Oil Spill Pollution Based on Borda Count Method of Ocean Water Surface Image. In Proceedings of the 2012 2nd International Conference on Remote Sensing, Environment and Transportation Engineering, Nanjing, China, 1–3 June 2012; pp. 1–4. [Google Scholar]
  107. Castro Gomez, M.G. Joint Use of Sentinel-1 and Sentinel-2 for Land Cover Classification: A Machine Learning Approach. Master’s Thesis, Lund University, Lund, Switzerland, 2017. [Google Scholar]
  108. Nezhad, M.M.; Groppi, D.; Laneve, G.; Marzialetti, P.; Piras, G. Oil spill detection analyzing “Sentinel 2” satellite images: A Persian Gulf case study. In Proceedings of the 3rd World Congress on Civil, Structural, and Environmental Engineering, Budapest, Hungary, 8–10 April 2018; pp. 1–8. [Google Scholar]
  109. Kolokoussis, P.; Karathanassi, V. Oil Spill Detection and Mapping Using Sentinel 2 Imagery. J. Mar. Sci. Eng. 2018, 6, 4. [Google Scholar] [CrossRef] [Green Version]
  110. Setiani, P.; Ramdani, F. Oil spill mapping using multi-sensor Sentinel data in Balikpapan Bay, Indonesia. In Proceedings of the 2018 4th International Symposium on Geoinformatics (ISyG), Malang, Indonesia, 10–12 November 2018; pp. 1–4. [Google Scholar]
  111. Espedal, H. Detection of oil spill and natural film in the marine environment by spaceborne SAR. In Proceedings of the IEEE 1999 International Geoscience and Remote Sensing Symposium. IGARSS’99 (Cat. No.99CH36293), Hamburg, Germany, 28 June–2 July 1999; Volume 3, pp. 1478–1480. [Google Scholar]
  112. Kostianoy, A.G.; Lebedev, S.A.; Litovchenko, K.T.; Stanichny, S.V.; Pichuzhkina, O.E. Satellite remote sensing of oil spill pollution in the southeastern Baltic Sea. Gayana Concepción 2004, 68, 327–2332. [Google Scholar] [CrossRef]
  113. Gallego, A.-J.; Gil, P.; Pertusa, A.; Fisher, R.B. Segmentation of Oil Spills on Side-Looking Airborne Radar Imagery with Autoencoders. Sensors 2018, 18, 797. [Google Scholar] [CrossRef] [Green Version]
  114. Chang, L.; Tang, Z.; Chang, S.; Chang, Y.-L. A region-based GLRT detection of oil spills in SAR images. Pattern Recognit. Lett. 2008, 29, 1915–1923. [Google Scholar] [CrossRef]
  115. Mera, D.; Bolón-Canedo, V.; Cotos, J.M.; Alonso-Betanzos, A. On the use of feature selection to improve the detection of sea oil spills in SAR images. Comput. Geosci. 2017, 100, 166–178. [Google Scholar] [CrossRef]
  116. Yu, F.; Sun, W.; Li, J.; Zhao, Y.; Zhang, Y.; Chen, G. An improved Otsu method for oil spill detection from SAR images. Oceanologia 2017, 59, 311–317. [Google Scholar] [CrossRef]
  117. Chaturvedi, S.K.; Banerjee, S.; Lele, S. An assessment of oil spill detection using Sentinel 1 SAR-C images. J. Ocean Eng. Sci. 2020, 5, 116–135. [Google Scholar] [CrossRef]
  118. Xu, L.; Shafiee, M.J.; Wong, A.; Clausi, D.A. Fully Connected Continuous Conditional Random Field with Stochastic Cliques for Dark-Spot Detection In SAR Imagery. IEEE J. Sel. Top. Appl. Earth Obs. Remote Sens. 2016, 9, 2882–2890. [Google Scholar] [CrossRef]
  119. Ma, X.L.; Jiao, L.C. Sar image segmentation based on watershed and spectral clustering. J. Infared. Millim. Waves 2008, 6, 013. [Google Scholar]
  120. Gao, G.; Liu, L.; Zhao, L.; Shi, G.; Kuang, G. An Adaptive and Fast CFAR Algorithm Based on Automatic Censoring for Target Detection in High-Resolution SAR Images. IEEE Trans. Geosci. Remote Sens. 2008, 47, 1685–1697. [Google Scholar] [CrossRef]
  121. Gonzalez, R.C.; Woods, R.E. Digital Image Processing; Prentice Hall: Upper Saddle River, NJ, USA, 2002. [Google Scholar]
  122. Alattas, R. Oil spill detection in SAR images using minimum cross-entropy thresholding. In Proceedings of the 2014 7th International Congress on Image and Signal Processing, Dalian, China, 14–16 October 2014; pp. 709–713. [Google Scholar]
  123. Skøelv, Å.; Wahl, T. Oil Spill Detection Using Satellite Based SAR; Phase 1B competition report; Norwegian Defence Research Establishment: Kjeller, Norway, 1993. [Google Scholar]
  124. Vachon, P.W.; Thomas, S.J.; Cranton, J.A.; Bjerkelund, C.; Dobson, F.W.; Olsen, R.B. Monitoring the coastal zone with the RADARSAT satellite. In Oceanology International; Brighton, UK, 10–13 March 1998; Volume 98, pp. 29–38. [Google Scholar]
  125. Manore, M.J.; Vachon, P.W.; Bjerkelund, C.; Edel, H.R.; Ramsay, B. Operational use of Radarsat SAR in the coastal zone—The Canadian experience. Inf. Sustain. 1998, 1998, 115–118. [Google Scholar]
  126. Vyas, G.; Bhan, A.; Gupta, D. Detection of oil spills using feature extraction and threshold based segmentation techniques. In Proceedings of the 2015 2nd International Conference on Signal Processing and Integrated Networks (SPIN), Noida, India, 19–20 February 2015. [Google Scholar]
  127. Solberg, A.S.; Storvik, G.; Solberg, R.; Volden, E. Automatic detection of oil spills in ERS SAR images. IEEE Trans. Geosci. Remote Sens. 1999, 37, 1916–1924. [Google Scholar] [CrossRef] [Green Version]
  128. Solberg, A.H.; Dokken, S.T.; Solberg, R. Automatic detection of oil spills in Envisat, Radarsat and ERS SAR images. In Proceedings of the IGARSS 2003, 2003 IEEE International Geoscience and Remote Sensing Symposium, Proceedings (IEEE Cat. No. 03CH37477), Toulouse, France, 21–25 July 2003; Volume 4, pp. 2747–2749. [Google Scholar]
  129. Canny, J. A computational approach to edge detection. IEEE Trans. Pattern Anal. Mach. Intel. 1986, 6, 679–698. [Google Scholar] [CrossRef]
  130. Kanaa, T.; Tonye, E.; Mercier, G.; Onana, V.; Ngono, J.; Frison, P.-L.; Rudant, J.-P.; Garello, R. Detection of oil slick signatures in SAR images by fusion of hysteresis thresholding responses. In Proceedings of the IGARSS 2003, 2003 IEEE International Geoscience and Remote Sensing Symposium, Proceedings (IEEE Cat. No. 03CH37477), Toulouse, France, 21–25 July 2003; Volume 4, pp. 2750–2752. [Google Scholar]
  131. Pelizzari, S.; Bioucas-Dias, J. Oil spill segmentation of SAR images via graph cuts. In Proceedings of the 2007 IEEE International Geoscience and Remote Sensing Symposium, Barcelona, Spain, 23–28 July 2007; pp. 1318–1321. [Google Scholar]
  132. Huang, B.; Li, H.; Huang, X. A level set method for oil slick segmentation in SAR images. Remote Sens. 2005, 26, 1145–1156. [Google Scholar] [CrossRef]
  133. Hu, G.; Xiao, X. Edge detection of oil spill using SAR image. In Proceedings of the 2013 Cross Strait Quad-Regional Radio Science and Wireless Technology Conference, Chengdu, China, 21–25 July 2013; pp. 466–469. [Google Scholar]
  134. Vyas, K.; Shah, P.; Patel, U.; Zaveri, T. Oil spill detection from SAR image data for remote monitoring of marine pollution using light weight imageJ implementation. In Proceedings of the 2015 5th Nirma University International Conference on Engineering (NUiCONE), Ahmedabad, India, 26–28 November 2015; pp. 1–6. [Google Scholar]
  135. Chen, F.; Yu, X.; Jiang, X.; Ren, P. Level sets with self-guided filtering for marine oil spill segmentation. In Proceedings of the 2017 IEEE International Geoscience and Remote Sensing Symposium (IGARSS), Fort Worth, TX, USA, 23–28 July 2017; pp. 1772–1775. [Google Scholar]
  136. Chen, Z.; Wang, C.; Teng, X.; Cao, L.; & Li, J. Oil spill detection based on a superpixel segmentation method for SAR image. In Proceedings of the 2014 IEEE Geoscience and Remote Sensing Symposium, Quebec City, QC, Canada, 13–18 July 2014; pp. 1725–1728. [Google Scholar]
  137. Mira, D.; Gil, P.; Alacid, B.; Torres, F. Oil Spill Detection using Segmentation based Approaches. In Proceedings of the 6th International Conference on Pattern Recognition Applications and Methods (ICPRAM 2017), Porto, Portugal, 24–26 February 2017; pp. 442–447. [Google Scholar]
  138. Wu, S.Y.; Liu, A.K. Towards an automated ocean feature detection, extraction and classification scheme for SAR imagery. Int. J. Remote Sens. 2003, 24, 935–951. [Google Scholar] [CrossRef]
  139. Barni, M.; Betti, M.; Mecocci, A. A fuzzy approach to oil spill detection an SAR images. In Proceedings of the 1995 International Geoscience and Remote Sensing Symposium, IGARSS’95. Quantitative Remote Sensing for Science and Applications, Firenze, Italy, 10–14 July 1995; Volume 1, pp. 157–159. [Google Scholar]
  140. Li, H.Z.; Wang, C.; Zhang, H.; Wu, F.; Li, J. Oil slick spot detection using K-distribution model of the sea background. In Proceedings of the 2009 IEEE International Geoscience and Remote Sensing Symposium, Cape Town, South Africa, 12–17 July 2009; Volume 4, pp. IV-470–IV-473. [Google Scholar]
  141. Singha, S.; Bellerby, T.J.; Trieschmann, O. Satellite Oil Spill Detection Using Artificial Neural Networks. IEEE J. Sel. Top. Appl. Earth Obs. Remote Sens. 2013, 6, 2355–2363. [Google Scholar] [CrossRef]
  142. Gasull, A.; Fàbregas, X.; Jiménez, J.; Marqués, F.; Moreno, V.; Herrero, M.A. Oil spills detection in SAR images using mathematical morphology. In Proceedings of the 2002 11th European Signal Processing Conference, Toulouse, France, 3–6 September 2002; pp. 1–4. [Google Scholar]
  143. Solberg, A.H.; Brekke, C.; Husoy, P.O. Oil Spill Detection in Radarsat and Envisat SAR Images. IEEE Trans. Geosci. Remote Sens. 2007, 45, 746–755. [Google Scholar] [CrossRef]
  144. Montali, A.; Giacinto, G.; Migliaccio, M.; Gambardella, A. Supervised pattern classification techniques for oil spill classification in SAR images: Preliminary results. In Proceedings of the SEASAR2006 Workshop, ESAESRIN, Frascati, Italy, 24–26 January 2006; pp. 23–26. [Google Scholar]
  145. Migliaccio, M.; Tranfaglia, M. Oil spill observation by SAR: A review. In Proceedings of the 2004 USA-Baltic Internation Symposium, Klaipeda, Lithuania, 15–17 June 2004; pp. 1–6. [Google Scholar]
  146. Singha, S.; Bellerby, T.J.; Trieschmann, O. Detection and classification of oil spill and look-alike spots from SAR imagery using an Artificial Neural Network. In Proceedings of the 2012 IEEE International Geoscience and Remote Sensing Symposium, Munich, Germany, 22–27 July 2012; pp. 5630–5633. [Google Scholar]
  147. Wu, D.; Guo, H.; An, J. Research on Multi-Feature Fusion for Discriminating Oil Spill and Look-Alike Spots. In Proceedings of the 2017 4th International Conference on Information Science and Control Engineering (ICISCE), Changsha, China, 21–23 July 2017; pp. 607–610. [Google Scholar]
  148. Karathanassi, V.; Topouzelis, K.; Pavlakis, P.; Rokos, D. An object-oriented methodology to detect oil spills. Int. J. Remote Sens. 2006, 27, 5235–5251. [Google Scholar] [CrossRef]
  149. Maianti, P.; Rusmini, M.; Tortini, R.; Via, G.D.; Frassy, F.; Marchesi, A.; Nodari, F.R.; Gianinetto, M. Monitoring large oil slick dynamics with moderate resolution multispectral satellite data. Nat. Hazards 2014, 73, 473–492. [Google Scholar] [CrossRef]
  150. Nieto-Hidalgo, M.; Gallego, A.-J.; Gil, P.; Pertusa, A. Two-Stage Convolutional Neural Network for Ship and Spill Detection Using SLAR Images. IEEE Trans. Geosci. Remote Sens. 2018, 56, 5217–5230. [Google Scholar] [CrossRef] [Green Version]
  151. Akar, S.; Süzen, M.L.; Kaymakçi, N. Detection and object-based classification of offshore oil slicks using ENVISAT-ASAR images. Environ. Monit. Assess. 2011, 183, 409–423. [Google Scholar] [CrossRef] [PubMed]
  152. Su, T.F.; Li, H.Y.; Liu, T.X. Sea Oil Spill Detection Method Using SAR Imagery Combined with Object-Based Image Analysis and Fuzzy Logic. Adv. Mater. Res. 2014, 1065, 3192–3200. [Google Scholar] [CrossRef]
  153. Balogun, A.-L.; Marks, D.; Sharma, R.; Shekhar, H.; Balmes, C.; Maheng, D.; Arshad, A.; Salehi, P. Assessing the Potentials of Digitalization as a Tool for Climate Change Adaptation and Sustainable Development in Urban Centres. Sustain. Cities Soc. 2020, 53, 101888. [Google Scholar] [CrossRef]
  154. Yalcin, A.; Reis, S.; Aydinoglu, A.; Yomralioglu, T. A GIS-based comparative study of frequency ratio, analytical hierarchy process, bivariate statistics and logistics regression methods for landslide susceptibility mapping in Trabzon, NE Turkey. Catena 2011, 85, 274–287. [Google Scholar] [CrossRef]
  155. Marwan, M.; Ali, K.; Ouahmane, H. Security Enhancement in Healthcare Cloud using Machine Learning. Procedia Comput. Sci. 2018, 127, 388–397. [Google Scholar] [CrossRef]
  156. Li, Y.; Zhang, Y. Synthetic aperture radar oil spills detection based on morphological characteristics. Geospatial Inf. Sci. 2014, 17, 8–16. [Google Scholar] [CrossRef]
  157. Wan, J.; Cheng, Y. Remote sensing monitoring of Gulf of Mexico oil spill using ENVISAT ASAR images. In Proceedings of the 2013 21st International Conference on Geoinformatics; Institute of Electrical and Electronics Engineers (IEEE), Kaifeng, China, 20–22 June 2013; pp. 1–5. [Google Scholar]
  158. Singha, S.; Vespe, M.; Trieschmann, O. Automatic Synthetic Aperture Radar based oil spill detection and performance estimation via a semi-automatic operational service benchmark. Mar. Pollut. Bull. 2013, 73, 199–209. [Google Scholar] [CrossRef]
  159. Topouzelis, K.; Psyllos, A. Oil spill feature selection and classification using decision tree forest on SAR image data. ISPRS J. Photogramm. Remote Sens. 2012, 68, 135–143. [Google Scholar] [CrossRef]
  160. Li, Q.; Lu, L.; Zhang, B.; Tong, Q. Oil Slope Index: An algorithm for crude oil spill detection with imaging spectroscopy. In Proceedings of the 2012 IEEE 2nd International Workshop on Earth Observation and Remote Sensing Applications, Shanghai, China, 8–11 June 2012; pp. 46–49. [Google Scholar]
  161. Breiman, L. Random Forests. Mach. Learn. 2001, 45, 5–32. [Google Scholar] [CrossRef] [Green Version]
  162. Mahdianpari, M.; Salehi, B.; Mohammadimanesh, F.; Motagh, M. Random forest wetland classification using ALOS-2 L-band, RADARSAT-2 C-band, and TerraSAR-X imagery. ISPRS J. Photogramm. Remote Sens. 2017, 130, 13–31. [Google Scholar] [CrossRef]
  163. Wang, W.; Yang, X.; Li, X.; Chen, K.; Liu, G.; Li, Z.; Gade, M. A Fully Polarimetric SAR Imagery Classification Scheme for Mud and Sand Flats in Intertidal Zones. IEEE Trans. Geosci. Remote Sens. 2016, 55, 1–9. [Google Scholar] [CrossRef]
  164. Tong, S.; Liu, X.; Chen, Q.-H.; Zhang, Z.; Xie, G. Multi-Feature Based Ocean Oil Spill Detection for Polarimetric SAR Data Using Random Forest and the Self-Similarity Parameter. Remote Sens. 2019, 11, 451. [Google Scholar] [CrossRef] [Green Version]
  165. Ma, Y.; Zeng, K.; Zhao, C.; Ding, X.; He, M. Feature selection and classification of oil spills in SAR image based on statistics and artificial neural network. In Proceedings of the 2014 IEEE Geoscience and Remote Sensing Symposium, Quebec City, QC, Canada, 13–18 July 2014; pp. 569–571. [Google Scholar]
  166. Litjens, G.; Kooi, T.; Bejnordi, B.E.; Setio, A.A.A.; Ciompi, F.; Ghafoorian, M.; Van Der Laak, J.A.; Van Ginneken, B.; Sánchez, C.I. A survey on deep learning in medical image analysis. Med. Image Anal. 2017, 42, 60–88. [Google Scholar] [CrossRef] [PubMed] [Green Version]
  167. Schmidhuber, J. Deep learning in neural networks: An overview. Neural Netw. 2015, 61, 85–117. [Google Scholar] [CrossRef] [Green Version]
  168. Ma, L.; Liu, Y.; Zhang, X.; Ye, Y.; Yin, G.; Johnson, B.A. Deep learning in remote sensing applications: A meta-analysis and review. ISPRS J. Photogramm. Remote Sens. 2019, 152, 166–177. [Google Scholar] [CrossRef]
  169. Yekeen, S.T.; Balogun, A.; Yusof, K.B.W. A novel deep learning instance segmentation model for automated marine oil spill detection. ISPRS J. Photogramm. Remote Sens. 2020, 167, 190–200. [Google Scholar] [CrossRef]
  170. Ramalho, G.L.B.; Medeiros, F. Using Boosting to Improve Oil Spill Detection in SAR Images. In Proceedings of the IEEE 18th International Conference on Pattern Recognition (ICPR’06), Hong Kong, China, 20–24 August 2006; Volume 2, pp. 1066–1069. [Google Scholar]
  171. Chen, G.; Li, Y.; Sun, G.; Zhang, Y. Application of Deep Networks to Oil Spill Detection Using Polarimetric Synthetic Aperture Radar Images. Appl. Sci. 2017, 7, 968. [Google Scholar] [CrossRef]
  172. Viola, P.; Jones, M.J.C. Rapid object detection using a boosted cascade of simple features. In Proceedings of the 2001 IEEE Computer Society Conference on Computer Vision and Pattern Recognition (CVPR 2001), Kauai, HI, USA, 8–14 December 2001; Volume 1, p. 3. [Google Scholar]
  173. Gu, Q.; Sheng, L.; Zhang, T.; Lu, Y.; Zhang, Z.; Zheng, K.; Hu, H.; Zhou, H. Early detection of tomato spotted wilt virus infection in tobacco using the hyperspectral imaging technique and machine learning algorithms. Comput. Electron. Agric. 2019, 167, 105066. [Google Scholar] [CrossRef]
  174. Barbat, M.M.; Wesche, C.; Werhli, A.V.; Mata, M.M. An adaptive machine learning approach to improve automatic iceberg detection from SAR images. ISPRS J. Photogramm. Remote Sens. 2019, 156, 247–259. [Google Scholar]
  175. Barbedo, J.G.A. Detection of nutrition deficiencies in plants using proximal images and machine learning: A review. Comput. Electron. Agric. 2019, 162, 482–492. [Google Scholar]
  176. Gunter, N.B.; Schwarz, C.G.; Graff-Radford, J.; Gunter, J.L.; Jones, D.T.; Graff-Radford, N.R.; Petersen, R.C.; Knopman, D.S.; Jack, C.R. Automated detection of imaging features of disproportionately enlarged subarachnoid space hydrocephalus using machine learning methods. NeuroImage Clin. 2019, 21, 101605. [Google Scholar] [PubMed]
  177. Castanedo, S.; Juanes, J.A.; Medina, R.; Puente, A.; Fernandez, F.; Olabarrieta, M.; Pombo, C. Oil spill vulnerability assessment integrating physical, biological and socio-economical aspects: Application to the Cantabrian coast (Bay of Biscay, Spain). J. Environ. Manag. 2009, 91, 149–159. [Google Scholar]
  178. DePellegrin, D.; Pereira, P. Assessing oil spill sensitivity in unsheltered coastal environments: A case study for Lithuanian-Russian coasts, South-eastern Baltic Sea. Mar. Pollut. Bull. 2016, 102, 44–57. [Google Scholar]
  179. Azevedo, A.; Fortunato, A.B.; Epifânio, B.; Boer, S.D.; Oliveira, E.R.; Alves, F.L.; De Jesus, G.; Gomes, J.L.; Oliveira, A. An oil risk management system based on high-resolution hazard and vulnerability calculations. Ocean Coast. Manag. 2017, 136, 1–18. [Google Scholar]
  180. Kankara, R.S.; Arockiaraj, S.; Prabhu, K. Environmental sensitivity mapping and risk assessment for oil spill along the Chennai Coast in India. Mar. Pollut. Bull. 2016, 106, 95–103. [Google Scholar]
  181. Guo, W.; Hao, Y.; Zhang, L.; Xu, T.; Ren, X.; Cao, F.; Wang, S. Development and application of an oil spill model with wave–current interactions in coastal areas. Mar. Pollut. Bull. 2014, 84, 213–224. [Google Scholar]
  182. Gług, M.; Wąs, J. Modeling of oil spill spreading disasters using combination of Langrangian discrete particle algorithm with Cellular Automata approach. Ocean Eng. 2018, 156, 396–405. [Google Scholar]
  183. Chiu, C.-M.; Huang, C.-J.; Wu, L.-C.; Zhang, Y.J.; Chuang, L.Z.-H.; Fan, Y.; Yu, H.-C. Forecasting of oil-spill trajectories by using SCHISM and X-band radar. Mar. Pollut. Bull. 2018, 137, 566–581. [Google Scholar]
  184. Lynch, D.R.; Greenberg, D.A.; Bilgili, A.; McGillicuddy, D.J., Jr.; Manning, J.P.; Aretxabaleta, A.L. Particles in the Coastal Ocean: Theory and Applications; Cambridge University Press: Cambridge, UK, 2014. [Google Scholar]
  185. Spaulding, M.L. State of the art review and future directions in oil spill modeling. Mar. Pollut. Bull. 2017, 115, 7–19. [Google Scholar] [CrossRef]
  186. Fay, J.A. Physical processes in the spread of oil on a water surface. In International Oil Spill Conference; American Petroleum Institute: Washington, DC, USA, 1971; Volume 1971, pp. 463–467. [Google Scholar]
  187. Mackay, D.; Buist, I.; Mascarenhas, R.; Paterson, S. Oil spill processes and models. In Environment Canada Report EE-8; Environmental Protection Service: Ottawa, ON, Canada, 1980. [Google Scholar]
  188. Mackay, D.; Shiu, W.Y.; Hossain, K.; Stiver, W.; McCurdy, D. Development and Calibration of an Oil Spill Behavior Model; Toronto University Dept of Chemical Engineering and Applied Chemistry: Toronto, ON, Canada, 1982. [Google Scholar]
  189. Elliott, A.; Hurford, N.; Penn, C. Shear diffusion and the spreading of oil slicks. Mar. Pollut. Bull. 1986, 17, 308–313. [Google Scholar] [CrossRef]
  190. Johansen, O. The Halten Bank experiment-observations and model studies of drift and fate of oil in the marine environment. In Proceedings of the 11th Arctic Marine Oil Spill Program (AMOP) Techn. Seminar. Environment Canada, Ottawa, ON, Canada, 7–9 June 1984; pp. 18–36. [Google Scholar]
  191. Galt, J.A.; Overstreet, R. Development of Spreading Algorithms for the ROC. In Response Options Calculator; Genwest: Edmonds, WA, USA, 2009. [Google Scholar]
  192. Berry, A.; Dabrowski, T.; Lyons, K. The oil spill model OILTRANS and its application to the Celtic Sea. Mar. Pollut. Bull. 2012, 64, 2489–2501. [Google Scholar] [CrossRef] [PubMed] [Green Version]
  193. Yu, F.; Xue, S.; Zhao, Y.; Chen, G. Risk assessment of oil spills in the Chinese Bohai Sea for prevention and readiness. Mar. Pollut. Bull. 2018, 135, 915–922. [Google Scholar] [CrossRef] [PubMed]
  194. Amir-Heidari, P.; Raie, M. Response planning for accidental oil spills in Persian Gulf: A decision support system (DSS) based on consequence modeling. Mar. Pollut. Bull. 2019, 140, 116–128. [Google Scholar] [CrossRef]
  195. Jones, A.; Logan, G.; Kennard, J.; Rollet, N. Reassessing potential origins of synthetic aperture radar (sar) slicks from the timor sea region of the north west shelf on the basis of field and ancillary data. Appea J. 2005, 45, 311–332. [Google Scholar] [CrossRef]
  196. Jones, A.; Thankappan, M.; Logan, G.A.; Kennard, J.M.; Smith, C.J.; Williams, A.K.; Lawrence, G.M. Coral spawn and bathymetric slicks in Synthetic Aperture Radar (SAR) data from the Timor Sea, north-west Australia. Int. J. Remote Sens. 2006, 27, 2063–2069. [Google Scholar] [CrossRef]
  197. Thankappan, M.; Rollet, N.; Smith, C.J.; Jones, A.; Logan, G.; Kennard, J. Assessment of SAR ocean features using optical and marine survey data. In Proceedings of the Envisat Symposium, Montreux, Switzerland, 23–27 April 2007; Volume 2327. [Google Scholar]
  198. Wettle, M.; Daniel, P.J.; Logan, G.A.; Thankappan, M. Assessing the effect of hydrocarbon oil type and thickness on a remote sensing signal: A sensitivity study based on the optical properties of two different oil types and the HYMAP and Quickbird sensors. Remote Sens. Environ. 2009, 113, 2000–2010. [Google Scholar] [CrossRef]
  199. Lotliker, A.A.; Mupparthy, R.S.; Tummala, S.K.; Nayak, S.R. Evaluation of high resolution MODIS-Aqua data for oil spill monitoring. In Remote Sensing of Inland, Coastal, and Oceanic Waters; International Society for Optics and Photonics: Bellingham, WA, USA, 2008; Volume 7150, p. 71500S. [Google Scholar]
  200. Brown, C.E.; Fingas, M.F. New space-borne sensors for oil spill response. In International Oil Spill Conference; American Petroleum Institute: Washington, DC, USA, 2001; Volume 2001, pp. 911–916. [Google Scholar]
  201. Fingas, M.; Brown, C.E. Review of oil spill remote sensing. Spill Sci. Technol. Bull. 1997, 4, 199–208. [Google Scholar] [CrossRef] [Green Version]
  202. Yekeen, S.T.; Balogun, A.L. Automated Marine Oil Spill Detection Using Deep Learning Instance Segmentation Model. Int. Arch. Photogramm. Remote Sens. Spatial Inf. Sci. 2020, XLIII-B3-2020, 1271–1276. [Google Scholar] [CrossRef]
  203. Xing, Q.; Li, L.; Lou, M.; Bing, L.; Zhao, R.; Li, Z. Observation of Oil Spills through Landsat Thermal Infrared Imagery: A Case of Deepwater Horizon. Aquat. Procedia 2015, 3, 151–156. [Google Scholar] [CrossRef]
  204. Espedal, H. Satellite SAR oil spill detection using wind history information. Int. J. Remote Sens. 1999, 20, 49–65. [Google Scholar] [CrossRef]
  205. Zeng, K.; Wang, Y. A Deep Convolutional Neural Network for Oil Spill Detection from Spaceborne SAR Images. Remote Sens. 2020, 12, 1015. [Google Scholar] [CrossRef] [Green Version]
  206. Zhang, J.; Feng, H.; Luo, Q.; Li, Y.; Wei, J.; Li, J. Oil Spill Detection in Quad-Polarimetric SAR Images Using an Advanced Convolutional Neural Network Based on SuperPixel Model. Remote Sens. 2020, 12, 944. [Google Scholar] [CrossRef] [Green Version]
  207. Robbe, N.; Hengstermann, T. Remote sensing of marine oil spills from airborne platforms using multi-sensor systems. Des. Nat. III Comparing Des. Nat. Sci. Eng. 2006, 95, 347–355. [Google Scholar]
  208. Fingas, M.; Brown, C.E. Chapter 6—Oil Spill Remote Sensing: A Review. In Oil Spill Science and Technology; Fingas, M., Ed.; Gulf Professional Publishing: Boston, MA, USA, 2011; pp. 111–169. [Google Scholar]
  209. Fingas, M.; Brown, C.E. Oil spill remote sensing. In Earth System Monitoring; Springer: New York, NY, USA, 2013; pp. 337–388. [Google Scholar]
Figure 1. Remote sensing for oil spill management.
Remotesensing 12 03416 g001
Figure 2. Examples of oil spill visible spectrum images: (a) Deepwater Horizon oil spill; and (b) Exxon Verdex Oil spill.
Remotesensing 12 03416 g002
Figure 3. Example of Airborne IR imagery with oil slick in red box from the China Victory oil filed oil spill in 1998.
Remotesensing 12 03416 g003
Figure 4. (A) MODIS; (B) MERIS; and (C) Landsat 5 TM showing the site of DWH oil spill in blue arrow.
Remotesensing 12 03416 g004
Figure 5. Sentinel 2A and 2B bands.
Remotesensing 12 03416 g005
Figure 6. (A) SAR imagery showing oil slick and lookalike in an open sea in Johor Malaysia; and (B) Ground truth masking of the oil slick (Purple) and lookalike (Cyan).
Remotesensing 12 03416 g006
Table 1. Past and current SAR Satellite Sensors.
SatelliteLaunch YearFrequency (GHz)BandOperator
SEASAT19781.27 GHzLNational Aeronautics and Space Administration (NASA)
ERS-119915.5 GHzCEuropean Remote Sensing Satellite
ERS-219955.5 GHzCEuropean Remote Sensing Satellite
ENVISAT-ASAR20055.30CEuropean Remote Sensing Satellite
TerraSAR-X20059.65XEuropean Remote Sensing Satellite
ALOS-PALSAR20061.27LEuropean Remote Sensing Satellite
RADARSAT-220075.40XGerman Earth observation satellite
Tandem-X20109.65XGerman Earth observation satellite
Cosmos Skymed-120079.65XItalian Space Agency
Cosmos Skymed-220109.65XItalian Space Agency
TecSAR20089.59XIsrael Aerospace Industries
Kompsat-520139.66XKorean Space Agency
Sentinel-1a and -1b2013/20165.405CEuropean Space Agency
RADARSAT-Constellation (3 satellites)20185.405CCanadian Space Agency
Table 2. Different Oil Spill Detection Features Feature classification.
NFeature CategoryFeatureCode
1Geometric/shape featureAreaA
2PerimeterP
3slick complexityC
4perimeter to area ratioP/A
5shape factor ISP1
6slick widthSW
7SpreadingS
8Backscatter featureDark spot meanDSMe
9dark spot standard deviationDSSd
background meanBMe
1backgrounds standard deviationBSd
1dark spot power to mean ratioOPm/Bpm
1mean contrastConMe
1max contrastConMax
1Gradient featureGradient meanGme
1gradient standard deviationGsd
1gradient maxGMax
1gradient minGMin
1gradient power to mean ratioGpm
Table 3. Summary comparison of the different oil spill sensors.
SensorsSpatial Resolution24-h Operation AbilityFalse Positive EffectAltitudeWeather Operation
VisiblehighNoAffected by elements such as seaweed, darker shoreline)Below or Above 500 mAffected by cloudy and non-clear weather
InfraredHighYesAffected by seaweed and shorelineBelow or above 250 mAffected by heavy fog and cloudy sky
Near-InfraredHighYesAffected by seaweed and shorelineBelow or above 250 mAffected by heavy fog and cloudy sky
UltraviolentHighNoSun glint, wind sheen, and seaweed cause lookalikes.Below or above 250 m.Requires a clearer atmosphere
Optical SatelliteMediumYesSun glint, wind sheen, and seaweed cause lookalikes.700–900 kmAffected by heavy cloud cover
Radar sensorHighYesAffected by several elements such as high wave, seaweed, grease, etc.Airborne (10–12 km) and Satellite (700–900 km)It can work under any weather condition, but wind speed contributes to the detection of oil spill.
Table 4. Different Automated oil spill Detection Methods.
Author Task AlgorithmMethodAccuracy
[164]Oil spill detection from Radarsat-2 and UAVSAR polarimetric SAR images Random Forest classifierMachine learning Overall accuracy of 92.99% and 82.25% were achieved from the two datasets respectively.
[113]Segmentation of oil spills on side-looking airborne radar imagery Deep Neural autoencodersDeep learningF1 score accuracy of 93.1%
[171]Oil spill detection using Polarimetric Synthetic Aperture Radar ImagesDeep Learning Algorithms (Stacked Auto Encoder and Deep Belief Network)Deep learningAbove 80.0% ROC accuracy
[203]Observation of oil spills through Landsat thermal infrared imagery Ocean surface temperature.Traditional segmentation methodReported a high accuracy (accuracy percentage was not documented)
[156]Oil spill detection based on morphological attributes SVMMachine learningReported a high accuracy (accuracy percentage was not documented)
[126]Using feature extraction and threshold-based segmentation for oil spill detection on SAR imagesSpot Extraction and Global ThresholdTraditional segmentation methodReported a high accuracy (accuracy percentage was not documented)
[204]Satellite SAR oil spill detection using wind history informationWind historyTraditional segmentation methodReported a high accuracy (accuracy percentage was not documented)
[45]Identification of marine oil spill from SAR imagesSemantic segmentation algorithms (UNet, LinkNet, PSPNet, DeepLabv2, DeepLabv2 (msc), DeepLabv3+)Deep learning DeepLab3+ had the highest mIoU accuracy 65.06%
[115]Feature selection for faster marine oil spill detection from SAR imagesSVMMachine learning87.1% and 74.6% overall accuracy and Cohen’s kappa coefficient.
[149]Monitoring large oil slick dynamics in optical MODIS imagesObject-based images analysisObject-based images analysisHighest user accuracy at 94.2% and producer accuracy at 73.5%.
[150]Coast, Ship and oil spill detection from side-looking airborne radar imagesTwo-stage CNNDeep learning98.34% overall accuracy was achieved.
[151]Detection and object-based classification of oil spill and lookalikeObject-based fuzzy classificationObject-based images analysis83% overall accuracy for oil spills and 77% for lookalikes
[152]Oil spill detection from SAR imagesObject-based images analysis and Fuzzy logicObject-based images analysis97.34% oil spill probability accuracy
[205]Oil spill detection from spaceborne SAR imagesDeep convolutional neural networks algorithmDeep learning An overall accuracy, recall and precision value of 94.1%, 83.51 and 85.70% were achieved respectively.
[206]Oil spill detection from Quad-Polarimetric SAR imagesCNNDeep learning Mean Intersection over Union (MIoU) accuracy of 90.5% was achieved.
[169,202]Detection of oil spill, lookalike, ship, and land areaMask R-CNNDeep leaning instance segmentationOverall accuracy of 96.6%
Publisher’s Note: MDPI stays neutral with regard to jurisdictional claims in published maps and institutional affiliations.

