Article

A Novel Spectral Matching Approach for Pigment: Spectral Subsection Identification Considering Ion Absorption Characteristics

1
School of Geomatics and Urban Spatial Informatics, Beijing University of Civil Engineering and Architecture, No.15 Yongyuan Road, Daxing District, Beijing 102616, China
2
Beijing Key Laboratory for Architectural Heritage Fine Reconstruction & Health Monitoring, No.15 Yongyuan Road, Daxing District, Beijing 102616, China
3
The Conservation Institute of Dunhuang Academy, Dunhuang, Gansu 736200, China
4
National Research Center for Conservation of Ancient Wall Paintings and Earthen Sites, Dunhuang Academy, Dunhuang, Gansu 736200, China
5
Chinese Academy of Cultural Heritage, Beijing 100029, China
*
Author to whom correspondence should be addressed.
Remote Sens. 2020, 12(20), 3415; https://doi.org/10.3390/rs12203415
Submission received: 16 September 2020 / Revised: 10 October 2020 / Accepted: 15 October 2020 / Published: 18 October 2020

Abstract

:
Background: Hyperspectral technology has made it possible to perform completely non-invasive investigations on pigment analysis, in particular, on pigment identification. The most commonly used method of pigment identification is to compare the spectral similarity between ones of unknown target and ones in spectral library, which requires a comprehensive and complete spectral library and is based on overall shape of the spectrum. To a certain extent, it may ignore some of the key absorption characteristics of the spectrum. Methods: A novel spectral matching method was proposed based on the spectrum divided into subsections for identification according to the main ion absorption characteristics. Main works: (1) establishing a spectral library suitable for typical pigment identification of painting; (2) discussing the main components, as well as the absorption positions of the ions and functional groups contained in pigments frequently used by artists; (3) presenting a novel spectral matching algorithm carried on spectral subsections for pigment identification; (4) verifying the feasibility and applicability of proposed method by a Chinese painting and a fresco. Conclusions: The proposed method can correctly identify the main pigments or components contained in the mixed area, which is better than the traditional method and more convenient than the unmixing method, except for some limitations in detecting white and black pigments.

Graphical Abstract

1. Introduction

As more attention is drawn on the conservation of cultural relics, the use of modern technology to preserve information on the surface of cultural relics to achieve the protection and inheritance of that has become an important development trend in this field. Painted artifacts refer to a kind of cultural relics that adhere pigments to the substrate material through the binding media, including frescoes, paintings, painted potteries, painted clay sculptures, ancient architectural oil paintings, etc. The color on the surface of the precious painted artifacts with a long history such as Chinese paintings and frescoes will appear to be lost or faded in some degree. On the other hand, pigments with vivid colors are important elements reflecting the artistic, historical, and research values of painted artifacts. Therefore, pigment identification plays an important role in scientific preservation and restoration of painted artifacts.
Many modern techniques can provide essential information about materials used in painted artifacts, for example, their pigments composition [1,2]. A set of different instruments and various techniques, including X-Ray diffraction (XRD), scanning electron microscopy coupled to energy dispersive spectroscopy (SEM-EDS), and several spectroscopies, were used to identify the complex composition structure of different green earths [3]. Five portable spectroscopic techniques, namely X-ray fluorescence (XRF), mid-infrared reflectance spectroscopy, near infrared reflectance spectroscopy, and UV-Vis spectroscopy in absorption and emission, were used to study the materials in a painting by Pierre-Auguste Renoir, “A woman at her toilette,” which has been examined using conventional micro-sampling techniques. The potential and limitations of the in-situ and non-invasive approaches were evaluated in pigments identification of painting [4]. Fiber optic Fourier transform-infrared (FT-IR) reflectance spectroscopy was used to acquire the reflectance spectra of two pigments, which were processed by principal components analysis and Mahalanobis distance [5]. In [6], a practical approach was developed to identify dyes in works of art from samples as small as 25 μm in diameter with the surface-enhanced Raman scattering (SERS). Two organic compounds were used to demonstrate the sensitivity of SERS at the single-molecule level. The practical application of SERS to cultural heritage studies were examined, including the selection of appropriate substrates, the development of analytical protocols, and the building of SERS spectral databases. Some of them require collecting sample from the cultural relics for testing, which is generally not allowed.
Another important technique for identifying pigments is the diffuse reflectance spectroscopy, which was firstly introduced to identifying pigments on surface of relics in 1995 [7]. This technique, which can also be categorized as hyperspectral technology due to its high spectral resolution in the remote sensing field, can rapidly acquire punctual reflectance spectra. It has increasingly become a kind of non-invasive and efficient way for detecting materials [8]. Wang et al. [9] developed a fiber optics reflectance spectrophotometer to identify pigments in a nondestructive way considering the special demands of protecting relics. The shape, characteristic reflectance peak, as well as the peak in the first derivative of the reflectance spectrum were employed to identify the pigments on colored pottery figurines and frescoes of Tang dynasty tombs in Xian, China. The results were reliable and verified by XRF analysis. The potential of non-invasive in situ analytical techniques such as portable Raman, portable X-ray fluorescence, portable optical microscope, and fiber optics reflectance spectroscopy has been used for studying painted layers of Renaissance terracotta polychrome sculptures belonging to the statuary of Santo Sepolcro Church in Milan. The results obtained pointing out the contribution of these techniques to the compositional diagnostic, providing complete information, in some cases better than micro-destructive techniques, on the kind of pigments used on the external painted layers. Moreover, a comparison with the results obtained before the last conservation work (2009) with micro-destructive techniques allowed ascertaining the removal of the external painted layers during the conservation operations [10]. In [11], a fiber spectroradiometer, with the aid of calibrated luminescence imaging spectroscopy, was used for identifying cadmium pigments and distinguishing among cadmium sulfide, cadmium zinc sulfide, and cadmium sulfoselenide. Cadmium pigments are semiconductors that show band edge luminescence in the visible range so as to realize pigments identification. It is necessary to further the work for finding features of other pigments for identification as well. The Fiber Optics Diffuse Reflectance Spectroscopy (FORS) technique was employed to explore the pigments on Byzantine wall painting. Its potential and reliability were assessed by several analytical techniques, such as environmental SEM-EDX, Attenuated Total Reflectance FTIR (ATR-FTIR), and micro-Raman Spectroscopy. The results confirmed the effectiveness of FORS technique for wall painting pigments’ identification, offering key advantages such as instrument mobility and rapid data collection, which are of utmost significance in the field archaeological research [12]. In [13], UV-Vis-NIR FORS combined other approaches were used to investigate the modern and contemporary mural paintings. Its results confirmed that the materials used by Keith Haring for the mural Tuttomondo (1989) have the same composition of the new Caparol acrylic paints, except for the case of yellow pigment. However, the previous studies focused on the feasibility and reliability of reflectance spectroscopy in pigments identification of colored relics. The identification methods mainly rely on the manual search for spectral characteristics. The accuracy and efficiency of the method are limited by comparing the shape, reflection peak, and absorption valley with the standard pigment spectra. Moreover, the wavelength range of above instruments is in visible and infrared (<1000 nm), which cannot distinguish the pigments with the same color very well, because some reflectance characteristics located in the wavelength are greater than 1000 nm [14].
In order to improve the accuracy and efficiency of this kind of reflectance spectrum to identify pigments, its spectral range has been extended to 2500 nm, which is often used in the spot spectrum measurement in hyperspectral remote sensing. Moreover, some automatic methods based on the curve matching of reflectance spectrum have also been proposed, and they all need standard spectral library as the reference. For materials on the earth, there are several generally approved spectral libraries available [15], such as the United States Geological Survey-MIN (USGS-MIN) [16], Jet Propulsion Laboratory (JPL) [17], John Hopkins University (JHU) [18], International Geological Correlation Program-264 (IGCP-264) [19], and Advanced Spaceborne Thermal Emission and Reflection Radiometer (ASTER) [20]. As for pigments, there are also some spectral libraries established as the reference for pigment recognition. Cosentino [21] developed a FORS database of 54 historical pigments commonly used in artwork, which was built by collecting the reflectance spectra of pigments in pure powder and applied with different binders. The spectra cover the 360–1000 nm spectral range. Now, the database is available on-line and can be download freely. Balas et al. [22] employed a hyperspectral imaging device and proposed an approach to identify and map pigments in paintings by El Greco and his workshop with the aid of a properly selected spectral classifier. They also built a spectral library by collecting the spectra of a series of pigment material replicas developed by using original methods covering almost the entire palette of Renaissance painters. The spectra cover the 370–1100 nm spectral range. Bayarri et al. [23] applied several hyperspectral techniques for the study, conservation, and management of rock art. Many methods in hyperspectral remote sensing, such as calibration, transformation, and mapping, were discussed and combined to study the panels in the Cave of El Castillo in Puente Viesgo, Cantabria, Spain. A spectral library was also built to identify the pigments used in the artworks. Wu et al. [24] utilized a shortwave infrared hyperspectral imaging device covered 1000–2500 nm to examine cultural relics. A painting created in Qing Dynasty (1636–1912) was selected as the sample. They extracted several kinds of information from this painting, such as color, pigment composition, and damage characteristics. In total, 12 kinds of typical Chinese painting pigments were also measure by a portable ground object spectrometer as the reference of pigment identification.
The automatic methods of spectral matching can be divided into two categories: the matching method based on the overall curve similarity and the matching method based on the feature similarity extracted from the spectral curve.
The first kind of method commonly used for spectral identification is to calculate the similarity between unknown spectrum and standard spectra in spectral library based on certain similarity indexes, such as mean distance, Spectral Angle Mapping (SAM), and correlation coefficient. In [25], the FORS was used to identify pigments in pictorial layers of works of art thanks to a spectra database of dry powdered mineral pigments. The mean distance between the spectral curve of the pigment to be identified and that of the standard pigment was used to calculate the similarity. And the best fit was given by the smallest mean distance computed for all the spectra in the database. Shi et al. [26] identified azurite pigment on the surface of a painting “80th birthday of Chongqing’s Empress Dowager” kept in the Forbidden City, Beijing, China, which was painted by Yao Wenhan, a famous painter in the 18th century in China. The SAM between the spectral curve on the painting and that of the standard pigment stored in USGS spectral library was used to identify the pigments. In [27], a method of spectral information divergence based on statistical manifold space was proposed, which improved the measurement standard of information divergence into Riemannian metric. The difference in component probability of the spectral vector was regarded as the probability variation. The pigment was identified by spectral information divergence, which effectively improved the matching accuracy.
Another commonly used method for spectral identification is to calculate the similarity of features extracted or enhanced from unknown spectra and reference spectra. It differs from the above-mentioned method in that it not only relies on the spectral curve in the standard spectral library, but also the spectral features enhanced for the similarity calculation. Typically, constraining the spectral shape is more important than the spectral magnitude because the former has a direct relationship with the composition of the target [28]. Therefore, it is necessary to enhance the spectral absorption characteristics of unknown spectra and reference spectra before spectral identification to obtain more accurate results. The methods for spectral absorption characteristics enhancement include the first derivative calculation and continuum removal of the spectrum. The derivative analysis of spectra has been widely applied in hyperspectral remote sensing and chemical analysis [29,30]. Fonseca et al. [31] used FORS to non-invasively identify madder- and cochineal based pigments on works of art. The features extracted in the first derivative transformation of the FORS spectra instead of the absorption features were used for pigment identification. This study provided a more robust means of primary identification and could be used to create a decision tree for the identification of madder and cochineal pigments based solely on FORS. Continuum removal is another widely used method for processing and analyzing spectra. It can not only highlight the absorption characteristics of spectral curves, but also normalize them to a unified spectral background, which is beneficial for the comparison between spectra measured in different environments. Furthermore, the original curve after removed continuum can be used for calculating the spectral characteristic parameters in the absorption bands. Wu et al. [32] performed continuum removal both on unknown spectra and reference spectra before spectral matching, and then used the least squares method for spectral features fitting to realize spectral identification. Cen et al. [33] highlighted the absorption and reflection characteristics on the spectral curve after continuum removal of mineral pigment collected, and extracted the band characteristics by using various spectral analysis methods. The identification and analysis of the main pigments of Thangka were realized by quantifying the spectral characteristics such as wavelength position, depth, symmetry, etc. It is of great significance to the identification, restoration, digital archiving, and reproduction of Thangka.
However, due to the similar spectral reflectance characteristics of different pigments with the same color, the above methods are prone to false matching in spectral matching of different materials with the same color [34]. Moreover, the colors on surfaces observed by our naked eyes or instruments are usually caused by a mixture of several kinds of pigments due to painting skills. The recognition ability of the above methods for mixed pigments is also very limited.
Since the absorption positions of main ions and functional groups in pigments will appear in certain intervals [35], we developed a pigment identification method based on the special ion absorption characteristics on subsection of pigment’s reflectance spectra. It could extract the certain intervals for spectral subsection identification, which can locate key features of unknown spectra accurately. This method is also effective for the identification of mixed pigments.
In Section 1, the paper starts from an overall introduction of context of the study and a brief review of related works. Section 2 introduces the spectral identification methods proposed in the study in detail, followed by describing the typical pigment spectral library established by our team, the typical ion absorption positions of pigments, Spectral Absorption Index (SAI) and SAM used in our novel method. The description of experiment and the presentation of results presented in Section 3. Furthermore, the results are explained and discussed in Section 4. In Section 5, the conclusion is briefly summarized and future work is outlined as well.

2. Materials and Methods

The overall process of this study is given in Figure 1. A spectral library suitable for typical pigment identification on surface of paintings is established. Furthermore, a novel spectral subsection identification (SSI) method considering ion absorption characteristics is proposed to identify the types of pigments on the surface of painted artifacts. It is carried out on a Chinese painting created in a laboratory, and an outdoor fresco in Qutan Temple, Qinghai Province, China, created in 1392. Moreover, the traditional identification method using the entire spectrum is also applied to the two samples for comparison. Finally, either the known truth value or X-ray fluorescence (XRF) spectrometer is used to verify the identification effect and applicability of the method.

2.1. SSI Method

The SSI method adopts the SAI or SAM method based on the absorption feature of the unknown spectrum in each characteristics subsection to calculate the similarities with standard spectra in corresponding subsection. The final results represent the presence of each pigment in mixture using the index, which are calculated based on the weights assigned to the top three results of each subsection. As shown in Figure 2, the process can be carried out in the next steps.
(1)
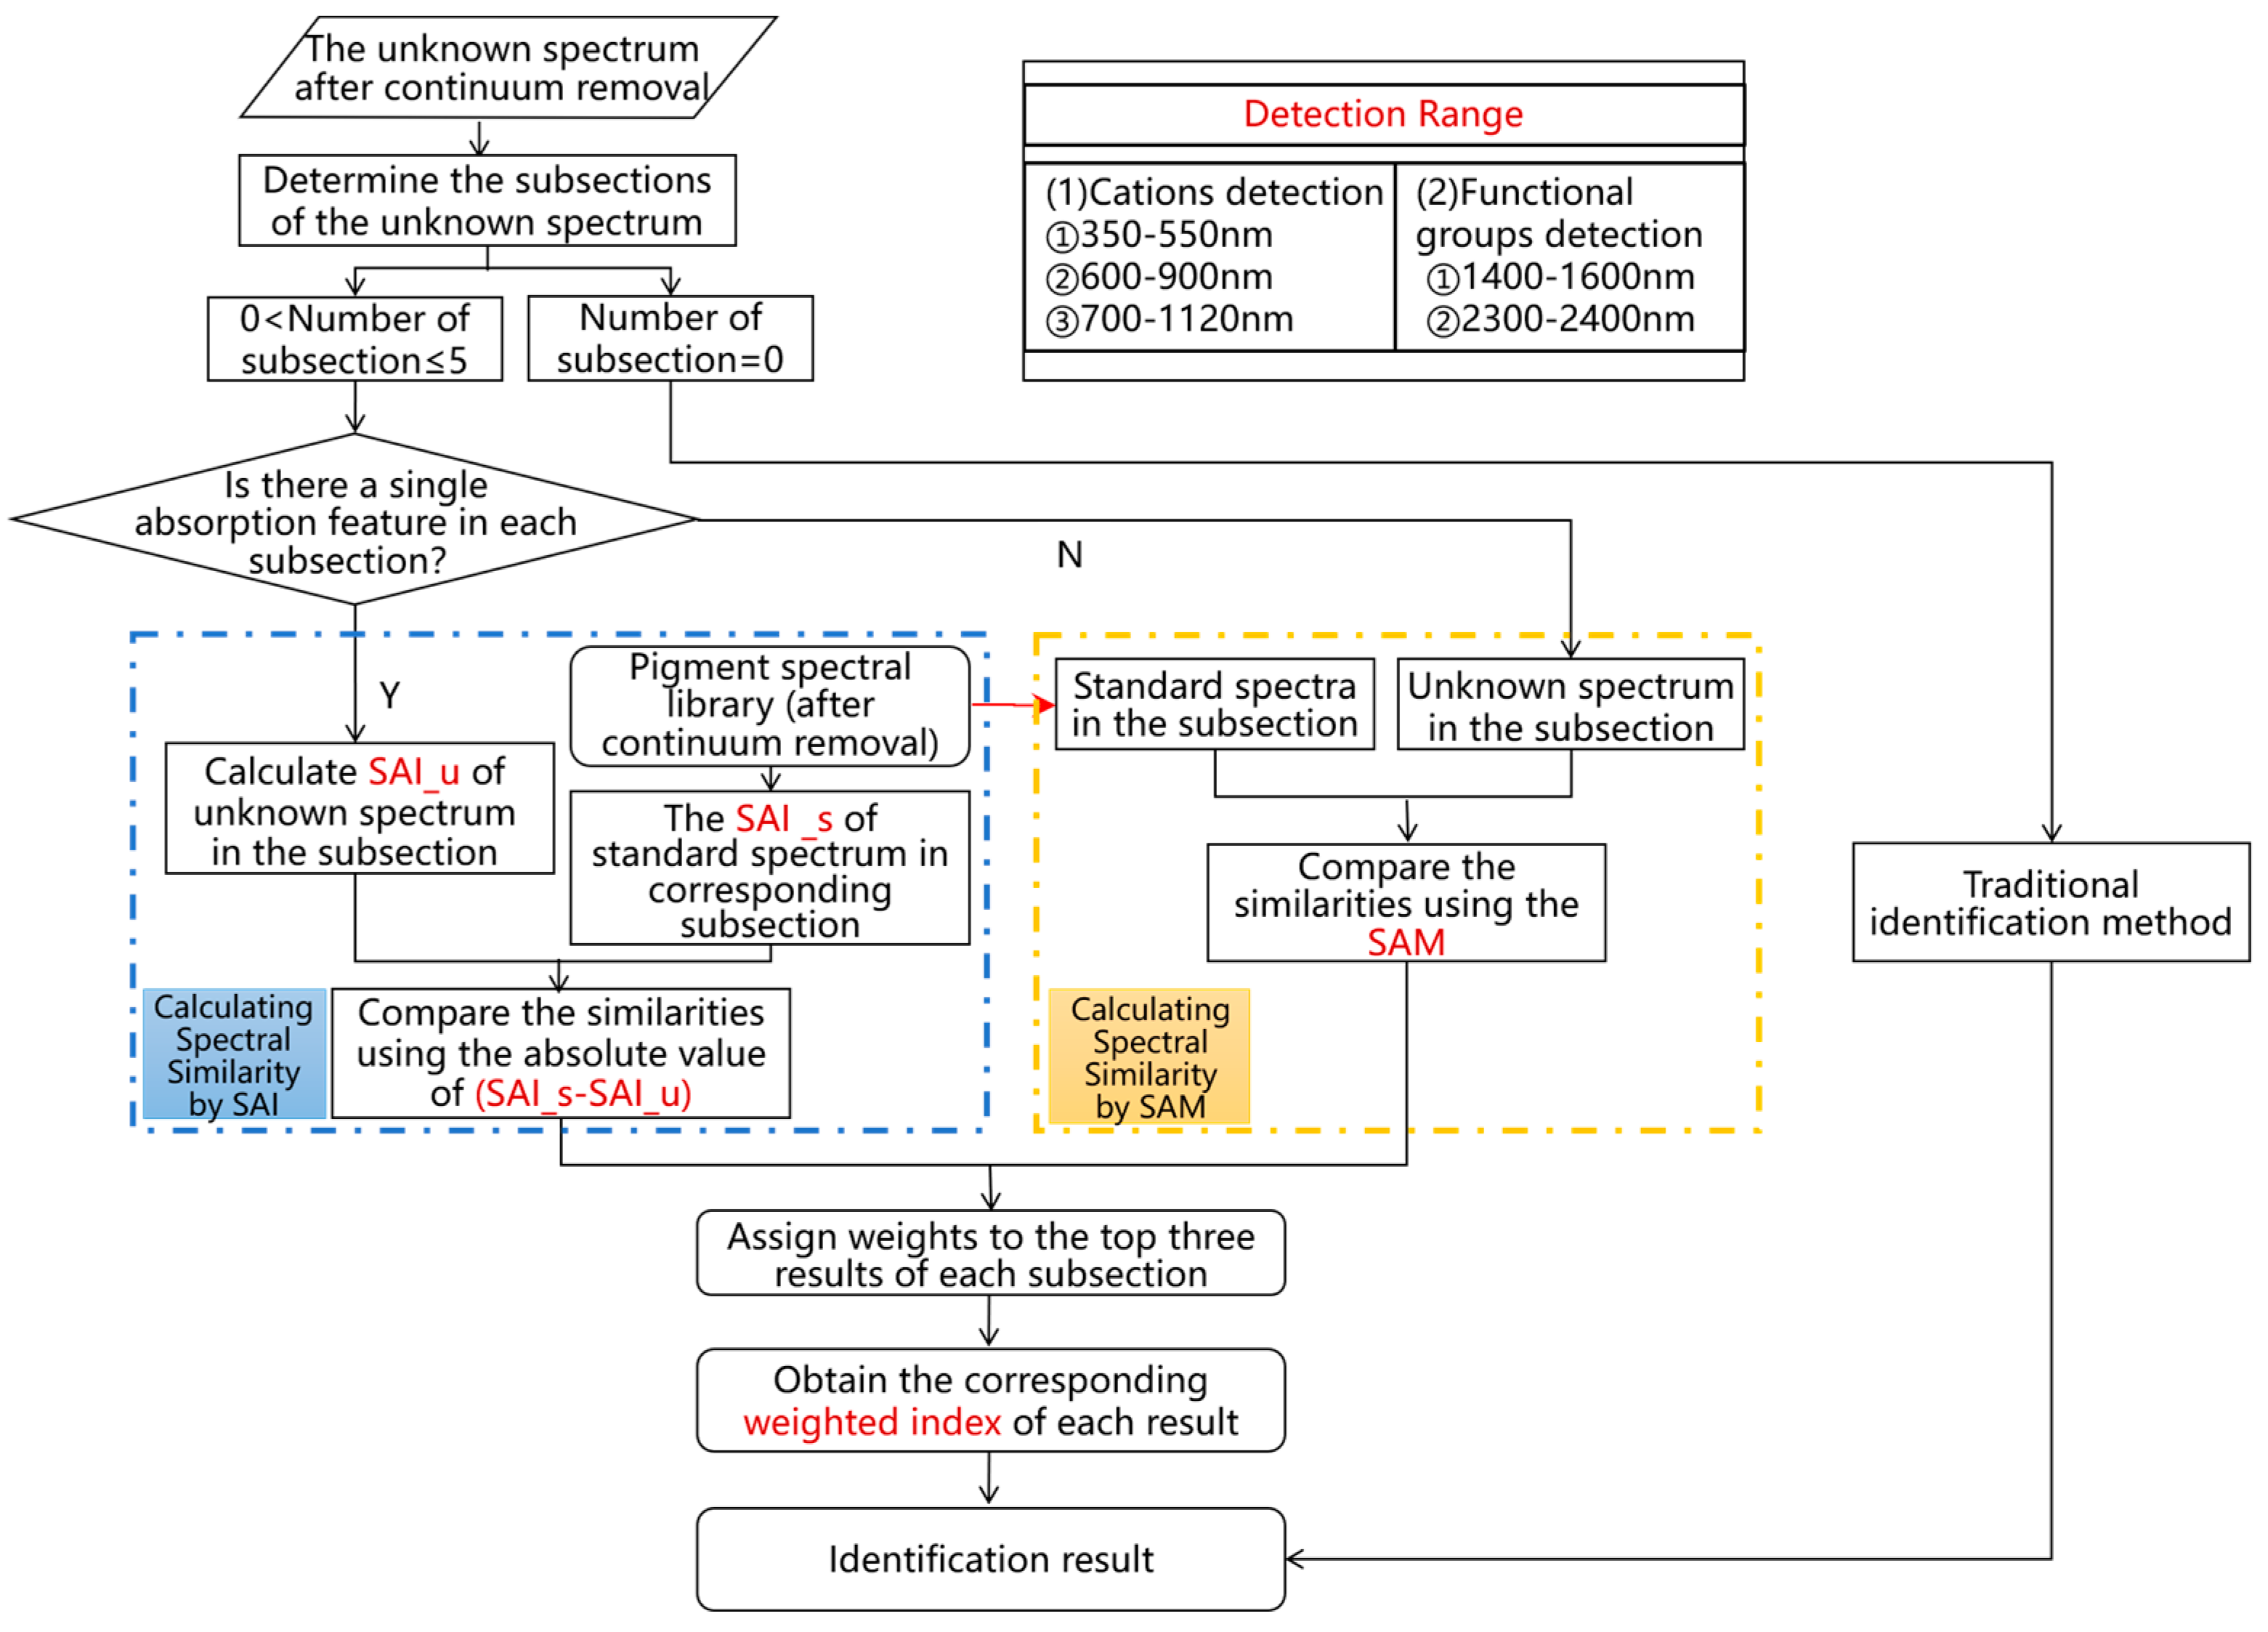
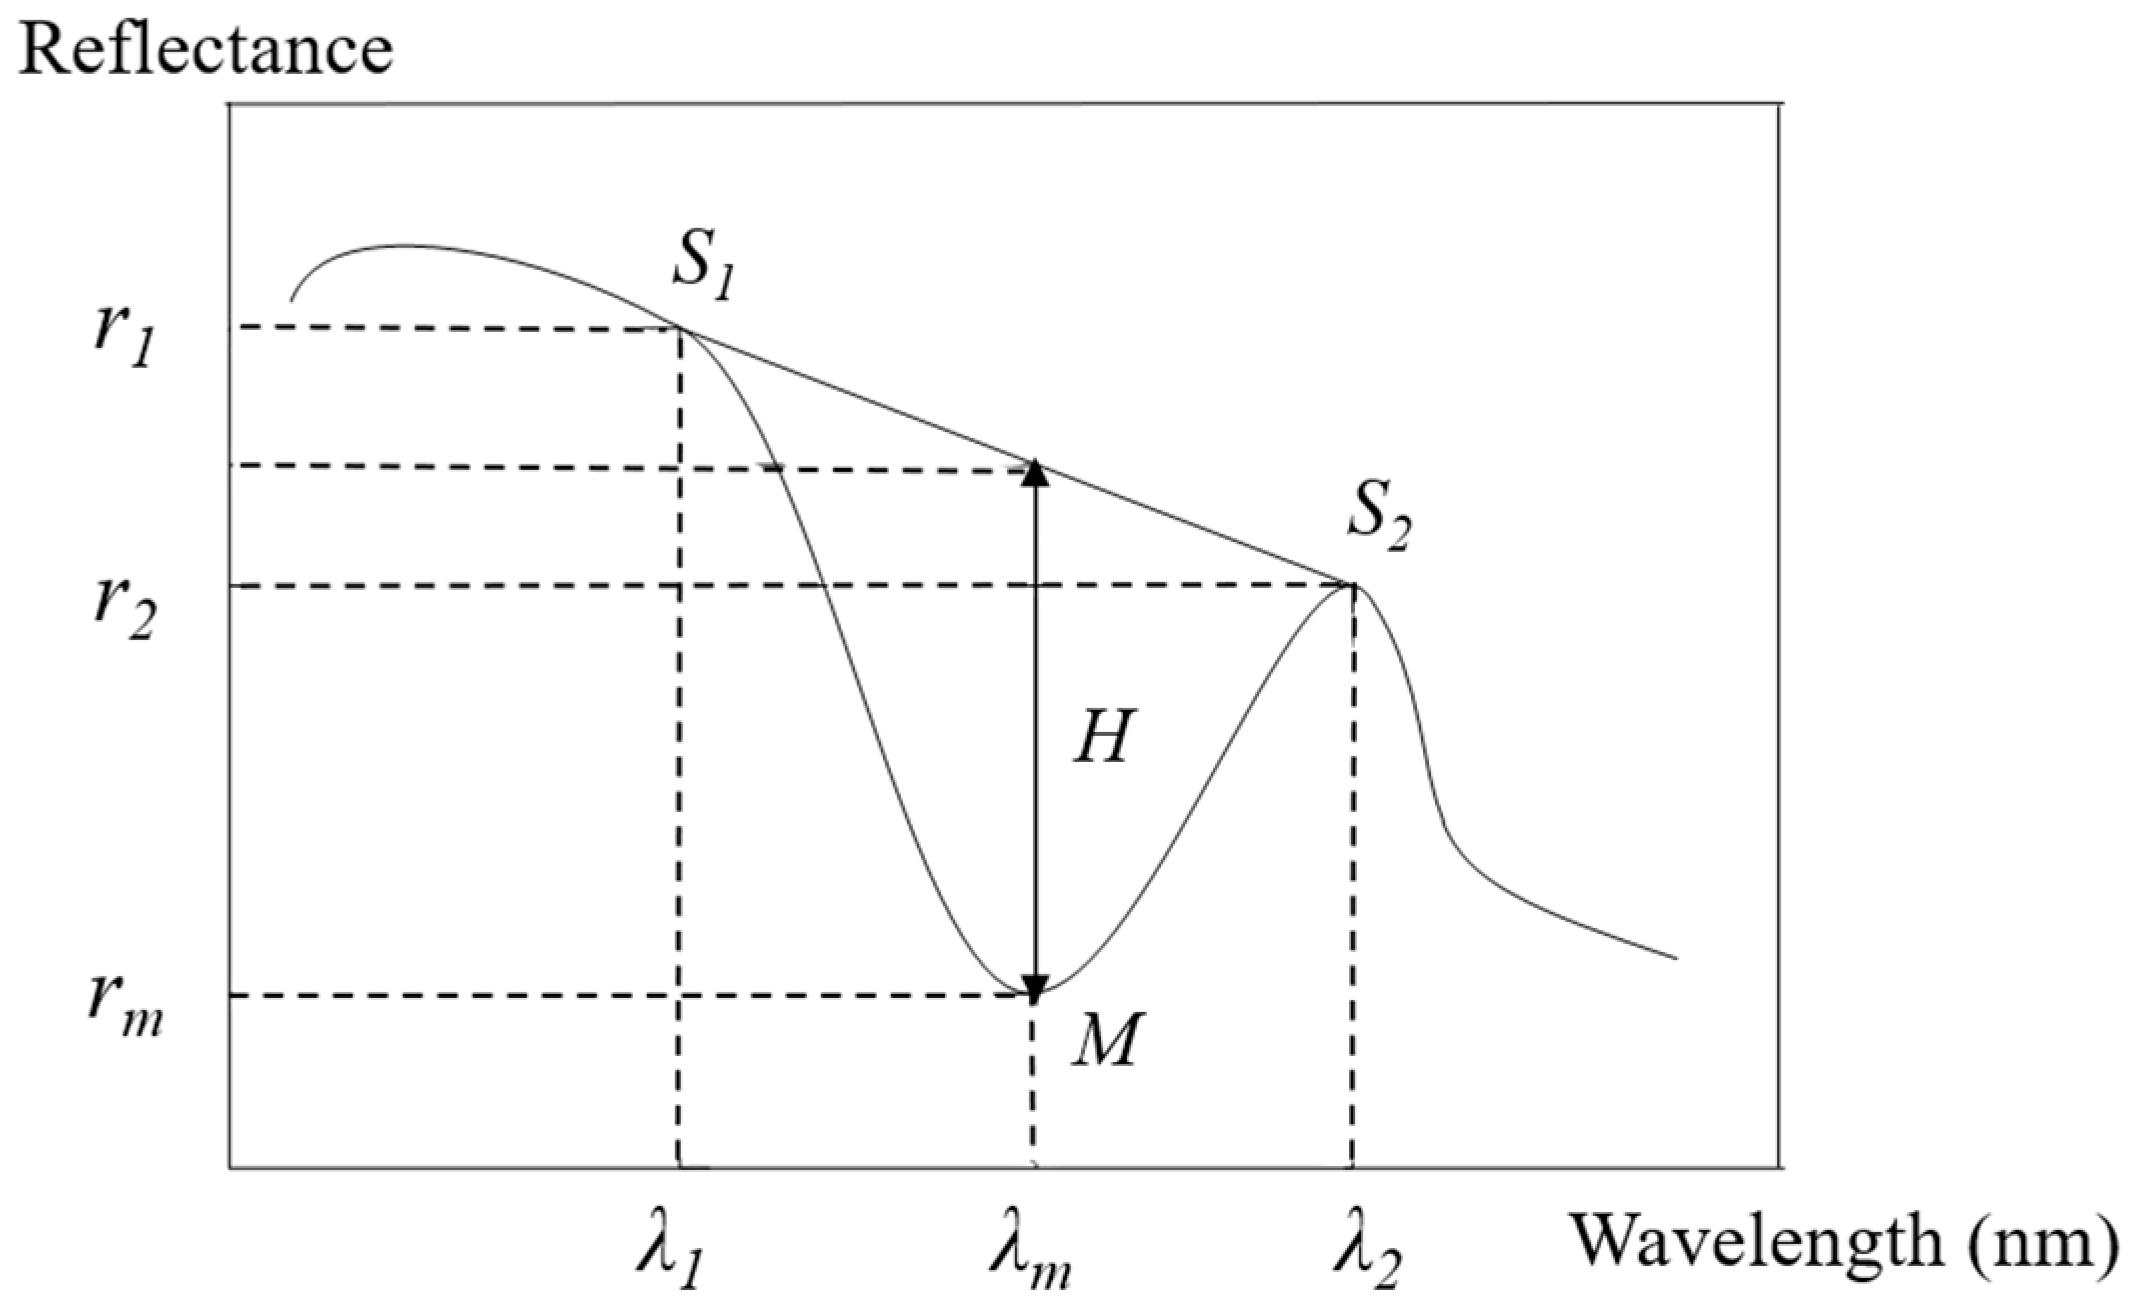
Perform the continuum removal on the unknown spectrum and the standard spectra in pigment spectral library.
(2)
Determine the number of subsections for the unknown spectrum as sub_int. The five detection ranges should be checked one by one to select the characteristic subsection(s), where the unknown spectrum has significant absorption characteristics as sub_int = (sub_int1, sub_int2, … sub_intm) (m is the number of subsections, 0 < m ≤ 5), for subsequent spectral subsection identification.
(3)
If the unknown spectrum does not have any characteristic subsection, the whole spectrum will be used for traditional identification. Then, go to step (9).
(4)
Judge whether there is a single absorption feature in each subsection. If it is false, then go to step (6).
(5)
If there is a single absorption feature in the subsection, the similarities between spectra will be calculated by using SAI. Firstly, the SAI is calculated within the subsection of the unknown spectrum and all standard spectra in the pigment spectral library as SAI_u and SAI_s = (SAI_s1, SAI_s2, … SAI_sn). Secondly, the difference is calculated between each element in SAI_si and the SAI_u. Finally, the smaller the absolute value result of (SAI_si-SAI_u), the higher is the similarity between the corresponding standard spectrum and the unknown spectrum in this subsection. The top three results with the highest similarity in each subsection will be selected. Then, go to step (7).
(6)
If there is no single absorption feature in the subsection, the similarities between spectra will be calculated by SAM. Firstly, the standard spectra within the subsection are extracted from pigment spectral library (after continuum removal). Then, we calculate the cosine of the spectral angles between them and the unknown spectrum in corresponding subsection. The larger the cosine value of the spectral angle, the higher is the similarity between the corresponding standard spectrum and the unknown spectrum in this subsection. The top three results with the highest similarity in each subsection will be selected.
(7)
Assign the weights. The top three pigments obtained in each subsection by step (5) or (6) are assigned weights of 3/3m, 2/3m, and 1/3m in order of ranking, respectively, where m is the number of subsections of the entire spectrum, and 0 < m ≤ 5. It should be noted that the higher ranking indicates that the pigment has a higher similarity with the unknown spectrum in this subsection. Therefore, the larger fraction will be assigned to the pigment. However, the pigment with the largest fraction in one subsection cannot be directly considered to exist in the mixed area, because the final identification result needs to be obtained by accumulating the weight scores of all the subsections.
(8)
Calculate the corresponding weighted index of each result according to the weights. According to the resulting weights of each characteristic subsection, the weighted index of each result is calculated. In that way, the existence of each pigment in mixture can be represented by the percentage. Moreover, the weighted index of pigment indicates the possibility of existence of the pigment, although it is not a strictly statistical probability.
(9)
To obtain the final identification result.

2.2. Spectral Library Establishment

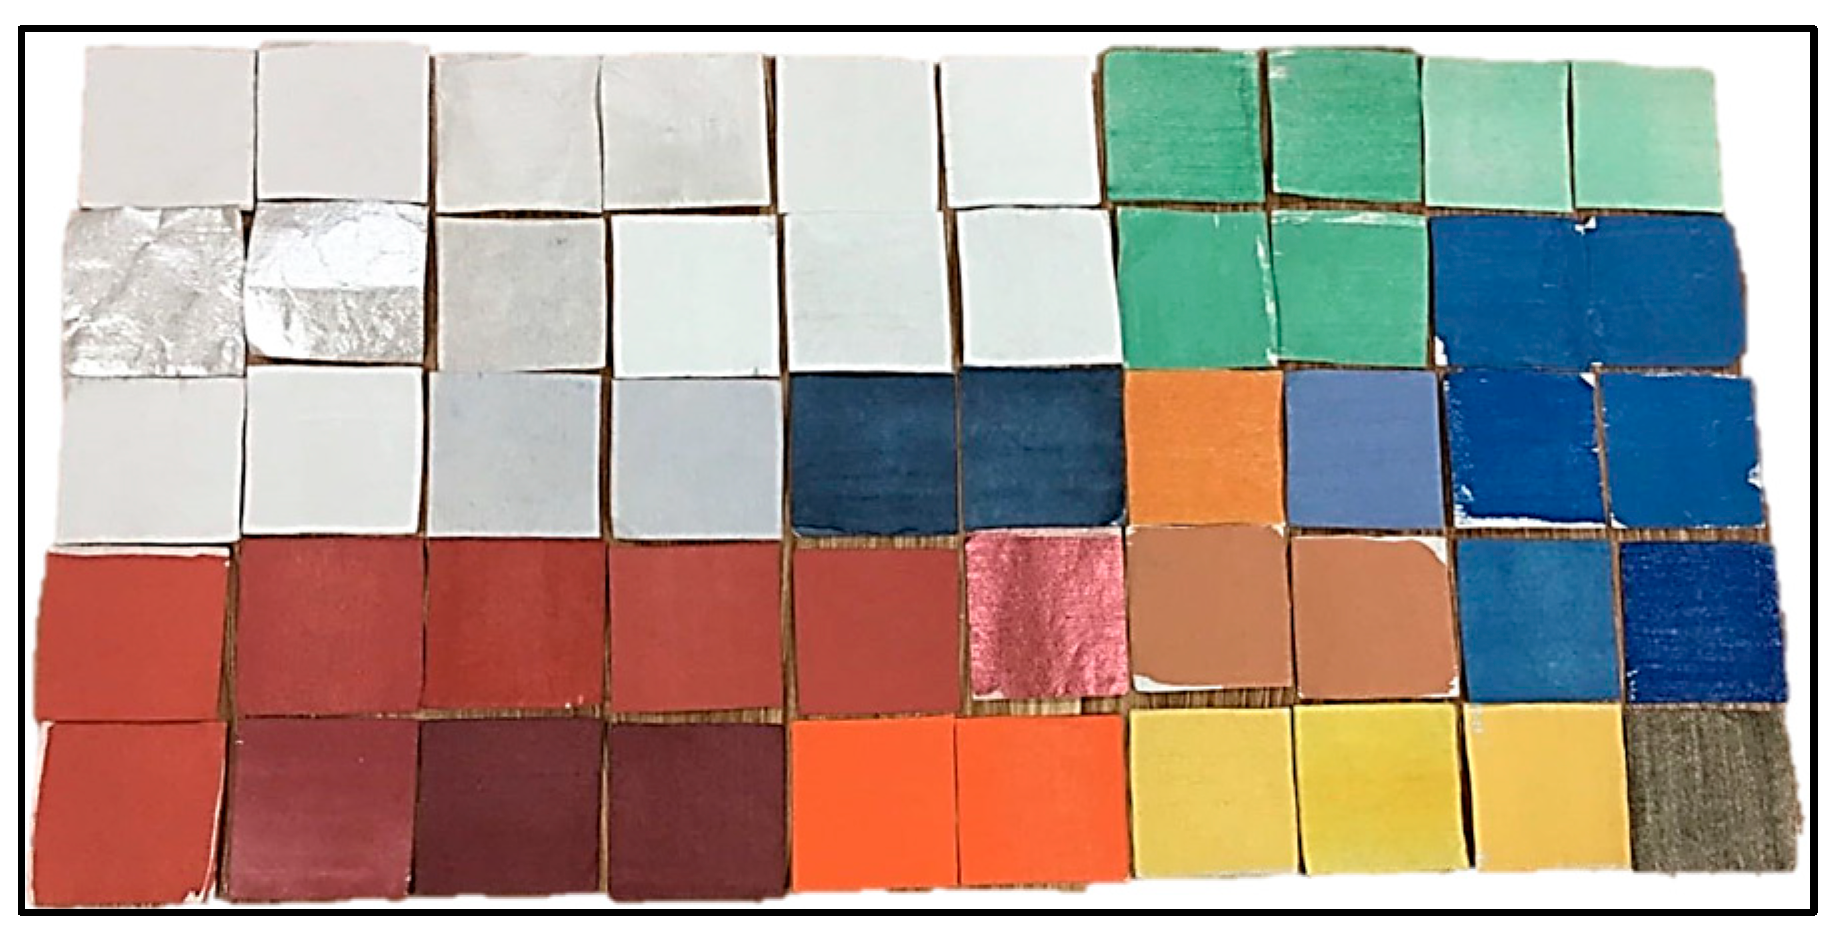
2.2.1. Samples of Spectral Library

Pigment Selection

The suitable pigments for establishing spectral library is crucial for spectral identification, because it usually affects the quality of identification results [36]. After careful investigation and comparison, 32 kinds of pigments of Jiang Sixutang, a famous brand established 300 years ago, were selected for sample making, including 24 kinds of mineral pigments and eight kinds of botanical and chemical pigments [37] (see Table 1). As shown in Table 1, the number following the pigment name means that it was painted in the corresponding times.

Glue Preparation

Since the mineral pigments cannot be directly drawn on the paper, it was necessary to configure a certain concentration of the glue before making experimental samples. There are many types of glue for painting, and the choice of them varies depending on the region. The glue produced by Jiang Sixutang was selected for the study and used as the following steps. Firstly, the desired amount of glue was soaked four times with cold water, and then, hot water at about 80 °C was added six times after it had expanded.

Sample Design

In this study, the sample block of pigment was designed to be a size of 4 cm × 4 cm to ensure a sufficient space for spectral data collection. The Raw Xuan type of paper from Rongbaozhai, with no aluminum on the surface, was selected as a base material to reduce the influence on spectrum. Most samples were painted in one time, two times, and three times with a brush to get three different thickness of pigments to ensure that the absorption characteristics of pigment components can also be observed as the thickness of the samples changed. Part of the sample blocks of glued pigments are shown in Figure 3.

2.2.2. The Instruments for Data Collection

The instrument used to acquire the spectral data was Analytical Spectral Devices (ASD) FieldSpec4 portable spectroradiometer, whose specific parameters were shown in Table 2. The data collection was carried out in a dark room to avoid the interference from all external light sources. Two halogen lamps, which can provide a source of light that is closest to sunlight, were chosen as an artificial light source for spectral data collection. In the study, if the region of interest (ROI) was large enough, the spectra would be collected by using the well-sealed probe and the internal halogen light source provided by the probe would be used for illumination. Otherwise, the fibers would be directly taken out for data collection and two halogen lamps would be used for illumination, such as the data collection in field. It is necessary to measure each sample multiple times and the data are averaged as a standard spectral curve in order to prevent external light sources and reduce operational errors.
The instrument used for auxiliary verification about the reliability of spectral identification results was a portable XRF of XL3T900 with CCD camera, which can be performed for more than 40 kinds of elements analyses. In this study, the portable XRF was used to test the same region of interest collected by ASD, using the soil model, and the acquisition time of each point is 60 s.

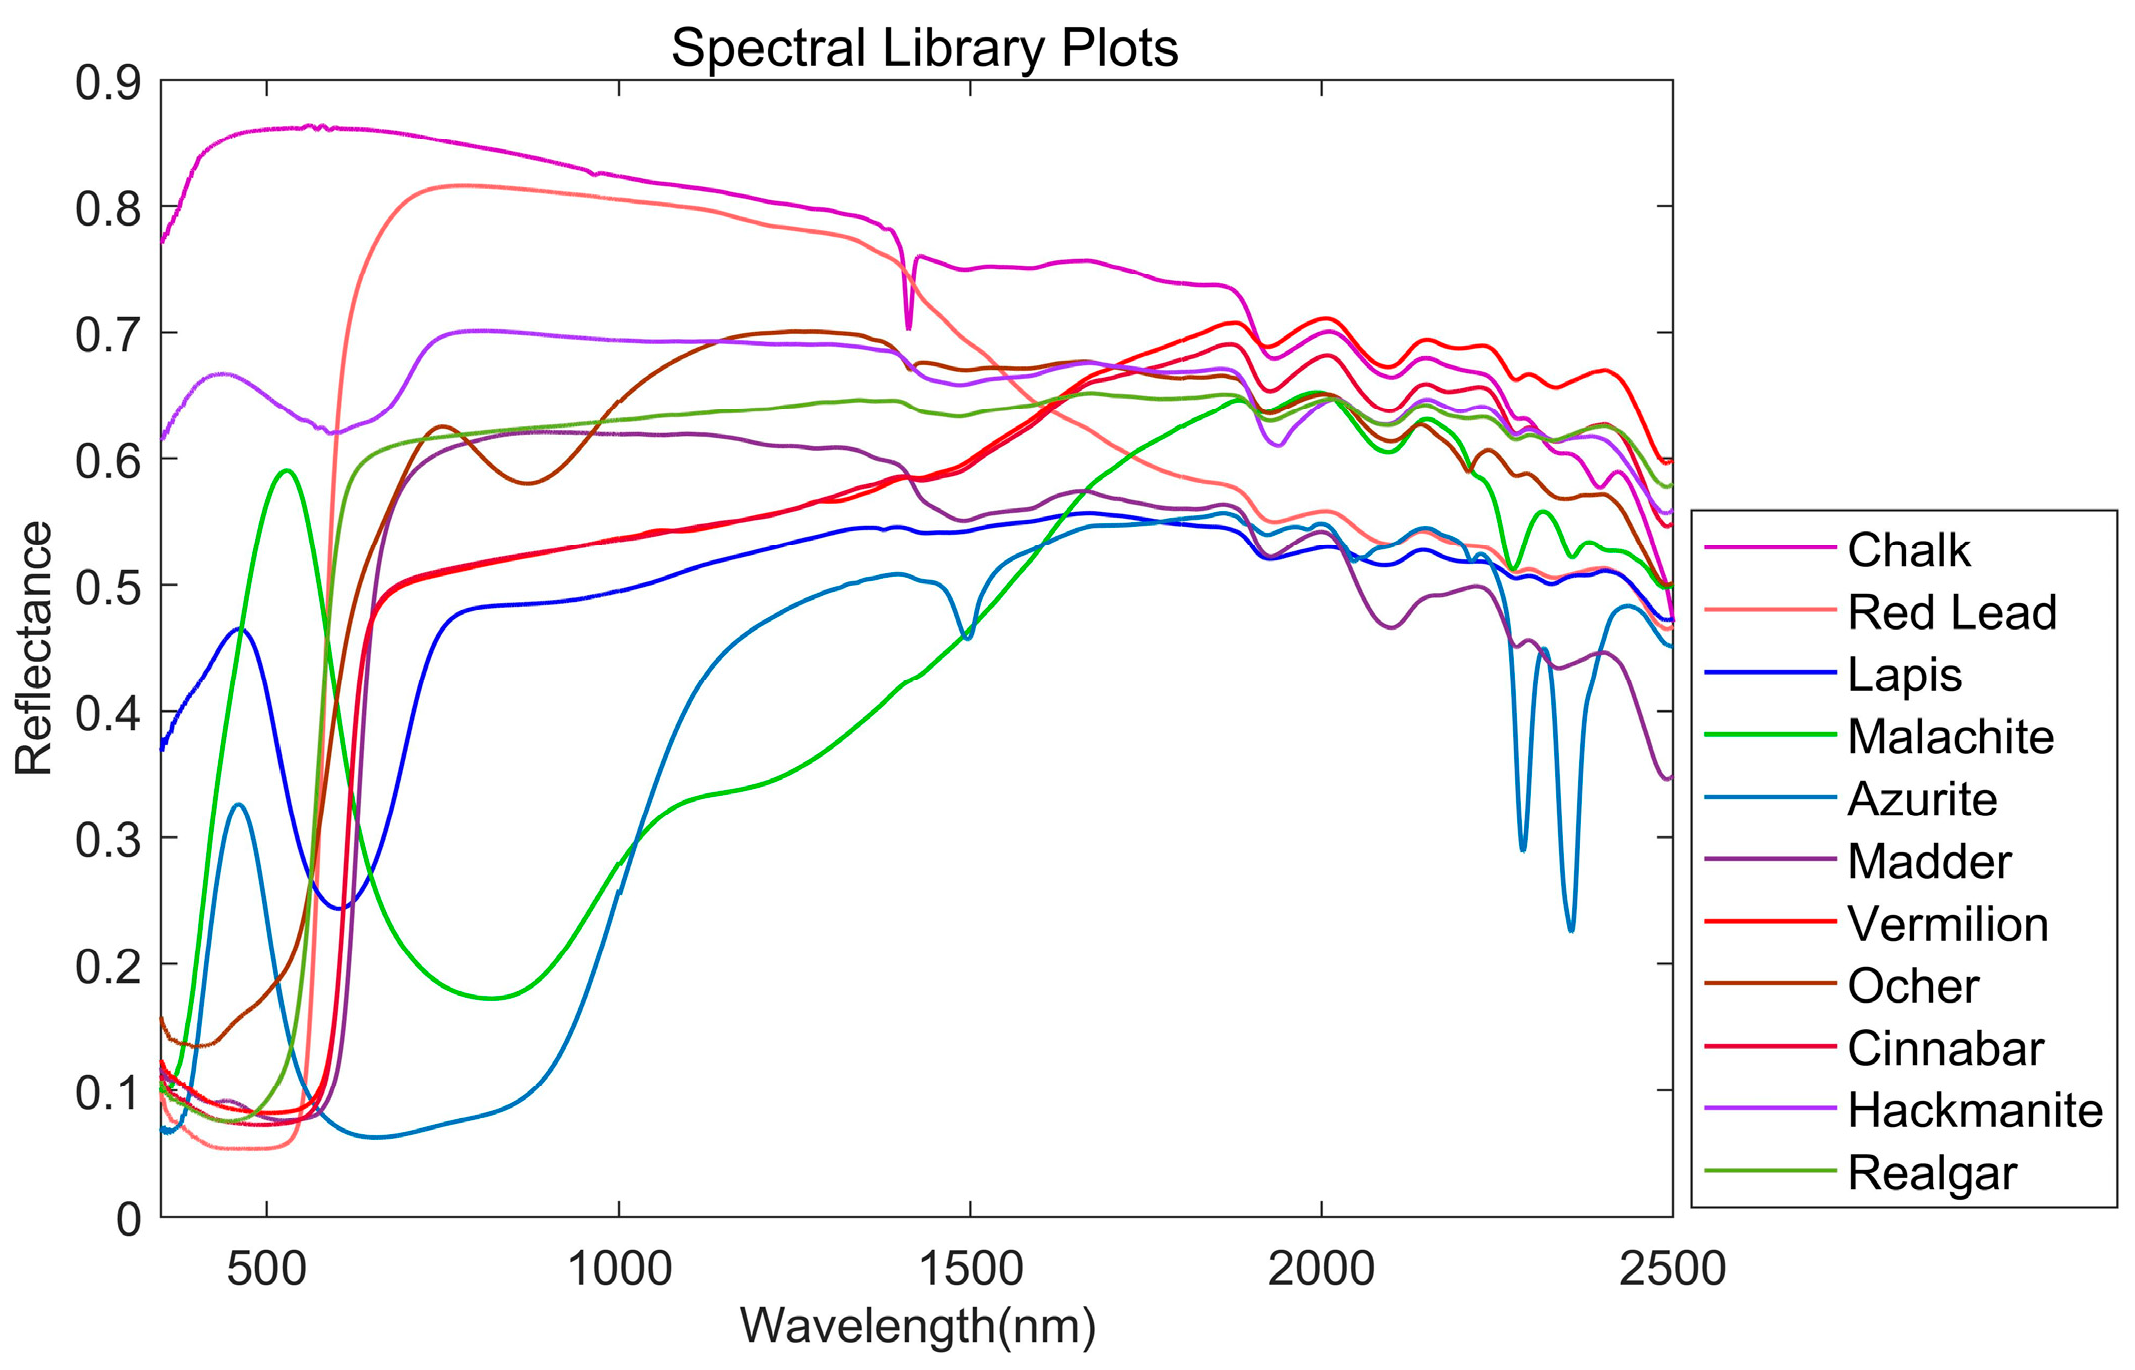
2.2.3. The Typical Pigment Spectral Library

In the study, a typical pigment spectral library was built by the spectral data collected on the laboratory pigment samples, which was the basis for identifying pigment types on painting surfaces. It contained 32 kinds of pigments, 95 spectra in total, some of which are shown in Figure 4. Most of the pigments had a thickness of one layer, two layers, and three layers, while the Alum and Azurite (piece) were only painted with one layer.

2.3. Typical Ion Absorption Positions of Pigments

As per the investigation of the absorption position of main ions and function groups contained in commonly used pigment [35,38], a complete summary is shown in Table 3.
According to the absorption positions summarized in Table 3, it can be found that the main cations include Cu2+, Fe2+, Fe3+, and Hg+, whose absorption positions generally appear before the wavelength of 1000 nm. The main functional groups are CO32− and OH, whose absorption positions generally appear after the wavelength of 1000 nm. It is further subdivided and defined as the detection range for the spectral subsection identification method. The first range is for cations detection, including 350–550 nm, 600–900 nm, and 700–1120 nm. Another one is for functional group detection, including 1400–1600 nm and 2300–2400 nm.

2.4. SAI and SAM

SAI is a comprehensive spectral absorption characteristic parameter. It was first proposed by Wang et al. and applied in extracting mineral composition from hyperspectral image [39]. The specific description is shown in Figure 5 and Equations (1)–(3).
W = λ 2 λ 1 ,
d = λ 2 λ m W ,
S A I = d r 1 + ( 1 d ) r 2 r m ,
where λ1, λ2, and λm are the wavelength of the point S1, S2, and M, W is the width of the absorption feature, d is the symmetry of the absorption feature, r1, r2, and rm are the reflectance of the point S1, S2, and M, and SAI reflects the relative depth characteristics of the spectrum.
In the SAM method, the spectral curve of n bands is considered as a n-dimensional vector. Generally, the cosine of the angle between two spectral vectors is calculated to evaluate the similarity between these spectra, whose range will be 0 to 1. The larger the cosine value, the more similar the spectra are.

3. Experiments and Results

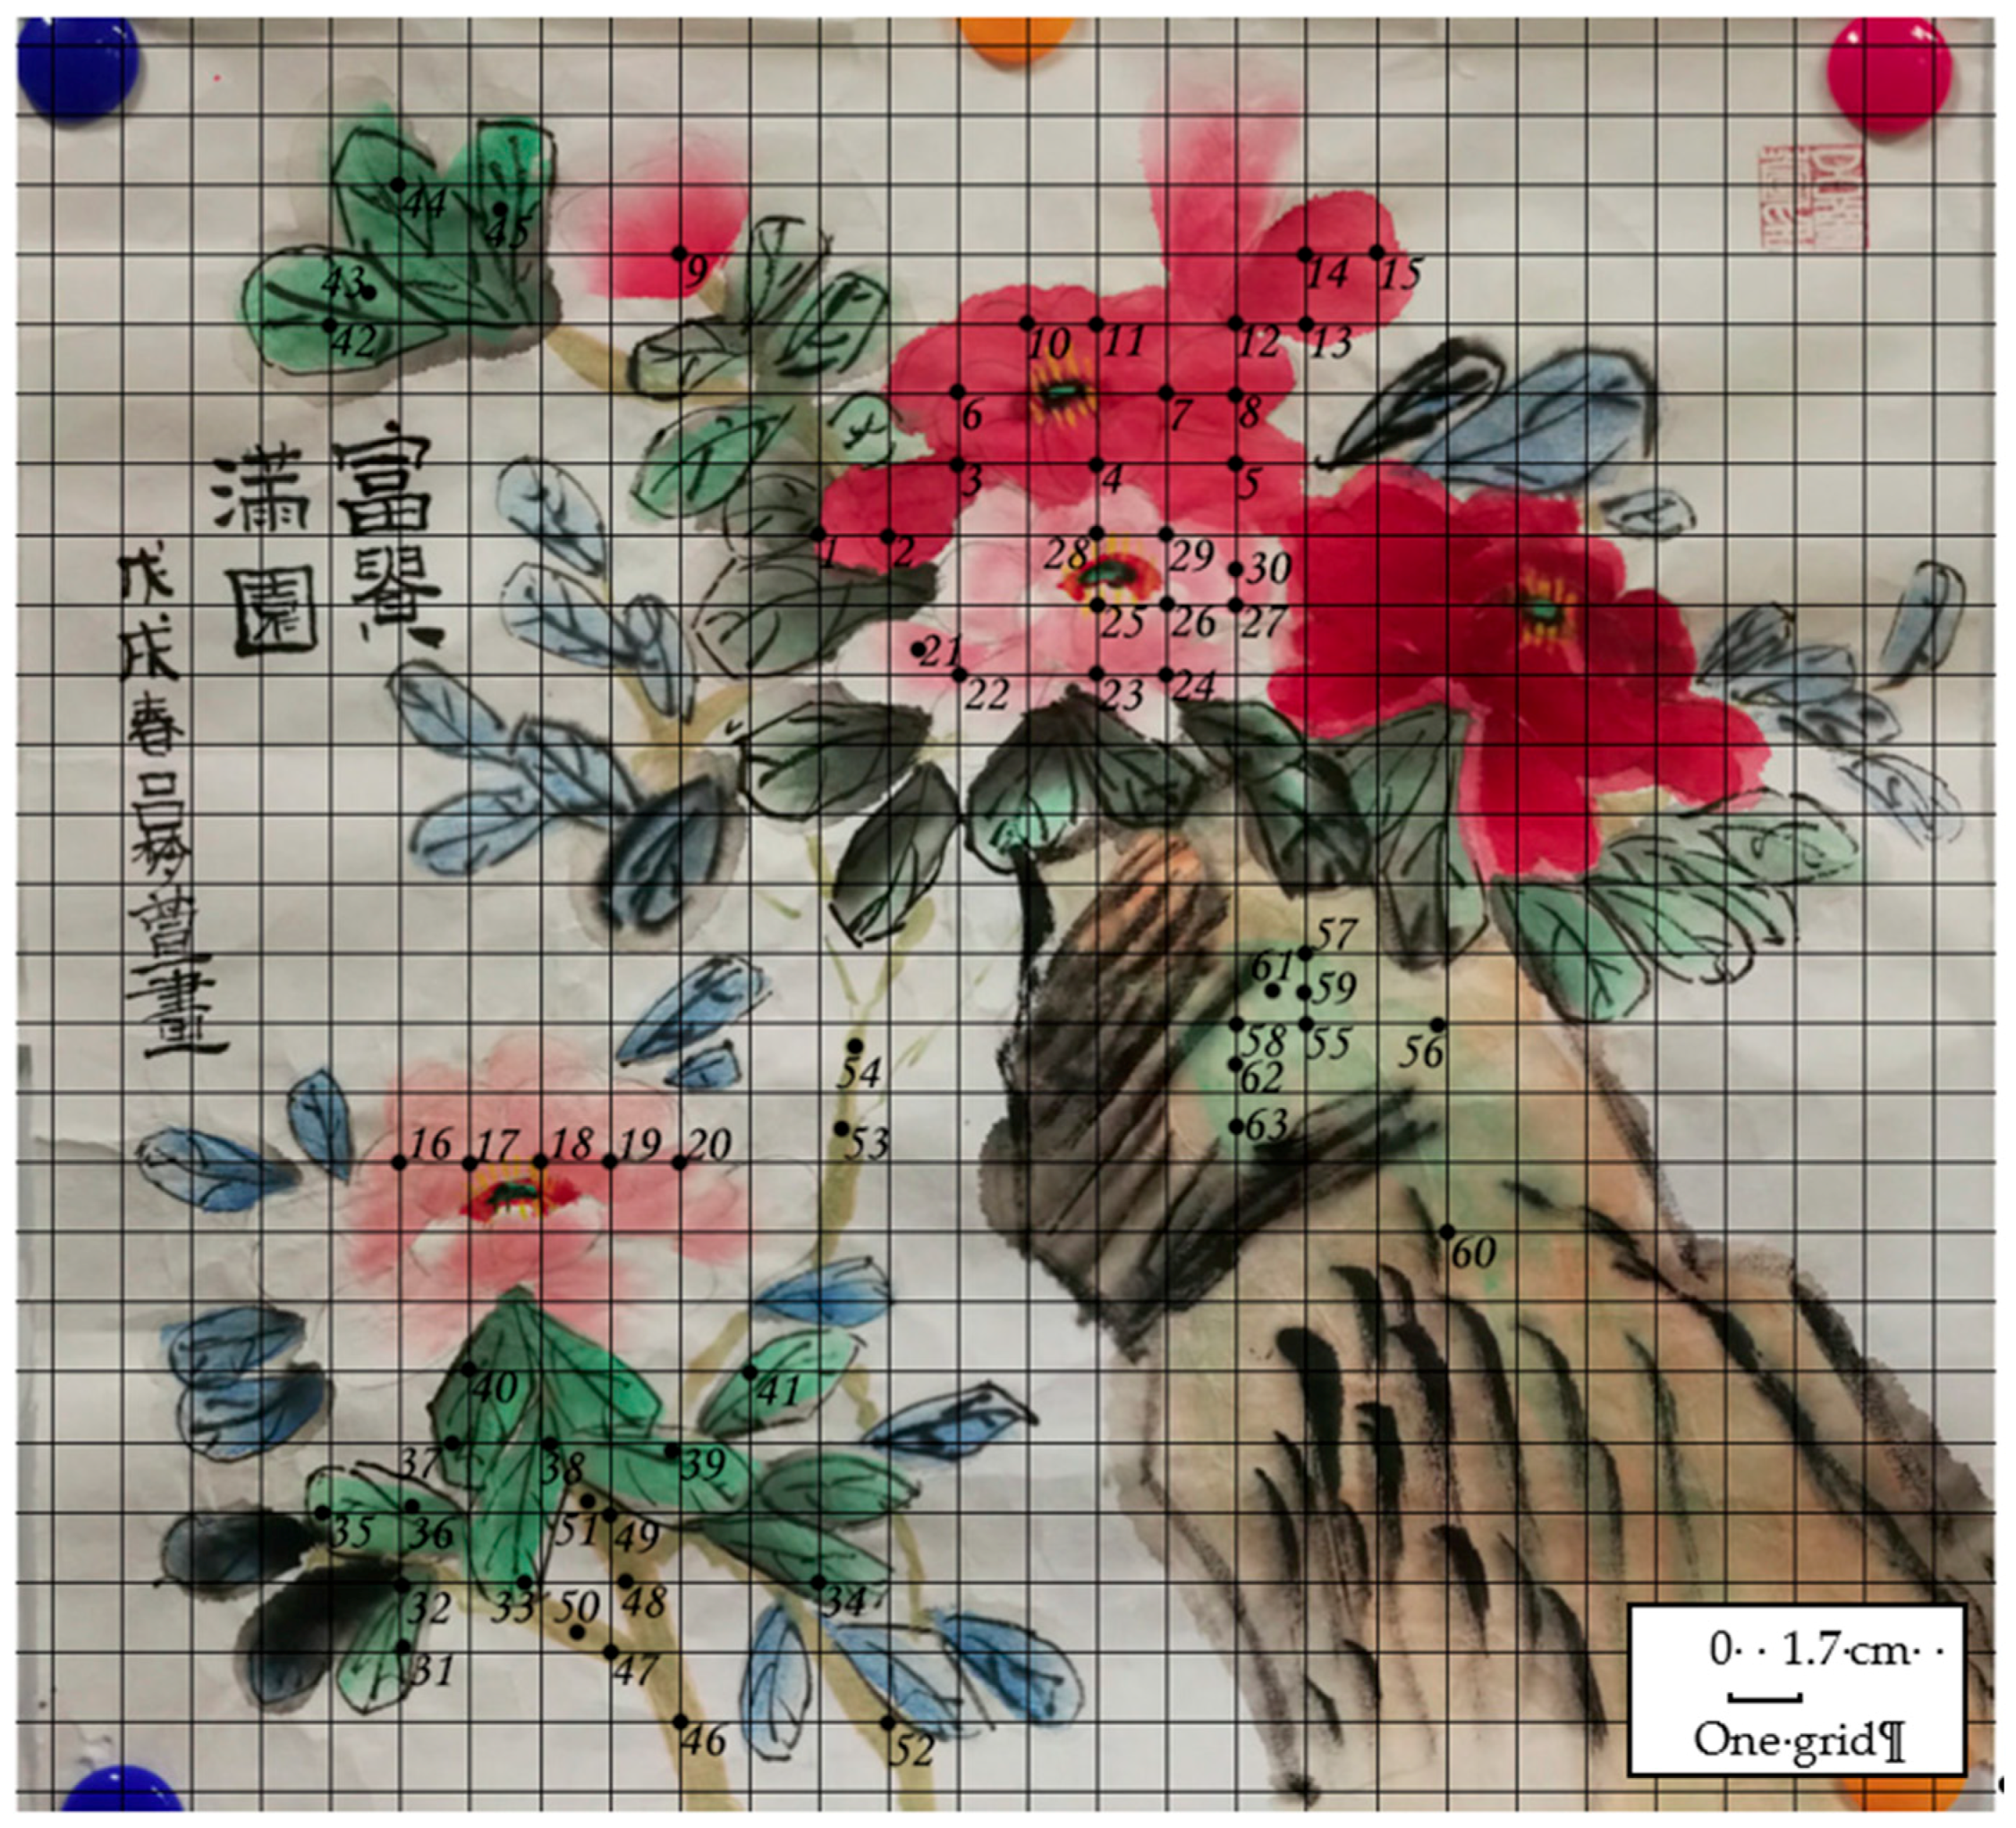
3.1. Experiment of a Chinese Painting

A Chinese painting was drawn on rice paper by using several commonly used mineral and botanical pigments. During the drawing process, the pigments used were recorded as the reference data to verify the experimental results recognized in this study.

3.1.1. Data Collection of the Chinese Painting

Several typical areas were selected on the surface of the Chinese painting, and their spectra were collected by using ASD. In order to make the sample points distributed as evenly as possible on the entire painting surface and reduce the impacts of subjective selection, a grid was drawn on the orthophoto of the painting firstly, so that the sample points can be selected at each corner point. Then, these sample points can be classified according to different groups and analyzed respectively. Due to the randomness of the grid generation, in the line-by-line spectral acquisition process, if there was less pigment at the intersection or the mixing was too complicated, some points could be ignored or replaced by others that were more suitable and closer to them.
The specific sample points are shown in Figure 6. According to the different colors, these points are divided into five groups, named C1, C2, C3, C4, and C5, listed in Table 4. The data collection environment of the Chinese painting is consistent with the condition of spectral library establishment, which has been described in Section 2.2.2.

3.1.2. Pigment Identification of the Chinese Painting Using Two Methods

Take the red region C1 as an example, where 15 spectra were collected. According to the method mentioned above, three characteristic subsections were determined for the SSI method. Moreover, weights were assigned in order of ranking. The results and weights of each subsection are listed in Table 5. In order to simplify the table, only the numerator of the weight was written after each pigment name (Underlined and bolded), and the denominator, which was 9 (m = 3) in this set of data, was omitted. For example, the top three identification results of the first characteristic subsection of the point 1 are eosin, crimson, and cyan, with the weights given as 3/9, 2/9, and 1/9, respectively. It should be noted that the large fraction here means that the spectrum of the corresponding pigment is more similar to the unknown spectrum in this subsection. The weighted index in the last line is calculated by accumulating the scores in each subsection for all the 15 spectra, followed by averaging (divided by the number of spectra, which is 15 here).
It should be noted that the weighted index of a pigment describes the possibility of the existence of the pigment at the test point of the painting. At the same time, it also indicates the content of the pigment to some extent. Therefore, except for the first pigment, the second, and even the third pigment might be picked out as the identification results, depending on the values of their index. The pigment would be regarded as one of the identification results if its index is greater than a given threshold. In identification of the Chinese painting, thresholds depend on the mean value of the weighted index of each region as in Equations (4) and (5):
W m e a n , i = W i K i
W m e a n = i = 1 N W m e a n , i N
where W m e a n , i is the weight index mean for the ith point for a region in the Chinese painting, W i is the sum of weights of pigment for the ith point in this region, K i is the kind number of pigments for the ith point in the region, N is the total number of points in this region, and W m e a n is the mean value of W m e a n , i for N points in the region.
In the pigment identification experiment for the Chinese painting, the W m e a n of each region is selected as the threshold. According to Equations (4) and (5), the thresholds of the five regions of the Chinese painting were calculated and given in Table 6.
The identification results of C1 around the threshold are sorted in descending order of weight index as eosin (0.778), crimson (0.356), and cyan (0.304). Combined with the colors presented in this area and the threshold, the mixed pigments in this area are the most likely to contain eosin pigment, followed by crimson.
In order to make the results more intuitive and clearer, the results in each subsection of all spectra are not listed. The final identification results of the five regions and the weighted indices are directly listed in Table 7.
The pigments used in the same five regions of the Chinese painting were also identified by the traditional method of SAM, spectral features match, and binary encoding match in software ENVI. The whole spectral curves were matched with the spectral library built in this study. The weights for each algorithm were set to be 1 and the top three pigments were selected as the results in Table 7.

3.1.3. Comparison of the Identification between the Two Methods in the Chinese Painting

The identification results using two methods in the five regions of Chinese painting are listed in Table 7. The results that meet the threshold of SSI method in each area are bolded in the second column, the top three results of traditional matching methods are listed in the third column, and the truth value recording when the Chinese painting is drawn are listed in the last column.
The results identified by the SSI method and traditional method can be described as follows:
C1 was painted with pigments of eosin, crimson, and madder according to the record. The eosin and crimson were identified correctly both by SSI and traditional one, while the pigment madder was missed by the approach proposed.
C2 was painted with pigments of crimson and clam meal. Both SSI and the traditional method correctly identified the crimson, but neither identified the clam white.
C3 was painted with pigments of malachite and ink, which were correctly identified by using traditional method, while the ink was missed by using SSI method.
C4 was painted with pigments of ocher and malachite. The pigments contained in the region were correctly identified by using the SSI method, but the ocher was missed by the traditional one.
C5 was painted with pigments of malachite and ocher, which are correctly identified by using SSI method, while the ocher was missed by using the traditional method.

3.2. Experiment of a Fresco

The Qutan Temple, which is located in Ledu county, Qinghai province, China, was built in 1392. The huge colorful frescoes, most of them painted by the royal painters in the Ming and Qing Dynasties, are the precious treasure of Qutan Temple. In this study, the spectral data of a small test area located in the west corridor of the Qutan Temple was used to study the applicability of the SSI method for pigment determination. The tradition identification method was also used for comparison. Then, the reliability of identification results was verified by XRF.

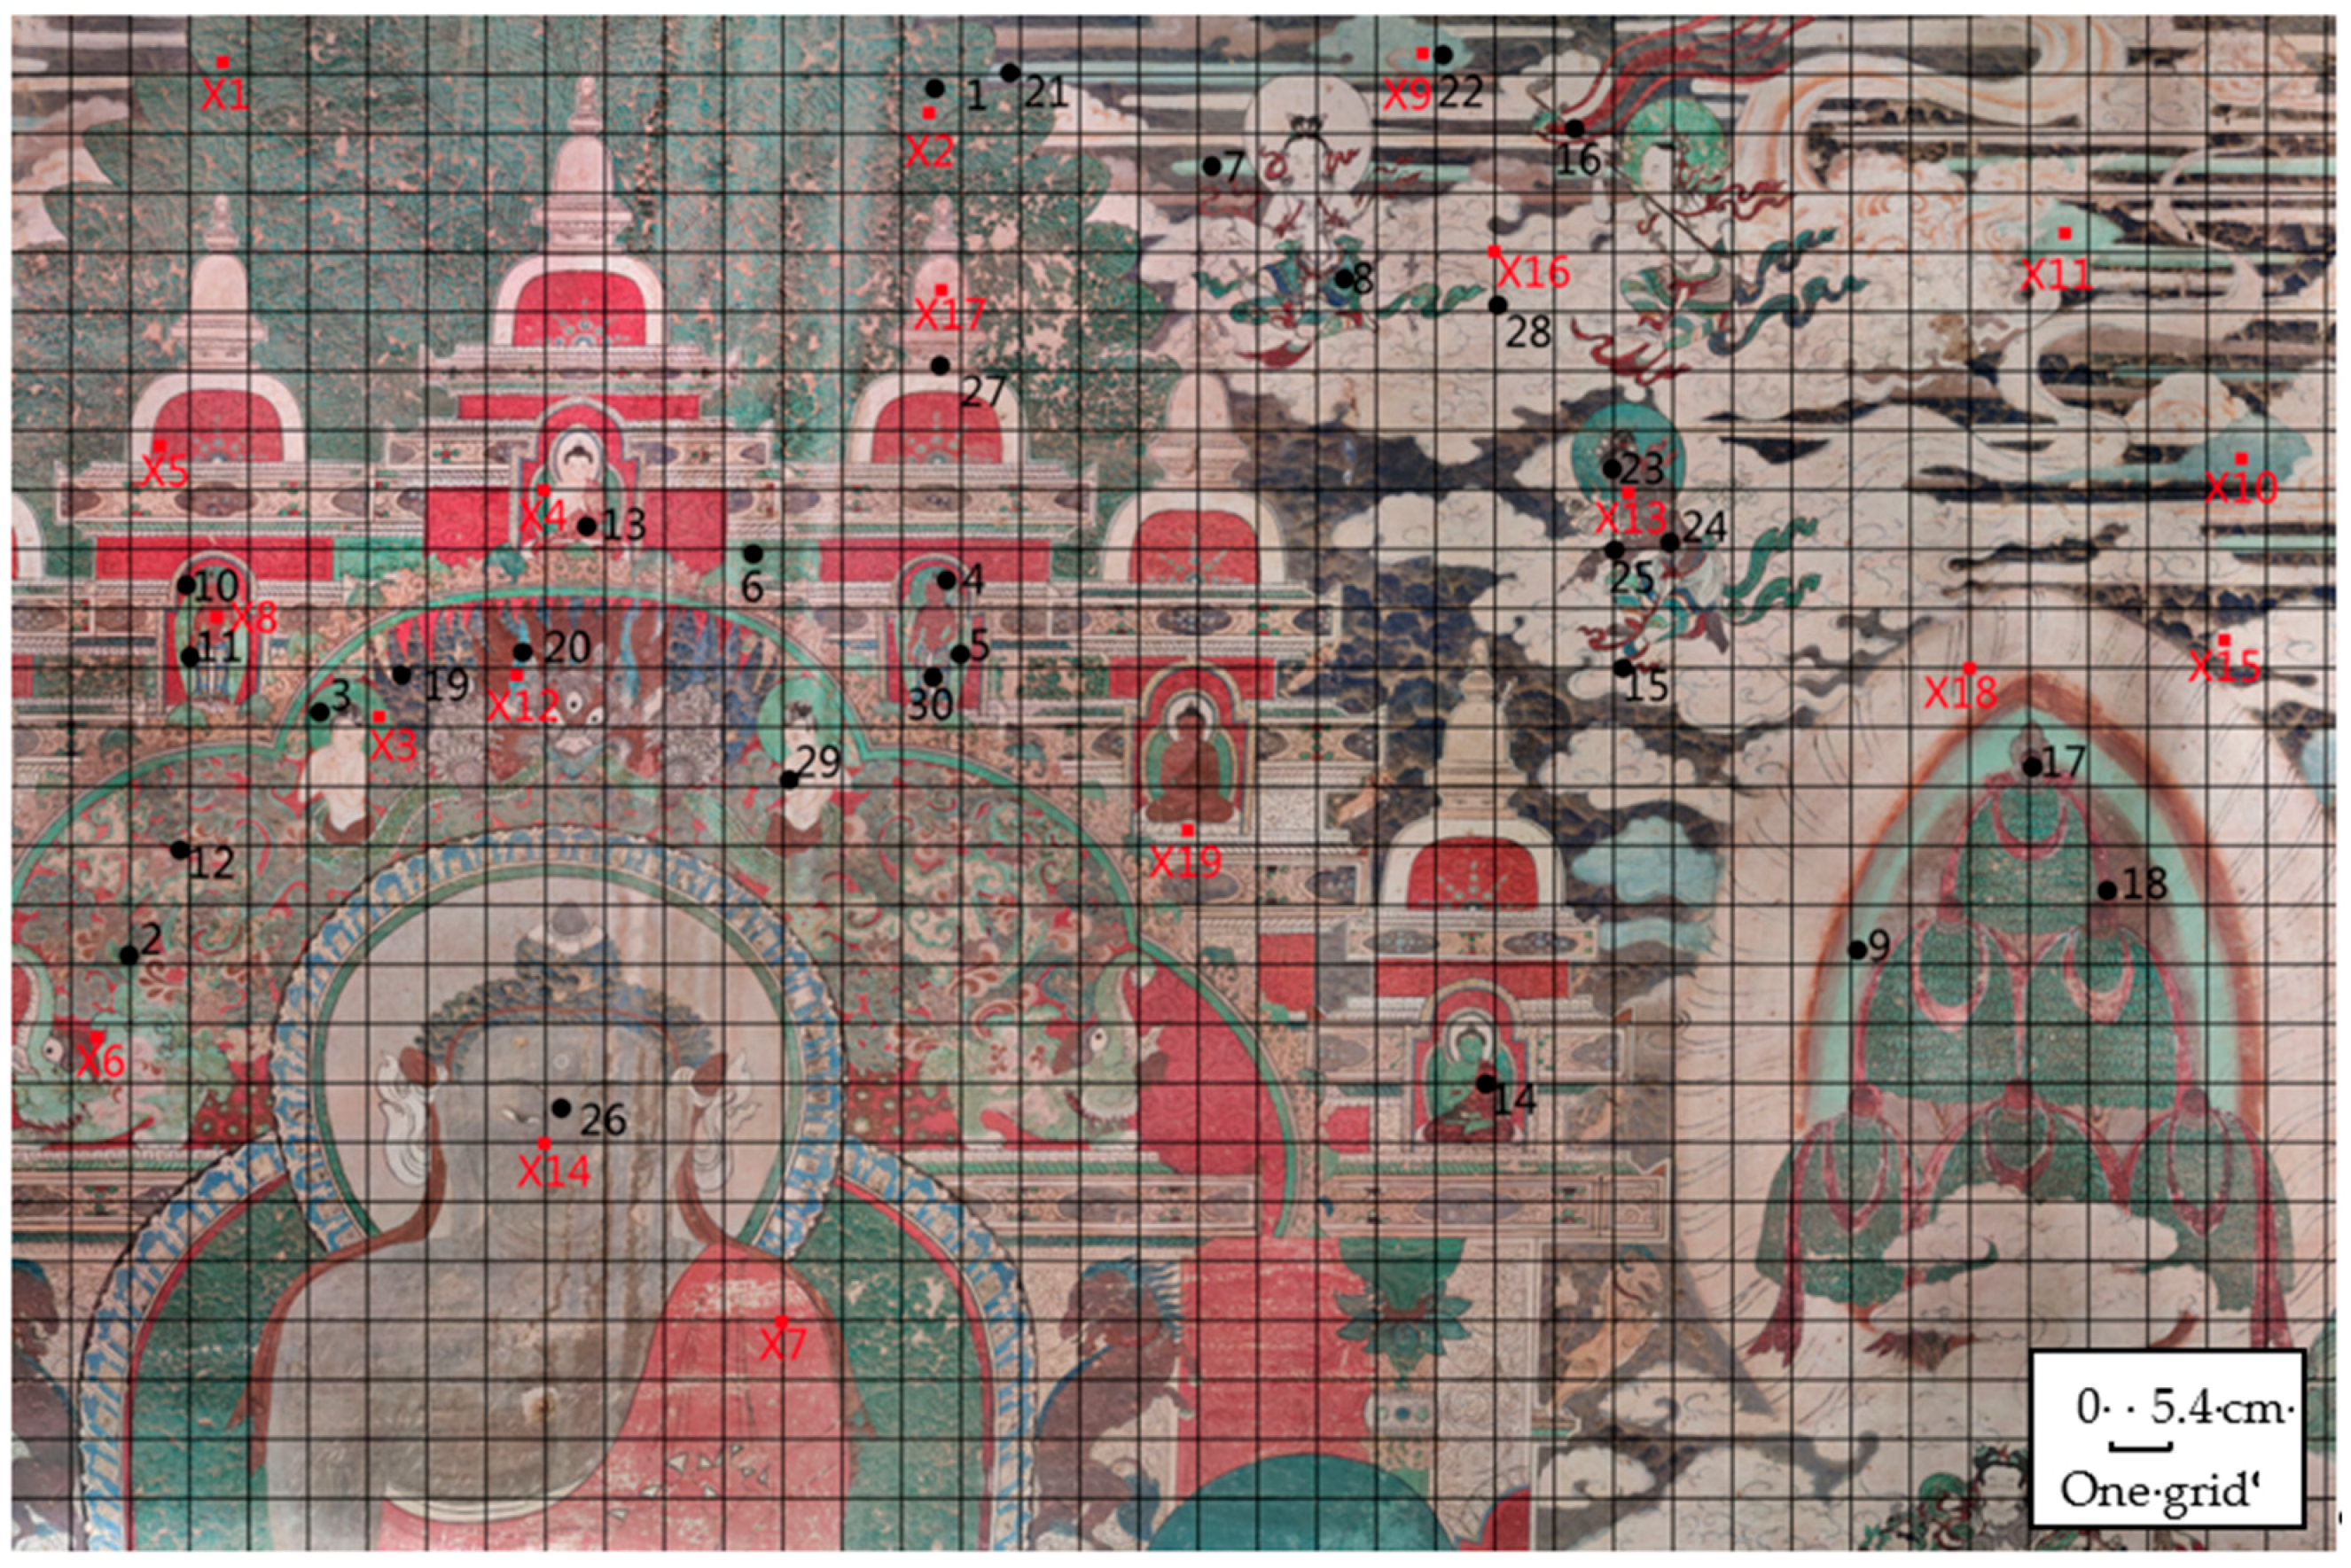
3.2.1. Data Collection of the Fresco

Due to the large size of the fresco, it is difficult to perform spectra collection of all points on the fresco using an ASD spectroradiometer. Instead, several typical pigment areas were selected for study. A grid was drawn on the orthophoto of the fresco before data collection, and five regions of interest were selected as F1-5, where a total of 30 spectral data were collected. Their specific location and detailed information are shown in Figure 7 (black points) and Table 8. As the fresco is located in the corridor on the west side of the temple, which is basically in a dark environment, it is necessary to use two halogen lamps for illumination, and to take out the optical fibers and connect them with the pistol handle for measurement.
Due to the long history of the fresco, it is impossible to obtain recordings or test results of the actual pigments used. Therefore, the portable XRF was used to detect the energy level of elements in each region. A total of 19 test points was collected for five regions, of which the specific location and detailed information are shown in Figure 7 (red points) and Table 8. The high-energy elements detected at each test point and their corresponding values are listed in Table 9. Among them, the elements with energy higher than 10,000 (kev) are bolded. In order to distinguish the difference in the energy level of each element detected, in Table 9, “++” and “+” are used to indicate that its energy is at a 100,000 and 10,000 level, respectively. The recognition ability analysis of the two methods can be performed by comparing the elements detection results with the chemical composition of the spectral identification result.
Since XRF can only provide the type of element contained in pigment, it is hard to distinguish those different pigments containing the same ions by XRF. However, it can still be used as an auxiliary method to provide certain information reference for fresco data without truth value.

3.2.2. Pigment Identification of Fresco Using Two Methods

Take the green region F1 of the fresco as an example, where nine spectra were collected for pigment identification. According to the steps mentioned in Section 2.1, four characteristic subsections were determined to perform SSI method. Moreover, weights were assigned in order of ranking. As shown in Table 10, the numerator of the weight that was also written after each pigment name (underlined and bolded), and the denominator, which was 12 (m = 4) in this set of data, was omitted.
Similar to the above Chinese painting pigment identification experiment, in addition to the pigment with the highest index, the second or third ranked according to the threshold value may also be selected as the identification result. Considering that the fresco is located in a more complex environment, with older history, and the use of pigments is more diverse, the threshold of the fresco is set lower than that for Chinese painting pigment identification in a more relaxed condition. Therefore, the threshold for each region in the fresco will be calculated by Equation (6). The thresholds for five regions are listed in Table 11.
T F j = W m e a n σ j ,
where T F j is the threshold of the jth region in the fresco, W m e a n is mean of W m e a n , i as mentioned in Equation (4), σ is the standard deviation of W m e a n , i for each region, and j is the number of regions (j = 1, 2, 3, 4, 5).
The identification results of F1 around the threshold are sorted in descending order of weight index in the last line of Table 9. It can be seen that the result with the highest weighted index in region F1 is malachite (0.769), followed by chalk (0.250), which are larger than the threshold. Therefore, these two are kept and the rest of are excluded from the final result. Combined with the colors presented in this area, the final identification result can be described as: the mixed pigments in region F1 are most likely to contain malachite, and may also exist a certain amount of chalk.
The final identification results of the five regions and their weighted indices are listed in Table 12. In addition, similar to the Chinese painting experiment, the pigments used in the same five regions of fresco are also identified by traditional method. The top three pigments are selected to show the results.

3.2.3. Comparison of Identification between Two Methods in the Fresco

In Table 12, the results that meet the threshold of SSI method, and the topic three results of traditional method in each area are listed in the second and third column, respectively. Moreover, the elements with energies higher than 10,000 detected by using XRF are listed in the last column. The XRF results are approximated as the truth value, and the pigment composition elements, which are correctly identified by the two methods, are in bold to facilitate comparison.
Note: Vermilion, cinnabar, and zinnober are all red pigments based on HgS. Vermilion is a synthetic pigment, which is not stable. Both cinnabar and zinnober are natural mineral pigments containing HgS. According to their particle size, they can be divided into cinnabar and zinnober. Their color is slightly different. The color of zinnober is red and yellow, which is lighter and more delicate than that of cinnabar.
The results identified by the SSI method and traditional method can be described as follows:
F1 may have the Cu and Ca element according to the XRF results. Both SSI and the traditional method correctly identified pigments containing these two elements.
F2 may have three elements, including the S, Hg, and Ca elements, according to XRF results. The SSI method correctly identified all of these elements, while the Ca was missed by using the tradition method.
F3 may have the mixed pigments containing S, Cu, and Pb. Both of the two methods correctly identified the pigments containing Cu, but missed the other two elements.
F4 may have four kinds of elements, including S, Pb, Ca, and Cu. The SSI method correctly identified three of them but missed the Cu in the final result. Only one kind of pigment containing the S element was identified by the traditional method.
F5 may be a mixture containing the S, Pb, and Ca elements according to XRF results. Both SSI and the traditional method correctly identified pigments containing the Pb and Ca. While they missed the S in the final result.
It should be noted that high-energy Ca elements were detected in some regions, including F1, F2, F4, and F5, which may be caused by the presence of white pigments containing Ca in the mixture, or the base materials of the fresco were collected during the test.
Significantly, Wang et al. [40] collected 22 painting pigment samples from the gallery and architectural painting of Qutan Temple in Qinghai Province. They were analyzed by radioisotopic XRF and XFD and more than 20 kinds of inorganic mineral pigments were recognized. The results are summarized in Table 13 according to their colors. It can be seen that the pigments are basically consistent with that detected by XRF in this study.

4. Discussion

In this paper, some typical points of interest on a Chinese painting and a fresco were performed using the SSI method and the traditional method, respectively, to determine the type of pigment in these mixed regions. In addition, for the identification of pure samples, we have also performed rigorous experiments and confirmed that the two methods have the same ability to identify pure mineral pigments with the same accuracy rate of 100%. Based on the consideration that the overall research focuses on identifying the type of pigment in mixed area, the experiment of pure samples identification as well as the results are not included in this paper.
Based on the final identification results of the two methods, and combined with the known truth value of pigments or the XRF results, the accuracy of the two methods were calculated in Table 14. Specifically, the accuracy of the Top 3 using the SSI method was obtained by dividing the number of pigments that be correctly identified by the number of actually used at that region, while the Top 3 using the traditional method were calculated by dividing the number of correctly identified element types by the number of elements with above 10,000 kev energy detected by XRF in the same area. The correctness of the first matching result and the correct rate of the top three matching results are used to evaluate the two methods.
In the Chinese painting experiment, the pigments used during the drawing process were recorded as the truth value. Therefore, through comparing with the result of the SSI method, it can be summarized as follows:
(1)
By using the SSI method, the correct rate of the first result in the five regions is 100.0%, and of the top three results 73.4%. Combined with the results of Chinese painting in Table 7, this method has limited ability to identify white and black pigments. Nevertheless, the first result obtained by this method is reliable, and the top three results can correctly identify the main components in the mixed area on the surface of Chinese painting.
(2)
Through applying the traditional method, the correct rate of the first result is 80.0%, and of the top three results 70.0%, which are lower than for the SSI method. Moreover, combined with the results presented in Table 7, the traditional method missed the ocher and white pigments in each mixed area.
In the fresco experiment, there were no recordings or test results about the actual pigments used due to its long history. Therefore, the XRF results of each ROI were used for qualitative analysis of mixture’s components in this paper. It should be noted that, with the limitation of the instrument, only the elements detected by XRF can be used to assist in verifying the identification ability of the proposed method. The instrument can only provide the energy ranking of the commonly used elements contained in the test regions. Therefore, it is difficult to distinguish different pigments with the same element composition, and it is hard to know the possibility of botanical pigments in the mixture. Nevertheless, it can still be used as a means of auxiliary analysis to provide a certain information reference for fresco data without truth values:
(1)
By using the SSI method, the correct rate of the first result in the five regions is 100.0%, and of the top three results 75.0%. Combined with the identification results of the fresco (in Table 12) and the color of each ROI (in Table 8), the first result obtained by using SSI method is reliable.
(2)
By using the traditional method, the correct rate of the first result is 60.0%, and of the top three results 58.4%. It can be seen that the accuracy of the traditional method is also lower than that of the SSI method, even for the fresco.
From the above discussion, it can be concluded that the SSI method can detect the main components contained in the area where multiple pigments are mixed, and the identification result is also consistent with the visual color presented in the area. However, there was some trouble in identifying white and black pigments according to the experiment results of Chinese painting. The possible reason is that the key of the SSI method is to identify the type of pigment in the mixture based on the absorption position of the ion contained in the mineral pigment. However, the black pigment used in the Chinese painting experiment in this paper is ink, of which main component is carbon. It is not a mineral pigment, and its spectral characteristics are not obvious. Therefore, it is difficult to detect out by using the SSI method. On the other hand, according to the use records of Chinese painting pigments, the use of white pigments in the C2 region (the ROI of Chinese painting) is small, which may be the reason why white pigments are not detected by the SSI method. Moreover, it is hard to verify whether there are botanical pigments in the mixture, or to distinguish whether the Ca element in the XRF results is from white pigment or the base material due to the instrument limitations in the fresco experiment. Nevertheless, in general, based on the truth records and the qualitative analysis from the XRF detection results, it can be seen that the SSI method has better performance on identifying multiple typical components in mixed region than the traditional method.

5. Conclusions

In the study, a typical pigment spectral library is established based on the pigment samples in laboratory. Then, a spectral subsection identification of pigments considering ion absorption characteristics, which divides spectrum into several characteristic subsections based on the main ion absorption position of each pigment, is proposed for determining the pigment type. Furthermore, it is applied to a Chinese painting and a fresco to test the applicability, and the traditional method is also used for comparison.
It can be concluded that the first result obtained by the proposed method can correctly identify the main pigment or component contained in the mixed region, and compared with the traditional method, it can also provide a more complete and more accurate result. The accuracy of the pigment identified by SSI is higher than the traditional method both in the Chinese painting and the fresco experiment.
According to a suitable threshold depending on weighted index, the SSI method can even provide a second or a third pigment identified in a simpler way than the unmixing method. It is better than the conventional identification method that can match only one pigment at a time, and its complexity lies in the traditional method of pigment recognition and spectral unmixing method, which can get more than one pigments at one time for a single point.
However, the proposed method has some limitations in detecting white and black pigments, so that some of the processes may need to be further refined to show a more significant identification advantage. In addition, the proposed method is carried out on the identification of one-dimensional spectral data in this paper. How effective the method is for hyperspectral images, which cannot be ignored, will be further studied.

Author Contributions

Conceptualization, Y.L., S.L., and M.H.; methodology, Y.L. and S.L.; validation, Y.L., Z.G., W.W., and X.Z.; formal analysis, Y.L., S.L., and X.Z.; resources, W.W.; writing—original draft preparation; writing—review, all authors. All authors have read and agreed to the published version of the manuscript.

Funding

This work was supported by the Research Fund of the National Key Research and Development Program (No. 2017YFB1402105), the Great Wall Scholars Training Program Project of Beijing Municipality Universities (No. CIT&TCD20180322), and the Independent Project of Chinese Academy of Cultural Heritage (No. 2018JBKY13).

Acknowledgments

The authors would like to thank Songnian Li from Ryerson University, Canada for his constructive comments on the preparation and many rounds of revisions of the paper and guidance during the research.

Conflicts of Interest

The authors declare no conflict of interest.

References

  1. Platania, E.; Streeton, N.L.; Lluverastenorio, A.; Vila, A.; Buti, D.; Caruso, F.; Kutzke, H.; Karlsson, A.; Colombini, M.P.; Uggerud, E. Identification of green pigments and binders in late medieval painted wings from Norwegian churches. Microchem. J. 2020, 156, 104811. [Google Scholar] [CrossRef]
  2. Berrie, B.H.; Leona, M.; Mclaughlin, R. Unusual pigments found in a painting by Giotto (c. 1266–1337) reveal diversity of materials used by medieval artists. Herit. Sci. 2016, 4, 1. [Google Scholar] [CrossRef] [Green Version]
  3. Fanost, A.; Gimat, A.; de Viguerie, L.; Martinetto, P.; Giot, A.C.; Clémancey, M.; Blondin, G.; Gaslain, F.; Glanville, H.; Walter, P.; et al. Revisiting the identification of commercial and historical green earth pigments. Colloids Surf A Physicochem. Eng. Asp. 2020, 584, 124035. [Google Scholar] [CrossRef]
  4. Miliani, C.; Rosi, F.; Burnstock, A.; Brunetti, B.G.; Sgamellotti, A. Non-invasive in-situ investigations versus micro-sampling: A comparative study on a Renoirs painting. Appl. Phys. 2007, 89, 849–856. [Google Scholar] [CrossRef]
  5. Bacci, M.; Fabbri, M.; Picollo, M.; Porcinai, S. Non-invasive fibre optic Fourier transform-infrared reflectance spectroscopy on painted layers: Identification of materials by means of principal component analysis and Mahalanobis distance. Anal. Chim. Acta 2001, 446, 15–21. [Google Scholar] [CrossRef]
  6. Casadio, F.; Leona, M.; Lombardi, J.R.; van Duyne, R. Identification of organic colorants in fibers, paints, and glazes by surface enhanced Raman spectroscopy. Acc. Chem. Res. 2010, 43, 782–791. [Google Scholar] [CrossRef]
  7. Bacci, M. Fibre optics applications to works of art. Sens. Actuators 1995, 29, 190–196. [Google Scholar] [CrossRef]
  8. Camaiti, M.; Benvenuti, M.; Costagliola, P.; di Benedetto, F.; del Ventisette, C.; Garfagnoli, F.; Lombardi, L.; Moretti, S.; Pecchioni, E.; Vettori, S. Monitoring of chemical and physical characteristics of stone surfaces by a portable spectroradiometer. EGU Gen. Assem. 2013, 15, 13552. [Google Scholar]
  9. Wang, L.; Dang, G.; Zhao, J. Nondestructive analysis and identification of pigments on colored relics by fiber optic reflectance spectroscopy. Spectrosc. Spectr. Anal. 2008, 28, 1722–1725. (In Chinese) [Google Scholar]
  10. Colombo, C.; Bevilacqua, F.; Brambilla, L.; Conti, C.; Realini, M.; Striova, J.; Zerbi, G. Terracotta polychrome sculptures examined before and after their conservation work: Contributions from non-invasive in situ analytical techniques. Anal. Bioanal. Chem. 2011, 401, 757–765. [Google Scholar] [CrossRef]
  11. Thoury, M.; Delaney, J.K.; de la Rie, E.R.; Palmer, M.; Morales, K.; Krueger, J. Near-infrared luminescence of cadmium pigments: In situ identification and mapping in paintings. Appl. Spectrosc. 2011, 65, 939–951. [Google Scholar] [CrossRef] [PubMed]
  12. Cheilakou, E.; Troullinos, M.; Koui, M. Identification of pigments on Byzantine wall paintings from Crete (14th century AD) using non-invasive fiber optics diffuse reflectance spectroscopy (FORS). J. Archaeol. Sci. 2014, 41, 541–555. [Google Scholar] [CrossRef]
  13. Cucci, C.; Bartolozzi, G.; De Vita, M.; Marchiafava, V.; Picollo, M.; Casadio, F. The colors of Keith Haring: A spectroscopic study on the materials of the mural painting Tuttomondo and on reference contemporary outdoor paints. Appl. Spectrosc. 2016, 70, 186. [Google Scholar] [CrossRef] [PubMed]
  14. Yang, L.; Huang, J.; Chen, X.; Lyu, H.; Wang, L.; Su, B. Nondestructive analysis of culture relics pigments by chemometrics combined with diffuse reflectance spectroscopy. J. Instrum. Anal. 2020, 39, 844–850. (In Chinese) [Google Scholar]
  15. Wan, Y. The analysis of mineral and rock’s hyper-spectral library. Geo Inf. Sci. 2001, 3, 54–58. (In Chinese) [Google Scholar]
  16. Kokaly, R.F.; Clark, R.N.; Swayze, G.A.; Livo, K.E.; Hoefen, T.M.; Pearson, N.C.; Wise, R.A.; Benzel, W.M.; Lowers, H.A.; Driscoll, R.L.; et al. USGS Spectral Library Version 7; US Geological Survey: Reston, VA, USA, 2017.
  17. Grove, C.I.; Hook, S.J.; Paylor, E.D., III. Laboratory Reflectance Spectra of 160 Minerals, 0.4 to 2.5 Micrometers; Jet Propulsion Laboratory: Pasadena, CA, USA, 1992.
  18. Pal, S.; Majumdar, T.; Bhattacharya, A.K.; Bhattacharyya, R. Utilization of Landsat ETM+ data for mineral-occurrences mapping over Dalma and Dhanjori, Jharkhand, India: An advanced spectral analysis approach. Int. J. Remote Sens. 2011, 32, 4023–4040. [Google Scholar] [CrossRef]
  19. Tian, Z.; Liu, S.; Fu, Y. Design and realization of spectral data management in the spectral knowledge base. IEEE Int. Geosci.Remote Sens. Symp. 2004, 7, 4410–4413. [Google Scholar]
  20. Baldridge, A.M.; Hook, S.; Grove, C.; Rivera, G. The ASTER spectral library version 2.0. Remote Sens. Environ. 2009, 113, 711–715. [Google Scholar] [CrossRef]
  21. Cosentino, A. FORS spectral database of historical pigments in different binders. E-Conserv. J. 2014, 2, 57–68. [Google Scholar] [CrossRef]
  22. Balas, C.; Epitropou, G.; Tsapras, A.; Hadjinicolaou, N. Hyperspectral imaging and spectral classification for pigment identification and mapping in paintings by El Greco and his workshop. Multimed. Tools Appl. 2018, 77, 1–15. [Google Scholar] [CrossRef]
  23. Bayarri, V.; Sebastián, M.A.; Ripoll, S. Hyperspectral imaging techniques for the study, conservation and management of rock art. Appl. Sci. 2019, 9, 5011. [Google Scholar] [CrossRef] [Green Version]
  24. Wu, T.; Li, G.; Yang, Z.; Zhang, H.; Lei, Y.; Wang, N.; Zhang, L. Shortwave infrared imaging spectroscopy for analysis of ancient paintings. Appl. Spectrosc. 2017, 71, 977. [Google Scholar] [CrossRef]
  25. Dupuis, G.; Elias, M.; Simonot, L. Pigment identification by fiber-optics diffuse reflectance spectroscopy. Appl. Spectrosc. 2002, 56, 1329–1336. [Google Scholar] [CrossRef]
  26. Shi, N.; Li, G.; Lei, E.; Wu, T. Hyperspectral imaging to Chinese paintings at the Palace Museum. Sci. Conserv. Archaeol. 2017, 29, 23–29. (In Chinese) [Google Scholar]
  27. Wang, W.; Wang, H.; Wang, K.; Wang, Z. An identification method of spectral information divergence pigment based on statistical manifold. Laser Optoelectron. Prog. 2018, 55, 416–423. (In Chinese) [Google Scholar]
  28. Zhang, J.; Rivard, B.; Sanchez-Azofeifa, A. Derivative spectral unmixing of hyperspectral data appied to mixtures of lichen and rock. IEEE Trans. Geosci. Remote Sens. 2004, 42, 1934–1940. [Google Scholar] [CrossRef]
  29. Demetriades-Shah, T.H.; Steven, M.D.; Clark, J.A. High resolution derivative spectra in remote sensing. Remote Sens. Environ. 1990, 33, 55–64. [Google Scholar] [CrossRef]
  30. Tsai, F.; Philpot, W.D. A derivative-aided hyperspectral image analysis system for land-cover classification. IEEE Trans. Geosci. Remote Sens. 2002, 40, 416–425. [Google Scholar] [CrossRef]
  31. Fonseca, B.; Patterson, C.S.; Ganio, M.; MacLennan, D.; Trentelman, K. Seeing red: Towards an improved protocol for the identification of madder and cochineal-based pigments by fiber optics reflectance spectroscopy (FORS). Herit. Sci. 2019, 7, 92. [Google Scholar] [CrossRef]
  32. Wu, F.; Yang, W.; Li, D. Research on art painting pigment composition recognition based on spectra feature fitting. J. Light Scatt. 2014, 26, 88–92. (In Chinese) [Google Scholar]
  33. Cen, Y.; Zhang, L.; Sun, X.; Zang, L.; Zhao, H.; Wang, X. Spectral analysis of main mineral pigments in Thangka. Spectrosc. Spectr. Anal. 2019, 39, 146–152. (In Chinese) [Google Scholar]
  34. Wang, K.; Wang, H.; Yin, Y.; Mao, L.; Zhang, Y. Pigment spectral matching recognition method based on adaptive edit distance. Laser Optoelectron. Progress 2018, 55, 487–494. (In Chinese) [Google Scholar]
  35. Zhang, L.; Wang, J.; Li, X.; Liu, S. A brief introduction to the standardized spectral database of typical ground objects. IEEE Int. Geosci. Remote Sens. Symp. 2004, 7, 4452–4455. [Google Scholar]
  36. Borsoi, R.A.; Imbiriba, T.; Bermudez, J.C.M.; Richard, C. Deep generative models for library augmentation in multiple endmember spectral mixture analysis. IEEE Geosci. Remote Sens. Lett. 2020, PP99, 1–5. [Google Scholar] [CrossRef]
  37. Fatemeh, F.; Saeideh, K. Identification of pigments in artworks by inverse tangent derivative of spectrum and a new filtering method. Herit. Sci. 2020. [Google Scholar] [CrossRef]
  38. Wang, J.; Zhang, L.; Liu, Q.; Zhang, B.; Yin, Q. Chinese Typical Spectrum Knowledge Base; Science Press: Beijing, China, 2009. (In Chinese) [Google Scholar]
  39. Wang, J.; Zheng, L.; Tong, Q. The spectral absorption identification model and mineral mapping by imaging spectrometer Data. Remote Sens. Environ. 1996, 11, 20–31. (In Chinese) [Google Scholar] [CrossRef] [Green Version]
  40. Wang, J.; Li, J.; Tang, J.; Xu, Z. Research on the murals pigments of Qutan Temple, Qinghai. Sci. Conserv. Archaeol. 1993, 5, 23–25. (In Chinese) [Google Scholar]
Figure 1. The overall process of the study (SSI, spectral subsection identification (SSI) method considering ion absorption characteristics; XRF, X-ray fluorescence).
Remotesensing 12 03415 g001
Figure 2. The spectral subsection identification method (SAI, Spectral Absorption Index; SAM, Spectral Angle Mapping).
Remotesensing 12 03415 g002
Figure 3. The sample blocks of glued pigments.
Remotesensing 12 03415 g003
Figure 4. Some spectra in the typical pigment spectral library.
Remotesensing 12 03415 g004
Figure 5. Parameters of Spectral Absorption Index.
Remotesensing 12 03415 g005
Figure 6. The grid and sample points on surface of the Chinese painting.
Remotesensing 12 03415 g006
Figure 7. The grid and sample points on surface of the fresco.
Remotesensing 12 03415 g007
Table 1. Pigments selected for samples making.
TypeTonePigment Name
Mineral pigmentsRedCinnabar
Zinnober
Vermilion
Ocher
YellowOrpiment1
Realgar
Orpiment2
GreenMalachite
Malachite2
Malachite3
BlueAzurite
Azurite1
Azurite2
Azurite3
Lapis
Hackmanite
WhiteChalk
Calcite
Muscovite
Clam meal
Lead white
Titanium white
Silver
Alum
BlackBiotite
Botanical and chemical pigmentsRedRed lead
Crimson
Madder
Eosin
YellowGamboge
BlueCyanine
WhiteLead white
BlackInk
Table 2. Parameters of the Analytical Spectral Device (ASD) FieldSpec4 portable spectroradiometer.
NameParameters
Spectral Range (Continuous Coverage)350–2500 nm
Spectral Bands2151
Spectral Width2.5 nm
Spectral Resolution350–1000 nm @ 3 nm;
1001–2500 nm @ 8 nm
Size12.7 × 35.6 × 29.2 cm
Weight5.44 kg
Table 3. Components and typical ion absorption position of commonly used pigments.
TonePigment NameMain ComponentAbsorption Position of Metal Cation (μm)Absorption Position of Function Group (μm)
RedCinnabarHgSHg+: 0.6
ZinnoberHgS
VermilionHgS
OcherFe2O3Fe3+: 0.9
YellowOrpiment1As2S30.55
RealgarAs4S4
Orpiment2As2S3
GreenMalachiteCuCO3·Cu(OH)2Cu2+: 0.8, Strong decline before 0.52CO32−: 2.29,2.52
BlueAzuriteCu3[CO3]2(OH)2Cu2+: 0.8, Strong decline before 0.52CO32−: 1.90,2.05,2.28;
OH: 1.45,1.95,2.35,2.50
Lapis(Na,Ca)4~8
(Al6Si6O24)
(SO4,S)1~2
Mixing of Na and other impurities: 0.6OH: 1.40;
H2O: 1.90;
Envelope water: 2.50
HackmaniteNa4(Al3Si3O12)ClMixing of Na and other impurities: 0.6H2O: 1.90
WhiteChalkCaCO3
CalciteCaCO3 CO32−: 1.88,2.00,2.16,
(2.30)2.35,(2.50)2.55
MuscoviteK2Al4(Si6Al2O20)
(OH,F)4
Fe2+: 0.44,0.9OH:1.40;
Al-O-H: 2.20,2.35,2.45
Clam mealCaO
Titanium whiteTiO2
SilverAl
AlumKAl3(SO4)2(OH)6 OH: 1.01,1.35,1.45,1.78,2.00,2.17,2.33,2.50
BlackBiotiteK(Mg,Fe)3AlSi3O10(F,OH)2 OH:1.40
Table 4. The five regions of the Chinese painting.
RegionsTypical ColorName of PointsNumber of Data
C1 Remotesensing 12 03415 i0011–1515
C2 Remotesensing 12 03415 i00216–3015
C3 Remotesensing 12 03415 i00331–4515
C4 Remotesensing 12 03415 i00446–549
C5 Remotesensing 12 03415 i00555–639
Table 5. The identification results and weights of each subsection in region C1.
Name of PointsResults and Weights of Each Subsections (The Denominator is 9)
Subsection ISubsection IISubsection III
1Eosin3 Ocher2 Vermilion1Crimson3 Eosin2 Cyan1Madder3 Clam meal2 Eosin1
2Eosin3 Vermilion2 Madder1Crimson3 Cyan2 Eosin1Eosin3 Clam meal2 Madder1
3Eosin3 Ocher2 Vermilion1Crimson3 Eosin2 Cyan1Eosin3 Cyan2 Crimson1
4Eosin3 Vermilion2 Madder1Crimson3 Cyan2 Eosin1Madder3 Cyan2 Eosin1
5Eosin3 Vermilion2 Ocher1Crimson3 Cyan2 Eosin1Eosin3 Crimson2 Cyan1
6Eosin3 Ocher2 Vermilion1Crimson3 Eosin2 Cyan1Eosin3 Cyan2 Madder1
7Eosin3 Ocher2 Lapis1Crimson3 Eosin2 Cyan1Clam meal3 Eosin2 Madder1
8Eosin3 Vermilion2 Madder1Crimson3 Eosin2 Cyan1Eosin3 Cyan2 Madder1
9Eosin3 Vermilion2 Madder1Crimson3 Eosin2 Cyan1Madder3 Eosin2 Clam meal1
10Eosin3 Ocher2 Vermilion1Crimson3 Cyan2 Eosin1Eosin3 Cyan2 Madder1
11Eosin3 Ocher2 Lapis1Crimson3 Cyan2 Eosin1Eosin3 Cyan2 Madder1
12Eosin3 Vermilion2 Madder1Crimson3 Cyan2 Eosin1Eosin3 Madder2 Cyan1
13Eosin3 Vermilion2 Ocher1Crimson3 Eosin2 Cyan1Calcite3 Eosin2 Cyan1
14Eosin3 Vermilion2 Madder1Crimson3 Cyan2 Eosin1Eosin3 Calcite2 Cyan1
15Eosin3 Vermilion2 Ocher1Crimson3 Cyan2 Eosin1Eosin3 Cyan2 Madder1
Weighted IndexEosin: 0.778; Crimson: 0.356; Cyan: 0.304
Table 6. The thresholds of the Chinese painting.
RegionsThresholds
C10.35
C20.26
C30.32
C40.27
C50.37
Table 7. Comparison of pigment identification in the five regions of the Chinese painting.
RegionsResults and Weighted Indices of SSIResults of Traditional MethodTruth Value
C1Eosin 0.778
Crimson 0.356
Cyan 0.304
Eosin
Crimson
Madder
Eosin
Crimson
Madder
C2Crimson 0.326
Ocher 0.259
Cyan 0.237
Eosin
Crimson
Red lead
Crimson
Clam meal
C3Malachite 0.778
Chalk 0.322
Ocher 0.289
Malachite
Ink
Azurite
Malachite
Ink
C4Ocher 0.728
Malachite 0.568
Clam meal 0.259
Malachite
Ink
Vermilion
Ocher
Malachite
C5Malachite 0.728
Ocher 0.619
Ink 0.247
Malachite
Ink
Vermilion
Malachite
Ocher
Table 8. Five regions of interest and sample numbers on the fresco.
RegionsTypical ColorASDXRF
PointsNumber of DataPointsNumber of Data
F1 Remotesensing 12 03415 i0061–99X1–X44
F2 Remotesensing 12 03415 i00710–189X5–X84
F3 Remotesensing 12 03415 i00819–224X9–X124
F4 Remotesensing 12 03415 i00923–264X13–X142
F5 Remotesensing 12 03415 i01027–304X15–X195
Table 9. Elements detection results by using XRF on the fresco.
Energy (kev)PbCuSHgCa
X11562.01278975.780.000.0026503.66
X21029.01178149.560.000.0032592.03
X3139.28195848.000.000.0044637.43
X41252.71164159.420.000.0039282.22
F1: Cu++, Ca+
X5526.68909.04175032.5669704.1618542.46
X62507.46418.18158248.25106331.3413908.16
X72378.84387.09169500.92107834.5823325.84
X826293.65696.39134419.1117502.0523500.73
F2: S++, Hg+, Ca+
X940606.5435573.78136492.4251.3818149.19
X1056087.0541295.69166482.0060.0818344.49
X11123496.9450570.20265214.560.006308.32
X126971.9793195.7167959.97344.8568024.49
F3: S+, Cu+, Pb+
X1348297.7025055.33208326.7835.9930534.81
X1431617.8724609.80176882.0043.2238761.93
F4: S++, Pb+, Ca+, Cu+
X1594247.71414.08188251.2384.7517509.94
X1693331.72823.98244973.98145.8614344.45
X1783581.70556.53160192.80188.2931010.53
X1830920.21153.00167193.3844.9341051.42
X1991778.10683.97216748.48140.3913162.02
F5: S++, Pb+, Ca+
Table 10. The identification results and weights of each subsection in region F1.
Name of PointsPigments and Weights of Each Subsections (The Denominator is 12)
Subsection ISubsection IISubsection IIISubsection IV
1Malachite3Malachite3Malachite3Madder3
Chalk2Ink2Vermilion2Eosin2
Clam meal1Ocher1Cinnabar1Cyan1
2Orpiment13Malachite3Malachite3Malachite3
Orpiment22Ink2Vermilion2Ocher2
Ink1Ocher1Cinnabar1Titanium white1
3Malachite3Ocher3Malachite3Malachite3
Chalk2Ink2Vermilion2Chalk2
Clam meal1Clam meal1Cinnabar1Ink1
4Malachite3Malachite3Malachite3Malachite3
Chalk2Ocher2Vermilion2Chalk2
Clam meal1Ink1Cinnabar1Ink1
5Malachite3Ocher3Malachite3Chalk3
Chalk2Ink2Vermilion2Malachite2
Clam meal1Clam meal1Cinnabar1Ink1
6Malachite3Ocher3Malachite3Malachite3
Chalk2Ink2Vermilion2Chalk2
Clam meal1Clam meal1Cinnabar1Ink1
7Malachite3Ocher3Malachite3Chalk3
Titanium white2Ink2Vermilion2Malachite2
Chalk1Malachite1Cinnabar1Ink1
8Malachite3Malachite3Vermilion3Malachite3
Chalk2Azurite2Cinnabar2Azurite2
Clam meal1Ink 1Gamboge1Calcite1
9Ocher3Malachite3Malachite3Malachite3
Orpiment22Ocher2Vermilion2Chalk2
Orpiment 11Ink1Cinnabar1Ink1
Weighted IndexMalachite: 0.769
Chalk: 0.250
Ocher: 0.213
Ink: 0.194
Table 11. The thresholds of five regions in the fresco.
RegionsThresholds
F10.24
F20.25
F30.19
F40.23
F50.25
Table 12. Comparison of pigment identification in the five regions of the fresco.
RegionsResults and Weighted Indices of SSIResults of Traditional MethodXRF Results
F1Malachite:0.769
CuCO3·Cu(OH)2
Chalk:0.250
CaCO3
Malachite
CuCO3·Cu(OH)2
Lapis
(Na,Ca)4~8(Al6Si6O24)(SO4,S)1~2
Azurite
Cu3[CO3]2(OH)2
Cu++, Ca+
F2Vermilion:0.346
HgS
Chalk:0.321
CaCO3
Ocher:0.309
Fe2O3
Ocher
Fe2O3
Zinnober
HgS
Cinnabar
HgS
S++, Hg+, Ca+
F3Malachite:0.380
CuCO3·Cu(OH)2
Azurite:0.310
Cu3[CO3]2(OH)2
Azurite
Cu3[CO3]2(OH)2
Lapis
(Na,Ca)4~8
(Al6Si6O24)
(SO4,S)1~2
Cyan
S+, Cu+, Pb+
F4Cinnabar:0.400
HgS
Zinnober:0.310HgS
Clam meal:0.250
CaO
Lead white:0.250
2PbCO3·Pb(OH)2
Vermilion:0.250
HgS
Hackmanite
Na4(Al3Si3O12)Cl
Orpiment 2
As2S3
Ocher
Fe2O3
S++, Pb+, Ca+, Cu+
F5Chalk:0.440
CaCO3
Lead white:0.220
2PbCO3·Pb(OH)2
Chalk
CaCO3
Lead white
2PbCO3·Pb(OH)2
Clam mealCaO
S++, Pb+, Ca+
Table 13. Inorganic mineral pigment analysis results.
NumberColor of SamplesPigments
1GreenMalachite, Atacamite, Eriochalcite
2RedCinnabar, Red lead
3Light redLead oxide
4BlueAzurite
5Light blueLapis
6BlackLead white
7Light yellowGypsum, Lead white
8BrownLead dioxide
9WhiteLead white, Calcite
Table 14. Pigment identification accuracy of the two methods.
MethodC1C2C3C4C5(Average) Accuracy
Top 1SSI method100.0%
Traditional method×80.0%
Top 3SSI method67%50%50%100%100%73.4%
Traditional method100%50%100%50%50%70.0%
MethodF1F2F3F4F5(Average) Accuracy
Top 1SSI method100.0%
Traditional method××60.0%
Top 3SSI method100%100%33%75%67%75.0%
Traditional method100%67%33%25%67%58.4%
Publisher’s Note: MDPI stays neutral with regard to jurisdictional claims in published maps and institutional affiliations.

