Article

Establishment and Preliminary Application of the Forward Modeling Method for Doppler Spectral Density of Ice Particles

1
Collaborative Innovation Center on Forecast and Evaluation of Meteorological Disasters, Nanjing University of Information Science and Technology, Nanjing 210044, China
2
State Key Laboratory of Severe Weather, Chinese Academy of Meteorological Sciences, Beijing 100086, China
*
Author to whom correspondence should be addressed.
Remote Sens. 2020, 12(20), 3378; https://doi.org/10.3390/rs12203378
Submission received: 11 September 2020 / Revised: 13 October 2020 / Accepted: 13 October 2020 / Published: 15 October 2020

Abstract

:
Owing to the various shapes of ice particles, the relationships between fall velocity, backscattering cross-section, mass, and particle size are complicated. This affects the application of cloud radar Doppler spectral density data in the retrieval of the microphysical properties of ice crystals. In this study, under the assumption of six particle shape types, the relationships between particle mass, fall velocity, backscattering cross-section, and particle size were established based on existing research. Variations of Doppler spectral density with the same particle size distribution (PSD) of different ice particle types are discussed. The radar-retrieved liquid and ice PSDs, water content, and mean volume-weighted particle diameter were compared with airborne in situ observations in the Xingtai, Hebei Province, China, in 2018. The results showed the following. (1) For the particles with the same equivalent diameter ( D e ), the fall velocity of the aggregates was the largest, followed by hexagonal columns, hexagonal plates, sector plates, and stellar crystals, with the ice spheres falling two to three times faster than ice crystals with the same D e . Hexagonal columns had the largest backscattering cross-section, followed by stellar crystals and sector plates, and the backscattering cross-sections of hexagonal plates and the two types of aggregates were very close to those of ice spheres. (2) The width of the simulated radar Doppler spectral density generated by various ice crystal types with the same PSD was mainly affected by the particle’s falling velocity, which increased with the particle size. Turbulence had different degrees of influence on the Doppler spectrum of different ice crystals, and it also brought large errors to the PSD retrieval. (3) PSD comparisons showed that each ice crystal type retrieved from the cloud radar corresponded well to aircraft observations within a certain scale range, when assuming that only a certain type of ice crystals existed in the cloud, which could fully prove the feasibility of retrieving ice PSDs from the reflectivity spectral density.

1. Introduction

The importance of clouds in the Earth-atmosphere system is self-evident. Cloud microphysical processes affect cloud distribution and lifetime. Ice clouds affect the Earth–atmosphere radiation balance by affecting long-wave and short-wave radiation transmission and changing the atmosphere’s thermodynamic structure [1,2,3]. Further understanding of ice cloud microphysical properties was clearly identified as essential to improving weather and climate change prediction, as well as the aerosol–cloud microphysical processes and the nonlinear relationships between them. The ice phase process is crucial to cloud and precipitation formation and development, and most surface precipitation begins as ice particles [4]. Accurate particle size distribution (PSD) information is vital to precipitation, and cloud radiation affect predictions in large-scale models. Compared to other ice cloud retrievals, radar parameters can be more representative when studying clouds [3]. One of the most powerful tools for detecting non-precipitating and weakly precipitating clouds, the vertically pointing millimeter-wavelength cloud radar (MMCR), has a short wavelength and a high gain, which can effectively penetrate cloud layers to continuously observe horizontal and vertical cloud structure changes under different dynamic conditions. This enables collection of more precise information on clouds.
MMCR detects a Doppler spectrum that is a function of the backscattering cross-section and a number of all particles in the radar detection volume with respect to their fall velocity. If the relationships between particle size and fall velocity and backscattering cross-section are known, Doppler spectral density data can be used to obtain the PSD characteristics of the cloud. However, radar-detected radial velocity includes particle fall velocity as well as vertical air motion, which is well-known as one of the most difficult physical quantities to determine in meteorology. Identifying and eliminating air motion presents difficulties in PSD retrieval using Doppler spectral density. If a small particle in a cloud (such as a liquid water droplet) is small enough, its fall speed relative to the vertical air motion can be neglected, which means that it can be used as a tracer to indicate clear-air motion [5,6]. On this basis, it is possible to use Doppler spectral density data to retrieve cloud PSD.
The relationships between fall velocity, backscattering cross-section, and particle sizes are easier to calculate for liquid particles than for ice particles because of their uniform shapes. Many studies focus on the raindrop size distribution retrieval using a Doppler spectral density data [7,8,9]. Liu et al. [7] analyzed the accuracy of raindrop size distributions retrieved from Doppler spectral density data, observed by cloud radar. However, calculating fall velocity and backscattering cross-section for ice particles is complicated because of the complex shape of solid particles and fall velocity’s sensitivity to changes in ambient temperature and humidity. This leads to many difficulties in interpreting and applying cloud radar data above the 0 °C level. Yang et al. [10] reviewed several classical computational approaches to light scattering simulations of non-spherical ice crystals and discussed the strengths and weaknesses associated with each approach. Liu [11] built a database of microwave single-scattering properties for several non-spherical particle shapes, at frequencies of 15 to 340 GHz, calculated using the discrete dipole approximation method (DDA). However, he only calculated certain size particles rather than a continuous relationship. In applied remote sensing, most previous studies focused on the study of PSD bulk characteristics and the relationship between PSD and microphysical parameters due to the inability of obtaining complete and specific PSD information, such as the relationship between radar reflectivity Z e , ice water content (IWC), and ice effective radius r e , through means of remote sensing [12,13,14,15]. Zhong et al. [16] indicated that IWC retrieved using radar Doppler spectra is more reliable than IWC obtained using classic Z e –IWC relationships. In order to obtain more detailed information, numerous studies used dual-frequency and triple-frequency radar due to the self-richness of these radar data. However, only the retrieval of raindrop size distribution (DSD) or part of the ice PSD and the identification of some microphysical processes in the cloud could be achieved [8,17,18,19]. So far, research on ice particle retrieval using MMCR Doppler spectral density in China was not found. Therefore, we establish the relationship between ice particle microphysical parameters and Doppler properties to verify the feasibility. At the same time, the results were compared with aircraft data, in order to evaluate the performance of China’s first cloud radar with a solid-state transmitter.
In this study, we established relationships between fall velocity, backscattering cross-section, and particle size of six typical ice crystals, based on a review of the existing literature. Additionally, the relationship between ice particle microphysical properties and radar-observed Doppler spectral density was preliminarily explored. Data and methods are presented in the second sections of the paper. Section 3 mainly analyzes the relationships between particle microphysical parameters and particle size, based on the calculation results, and Doppler spectra were simulated with the given PSD. Section 3 also presents a qualitative analysis of MMCR spectral density data and a brief comparison with aircraft observations. Section 4 provides discussion and conclusions.

2. Data and Methods

2.1. Data

2.1.1. Cloud Radar

From 15 May 2018 to 31 May 2018, intensive cloud and precipitation observations were conducted at the Huangsi Meteorological Station in Hebei Province, China (114.21°E, 37.10°N). This experiment used a Ka-band MMCR with a working frequency of 35 GHz and 8.6 mm wavelength. The MMCR operated in a vertically pointing mode and had a vertical resolution of 30 m. A solid-state transmitter enabled the radar to make continuous observations. Four operational modes were applied to improve cloud and precipitation radar detection capabilities—precipitation mode (M1), boundary mode (M2), middle level mode (M3), and cirrus mode (M4). Varying radar pulse widths and coherent and incoherent integration techniques were used to enable the detection of low-level clouds and high-level weak clouds. During detection, the radar circulated through the four observation modes and converted reflected signals processed using fast Fourier transform into Doppler spectral data for storage. Table 1 shows the MMCR’s major operational parameters. Considering that particles above the zero degree Celsius level have relatively small fall velocities and weak reflectivity, we used the M3 mode data with high sensitivity and radial velocity resolution.

2.1.2. Aircraft Instruments

From 5:17:42 to 5:49:35 UTC on 21 May 2018, stratiform precipitation occurred in the observation area. At the same time, an aircraft reached a maximum altitude of 4800 m and spiraled downward, with an approximately 18 km circling diameter, to 700 m around the observation site, to observe cloud and precipitation vertical structures. The primary instruments in the aircraft included a modified cloud combination probe (CCP), a two-dimensional stereo probe (2D-S), a high-volume precipitation spectrometer (HVPS), and an Aircraft Integrated Meteorological Measurement System (AIMMS-20), which could provide meteorological data such as three-dimensional wind vectors, three-dimensional aircraft position (i.e., latitude, longitude, and altitude), ambient temperature, and ambient relative humidity. The CCP consists of a cloud droplet probe (CDP), a grayscale optical array imaging probe (CIPgs), and a hotwire liquid water content sensor. Using a two-dimensional shadow cast technique, the CIPgs detects cloud particles with diameters of 15–2000 μm. The 2D-S is an optical array imaging probe that records projected areas of three-dimensional ice particles and PSDs from 10 to 1280 μm, with resolutions of 10, 20, 50, 100, and 200 μm. To mitigate the ice crystal shattering problem, we modified probe tips and applied an arrival time algorithm to the collected data to remove artifacts. HVPS data cover 150–47,075 μm, with resolutions of 150 and 300 μm. Below this range, 2D-S data are used. The data set detected by the aircraft was used to compare with radar retrievals, including liquid water content and ice particle size distribution.

2.2. Methods

When ignoring the effects of vertical air motion and turbulence, the relationship between the radar-detected Doppler spectral density S z ( v r ) ( mm 6 · s · m 4 ) and PSD N D d D ( m 3 ) could be expressed as
S z ( v r ) = C N ( D ) σ ( D ) D v f
where C = 10 6 λ 4 | ε + 2 | 2 / ( π 5 | ε 1 | 2 ) is a constant related to the wavelength λ and complex permittivity ε of precipitation particles, and has a unit of cm4. σ ( D )   (cm2) is the particle’s backscattering cross-section, v r (m·s1) is the radar-detected radial velocity, and v f represents particle fall velocity (both v r and v f positive velocities are downward). Radar-observed radial velocity can only be regarded as particle fall velocity in static air, after air speed v a (positive speed is upward) is determined and eliminated using the small particle tracing method (i.e., v f = v r + v a ). As long as the shape of the particle can be determined, particle size can then be calculated based on the relationship between particle fall velocity and size. Thus, the relationship between Doppler spectral density S z and N(D) can be established based on the relationship between v f -D and σ -D. IWC (g·m−3) and mean volume-weighted diameter D m (μm) can then be calculated after N(D) is retrieved:
I W C = π ρ i c e 6   N ( D ) D 3 d D
D m = N ( D ) D 4 d D N ( D ) D 3 d D
However, as mentioned in the introduction, ice PSD retrieval is a very complicated task. There are three prerequisites for the realization of PSD retrieval by using radar Doppler spectrum, the determination of the shape of the particles, the calculation of the v f -D and σ -D relationships. In this study, six different shapes of ice crystals were selected according to the growth habits, and their falling speed and backscattering cross-section at different sizes were calculated. We also did some simulation work to evaluate the influence of some factors that might affect the accuracy of PSD retrieval (including radar sensitivity and air turbulence). We used a certain power spectrum to make a preliminary attempt to perform PSD retrieval of different shapes of ice particle, and analyze the differences between them. In order to apply these attempts to the actual observation of clouds and further verify the feasibility of the method, the data obtained during a stable stratiform precipitation period was selected to retrieve PSD, and the aircraft data collected during the same period were compared with the radar retrieval results. Since the ice layer involved in the altitude of the flight was very thin, the real shape and size distribution of the ice particles could not be determined. Therefore, the retrieval could only be performed under the assumption that there is only one shape of particles that exist in the cloud. In addition, the retrieved PSDs were used to calculate the ice water content and compared with the results given by other studies.

2.2.1. Determination of the Shape of Ice Particles

Ice crystal fall velocity and scattering characteristics are known to be closely related to their shapes, which are related to ambient temperature and supersaturation with respect to ice. Magono and Lee [20] classified and named ice crystals found in nature as early as 1966. Over the past 70 years, researchers developed many charts of ice crystal growth habits through laboratory research, in situ observation, or a combination of both. Most researchers agree that, when temperatures are greater than −18 °C, the basic behavior of ice crystals goes from forming plates (0 °C~−4 °C), to columns (−4 °C~−8 °C), to plates (−8 °C~−22 °C). Bailey and Hallett [21] provided a detailed diagram of ice crystal growth habits by combining laboratory and field observations. They pointed out that ice crystal growth habits are dominated by various forms of polycrystals with two distinct habit regimes below −20 °C: plate-like from −20 °C to −40 °C and columnar from −40 °C to −70 °C. On the basis of these results, this study mainly discusses six typical ice particle types (four single crystal types and two aggregates). These types are hexagonal plates (−8 °C~−25 °C, low ice supersaturation), hexagonal columns (below −40 °C, ice supersaturation of 10–25%), sector-like plates (−10 °C~−25 °C, high ice supersaturation), stellar crystals with broad arms (about −20 °C, near water supersaturation), and plate and column aggregates. The six particle type shapes were thus chosen to represent complicated ice types (Figure 1).
When calculating the backscattering cross-section of individual ice crystal particles, their shape and fall attitude should be determined first. On the basis of the particle shape parameters given by Auer Jr and Veal [22], the thickness of hexagonal and sector plates was L = 2.02D0.449, that of stellar crystals was L = 2.028D0.431, and the relationship between hexagonal column length L and half-width a was a = 3.48L0.5 [23]. These measurements (a, L, and D) were all in micrometer. The aspect ratio of the two kinds of aggregates was 0.6 [24]. Additionally, the vertical orientation of all ice crystals was horizontal along the long axis, when falling and horizontal orientation is random.

2.2.2. Fall Velocities

There are usually two ways to obtain the fall velocity v f of a single ice crystal particle—direct laboratory measurements or field observations (mainly large-scale ice particles or snowflakes) and calculation of the drag force based on aerodynamic principles. Fall velocity could then be calculated by combining empirical relationships (such as mass and projected area-dimension power laws) and the measured or calculated results can be expressed in the form of an empirical power law [25]. Obviously, results obtained through direct measurement are more accurate; however, they are not applicable to particles of all scales, i.e., the application range is limited. Therefore, many researchers are working to determine a fall velocity equation based on particle size, mass, and projected area [26,27,28,29]. Heymsfield and Westbrook evaluated the four most recent calculation methods at that time and pointed out their shortcomings [30]. They made a simple correction to the method proposed by Mitchell to reduce sensitivity to area ratio and thus obtained a more accurate and simpler equation [29]. We used their proposed calculation method to calculate particle fall velocity. In general, when the force of gravity on the particle is in balance with the drag force, v f can be calculated as follows:
  • The modified best number can be calculated as X = ρ a i r η 2 8 m g π A r 0.5 when the values of η , ρ a i r , m , A r , and D are given. Here, η is the dynamic viscosity of air, ρ a i r is the density of air, m is mass, and g is gravity. A r is defined as the particle’s area ratio, i.e., the ratio of projected area (A) to the particle’s circumscribed circle area. The m- and A–D relations are obtained using the formula compiled by Mitchell (1996), and the coefficients used are given in Table 2. Here, D is the particle’s maximum dimension (the diameter of the circumscribed circle of the particle).
  • Then, the Reynolds number is estimated as R e = δ 0 2 4 [ ( 1 + 4 X δ 0 2 C 0 ) 1 2 1 ] 2 using C 0 = 0.35 and δ 0 = 8.0.
  • Finally, particle fall velocity is directly computed as v f = η R e D ρ a i r .

2.2.3. Backscattering Cross-Section

After establishing the relationship between particle fall velocity and particle size, it is necessary to know the relationship between backscattering cross-section and size to determine the PSD using Doppler spectral density. As the ice crystal shapes are complex, it is essential to establish a scattering model using a simple theory, a simple calculation, and reliable results, to obtain the backscattering characteristics of non-spherical ice crystals. One approach is to simplify particle shapes by treating them as spheres or ellipsoids and then applying a suitable scattering theory. For example, spheres can be calculated using the Mie scattering theory, and ellipsoids can be calculated using the T-matrix method [31]. Although the T-matrix method can effectively calculate the scattering characteristics of spherical particles, it can only be applied to a limited particle size range, beyond which numerical stability problems are likely to occur during calculation [32]. This makes the processing complex when calculating particles of different shapes, so it is difficult to apply to the scattering calculation of particles of complex shapes. Another method is to use a simplified scattering theory, such as the Rayleigh–Gans approximation theory (RGA), rather than simplified particle shapes [33]. RGA ignores internal higher-order interactions of electromagnetic waves, greatly simplifying mathematical problems. The RGA method was adopted in this study. In the RGA theory, the backscattering cross-section of particles with arbitrary shapes to plane waves in the s direction can be written as:
σ b = 9 k 4 | K | 2 4 π | D / 2 D / 2 A ( s ) exp ( i 2 k s ) d s | 2
where k is the wave number, K = ( ε 1 ) / ( ε + 2 ) ,   ε is the complex permittivity of ice, and A(s) is the area of ice crystals intersected by the plane. Hogan and Westbrook [24] made some improvements to the RGA method in 2014, creating a self-similar Rayleigh–Gans approximation (SSRGA) that could be used to calculate the backscattering cross-section of aggregates. Although aggregate structures are complex and difficult to predict, Hogan and Westbrook [24] found that the aggregation process of the crystals was self-similar and could be described by a power law. Thus, they proposed an equation to calculate the backscattering cross-section of particles in the centimeter and millimeter bands:
σ b =   9 π k 4 | K | 2 V 2 16 { c o s 2 [ ( 1 + κ 3 ) ( 1 2 x + π 1 2 x π ) κ ( 1 2 x + 3 π 1 2 x 3 π ) ] 2 + β j = 1 n ( 2 j ) γ s i n 2 ( x ) [ 1 ( 2 x + 2 π j ) 2 1 ( 2 x 2 π j ) 2 ] }
where x = kD, κ is the kurtosis parameter, and β is the prefactor of the power law. Hogan and Westbrook [24] also pointed out that, when the ice crystals collide into aggregates, the overall shape of the aggregates affects the scattering properties rather than the shape and size of the individual crystals making up the aggregates. Of the six types of ice crystals calculated using the parameters given in Table 2, the backscattering cross-sections of four kinds of single ice crystals were calculated using Equation (4), and the backscattering cross-sections of two kinds of aggregates were calculated using Equation (5). The kurtosis and power-law prefactor parameters could be found in Table 1 of Hogan and Westbrook [24].

3. Results

3.1. Analysis and Simulation

3.1.1. Fall Velocities and Backscattering Cross-Section of Different Types of Ice Particles

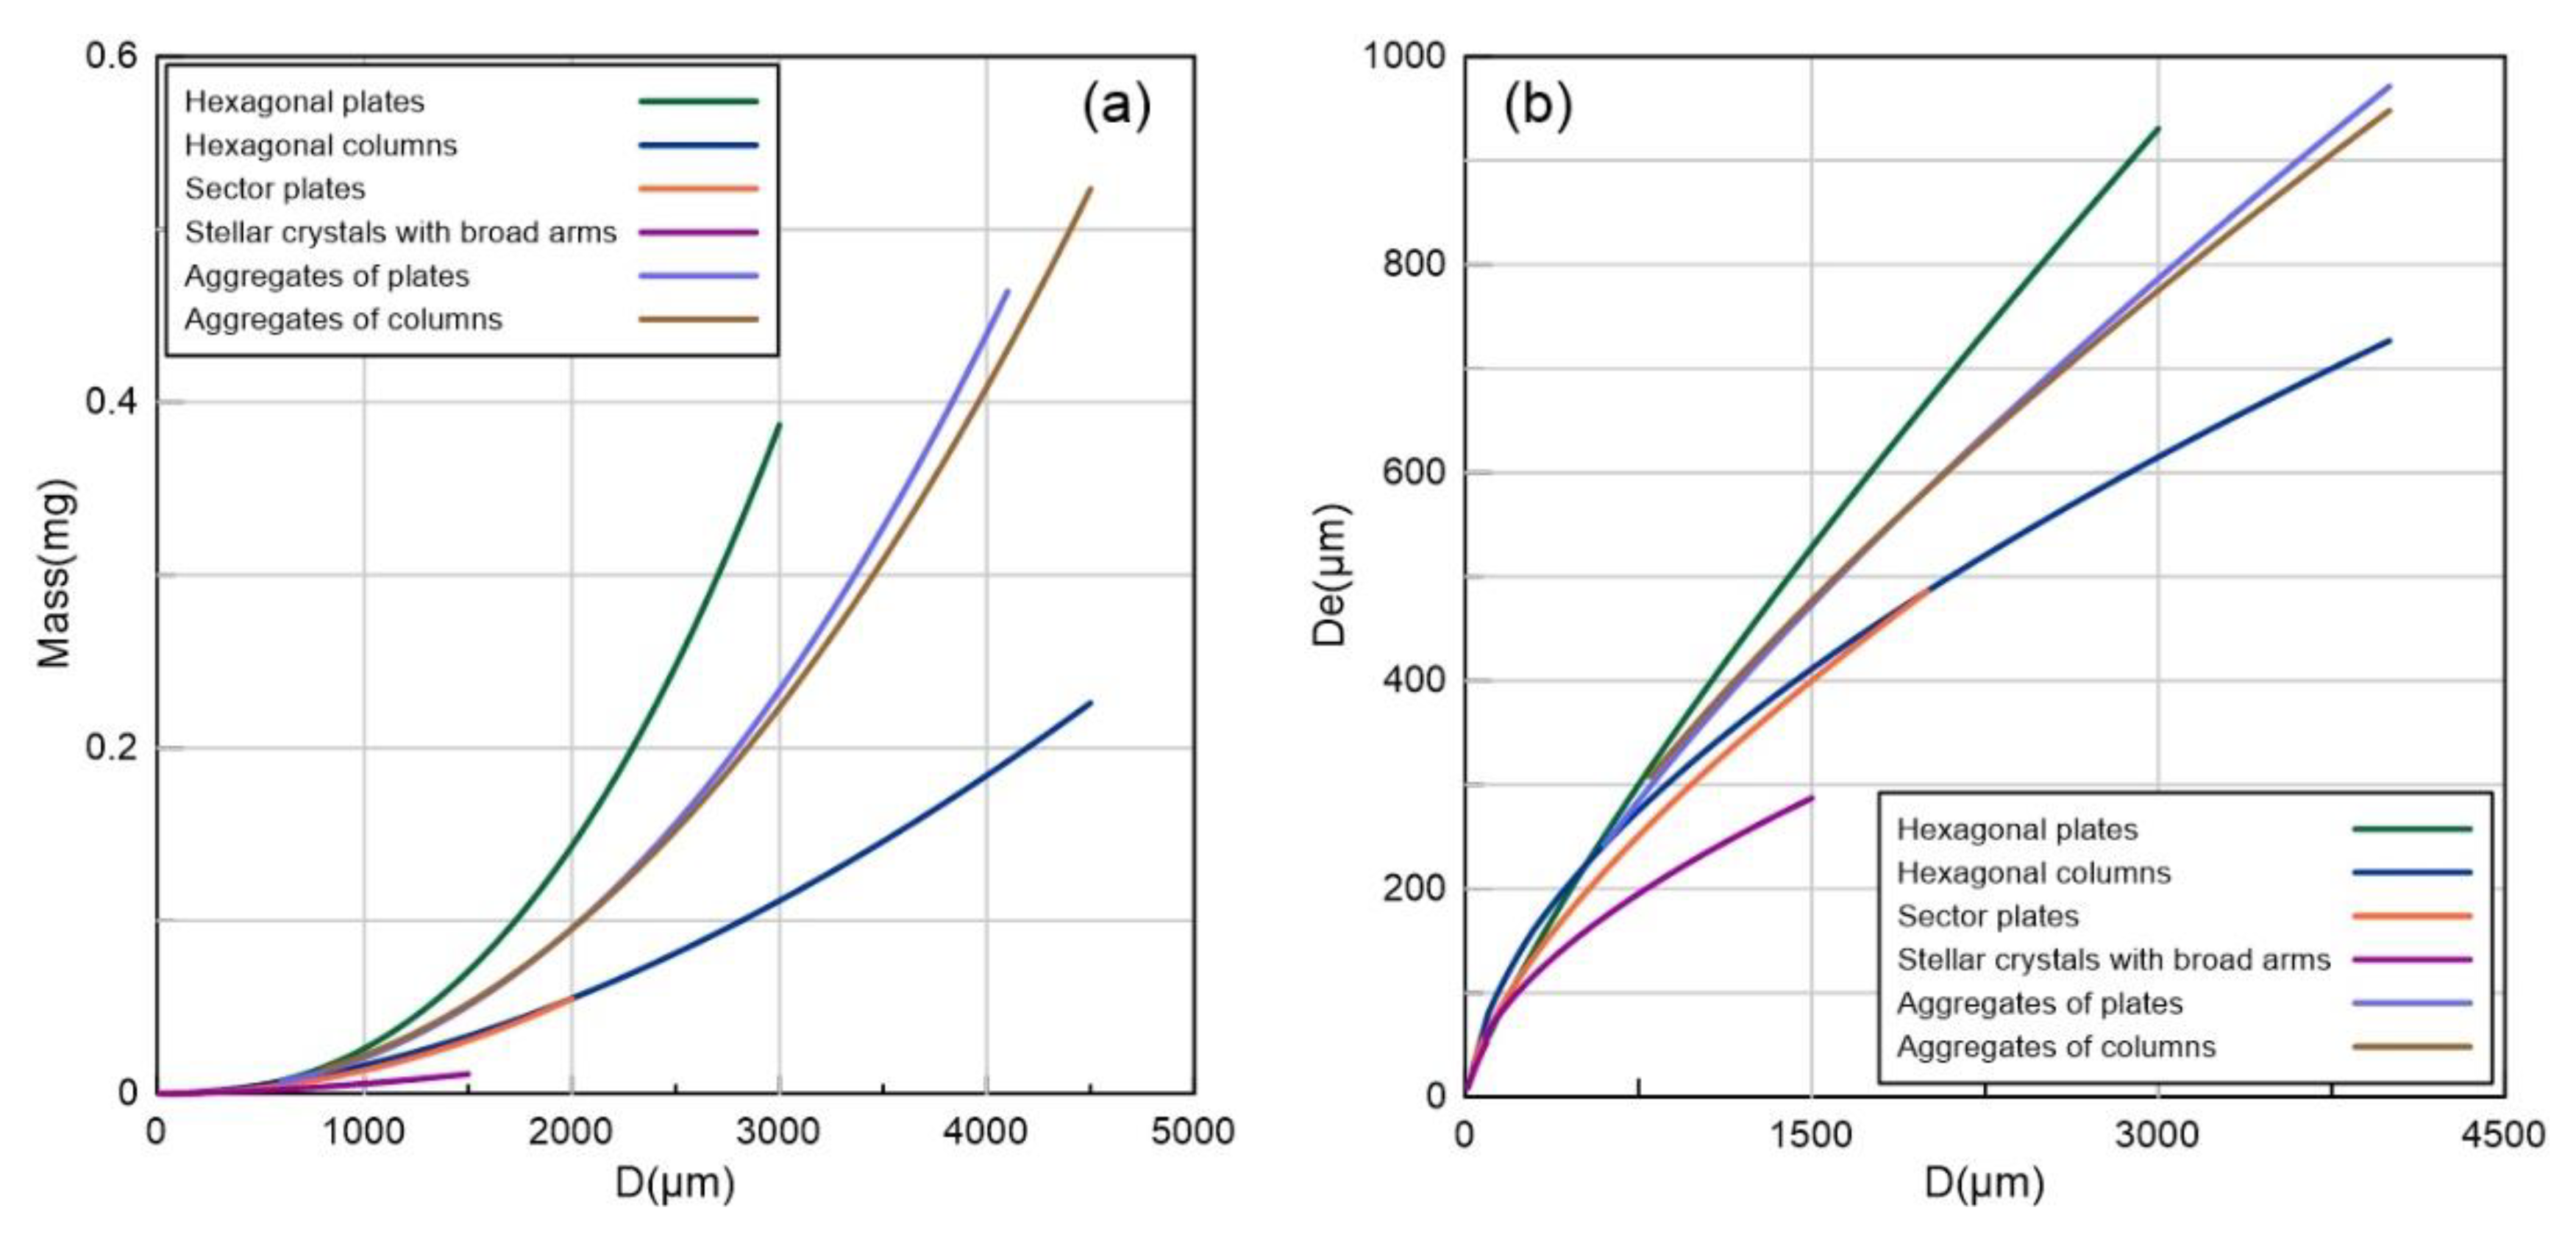
To establish the relationship between Doppler spectral density data and PSD, we calculated the masses, fall velocities, and backscattering cross-sections of ice crystals with different sizes, based on the methods mentioned in Section 2.2. To compare and verify the calculation results, we equated ice crystal particles of different shapes to solid ice spheres of the same mass, with an equivalent diameter represented by D e . Figure 2a shows the relationship between mass and the maximum dimension of six ice particle types within the physical size limits. Figure 2b shows the corresponding relationship between maximum diameter and the ice sphere equivalent diameter of different particles. These figures show that, when the maximum diameter was same, hexagonal plates had the largest mass, followed by the two aggregate types and sector plates, with the stellar plate crystals having the smallest mass. The masses of the two aggregate types were almost equal when D was less than 2500 μm, and the masses of the sector plates were similar to those of hexagonal columns when D was less than 2000 μm.
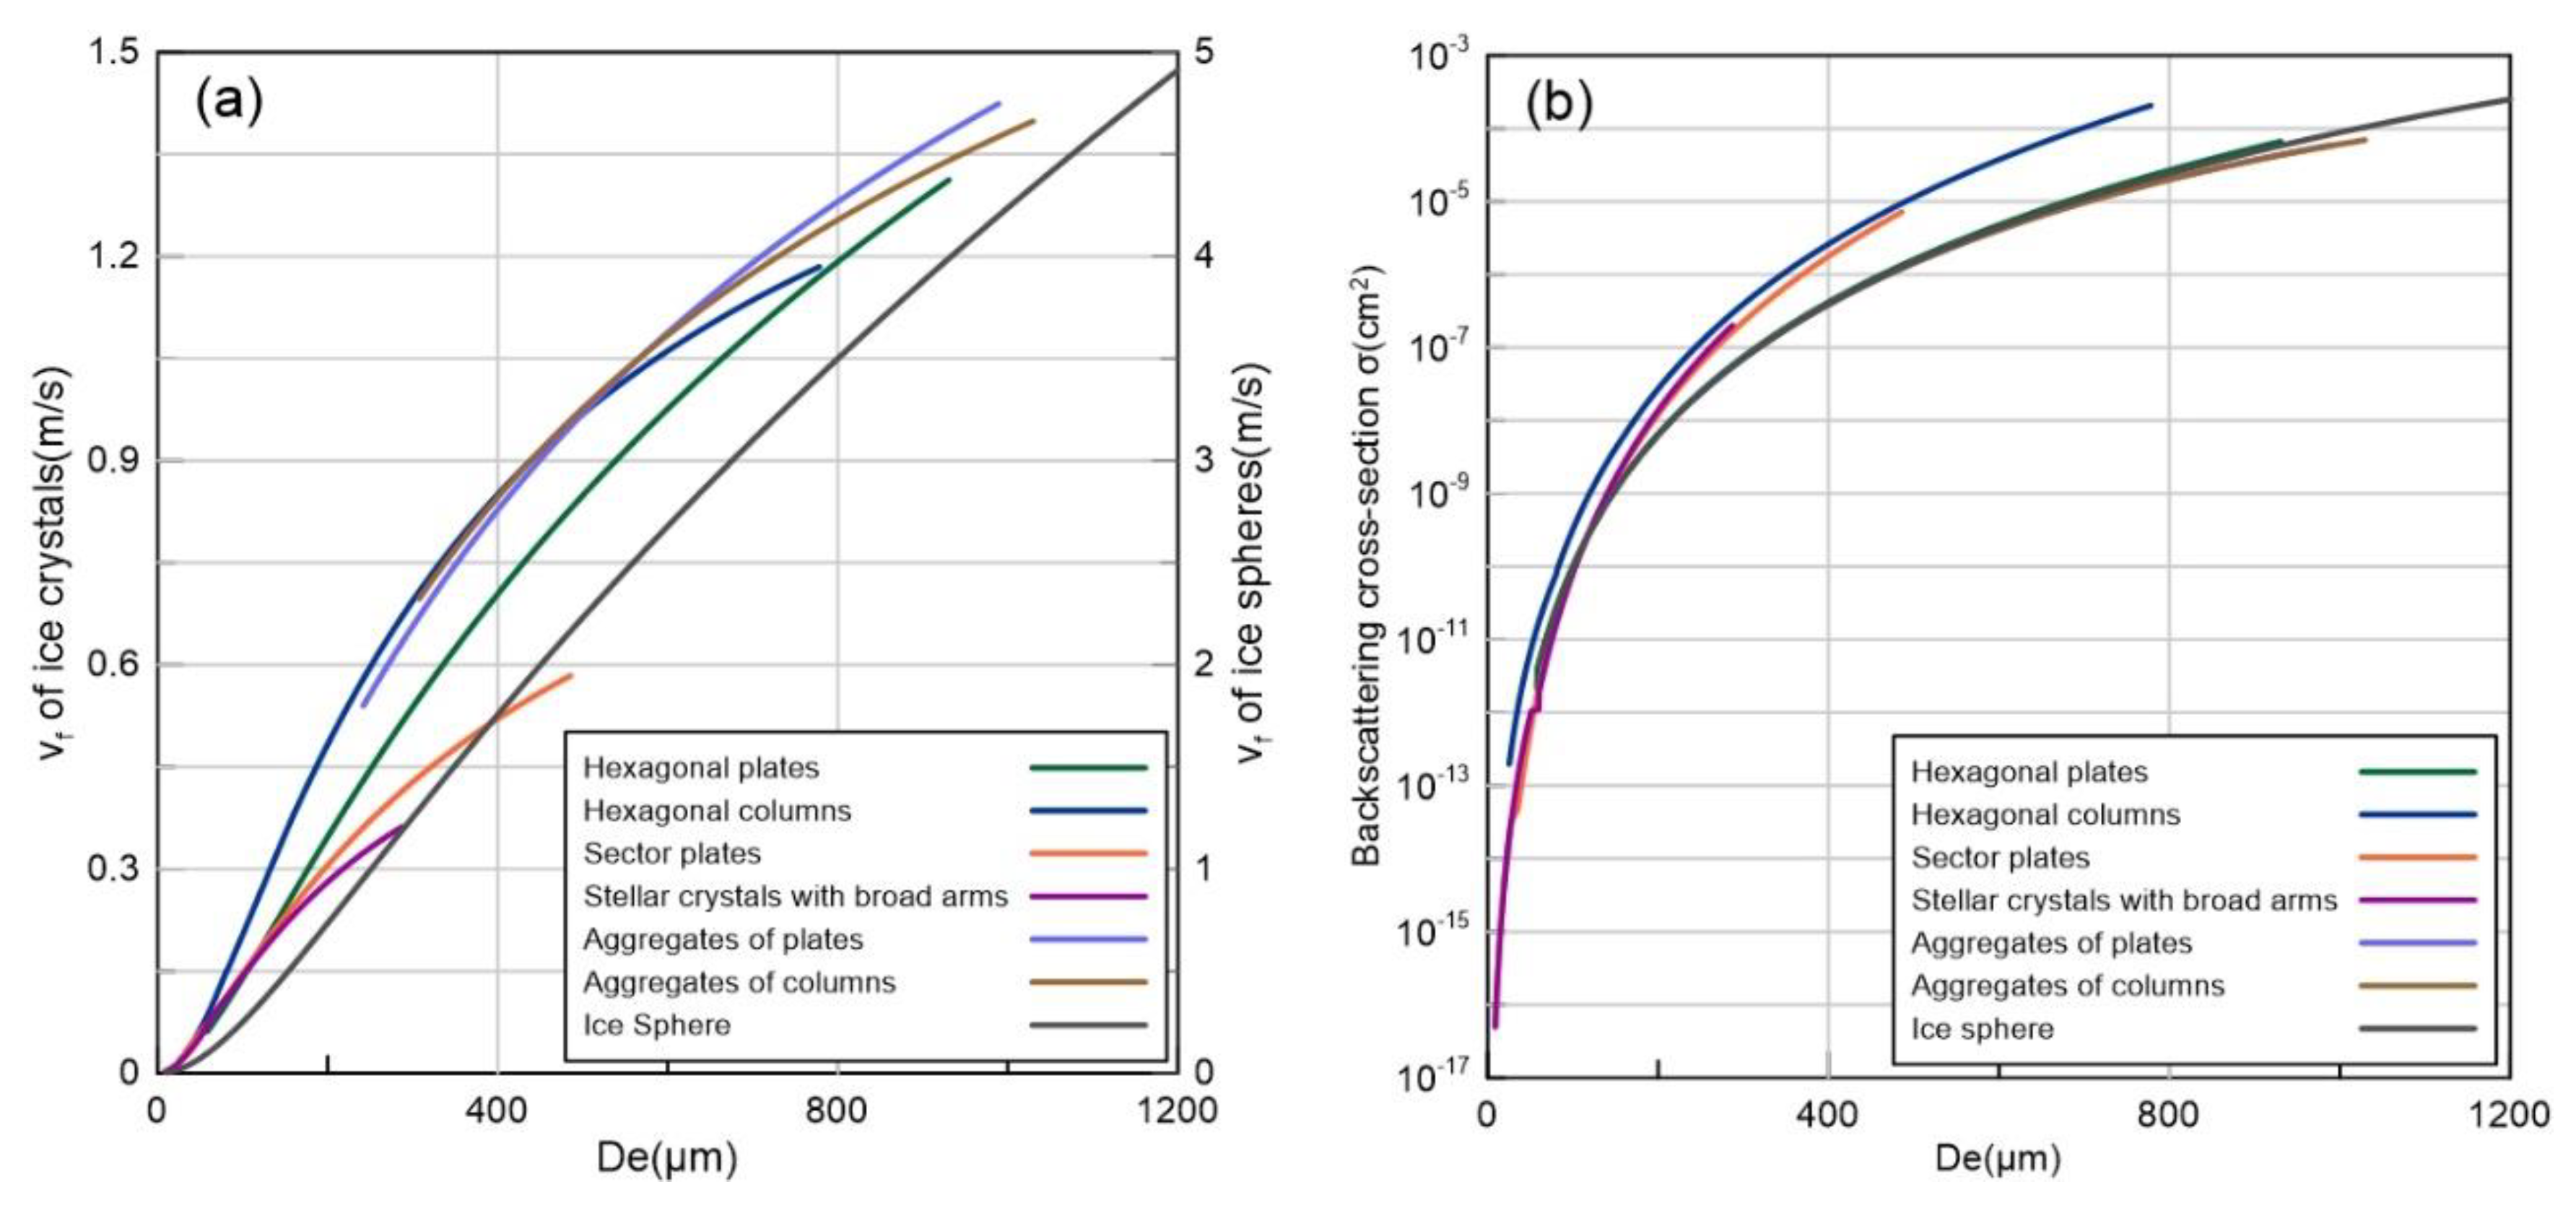
As the air viscosity coefficient mainly depends on air density, air density changes would affect particle fall velocity. Thus, even if the particles are of the same size, the fall velocity would change with height. We take the fall velocity of particles at a height of 4.5 km under standard atmosphere, as an example for analysis. Figure 3a shows the v f D e relationship of ice crystals and an ice sphere. An ice sphere falls approximately 2–3 times faster than ice particles with the same D e . Among the six ice crystal types, the two aggregates have the greatest fall velocity, followed by hexagonal columns, hexagonal plates, sector plates, and stellar plates, which have the smallest fall velocity. Due to size limitations, sector-like plate and stellar plate crystals have relatively small maximum fall velocities, which slowly increase with particle size. By contrast, the fall velocity of hexagonal columns increases the fastest with increasing size. At the same time, if we suppose that all ice particles in a cloud were spherical, ice particle sizes corresponding to the same fall velocity would be much smaller than actual ice particles of different shapes. This would impose serious errors on the following calculation, causing it to deviate from the real situation, when retrieving PSD spectra using radar data.
The backscattering cross-sections of single ice particles and aggregates were calculated using the method mentioned above, and the results are shown in Figure 3b. The values of backscattering cross-section of different types were closer to each other, when the size of the ice particles was small. For the same D e , the hexagonal columns had the largest backscattering cross-section, followed by stellar plates and sector plates, while the backscattering cross-section of the hexagonal plates, two kinds of aggregates and ice spheres were relatively small and almost equal to each other. Additionally, we found that the backscattering cross-section area had little correlation to the projected area of particles with the same volume. The backscattering cross-section only depended on the integral of the projected area in the electromagnetic wave propagation direction. For ice crystals of the same volume, if they had the same density, their projected area was large or small (their thickness was thick or thin), the differences of their backscattering cross-sections were too small to neglect. Therefore, it is crucial to choose the mass parameters for ice particle types, which would significantly affect the calculation results. However, ice crystal shapes are very complex; thus, it is obvious that we could not cover them all in the calculation. Therefore, we can only select the typical scale parameters to obtain a more representative relationship between backscattering cross-section and particle size.

3.1.2. Doppler Spectral Density and PSD Retrieval Simulations

From the above results, if PSD is given, the Doppler spectrum could be calculated, based on Equation (1). Many studies proposed various functions to describe the PSD of ice crystals, such as the negative power function, the power function, and the Gamma function [34,35]. Gunn and Marshall used the exponential function to describe ice crystal PSD, which is widely used since then [36]:
N ( D ) = N 0 e x p ( Λ D )
Z e = 0 v S z ( v f ) d v
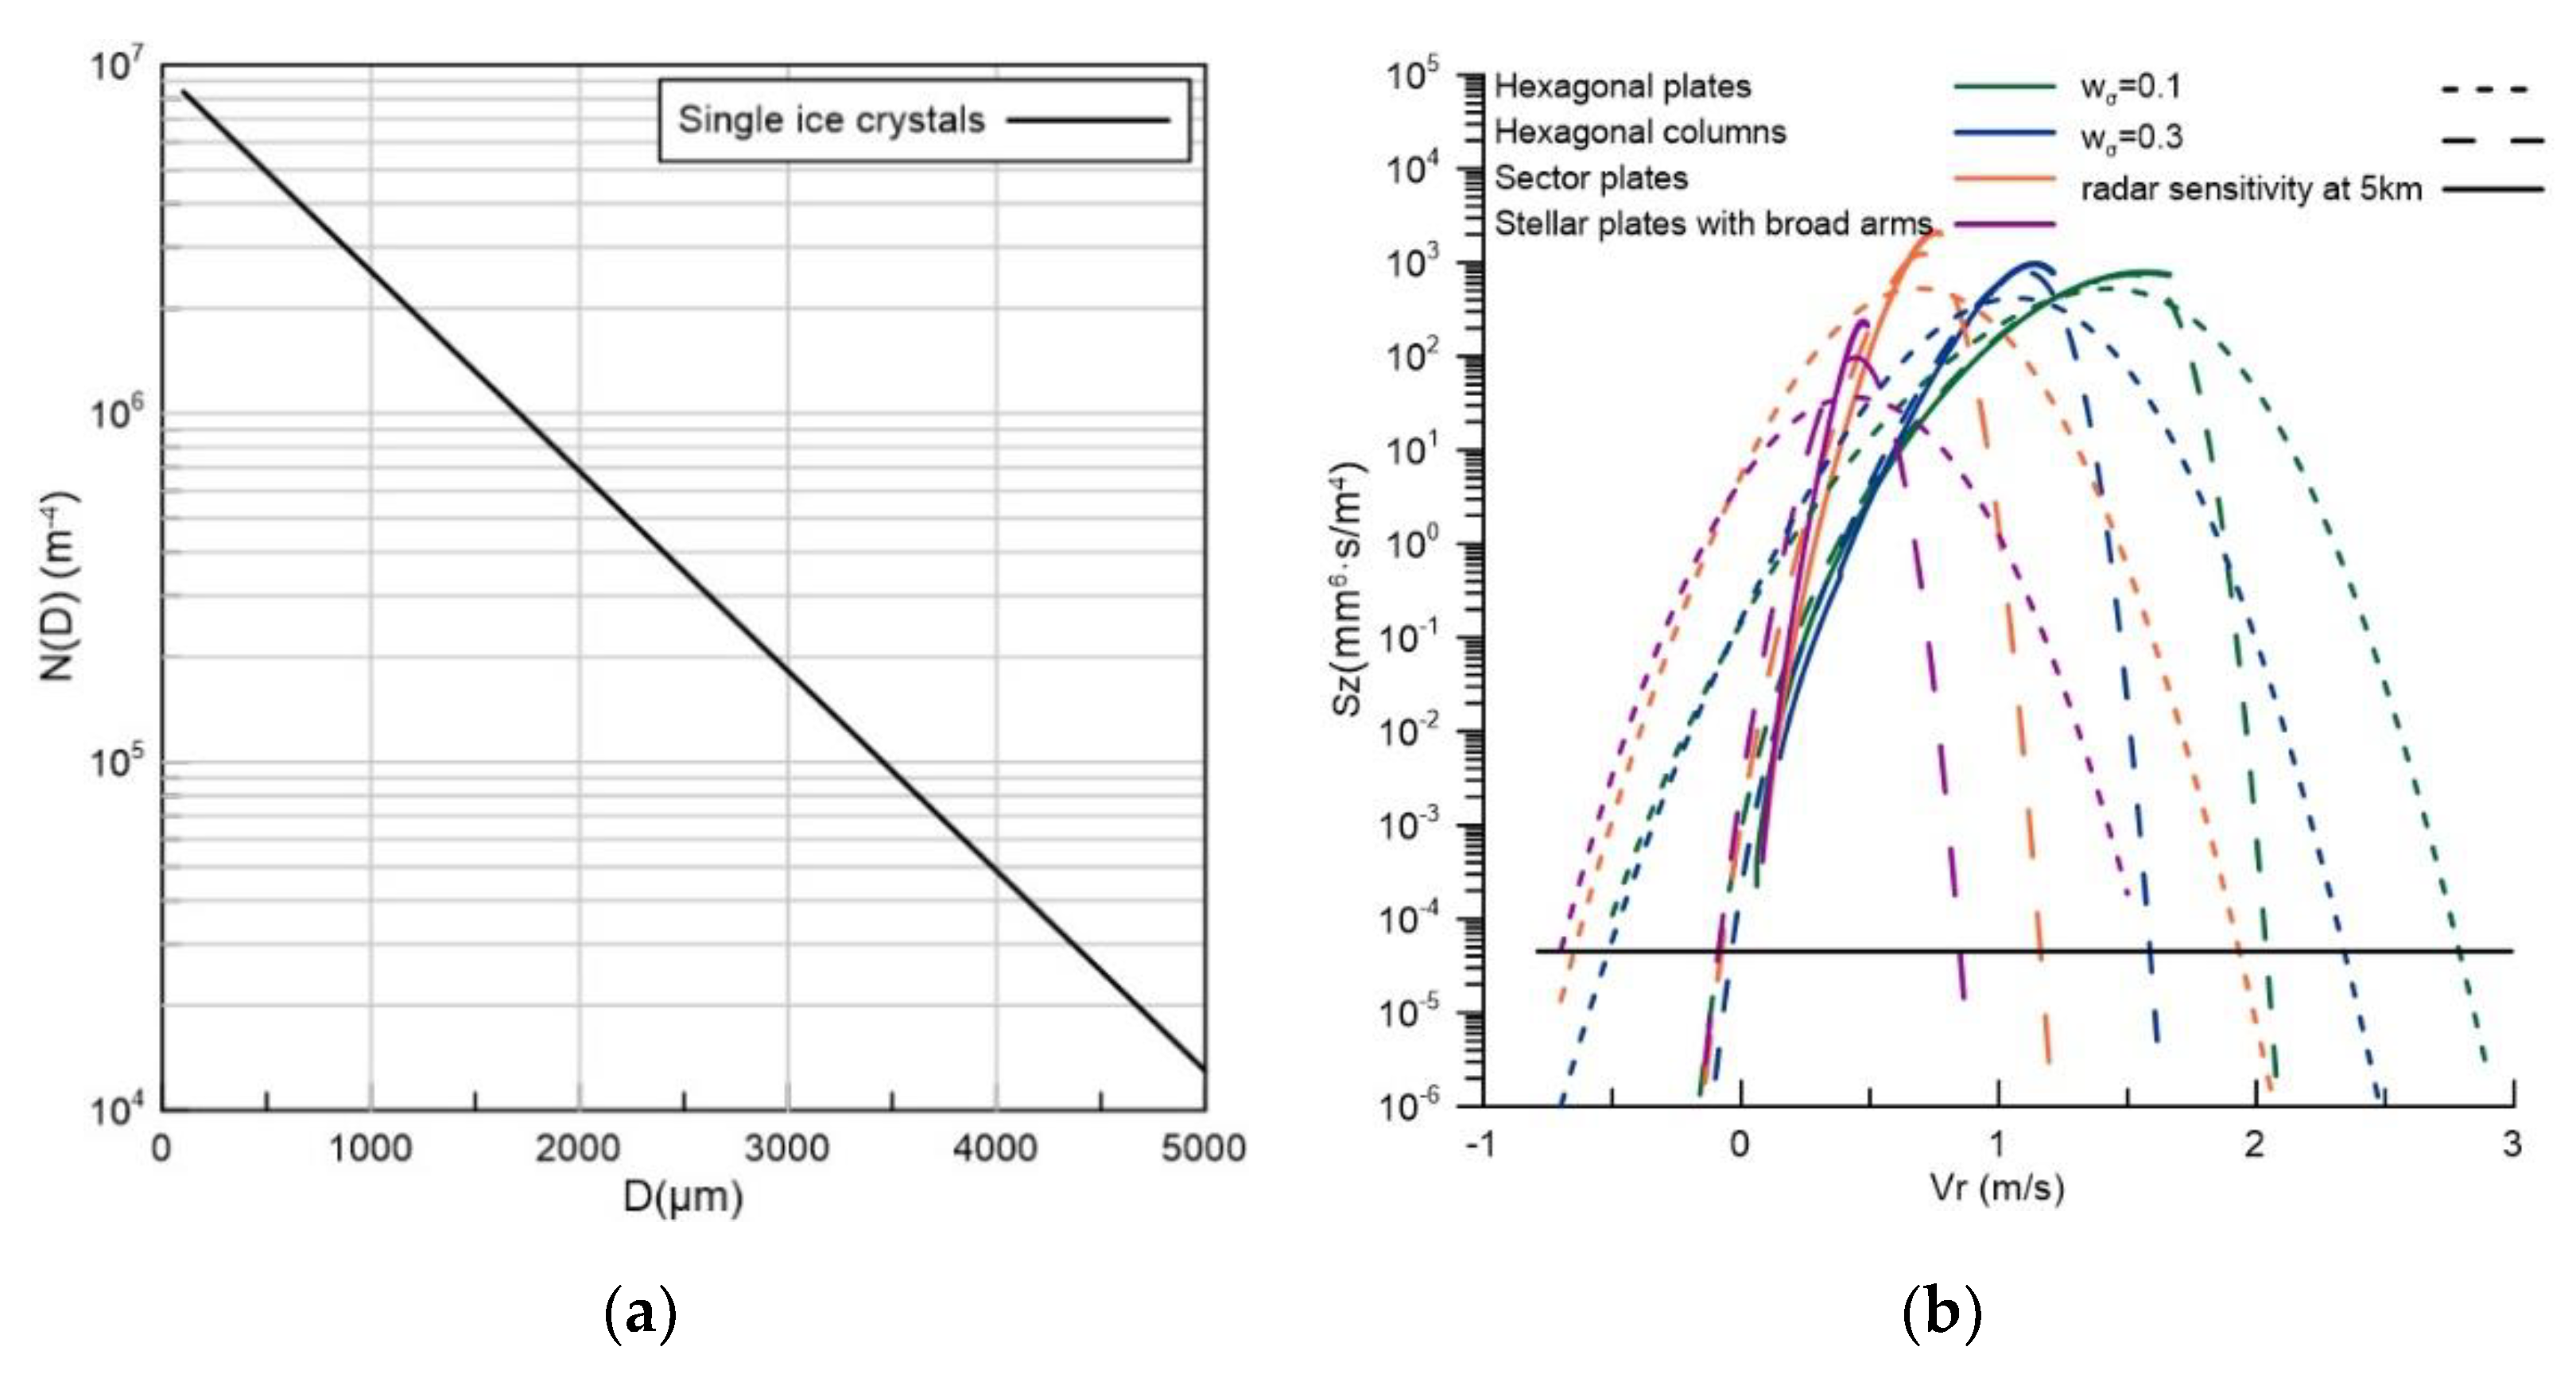
where N ( D ) (m−3 mm−1) is the number of particles per unit volume per unit, N0 (m−3 mm−1) is the intercept parameter, and Λ (mm−1) is the shape parameter. We used the Marshall–Palmer constants given by Platt at −10 °C~−5 °C, with N0 and λ values of 9560 m−3 mm−1 and 1.32 mm−1, respectively [37]. For the single ice crystals, we assumed that D ranges from 100 to 5000 μm, and the average PSD was used to calculate the Doppler spectral density produced by four kinds of single ice crystals (based on Equation (1)). The PSD used for Doppler spectrum simulation are shown in Figure 4a. By using Equation (7), the equivalent reflectivity values generated by the four crystal types were 25.8, 24, 24.7, and 12.9 dBZ (hexagonal plates, hexagonal columns, sector-like plates, and stellar crystals). Additionally, the Doppler spectrum affected by air turbulence at different intensities was calculated. According to Gossard et al. [9], the convolution of Doppler spectrum in clear-air and the air turbulence could be written as:
S z T ( v r ) = 1 π w σ 0 S z [ v f ( D ) ] e x p [ ( v r v f ) 2 w σ 2 ] d v f
where S z T and S z represent the Doppler spectral density affected by turbulence and in clear-air, respectively. w σ is the intensity of turbulence. As can be seen in Figure 4b, air turbulence would broaden the Doppler spectrum while weakening its peak. The stronger the turbulence, the more severe the spectral distortion. For the turbulence of the same intensity, a narrower Doppler spectrum has more severe distortion. Due to the high sensitivity of mode 3 of our radar, the sensitivity has a limited effect on the detection of Doppler spectrum, which could be ignored in the retrieval of PSDs.
Comparing the Doppler spectra generated by different types of ice crystals with the same PSD in Figure 4b, the width of the spectra was mainly inversely proportional to the rate at which the falling velocity increased with the particle scale. The faster the velocity increase with size, the wider the generated Doppler spectrum and vice versa. The value of S Z was jointly determined by particle backscattering cross-section and D / V f (as shown in Equation (1)), which was proportional to the σ and inversely proportional to the rate of velocity change with particle size.
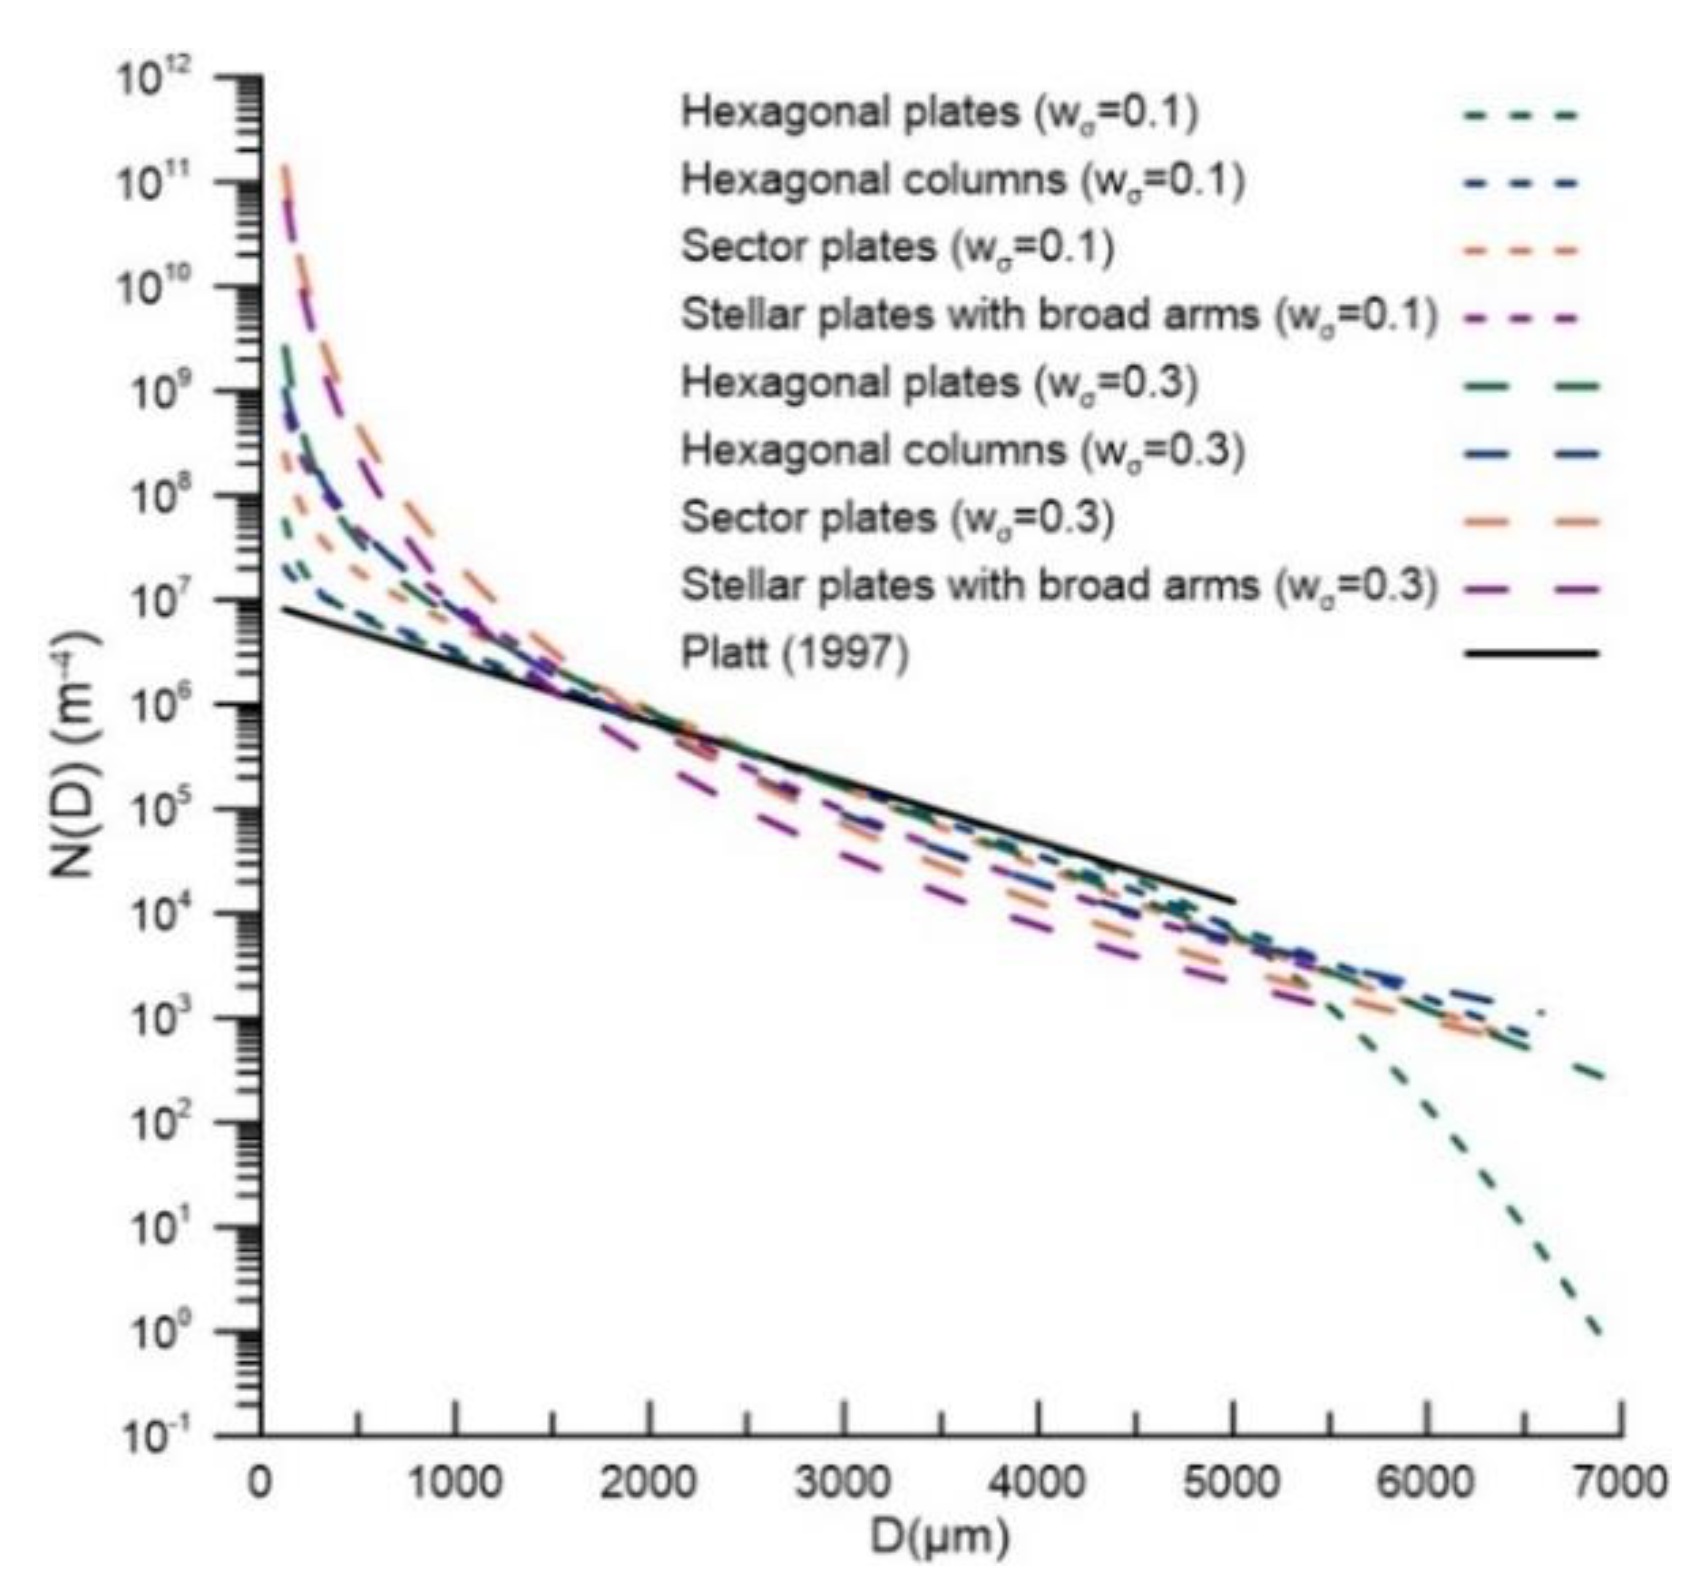
To further study the effect of turbulence on PSD retrieval, the affected Doppler spectra were used to invert the new PSD, and compared to the original given PSD. According to Figure 5, the retrieved PSD (the dashed lines) were significantly wider than the original one (the black solid line). Additionally, the value of the retrieved N(D) was also deviated. The concentration was overestimated when the size of particle was small and when the particle size was large, the concentration was underestimated. It could be easily seen that stronger turbulence had a greater impact on the inverted PSD, which would cause the particle number to seriously deviate from the true value. Moreover, different types of ice crystals have varying degrees of sensitivity to turbulence. Compared with sector crystals and stellar crystals, hexagonal plates and hexagonal columns are less affected by turbulence.

3.2. Retrieved Ressults from MMCR

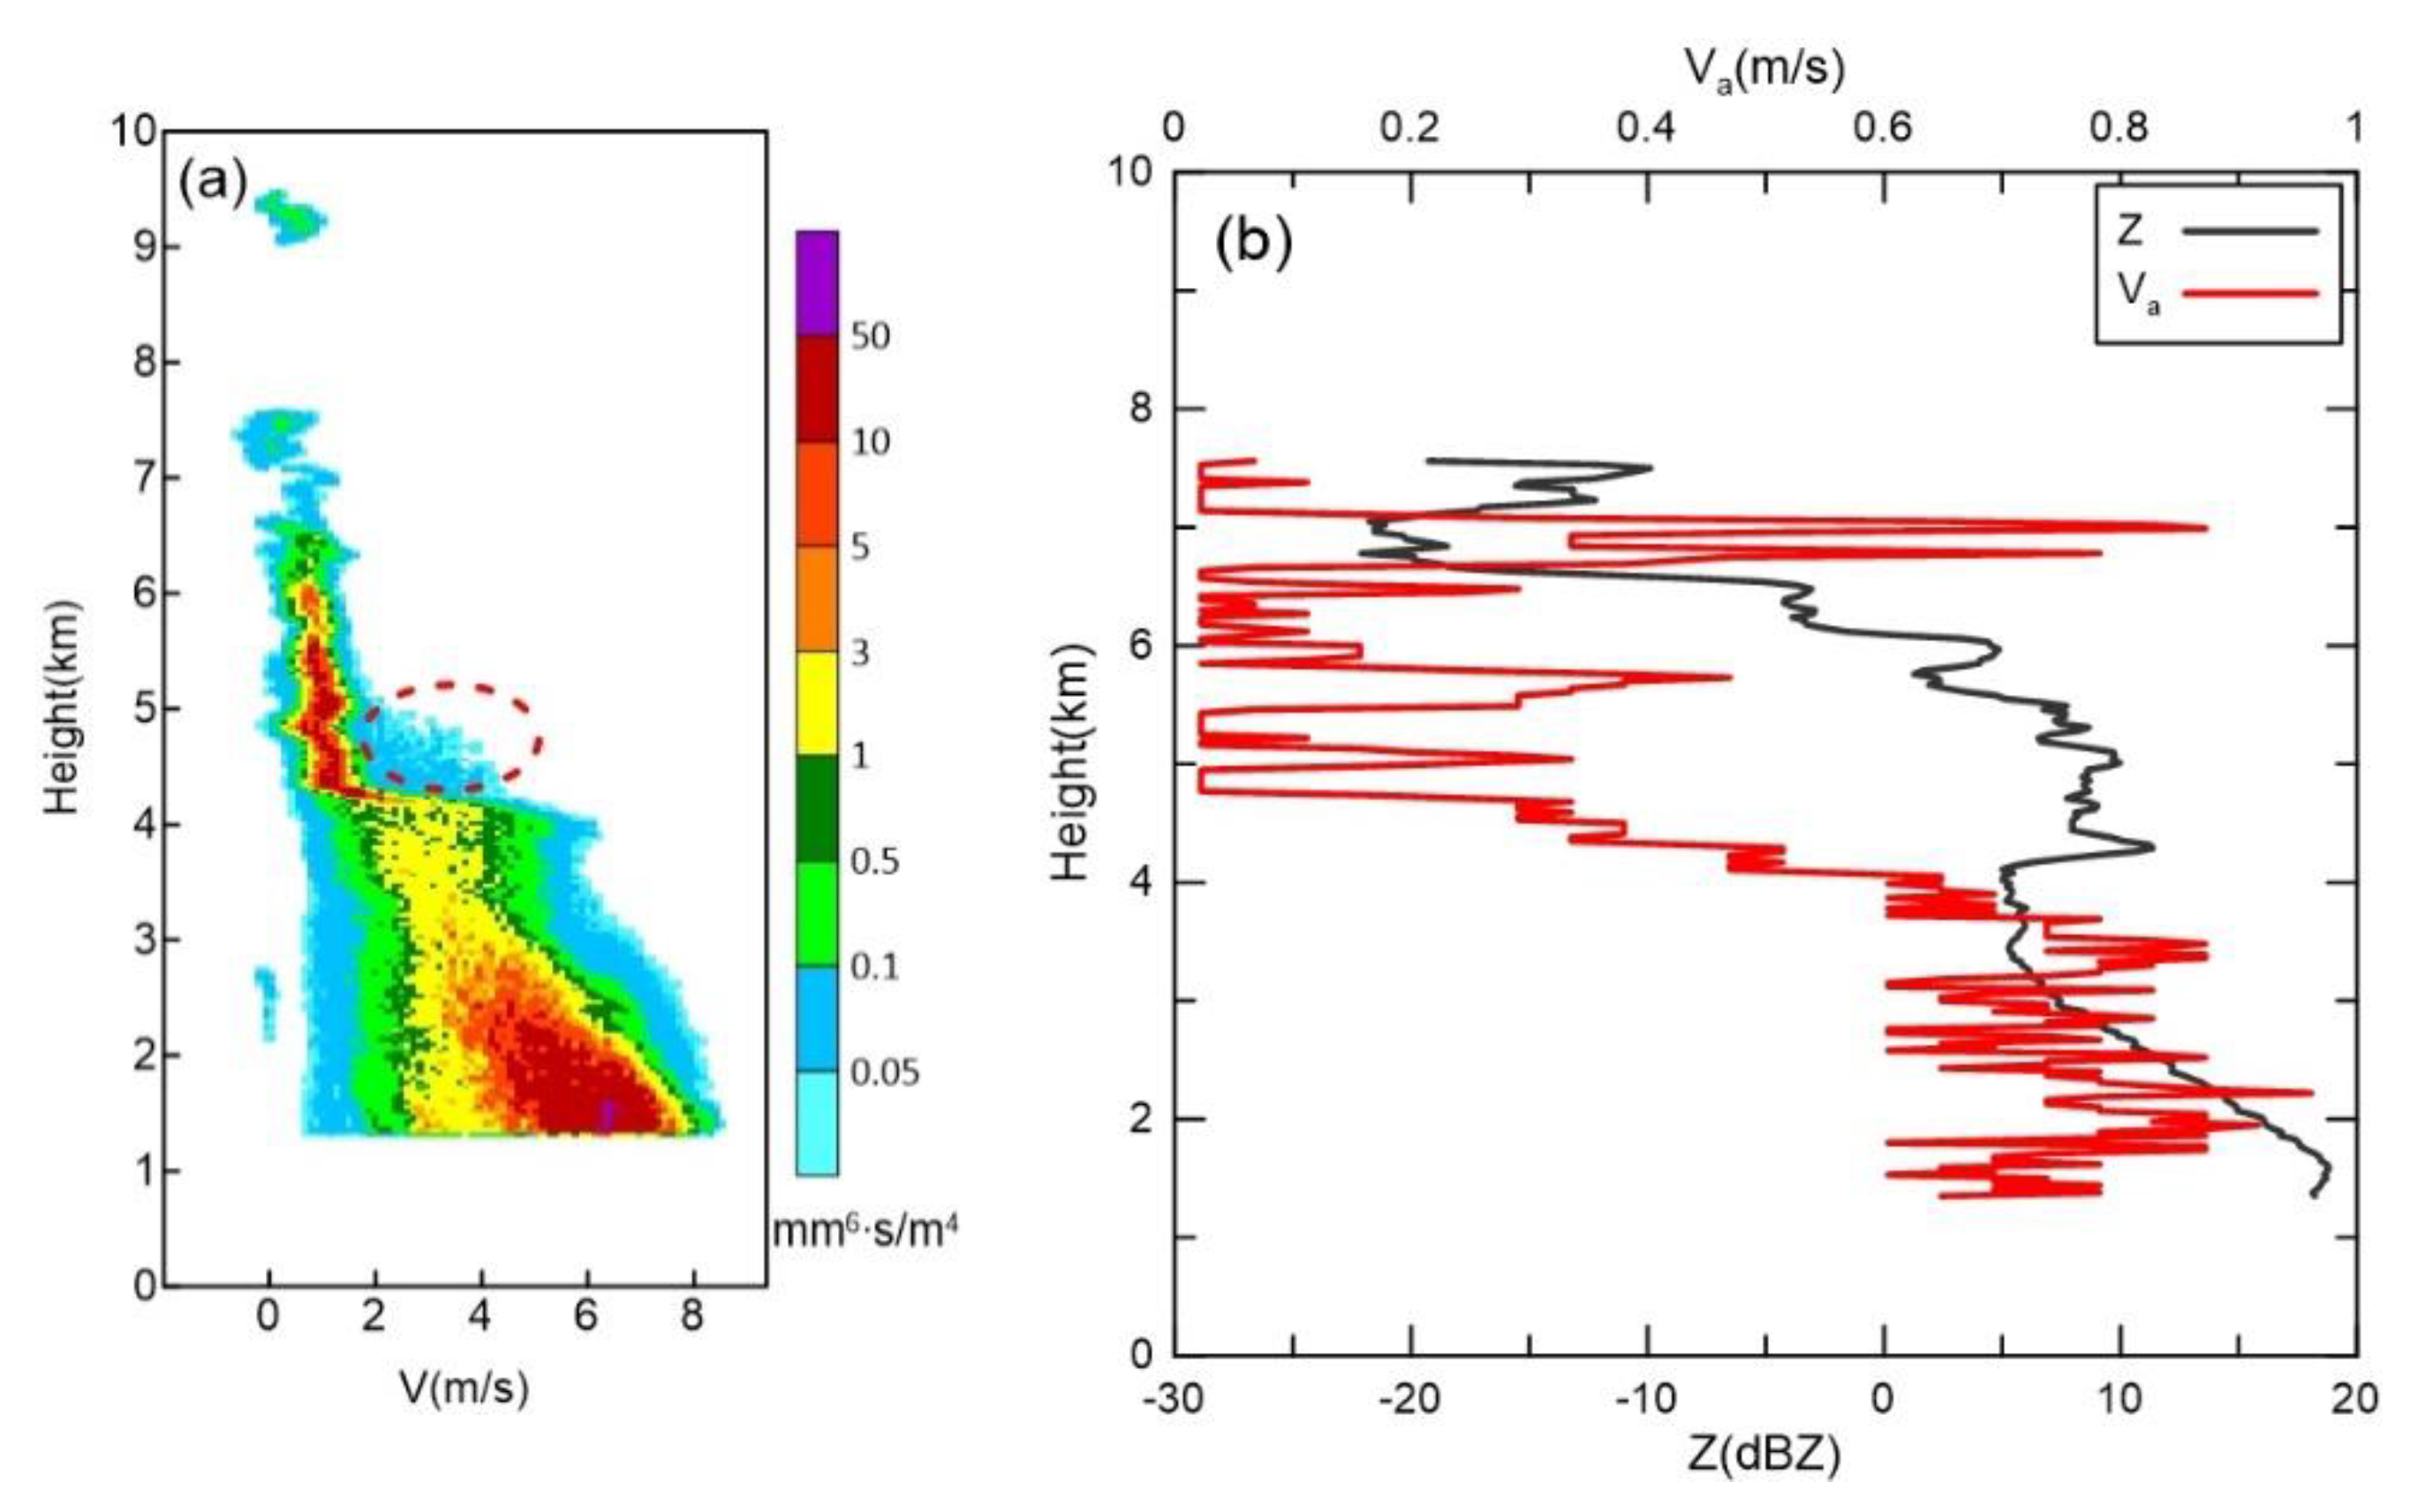
Reflectivity and Doppler spectral density data from the M3 mode, with a higher speed resolution and sensitivity, were used to retrieve the PSD and IWC. The high-velocity resolution meant that a fine PSD could be produced. On the basis of the relationships that we established, more sophisticated Doppler spectra would yield more accurate PSDs. Figure 6a shows Doppler spectral density data of a beam obtained at 5:38 (UTC) by MMCR. The side lobe echo is highlighted by a red circle. The raw Doppler spectral density data from the four work modes were post-processed and used to recalculate reflectivity and retrieve the vertical air motion. The data post-processing included quality control (QC), and recalculating Doppler moments [17]. QC for Doppler spectra included dealiasing singly wrapped aliased Doppler spectral density data and detecting and removing artifacts produced by pulse compression. After QC, we directly estimated the vertical air velocity using the velocity bin of small particles, such as liquid droplets and small ice crystals, assuming that these particles could be considered tracers of clear-air motion in the measured spectra since the falling velocity of the particles themselves could be ignored relative to the air speed, when the particle size was small enough [5,6]. We calculated the attenuation coefficient according to Wang’s algorithm and conducted attenuation correction of Doppler spectral density, bin by bin, from the first range to the end [38]. In addition, since the occurrence of stable stratiform precipitation during observation, the effects of turbulence were neglected when performing the PSD retrieval.
Reflectivity and retrieved air speed profiles based on “small-particle tracers” are shown in Figure 6b. On the basis of the Z e profile and Doppler spectrum, we inferred that the melting layer was at approximately 4.15–4.5 km. Additionally, the Doppler spectrum width suddenly narrowed at 4.5 km, indicating that echoes above this height were mainly generated by ice particles. Below the melting layer (4.15 km), we inverted the Doppler spectrum using the v f –D relation of raindrops given by Gossard [6] and the σ –D relation calculated using the extended boundary condition method [39]. Above the melting layer (4.5 km), we assumed that there was only one ice crystal type in the cloud and used the microphysical relations established in Section 2 to derive the PSD. In addition, the size of all ice particle types was controlled within the limit of the particle scale that exists in nature.
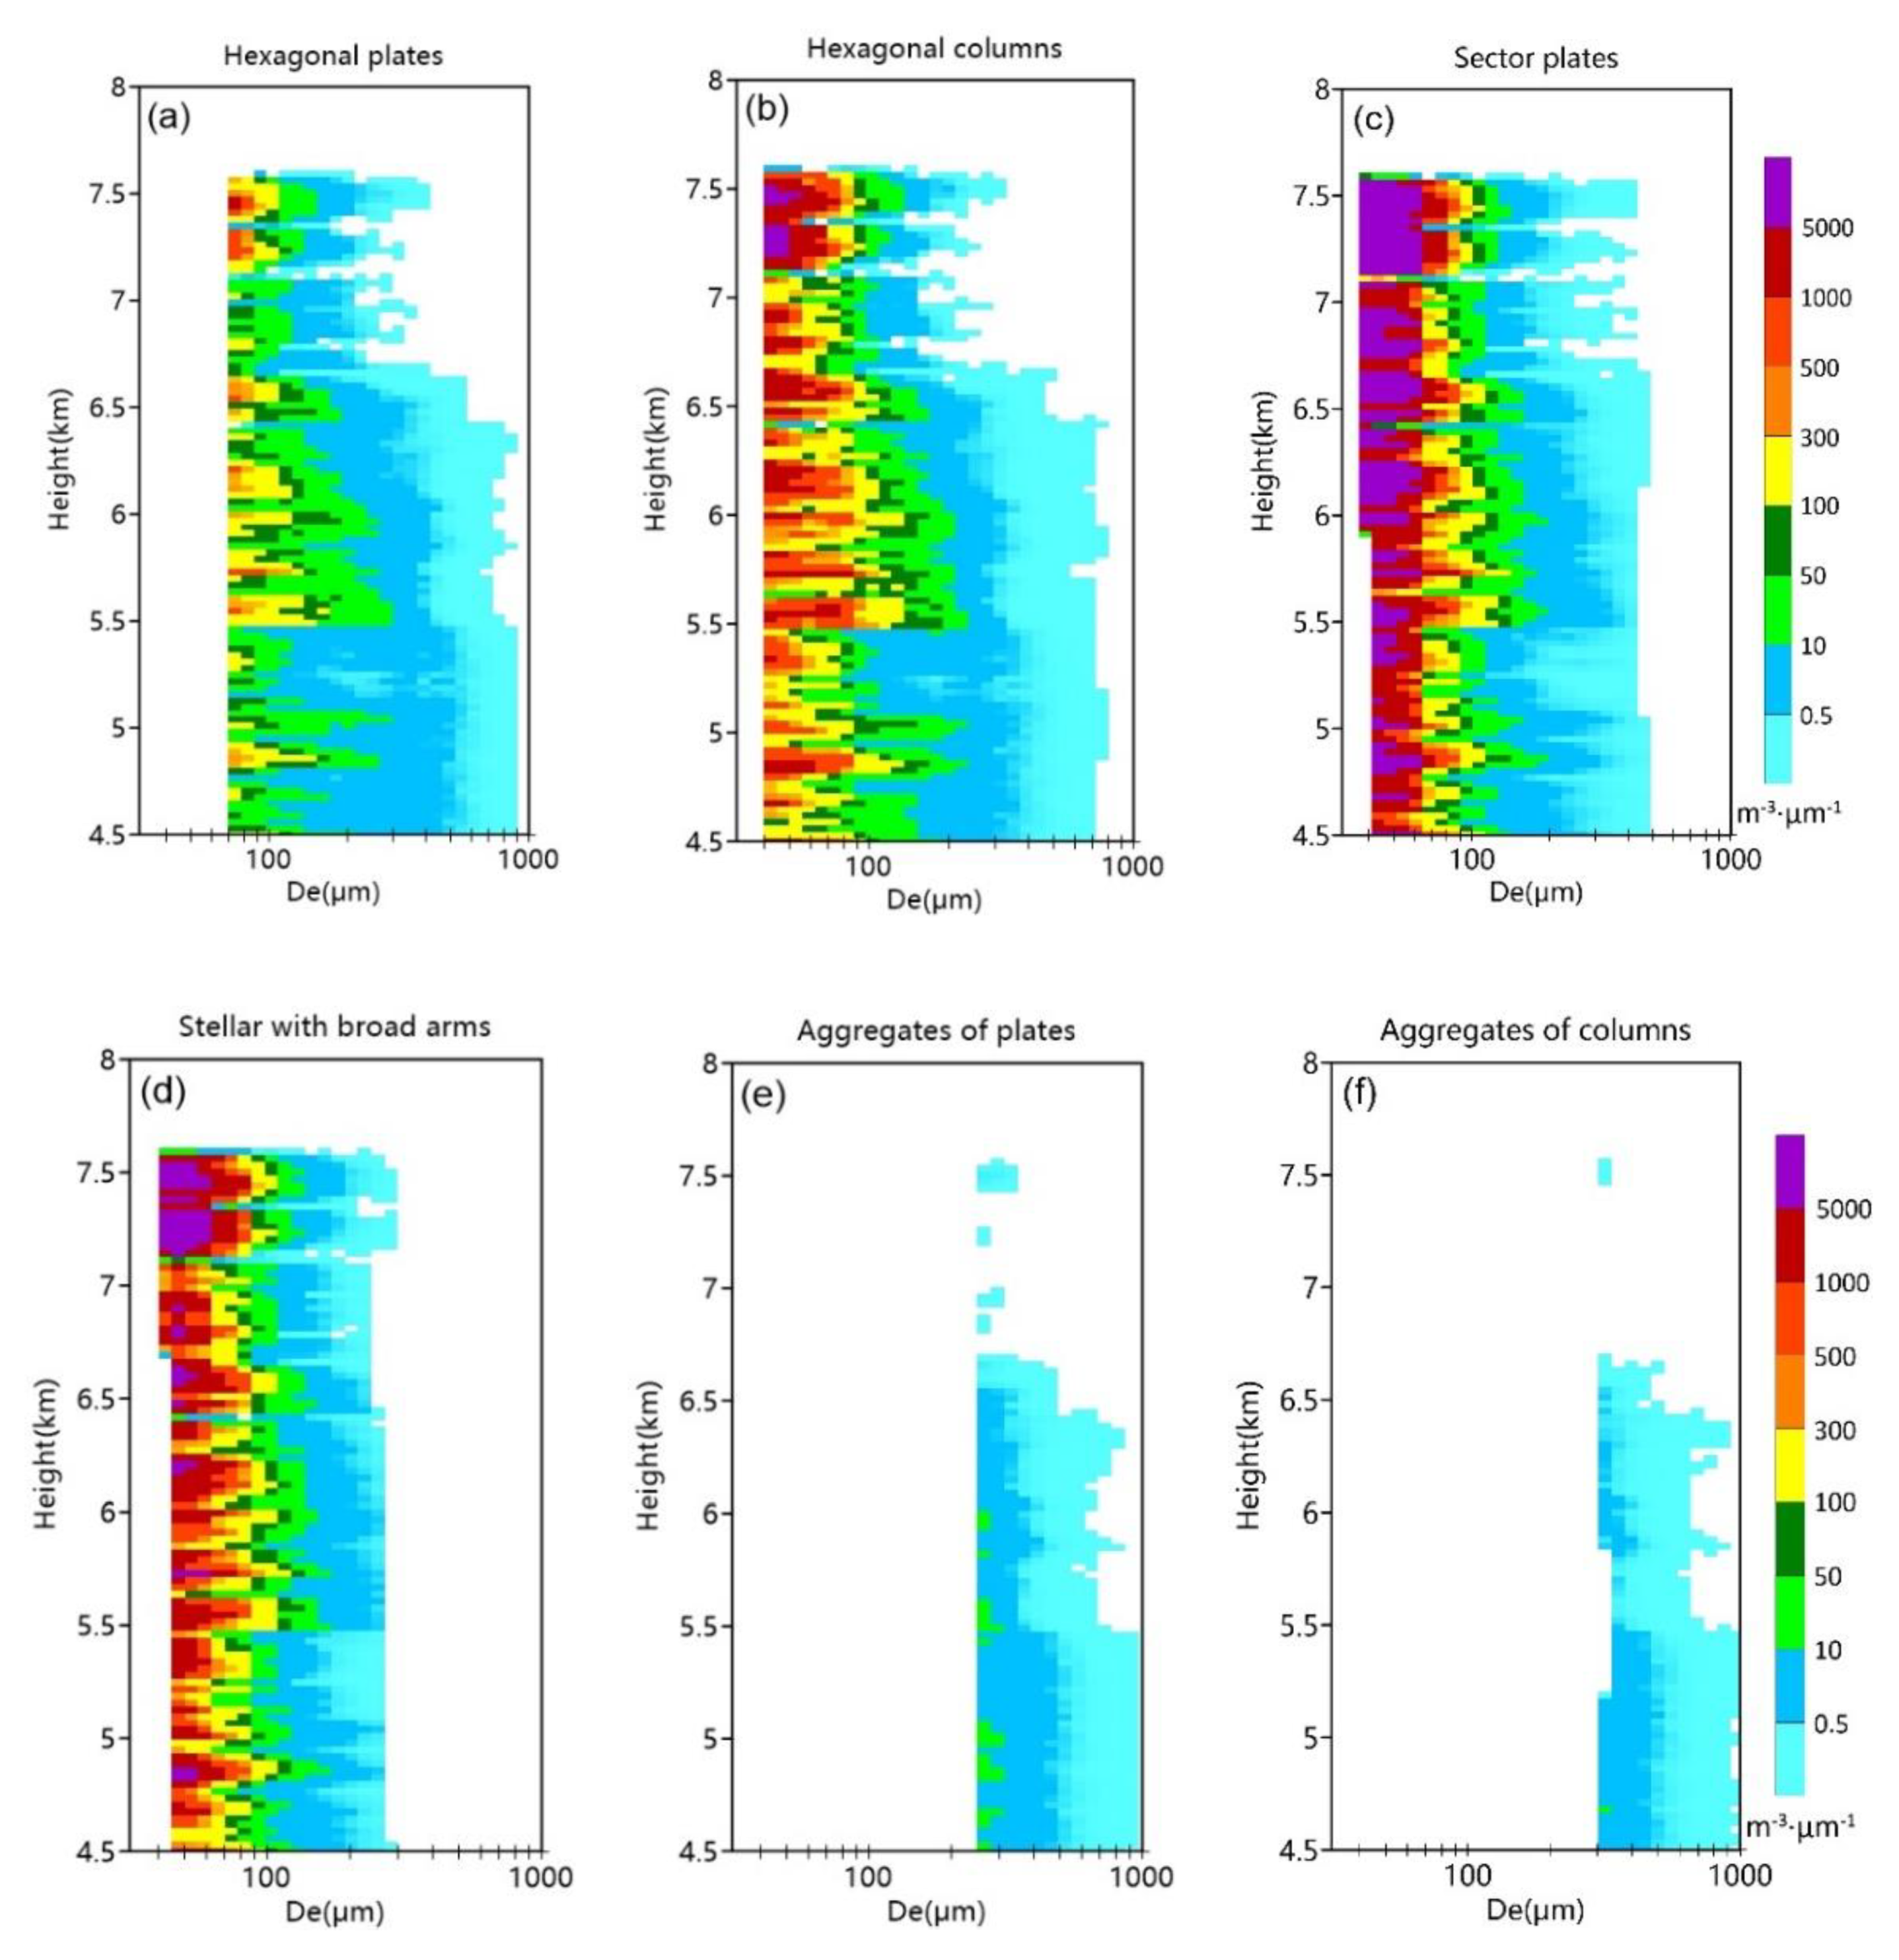
Under the assumption that the ice crystals in the cloud were all of the same shape, the inversion results of the concentration of ice crystals of different shapes are shown in Figure 7. Generally, the change trends of PSD widths of the six particle types are similar to those of the Doppler spectral width with height. However, the concentrations of different types of particles retrieved from the same height are different. For Doppler spectral density data, the corresponding velocity represents particle size; thus, the droplet spectrum width is mainly determined by particle fall velocity. In other words, the smaller the particle size corresponding to the same velocity, the more left broadened the derived PSD spectral width. Similarly, the slower the fall velocity increases with particle size, the larger the particle size corresponding to the large fall velocity and the more right broadened the derived PSD spectral width. By comparing the PSD results of the six particle types, we could see that the PSD spectra were incomplete, due to the limitation of the particle physical scale (only a part of them existed). The hexagonal plates and two kinds of aggregates were mainly affected by the lower limit of the physical scale, and their minimum discernible D e values were 70, 240, and 300 μm, respectively. Additionally, the hexagonal columns, sector plates, and stellar plates were mainly affected by the upper limit of the physical scale, with maximum discernible D e values of 800, 500, and 300 μm, respectively. There must be no aggregates of columns in the inversion results when D e is less than 300 μm, and the aggregates must be present when D e is greater than 930 μm. It is important to note that the physical scale constraint did not allow all Doppler spectra density data to be involved in PSD retrieval when only one ice particle type was assumed to be present in the cloud. This is also the reason why the Z e values calculated using the PSD retrieved for different ice crystals were slightly less than the reflectivity values shown in Figure 6b.
Moreover, it can be seen from Figure 7 that the concentration of small particles was largest at each height, and the particle concentration decreased with increasing particle size. The conclusion of the simulation demonstrated that particle number was inversely proportional to the particle’s σ and directly proportional to D / V f . The sector plates had the highest concentration when D e was less than 100 μm and had a smaller D e than the stellar crystals for the same falling speed; thus, the smaller backscattering cross-section coupled with a larger D / v f , resulted in a high concentration. Although the two kinds of aggregates only had the PSD of large-size particles, the aggregates of plates had a slightly higher concentration than that of column aggregations. As the two have almost identical backscattering cross-sections, the difference was mainly caused by the fall velocity. Considering the existence of echo generated by particles with small speed, there must be single crystals within the radar detection volume.
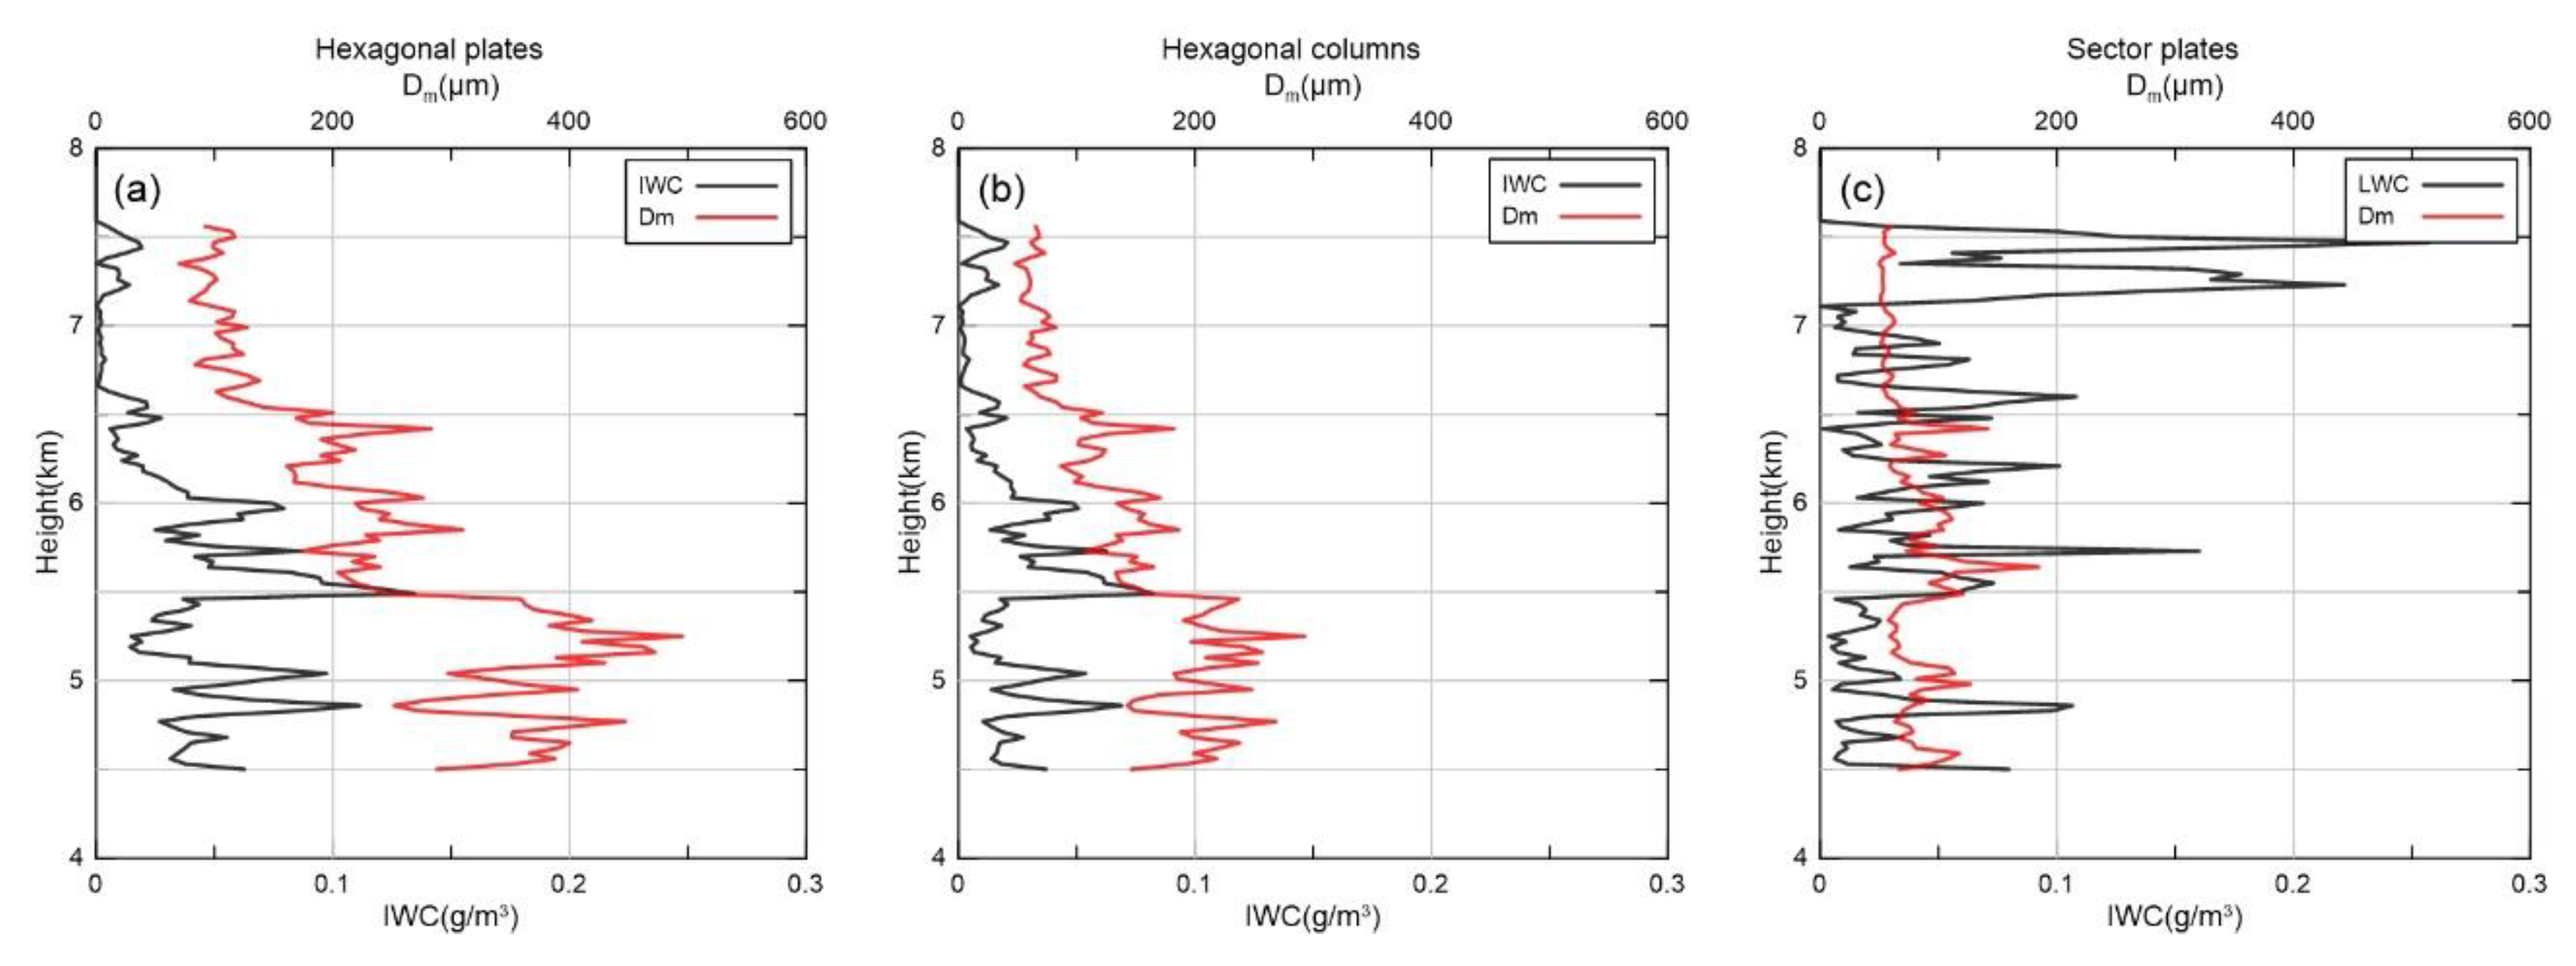
Figure 8 shows retrieved IWC and D m profiles for the six ice particle types. IWC values derived from the hexagonal plates and hexagonal columns showed a consistent trend with height, with relatively uniform changes below 6 km and gradual decreases with increasing height above 6 km. Due to physical size limitations, hexagonal plates had a narrower PSD spectrum than hexagonal columns. However, the small particle concentration for hexagonal plates was smaller than that of hexagonal columns, and the concentration of large particles was larger; thus, hexagonal plates had an IWC of about 0–0.12 g·m3, whereas the IWC of hexagonal columns was approximately 0–0.08 g·m−3. Additionally, sector plates and stellar plates had relatively consistent IWC change trends, with the overall changes relatively uniform below 7 km, and the IWC increasing sharply above 7 km. Figure 7 shows that the sector plates had wider PSD spectra and a larger concentration; thus, their IWC was larger, ranging 0–0.1 g·m−3 below 7 km. Stellar crystals had an IWC of approximately 0–0.04 g·m−3, which was roughly half that of the sector plates. The IWC variation trend of the aggregates were also very similar, although they only had the PSD spectra of large particles, as the large particle concentration was slightly larger than that of other ice crystals, especially for the aggregates of plates. The aggregates of columns and plates had IWC values that were not particularly small, at 0–0.08 and 0–0.06 g·m−3, respectively. Additionally, the D m profiles of different ice crystals were similar to the PSDs shown in Figure 7. The more the PSD spectrum widens to the right, the bigger the D m would be, and the narrower the PSD spectrum becomes to the left, the smaller the D m would be. Hexagonal plates have D m values about 1.5 times larger than those of hexagonal columns, mainly because of the lack of small particles in the hexagonal plates’ PSD. The D m values of the aggregates were similar, and the D m values of sector plates and stellar plates were almost identical. Additionally, the change of all D m values with height was similar to the changes in IWC.

3.3. Comparison with Aircraft Detection

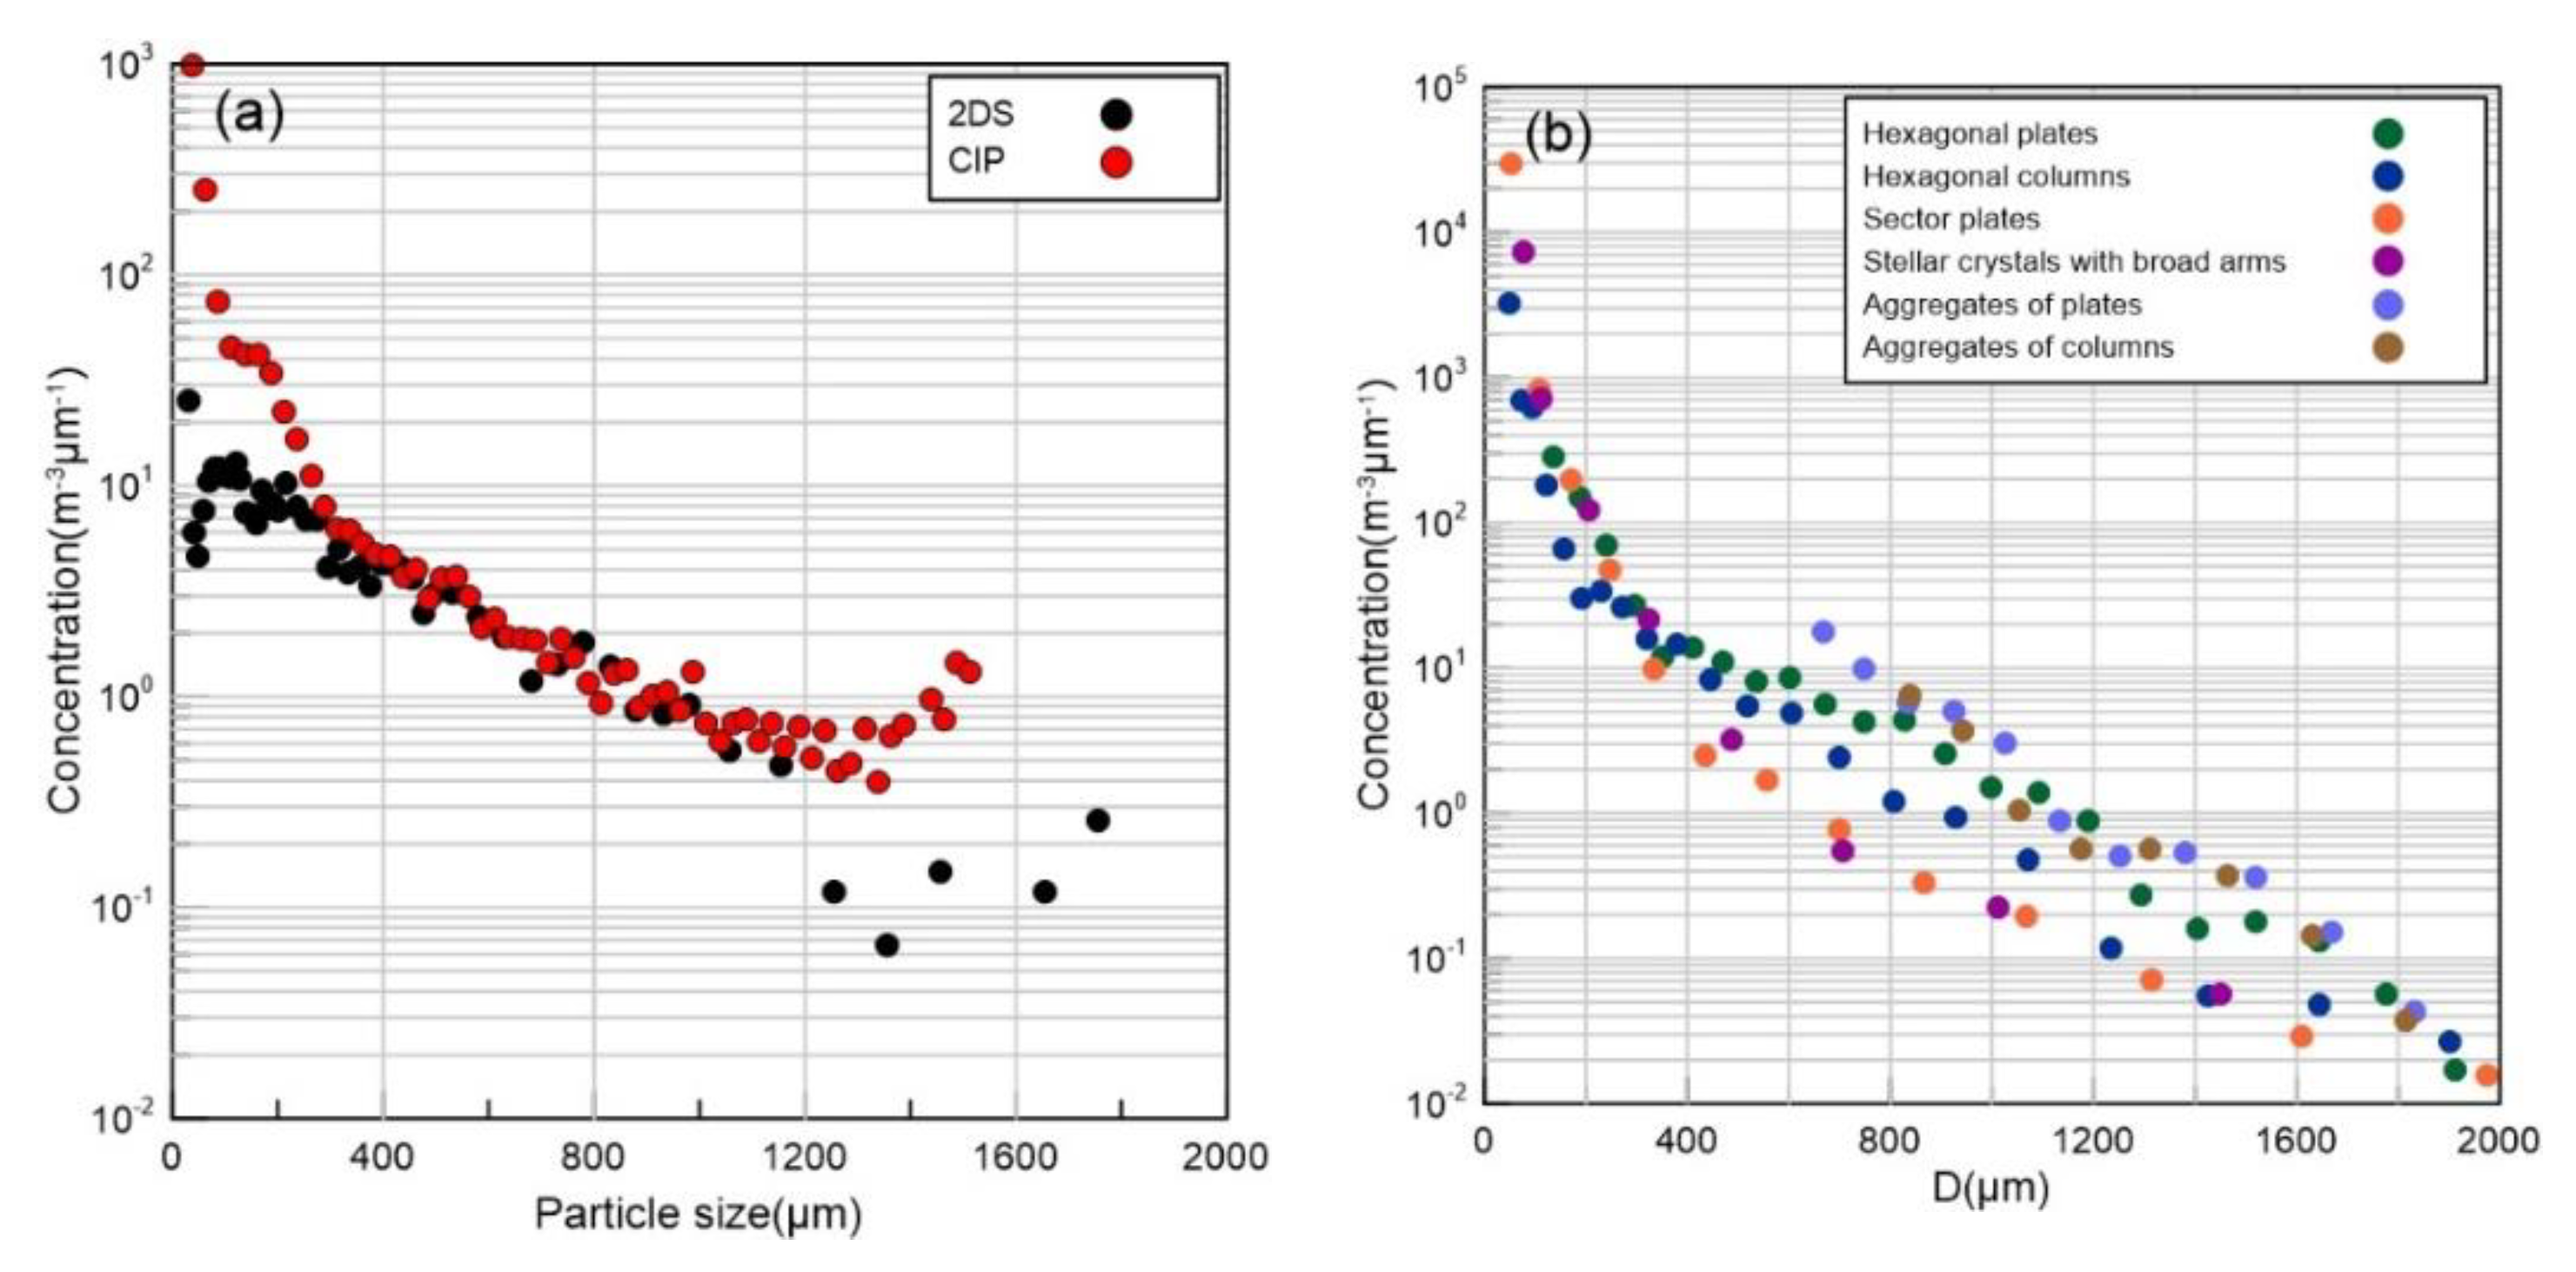
Because the aircraft’s maximum flight altitude was about 4900 m, to compare the inversion results of MMCR with the PSD observed by the aircraft, the particle concentration above 4.7 km (above the melting layer) observed by the 2D-S and CIP probes was first averaged and then compared with the PSD retrieved from MMCR data at 4.5 km. The results are shown in Figure 9 (note that both the aircraft and radar results are denoted by the maximum particle size because of the way the probe takes measurements). The 2D-S and CIP probes have consistent measurements. The particle concentration decreased with increased particle size, and the concentration of 400–1200 μm particles detected by the two probes was almost equal. Compared to the radar inversion results, the trend in concentration variation with particle size was roughly the same; however, the radar inversion concentration decreased more quickly with increased particle size and was much larger than that observed by aircraft, for small particles. Focusing on the concentration of particles smaller than 2000 μm, the size ranges of different ice crystal types with almost identical concentrations, as observed by aircraft, were as follows—hexagonal plates (800–1200 μm), hexagonal columns (600–1000 μm), sector plates (200–600 μm), stellar plates (400–600 μm), aggregates of columns (1000–1600 μm), and aggregates of plates (1000–1600 μm). In fact, because of the aircraft probe’s small sampling volume and the large range bin observed by radar, inconsistencies in particle concentration were inevitable. Additionally, the aircraft data’s time (altitude) average also led to some concentration differences between observation and reality.
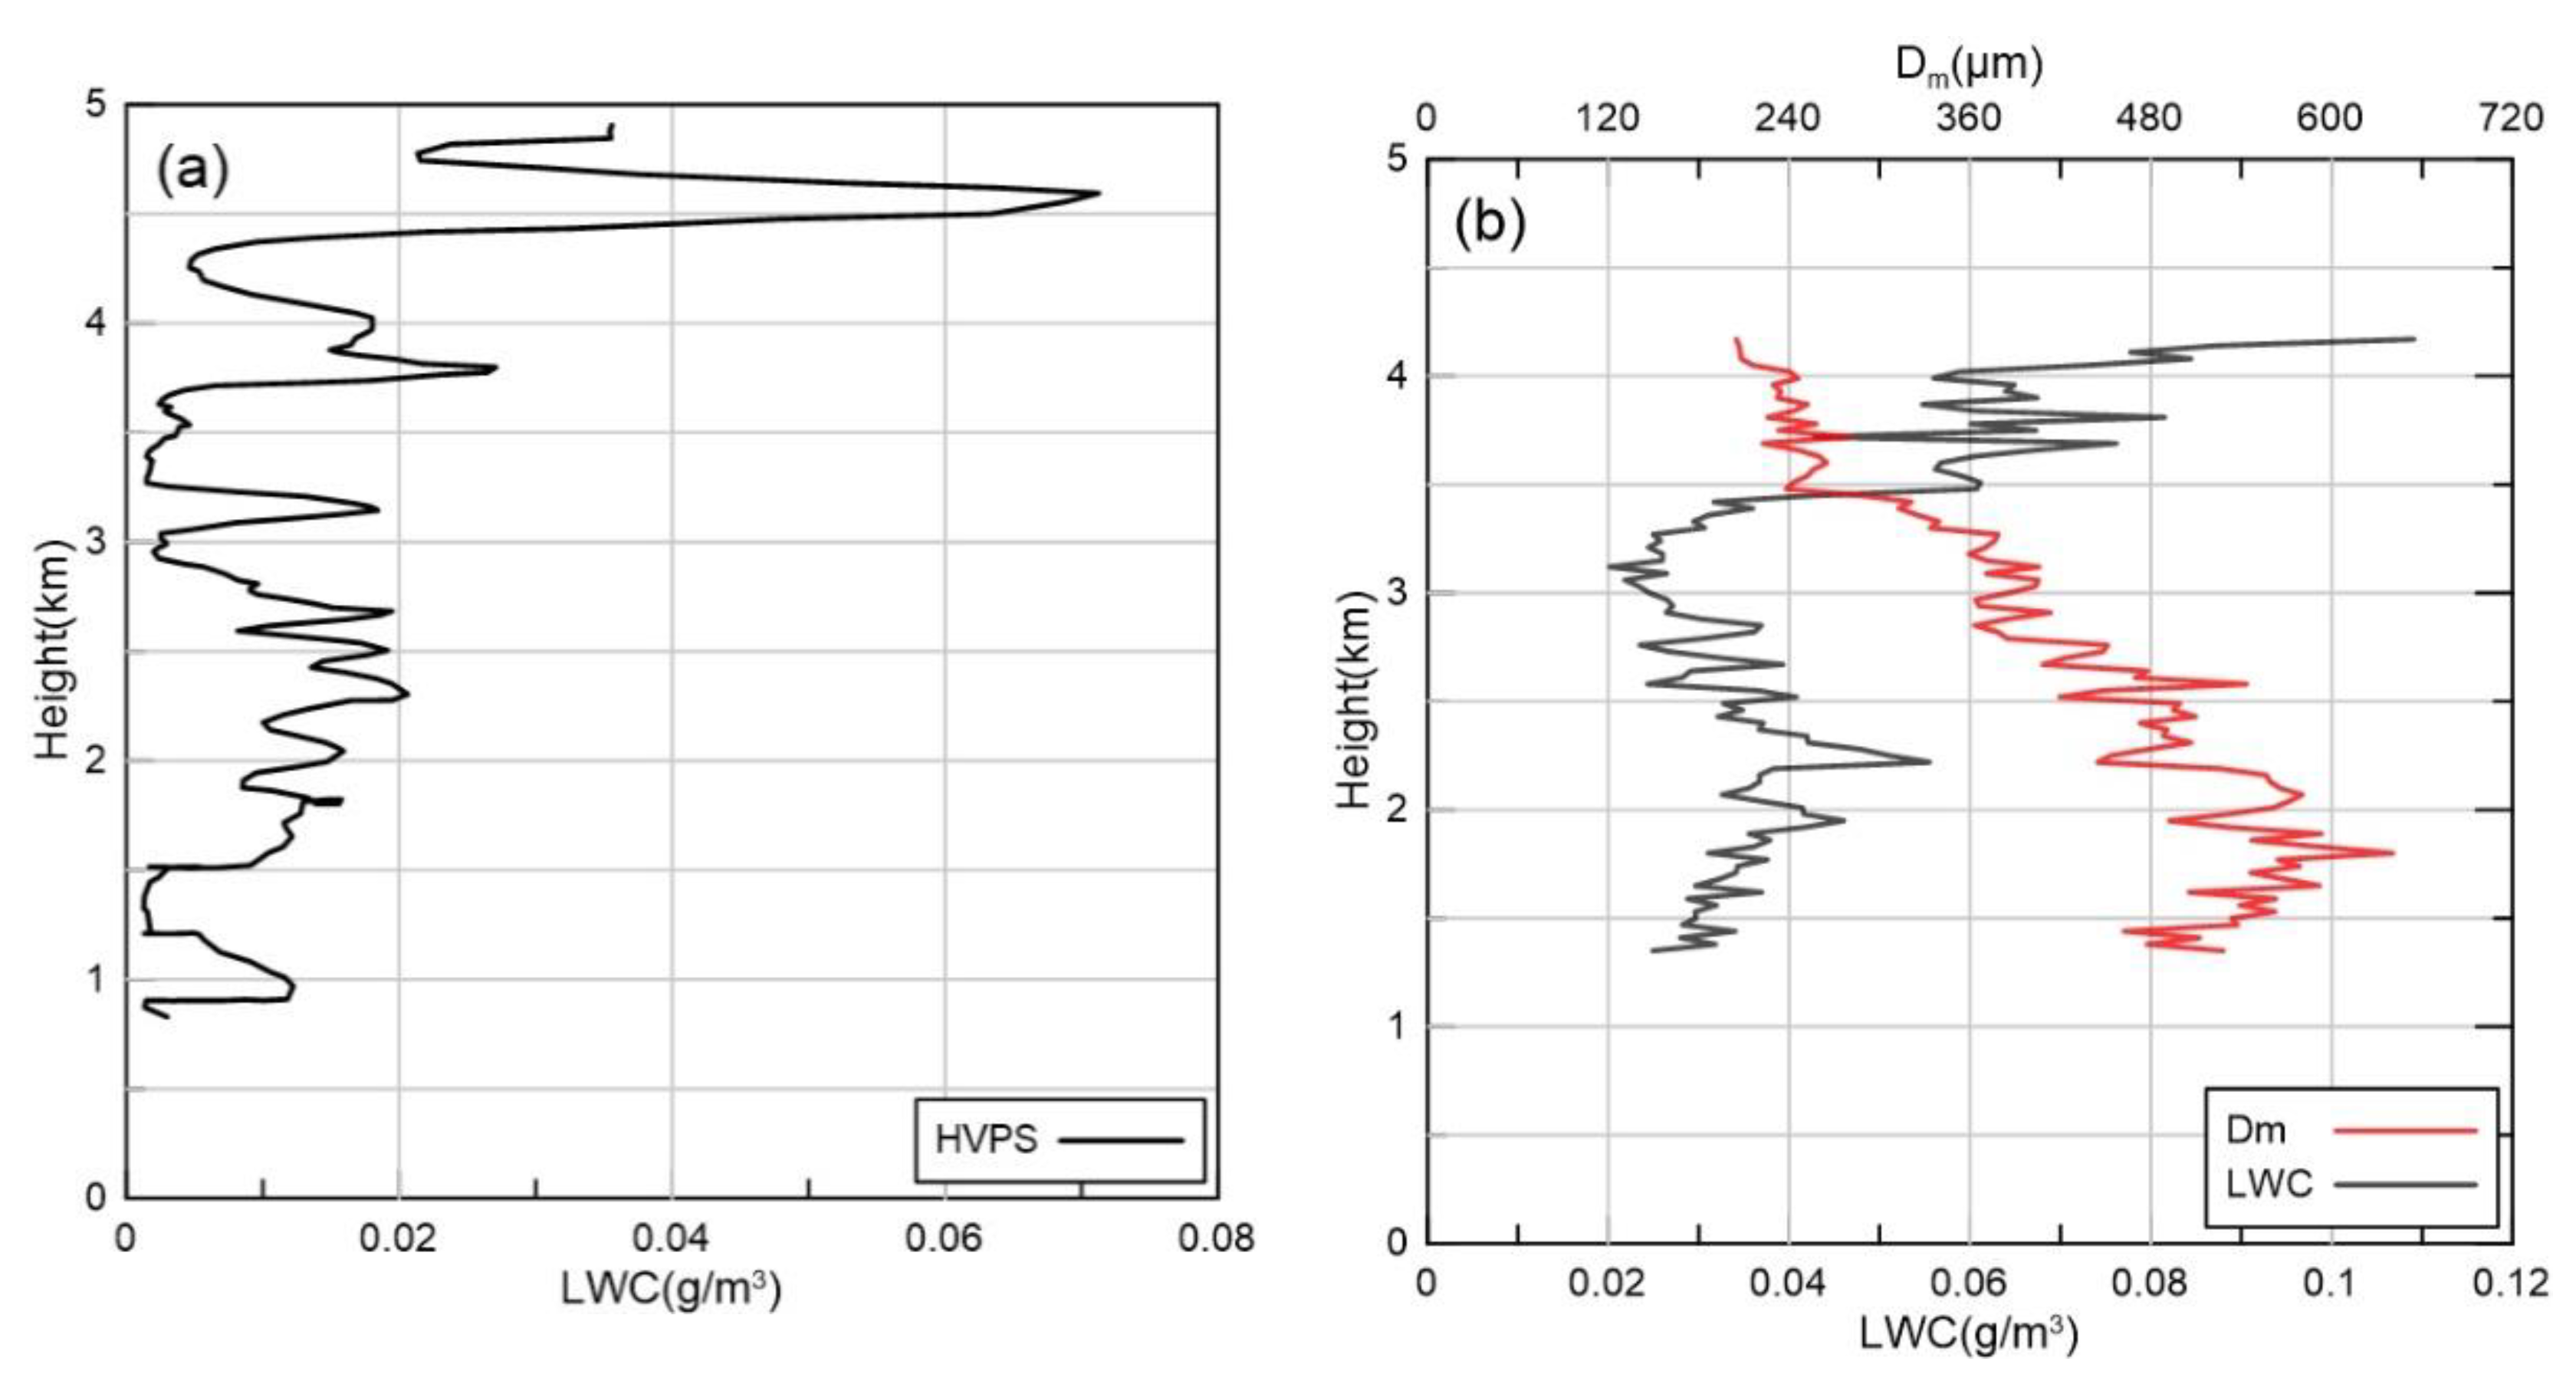
Using the same retrieval method, the liquid hydrometeor PSD was retrieved from Doppler spectra density data below 4.2 km, based on microphysical relationships of liquid droplets. Then, liquid water content (LWC) and D m were calculated using Equations (2) and (3). Figure 10a shows the LWC detected by the aircraft’s HVPS probe, and the LWC and D m values in Figure 10b were retrieved from MMCR. The trend of LWC with height of the two was basically the same, with aircraft-observed LWC within 0–0.02 g·m3 and the radar-retrieved results within 0.02–0.05 g·m−3 being below 3 km. Above 3 km, both aircraft-obtained and radar-retrieved LWC values increased with height; however, radar-based LWC results were still larger than those of the aircraft overall. It is worth noting that the HVPS had a detection range for particles larger than 75 μm and had a 150-μm resolution, making it inevitable that some small particles were missed, resulting in the underestimation of LWC. The aircraft’s temperature detection results showed that the altitude of 0 degree Celsius layer was about 4.5–4.7 km. It could also be seen in Figure 10a that the water content increased significantly near this altitude. Above this altitude, the liquid water content observed by the aircraft was about 0.35 g·m−3, which was very close to the inversion results of the ice water content of hexagonal plates, hexagonal columns and sector plates. Additionally, D m increased with height below 2 km and decreased with height above 2 km, with the peak D m value appearing at 1.7 km. Figure 6a also showed that the widest Doppler spectrum was at 1.5 km.

4. Conclusions and Discussion

To use Ka-band cloud radar Doppler spectral density data to quantitatively analyze the microphysical and dynamic structure properties of cloud ice processes, this paper established the relationship between fall velocity, backscattering cross-section, and particle size of six typical ice crystal types, analyzed the microphysical properties of various particles and their influence on cloud radar reflectivity and Doppler spectral density, and applied the established relationship to the retrieval of ice microphysical properties using Doppler spectral density data on the east side of the Taihang mountain in the Hebei Province, China. We then obtained PSDs at different heights and compared them with the results from aircraft observation. The main conclusions of this study were as follows—for particles with the same equivalent diameter, the fall velocity of aggregates was the largest, followed by hexagonal columns, hexagonal plates, sector plates, and stellar crystals. Hexagonal columns had the largest backscattering cross-section, followed by stellar crystals and sector plates, and the backscattering cross-sections of hexagonal plates and the two aggregate types were very close to those of ice spheres. However, the ice spheres fell two to three times faster than ice crystals with the same D e , which meant that considering different ice crystal types as ice spheres while retrieving the PSD using Doppler spectral data would lead to different degrees of particle scale underestimation. The spectral width of the radar Doppler spectrum generated by the same PSD was mainly affected by particle fall velocity’s increasing rate with increased particle size. The faster fall velocity increased with particle scale, the narrower was the Doppler spectrum. The value of S Z was determined by particle backscattering cross-section and the rate of velocity change with scale, which was directly proportional to the particle backscattering cross-section value and inversely proportional to the rate of fall velocity increase. Additionally, turbulence had a great influence on the PSD retrieval. We assumed that only a certain type of ice crystal existed in the cloud, and the PSD comparison showed that the radar inversions of each ice crystal type corresponded well to aircraft observations within a certain scale range, indicating a great possibility of the existence of this type of particle within that range and fully verifying the feasibility and reliability of ice PSD retrieval from the Doppler spectra. The LWC variation trend with height between radar inversion and aircraft observation was basically the same, whereas the aircraft-measured value was slightly smaller than that of radar inversion. Additionally, height average was carried out to facilitate the comparison with aircraft observations, making the situation different from reality, which made comparison with radar results more difficult.
Additionally, many studies gave coefficients of the statistical relation between Z e and IWC [12,13,15,40,41,42]. We chose coefficients from several studies to compare against our MMCR-derived IWC results. The relationships between Z e (dBZ) and IWC (g/m3) of ice clouds used in this study are listed in detail in Table 3. Reflectivity above 4.5 km was used to calculate IWC based on five Z e –IWC values. As shown in Figure 11, hexagonal plates and hexagonal columns had IWC values very close to the results from Atlas et al. [41] and slightly less than the results from Protat et al. [13], Mace et al. [15], and Liu and Illingworth [42]. Lower Z e values led to the underestimation of IWC for the two kinds of aggregates, and degree underestimation decreased with increasing Z e . The IWC retrieved from sector plates and stellar plates when Z e values were less than −5 dBZ was larger than that calculated from other studies, and was less when the Z e values were greater than −5 dBZ. Almost all ice crystal types had IWC values less than those from other studies, when the reflectivity was stronger than 0 dBZ, and this underestimation tended to become more serious when reflectivity was greater than 10 dBZ.
The above work is a preliminary attempt to establish a forward modeling method for Doppler spectral density data of solid precipitation particles. In the future, more microphysical parameters of precipitation particles can be used to establish a more complete relationship, and can aid in the interpretation and analysis of radar Doppler spectral density data. In addition, this study used one set of shape parameters for the calculation of each ice crystal type; however, there are many other ice crystal proportions in nature. Moreover, it could be seen that the turbulence had a great effect on the PSD retrieval. Although we neglected the influence of turbulence in the inversion during the observation, due to the relatively stable stratiform precipitation, the effects of turbulence are still worthy of attention and discussion. Additionally, because our field measurement only obtained one dataset of aircraft and radar joint observations for the retrieval of PSD using Doppler spectral density data, our work assumed that there was only one particle type in the cloud. Further verification requires the support of long-term observation and statistical analysis. Subsequent simulation and inversion can be carried out with a mix of all kinds of ice crystals in proportions based on observations. It is also possible to convert the concentration ratio of different types of crystals to the ratio of the Doppler spectrum generated by different kinds of particles (based on the σ -D and v f -D relationship we established) and to calculate the PSDs of various kind of particles. In short, with such a set of microphysical parameters and size relations of various ice crystal particles, more Doppler spectral density data could be analyzed to statistically study the ice cloud properties and the microphysical processes in the cloud.

Author Contributions

Conceptualization and methodology, L.L.; Formal analysis and software, H.D. All authors have read and agreed to the published version of the manuscript.

Funding

This research was funded by the National Natural Science Foundation of China (91837310 and 41875036).

Conflicts of Interest

The authors declare no conflict of interest.

Abbreviations

ahalf-width of columnar crystals
Aprojected area
A r area ratio (the ratio of projected area to the particle’s circumscribed circle area)
D maximum diameter
D e equivalent ice sphere diameter
D m volume-weighted diameter
ggravity
v a air speed
v f fall velocity
v r radial velocity detected by radar
Z e equivalent reflectivity
S Z Doppler spectral density
N D number of particles per unit volume per unit
σ and σ b backscattering cross section
ε complex permittivity
λ wavelength
ρ i c e ice density
Llength of ice crystals
η dynamic viscosity of air
ρ a i r air density
m mass
R e Reynolds number
X modified best number
A ( s ) area of ice crystals intersected by the plane
kwave number
κ kurtosis parameter
β prefactor of the power law computed by
N 0 intercept parameter of exponential function
Λ shape parameter of exponential function
S z T Doppler spectral density affected by turbulence
w σ intensity of turbulence

References

  1. Rosenfeld, D.; Lohmann, U.; Raga, G.B.; O’Dowd, C.D.; Kulmala, M.; Fuzzi, S.; Reissell, A.; Andreae, M.O. Flood or Drought: How Do Aerosols Affect Precipitation? Science 2008, 321, 1309–1313. [Google Scholar] [CrossRef] [PubMed] [Green Version]
  2. Yu, H.; Kaufman, Y.J.; Chin, M.; Feingold, G.; Remer, L.A.; Anderson, T.L.; Balkanski, Y.; Bellouin, N.; Boucher, O.; Christopher, S.; et al. A review of measurement-based assessments of the aerosol direct radiative effect and forcing. Atmos. Chem. Phys. 2006, 6, 666. [Google Scholar] [CrossRef] [Green Version]
  3. Chakraborty, S.; Fu, R.; Massie, S.T.; Stephens, G. Relative influence of meteorological conditions and aerosols on the lifetime of mesoscale convective systems. Proc. Natl. Acad. Sci. USA 2016, 113, 7426–7431. [Google Scholar] [CrossRef] [Green Version]
  4. Field, P.R.; Heymsfield, A.J. Importance of snow to global precipitation. Geophys. Res. Lett. 2015, 42, 9512–9520. [Google Scholar] [CrossRef] [Green Version]
  5. Kollias, P.; Albrecht, B.A.; Lhermitte, R.; Savtchenko, A. Radar Observations of Updrafts, Downdrafts, and Turbulence in Fair-Weather Cumuli. J. Atmos. Sci. 2001, 58, 1750–1766. [Google Scholar] [CrossRef]
  6. Gossard, E.E. Measurement of Cloud Droplet Size Spectra by Doppler Radar. J. Atmos. Ocean. Technol. 1994, 11, 712–726. [Google Scholar] [CrossRef] [Green Version]
  7. Liu, L.; Xie, L.; Cui, Z. Examination and application of Doppler spectral density data in drop size distribution retrieval in weak precipitation by cloud radar. Chin. J. Atmos. Sci. 2014, 38, 223–236. (In Chinese) [Google Scholar] [CrossRef]
  8. Kollias, P.; Rémillard, J.; Luke, E.; Szyrmer, W. Cloud radar Doppler spectra in drizzling stratiform clouds: 1. Forward modeling and remote sensing applications. J. Geophys. Res. Atmos. 2011, 116. [Google Scholar] [CrossRef] [Green Version]
  9. Gossard, E.E.; Snider, J.B.; Clothiaux, E.E.; Martner, B.; Gibson, J.S.; Kropfli, R.A.; Frisch, A.S. The Potential of 8-mm Radars for Remotely Sensing Cloud Drop Size Distributions. J. Atmos. Ocean. Technol. 1997, 14, 76–87. [Google Scholar] [CrossRef]
  10. Yang, P.; Liou, K.-N.; Bi, L.; Liu, C.; Yi, B.; Baum, B.A. On the radiative properties of ice clouds: Light scattering, remote sensing, and radiation parameterization. Adv. Atmos. Sci. 2015, 32, 32–63. [Google Scholar] [CrossRef]
  11. Liu, G. A Database of Microwave Single-Scattering Properties for Nonspherical Ice Particles. Bull. Am. Meteorol. Soc. 2008, 89, 1563–1570. [Google Scholar] [CrossRef] [Green Version]
  12. Zhao, C.; Liu, L.; Wang, Q.; Qiu, Y.; Wang, W.; Wang, Y.; Fan, T. Toward Understanding the Properties of High Ice Clouds at the Naqu Site on the Tibetan Plateau Using Ground-Based Active Remote Sensing Measurements Obtained during a Short Period in July 2014. J. Appl. Meteorol. Climatol. 2016, 55, 2493–2507. [Google Scholar] [CrossRef]
  13. Protat, A.; Delanoë, J.; Bouniol, D.; Heymsfield, A.J.; Bansemer, A.; Brown, P. Evaluation of Ice Water Content Retrievals from Cloud Radar Reflectivity and Temperature Using a Large Airborne In Situ Microphysical Database. J. Appl. Meteorol. Climatol. 2007, 46, 557–572. [Google Scholar] [CrossRef]
  14. Sassen, K.; Wang, Z.; Khvorostyanov, V.I.; Stephens, G.L.; Bennedetti, A. Cirrus cloud ice water content radar algorithm evaluation using an explicit cloud microphysical model. J. Appl. Meteorol. 2002, 41, 620–628. [Google Scholar] [CrossRef]
  15. Mace, G.G.; Heymsfield, A.J.; Poellot, M.R. On retrieving the microphysical properties of cirrus clouds using the moments of the millimeter-wavelength Doppler spectrum. J. Geophys. Res. Atmos. 2002, 107, AAC 22-21–AAC 22-26. [Google Scholar] [CrossRef] [Green Version]
  16. Zhong, L.; Liu, L.; Deng, M.; Zhou, X. Retrieving microphysical properties and air motion of cirrus clouds based on the doppler moments method using cloud radar. Adv. Atmos. Sci. 2012, 29, 611–622. [Google Scholar] [CrossRef]
  17. Liu, L.; Ding, H.; Dong, X.; Cao, J.; Su, T. Applications of QC and Merged Doppler Spectral Density Data from Ka-Band Cloud Radar to Microphysics Retrieval and Comparison with Airplane in Situ Observation. Remote Sens. 2019, 11, 1595. [Google Scholar] [CrossRef] [Green Version]
  18. Barrett, A.I.; Westbrook, C.D.; Nicol, J.C.; Stein, T.H. Rapid ice aggregation process revealed through triple-wavelength Doppler spectrum radar analysis. Atmos. Chem. Phys. 2019, 19, 5753–5769. [Google Scholar] [CrossRef] [Green Version]
  19. Kneifel, S.; Kollias, P.; Battaglia, A.; Leinonen, J.; Maahn, M.; Kalesse, H.; Tridon, F. First observations of triple-frequency radar Doppler spectra in snowfall: Interpretation and applications. Geophys. Res. Lett. 2016, 43, 2225–2233. [Google Scholar] [CrossRef] [Green Version]
  20. Magono, C.; Lee, C.W. Meteorological classification of natural snow crystals. J. Fac. Sci. Hokkaido Univ. Ser. 7 Geophys. 1966, 2, 321–335. [Google Scholar]
  21. Bailey, M.P.; Hallett, J. A comprehensive habit diagram for atmospheric ice crystals: Confirmation from the laboratory, AIRS II, and other field studies. J. Atmos. Sci. 2009, 66, 2888–2899. [Google Scholar] [CrossRef] [Green Version]
  22. Auer, A.H., Jr.; Veal, D.L. The dimension of ice crystals in natural clouds. J. Atmos. Sci. 1970, 27, 919–926. [Google Scholar] [CrossRef] [Green Version]
  23. Mitchell, D.L.; Arontt, W.P. A model predicting the evolution of ice particle size spectra and radiative properties of cirrus clouds.Part II: Dependence of absorption and extinction on ice crystal morphology. J. Atmos. Sci. 1994, 51, 817–832. [Google Scholar] [CrossRef] [Green Version]
  24. Hogan, R.J.; Westbrook, C.D. Equation for the microwave backscatter cross section of aggregate snowflakes using the self-similar Rayleigh–Gans approximation. J. Atmos. Sci. 2014, 71, 3292–3301. [Google Scholar] [CrossRef] [Green Version]
  25. Matrosov, S.Y.; Heymsfield, A.J. Use of Doppler radar to assess ice cloud particle fall velocity-size relations for remote sensing and climate studies. J. Geophys. Res. Atmos. 2000, 105, 22427–22436. [Google Scholar] [CrossRef]
  26. Mitchell, D.L.; Heymsfield, A.J. Refinements in the treatment of ice particle terminal velocities, highlighting aggregates. J. Atmos. Sci. 2005, 62, 1637–1644. [Google Scholar] [CrossRef]
  27. Khvorostyanov, V.I.; Curry, J.A. Fall velocities of hydrometeors in the atmosphere: Refinements to a continuous analytical power law. J. Atmos. Sci. 2005, 62, 4343–4357. [Google Scholar] [CrossRef]
  28. Khvorostyanov, V.I.; Curry, J.A. Terminal velocities of droplets and crystals: Power laws with continuous parameters over the size spectrum. J. Atmos. Sci. 2002, 59, 1872–1884. [Google Scholar] [CrossRef]
  29. Mitchell, D.L. Use of mass- and area-dimensional power laws for determining precipitation particle terminal velocities. J. Atmos. Sci. 1996, 53, 1710–1723. [Google Scholar] [CrossRef]
  30. Heymsfield, A.J.; Westbrook, C.D. Advances in the Estimation of Ice Particle Fall Speeds Using Laboratory and Field Measurements. J. Atmos. Sci. 2010, 67, 2469–2482. [Google Scholar] [CrossRef] [Green Version]
  31. Mie, G. Beiträge zur Optik trüber Medien, speziell kolloidaler Metallösungen. Ann. Der Phys. 1908, 330, 377–445. [Google Scholar] [CrossRef]
  32. Macke, A.; Mueller, J.; Raschke, E. Single Scattering Properties of Atmospheric Ice Crystals. J. Atmos. Sci. 1996, 53, 2813–2825. [Google Scholar] [CrossRef] [Green Version]
  33. Craig, F.B.; Bohren, F.; Huffman, D. Absorption and Scattering of Light by Small Particles; John Wiley & Sons Inc.: New York, NY, USA, 1983. [Google Scholar]
  34. Heymsfield, A.J.; Platt, C.M.R. A parameterization of the particle size spectrum of ice clouds in terms of the ambient temperature and the ice water content. J. Atmos. Sci. 1984, 41, 846–855. [Google Scholar] [CrossRef] [Green Version]
  35. Ryan, B.F. A bulk parameterization of the ice particle size distribution and the optical properties in ice clouds. J. Atmos. Sci. 2000, 57, 1436–1451. [Google Scholar] [CrossRef]
  36. Gunn, K.; Marshall, J. The distribution with size of aggregate snowflakes. J. Meteorol. 1958, 15, 452–461. [Google Scholar] [CrossRef] [Green Version]
  37. Platt, C.M.R. A parameterization of the visible extinction coefficient of ice clouds in terms of the ice/water content. J. Atmos. Sci. 1997, 54, 2083–2098. [Google Scholar] [CrossRef]
  38. Zhenhui, W.; Xu, T. A study of the relationship between the attenuation coefficient and radar reflectivity factor for spherical particles in clouds at millimeter wavelengths. Acta Meteorol. Sin. 2011, 69, 1020–1028. [Google Scholar]
  39. Barber, P.; Yeh, C. Scattering of electromagnetic waves by arbitrarily shaped dielectric bodies. Appl. Opt. 1975, 14, 2864–2872. [Google Scholar] [CrossRef]
  40. Liao, L.; Sassen, K. Investigation of relationships between Ka-band radar reflectivity and ice and liquid water contents. Atmos. Res. 1994, 34, 231–248. [Google Scholar] [CrossRef]
  41. Atlas, D.; Matrosov, S.Y.; Heymsfield, A.J.; Chou, M.-D.; Wolff, D.B. Radar and radiation properties of ice clouds. J. Appl. Meteorol. 1995, 34, 2329–2345. [Google Scholar] [CrossRef] [Green Version]
  42. Liu, C.-L.; Illingworth, A.J. Toward more accurate retrievals of ice water content from radar measurements of clouds. J. Appl. Meteorol. 2000, 39, 1130–1146. [Google Scholar] [CrossRef] [Green Version]
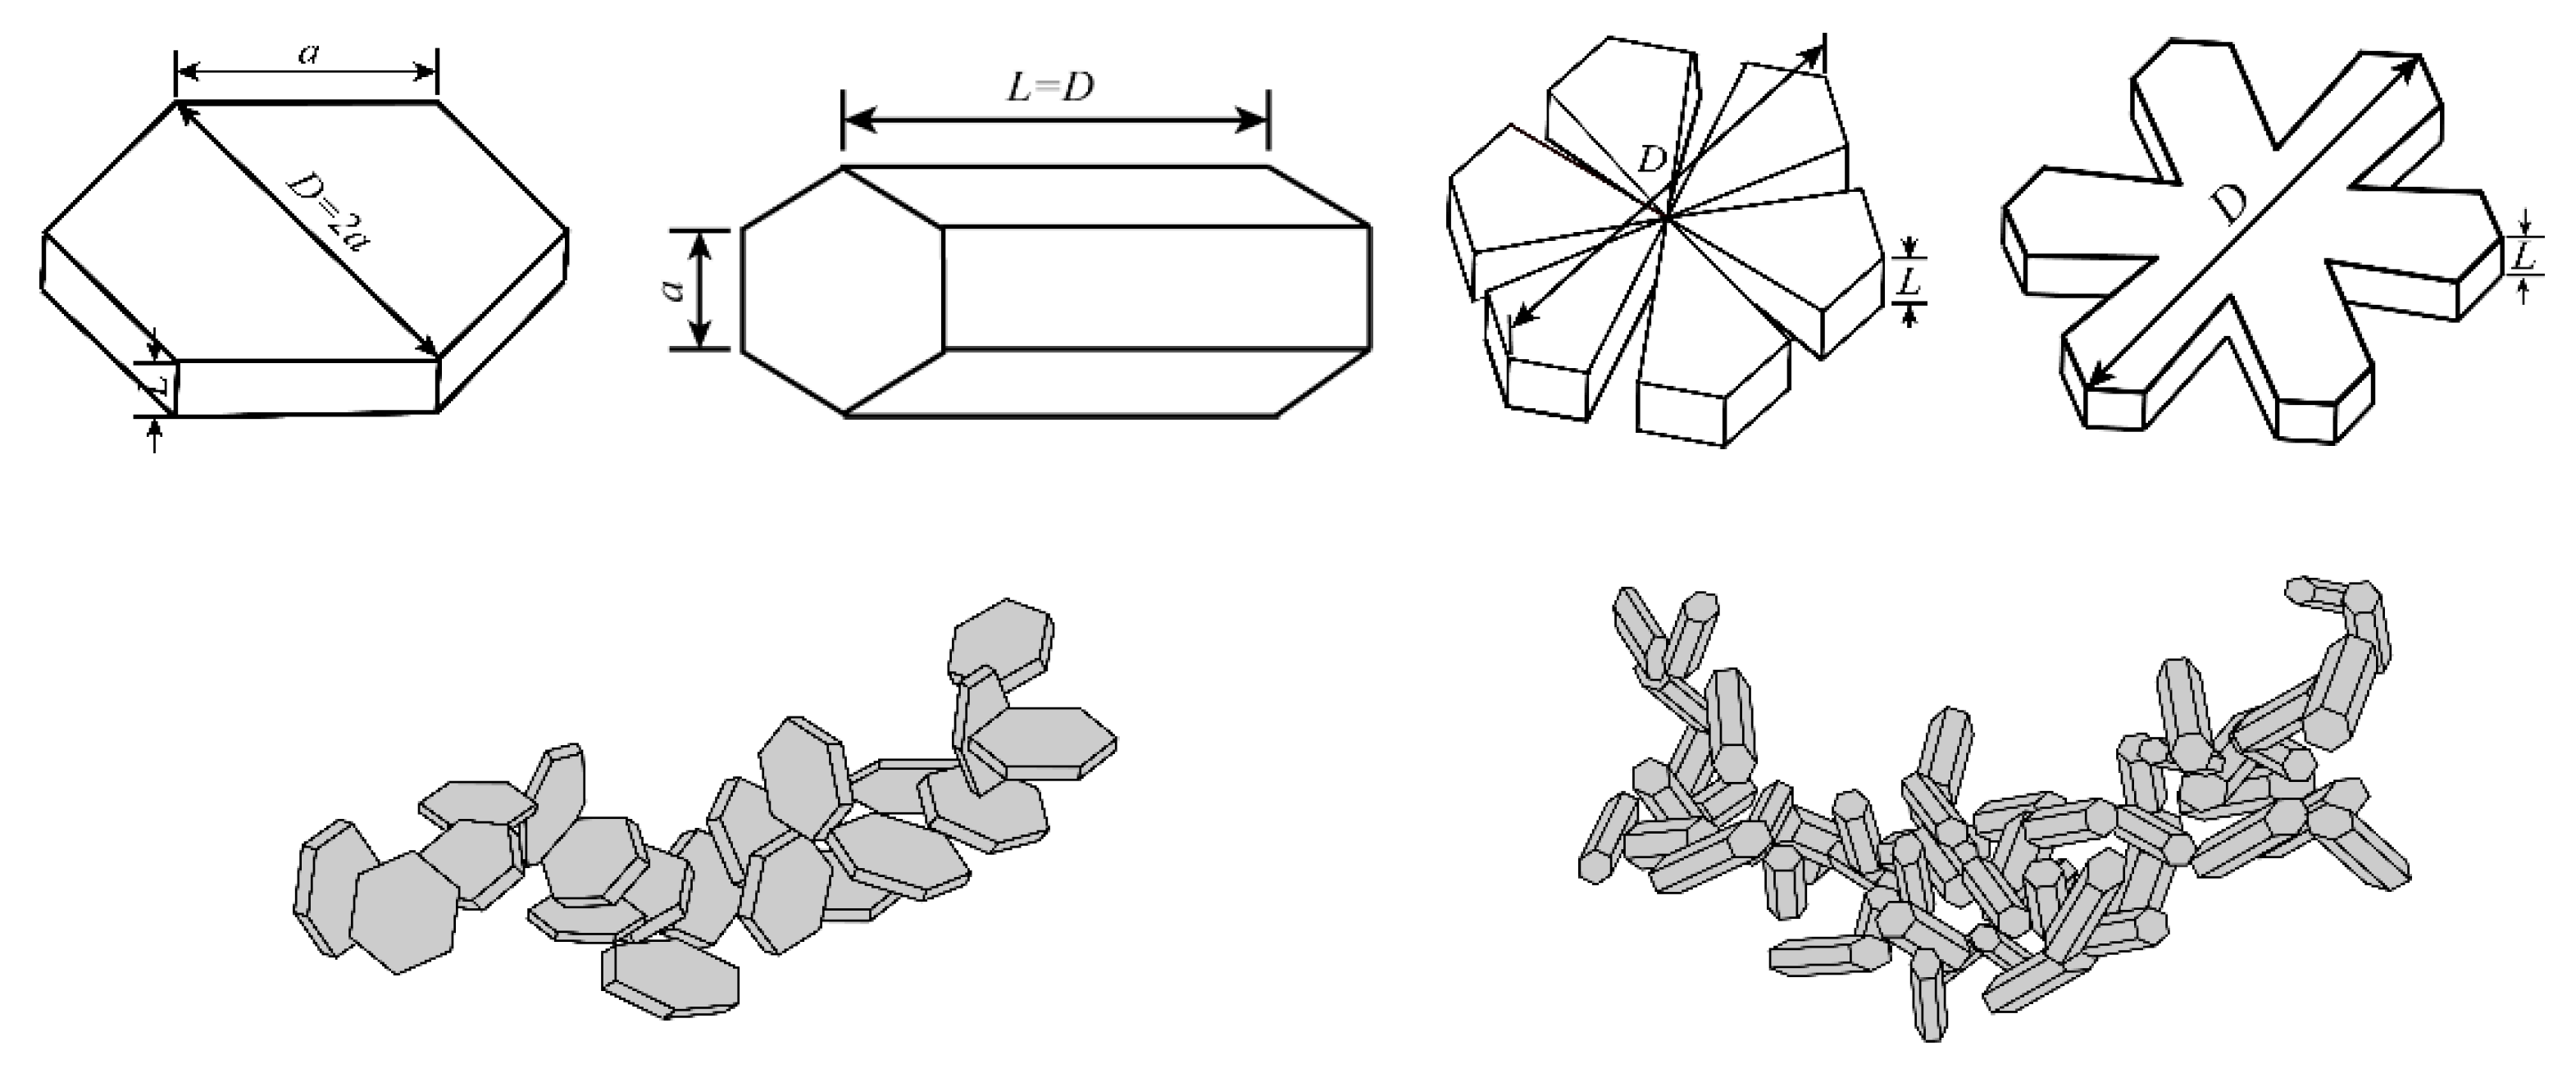
Figure 1. Ice particle geometries considered in this study. From left to right: (top) hexagonal plate, hexagonal column, sector-like plates, stellar crystal with broad arms, (bottom) aggregate of plates, and aggregate of columns.
Remotesensing 12 03378 g001
Figure 2. The relationship between mass and maximum diameter of ice crystals (a) and the corresponding relationship between maximum diameter and equivalent ice sphere diameter (b).
Remotesensing 12 03378 g002
Figure 3. Relationships between the fall velocities of different types of ice crystals and an ice sphere (a) and the backscattering cross-section of ice crystals and an ice sphere (b). The fall velocity of particles at a height of 4.5 km under standard atmospheric conditions.
Remotesensing 12 03378 g003
Figure 4. (a) Exponential distribution used in this study. (b) The Doppler spectral density calculated from the exponential distribution without turbulence (the solid line) and at different turbulence intensities (the dashed line). Radar sensitivity at 5 km of M3 are marked by a solid black line.
Remotesensing 12 03378 g004
Figure 5. Particle size distribution (PSDs) retrieved from the Doppler spectra affected by turbulence, shown in Figure 4b. The solid black line is the PSD given by Platt (1997) at −10 °C~−5 °C (same as Figure 4a).
Remotesensing 12 03378 g005
Figure 6. Doppler spectrum obtained by M3 at 5:38 (UTC) (a) and reflectivity and vertical air speed (b).
Remotesensing 12 03378 g006
Figure 7. Retrieved PSDs at different heights for six ice crystal types—hexagonal plates (a), hexagonal columns (b), sector plates (c), stellar plates with broad arms (d), aggregates of plates (e), and aggregates of columns (f).
Remotesensing 12 03378 g007
Figure 8. Mean volume-weighted diameter and IWC of different ice crystals retrieved from radar data—hexagonal plates (a), hexagonal columns (b), sector plates (c), stellar plates with broad arms (d), aggregates of plates (e), and aggregates of columns (f).
Remotesensing 12 03378 g008aRemotesensing 12 03378 g008b
Figure 9. Particle size distribution observed by 2D-S and CIP probes (a) and retrieved by MMCR at 4.5 km (b).
Remotesensing 12 03378 g009
Figure 10. Liquid water content (LWC) observed by high-volume precipitation spectrometer (HVPS) (a) and calculated from PSD obtained by MMCR (b).
Remotesensing 12 03378 g010
Figure 11. Relationship between Z e and ice water content (IWC).
Remotesensing 12 03378 g011
Table 1. Major parameters of the four operational modes.
ItemPrecipitation Mode (M1)Boundary Mode (M2)Middle Level Mode (M3)Cirrus Mode (M4)
Pulse width0.2 μs2 μs8 μs20 μs
Pulse repetition frequency8000 Hz8000 Hz8000 Hz8000 Hz
Number of coherent integrations1334
Number of incoherent integrations4444
Number of fast Fourier transforms256256256256
Dwell time4 s4 s4 s4 s
Range sample volume spacing30 m30 m30 m30 m
Minimum range30 m300 m1200 m3000 m
Maximum range18 km18 km18 km18 km
Nyquist velocity17.13 m/s5.7 m/s5.7 m/s8.56 m/s
Velocity resolution0.134 m/s0.045 m/s0.045 m/s0.067 m/s
Minimum detectable reflectivity at 5 km−12.4 dBZ−26.9 dBZ−32.9 dBZ−34.9 dBZ
Table 2. Coefficients of mass- and area-dimensional power laws for the six ice particle types. ( m = a D b , A = α D β , units are cgs).
Particle TypeMassArea
abαβ
Hexagonal plates
100 μm ≤ D ≤ 3000 μm0.007392.450.652.0
Hexagonal columns
30 μm < D ≤ 100 μm0.16772.910.6842.0
100 μm < D ≤ 300 μm0.001661.910.06961.50
D > 300 μm0.0009071.740.05121.414
Crystals with sector-like branches
10 μm < D ≤ 40 μm0.006142.420.241.85
40 μm < D ≤ 2000 μm0.001422.020.551.97
Stellar crystals with broad arms
10 μm ≤ D ≤ 90 μm0.005832.420.241.85
90 μm < D ≤ 1500 μm0.000271.670.111.63
Aggregates of plates
600 μm ≤ D ≤ 4100 μm0.00332.20.22851.88
Aggregates of columns
800 μm ≤ D ≤ 4500 μm0.00282.10.22851.88
Table 3. Statistical empirical parameters for ice clouds using Ka-band MMCR observations. (The units of IWC is g·m−3 and the Z e is in units of mm6 m−3).
ReferenceEquationCloud Type
Liao and Sassen [40] IWC = 0.027 Z e 0.78 Ice cloud
Atlas, Matrosov, Heymsfield, Chou and Wolff [41] IWC = 0.064 Z e 0.58 Ice cloud
Liu and Illingworth [42] IWC = 0.097 Z e 0.59 Cirrus cloud
Mace, Heymsfield and Poellot [15] IWC = 0.103 Z e 0.576 Cirrus cloud
Protat, Delanoë, Bouniol, Heymsfield, Bansemer and Brown [13] IWC = 0.082 Z e 0.54 Mid- and high-latitude ice cloud
Publisher’s Note: MDPI stays neutral with regard to jurisdictional claims in published maps and institutional affiliations.