1. Introduction
Together with geotechnical, geological, and geomorphological investigations, the geodetic monitoring of surface movements forms an integral part of comprehensive landslide analyses for mitigation measurement planning [
1,
2,
3,
4,
5,
6]. Over the past decade, the use of remote sensing data for landslide identification, detection, and monitoring has expanded significantly, mainly due to the increasing availability of very high-resolution data and improvements in computer processing. Global Navigation Satellite System (GNSS) sensors are a well-known solution for landslide monitoring [
7,
8]. Despite the decreasing cost of GNSS systems, the equipment is still quite expensive compared to other sensors used in structural engineering. The advances in GNSS technology have allowed for the creation of new low-cost sensors which can provide continuous monitoring with medium to high precision, accuracy, and limited costs [
9,
10,
11]. As demonstrated by Oguchi et al. [
12] and Herrera et al. [
13], the efficiency, usefulness, and cost (i.e., the total cost required to install the integrated geodetic monitoring system, collect the data, perform the analysis and deliver the proper results to the end-users) of geodetic monitoring depend on several factors, e.g., (1) the scale (the dimension of the investigated area); (2) the spatial resolution (the mean distance between the monitored points); (3) the temporal resolution (the time required before individual observations are repeated); (4) latency (the time required to get the results after a specific monitoring epoch); (5) repeatability (the mean difference between repeated position estimates in the absence of the deformation phenomenon), and (6) a statistical analyser (a tool used to identify potential movements and issue reliable early warnings). In general, low-cost sensors have been developed both for remote sensing, as well as for geotechnical and hydrological techniques. The sensors are placed within the landslide body and out of sight, providing subsurface deformation data. The efficiency of low-cost GNSS sensors in monitoring landslides has been confirmed by several authors [
10,
11,
14,
15,
16]. The trend of using low-cost sensors for the continuous monitoring of landslides is increasing mainly due to their improved sensitivity and the wide range of their applicability [
17,
18,
19,
20].
In comparison with other remote sensing techniques, such as Permanent Scatterer Interferometry (PSI), the GNSS technology is more appropriate for studying geodynamics, while PSI is more suitable for detecting subsidence and uplift [
21]. A major limitation of the SAR (Synthetic Aperture Radar) geometry is the fact that displacements can only be monitored in the Line-Of-Sight (LOS) direction [
21,
22,
23,
24]. As a result, the detection of displacements perpendicular to the radar LOS is subject to error. It is only east- and west-facing slopes which provide proper conditions for the SAR technology, as a landslide would move down the slope in the LOS direction. In the landslide area presented in this paper, the usefulness of PSI is reduced by temporal and spatial coherence and vegetation. Due to the orientation of the landslide (NE-SW), low coherence, and mostly vegetated landslide area, the PSI technique is not relevant for displacement monitoring of this landslide.
The GNSS hardware and data processing employed in this study have been developed in the framework of the Geodetic Integrated Monitoring System (GIMS) project (
https://www.gims-project.eu/). The GNSS component of the GIMS unit brings several innovations to the recent remote sensing landslide monitoring techniques. The station hardware is among the first types of low-cost dual-frequency GNSS equipment successfully deployed and used operatively to monitor an active landslide, while the processing software has been developed as an open-source application capable of matching the performance of the state-of-the-art Bernese software.
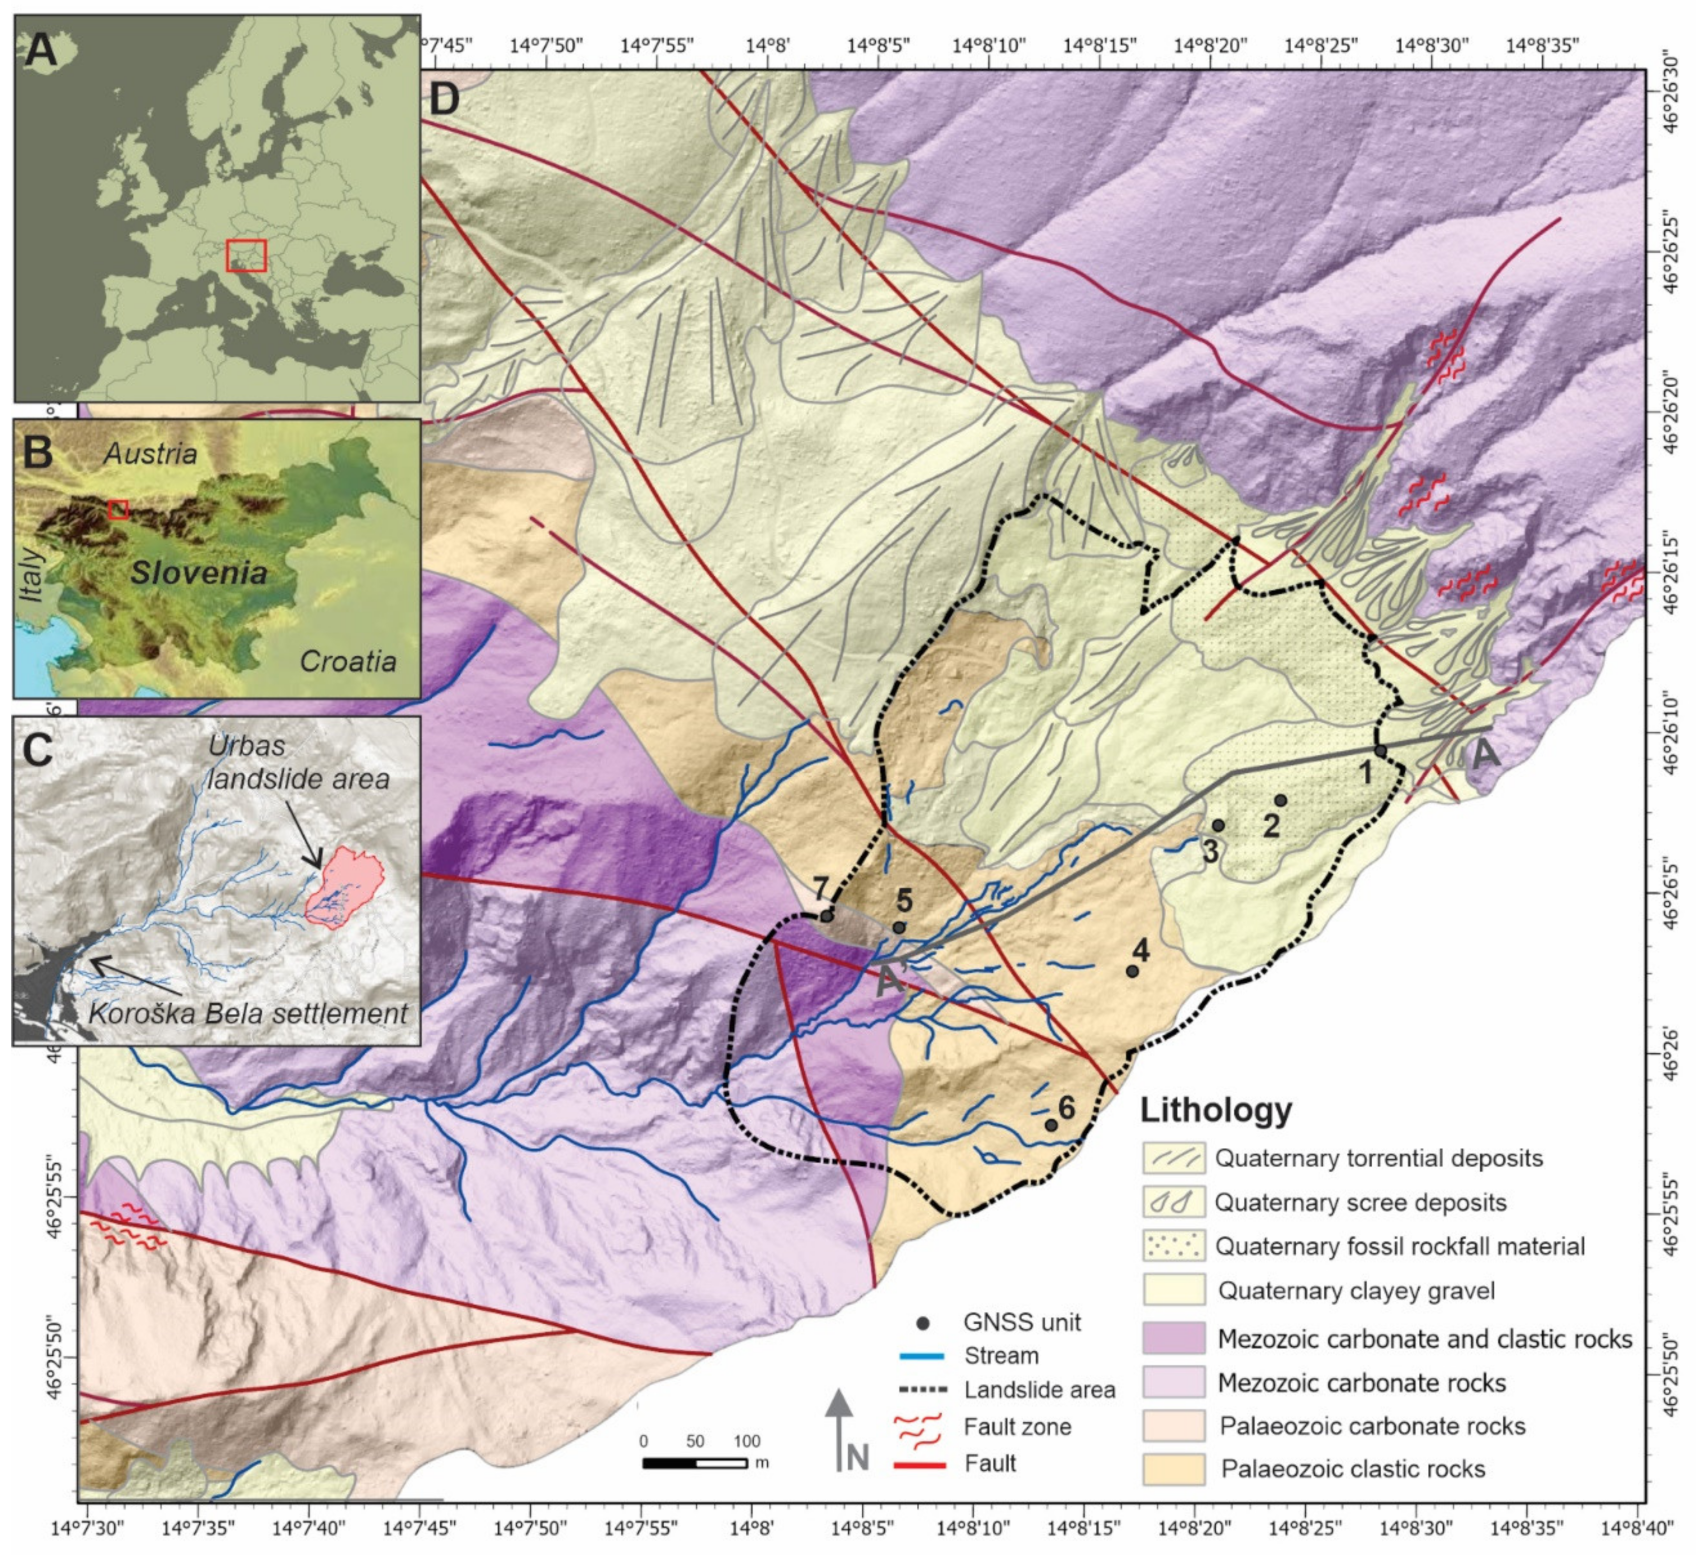
The objective of this paper is to present the first results of the GNSS low-cost monitoring system and to evaluate its performance under actual field conditions. The prototype was tested on one of the most active deep-seated landslides in Slovenia, i.e., the Urbas landslide in the NW of the country (
Figure 1). Due to its potential for mobilization into a debris flow [
25], the area is currently under extensive research. A monitoring network including boreholes, piezometers, inclinometers, geodetic measurements, wire crackmeter and rain gauges has been established for the development of the mitigation strategy and early warning system. Seven low-cost GNSS units were installed to supplement the existing instrumentation with the monitoring of surface movements. The results of the GNSS monitoring were discussed in the context of the known landslide kinematics. To test the applicability of the system in the development of landslide prediction, the results of the nine-month GNSS monitoring were correlated with the precipitation recorded at the site.
2. Study Site
The performance of the prototype was tested in the larger area of the Urbas landslide in the Karavanke mountain chain of north-western Slovenia (
Figure 1A,B).
The landslide lies in the hinterland of Koroška Bela, a settlement which occupies an area of 1.02 km
2 and is densely populated by over 2200 inhabitants (
Figure 1C). The landslide represents a direct hazard to the inhabitants and public infrastructure, including a major railway, local road, and steel factory.
According to historical sources, the area of Koroška Bela is known to have experienced several debris-flow events in the recent geological past. The most recent of these events occurred back in the 18th century and caused a partial or total destruction of over 40 buildings and cultivated areas in Koroška Bela, which is located in the area of the debris fan deposits [
26,
27].
In this regard, the hinterland of Koroška Bela has been investigated since 2008 through various national and European projects. To define landslide characteristics, several site investigations and monitoring projects have been carried out using detailed field mapping, along with geotechnical, hydrogeological, geophysical, and geodetic methods [
25,
28,
29,
30,
31,
32,
33].
According to previous investigations and field observations, the Urbas landslide is considered to be the largest landslide in the hinterland of Koroška Bela (
Figure 1). It has a width of 460 m and a length of 580 m. Site investigations performed in 2017 revealed the sliding surface located at a depth of 15 m [
25]. The maximum volume of the sliding mass was estimated at 1.0 × 10
6 m
3 [
25]. The main body of the Urbas landslide extends between an elevation of 1375 m and 1125–1130 m. It is characterised by medium to high slope gradients, ranging from 30° to 70°.
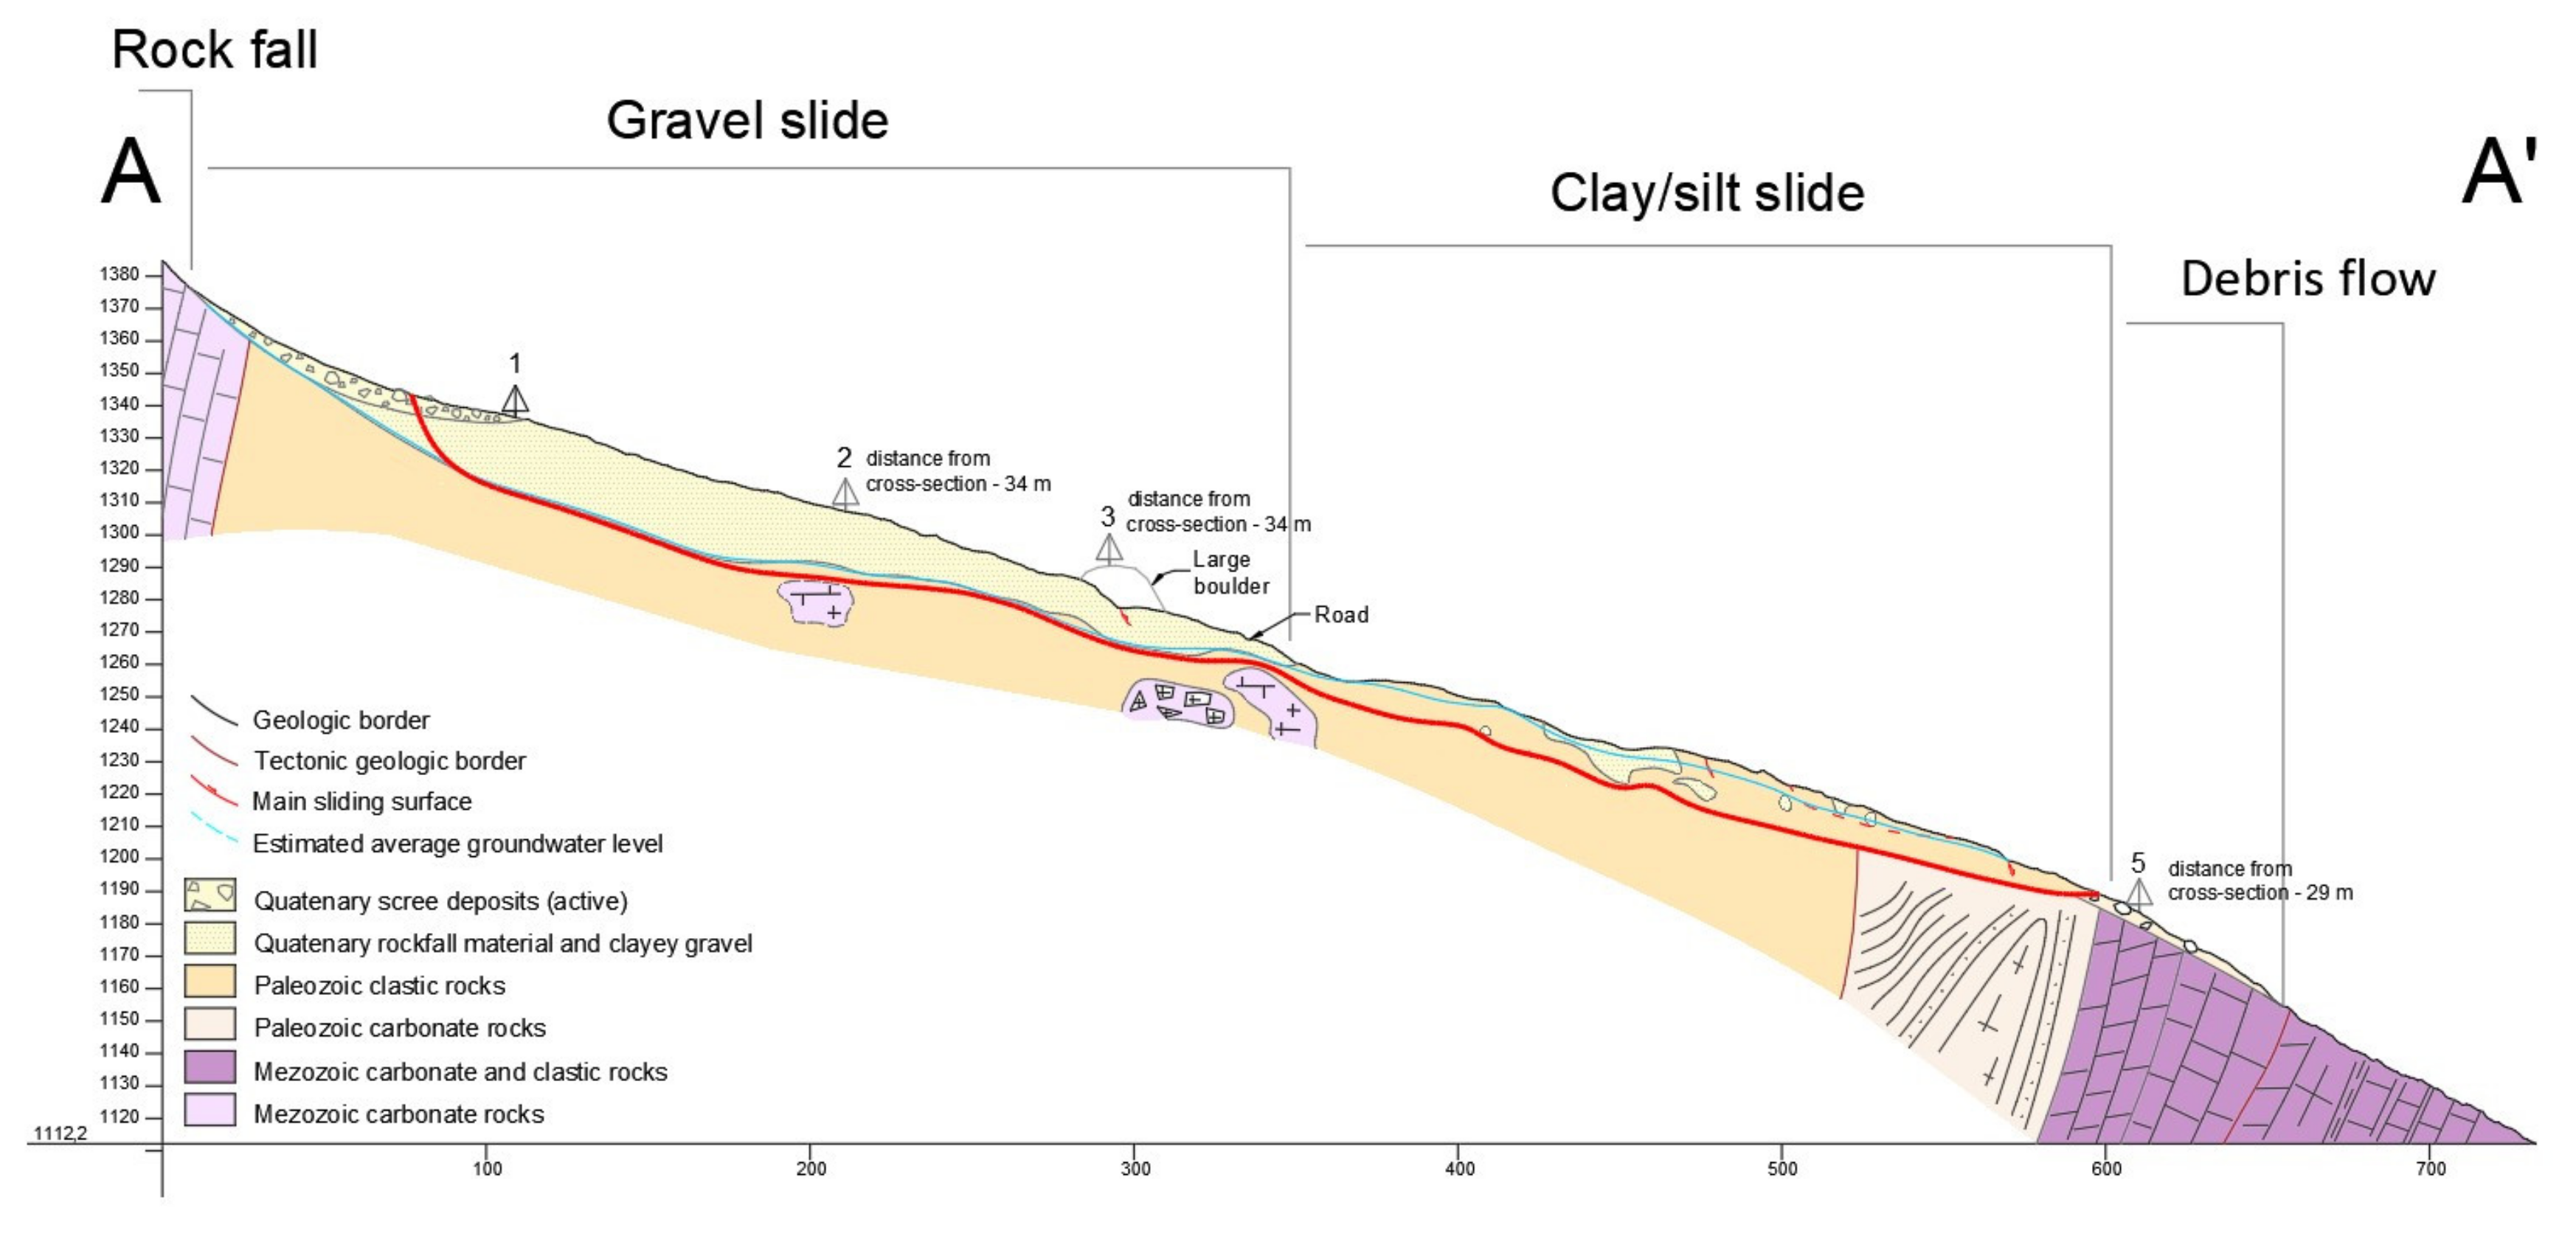
The broad area of the Urbas landslide is characterised by complex geological and tectonic conditions (
Figure 1D and
Figure 2). The geological settings of this area are represented by the Upper Carboniferous and Permian sedimentary clastic rocks (alternating shale, quartz sandstone and conglomerate), Permian carbonates and Triassic to Lower Jurassic carbonate rocks [
25,
28]. In terms of tectonics, the area is part of the Košuta fault zone and is dissected by numerous NW-SE faults linking two major fault zones (the Sava and Periadriatic fault zones) [
28]. Due to the geological, geomorphological, and structural conditions of the Urbas landslide, carbonate and clastic rocks are highly deformed and very prone to rapid weathering, resulting in large quantities of talus carbonate material and deeply weathered clastic rocks.
The Karavanke mountain range is characterised by average annual precipitation of about 2600–3200 mm, distributed over 70–100 days in a year. The study site is located within an area with two precipitation peaks, with the main precipitation peak occurring in autumn and the second in spring. The lowest precipitation rate is recorded in summer [
34].
Due to its geological, geomorphological, structural, and climatic conditions, the wider area of the Urbas landslide is subject to different types of landslide movements. Despite this fact, the whole landslide area acts as one body (
Figure 2).
The source area in the landslide hinterland is characterised by rocky cliffs and an active slope talus. Rockfall processes result in continuous input of scree material onto the main body of the landslide and mask the main scarp, thereby preventing the exact delineation of its location. The main body of the landslide is mostly located in Palaeozoic clastic rocks. It is presumed to be a rotational clay slide which has accelerated predominately with the percolation of surface and groundwater [
25,
28]. The sliding mass is composed of tectonically deformed and deep weathered clastic rocks covered with carbonate blocks. Its upper part is covered by fossil talus scree. According to Hungr et al. [
35], this part could be considered a gravel slide. Palaeozoic clastic bedrock outcrops in the lower part of the main body of the landslide, and according to the prevailing landslide process, this part can be considered a clay/silt slide [
35]. The activity of this part is evidenced by irregular and hummocky terrain comprised of protrusions and depressions of various sizes, curved pine trees, longitudinal tension cracks which represent minor scarps, ponds on the surface and common deformation of local roads. According to the Varnes [
36] classification and based on the depth of the slip surfaces determined by the previous investigations, this entire part of the landslide is understood to be a deep-seated rotational slide [
25,
37].
The lowest part of the main body continues into the narrow Bela stream channel. The narrow terrain morphology in this part increases the displacement velocity of the material, which has been accumulated from the broader source area. The sliding mass is composed of tectonically deformed and weathered clastic rocks covered with a large amount of carbonate talus material. Additionally, the Bela stream causes significant erosion and increases the possibility downstream mobilization of the sliding mass. Consequently, the toe of the landslide is characterised by bare ground with fallen trees, a rugged surface, strong gully erosion, and flank ridges. This is presumed to be the most active part of the landslide, as the downward displacement of the material is accelerated by the steep slope inclination and fluvial erosion of the Bela stream. The results of a previous study using near-real-time monitoring demonstrate that the area is prone to a steady sliding of the mass with localised superficial surge slips [
32]. The sliding material moves downslope towards the bottom of the landslide where the material is fed into the stream [
30]. An ongoing stability analysis confirms the existing assumption that the material, partially blocked in the narrow Bela channel, has the potential of being mobilized into the debris flow [
25].
3. Methods
3.1. GNSS System
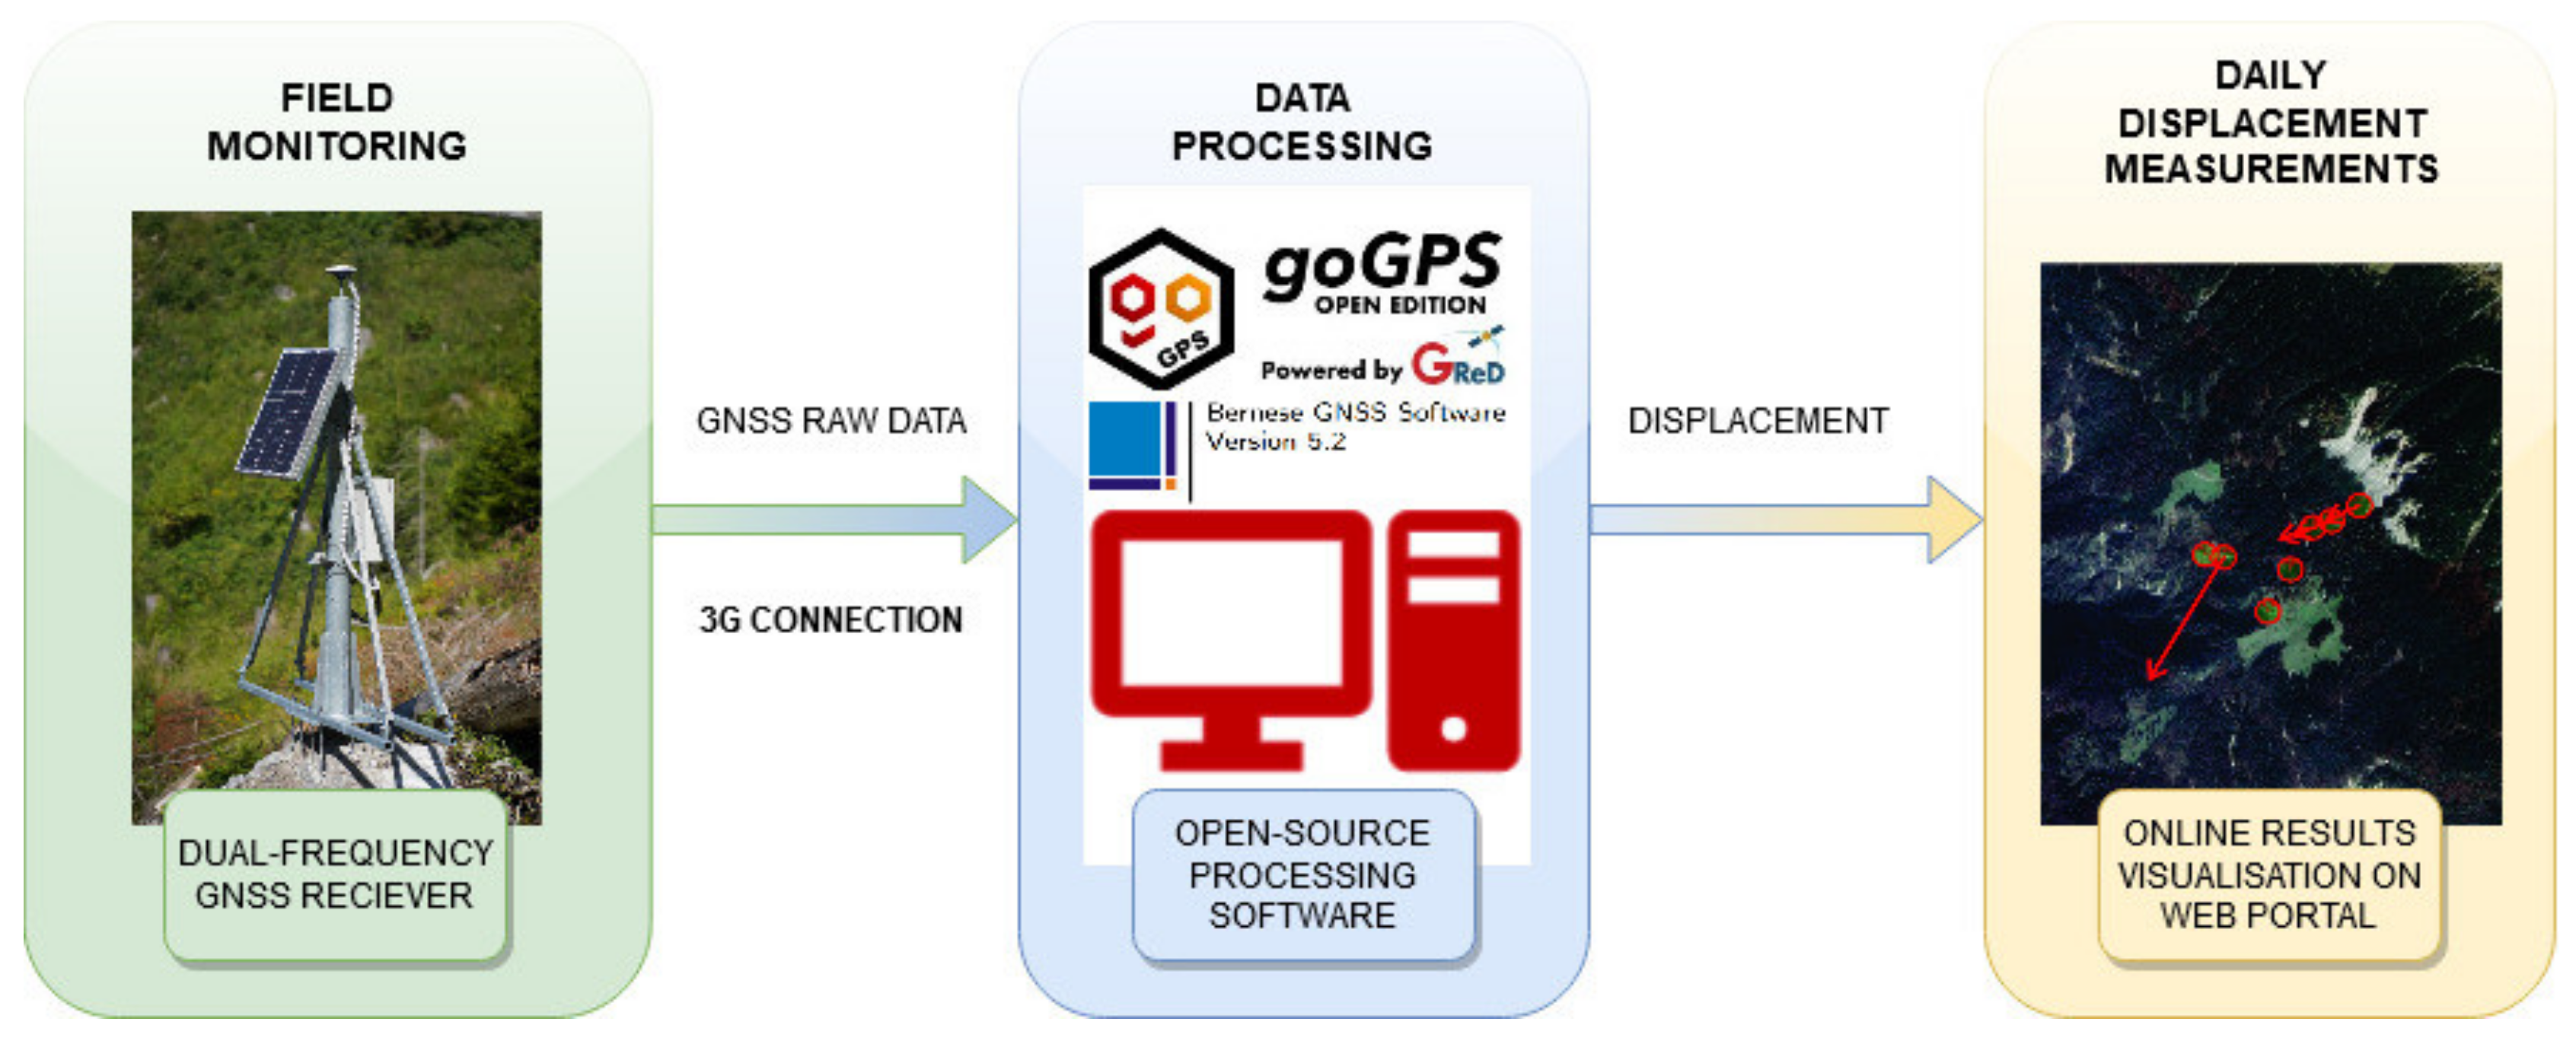
The GNSS processing is performed automatically, server-side. Each station sends raw GNSS data (i.e., timing, code and phase pseudoranges, signal-to-noise ratio) to the server via a 3G (Third Generation of Wireless Mobile Telecommunications Technology) connection, in a compressed RINEX (Receiver Independent Exchange) format. The software on the server decompresses the files, performs quality checks, and then processes the data. The estimated daily displacement time series are formatted as text files and displayed through a dedicated web portal (based on GReD's GeoGuard backend) and uploaded to an FTP (File Transfer Protocol) server. Both the web portal and the FTP server are directly accessible to the end-user (
Figure 3).
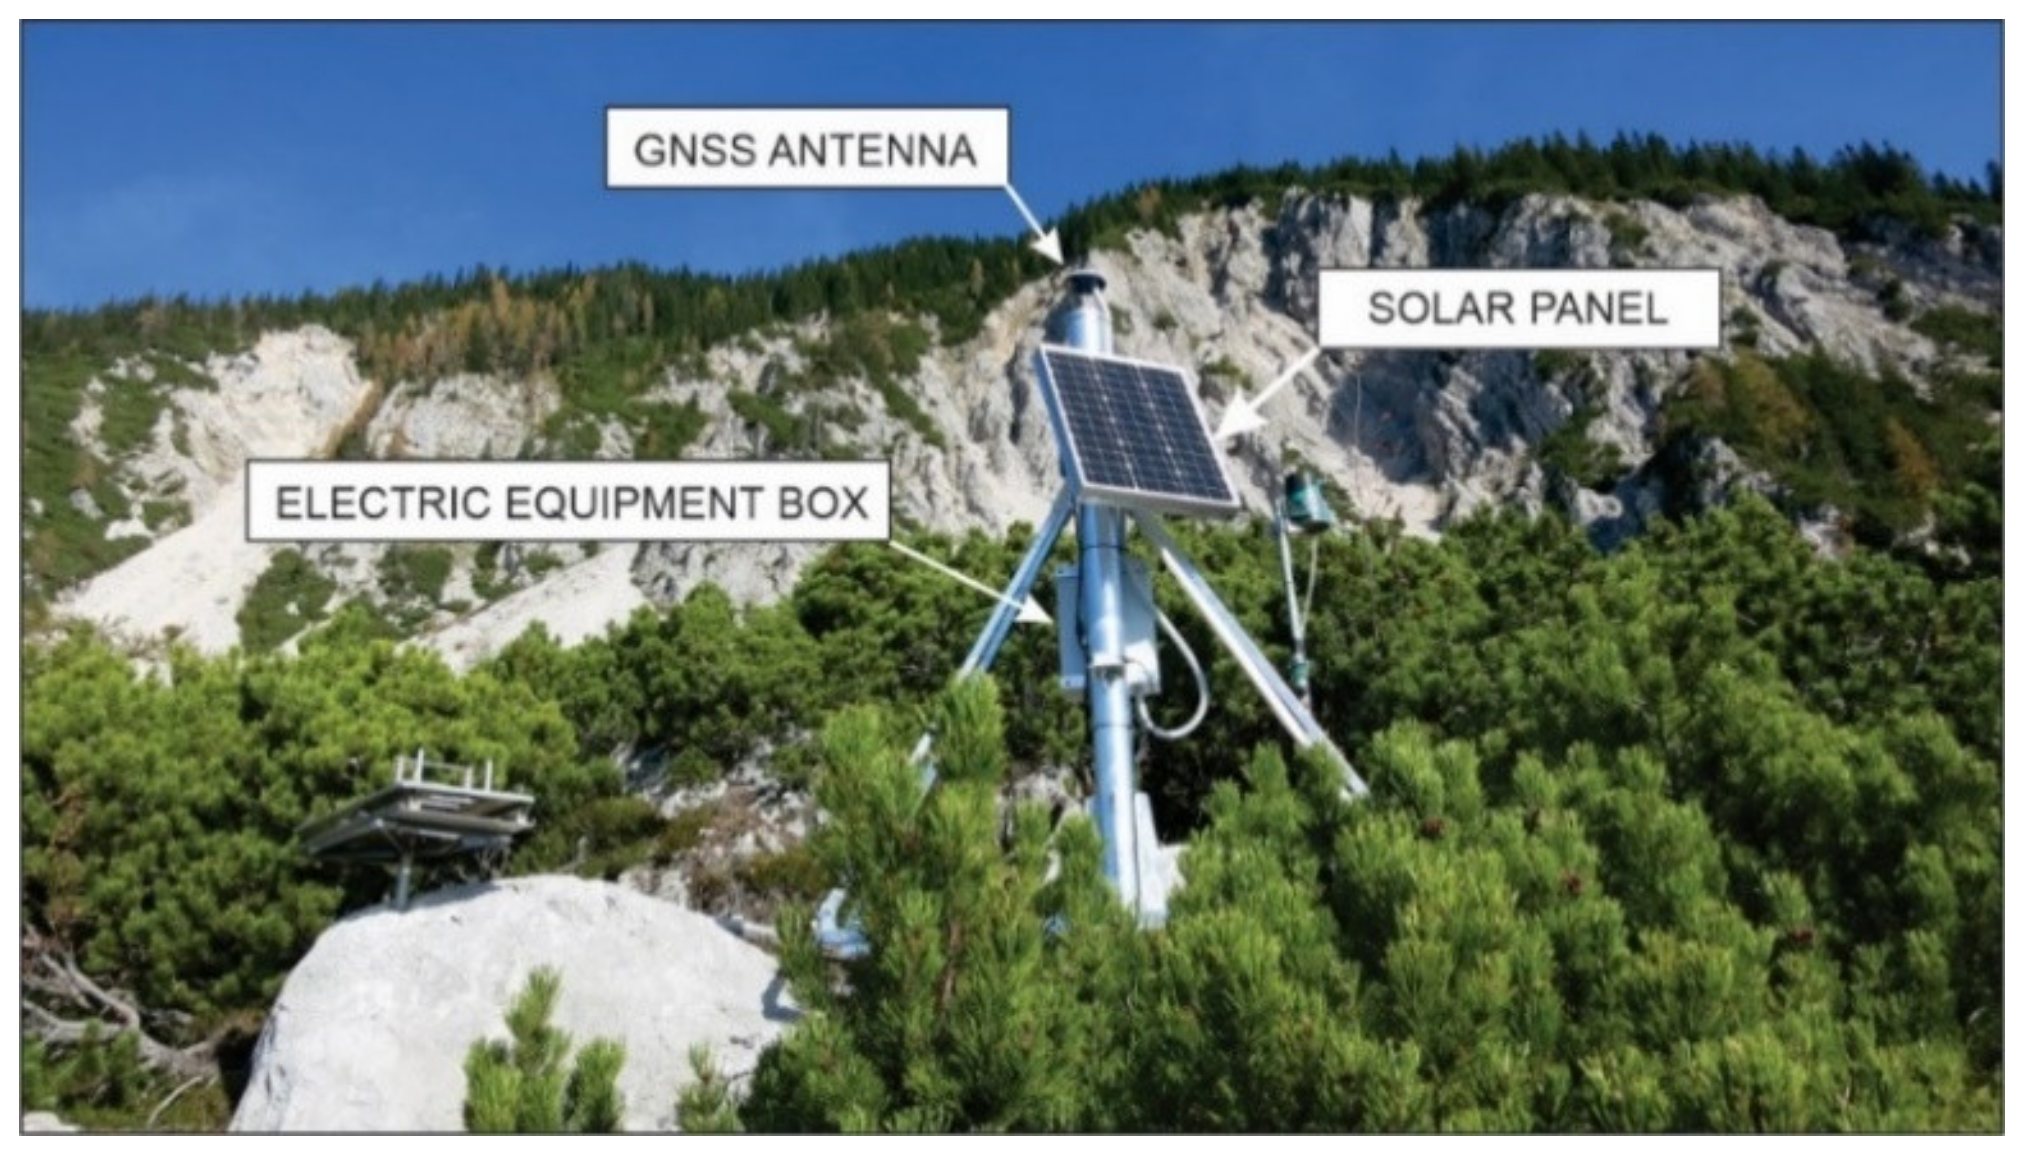
The GNSS units comprise a u-blox ZED-F9P dual-frequency receiver module and a u-blox patch multi-frequency antenna protected within a hermetic plastic dome. In the framework of the GIMS project, the receiver module was integrated within a PCB (Printed Circuit Board) developed by the Swiss company Saphyrion Sagl. The PCB is plugged-in to a standard, low-cost single-board computer (Raspberry Pi), which also hosts a 3G dongle for mobile internet connection. Power is provided through a standard solar panel supported by a 12V lead battery (
Figure 4).
The cost of a single monitoring unit strongly depends on the number of stations to be assembled, tested, and validated. At the prototype stage with small number of units produced (<10), the cost of a single monitoring unit is around 2000 €. A recent market survey indicates that this cost assures high competitivity with respect to the current providers of similar systems.
The server-side processing of the raw GNSS data was performed using two software suites running in parallel: Bernese v5.2 [
38] and goGPS in its latest beta version [
13,
39]. While Bernese is state-of-the-art software used throughout the world for geodetic applications, goGPS is open-source software written in MATLAB, developed by the Italian company GReD srl since 2017. To develop a GNSS processing tool capable of exploiting all GNSS constellations (including Galileo) and matching the performance of the Bernese software, goGPS was re-engineered and re-written in the framework of the GIMS project A version of goGPS is available as free and open-source software on the GitHub platform. Both Bernese and goGPS were configured to perform relative positioning applied to baselines stemming from a reference station. In the Urbas landslide area, the location of a reference station (GNSS unit 7) was selected based on previous geological surveys of the wider area [
25,
28,
30]. GNSS data were processed in baseline mode by a batch least squares adjustment approach, using the signal from both GPS (L1 and L2 frequencies) and Galileo (E1 and E5b) frequencies. The observation rate was 30 s, and the interval of the estimated coordinates 24 h. The observations were weighted with the inverse of the sine of the satellite elevation. No tropospheric parameter was set in the solution, and ambiguity was corrected with the LAMBDA method [
40]. In the case of the monitoring presented in this paper, the solutions offered by the two software suites differed by under 1 mm RMS for the East and North components, and under 2 mm RMS for the vertical component, thus proving that a free and open-source alternative exists for state-of-the-art GNSS monitoring of displacements.
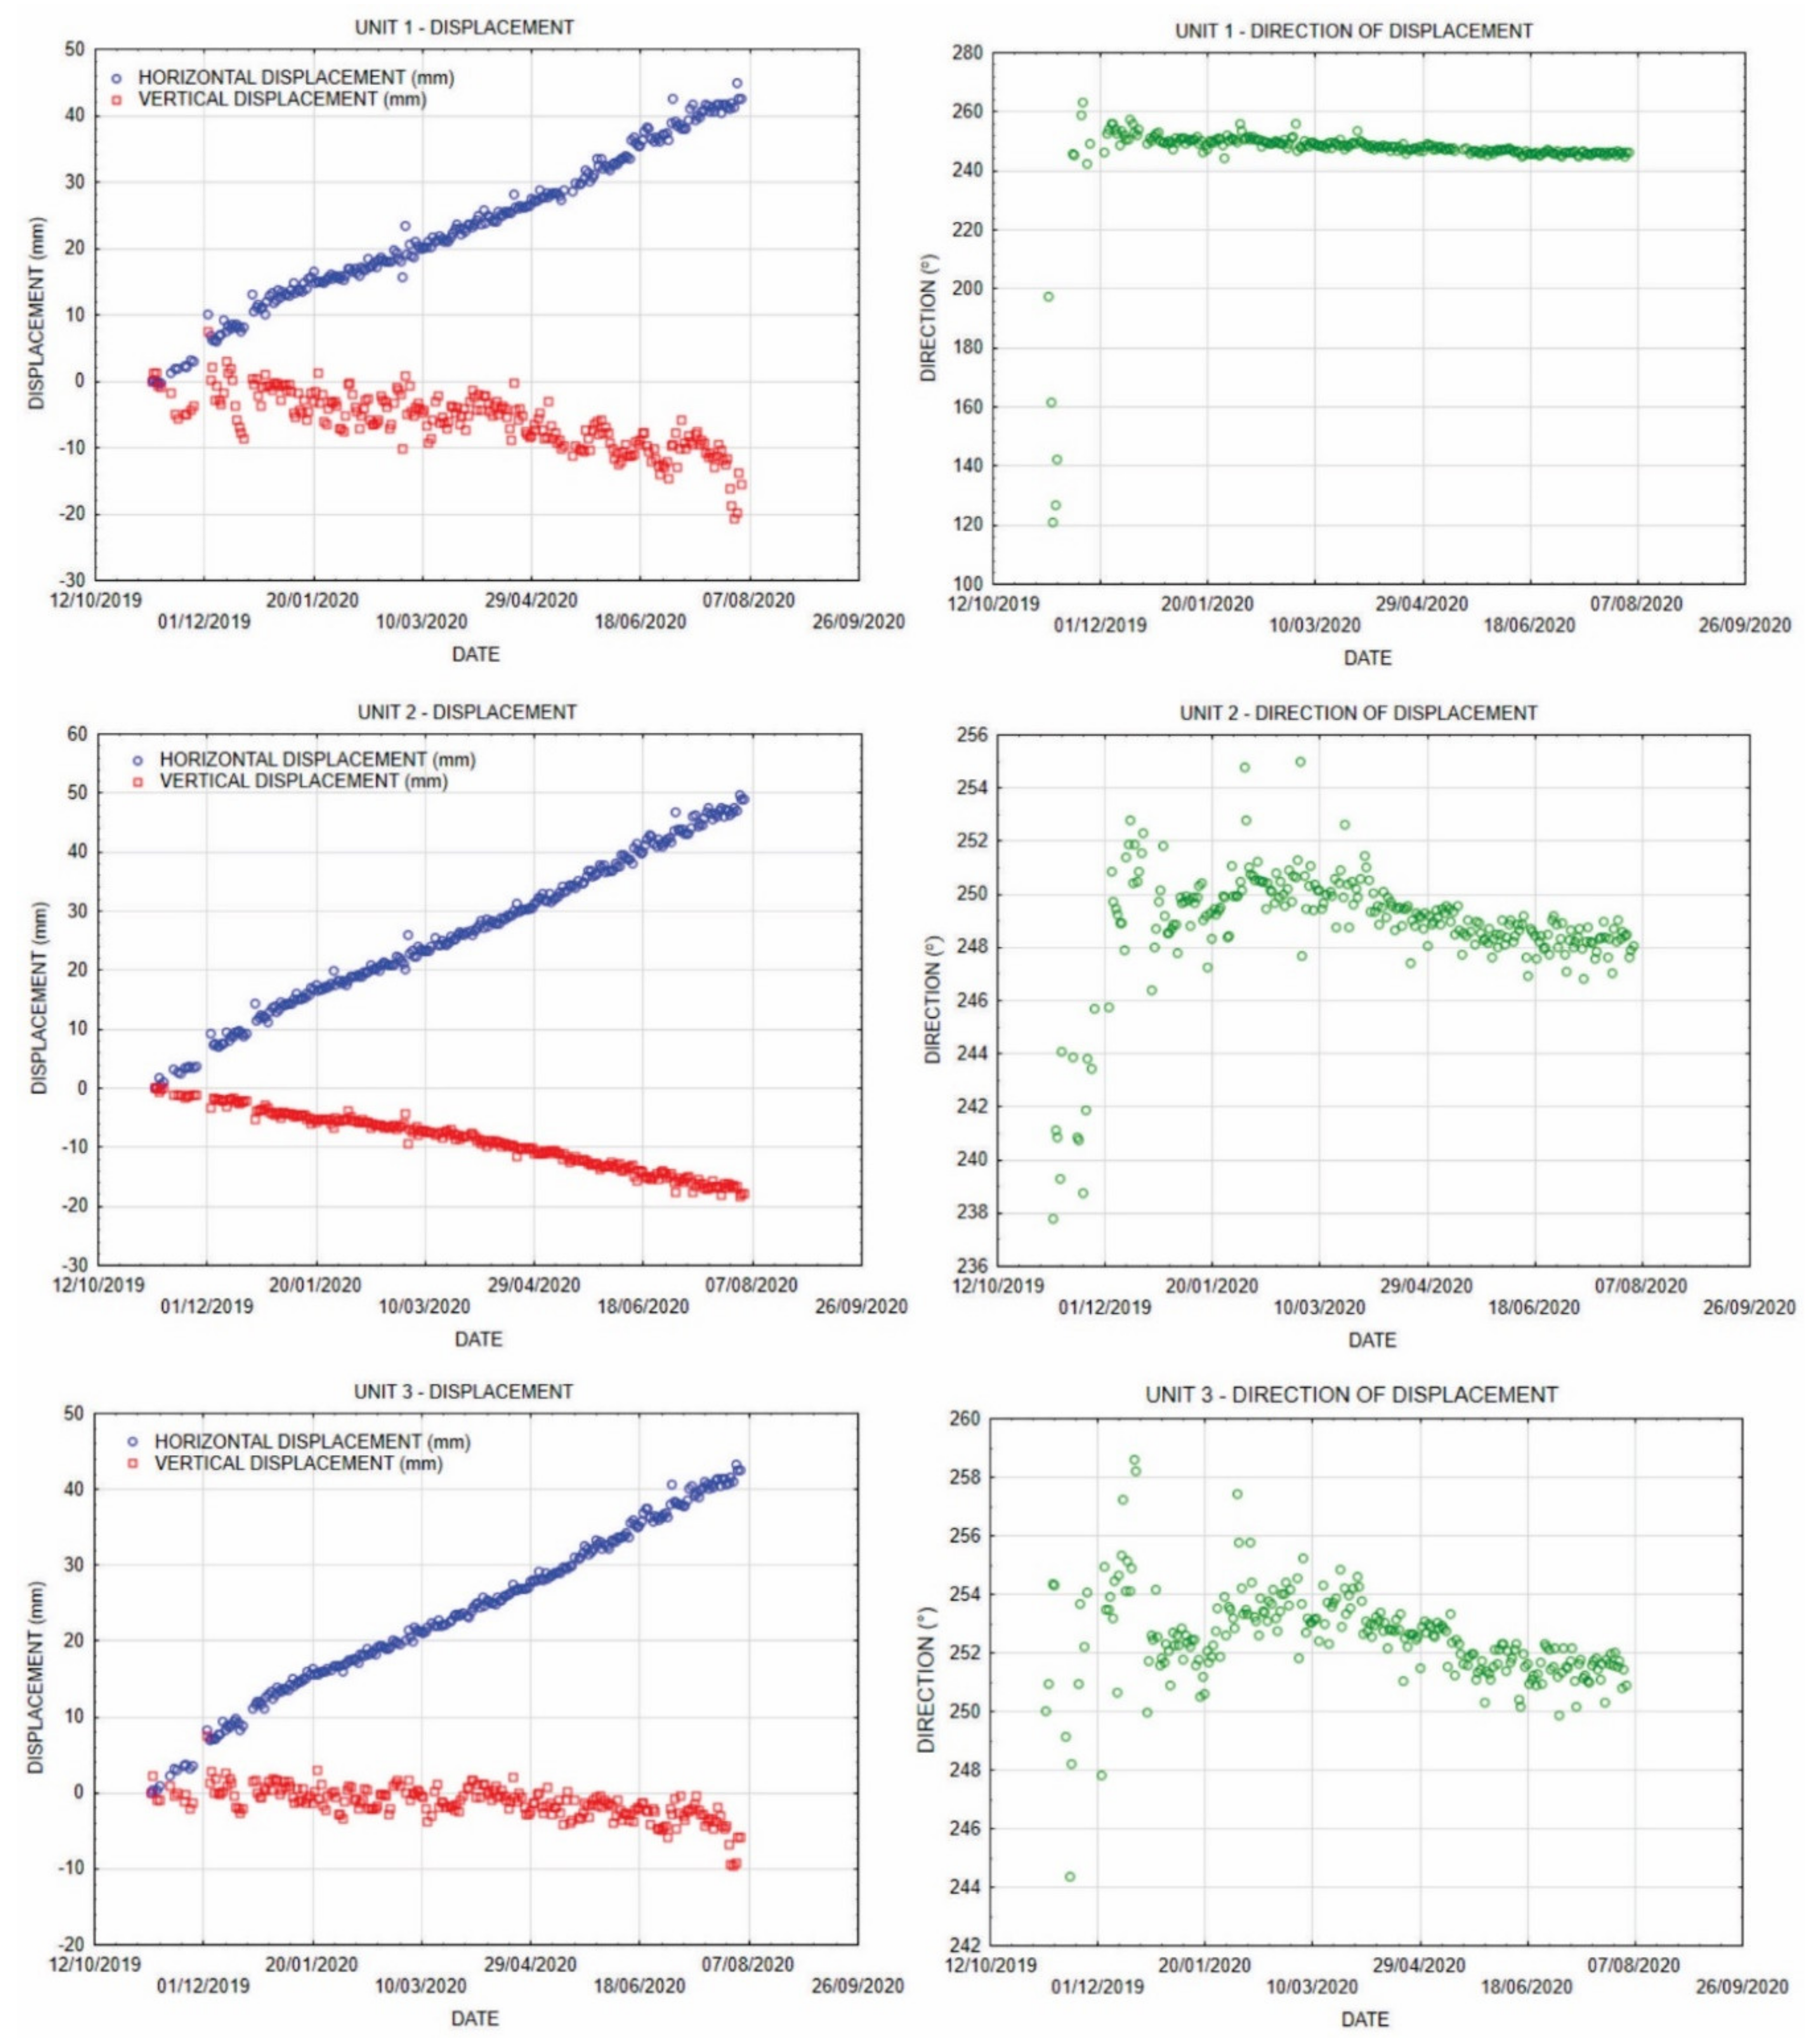
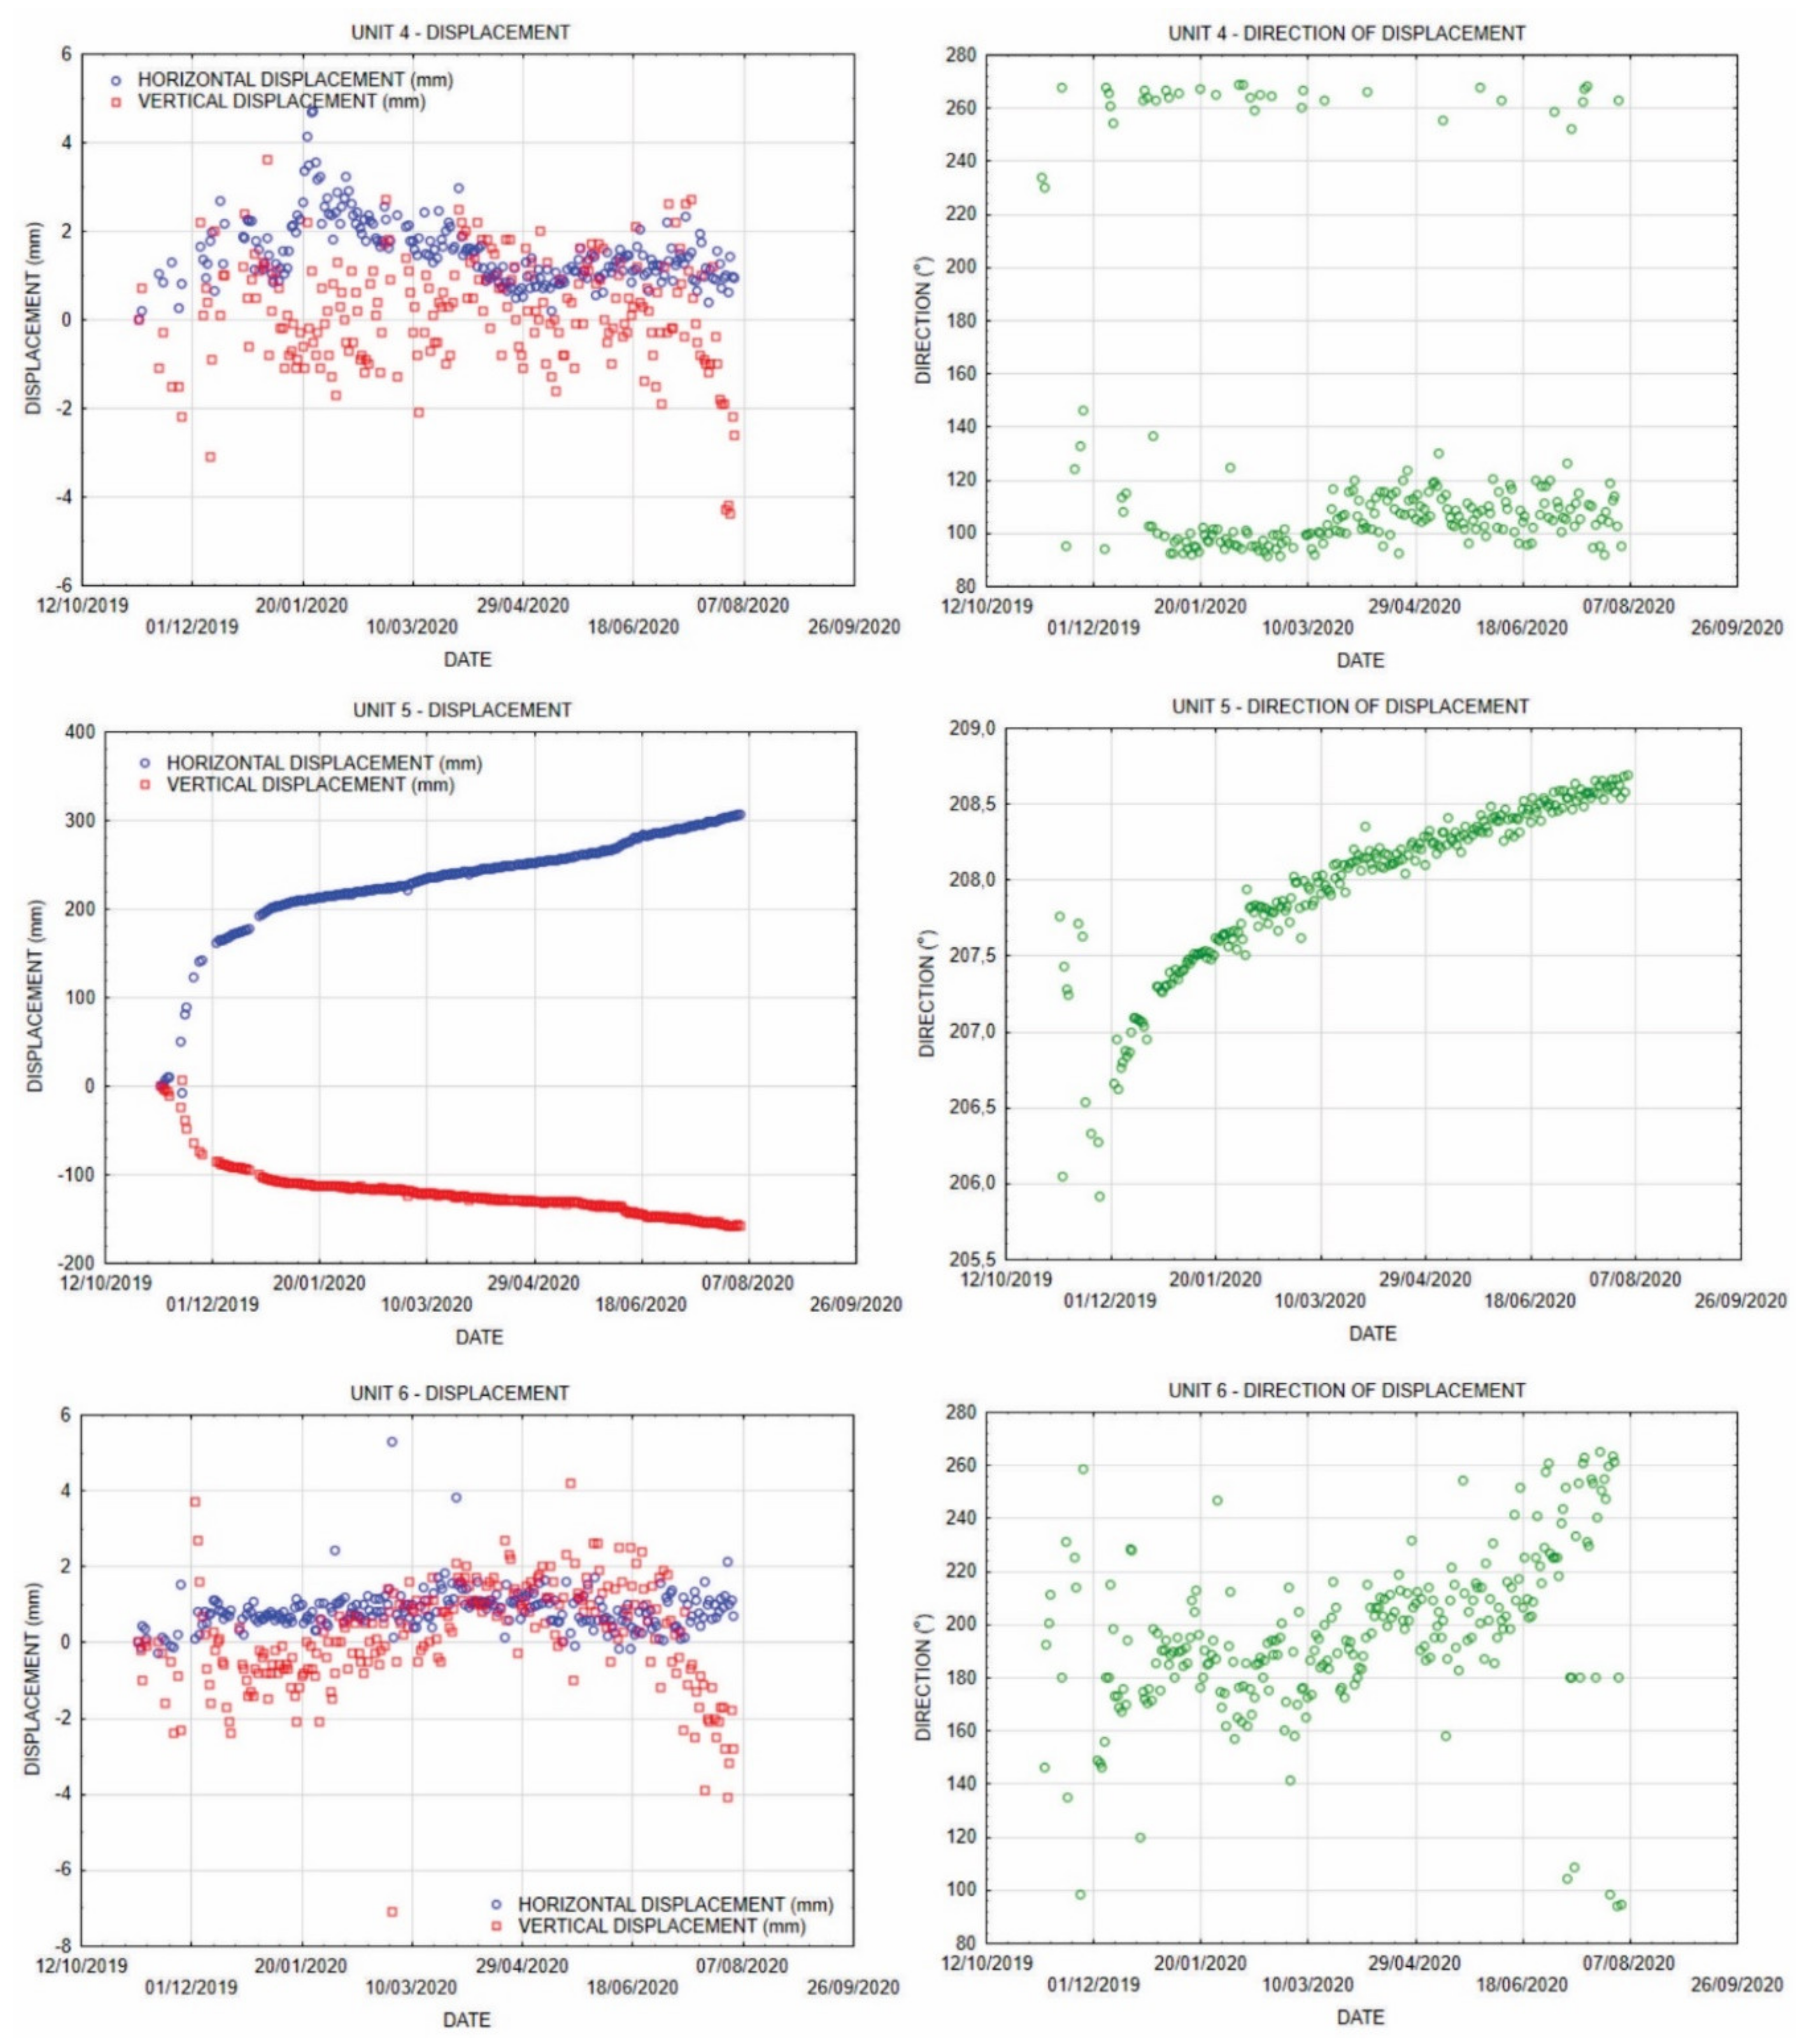
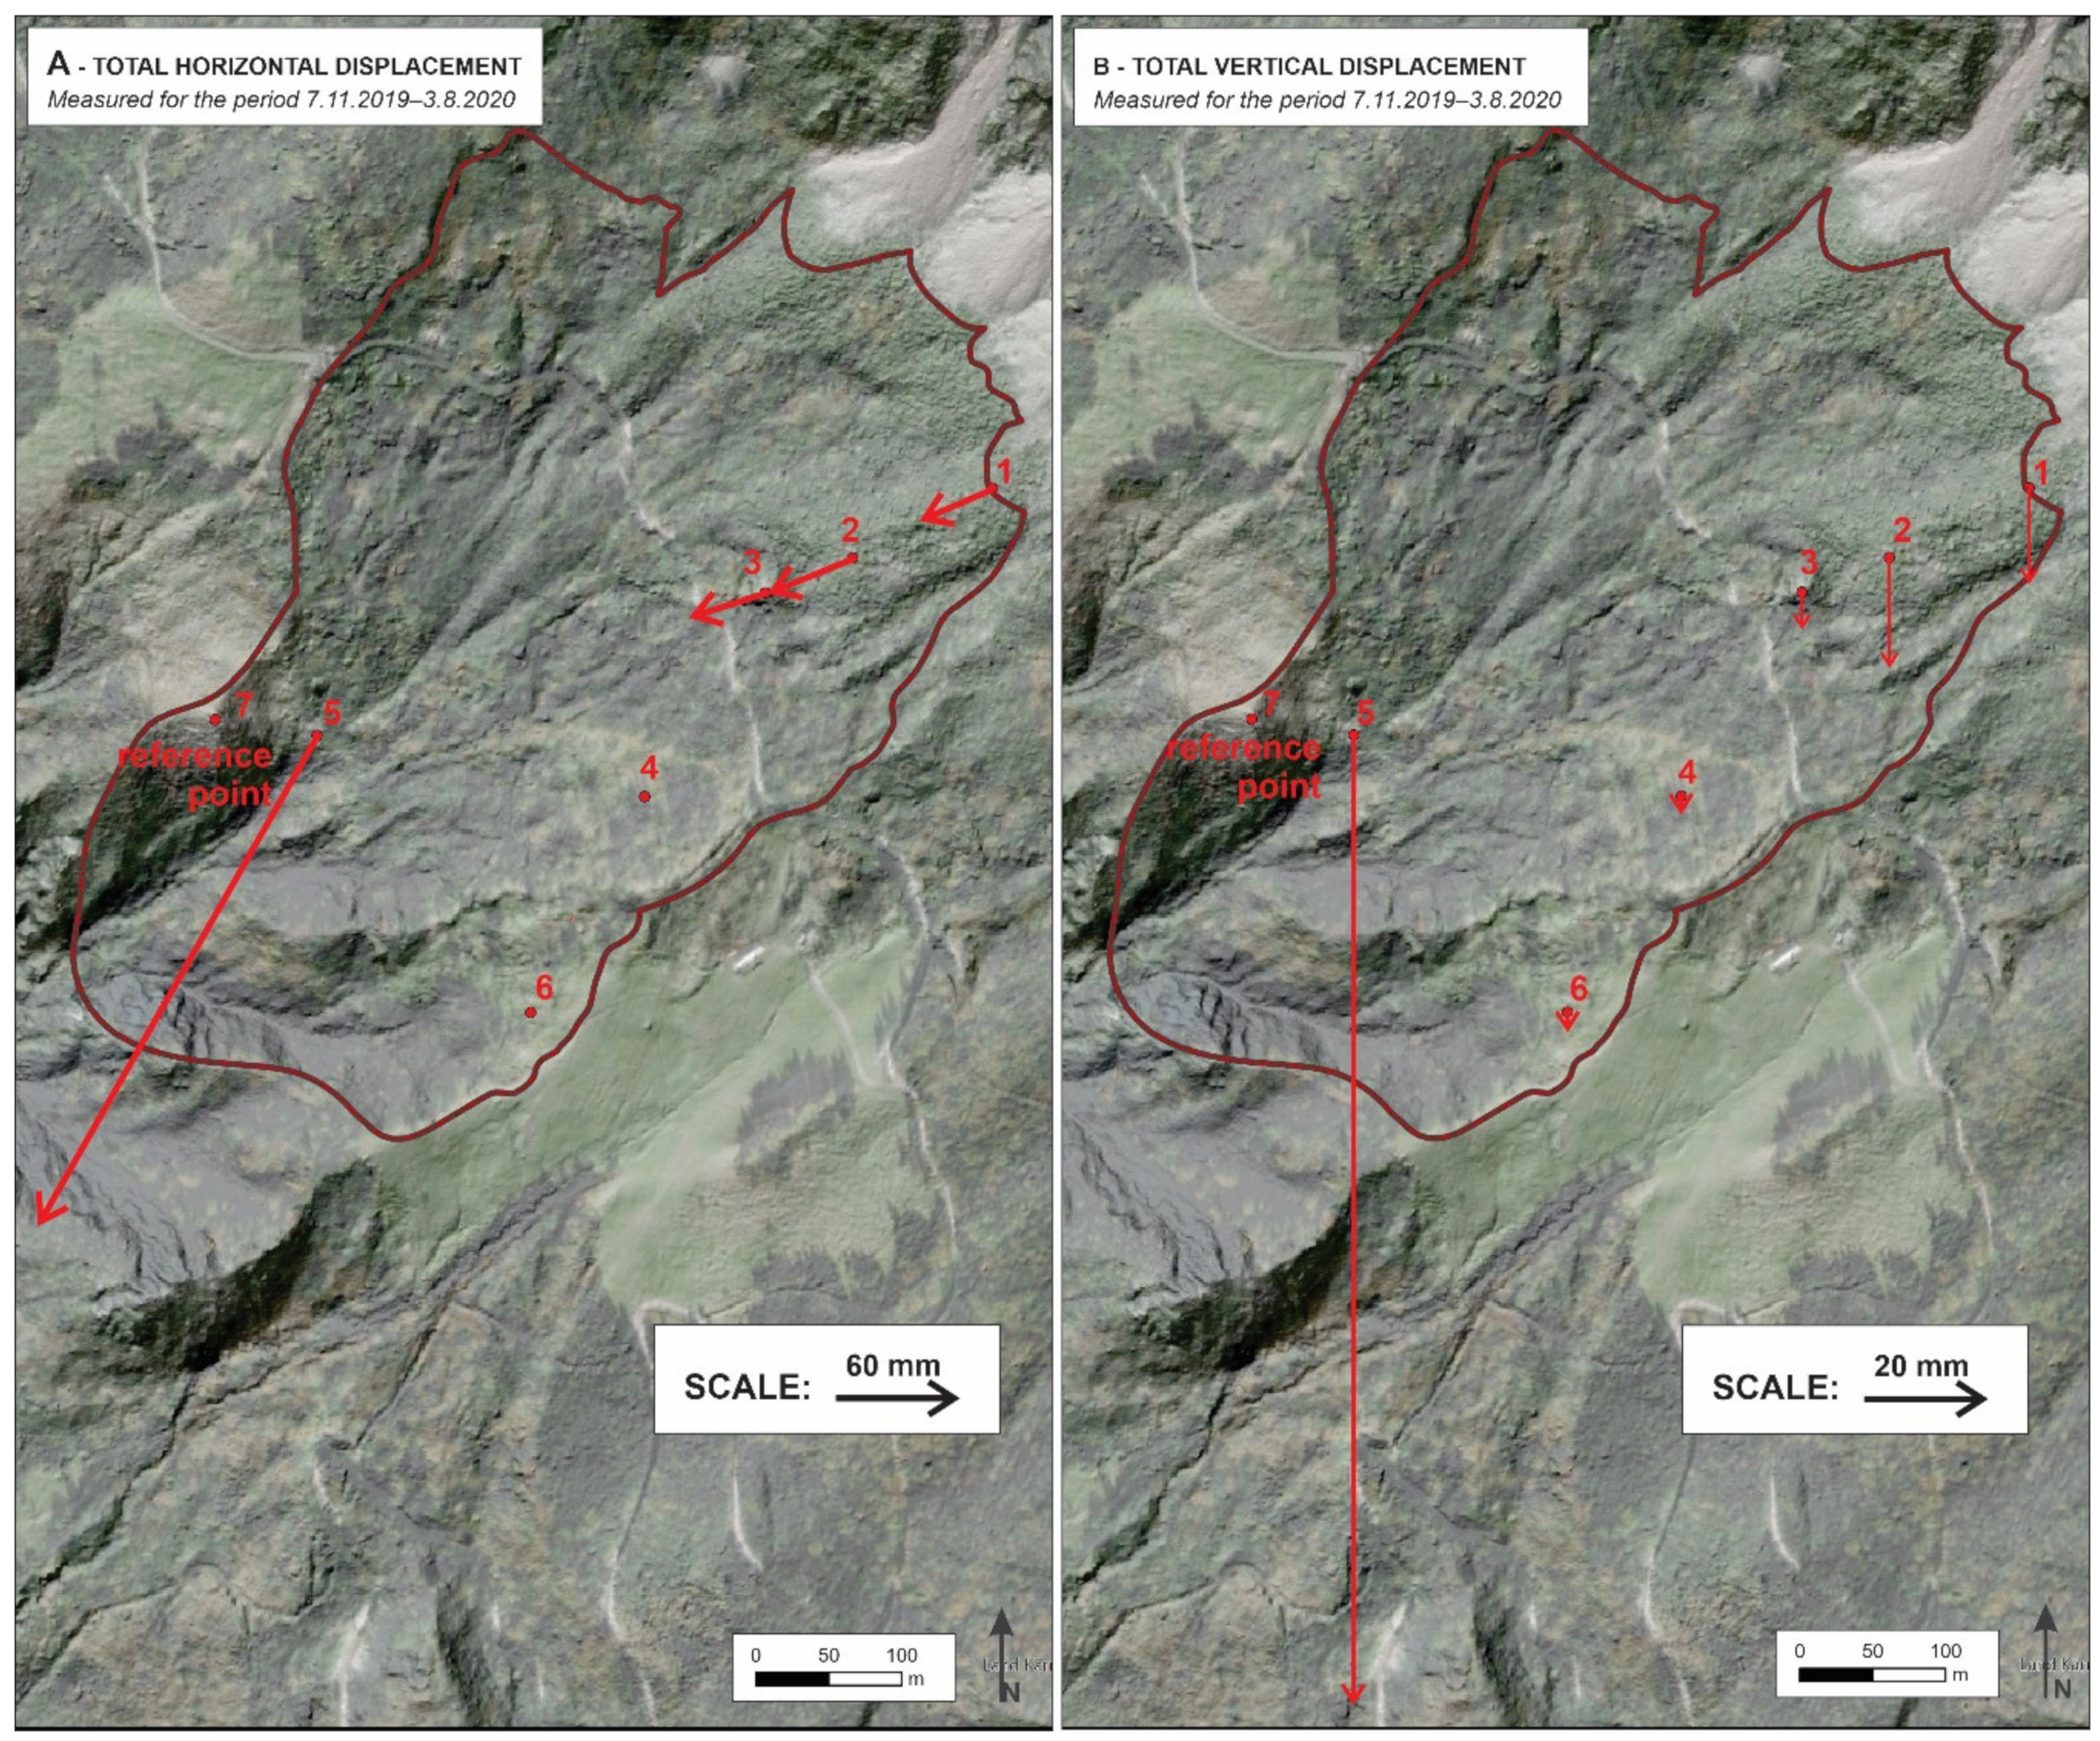
The GNSS data were captured between 24 October 2019 and 3 August 2020 (over 270 days) (
Figure 5). Horizontal displacements were calculated from the displacements detected along the east-west and north-south axes. Due to a lower precision of the GNSS data acquisition along the z-axis, vertical displacements were considered separately.
3.2. Evaluation Method: Classic Geodetic Measurement
The functionality of the low-cost GNSS system prototype was evaluated by comparison with classic geodetic measurements. In landslide areas, displacements are determined most accurately through geodetic methods when the positions of individual points are measured. This has also been confirmed by studies focusing on the advantages and disadvantages of single-point measurement methods for landslide monitoring [
14,
41,
42]. Mainly for reasons of affordability and continuity of measurements, the use of automated GNSS receivers for such measurements is becoming increasingly common [
11,
43]. For monitoring small displacements, total stations, due to their high precision, still have an advantage over GNSS measurement methods [
44,
45]. It has been established that the coordinates from classic geodetic measurements using a total station are determined most accurately when all points are connected into a geodetic network [
46,
47].
Displacements can be determined for the points whose coordinates are determined at least two different occasions. The displacements can be defined as 1D, 2D, or 3D. In our case, 1D—vertical and 2D—horizontal displacements were determined for 6 GNSS units and 9 checkpoints. For the displacement difference analyses, the precision of the antenna used for GNSS measurements was set to the value stated in the technical specifications of the manufacturer [
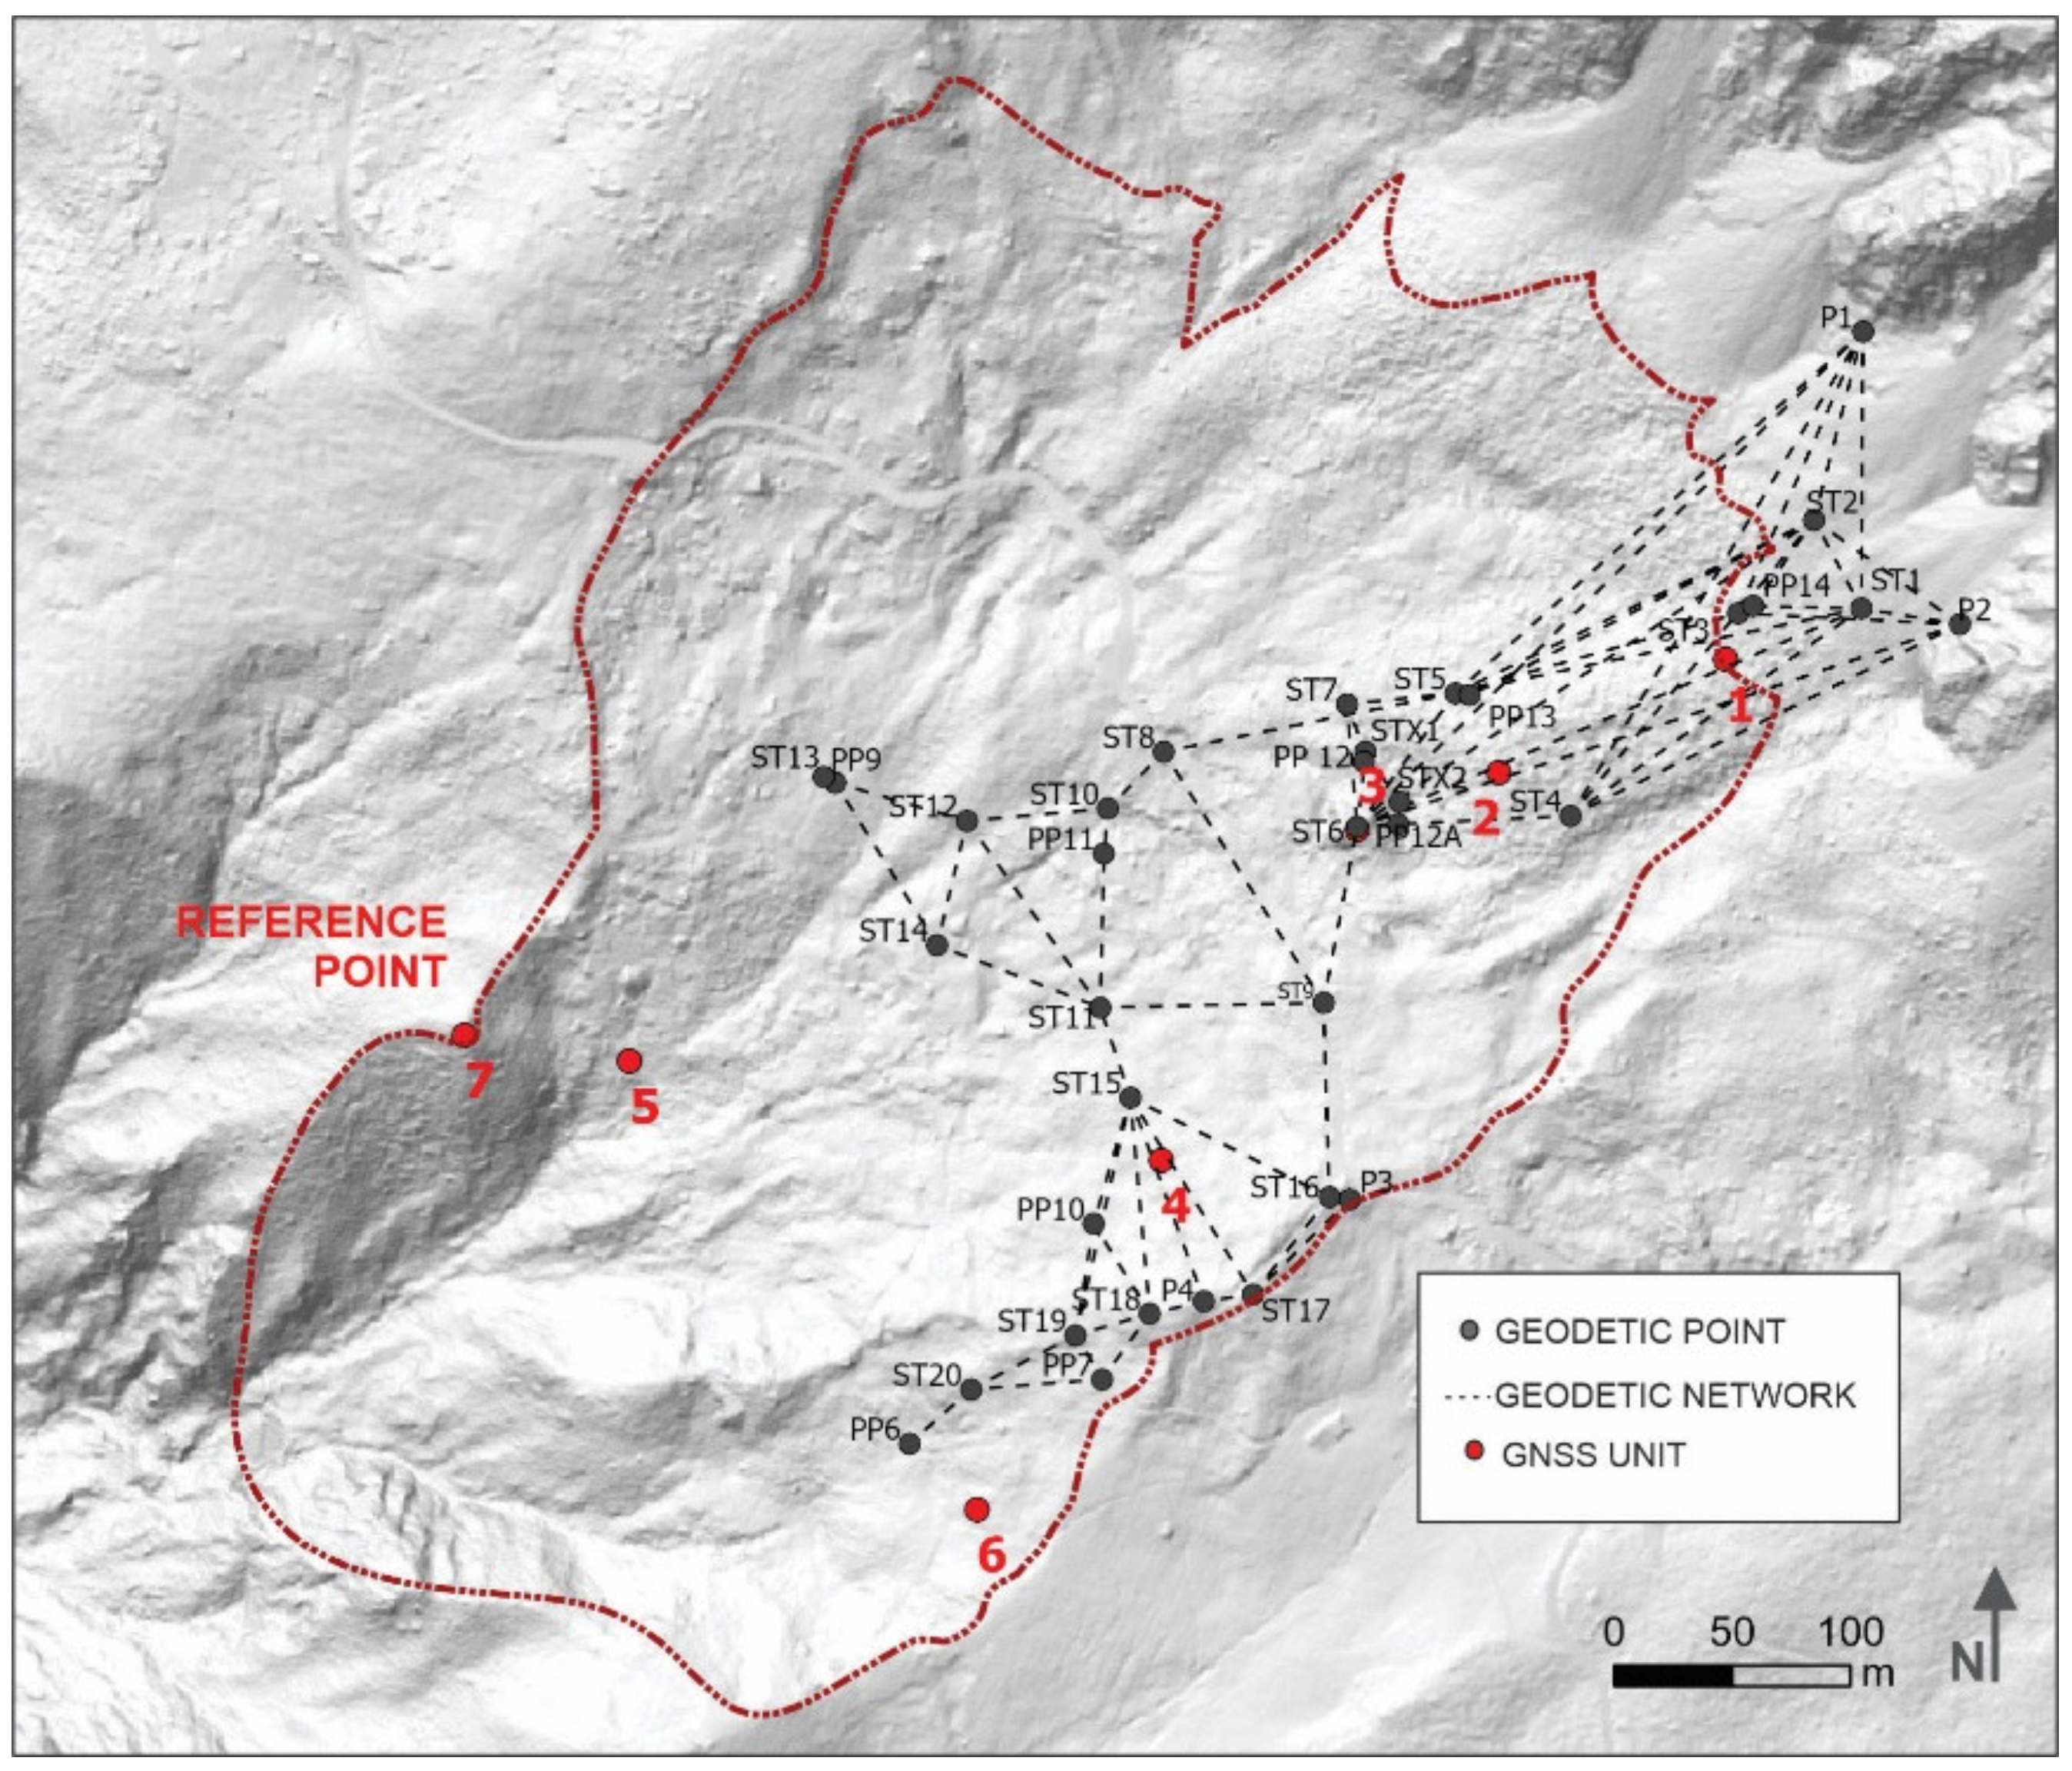
48]. The precision of the checkpoints was calculated from the results of the stochastic part of the geodetic network adjustment, i.e., from the covariance matrix. To achieve the best possible precision of the checkpoint coordinates, we used a suitable measuring method and classic geodetic instruments. There are 9 checkpoints in the area under investigation (PP6-PP14). To check their stability, we stabilised 4 reference points on a supposedly stable terrain (P1-P4). All reference and checkpoints were connected into the geodetic network with 26 stands (ST1-ST20, STX1, STX2) (
Figure 6). We tried to ensure the best possible geometry of the geodetic network, which was strongly influenced by the topography of the terrain and the height of vegetation.
Measurements were taken with the Leica Nova MS50 (angular accuracy 1″, distance accuracy 1 mm + 1.5 ppm) and Leica GPH1P precision prisms (centring accuracy of 0.3 mm). We carried out two measurements, the first one on 3 January 2020, and the second one on 17 April 2020. At each stand, horizontal angles, vertical angles, and slope distances were measured in 5 repetitions in both faces. To calculate the corrections of the measured slope distances, the dry and wet temperatures and air pressure were measured at each stand. The geodetic network was adjusted as a 3D network. By using the same 4 reference points in both adjustments, the same geodetic datum was provided. The accuracy of the adjusted point coordinates (
,
,
) is listed in
Table 1.
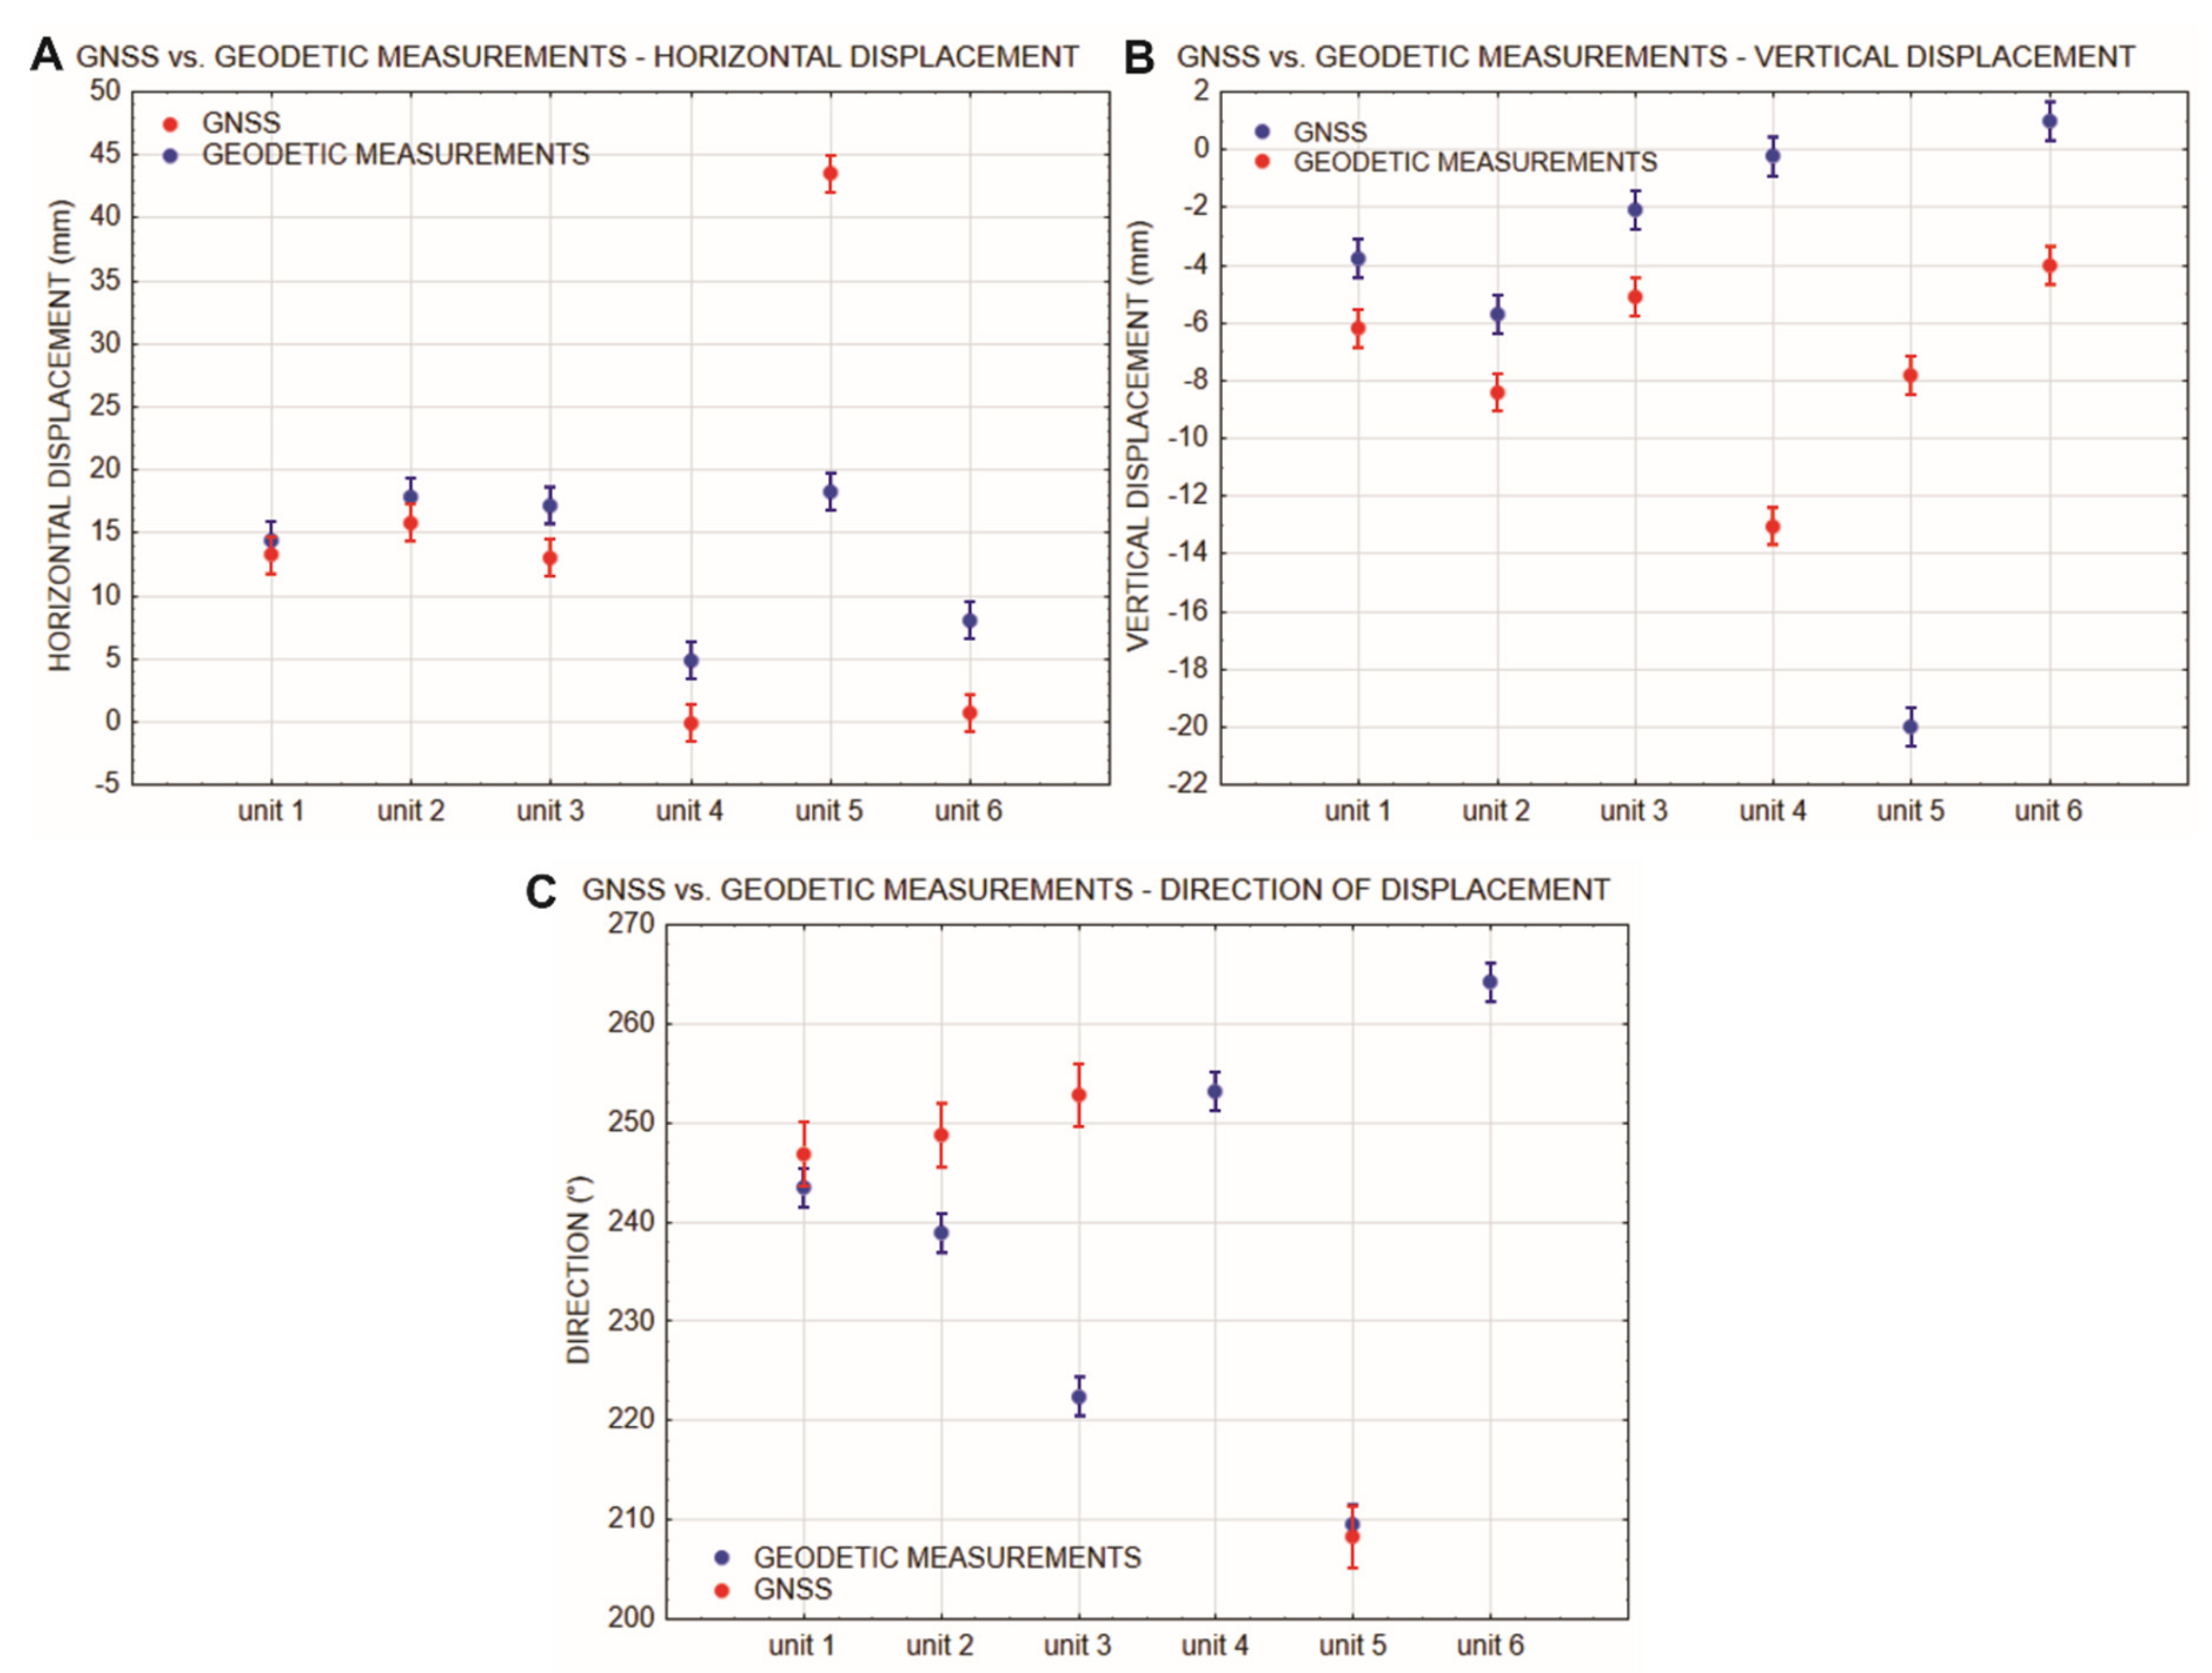
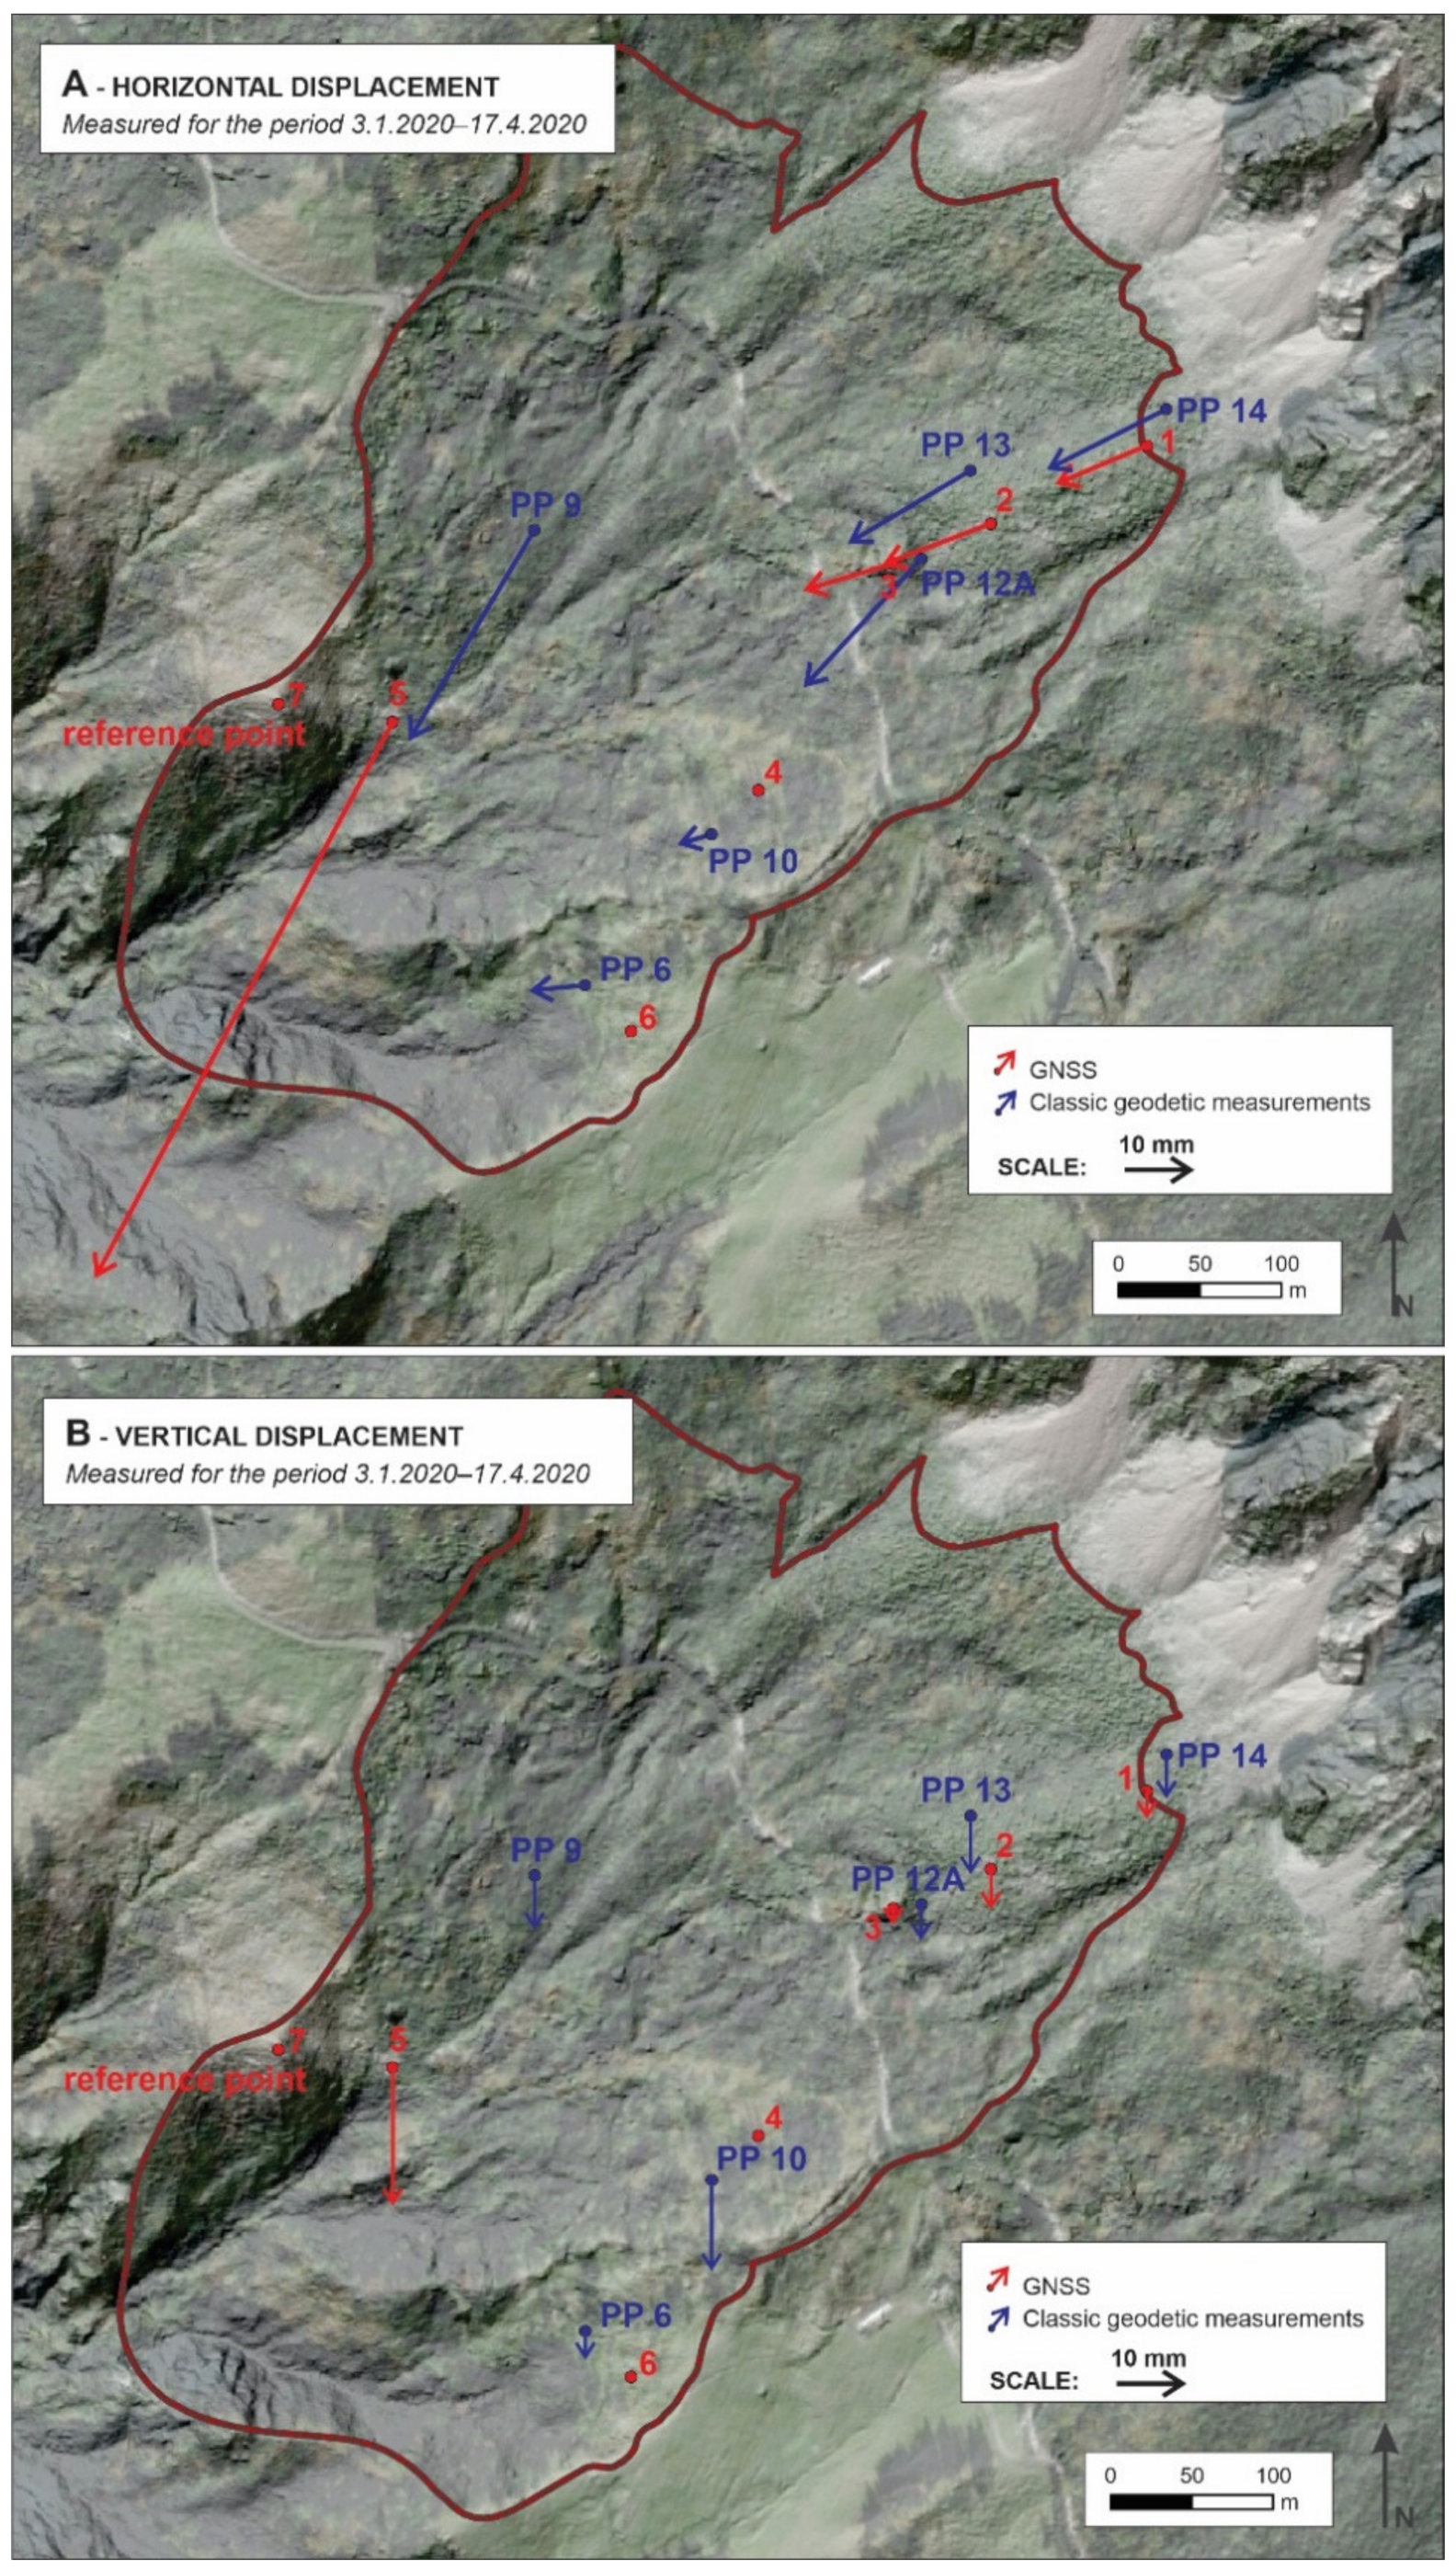
The objective of the analysis of all geodetic observations was to compare the displacements of GNSS points and checkpoints. Since these two types of points were not stabilised at the same locations, the selection of the points for comparison was based on the two criteria: (1) both GNSS and geodetic point are located within the same sector of the landslide, characterised by equivalent landslide kinematics, (2) the GNSS and geodetic points with the shortest mutual distance were selected for comparison. We compared the displacements measured using the GNSS method at the sites of six units with the displacements measured using classic geodetic measurements, and calculated the difference between the horizontal (Hz) and vertical (H) displacements. We then calculated the displacement differences , and differences in the direction of horizontal displacements between the total station measured displacements at the locations of checkpoints and the displacements from the coordinates of the GNSS points. The accuracy of the differences and was calculated according to the error propagation law. The statistical significance of the displacement differences was tested using the 3σ rule.
The correlation between GNSS and geodetic measurements was performed for the displacements measured during the period between 3 January 2020 and 17 April 2020. Classic geodetic measurements are valid for the surface located at approximately 1200 m, while the GNSS measurements are valid for 0 m above sea level. The established difference between the measurements at the displacement of 1 cm is 0.31 mm. Considering the existing precision of GNSS measurements, the deviation is negligible, and GNSS measurements were directly correlated with the geodetic displacement measurements.
3.3. Landslide Monitoring Network
The monitoring sites were selected with the aim of (i) providing good coverage of the whole landslide area and (ii) obtaining a near real-time data on landslide kinematics based on the known landslide behaviour resulting from previous investigations. The selection of the most suitable location for the GNSS units followed the configuration of the terrain, vegetation coverage and accessibility of the site. We also had to pay considerable attention to the logistic constraints (no electrical power, no Wi-Fi, etc.).
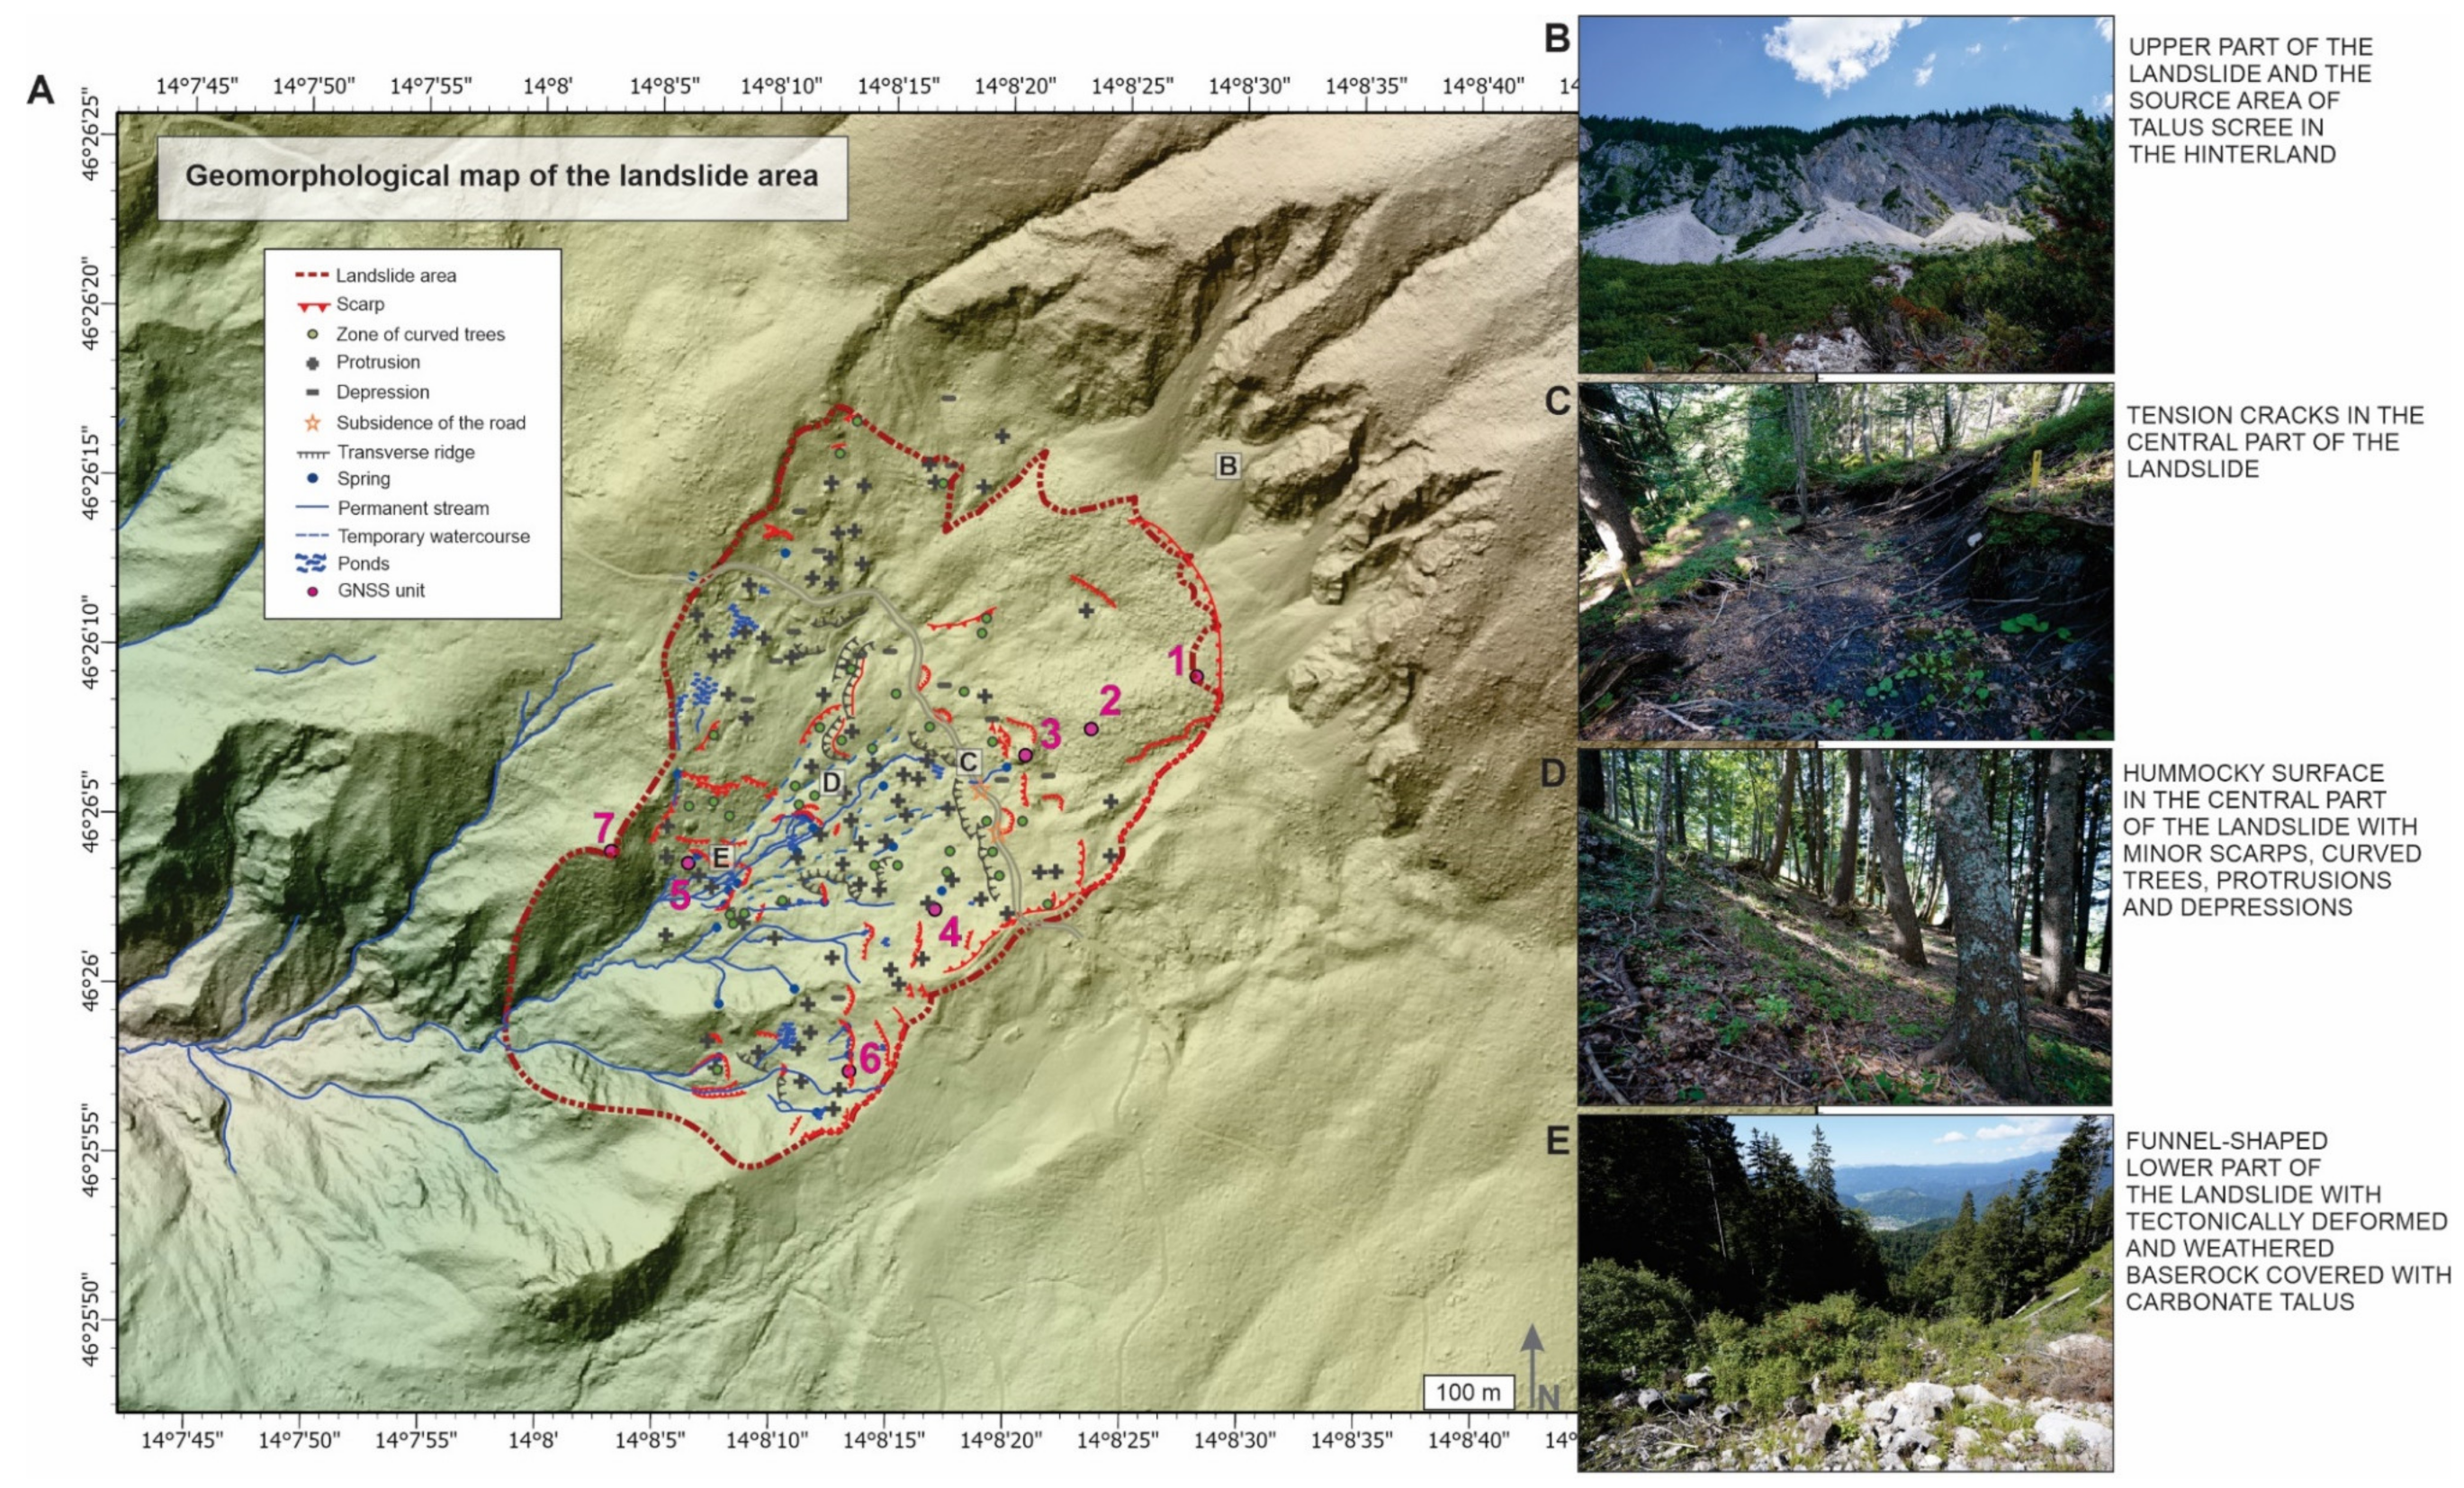
Three units were installed at the head of the landslide (units 1, 2 and 3) to monitor the activity of the fossil scree accumulation located under the steep slopes of the rocky mountain ridge and define the main scarp of the landslide (
Figure 7A). Unit 1 was located close to the estimated main scarp of the landslide and installed on the boulder with the volume of about 1 m
3. Unit 2 was installed on a similar boulder further downhill from the l main scarp of the landslide. Unit 3 was fixed to a large boulder forming a rocky ridge in the unconsolidated scree material in the lower part of the head of the landslide. This boulder is located right above the spring in the currently most active part of the Urbas landslide, where longitudinal open tension cracks have been formed in Palaeozoic rocks (
Figure 7B). To test the side-activity of the landslide, two GNSS units (units 4 and 6) were installed at the left flank of the landslide. Both units were positioned on Palaeozoic clastic rocks. Unit 4 was positioned on a structural bench, while unit 6 was installed in the area which is considered to be a secondary landslide. Unit 5 was fixed onto a large boulder with the volume of about 20 m
3, located in the Bela stream channel in the lower part of landslide. The wider area of this monitoring site is subject to the mass-wasting of weathered clastic rocks and scree material (
Figure 7E). One GNSS unit (unit 7) was installed on an outcrop of Permian limestone within a morphologically expressed ridge. Geomorphological and field mapping did not reveal any signs of sliding activity in this section, nor in the section towards the north-west of the landslide. This unit was considered a reference point.
3.4. Correlation of GNSS and Rainfall Data
GNSS-derived data on surface displacements were correlated with the precipitation measured at the rain gauge located at the GNSS unit 2. First, precipitation data were analysed to isolate rainy, dry and mixed periods and individual heavy rain events. Surface displacement time series were then correlated with the established weather conditions to reveal the potential relation between the velocity of surface displacement and precipitation. Then, the correlation coefficient (r) was calculated between the daily displacements and rainfall considering different antecedent precipitation. Based on this, the antecedent precipitation exhibiting the strongest correlation with the measured daily displacements were determined. To define the strength of the correlation, the determined antecedent precipitation was taken into account for the final correlation with the daily displacement.
5. Discussion
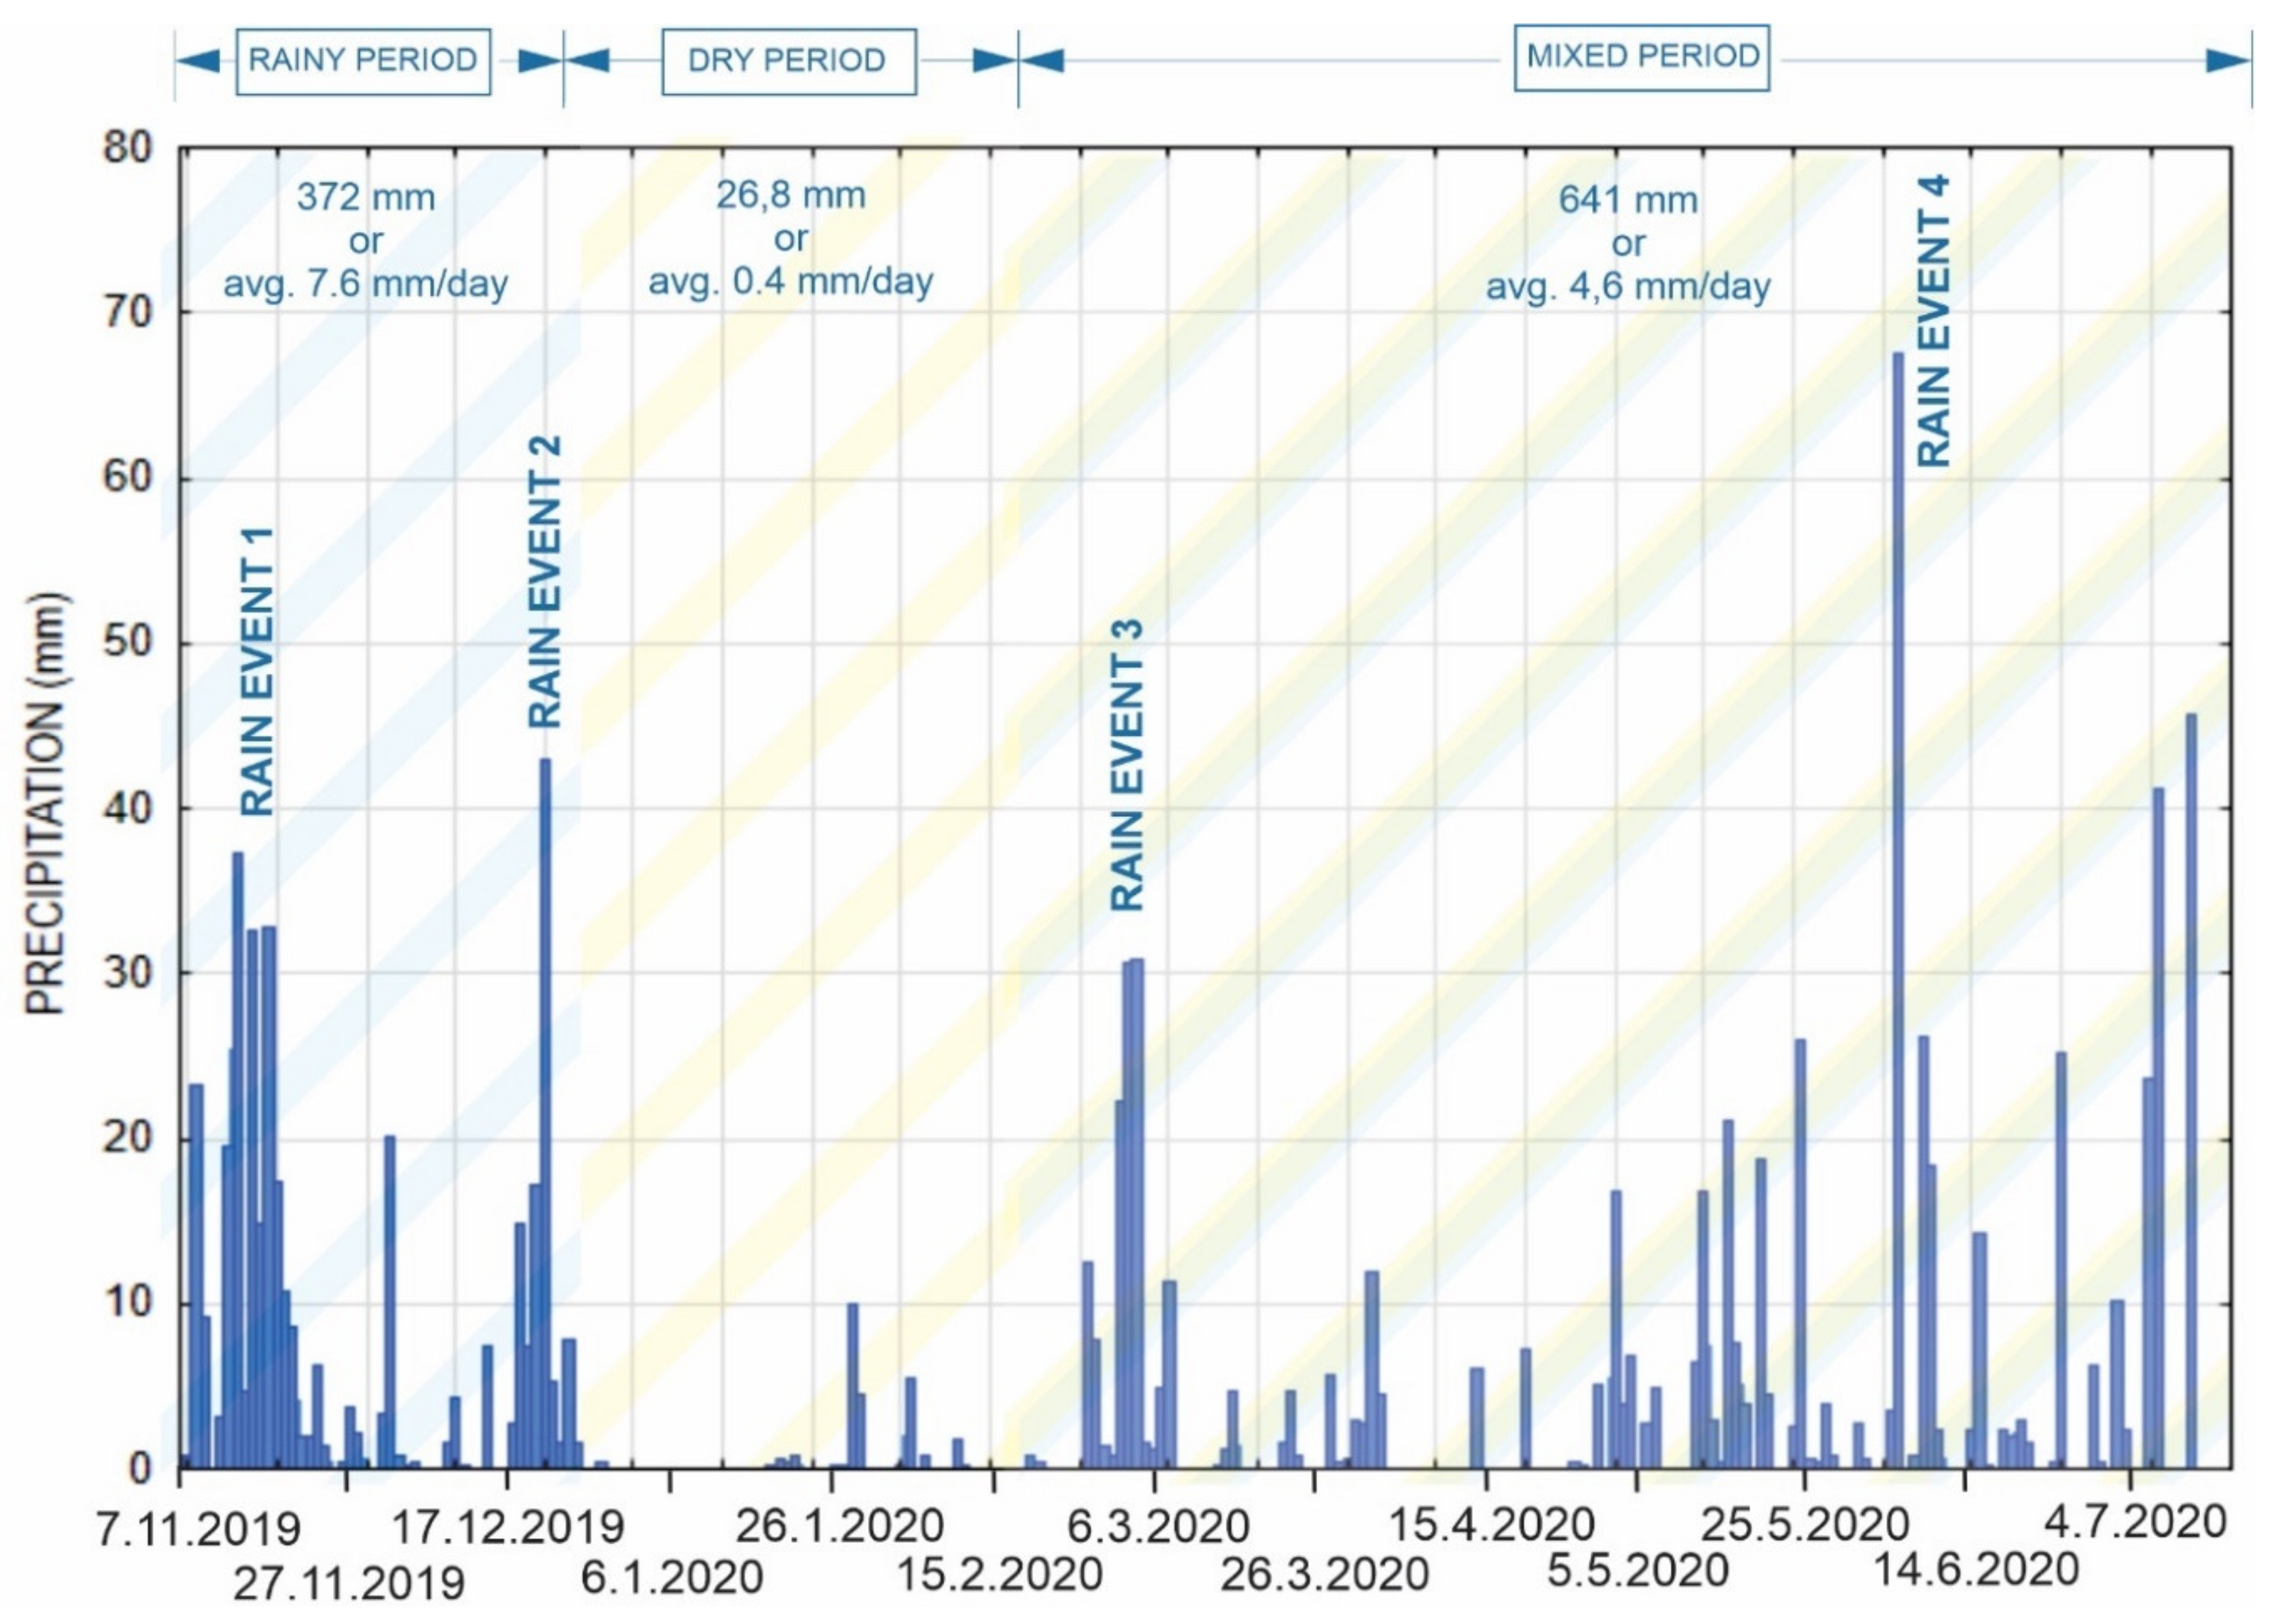
The following analysis shows an example of the way in which the acquired GNSS data can be applied to determine the impact of rainfall on the shallow surface displacement velocity of the deep-seated landslide. During the observation period between 7 November 2019 and 14 July 2020, the Urbas landslide area was exposed to variable weather conditions. A heavy rain period characterised by intense and long-lasting rainfall was followed by a dry period. The last part of the observation period could be considered a mixed period, with a combination of short rainy and dry periods (
Table 4).
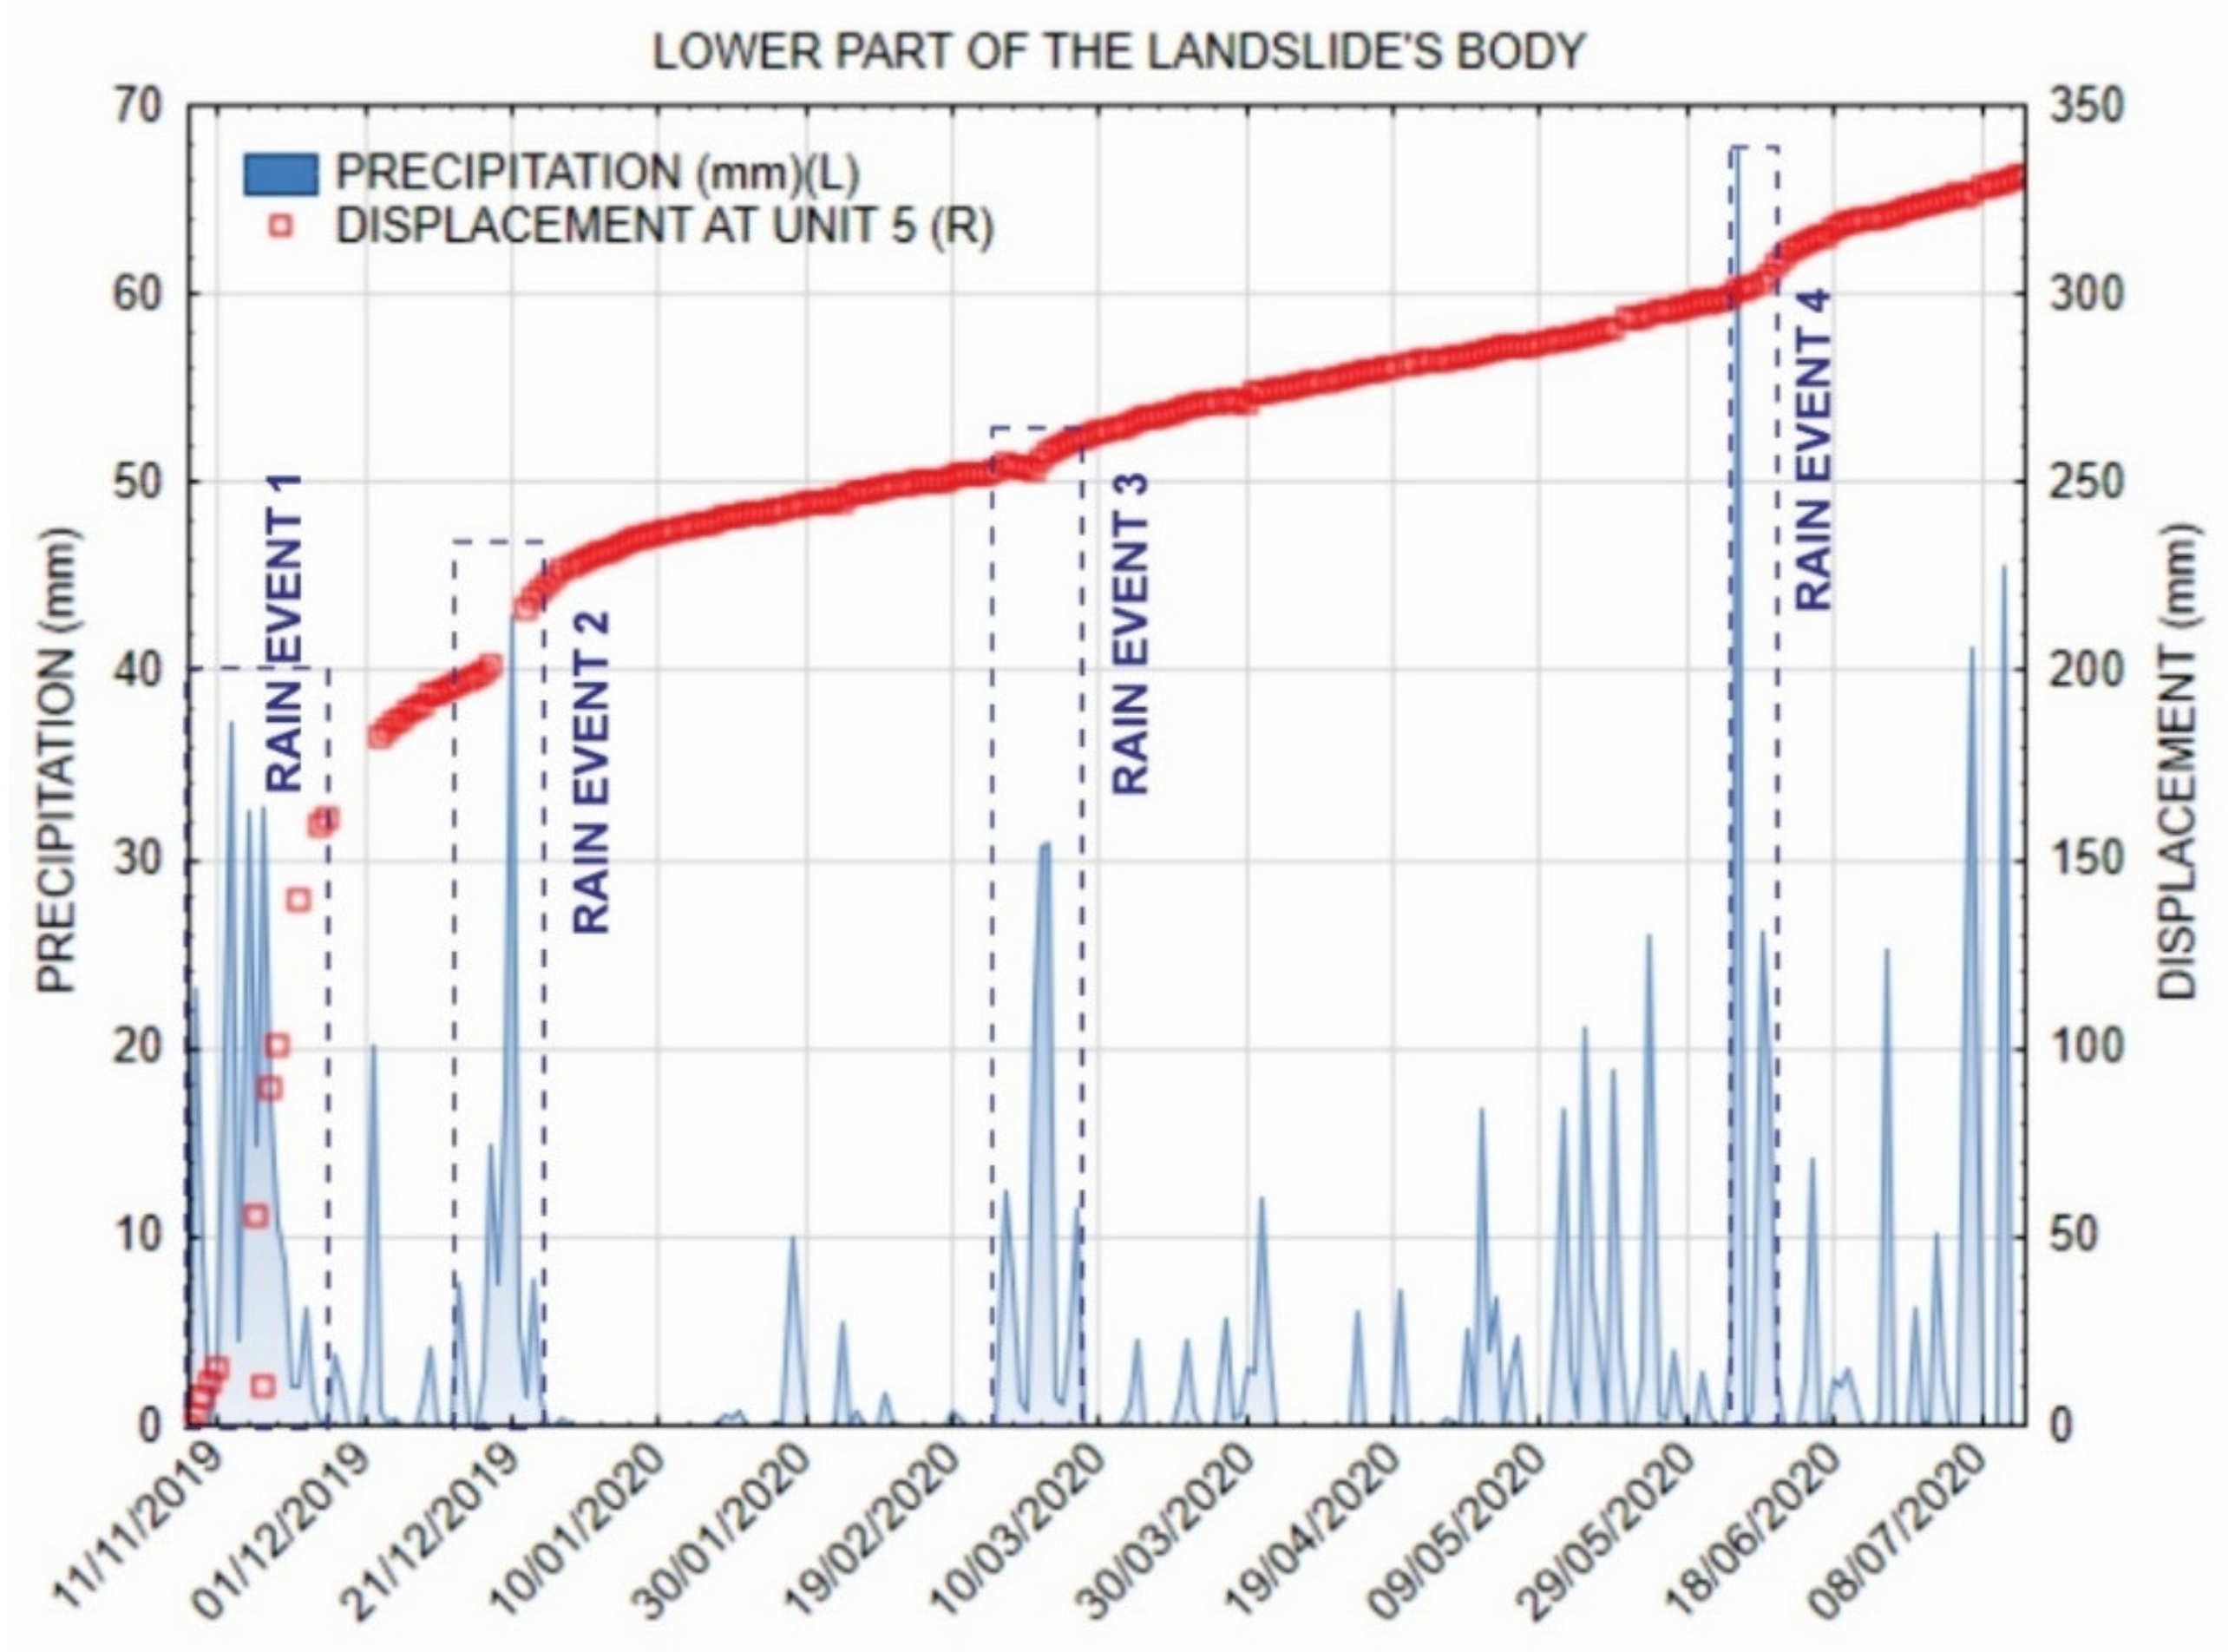
During the entire monitoring period, three major rain events were reported:
- -
Rain event 1: 7 November 2019–20 November 2019 (313.8 mm or 17.4 mm/day),
- -
Rain event 2: 17 December 2019–25 December 2019 (92.4 mm or 10.3 mm/day), and
- -
Rain event 3: 26 February 2020–7 March 2020 (125.0 mm or 11.4 mm/day),
- -
Rain event 4: 5 June 2020–9 June 2020 (113.0 mm or 22.6 mm/day) (
Figure 12).
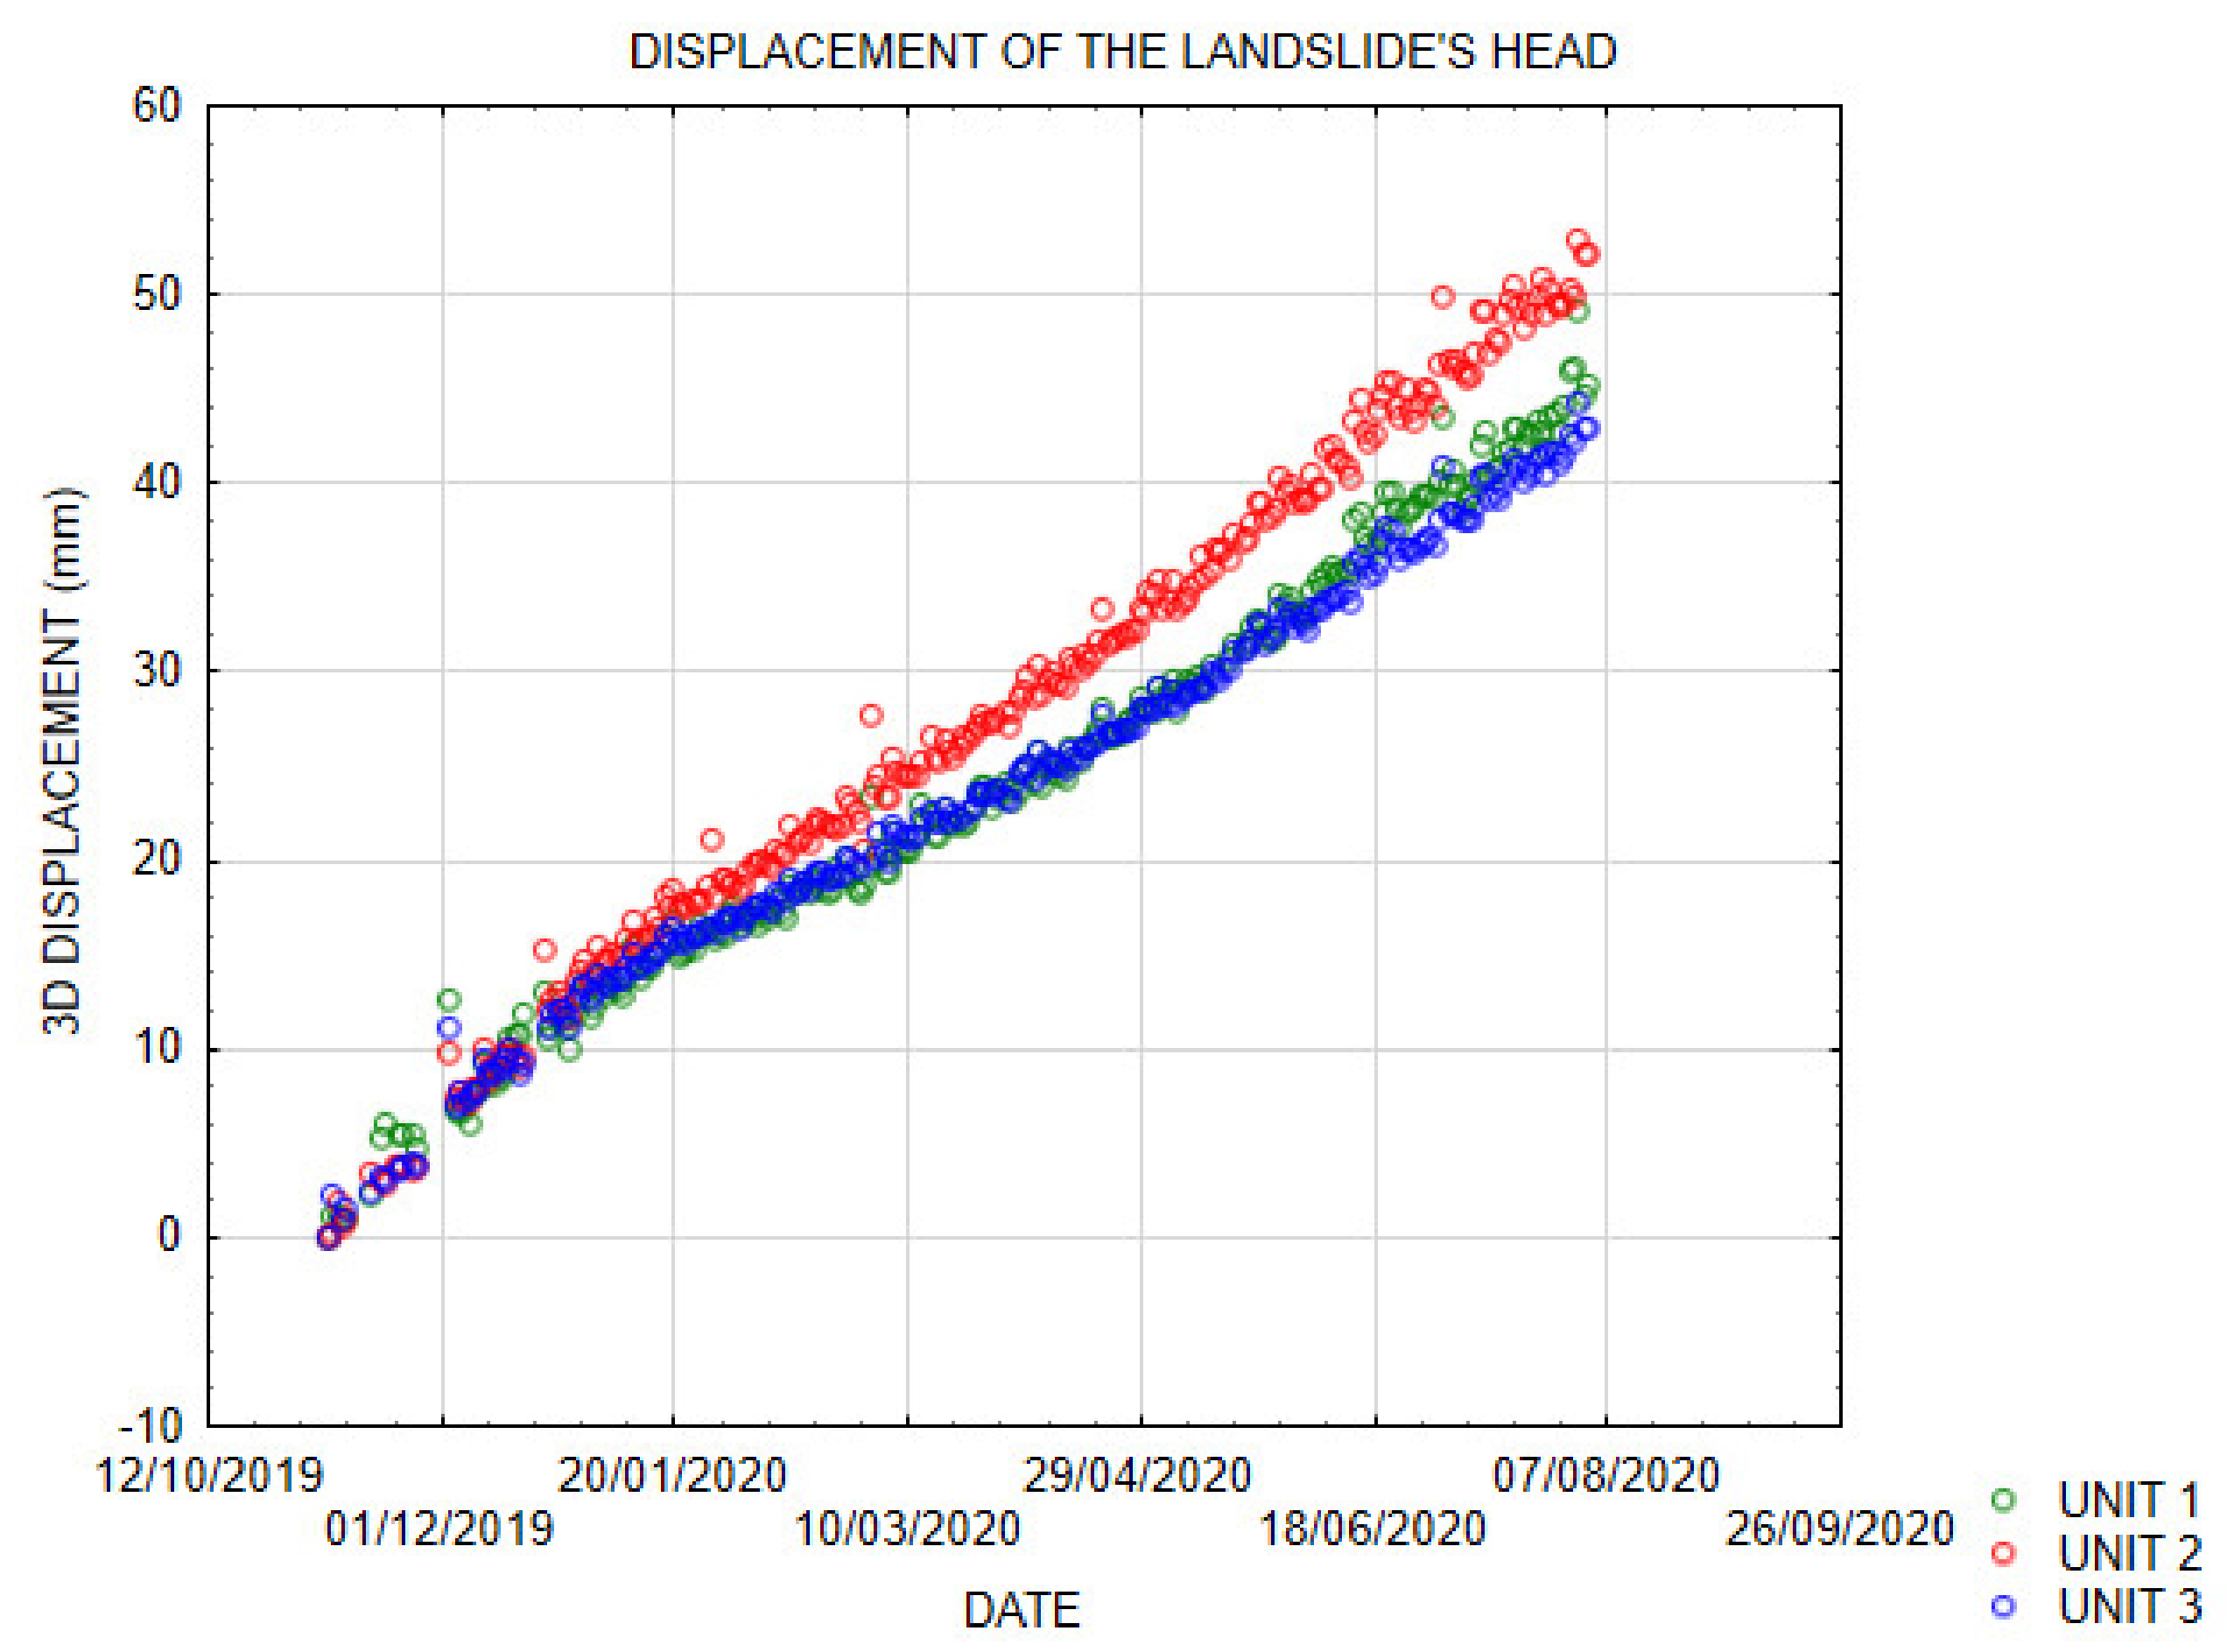
According to the recorded data, the head of the landslide comprises a wider area of units 1, 2 and 3. The main scarp was presumed to be located in the vicinity of unit 1, but it was difficult to determine its exact location due to a thick cover of slope talus and a continuous accumulation of the material from the steep rocky cliffs in the hinterland (
Figure 2). The displacements recorded at the GNSS site 1 confirmed the location of the main scarp at least slightly above the location of unit 1.
Spatially and temporally, this area exhibited fairly uniform surface displacements with the app. velocity of 0.17 mm/day (
Figure 13). During the heavy rain period, the displacement rate increased to app. 0.25 mm/day. The displacement trend slowed down over the week following the rain period (
Figure 13). Other less intense and shorter rain events did not affect the surface kinematics of this part of the landslide. During dry and mixed periods, the area of unit 2 showed a slightly higher displacement rate compared to the areas of units 1 and 3. These findings indicate that the surface displacements in the upper part of the landslide body are coherent with the deep displacements at the sliding surface. The kinematics of this part of the landslide respond only on long rainy periods, such as that recorded in November 2019.
All three units were installed on large boulders. The specific behaviour of boulders within the sliding material (downslope movement, rotation) may result in slightly different displacement rates observed between the sites.
The site of unit 2 was previously monitored using the GNSS method in the period between the years 2010 and 2011 [
37], during which a well-comparable horizontal annual velocity was acquired (
Table 5). Due to the lower accuracy of the GNSS measurements along the vertical axis, the deviation is larger for vertical annual velocity.
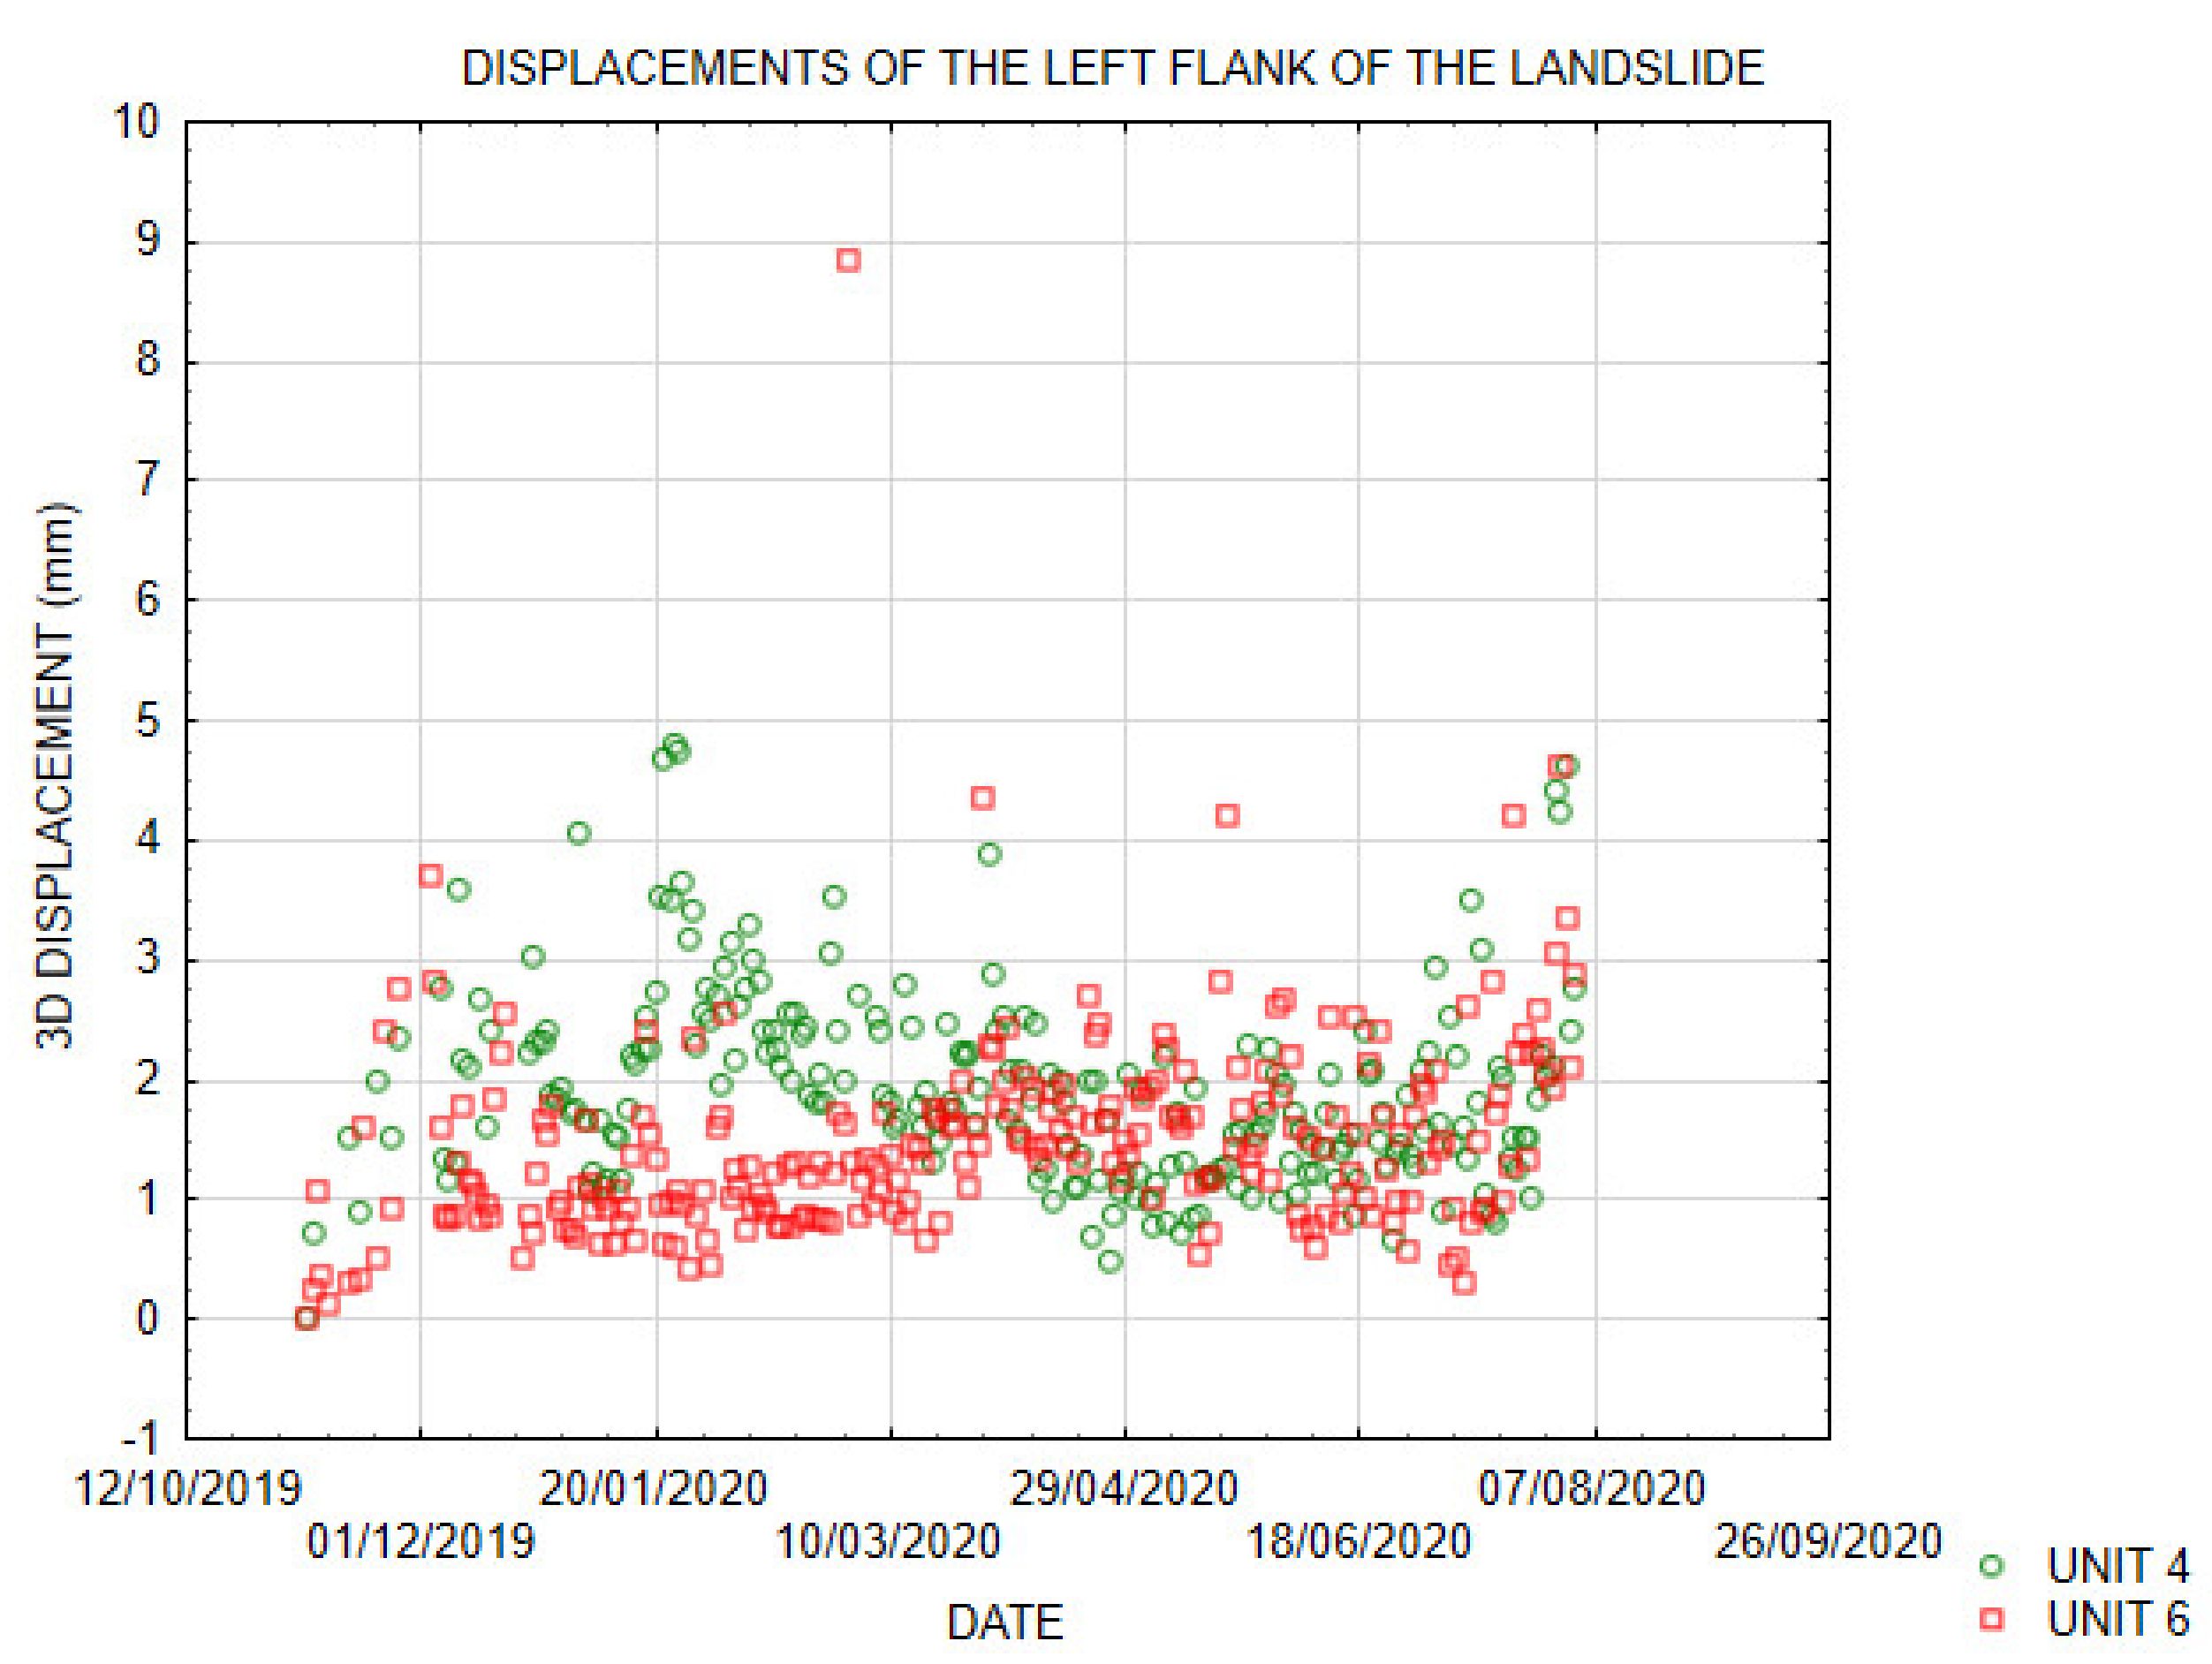
During the entire observation period, the left flank of the landslide monitored by GNSS units 4 and 6 exhibited only negligible displacements (
Figure 14). However, unit 4 detected the displacement trend at the rate of 0.12 mm/day, which was strictly limited to the heavy rain period. The displacement ended immediately after the end of the rain period, indicating a strong correlation between the displacements in this area and extreme precipitation. This conclusion confirms the GNSS displacement measurements obtained in 2010–2011 at the same site [
37], which show that the sliding occurred exclusively in correlation with a very high amount of precipitation. Both GNSS systems indicate that this part of the landslide activates only during periods of extreme rainfall. The existing sliding morphology which includes curved trees, scarps, and hummocky terrain might be a consequence of episodic movements related to extreme precipitation or related groundwater fluctuations [
21]. Precipitation peaks detected during the mixed period (rain events 3 and 4) did not affect the stability of this part of the landslide.
The left flank of the landslide at unit 6 was stable during the entire monitoring period. However, the sliding morphology of the surface indicates some displacements in this area. It appears that the displacements are outside the range of the accuracy of the GNSS system or are correlated with particular environmental conditions which were not met during the monitoring period.
The highest surface displacement rates were observed in the lower part of the landslide body, where the material from the wide source area is accumulated in the narrow channel of the Bela stream (
Figure 7). Generally speaking, the material is subject to a constant slow-motion surface displacement, interrupted by periodically increased movements strictly correlated with rain events. The direct correlation between surface displacement and rainfall indicates that this part of the deep-seated landslide is dominated by shallow processes which quickly respond to rain events, as opposed to other parts of the landslide. In this area, the sliding surface reaches the surface (
Figure 2), and the transported material consisting of mixed weathered clastic rocks and carbonate talus deposits is subject to continuous washing-out by the Bela stream.
The detailed inspection of the displacement rates shows the complex nature of the landslide surface kinematics at this location. During dry periods, the area recorded a continuous displacement rate of 0.48 mm/day, which is four times faster compared to the constant displacement rate during the dry period recorded at the head of the landslide. The highest displacement rate observed at the site occurred during rain event 1 between 16 November 2019 and 26 November 2019, when it reached 17.69 mm/day. Virtually every rain event caused some changes in the displacement trend of this site (
Figure 15). The time series of the data shows that the lowest part of the landslide is very sensitive to the amount and type of precipitation and constantly adapts the displacement to environmental conditions.
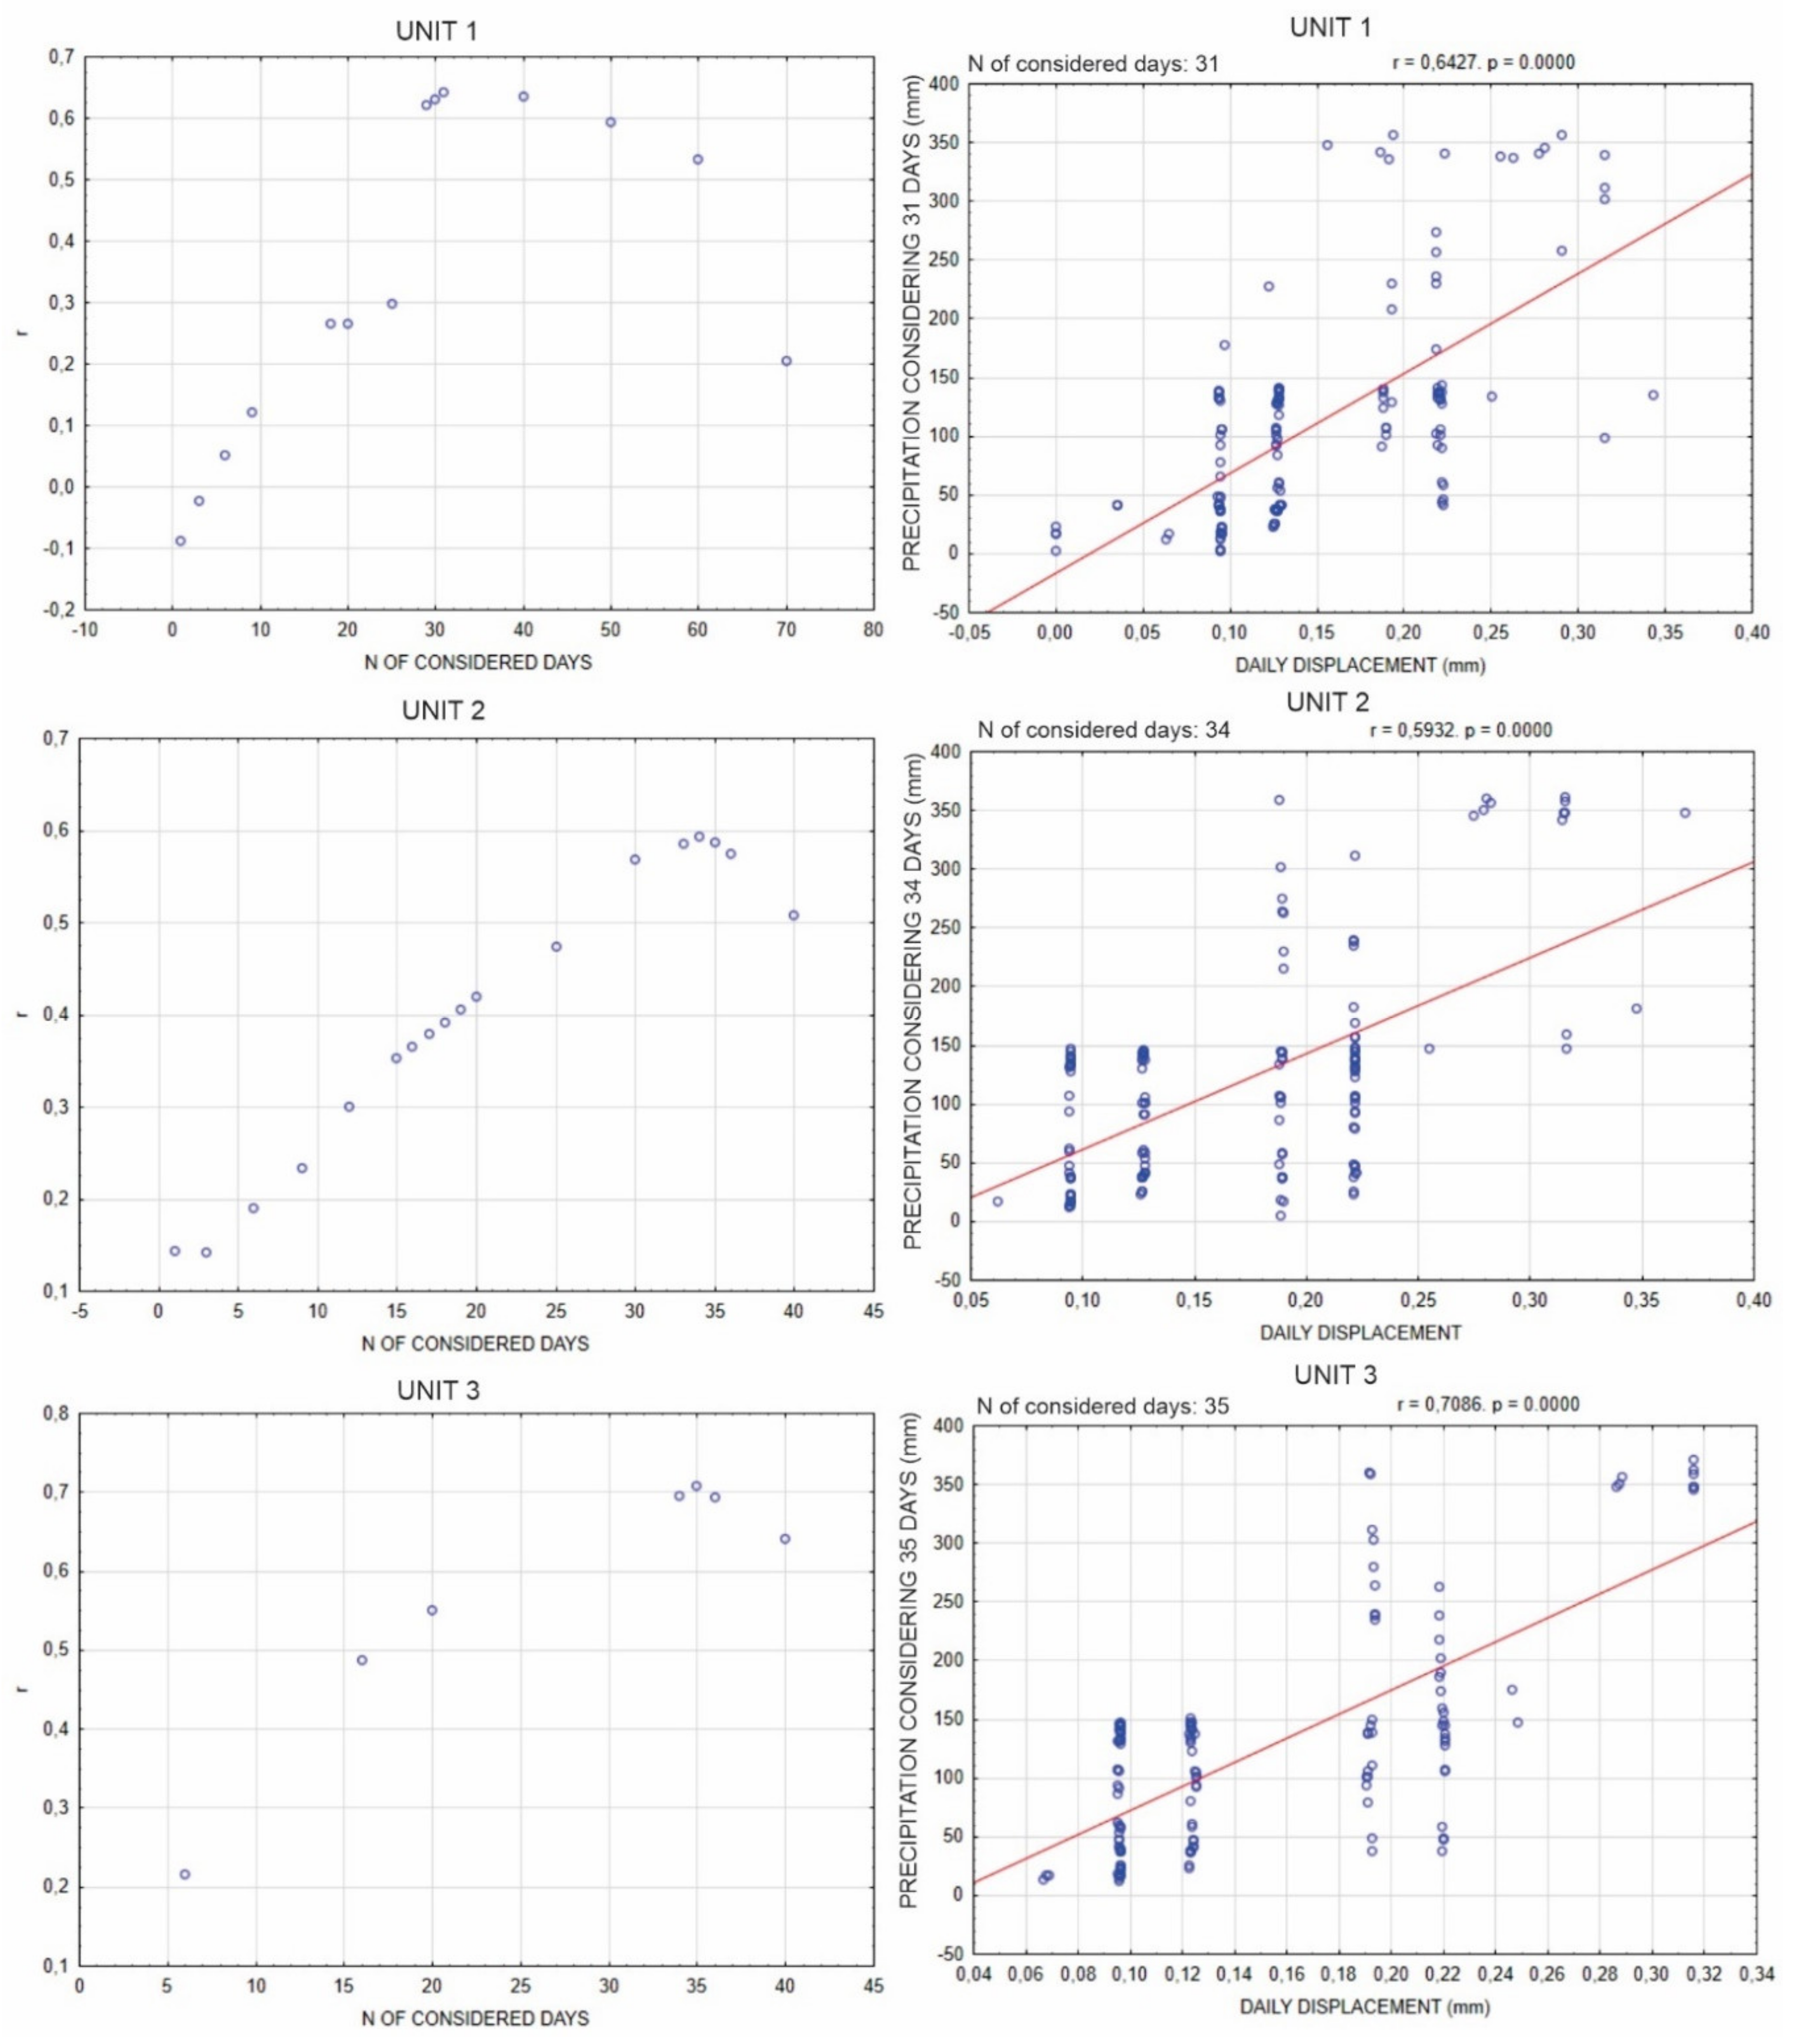
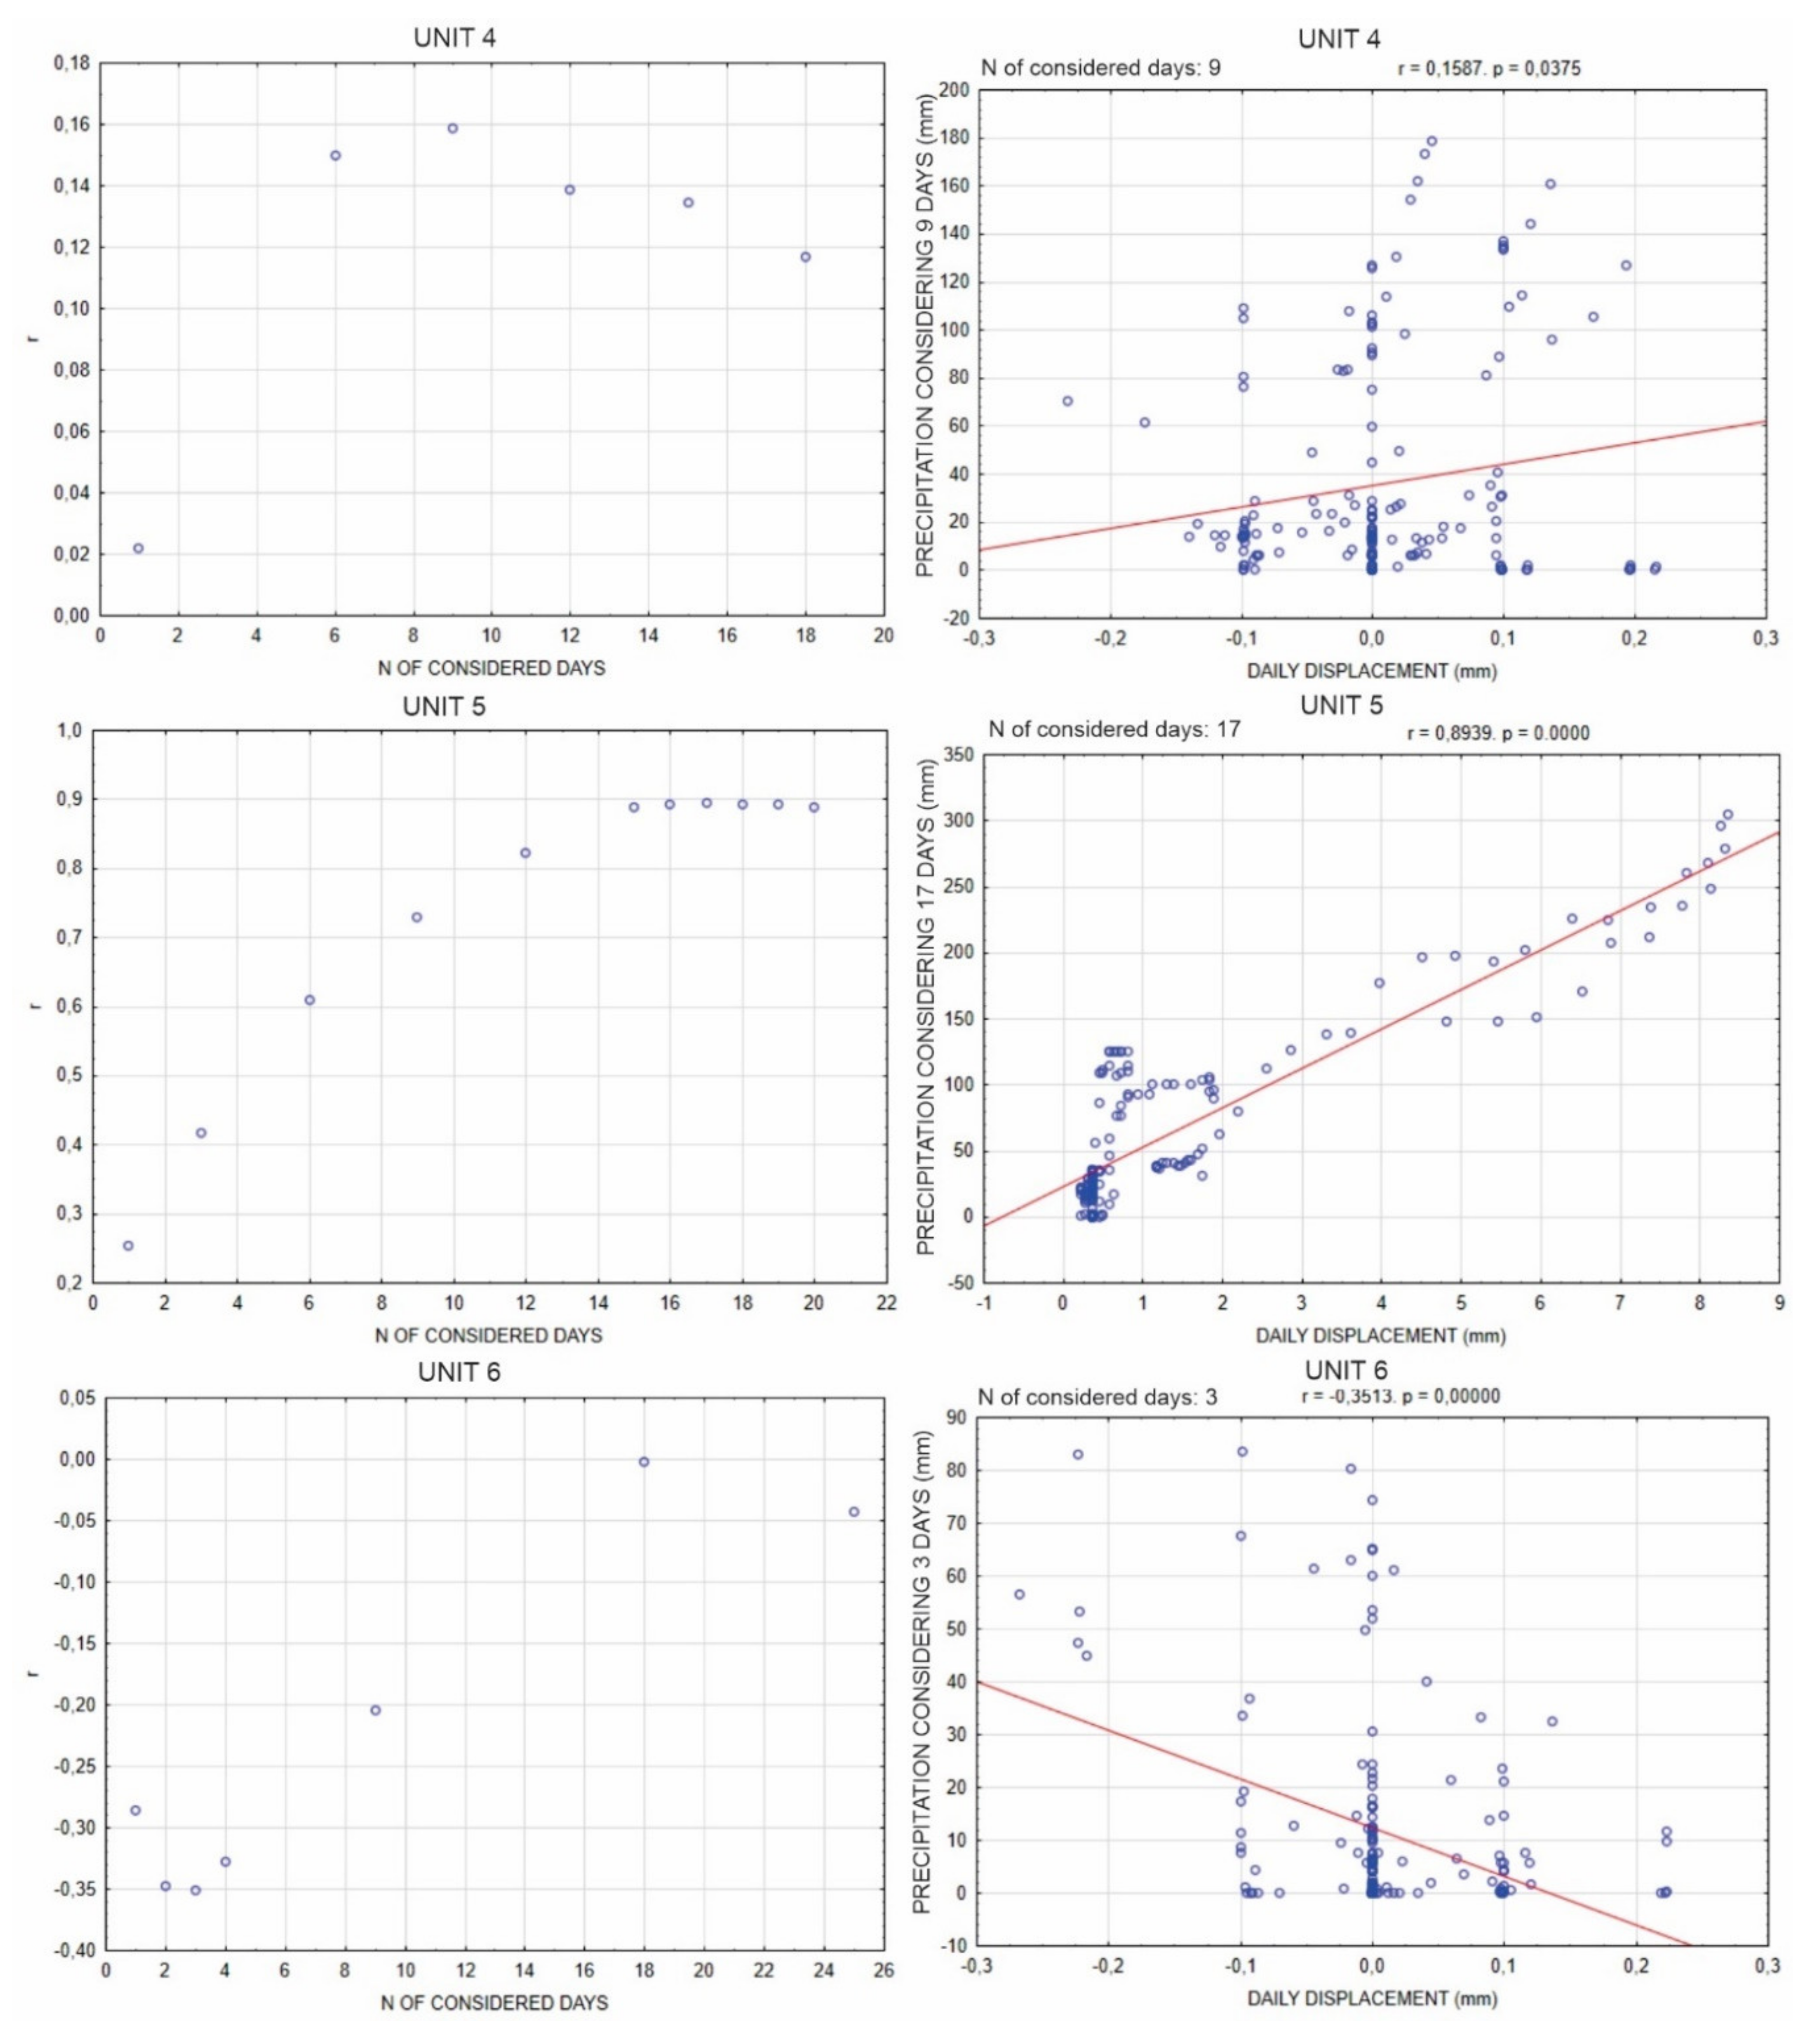
For a deeper insight into the landslide kinematics, a correlation between rainfall and daily displacement was additionally analysed for all GNSS datasets. To reduce the processing error, the modelled daily displacements measured by GNSS were correlated with the daily sum of precipitation measured at the rain gauge located at the GNSS unit 2 for the period between 24 October 2019 and 20 April 2020. Different sets of antecedent precipitation as a triggering factor for the displacement of the surface material of the landslide were observed to determine the highest correlation coefficient between daily displacement and precipitation (
Figure 16 and
Figure 17). As expected, a good correlation between daily displacement and precipitation was established only at the lower part of the landslide, which is dominated by shallow processes associated with the deep-seated landslide (unit 5) (
Table 6). At the upper part of the landslide, a lag of over a month in response to precipitation confirms that surface displacements are driven by the deep displacements along the sliding surface. The rain period lasting over a month, which occurred at the beginning of the monitoring period, influenced the displacement rate at this part of the landslide (units 1–3). Extreme precipitation was required for displacements to occur at the left flank of the landslide at unit 4, while at unit 6, the rainfall encountered during the observation period did not cause any measurable displacement of the landslide surface.
The landslide triggering rainfall threshold value for each engineering geological unit was determined within the framework of the National Landslide Prediction System in Slovenia (MASPREM) [
29]. The minimum value of rainfall threshold values of 120 mm was assigned for engineering geological units in the area of the Urbas landslide [
29]. According to the precipitation recorded at the rain gauge at the site, the area was subject to such circumstances during the rainfall event 1, taking into account 5 days of antecedent precipitation. Indeed, the GNSS system measured the highest displacement during this period (
Figure 15). Continuous and close to real-time data of surface landslide displacements acquired by the low-cost GNSS system represent an extensive source of information for further analysis, preparation of local landslide prediction models and a reliable early-warning system. It is essential to point out that during the monitoring period there were no extreme rainfall events. It should also be noted that a rainfall threshold value of 120 mm was considered as a reference value which was determined at the regional scale. To determine the real rainfall threshold values for the Urbas landslide, a correlation between the displacement rates and long-term rainy periods or snow-melt is required using real-time data from continuous monitoring.
The verified low-cost GNSS monitoring system, newly developed within the GIMS project, allows for a welcome upgrade of an already established geodetic, geotechnical, and hydrogeological observation system on the deep-seated Urbas landslide. It provides accurate and real-time data on landslide surface movements, which are of great importance for the interpretation of landslide kinematics. The installation of the equipment in the field is relatively simple and fast, even in mountainous areas which are difficult to access. The recent development of GNSS, power supply and data transmission technologies has brought about increased usability of such systems and significant improvements compared to similar earlier systems (e.g., I2GPS [
37]). However, the tested monitoring technique is only capable of providing information on surface movements. For a full description of deep-seated landslide dynamics, it is necessary to integrate the surface analysis with subsoil investigation.
Reliable temporal prediction of landslide kinematics remains a challenge. In the future, research will be focused on the correlation of displacements and landslide triggering mechanisms using processed data from existing engineering geological (EG units; landslide features; results from core-logging), geotechnical (magnitude, depth, the direction of ground movement) and hydro-meteorological data (pore water pressure, groundwater level, precipitation).
