A Novel Method for River Bank Detection from Landsat Satellite Data: A Case Study in the Vietnamese Mekong Delta

 ,
, 
 ,
, 
 , ,
, , 
Abstract
1. Introduction
2. Study Areas and Data Preparation
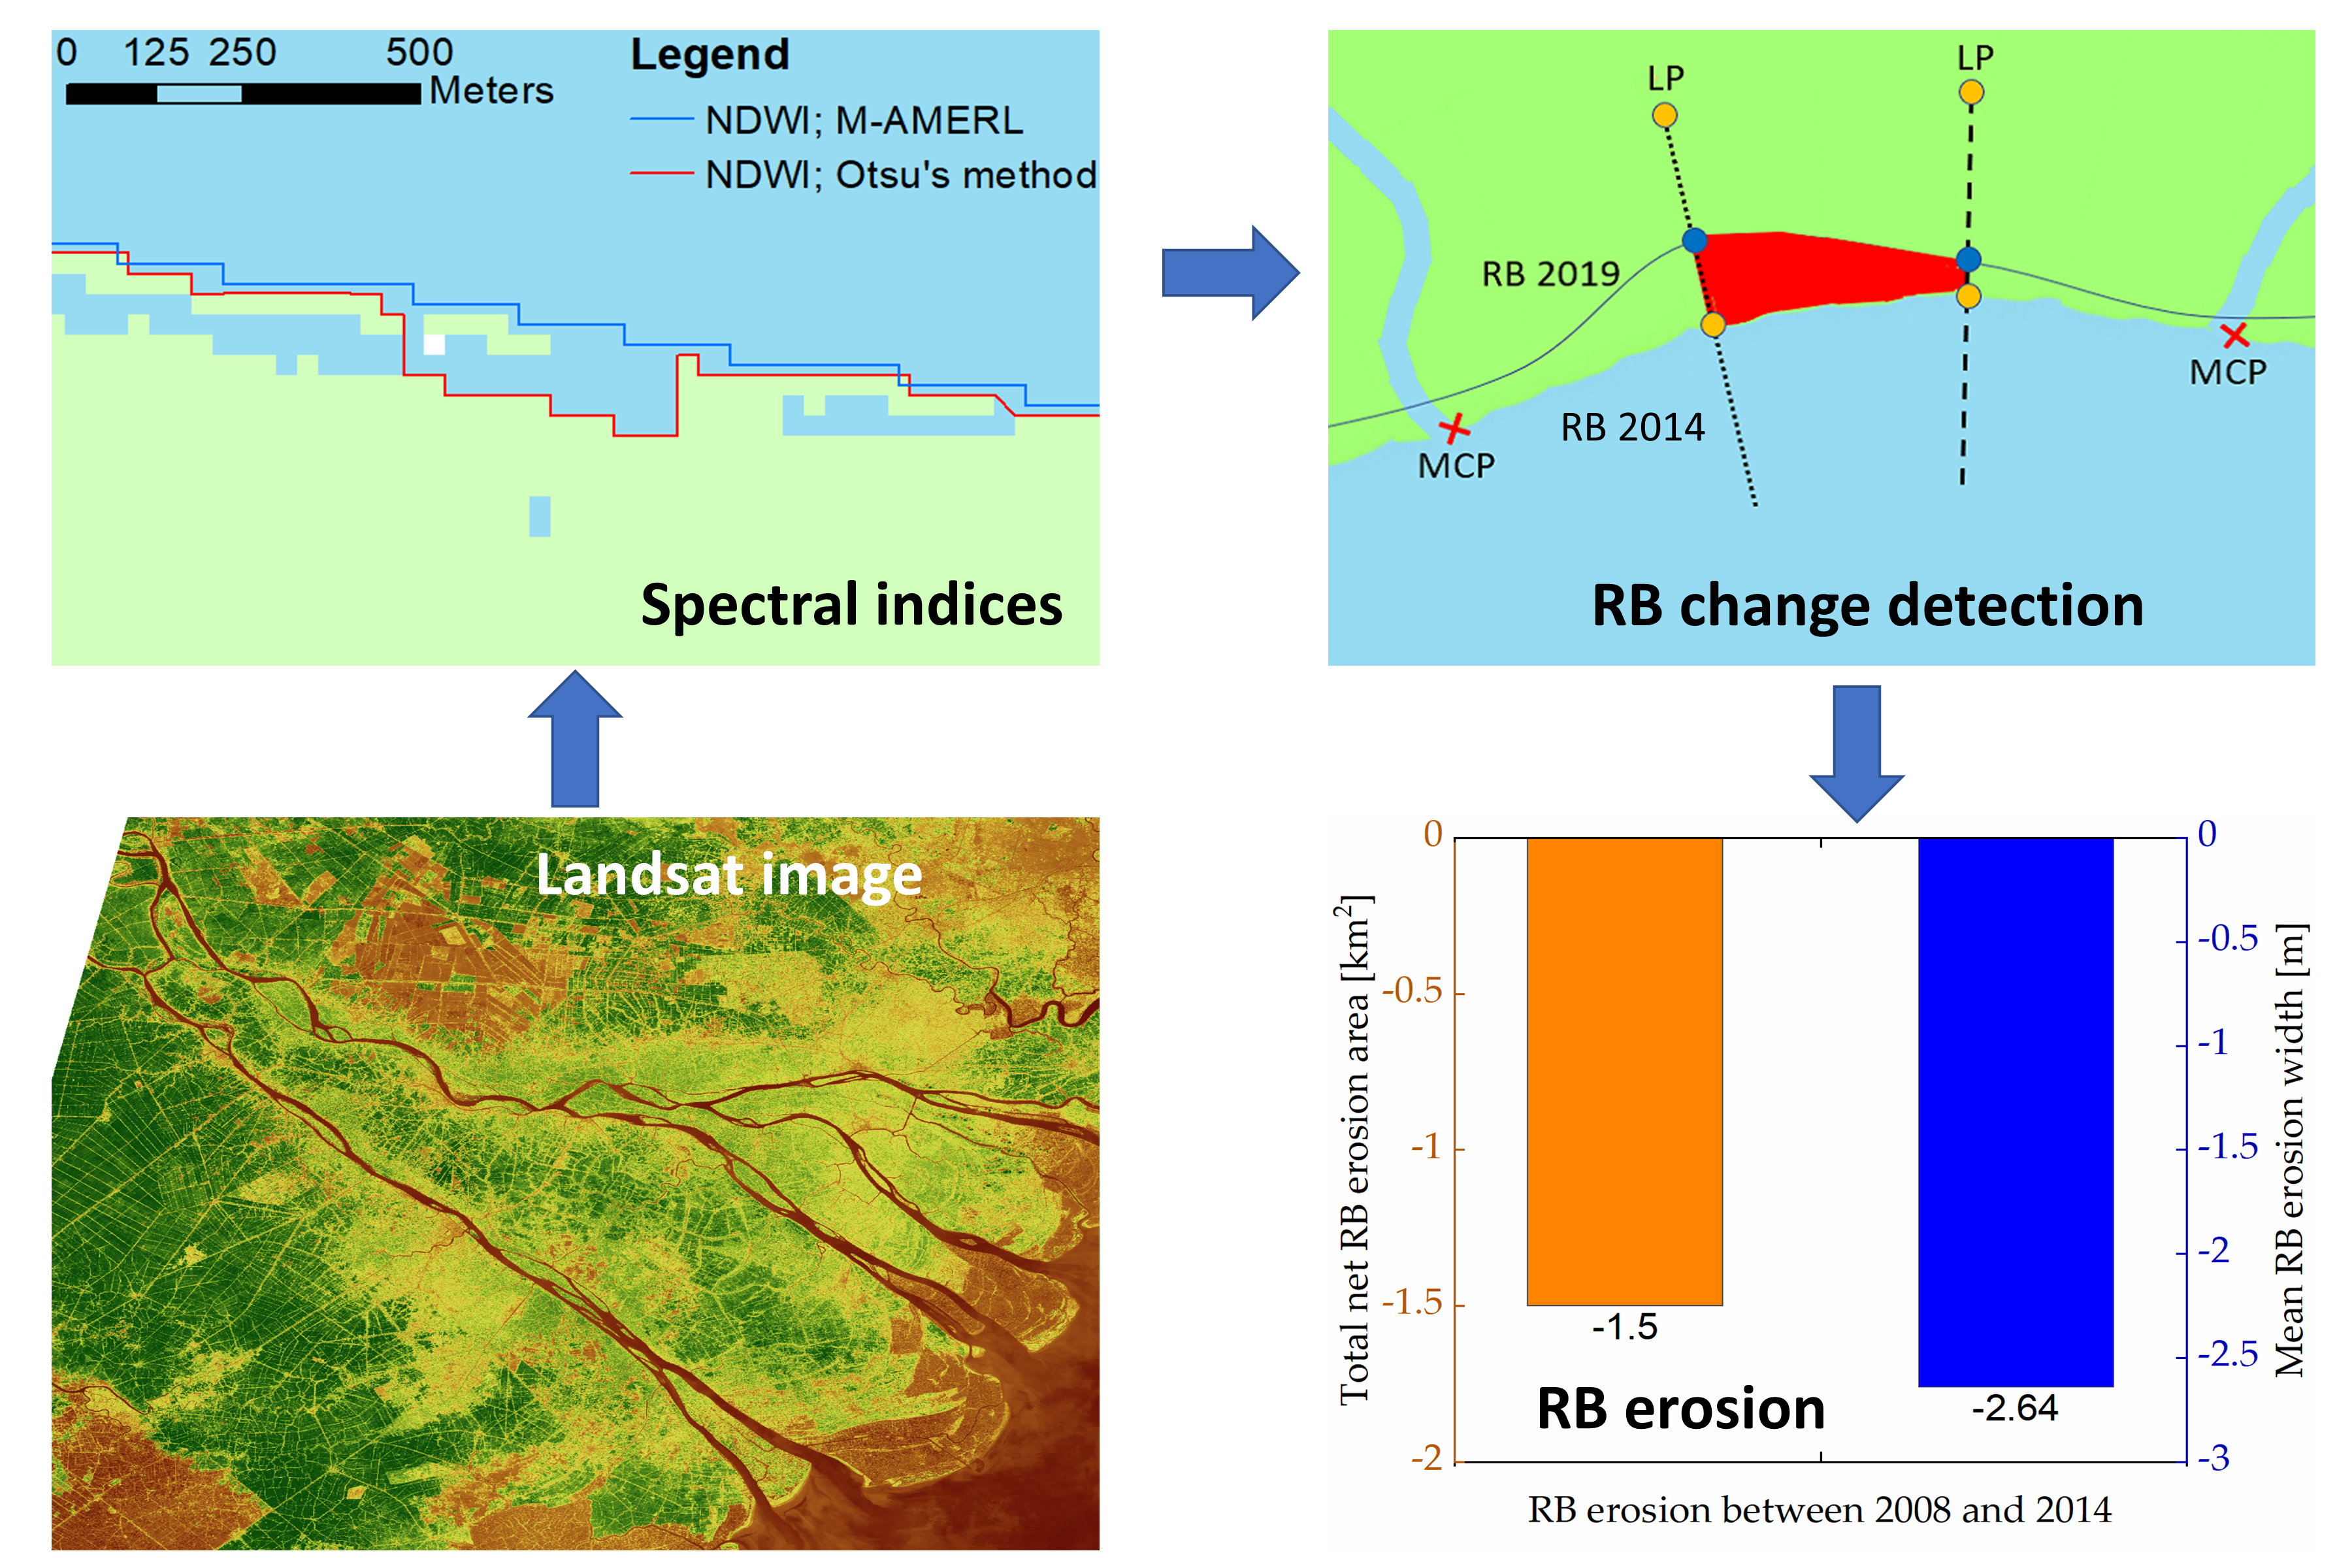
2.1. Study Area
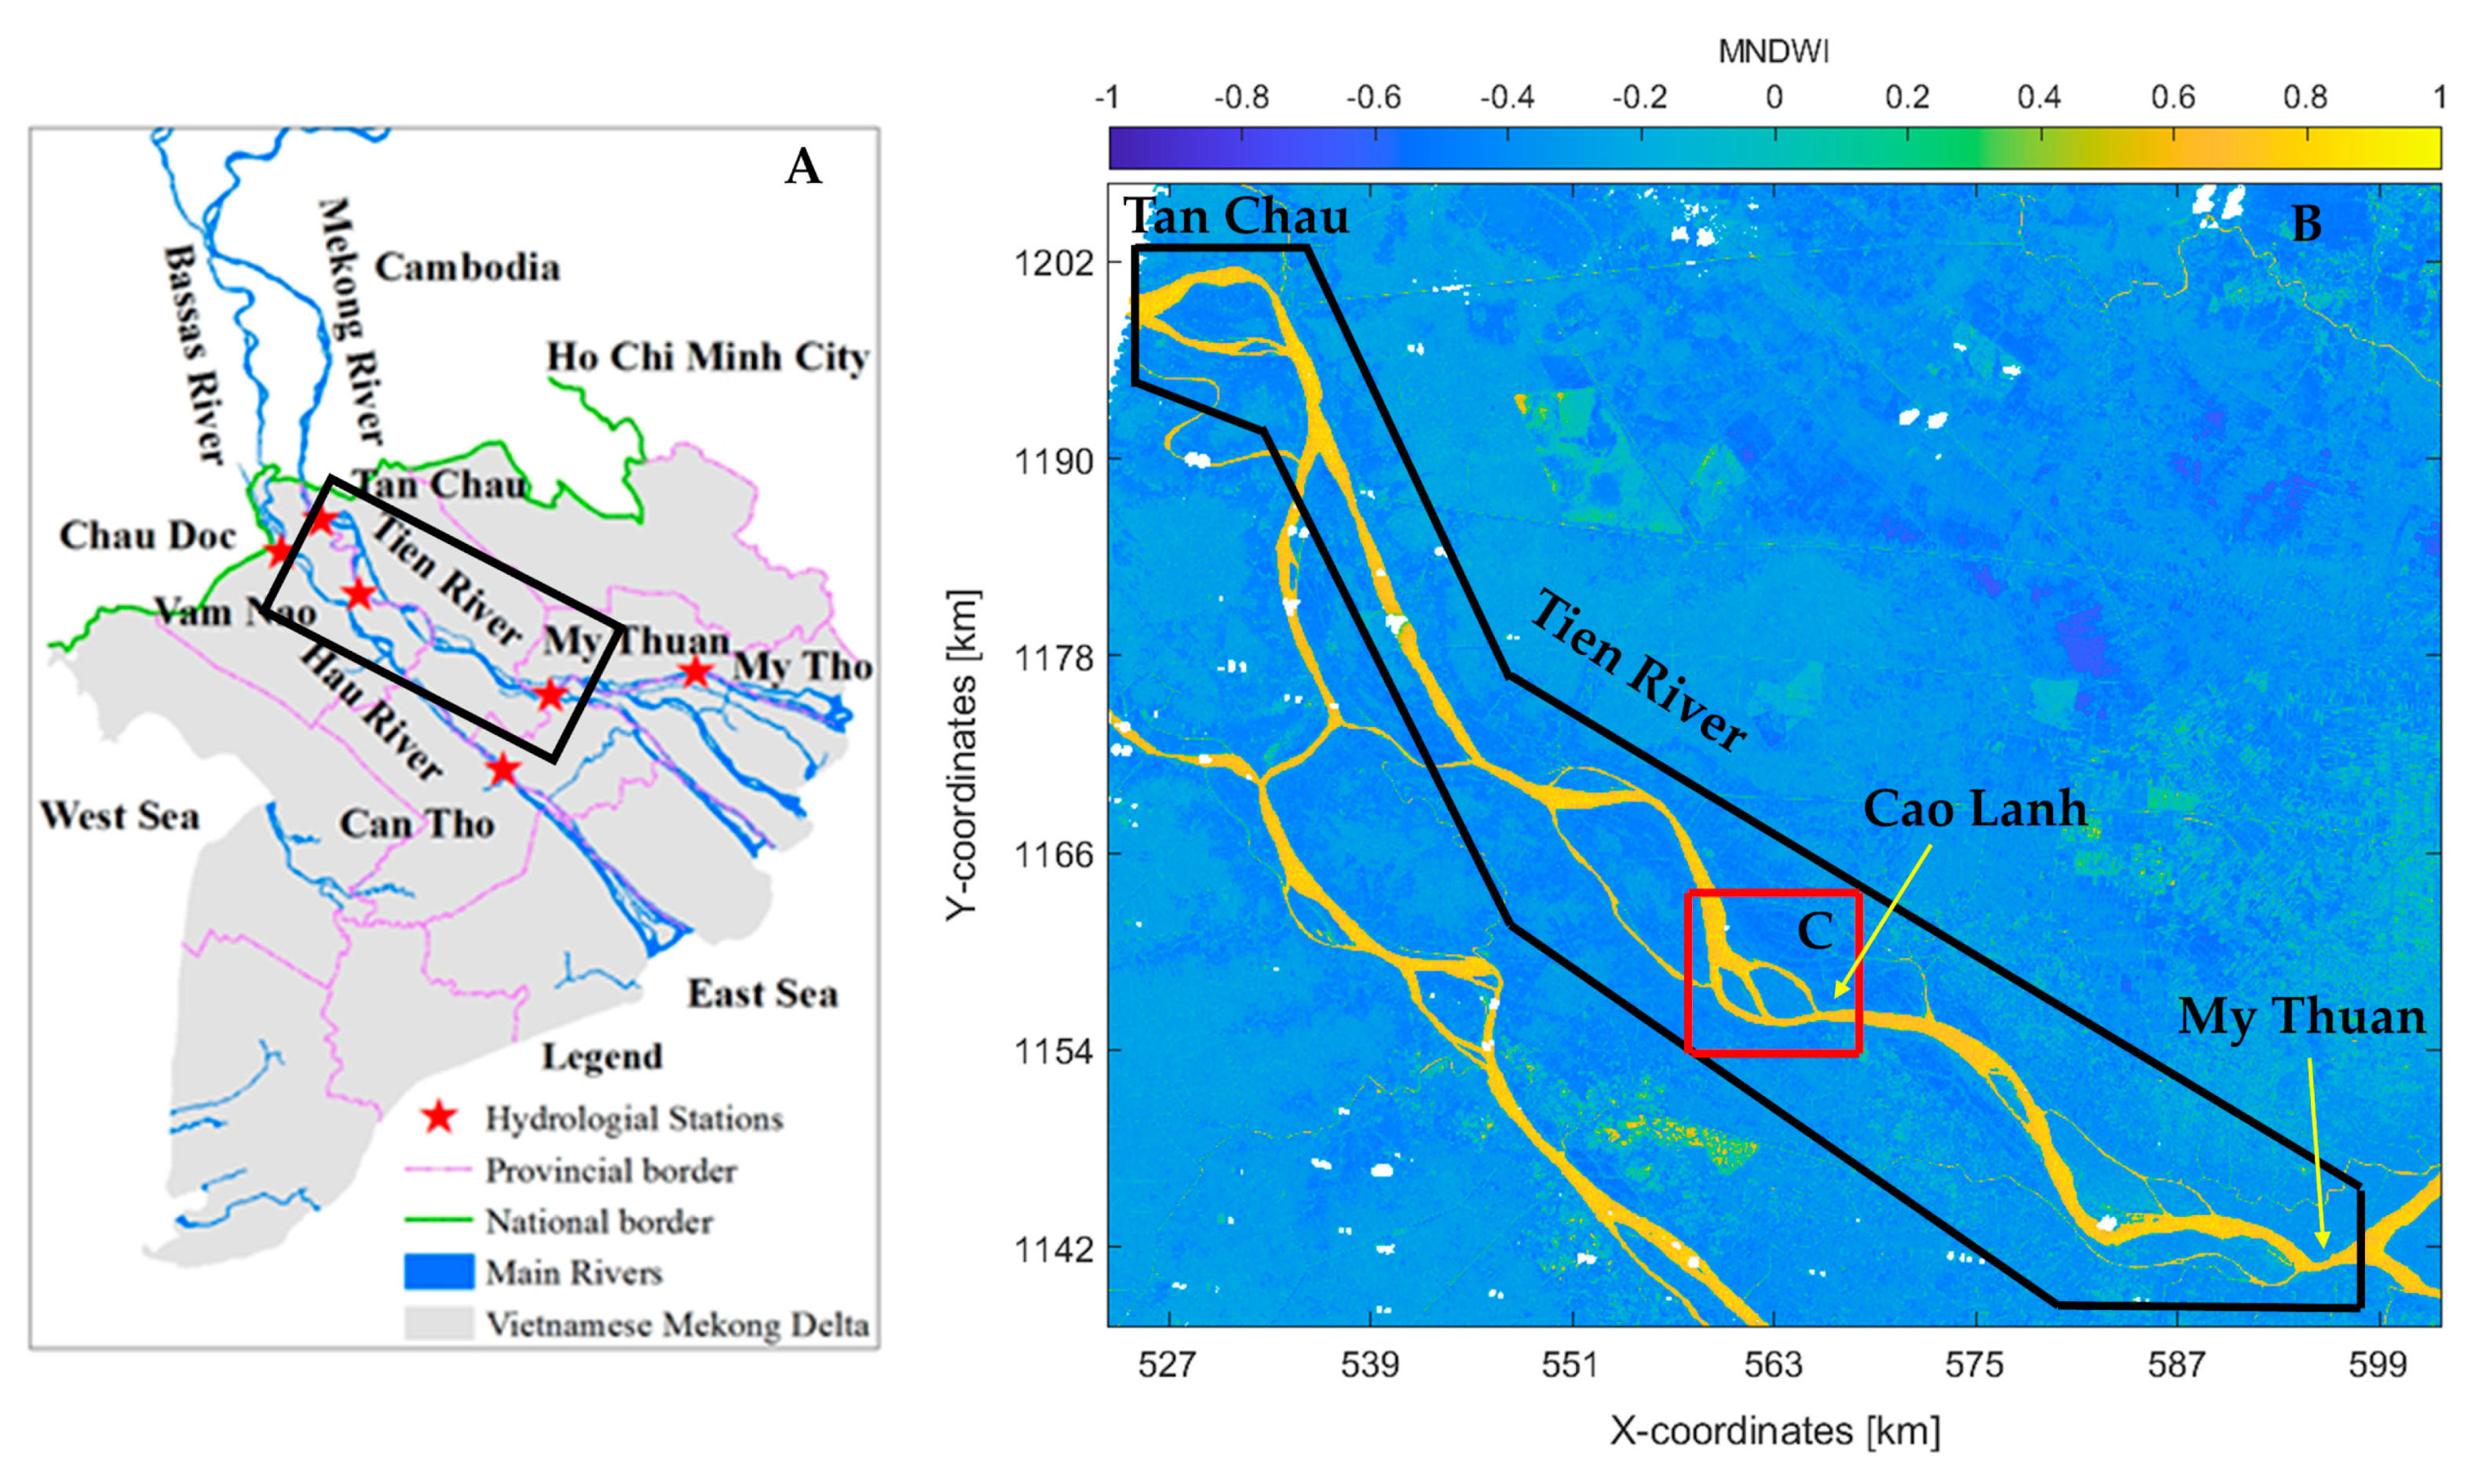
2.2. Data
2.2.1. Landsat
2.2.2. Reference Dataset
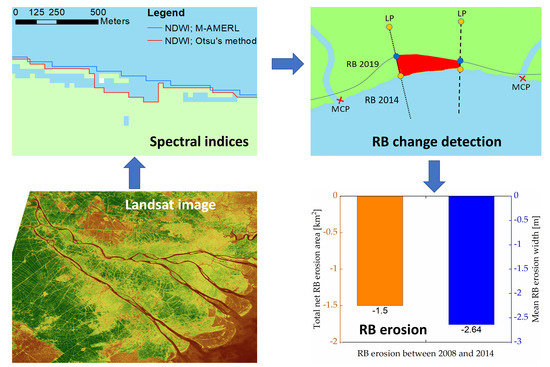
3. Methodology
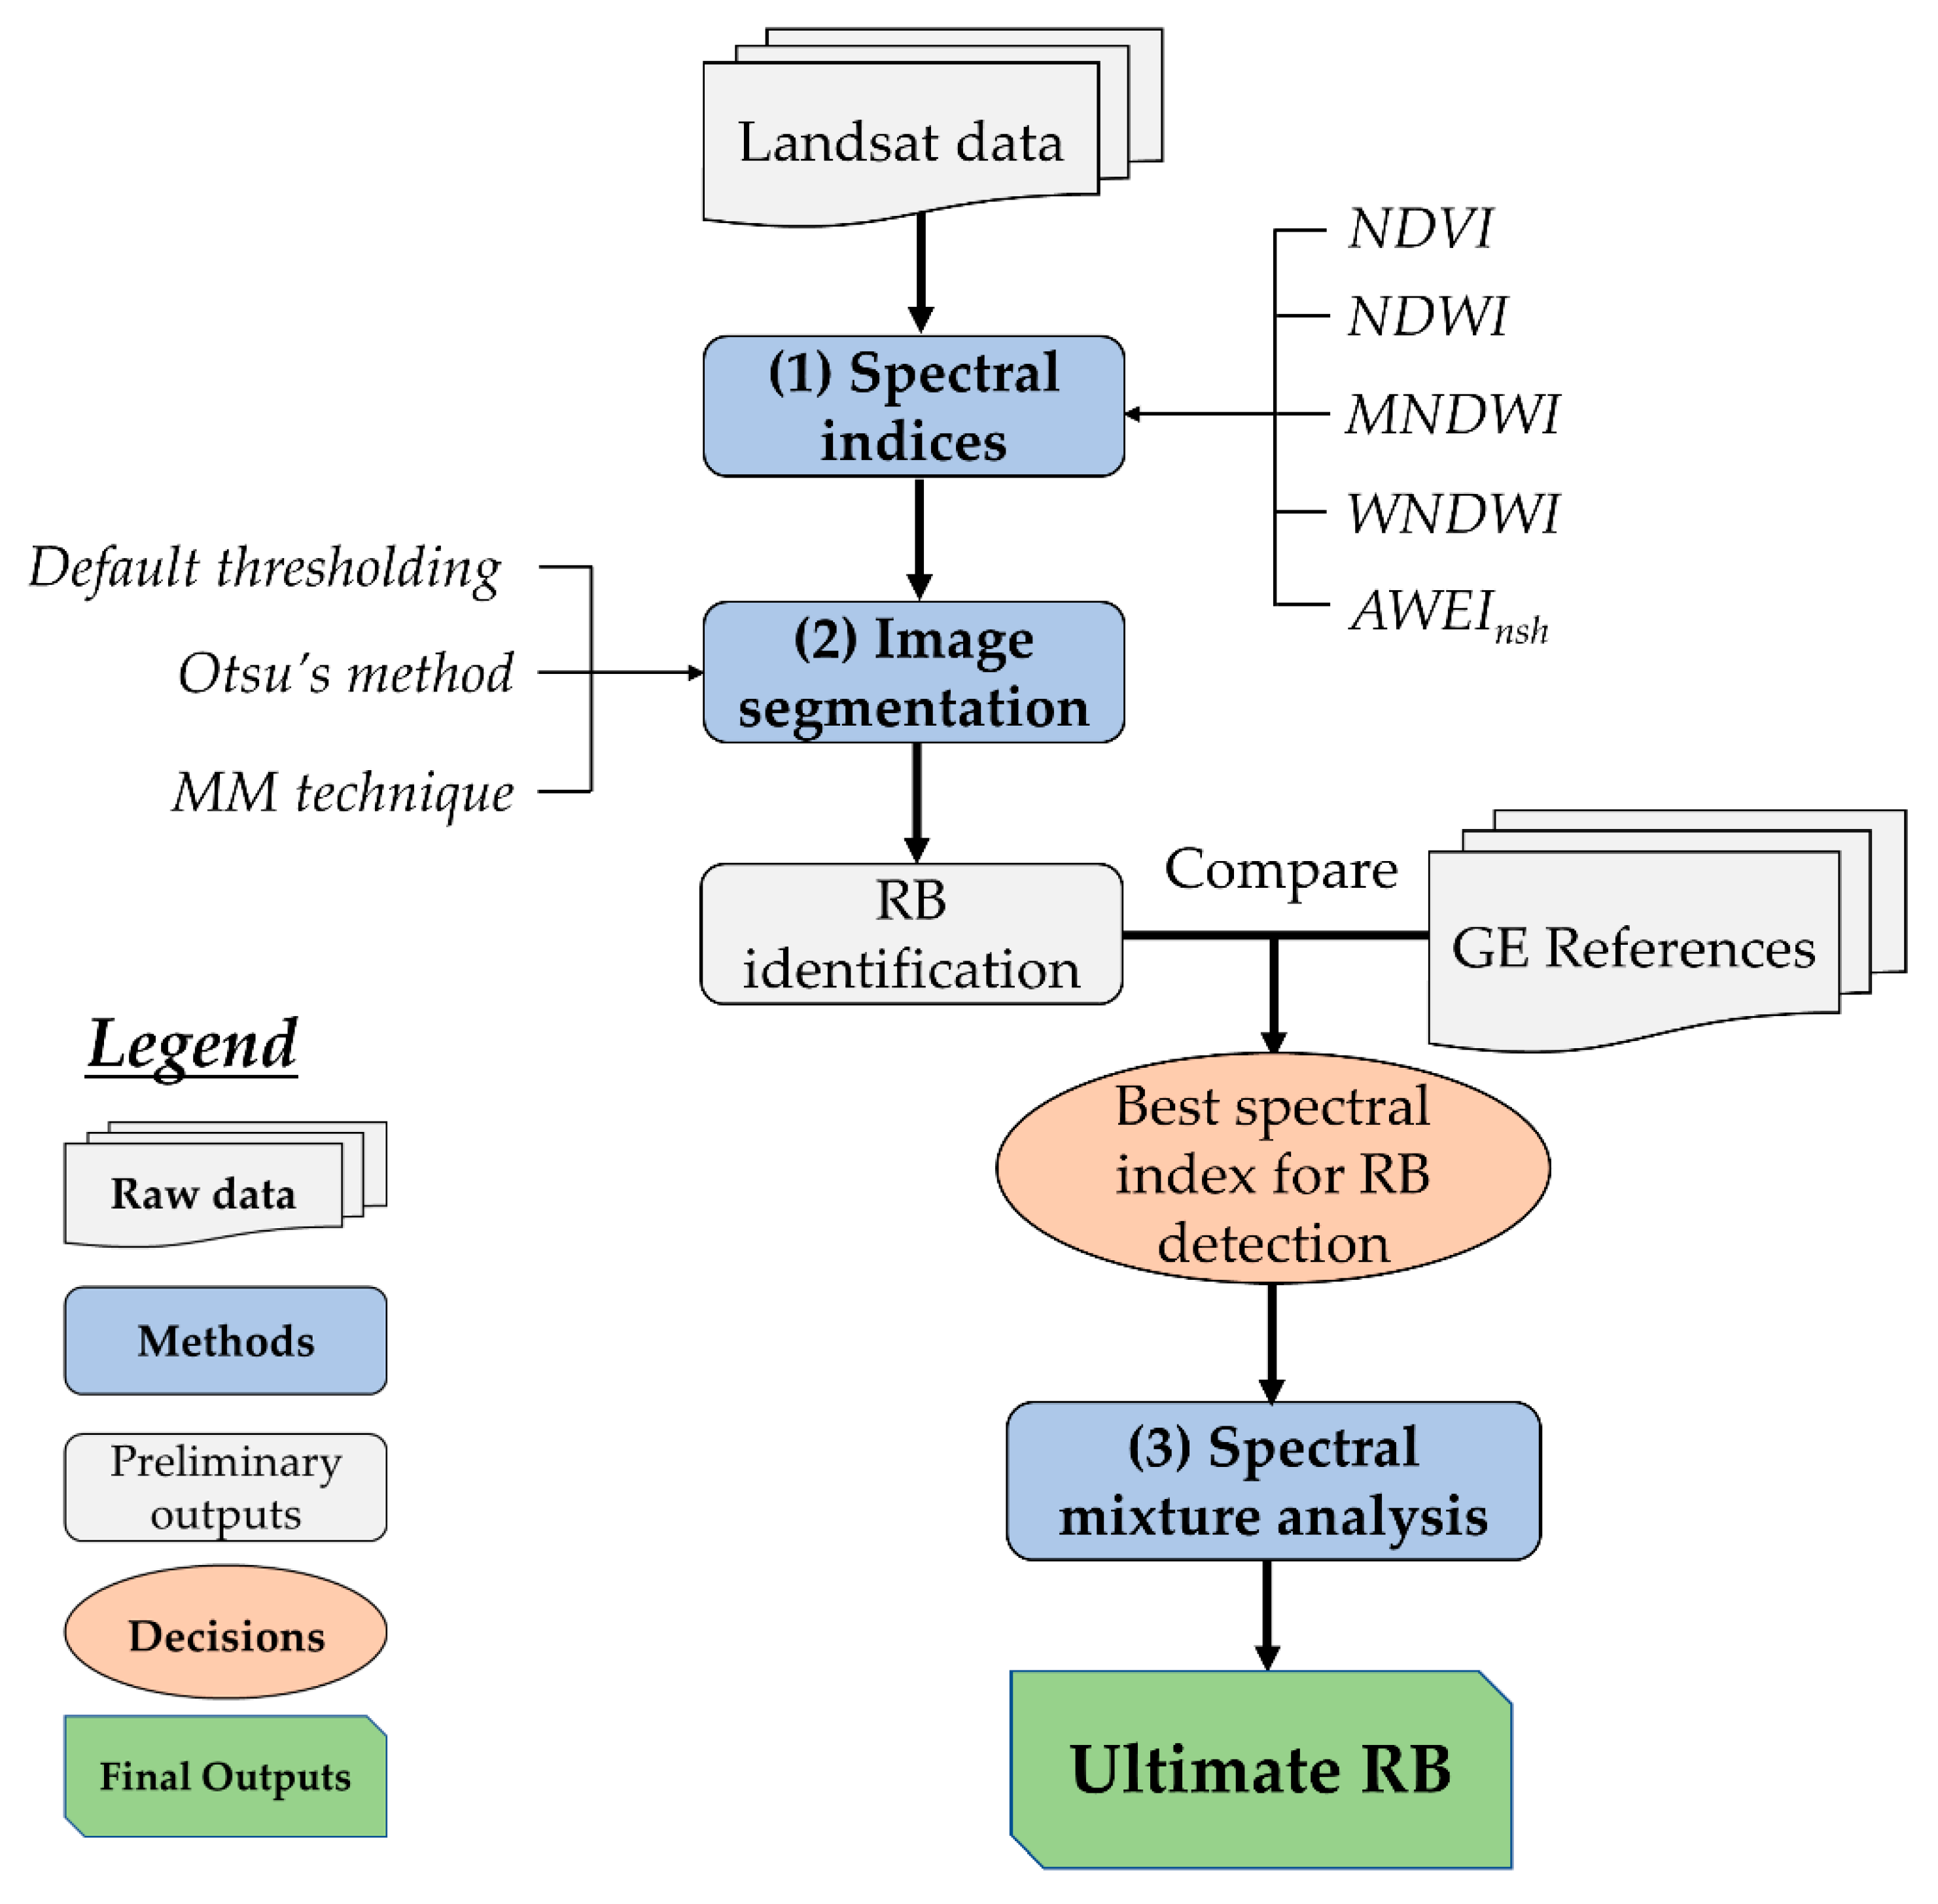
3.1. RB Extraction
3.1.1. Spectral Indices
3.1.2. Segmentation Methods
3.1.3. SMA Algorithm
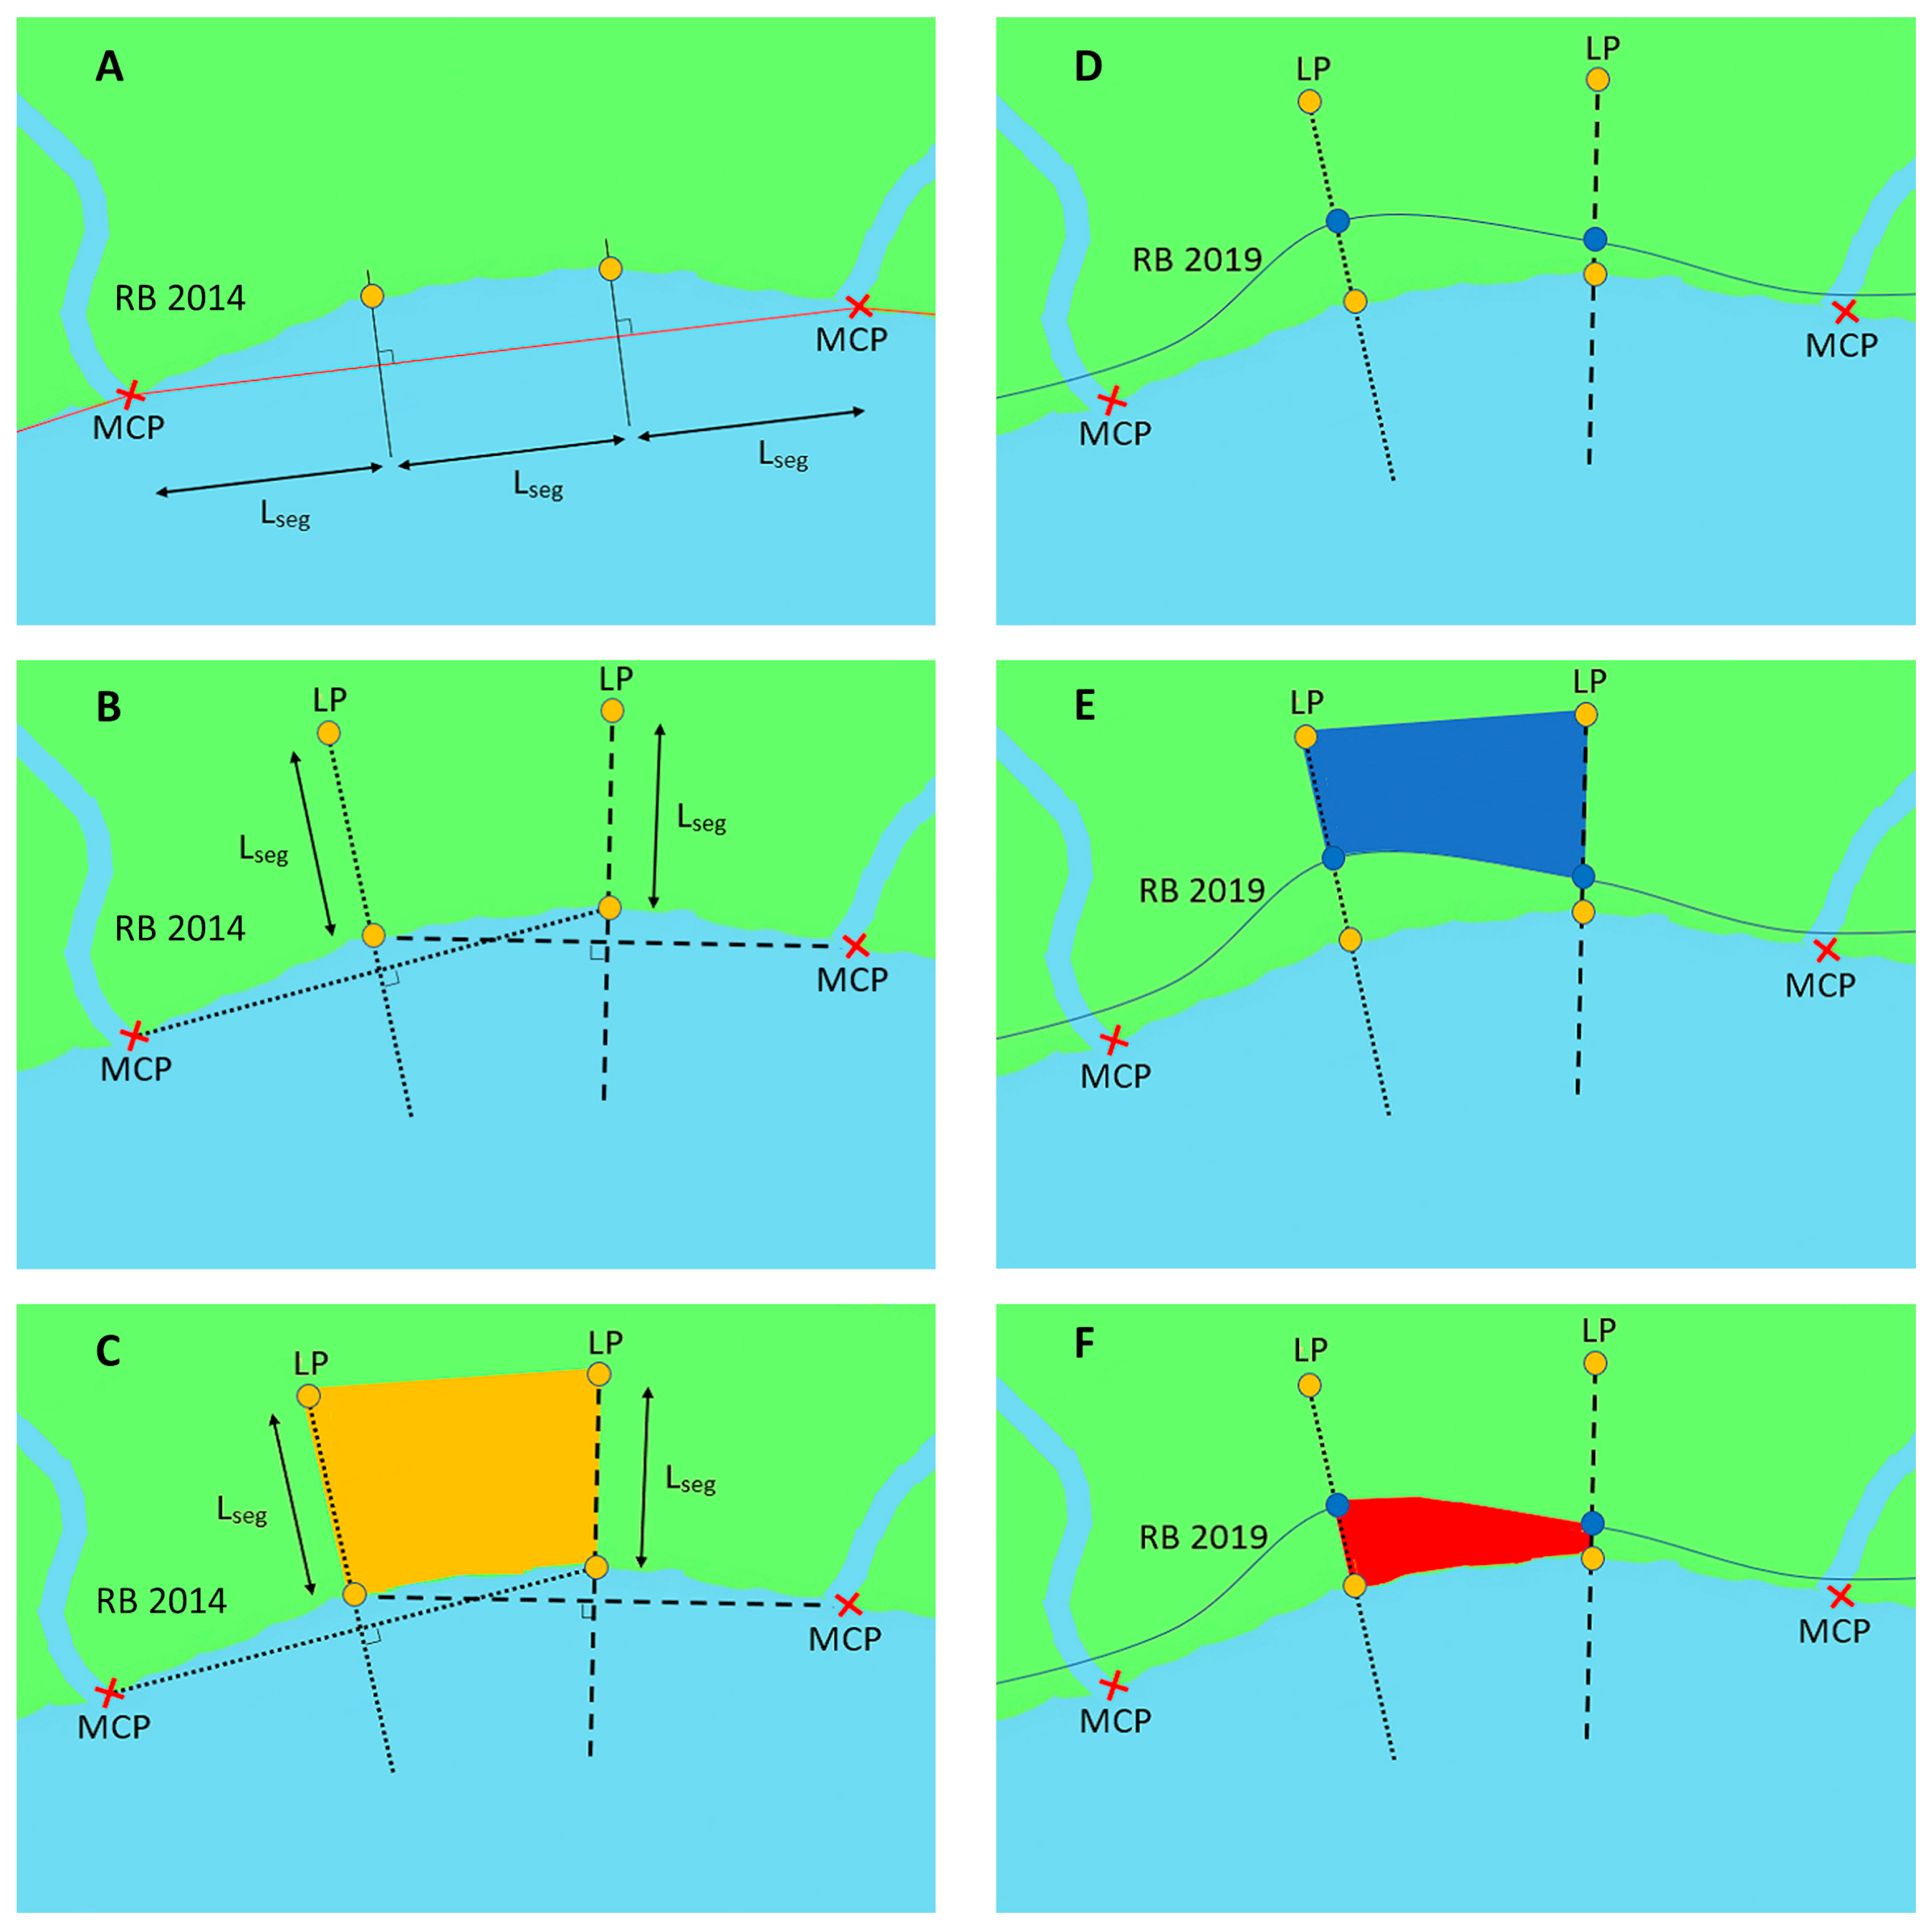
3.2. RB Change Detection Algorithm
4. Results
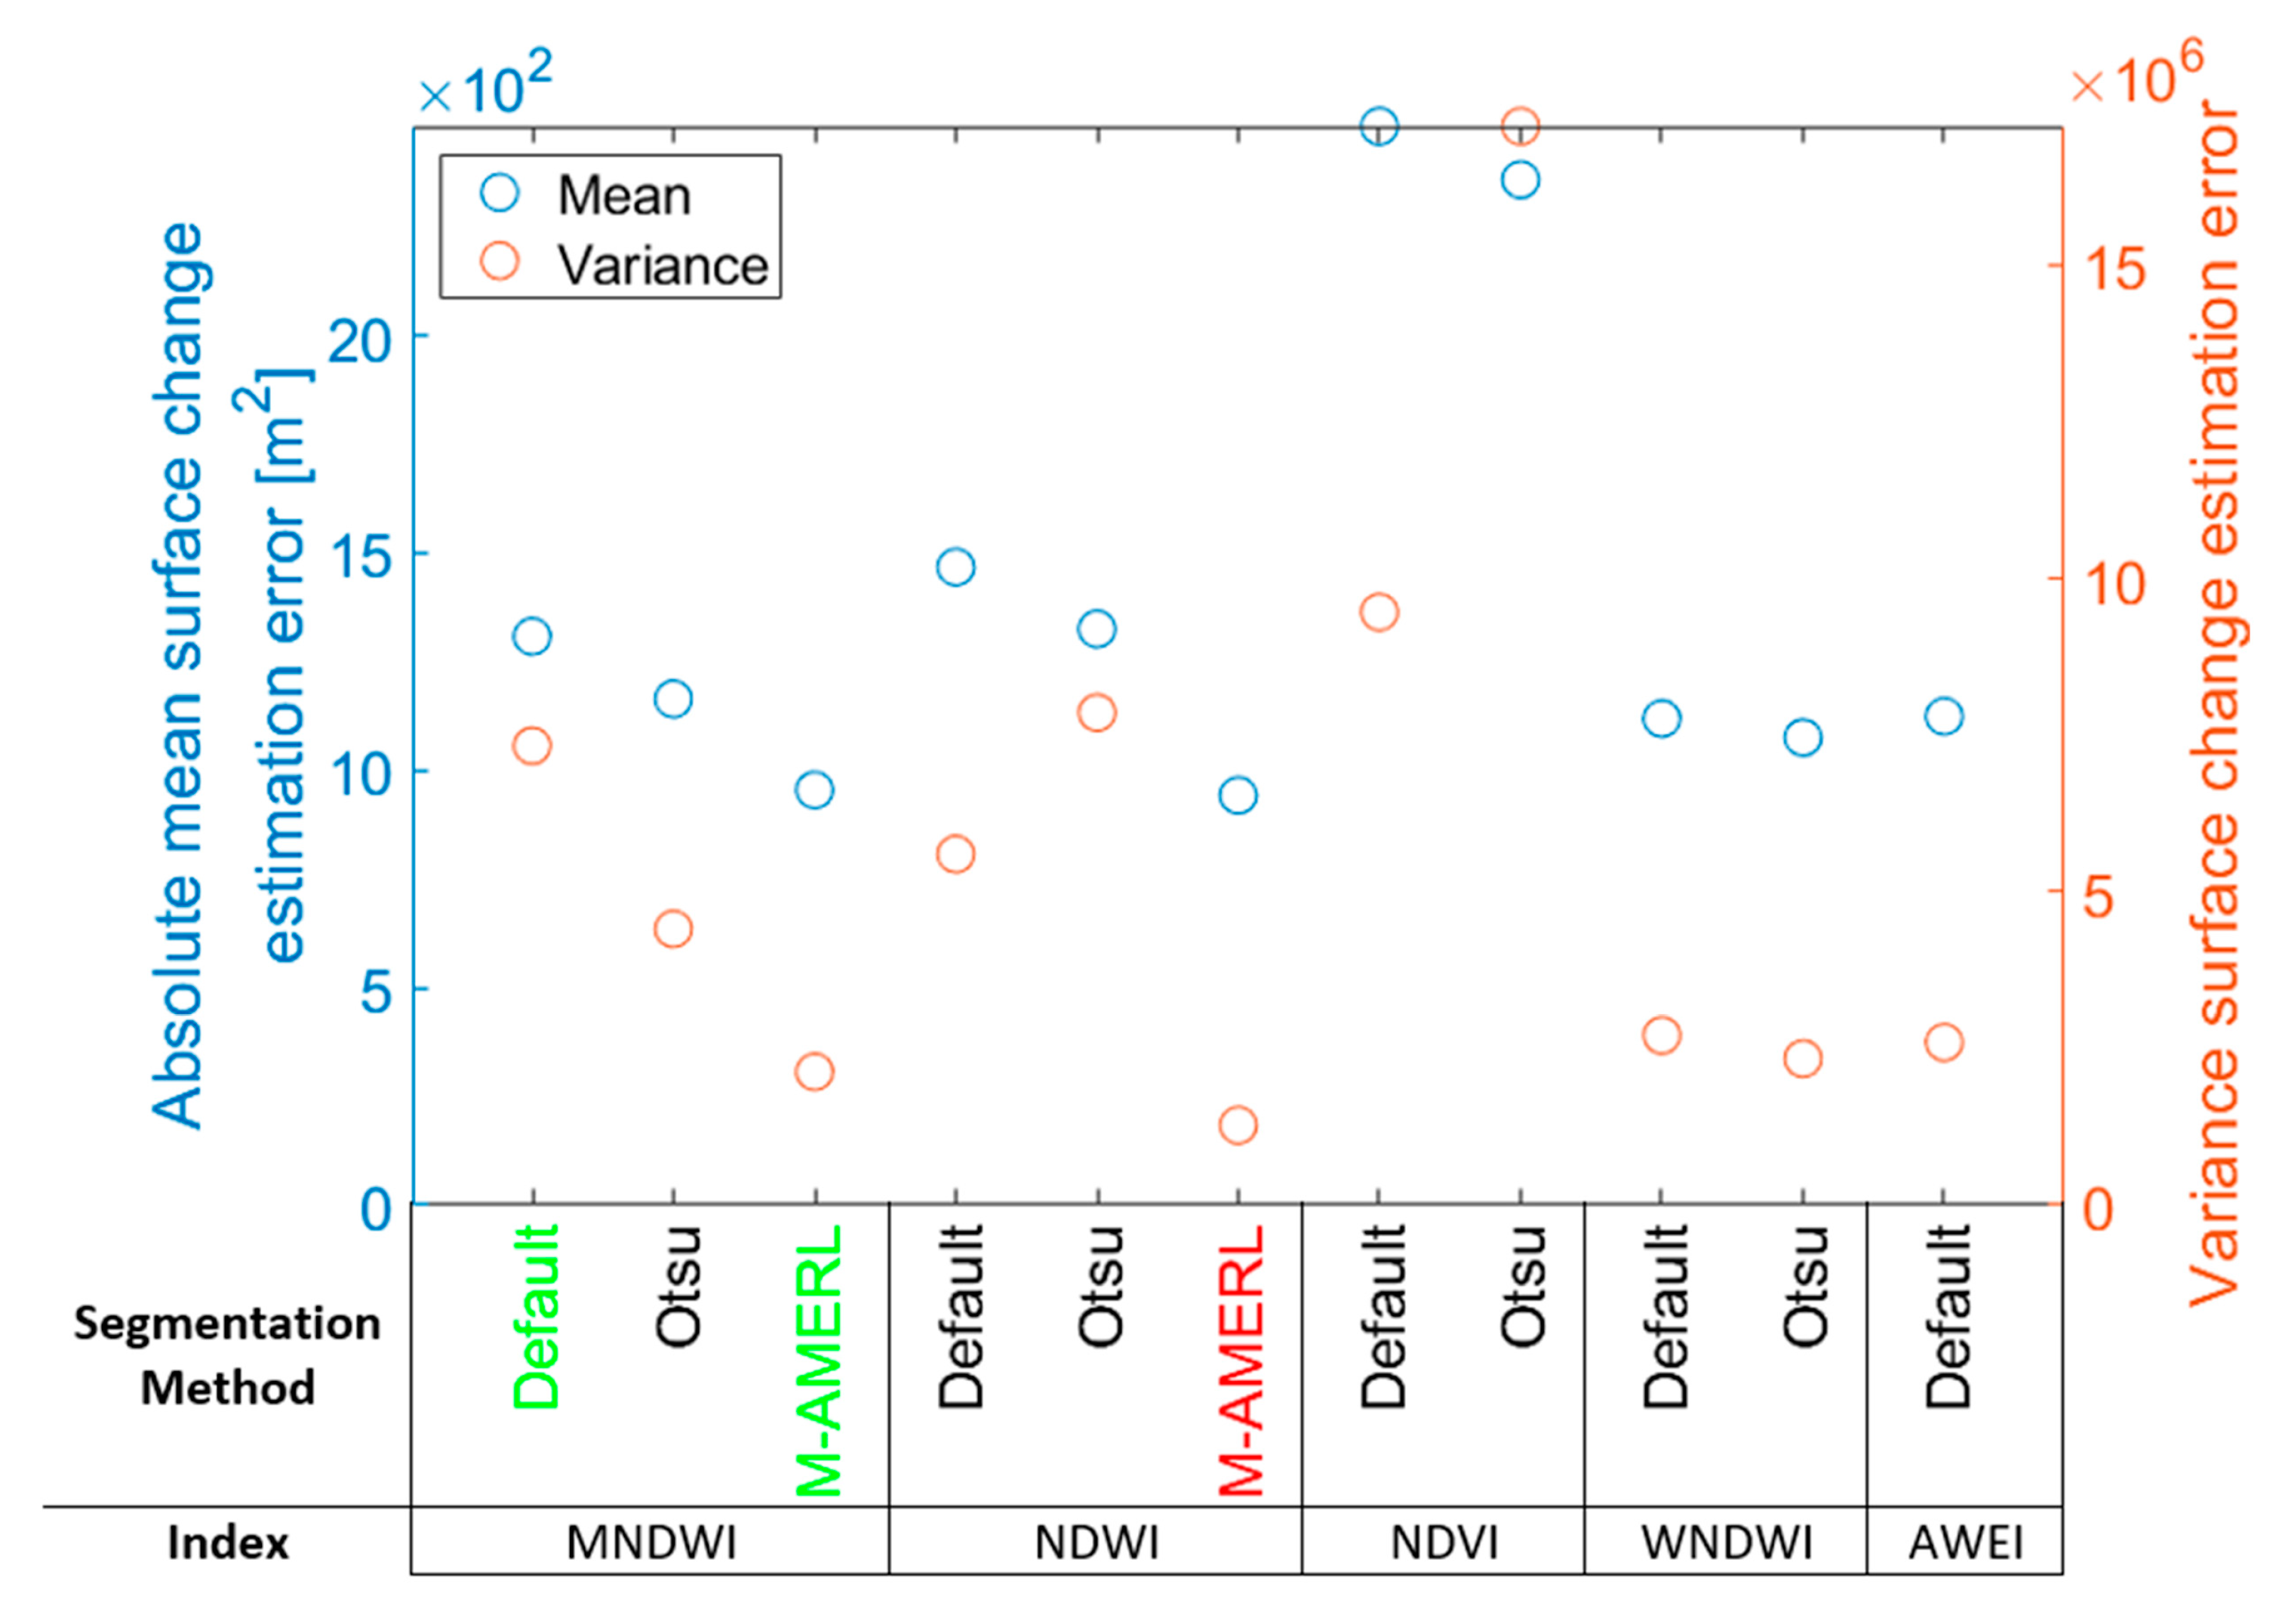
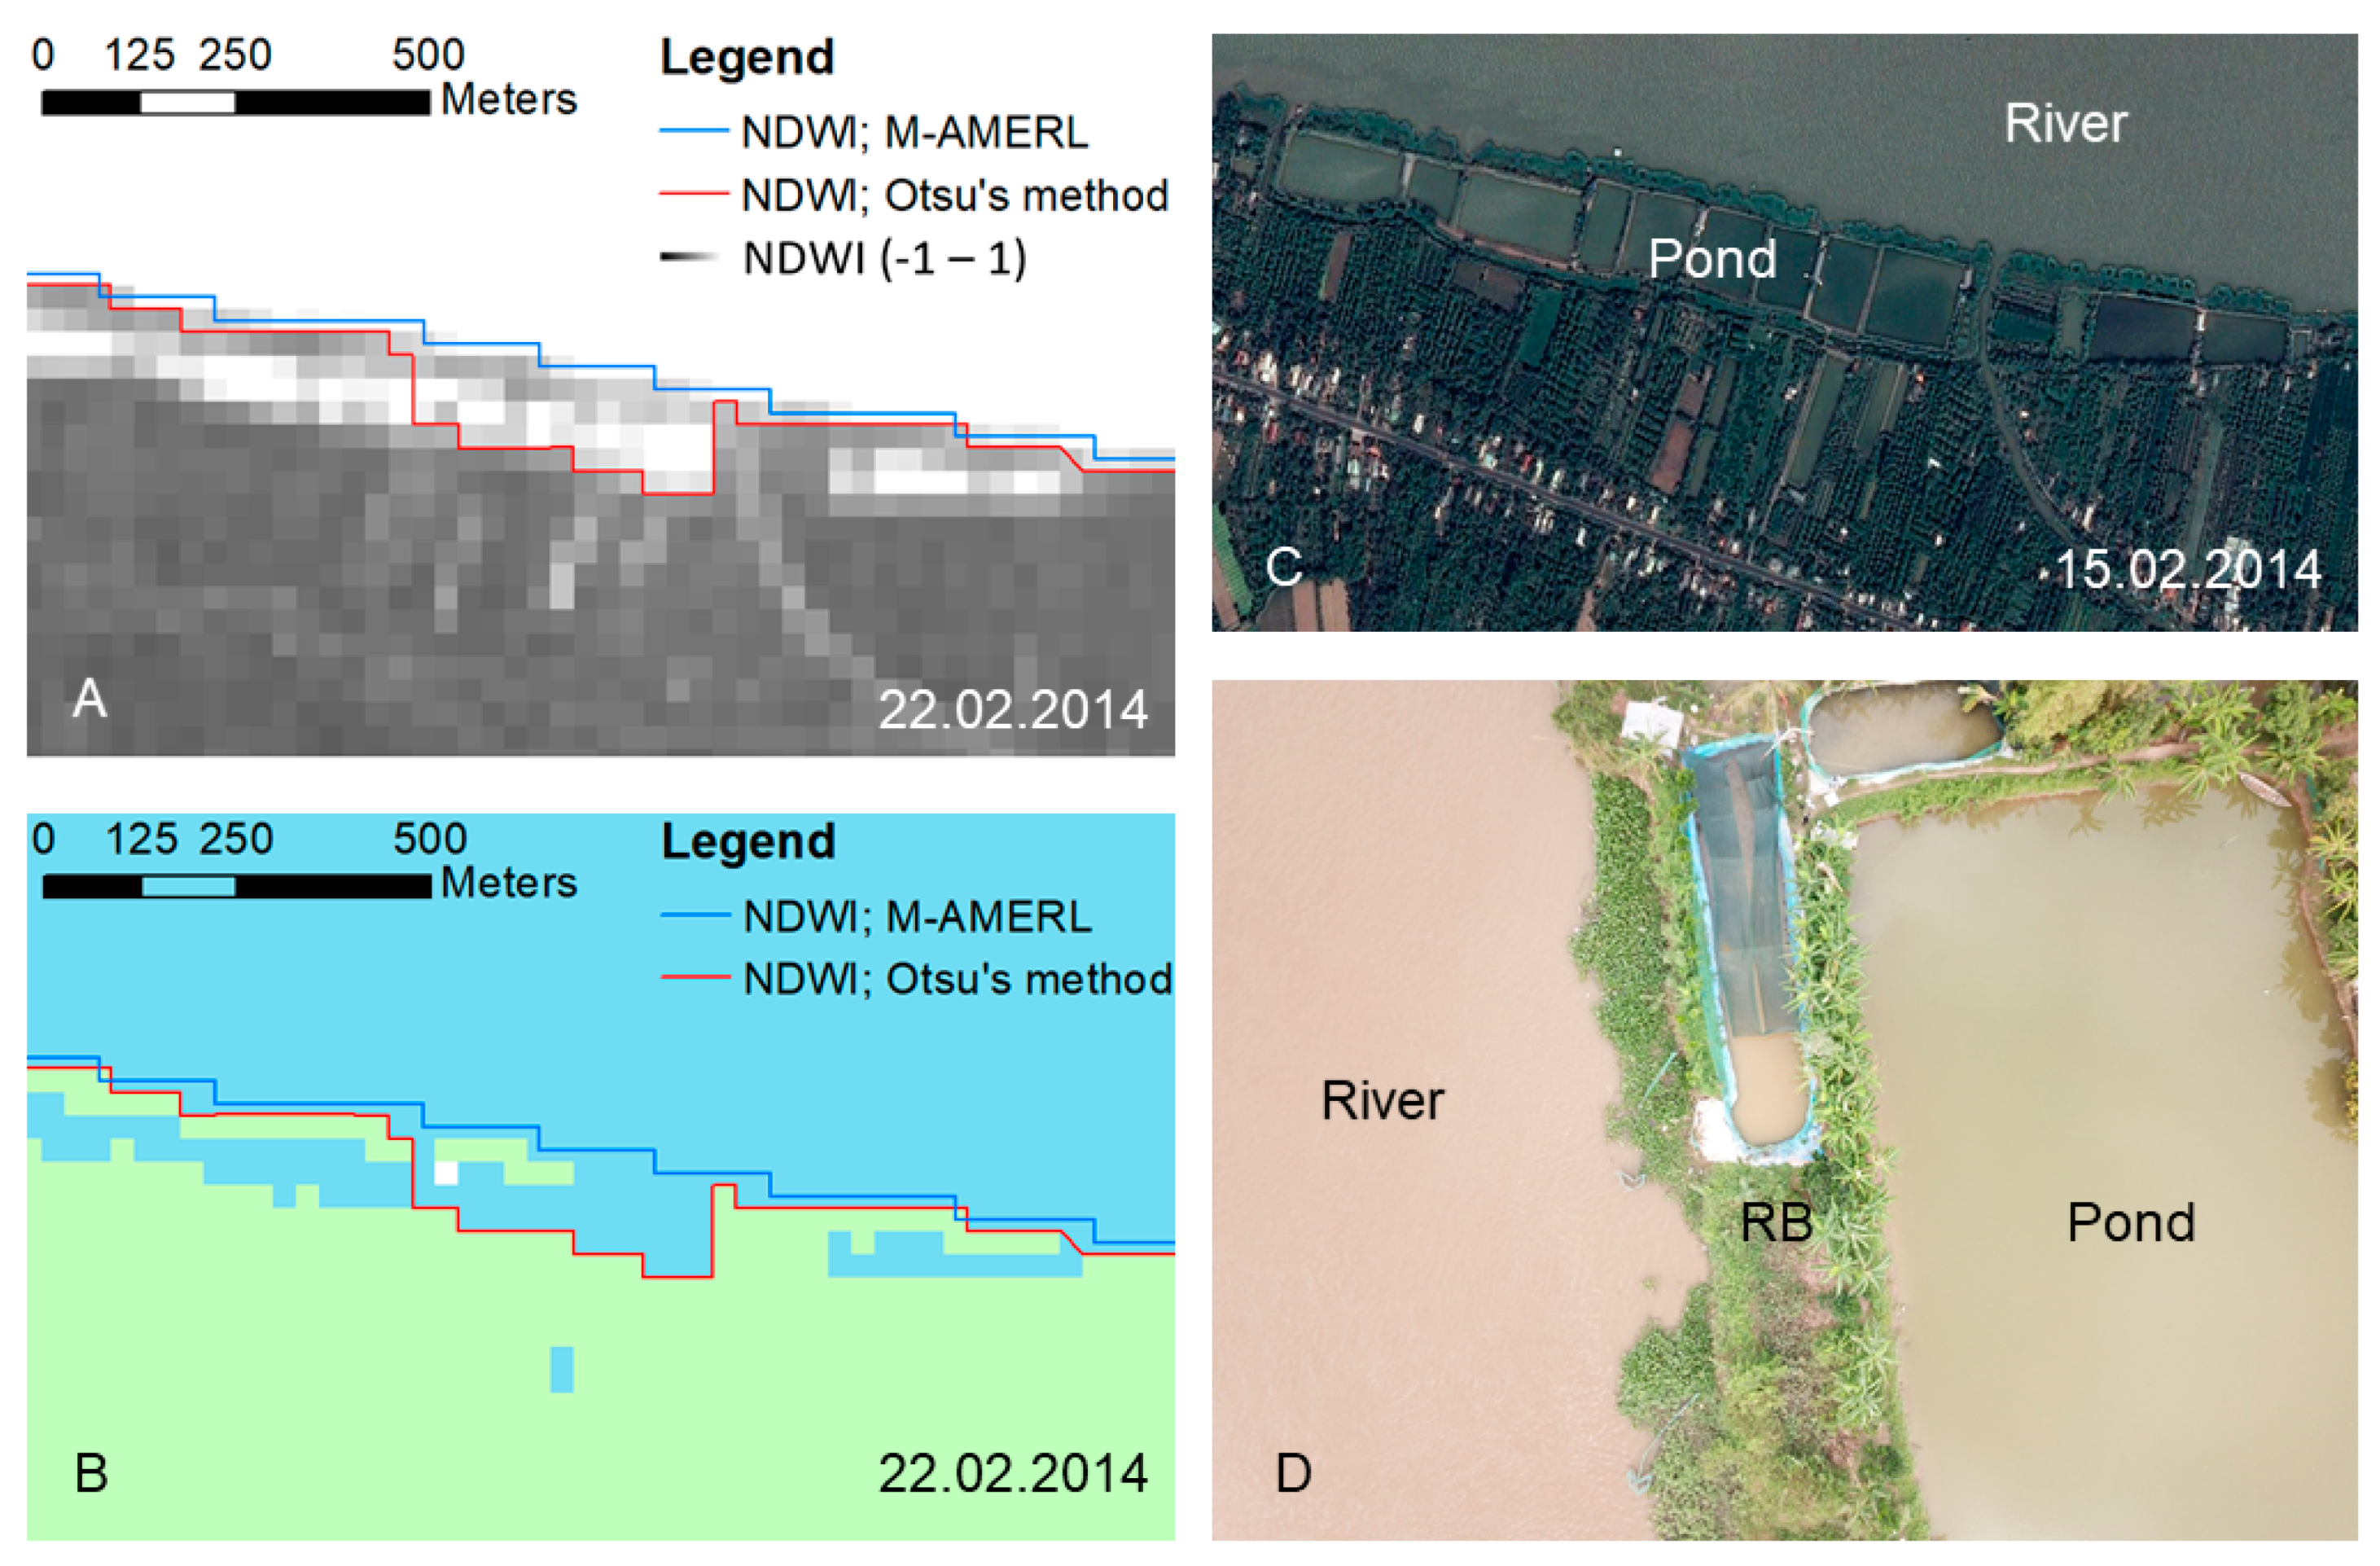
4.1. Performance of the Developed M-AMERL Method in RB Extraction
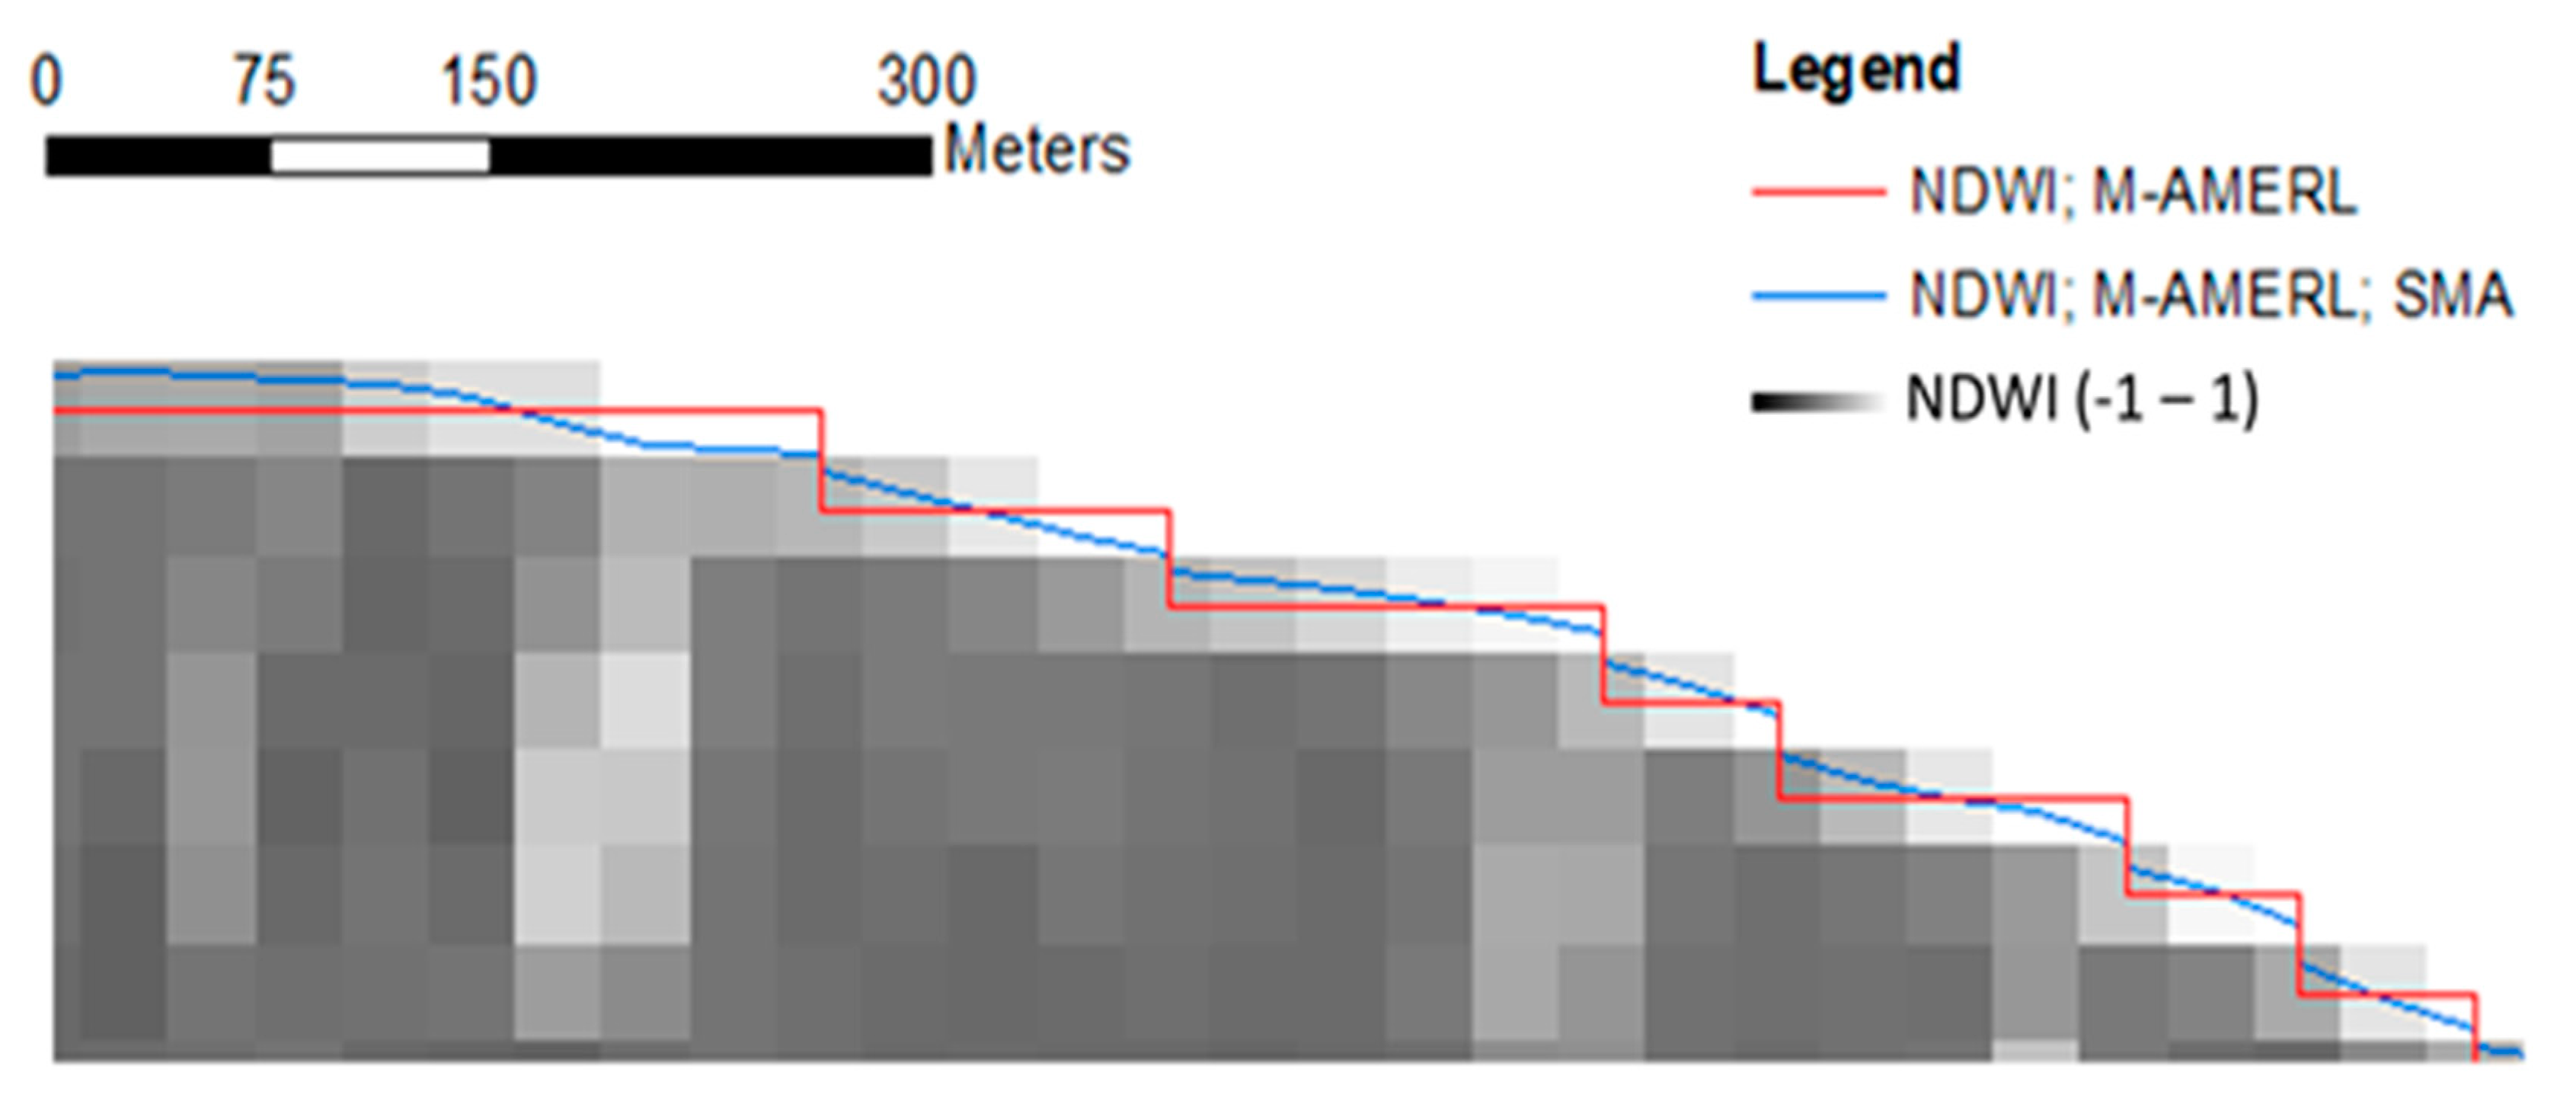
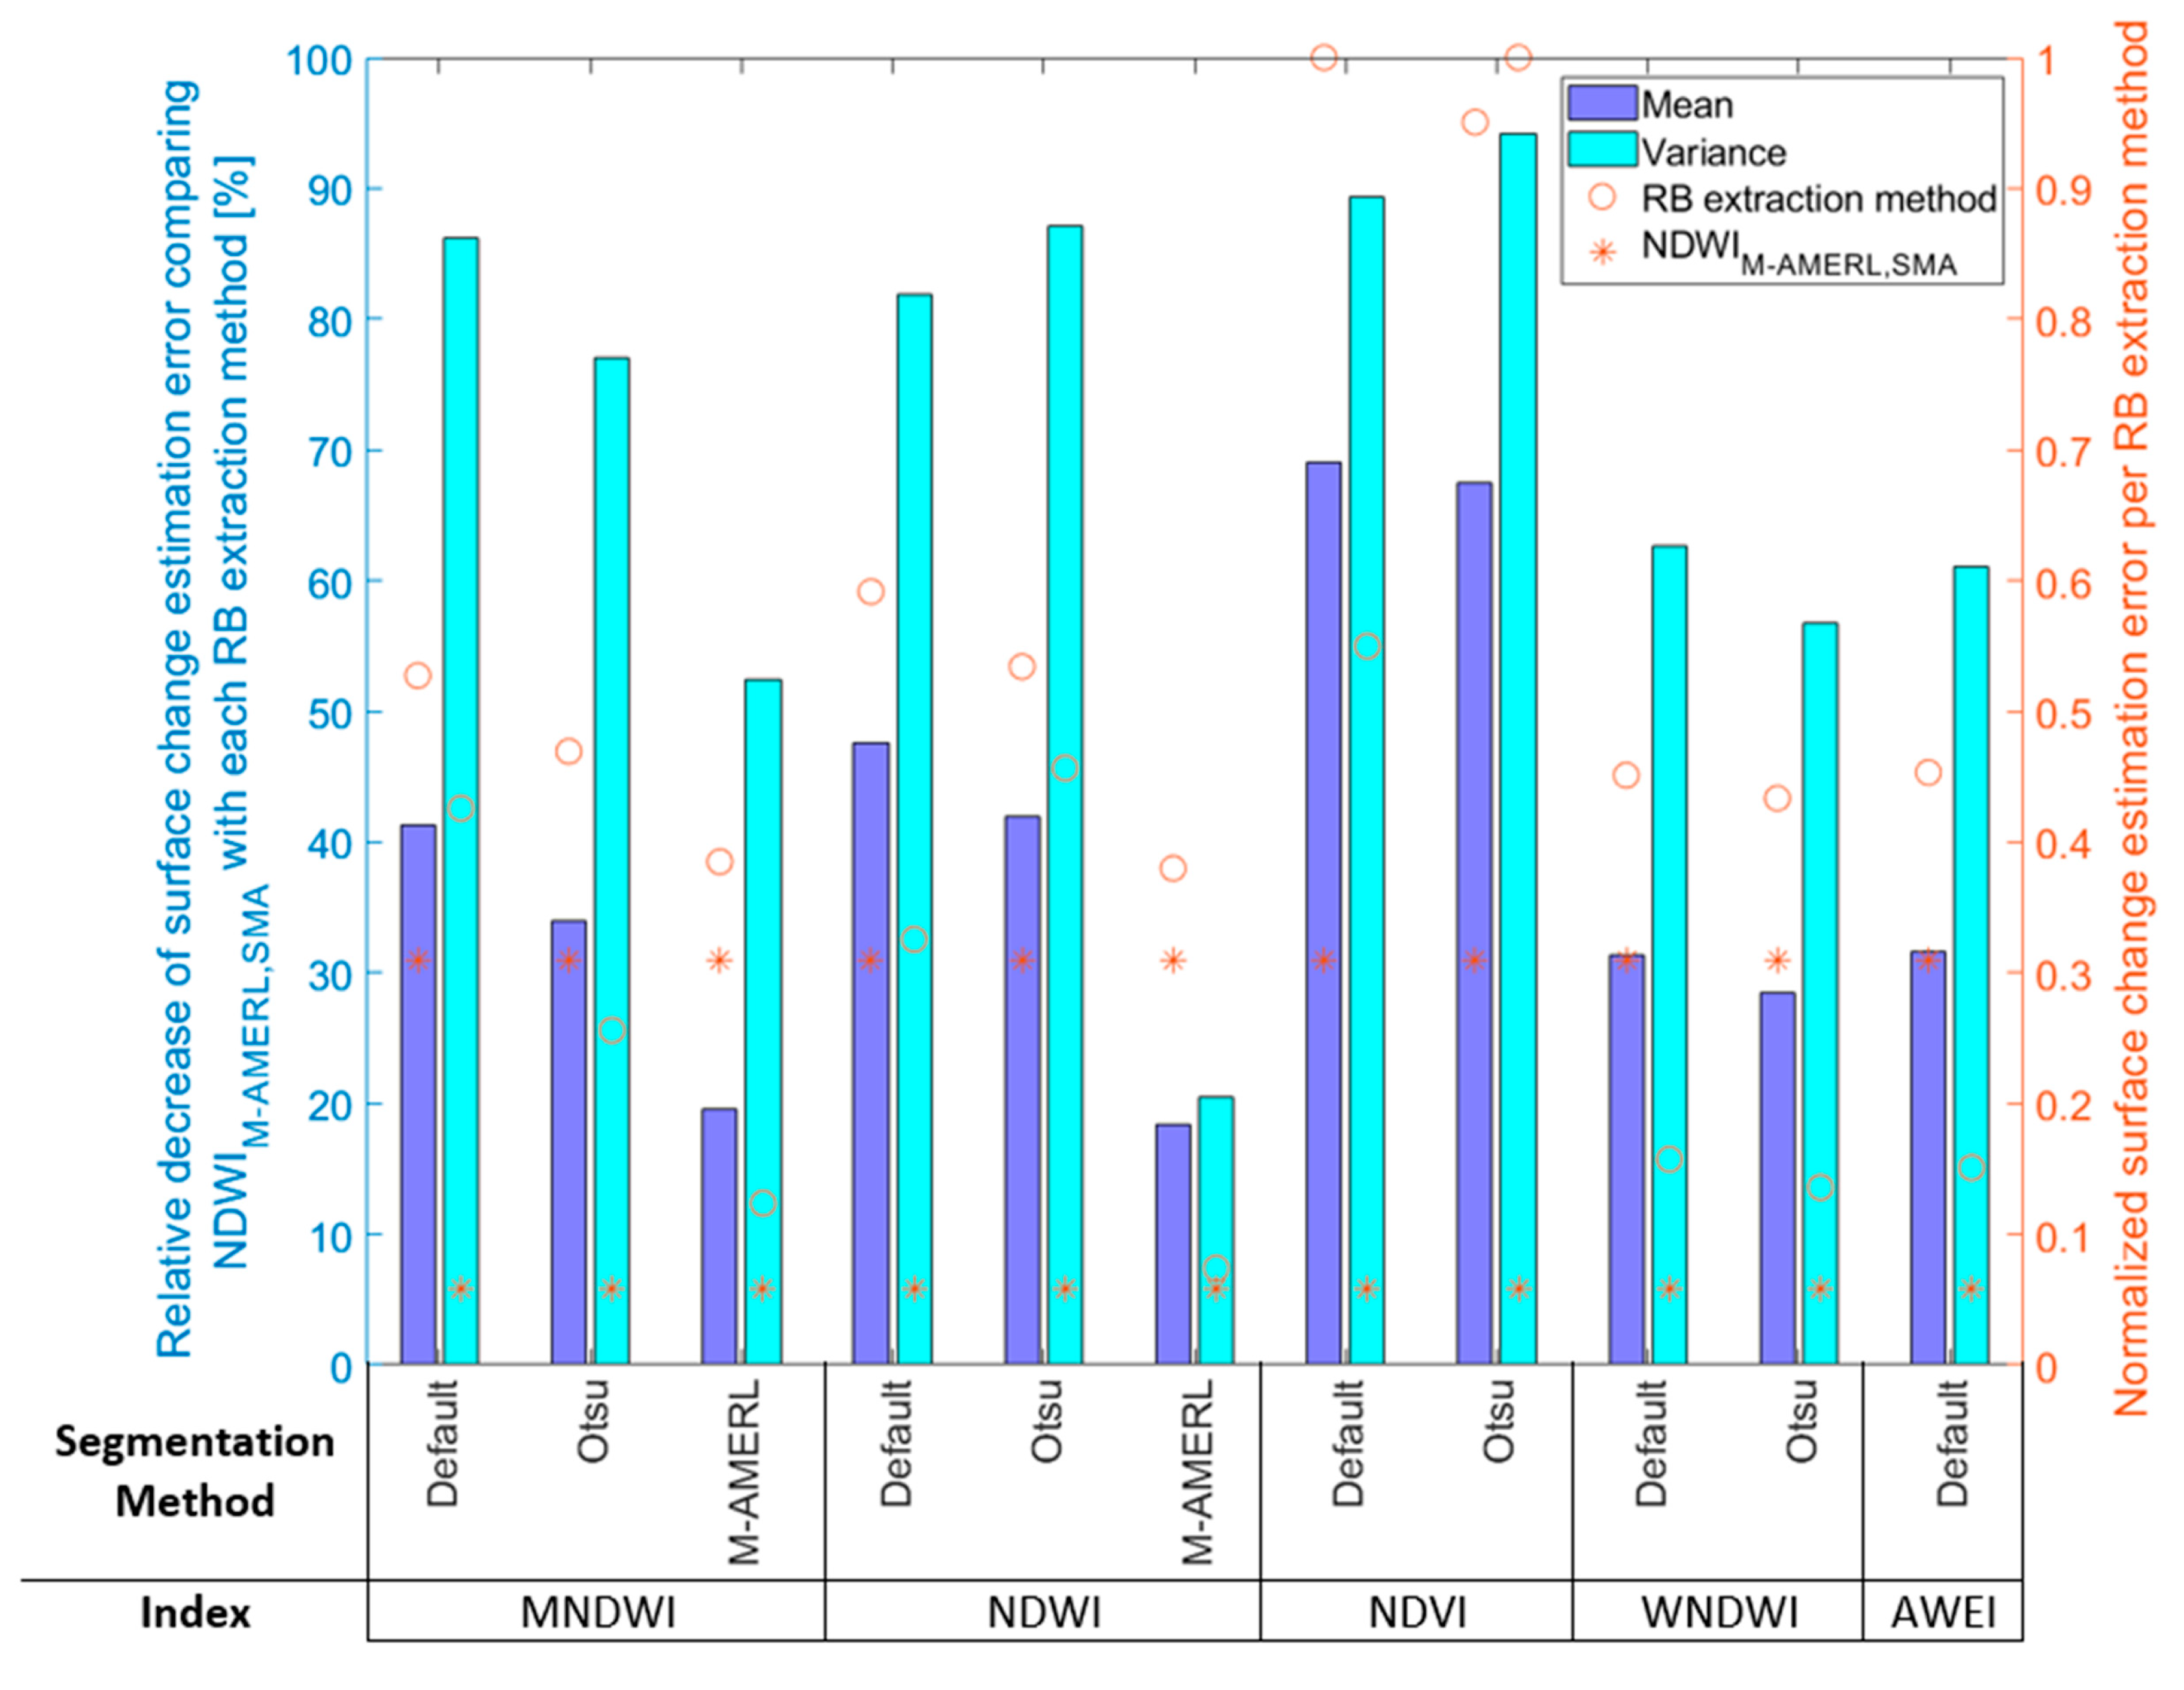
4.2. Advantage of the SMA Algorithm
4.3. Applying the Developed SRBED Methodology on Quantifying RB Changes in the River-Dominated Zone in the VMD
5. Discussion
6. Conclusions
Author Contributions
Funding
Acknowledgments
Conflicts of Interest
References
- Anthony, E.J.; Brunier, G.; Besset, M.; Goichot, M.; Dussouillez, P.; Nguyen, V.L. Linking rapid erosion of the Mekong River Delta to human activities. Sci. Rep. 2015, 5, 14745. [Google Scholar] [CrossRef] [PubMed]
- Triet, N.V.K.; Dung, N.V.; Fujii, H.; Kummu, M.; Merz, B.; Apel, H. Has dyke development in the Vietnamese Mekong Delta shifted flood hazard downstream? Hydrol. Earth Syst. Sci. Discuss. Rev. 2017, 21, 3991–4010. [Google Scholar] [CrossRef]
- Binh, D.; Kantoush, S.; Mai, N.; Sumi, T. Water level changes under increased regulated flows and degraded river in Vietnamese Mekong Delta. J. Jpn. Soc. Civil Eng. Ser. B1 (Hydrul. Eng.) 2018, 74, 871–876. [Google Scholar] [CrossRef]
- Binh, D.V.; Kantoush, S.; Sumi, T. Changes to long-term discharge and sediment loads in the Vietnamese Mekong Delta caused by upstream dams. Geomorphology 2020, 353, 107011. [Google Scholar] [CrossRef]
- Khoi, D.N.; Dang, T.D.; Pham, L.T.H.; Loi, P.T.; Thuy, N.T.D.; Phung, N.K.; Bay, N.T. Morphological change assessment from intertidal to river-dominated zones using multiple-satellite imagery: A case study of the Vietnamese Mekong Delta. Reg. Stud. Mar. Sci. 2020, 34, 101087. [Google Scholar] [CrossRef]
- Li, X.; Liu, J.P.; Saito, Y.; Nguyen, V.L. Recent evolution of the Mekong Delta and the impacts of dams. Earth-Sci. Rev. 2017, 175, 1–17. [Google Scholar] [CrossRef]
- Mai, N.P.; Kantoush, S.; Sumi, T.; Thang, T.D.; Trung, L.V.; Binh, D.V. Assessing and adapting the impacts of dams operation and sea level rising on saltwater intrusion into the Vietnamese Mekong Delta. J. Jpn. Soc. Civil Eng. Ser. B1 (Hydraul. Eng.) 2018, 74, 373–378. [Google Scholar] [CrossRef]
- Wang, J.J.; Lu, X.X.; Kummu, M. Sediment load estimates and variations in the lower Mekong River. River Res. Appl. 2011, 27, 33–46. [Google Scholar] [CrossRef]
- Tran, D.D.; Loc, H.H.; Long, P.H.; Tien, P.D.; Au, H.N. Sustainability of rice-based livelihoods in the upper floodplains of Vietnamese Mekong Delta: Prospects and challenges. Agric. Water Manag. 2021, 243, 106495. [Google Scholar] [CrossRef]
- Pham, T.A.N.; Loc, H.H.; Tran, D.D.; Quan, N.H. The inefficiency of Vietnamese prawn-rice rotational crops: A slacks-based data envelopment analysis. J. Agribus. Dev. Emerg. Econ 2020, in press. [Google Scholar] [CrossRef]
- Loc, H.H.; Diep, N.T.H.; Can, N.T.; Irvine, K.N.; Shimizu, Y. Integrated evaluation of ecosystem services in prawn-rice rotational crops, Vietnam. Ecosyt. Serv. 2017, 26, 377–387. [Google Scholar] [CrossRef]
- Tan, L.V.; Tran, T.; Loc, H.H. Soil and water quality indicators of diversified farming systems in a saline region of the Mekong Delta, Vietnam. Agriculture 2020, 10, 38. [Google Scholar] [CrossRef]
- Klaassen, G.J.; Pilarczyk, K.W.; San, D.C. River bank erosion and mitigation strategies in Vietnam. In Floods from Defence to Management; Van, A., vam Beek, T., Eds.; Taylor & Francis Group: London, UK, 2005; pp. 269–279. [Google Scholar]
- Fuller, I.C.; Large, A.R.G.; Milan, D.J. Quantifying development and sediment transfer following chute cutoff in a wandering gravel-bed river. Geomorphology 2003, 54, 307–323. [Google Scholar] [CrossRef]
- Lawer, D.M. The Measurement of river bank erosion and lateral channel change: A Review. Earth Surface Processes Landforms 1993, 18, 777–821. [Google Scholar] [CrossRef]
- Papini, M.; Ivanov, V.I.; Brambilla, D.; Arosio, D.; Longoni, L. Monitoring bedload sediment transport in a pre-Alpine river: An experimental metod. Rend. Online Soc. Geol. Ital. 2017, 43, 57–63. [Google Scholar] [CrossRef]
- Vietz, G.J.; Lintern, A.; Webb, J.A.; Straccione, D. River bank erosion and te influence of environmental flow management. Environ. Manag. 2018, 61, 454–468. [Google Scholar] [CrossRef] [PubMed]
- Mandlburger, G.; Pfennigbauer, M.; Wieser, M.; Riegl, U.; Pfeifer, N. Evaluation of a Novel UAV-Borne Topo-Bathymetric Laser Profiler. In Proceedings of the International Archives of the Photogrammetry, Remote Sensing and Spatial Information Sciences, Prague, Czech Republic, 12–19 July 2016. [Google Scholar]
- Thoma, D.P.; Gupta, S.C.; and Bauer, M.A.; Kirchoff, C.E. Airborne laser scanning for riverbank erosion assessment. Remote Sens. Environ. 2005, 95, 493–501. [Google Scholar] [CrossRef]
- Telling, J.; Lyda, A.; Hartzell, P.; Glennie, C. Review of Earth science research using terrestrial laser scanning. Earth-Sci. Rev. 2017, 169, 35–68. [Google Scholar] [CrossRef]
- Lai, Y.G. Modeling stream bank erosion: Practical stream results and future needs. Water 2017, 9, 950. [Google Scholar] [CrossRef]
- Abderrezzak, K.E.K.; Moran, A.D.; Tassi, P.; Ata, R.; Hervouet, M. Modelling river bank erosion using a 2D depth-averaged numerical model of flow and non-cohesive, non-uniform sediment transport. Adv. Water Res. 2016, 93, 75–88. [Google Scholar] [CrossRef]
- Rinaldi, M.; Darby, S.E. Modelling river-bank-erosion processes and mass failure mechanisms: Progress towards fully coupled simulations. Dev. Earth Surface Process. 2007, 11, 213–239. [Google Scholar]
- Cohen, W.B.; Goward, S.N. Landsat’s role in ecological applications of remote sensing. BioScience 2004, 54, 535–545. [Google Scholar] [CrossRef]
- Jiang, H.; Feng, M.; Zhu, Y.; Lu, N.; Huang, J.; Xiao, T. An automated method for extracting rivers and lakes from landsat imagery. Remote Sens. 2014, 6, 5067–5089. [Google Scholar] [CrossRef]
- Kennedy, R.E.; Andréfouët, S.; Cohen, W.B.; Gómez, C.; Griffiths, P.; Hais, M.; Healey, S.P.; Helmer, E.H.; Hostert, P.; Lyon, M.B.; et al. Bringing an ecological view of change to Landsat- based remote sensing. Front. Ecol. Environ. 2014, 12, 339–346. [Google Scholar] [CrossRef]
- Loveland, T.R.; Dwyer, J.L. Landsat: Building a strong future. Remote Sens. Environ. 2012, 122, 22–29. [Google Scholar] [CrossRef]
- Park, E. Characterizing channel-floodplain connectivity using satellite altimetry: Mechanism, hydrogeomorphic control, and sediment budget. Remote Sens. Environ. 2020, 243, 111783. [Google Scholar] [CrossRef]
- Turner, W.; Rondinini, C.; Pettorelli, N.; Mora, B.; Leidner, A.K.; Szantoi, Z.; Buchanan, G.; Dech, S.; Dwyer, J.; Herold, M.; et al. Free and open- access satellite data are key to biodiversity conservation. Biol. Conserv. 2015, 182, 173–176. [Google Scholar] [CrossRef]
- Vogelmann, J.E.; Gallant, A.L.; Shi, H.; Zhu, Z. Perspectives on monitoring gradual change across the continuity of Landsat sensors using time- series data. Remote Sens. Environ. 2016, 185, 258–270. [Google Scholar] [CrossRef]
- Young, N.E.; Anderson, R.S.; Chignell, S.M.; Vorster, A.G.; Lawrence, R.; Evangelista, P.H. A survival guide to Landsat preprocessing. Ecology 2017, 98, 920–932. [Google Scholar] [CrossRef]
- Huang, C.; Chen, Y.; Zhang, S.; Wu, J. Detecting, extracting, and monitoring surface water from space using optical sensors: A review. Rev. Geophys. 2018, 56, 333–360. [Google Scholar] [CrossRef]
- Rouse, J.W., Jr.; Haas, R.H.; Schell, J.A.; Deering, D.W. Monitoring vegetation systems in the Great Plains with ERTS. Goddard Space Flight Center 3d ERTS-1 Sympos. Sect.A 1974, 1, 309–317. [Google Scholar]
- McFeeters, S.K. The use of the normalized difference water index (NDWI) in the delineation of open water features. Int. J. Remote Sens. 1996, 17, 1425–1432. [Google Scholar] [CrossRef]
- Xu, H. Modification of normalized difference water index (NDWI) to enhance open water features in remotely sensed imagery. Int. J. Remote Sens. 2006, 27, 3025–3033. [Google Scholar] [CrossRef]
- Guo, Q.; Pu, R.; Li, J.; Cheng, J. A weighted normalized difference water index for water extraction using landsat imagery. Int. J. Remote Sens. 2017, 38, 5430–5445. [Google Scholar] [CrossRef]
- Feyisa, G.L.; Meilby, H.; Fensholt, R.; Proud, S.R. Automated water extraction index: A new technique for surface water mapping using landsat imagery. Remote Sens. Environ. 2014, 140, 23–33. [Google Scholar] [CrossRef]
- Eslami, S.; Hoekstra, P.; Trung, N.N.; Kantoush, S.A.; Binh, D.V.; Dung, D.D.; Quang, T.T.; Vegt, M.V.D. Tidal amplification and salt intrusion in the Mekong delta driven by anthropogenic sediment starvation. Sci. Rep. 2019, 9, 18746. [Google Scholar] [CrossRef]
- Mai, N.P.; Kantoush, S.; Sumi, T.; Thang, T.D.; Binh, D.V.; Trung, L.V. Study on salinity intrusion processes into Hau River of Vietnamese Mekong Delta. J. Jpn. Soc. Civil Eng. Ser. B1 (Hydraul. Eng.) 2019, 75, 751–756. [Google Scholar]
- Kantoush, S.; Binh, D.V.; Sumi, T.; Trung, L.V. Impact of upstream hydropower dams and climate change on hydrodynamics of Vietnamese Mekong Delta. J. Jpn. Soc. Civil Eng. Ser. B1 (Hydraul. Eng.) 2017, 73, 109–114. [Google Scholar] [CrossRef]
- Hecht, J.S.; Lacombe, G.; Arias, M.E.; Dang, T.D. Hydropower dams of the Mekong River basin: A review of their hydrological impacts. J. Hydrol. 2019, 568, 285–300. [Google Scholar] [CrossRef]
- Minderhoud, P.S.J.; Erkens, G.; Pham, V.H.; Bui, V.T.; Erban, L.; Kooi, H.; Stouthamer, E. Impacts of 25 years of groundwater extraction on subsidence in the Mekong delta, Vietnam. Environ. Res. Lett. 2017, 12, 064006. [Google Scholar] [CrossRef]
- Minderhoud, P.S.J.; Middelkoop, H.; Erkens, G.; Stouthamer, E. Groundwater extraction may drown mega-delta: Projections of extraction-induced subsidence and elevation of the Mekong Delta for the 21st century. Environ. Res. Commun. 2020, 2, 011005. [Google Scholar] [CrossRef]
- Kondolf, G.M.; Rubin, Z.K.; Minear, J.T. Dams of the Mekong: Cumulative sediment starvation. Water Res. 2014, 50, 5158–5169. [Google Scholar] [CrossRef]
- Nowacki, D.J.; Ogston, A.S.; Nittrouer, C.A.; Fricke, A.T.; Van, P.D.T. Sediment dynamics in the lower Mekong River: Transition from tidal river to estuary. J. Geophys. Res. Oceans 2015, 120, 6363–6383. [Google Scholar] [CrossRef]
- Hackney, C.R.; Darby, S.E.; Parsons, D.R.; Leyland, J.; Best, J.L.; Aalto, R.; Nicholas, A.P.; Houseago, R.C. River bank instability from unsustainable sand mining in the lower Mekong River. Nat. Sustain. 2020, 3, 217–225. [Google Scholar] [CrossRef]
- Jordan, C.; Tiede, J.; Lojek, O.; Visscher, J.; Apel, H.; Nguyen, H.Q.; Quang, C.N.X.; Schlurmann, T. Sand mining in the Mekong Delta revisited-current scales of local sediment deficits. Sci. Rep. 2019, 9, 17823. [Google Scholar] [CrossRef]
- Park, E.; Loc, H.H.; Dung, T.D.; Yang, X.; Alcantara, E.; Merino, E.; Son, V.H. Dramatic decrease of flood frequency in the Mekong Delta due to riverbed mining and dyke construction. Sci. Total Environ. 2020, 25, 138066. [Google Scholar] [CrossRef]
- Bravard, J.-P.; Goichot, M.; Gaillot, S. Geography of sand and gravel mining in the lower Mekong River: First survey and impact assessment. EchoGéo 2013, 26, 1–18. [Google Scholar] [CrossRef]
- Chu, Z.X.; Sun, X.G.; Zhai, S.K.; Xu, K.H. Changing pattern of accretion/erosion of the modern Yellow River (Huanghe) subaerial delta, China: Based on remote sensing images. Mar. Geol. 2006, 227, 13–30. [Google Scholar] [CrossRef]
- Chu, Z.; Yang, X.; Feng, X.; Fan, D.; Li, Y.; Shen, X.; Miao, A. Temporal and spatial changes in coastline movement of the Yangtze delta during 1974–2010. J. Asian Earth Sci. 2013, 66, 166–174. [Google Scholar] [CrossRef]
- White, K.; El Asmar, H.M. Monitoring changing position of coastlines using thematic mapper imagery, an example from the Nile Delta. Geomorphology 1999, 29, 93–105. [Google Scholar] [CrossRef]
- Horn, B.K.P.; Hilden, H.M.; Negahdaripour, S. Closed-form solution of absolute orientation using orthonormal matrices. J. Opt. Soc. Am. A 1988, 5, 1127–1135. [Google Scholar] [CrossRef]
- Liu, D.; Yu, J. Otsu Method and K-Means. In Proceedings of the 2009 Ninth International Conference on Hybrid Intelligent Systems, Shenyang, China, 12–14 August 2009; pp. 344–349. [Google Scholar]
- Arora, S.; Acharya, J.; Verma, A.; Panigrahi, P.K. Multilevel thresholding for image segmentation through a fast statistical recursive algorithm. Pattern Recogn. Lett. 2008, 29, 119–125. [Google Scholar] [CrossRef]
- Dong, L.J.; Yu, G.; Ogunbona, P.; Li, W.Q. An efficient iterative algorithm for image thresholding. Pattern Recogn. Lett. 2008, 29, 1311–1316. [Google Scholar] [CrossRef]
- Huang, D.Y.; Wang, C.H. Optimal multilevel thresholding using a two-stage Otsu optimization approach. Pattern Recogn. Lett. 2009, 30, 275–284. [Google Scholar] [CrossRef]
- Kirk, J. Traveling Salesman Problem Nearest Neighbor; MATLAB Central File Exchange. 2020. Available online: https://www.mathworks.com/matlabcentral/fileexchange/21297-traveling-salesman-problem-nearest-neighbor (accessed on 15 January 2020).
- Haertel, V.F.; Shimabukuro, Y.E. Spectral linear mixing model in low spatial resolution image data. IEEE Trans. Geosci. Remote Sens. 2005, 43, 2555–2562. [Google Scholar] [CrossRef]
- Park, E.; Latrubesse, E.M. Modeling suspended sediment distribution patterns of the Amazon River using MODIS data. Remote Sens. Environ. 2014, 147, 232–242. [Google Scholar] [CrossRef]
- Li, S.; Sun, D.; Yu, Y.; Csiszar, I.; Stefanidis, A.; Goldberg, M.D. A new short-wave infrared (SWIR) method for quantitative water fraction derivation and evaluation with eos/modis and landsat/tm data. IEEE Trans. Geosci. Remote Sens. 2012, 51, 1852–1862. [Google Scholar] [CrossRef]
- Kondolf, G.M.; Schmitt, R.J.P.; Carling, P.; Darby, S.; Arias, M.; Bizzi, S.; Castelletti, A.; Cochrane, T.A.; Gibson, S.; Kummu, M.; et al. Changing sediment budget of the Mekong: Cumulative threats and management strategies for a large river basin. Sci. Total Environ. 2018, 625, 114–134. [Google Scholar] [CrossRef]
- Binh, D.; Kantoush, S.; Sumi, T.; Mai, N.P. Impact of Lancang cascade dams on flow regimes of Vietnamese Mekong Delta. J. Jpn. Soc. Civil Eng. Ser. B1 (Hydraul. Eng.) 2018, 74, 487–492. [Google Scholar] [CrossRef]
- Binh, D.V.; Kantoush, S.; Sumi, T.; Mai, N.P.; Trung, L.V. Dam-induced riverbed incision and saltwater intrusion in the Mekong Delta. In River Flow; Uijttewaal, W.S.J., Crosato, A., Schielen, R., Eds.; Taylor & Francis Group: London, UK, 2020. [Google Scholar]
- Darby, S.E.; Hackney, C.R.; Leyland, J.; Kummu, M.; Lauri, H.; Parsons, D.R.; Best, J.L.; Nicholas, A.P.; Aalto, R. Fluvial sediment supply to a megadelta reduced by shifting tropical-cyclone activity. Nature 2016, 539, 276–279. [Google Scholar] [CrossRef]


| Date | Landsat Sensor | Water Level (m) | Purpose | ||
|---|---|---|---|---|---|
| Tan Chau | My Thuan | Mean | |||
| 22.02.2014 | 8 OLI | 0.59 | 0.42 | 0.51 | For model development |
| 08.03.2019 | 8 OLI | 0.63 | 0.4 | 0.52 | |
| 25.03.2008 | 5 TM | 0.91 | 0.41 | 0.66 | For model application |
| 21.01.2014 | 8 OLI | 0.9 | 0.39 | 0.65 | |
| Segmentation method | NDVI | NDWI | MNDWI | WNDWI | AWEInsh |
| Default thresholding | x | X | X | x | x |
| Otsu’s method | x | X | X | x | |
| M-AMERL | X | X |
| Spectral | Algorithm | Default Water Threshold | Sources |
|---|---|---|---|
| NDVI | <0 | [29] | |
| NDWI | >0 | [30] | |
| MNDWI | >0 | [31] | |
| WNDWI | >0 ( = 0.5) | [32] | |
| AWEInsh | >0 | [33] |
© 2020 by the authors. Licensee MDPI, Basel, Switzerland. This article is an open access article distributed under the terms and conditions of the Creative Commons Attribution (CC BY) license (http://creativecommons.org/licenses/by/4.0/).
Share and Cite
Binh, D.V.; Wietlisbach, B.; Kantoush, S.; Loc, H.H.; Park, E.; Cesare, G.d.; Cuong, D.H.; Tung, N.X.; Sumi, T. A Novel Method for River Bank Detection from Landsat Satellite Data: A Case Study in the Vietnamese Mekong Delta. Remote Sens. 2020, 12, 3298. https://doi.org/10.3390/rs12203298
Binh DV, Wietlisbach B, Kantoush S, Loc HH, Park E, Cesare Gd, Cuong DH, Tung NX, Sumi T. A Novel Method for River Bank Detection from Landsat Satellite Data: A Case Study in the Vietnamese Mekong Delta. Remote Sensing. 2020; 12(20):3298. https://doi.org/10.3390/rs12203298
Chicago/Turabian StyleBinh, Doan Van, Basil Wietlisbach, Sameh Kantoush, Ho Huu Loc, Edward Park, Giovanni de Cesare, Do Huy Cuong, Nguyen Xuan Tung, and Tetsuya Sumi. 2020. "A Novel Method for River Bank Detection from Landsat Satellite Data: A Case Study in the Vietnamese Mekong Delta" Remote Sensing 12, no. 20: 3298. https://doi.org/10.3390/rs12203298
APA StyleBinh, D. V., Wietlisbach, B., Kantoush, S., Loc, H. H., Park, E., Cesare, G. d., Cuong, D. H., Tung, N. X., & Sumi, T. (2020). A Novel Method for River Bank Detection from Landsat Satellite Data: A Case Study in the Vietnamese Mekong Delta. Remote Sensing, 12(20), 3298. https://doi.org/10.3390/rs12203298