Article

Data Assimilation of High-Resolution Satellite Rainfall Product Improves Rainfall Simulation Associated with Landfalling Tropical Cyclones in the Yangtze River Delta

1
School of Geography and Ocean Science, Nanjing University, Nanjing 210023, China
2
School of Geography and Tourism, Chongqing Normal University, Chongqing 401331, China
*
Author to whom correspondence should be addressed.
Remote Sens. 2020, 12(2), 276; https://doi.org/10.3390/rs12020276
Submission received: 3 November 2019 / Revised: 5 January 2020 / Accepted: 10 January 2020 / Published: 14 January 2020
(This article belongs to the Special Issue Weather Forecasting and Modeling Using Satellite Data)

Abstract

:
Floods caused by heavy rainfall events associated with landfalling tropical cyclones (TCs) represent a major risk for the Yangtze River Delta (YRD) region of China. Accurate extreme precipitation forecasting, at long lead times, is crucial for the improvement of flood prevention and warning. However, accurate prediction of timing, location, and intensity of the heavy rainfall events is a major challenge for the Numerical Weather Prediction (NWP). In this study, high-resolution satellite precipitation products like Global Precipitation Measurement (GPM) are evaluated at the hourly timescale, and the optimal Integrated Multi-satellite Retrievals for GPM (IMERG) precipitation product is selected and applied to directly assimilate into the Weather Research and Forecasting (WRF) model via the four-dimensional variational (4D-Var) method. The TC Jondari and Rumbia events of August 2018 are evaluated to analyze the performance of the WRF model with the 4D-Var method assimilated IMERG precipitation product (DA-IMERG) and the conventional observation (DA-CONV) for real-time heavy rainfall forecasting. The results indicate that (1) IMERG precipitation products were larger and wetter than the observed precipitation values over YRD. By comparison, the performance of “late” run precipitation product (IMERG-L) was the closest to the observation data with lower deviation and higher detection capability; (2) DA-IMERG experiment substantially affected the magnitude of the WRF model primary variables, which changed the precipitation pattern of the TC heavy rain. (3) DA-IMERG experiment further improved the forecast of heavy rainbands and relatively reduced erroneous detection rate than CTL and DA-CONV experiments at the grid scale. Meanwhile, the DA-IMERG experiment has a better fractions skill score (FSS) value (especially in the threshold of 10 mm/h) than DA-CONV for TC Jondari and Rumbia at the spatial scale, while it shows a lower performance than CTL and DA-CONV experiments when the threshold is lower than the 5 mm/h for the TC Rumbia.

Graphical Abstract

1. Introduction

Flooding is considered one of the most devastating natural disasters, causing extensive damage to human society. According to the report of the Centre for Research on the Epidemiology of Disasters (CRED), there were 315 natural disaster events that caused a total of 11,804 people deaths, over 68 million people affected, and economic losses of up to $131.7 billion in 2018 [1]. Among these disasters, flood affects more people than any other type of disasters, accounting for 50% of the total affected. Floods are often caused by short-term heavy rainfall associated with tropical cyclones (TCs) and extratropical systems playing central roles [2]. Heavy typhoon rainfall often causes flood inundation and strongly influences human lives. For instance, the super-typhoon Haiyan (2013) took at least 6300 lives and caused approximately $2 billion in damage in the Philippines [3]. Therefore, accurate typhoon rainfall forecasting is imperative for flood warning and emergency response during typhoon landfall.
Currently, our state-of-the-art General Circulation Models (GCM) use Numerical Weather Prediction (NWP) to predict TCs and study their formation, development, and dissipation [4]. However, most GCM simulations present coarse horizontal resolutions (~0.1°). Coarse GCM resolutions heavily smooth and inaccurately represent the complex topographic patterns that inevitably affect the finer resolution climate simulations [5]. To obtain accurate climatic information, several regional climate models (RCMs) have been used to simulate the regional atmospheric and land processes, including WRF (Weather Research and Forecasting), RSM (Regional Spectrum Model), PNNLRCM (Pacific Northwest National Laboratory Regional Climate Model), PRECIS (Providing Regional Climates for Impacts Studies), RIEMS (Regional Integrated Environment Modeling System), RegCM (Regional Climate Model), and so on; these have evolved from mesoscale and weather forecast models or as regional configurations of global models [5]. Until now, the RCMs models have been widely used in the diverse community for regional process and sensitivity studies. Among the various NWP models, WRF, as one of the most popular mesoscale numerical weather predictions models, has been widely used to forecast and study TCs due to a flexible and computationally efficient platform for operational forecasting [6,7]. Nevertheless, TC’s intense rainfall is time-dependent and spatially complex, therefore, the accuracy of TC precipitation prediction remains a challenge [4]. Additionally, uncertainty remains in optimal microphysics schemes and initializations, which contribute to inaccurate simulations.
High-resolution precipitation data assimilation (DA) offers an opportunity to improve the numerical prediction of TC by providing accurate initial conditions for the subsequent weather forecast [8]. In the last several decades, various DA techniques have been developed and successfully applied in NWP [9]. The three-dimensional variational DA (3D-Var) [10] and four-dimensional variational DA (4D-Var) are commonly used DA methods in the WRF model to restructure the moisture and temperature fields for improving the quality of model analyses and forecasts [11,12]. Huang et al. [13] investigated that 4D-Var had a significant positive impact on the rainfall forecasts compared to the 3D-Var owing to the fact that 4D-Var used physical and dynamical constraints to improve analysis field initial conditions. Another advantage of 4D-Var is that it can assimilate precipitation data directly and adjust the model variables towards observed precipitation [14]. Koizumi et al. [15] demonstrated that the rainfall assimilation using 4D-Var could improve the forecast of synoptic-scale atmospheric flow and sub-synoptic-scale precipitation distributions. However, the accuracy of precipitation simulated by WRF with 4D-Var depends on the assimilation data. Yi et al. [16] reported that WRF precipitation assimilated with GPM IMERG outperformed that with TRMM-3B42.
Satellite precipitation products with wide coverage and high spatiotemporal resolution have been used in landfalling TC research [17,18]. At present, satellite precipitation products such as CMORPH (the Climate Precipitation Center morphing method), PERSIAN (the Precipitation Estimation from Remotely Sensed Information using Artificial Neural Network), TMPA (Tropical Rainfall Measuring Mission (TRMM) Multi-satellite Precipitation Analysis), IMERG (Integrated Multi-Satellite Retrievals for Global Precipitation Measurement (GPM) mission), have been made available to the public [19]. The GPM as the successor of the TRMM provided three IMERG precipitation products (the near-real-time “early” run (IMERG-E), “late” run (IMERG-L), and the post-real-time “final” run (IMERG-F)). According to existing research, scholars mainly evaluate and compare IMERG-L with rain gauge observations and several prevailing satellite precipitation products in varying climate zones and spatial-temporal scales for capturing key features of rainfall [20,21,22,23,24,25,26,27,28,29]. Predominantly, the aforementioned studies find that IMERG products show promising potential in rainfall spatial-temporal distribution, but they pay little attention to assessing the performance of the satellite precipitation of typhoon-specific precipitation over the Yangtze River Delta (YRD).
YRD lies in one of the main typhoon paths and often suffers from flooding caused by heavy TC rainfall. [30]. This study will focus on the comparative performance of IMERG precipitation products on capturing the space-time organization of precipitation associated with TC Jondari and Rumbia at hourly timescales over YRD. Furthermore, we analyze the impact of the optimal IMERG precipitation product and conventional observation data assimilated into WRF with 4D-Var for simulating heavy rainfall events that occurred over YRD. Results of this study can provide reference for improving the numerical simulations of TC rainfall for timely flood forecasting and warning.

2. Materials and Methods

2.1. Study Area

YRD is located on the east coast of China with latitude of 29°12′ N–33°19′ N and longitude of 118°19′ E–122°19′ E and has a basin area of 9.54 × 10⁴ km2. The plain area accounts for 85.3% of the watershed located in north and east of the YRD, while mountains and hills lie on the southwest of YRD. The YRD region is dominated by the East Asian monsoon (Figure 1). The average annual precipitation of this area ranges from 729.7 to 1526.2 mm, with an average temperature of 16 °C [31]. The precipitation shows a distinct seasonal distribution, and mainly occurs in May to October. During this period, the YRD often suffers from yearly severe flooding because of the short-term heavy rainfall caused by TCs from the east Pacific. For instance, four TCs (e.g., Ampil, Jondari, Yagi, and Rumbia) impacted the YRD from July 2018 to August 2018. The area affected by TC Rumbia covered 37,489 km2 in the Jiangsu province. The water level of Taihu lagoon rose to 3.72 m and exceeded the water warning level by 0.26 m. Additionally, several observation gauges in the plain river area exceed the warning level during the period of TC Rumbia [30]. Thus, the TC heavy rainfall increased the potential danger of the flood risk in the study area.

2.2. Datasets

The hourly rain gauge precipitation data are employed as ground truth to evaluate satellite products. Hourly precipitation data of rain gauge stations in August 2018 are obtained from the National Meteorological Information Center of China Meteorological Administration (CMA). There are 82 rain gauge stations located in the YRD (Figure 1). All data have undergone strict quality control by CMA, including checking extreme values, internal consistency, and spatial consistency [19].
Global Precipitation Measurement (GPM) is a successor of TRMM, which began to provide next-generation global precipitation products since April 2014. The GPM sensors carry the Ku/Ka-band (13.6 GHz/35.5 GHz) dual-frequency precipitation radar (DPR) and a multi-channel GPM Microwave Imager (GMI) ranging from 10–183 GHz with a swath width of 885 km, similar to TRMM [32]. DPR improved sensitively of Ku and Ka bands and combined with radar observation technology provides more detail physical information of cloud precipitation particles, thereby improving the detection of micro precipitation (<0.5 mm/h) and solid precipitation [22,25]. The Integrated Multi-satellite Retrievals for GPM (IMERG) is the Level 3 precipitation estimation algorithm of GPM, which provides three types of precipitation products (including the IMERG-E (near real-time, with a latency of 4 h), IMERG-L (near real-time, with a latency of 18 h), and IMERG-F (with a latency of four months)) which has a finer spatial-temporal resolution (0.1° and 30 min) and greater coverage (60° S–60° N) than TRMM products. The IMERG-E and IMERG-L products are only calibrated using “satellite source” data while the IMERG-F product is adjusted by monthly Global Precipitation Climatology Centre (GPCC) gauge data [32]. IMERG precipitation products within 23° N–39° N and 110° E–130° E are obtained from NASA Goddard Earth Sciences (GES) Data and Information Services Center (DISC) website. Before using the IMERG precipitation products, the time of local time and UTC (+8) was united in the study period.

2.3. Method Used

2.3.1. WRF Model Configuration

The numerical simulation of intense precipitation events by the TCs are investigated by Advanced Research WRF ARW version 3.9.1. This full compressible non-hydrostatic model is widely used in the research fields of meteorology and hydrometeorology due to its flexibility regarding the implementation of a large number of physical parameterizations and its ability to simulate atmosphere dynamics at a variety of horizontal and vertical scales [33]. In this work, two nested domains are utilized. The horizontal grid domain 1 (D1) is 90 × 90 and domain 2 (D2) is 76 × 76 in the east-west and south-north directions (Table 1), with horizontal grid spacing 27 km and 9 km respectively. D1 is centered at (120° E, 31° N) and covers most of East China and its surrounding areas, while the nested inner domain (D2) is centered over YRD. The vertical grids contain 38 sigma levels from the surface to 50hPa. The initial and boundary conditions are obtained from the National Center for Environmental Prediction (NCEP) FNL global reanalysis data (https://rda.ucar.edu/datasets/ds083.3/) on 0.25° × 0.25° grids at 6 h interval. The model time step is 60 s and 30 s respectively, and the output interval is 60 s for each domain (Table 1).
Parameterization is the method of replacing process that are too small-scale or complex to be physically represented in the model by simplified process. WRF commonly parameterizes microphysical processes, cumulus physics, land surface processes, planetary boundary layer (PBL) processes, surface layer processes, and radiation physics [7]. The model performance is highly dependent on the choice of parameterization schemes. Several physics schemes were widely utilized in previous studies [34,35,36], including Morrison two-moment microphysics scheme, RRTMG radiation scheme, Monin–Obukhov surface layer schemem, Noah land-surface process, Mellor–Yamada–Jajic TKE planetary boundary layer process, and Kain–Fritsch cumulus scheme, were identical for the two nested domains.

2.3.2. Experiments Design

In this study, we conducted three sets of WRF experiments over YRD outlined in Table 2. For the control experiment (CTL), we run the WRF model without assimilating observation data. The simulated period was set from 0000 UTC 02 to 1800 UTC 03 August for TC Jondari and from 1800 UTC 15 to 0000 UTC 18 August 2018 for TC Rumbia. The purpose of the WRF experiment was to investigate the accuracy of simulated precipitation in the WRF model. To ensure an equilibrium between the boundary conditions and the model dynamics [37], we sited the first 6h of the simulations as spin up. The 4D-Var (4D-Var details are contained in Appendix A) assimilation experiments included the WRF model assimilated optimal IMERG precipitation product (DA-IMERG) and conventional observations (DA-CONV). Two assimilation experiments, the analysis time of the assimilation experiment was valid at 0600 UTC 02 to 1800 UTC 03 August for TC Jondari and 0000 UTC 16 August to 0000 UTC 18 August 2018 for TC Rumbia. DA-IMERG experiment was directly assimilated IMERG precipitation products utilizing 4D-Var. The IMERG precipitation product was applied as observation operators, which was collected and accumulated every 6h for assimilating into the DA-IMERG experiment [16]. For comparison purposes, The DA-CONV was based on the assimilation of conventional observations (surface observational weather data (ds461.0) and upper air observational weather data (ds351.0)) from the Research Data Archive at the National Center for Atmospheric Research (https://rda.ucar.edu/datasets/). For each case, we used 6 h analysis cycle, and the first 6 h period of the CTL experiment as the first-guess field of the 4D-Var assimilation experiment. The 4D-Var model provided the initial and boundary conditions for the subsequent WRF model with a cycling forecast. The assimilations were carried out in both outer and inner domains (27 km and 9 km resolutions, respectively). For all assimilation experiments, the background error covariance matrices were statistics by computing the differences between 24 h and 12 h forecasts for the one-month ensemble forecasts from 21 July to 21 August 2018.

2.3.3. Evaluation Metrics

To evaluate the performance of the GPM satellite precipitation products and the precipitation results simulated by the WRF model and assimilation experiments, we extracted the precipitation series of IMERG precipitation products and simulated precipitation at the satellite gridboxes where at least one rain gauge was located over YRD. Several widely-used evaluation metrics were selected to quantify the deviations and the precipitation event detection capability of the IMERG precipitation products, CTL, DA-CONV, and DA-IMERG (Table 3). The correlation coefficient (CC), the relative bias (Bias), and root-mean-square error (RMSE) were used to quantitatively assess the correlations, errors, and deviation between the estimated precipitation and the gauge precipitation at the point scale. To evaluate the precipitation detection capability of the GPM, CTL, DA-CONV, and DA-IMERG, three contingency statistic descriptions are adopted in meteorological studies, including probability of detection (POD), false alarm ratio (FAR), and critical success index (CSI). POD denotes the ratio of precipitation events correctly detected to the total number of observed events. FAR indicates the fraction of spurious precipitation events among all the events the satellite/simulated detected. CSI captures the ratio of satellite/simulated events that are correctly detected to total number of observed or detected events (Table 3). Besides, the fractions skill score (FSS) was used for assessing the spatial agreement between simulated precipitation and optimal IMERG product precipitation for several rainfall thresholds (i.e., 1.0 mm/h, 2.5 mm/h, 5 mm/h, and 10 mm/h). FSS value range from 0 to 1, 0 meaning there is no overlap between the forecasted and observed precipitation, 1 meaning complete overlap.

3. Results

3.1. Evaluation of IMERG Precipitation Products

3.1.1. Temporal and Spatial Distribution of IMERG Precipitation

Figure 2 shows the spatial distribution of accumulated precipitation of the TC Jondari and Rumbia retrieved from IMERG and gauge observation during TC landfalling period. The structure of the landfalling TC in Figure 2 is consistent with similar results presented by Rios Gaona et al. [17]. It is clear in Figure 2, that although the IMERG precipitation products show similar spatial variations; the rainbands of the IMERG-F is obviously wider than IMERG-E and IMERG-L. Compared to the observed precipitation, IMERG products exhibit good capacity in capturing the spatial characteristics of total precipitation. However, IMERG precipitation products seem to overestimate precipitation. The spatial distributions and the amounts of the IMERG-E (Figure 2a,d) and IMERG-F (Figure 2c,f) precipitation products are larger than observed precipitation. In contrast, IMERG-L precipitation product presents a more reasonable distribution and shows the best match with the observed precipitation (Figure 2b,e).
The temporal distribution of the hourly rain rate over YRD is shown in Figure 3. The hourly rain rate was calculated by averaging precipitation amount of 82 rain gauge and 128 selected grid boxes nearest each gauge within YRD (Figure 1). The IMERG precipitation products exhibit similar distribution patterns with observed precipitation in terms of hourly rain rate, but there are some differences in the temporal distribution curves. For TC Jondari, the performance of all three IMERG products comparatively poor CC values during TC landfalling, while the systematic error has a good performance, with average Bias value of 4.38% and average RMSE value of 2.85 mm (Figure 3a). By comparison, although the distribution of the IMERG products for TC Rumbia presents a higher CC value, the Bias and RMSE values are large, indicating IMERG products have obvious overestimation for the hourly rain rate. As shown in Figure 3b, IMERG-E and IMERG-F evidently overestimated the hourly rain rate from 1200 UTC 16 to 0800 UTC 17 August 2018. IMERG-L product shows a relatively slight overestimation and has the best fitting with the observed precipitation for two landfalling TC over YRD, in terms of the slightly better CC, Bias, and RMSE value than IMERG-E and IMERG-F.
We further examine the frequency of the hourly rain rate at different precipitation intensity levels over YRD. We use thresholds of 2.5 mm and 8 mm hourly rain rate to divide mean hourly precipitation into three levels (e.g., light rain (0.1 ≤ R < 2.5 mm), moderate rain (2.5 ≤ R < 8 mm), and heavy rain (R ≥ 8 mm)) (Table 4 and Figure 4). Results indicate that IMERG-E and IMERG-L products underestimated the incidence of light rain, while the IMERG-F products overestimated the incidence of light rain with a Bias value of 13.91% during Jondari landfalling (Figure 4a,c). For moderate rain, although IMERG produces provide a relatively higher estimate during Jondari landfalling, it tends to provide a good estimate during Rumbia with a higher CC value (ranging from 0.80 to 0.89) (Figure 4e). In the case of heavy rain, IMERG-F products obviously overestimated the occurrence frequency (especially the Bias of IMERG-F up to 138.55% for Rumbia) (Table 4). Comparing the statistical results of occurrence frequency in Table 4, IMERG-L was much closer to observed precipitation with the smallest biases and higher CC values for light rain and moderate rain. In contrast, although IMERG-F shows the highest CC value for heavy rain (with the largest CC value of 0.85 and 0.90 for Jongdari and Rumbia, respectively), it presents significant biases (with the largest Bias value of 49.20% and 138.55% for Jongdari and Rumbia, respectively) (Table 4). Therefore, the frequency of the hourly rain rate for IMERG-L is relatively closer to that of the observations than IMERG-F and IMERG-E.

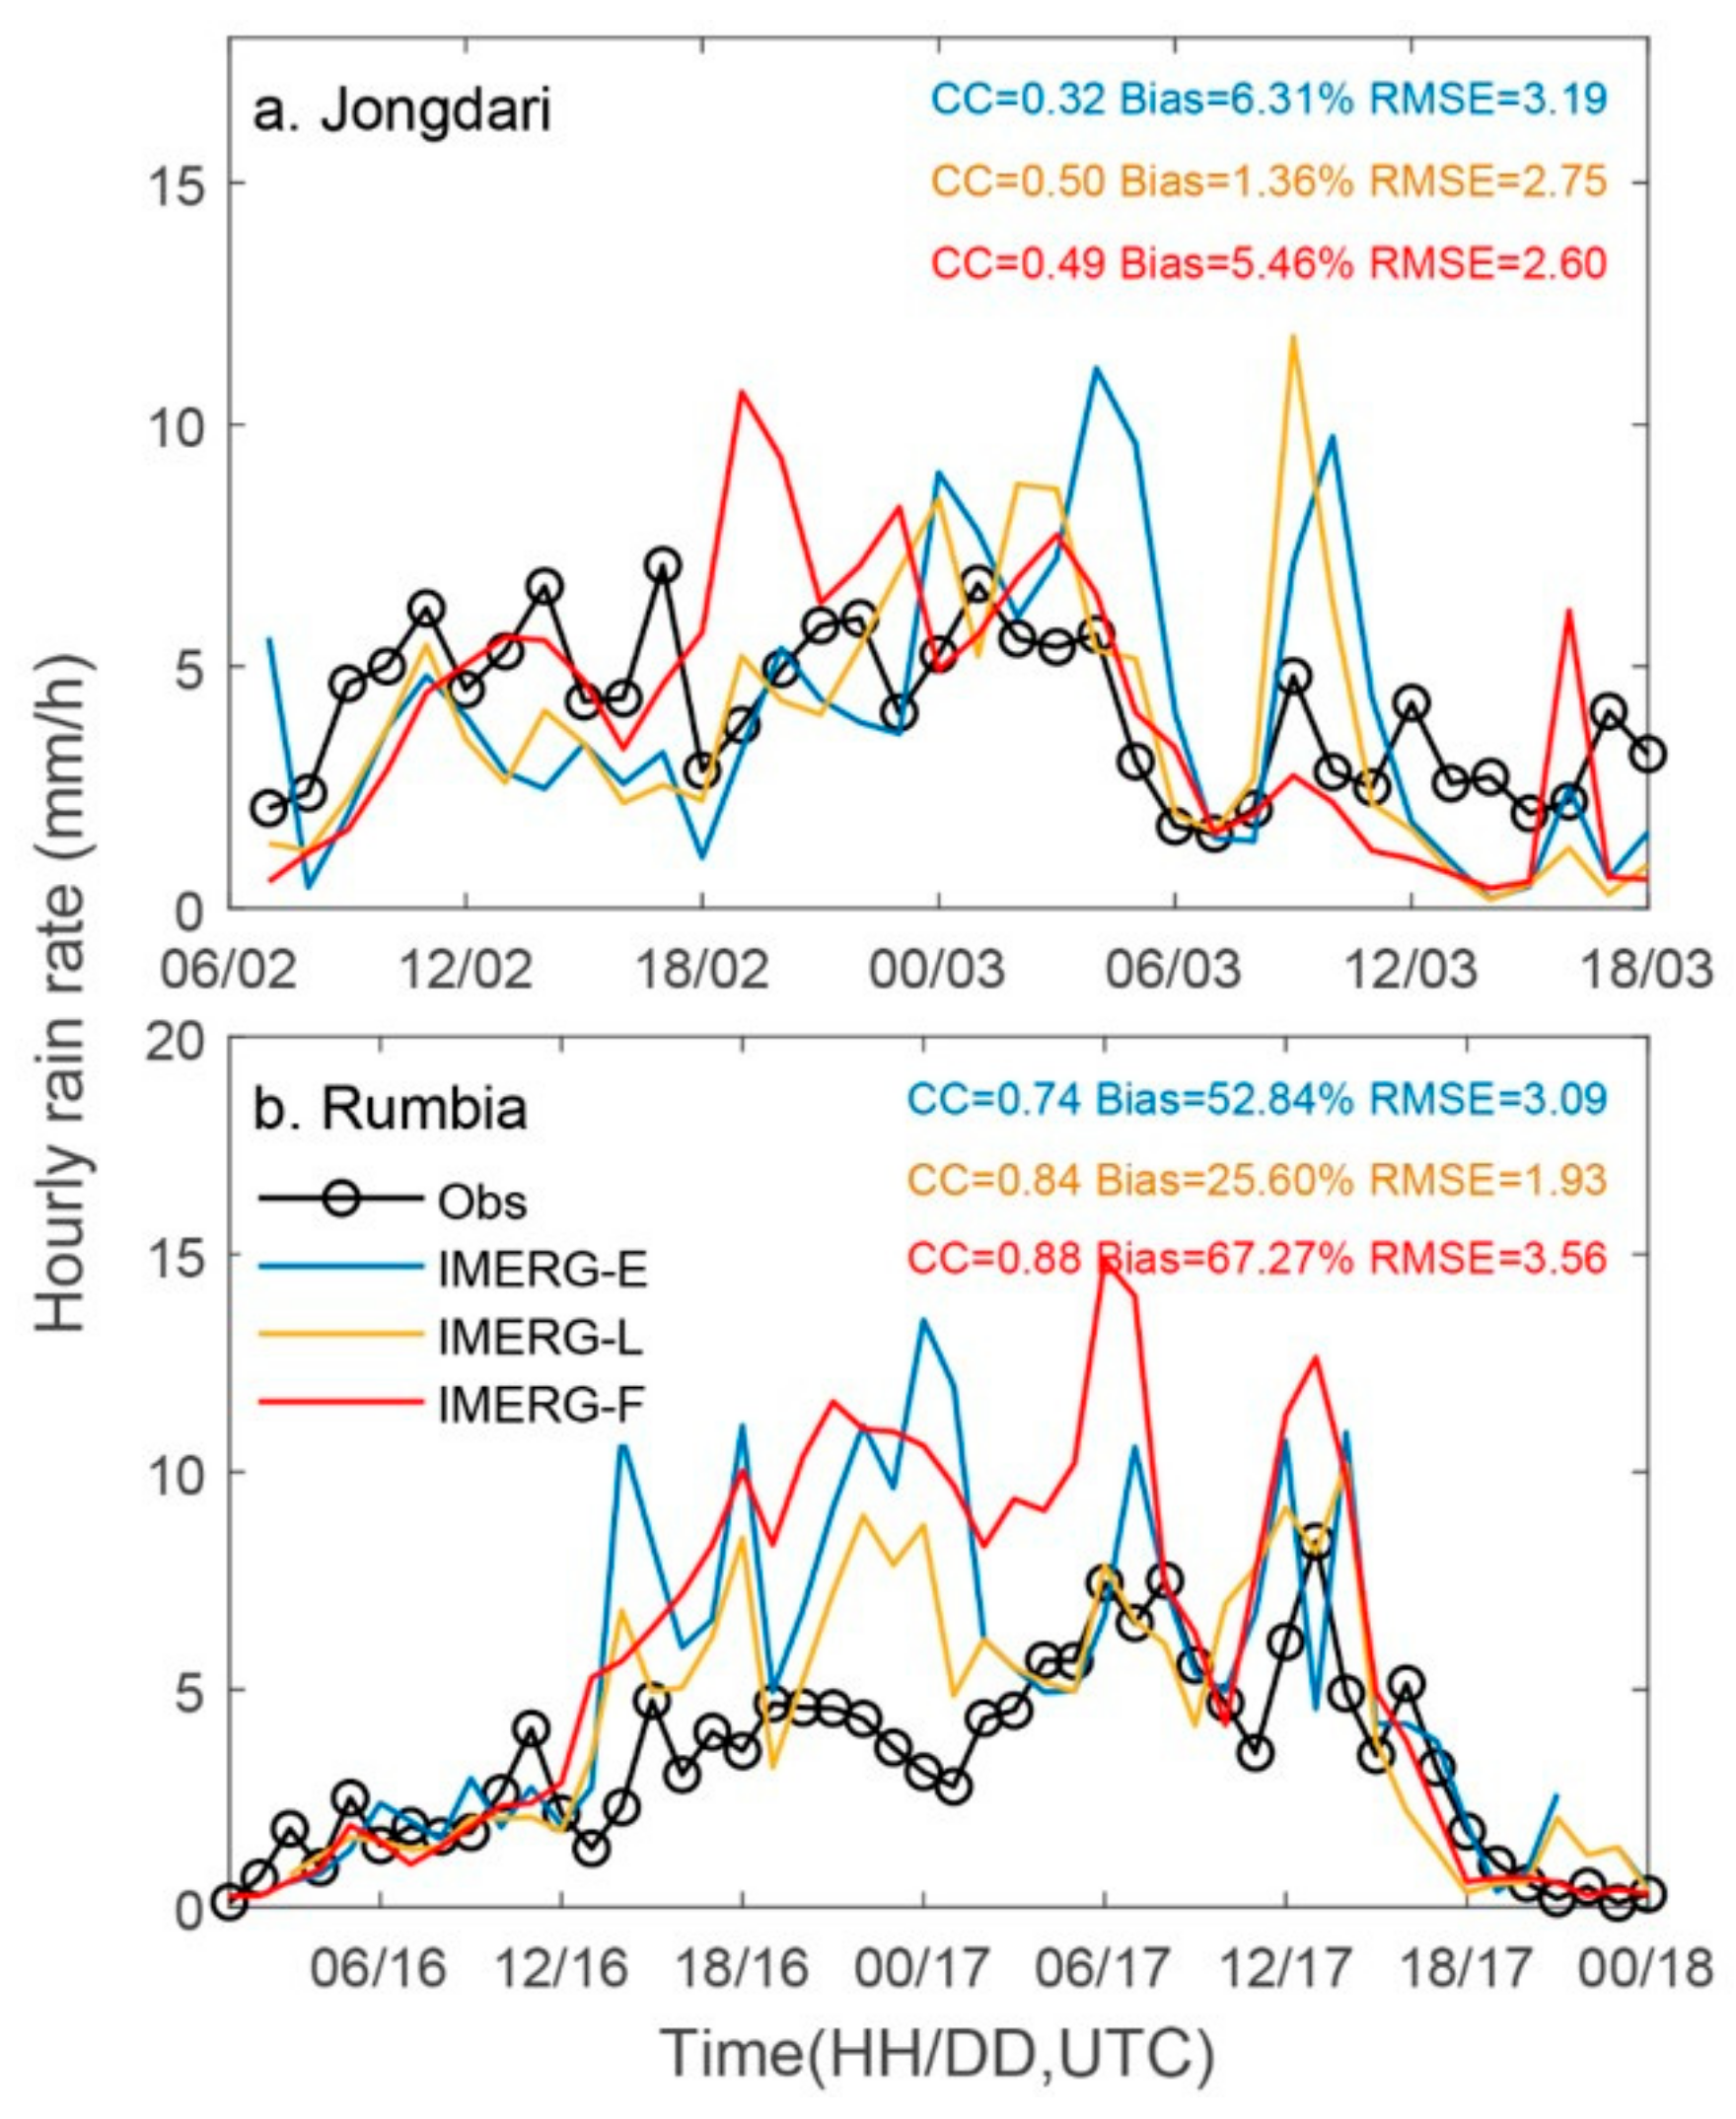
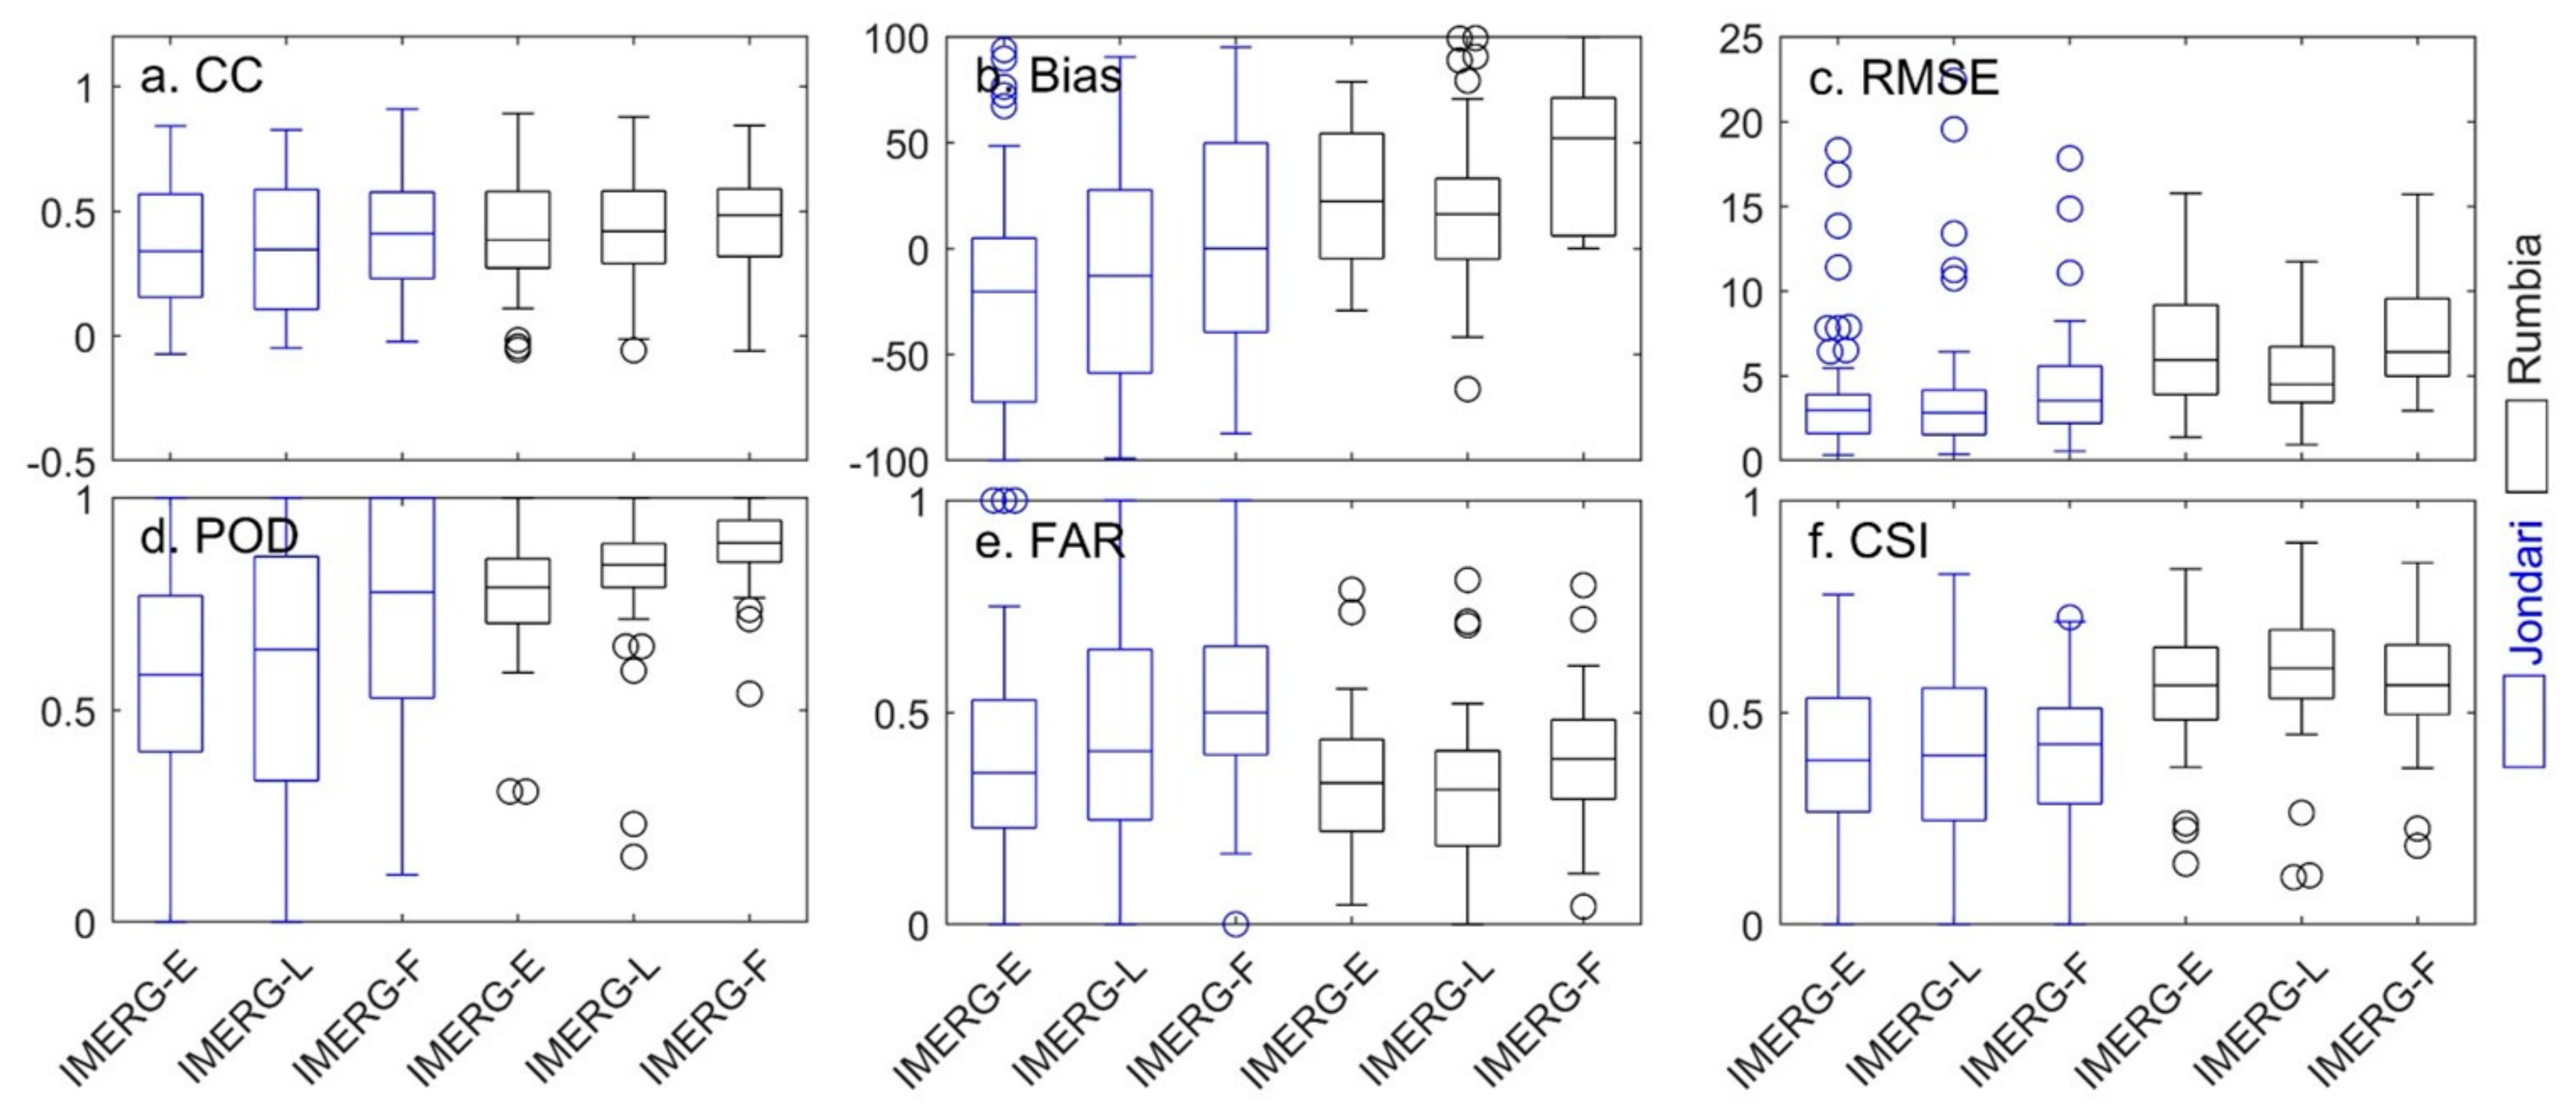
3.1.2. Evaluated the Deviation and Detection Capability in Hourly Scale at the Gauge Stations

Rainfall evaluates at IMERG products grid boxes with at least one observation gauge are compared with the observed precipitation value within the grid boxes. Figure 5 and Table 5 show CC, Bias, RMSE, POD, FAR, and CSI between grid boxes and observation over the YRD at hourly timescale. Among the IMERG precipitation products, IMERG-F precipitation exhibits the best performance with the highest CC of 0.42 and 0.45, the IMERG-L shows middle performance with CC of 0.35 and 0.43 for Jondari and Rmbia, respectively, while the IMERG-E presents the lowest performance with CC value of 0.35 and 0.40 for Jondari and Rmbia, respectively. This means that all IMERG precipitation products show better agreement with the observation at hourly timescale for TC heavy rainfall. However, IMERG-E and IMERG-F exhibit a higher Bias and RMSE value than the IMERG-L (Figure 5b,c). This finding indicates that the IMERG-E and IMERG-F tend to overestimate rainfall, while the opposite is true for the IMERG-L product. Therefore, we calculate that IMERG-L product with lower Bias (17.17% for Jongdari and 49.85% for Rumbia) and RMSE (4.08 mm for Jongdari and 5.20 mm for Rumbia) exhibits relatively better performance among the three IMERG products.
For the detection capability of the IMERG products, the statistical indices (POD, FAR, and CSI) for the point scale are shown in Figure 5. Among three IMERG products, IMERG-F shows better POD than IMERG-E and IMERG-L, which reveals that IMERG-F precipitation product performs better for detecting rainfall events. However, Higher FAR value at the IMERG-F can be found in Figure 5. This phenomenon reveals that IMERG-F product tends to overestimate the occurrence probability of rain events, whereas many of them are false alarm events (average FAR = 0.50 and 0.39 for Jondari and Rumbia, respectively). This may explain IMERG-F overestimation of accumulated precipitation compared with IMERG-E and IMERG-L in Figure 2, which is consistent with the findings of Tan et al. [23]. With respect to the IMERG-F, IMERG-L presents relatively higher POD (0.60 for Jondari and 0.83 for Rumbia) and lower FAR (0.45 for Jondari and 0.30 for Rumbia), indicating IMERG-L has a better capability of the rainfall detection with a CSI value of 0.40 for Jondari and 0.61 for Rumbia. Thus, IMERG-L is the optimal choice of precipitation products for rainfall event detection.

3.2. Evaluation of WRF Model with 4D-Var

3.2.1. Brief Analyzed the Assimilation Increment

In this section, IMERG-L has been utilized as data source for the assimilation experiment in the WRF model with 4D-Var. To identify the possible effect of 4D-Var assimilated IMERG-L precipitation the analysis increments (i.e., analysis minus the first guess) of zonal wind, meridional wind, surface pressure, potential temperature, surface dry air mass pressure, and specific humidity at the lowest model level are compared (Figure 6). The zonal wind maximum analysis increments are larger than ±10 m/s. The meridional wind maximum analysis increments are larger than ±20 m/s, the surface pressure and surface dry air mass pressure are larger than ±500 Pa. The potential temperature maximum analysis increments show obvious land-sea difference, while the specific humidity maximum analysis increments are small. Similarly, Lin et al. [38] investigated that a small precipitation assimilated by the WRFDA system did not substantially affect the magnitude of the WRF primary state variables, but significantly influenced the analysis rainfall. Thus, the 4D-Var algorithm was sensitive to assimilated rainfall observations. In this study, the 4D-Var assimilated IMERG-L precipitation substantially affects the magnitude of WRF model primary state variables. It can be concluded that the pattern of rainfall simulated by WRF is bound to change due to assimilated IMERG-L.

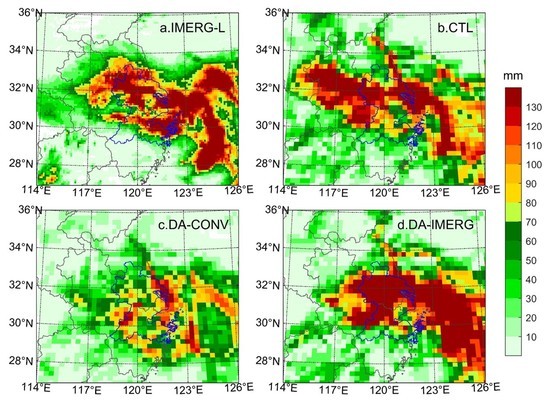
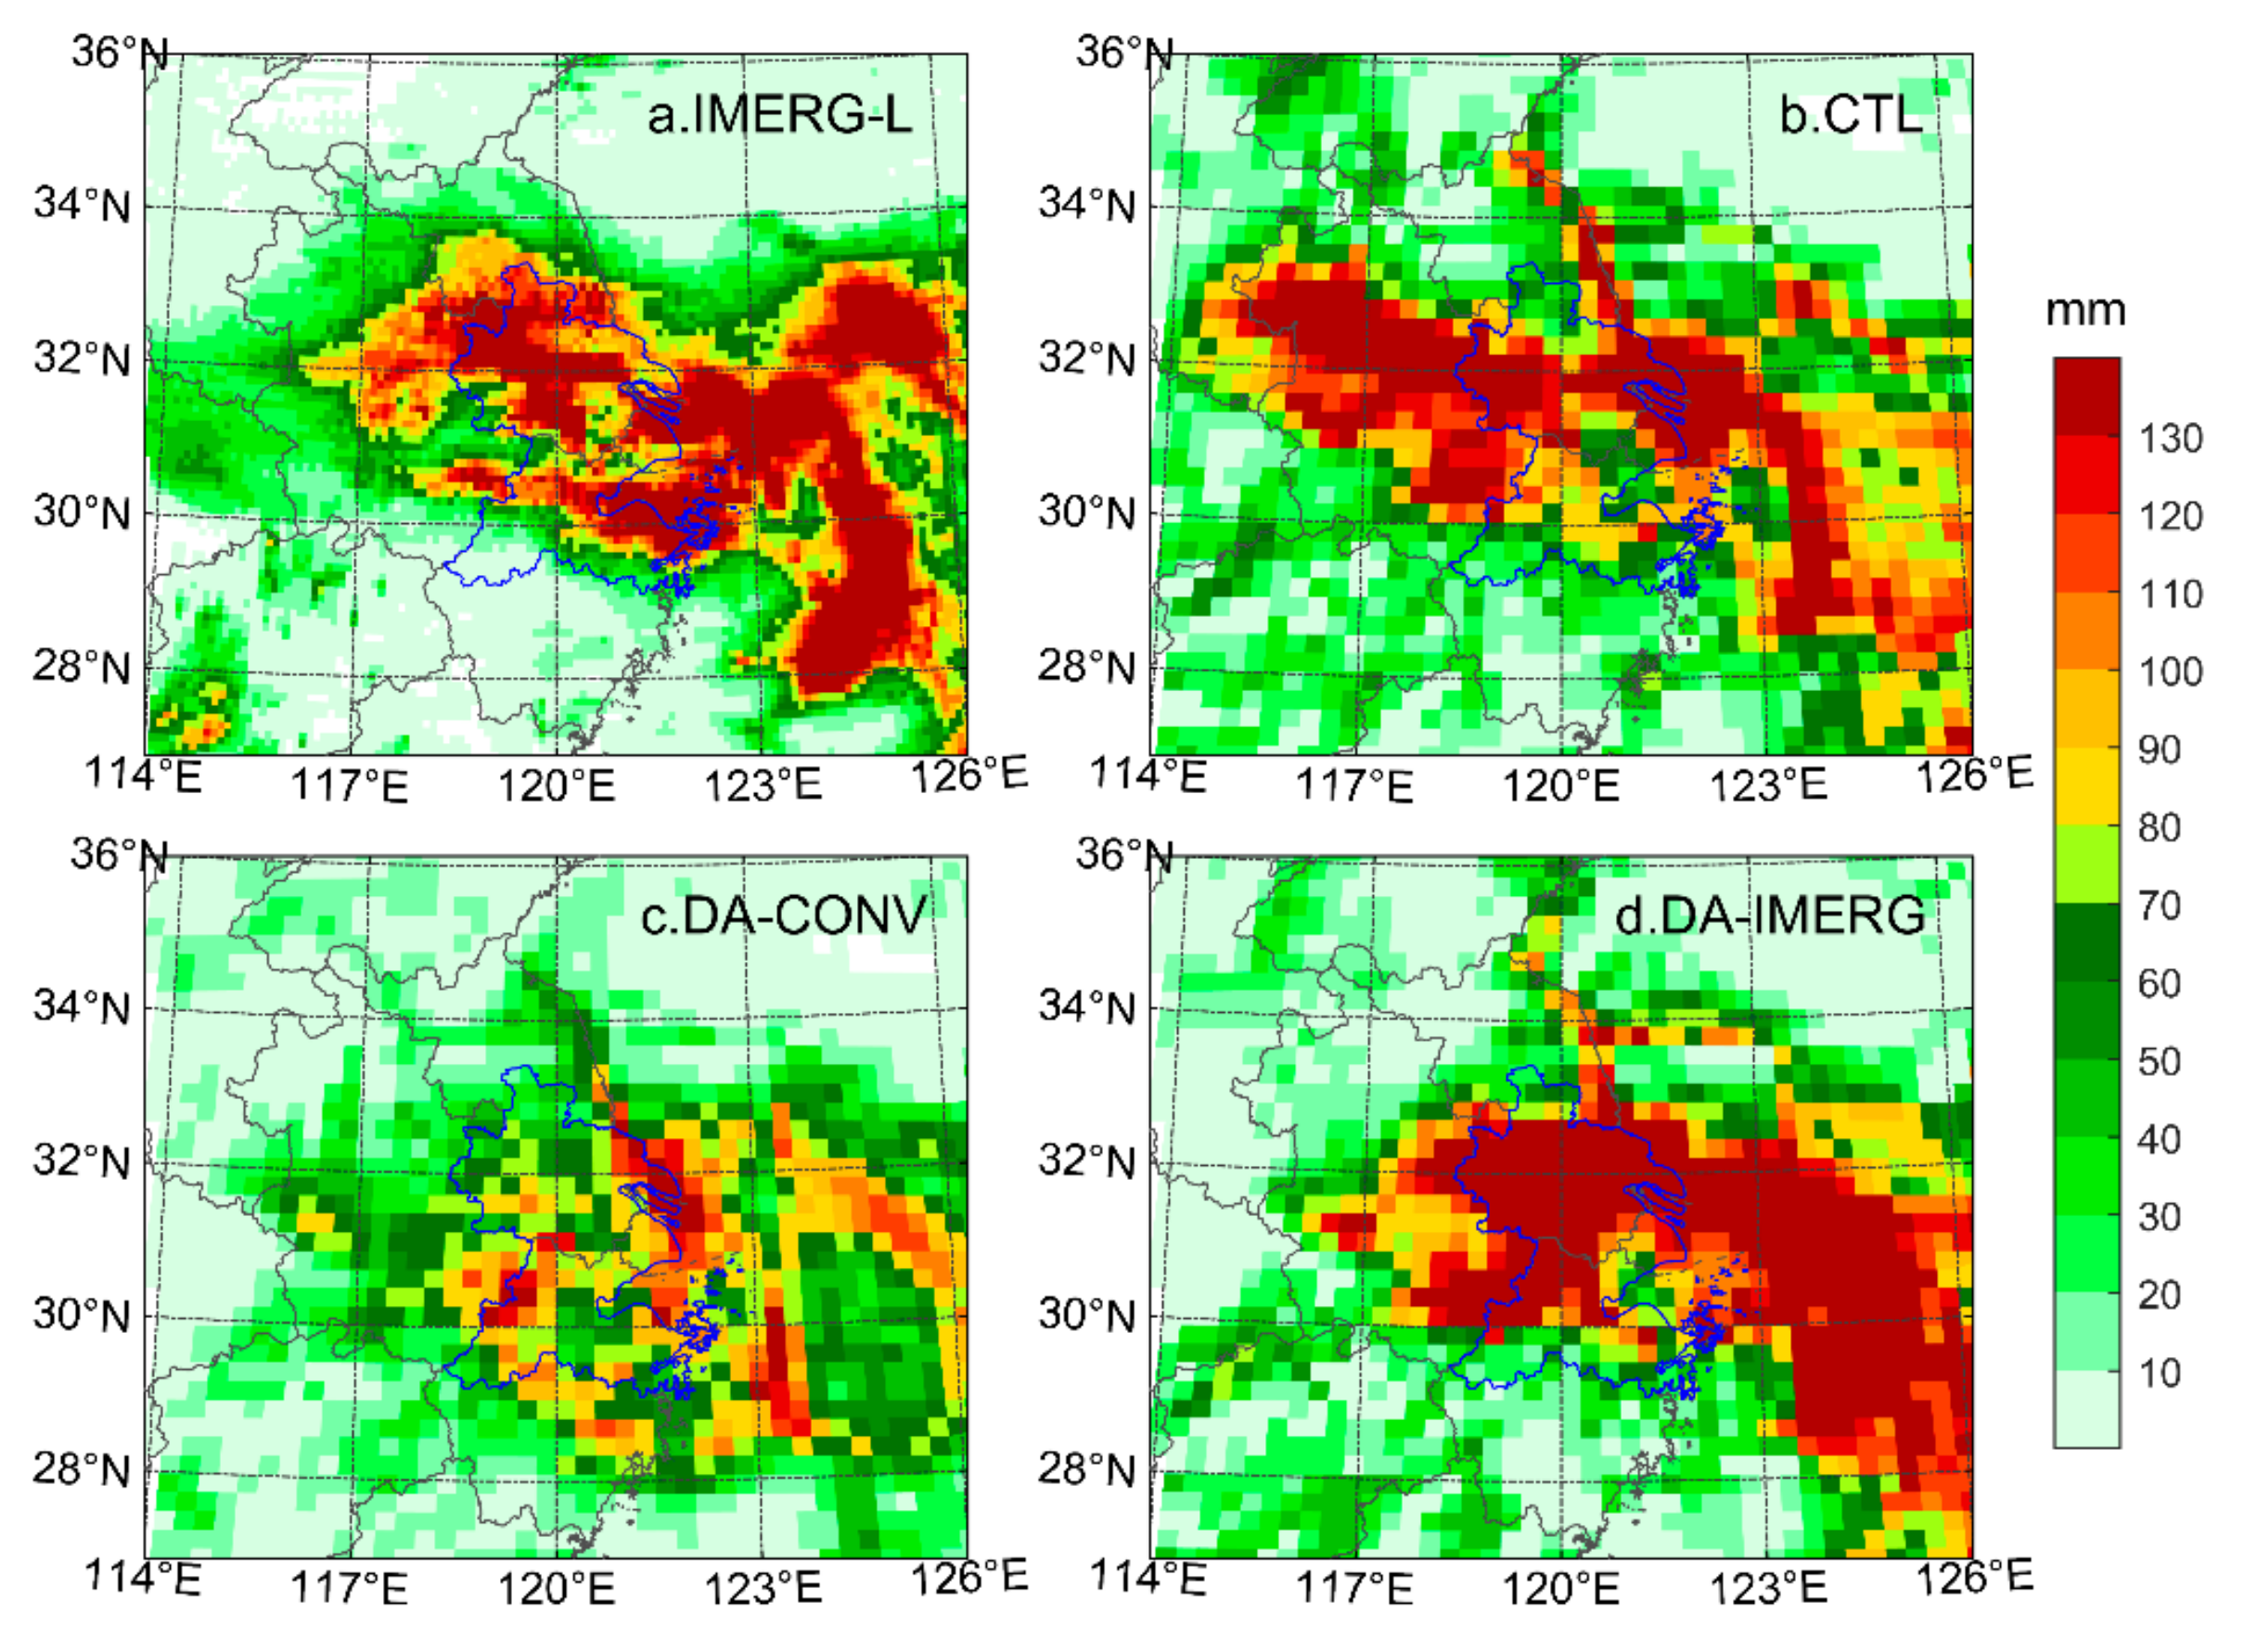
3.2.2. Temporal and Spatial Distribution of Precipitation

To better pinpoint the impact of the assimilated satellite precipitation with 4D-Var, we compared the spatial distribution of simulated precipitation from the IMERG-L, CTL experiment, DA-CONV experiment, and DA-IMERG experiment for TC Jondari and Rumbia. Figure 7 shows the accumulated rainfall from 0600 UTC 02 to 1800 UTC 03 August 2018 for TC Jondari. The IMERG-L precipitation has a heavy rainband in the center of the YRD (Figure 7a). CTL experiment is able to simulate the precipitation pattern compared with observed precipitation, but it fails in forecasting the precipitation core (Figure 7b). When compared to the CTL experiment, although the DA-CONV experiment improves the spatial pattern of heavy rain, it is still weaker than IMERG-L. Meanwhile, the position of precipitation core forecast by the DA-CONV experiment is apparently different from the IMERG-L (Figure 7c). For the DA-IMERG experiment, it further improves the forecast for the intensity of heavy rainband, whereas, the precipitation pattern extends western YRD. The precipitation core forecasted by the DA-IMERG experiment is farther north than in the IMERG-L (Figure 7d).
For TC Rumbia, the IMERG-L precipitation has a higher intensity and a larger spread than TC Jondari (Figure 8a). Among in three assimilated experiments, CTL, and DA-IMERG experiments capture the accumulated precipitation pattern, while the differences in the spatial distribution of those experiment are still remarkable. The CTL experiment shows a wider rainband in the west of YRD than DA-IMERG (Figure 8b). This indicates that DA-IMERG experiment assimilated IMERG-L satellite precipitation is quite effective and shows an evident positive impact on the accumulated precipitation forecasts. The cover area of heavy rain simulated by DA-IMERG experiment reduces in the western YRD, which is closer agreement with IMERG-L than DA-CONV (Figure 8d). In comparison with the IMERG-L, DA-CONV experiment obviously underestimates the accumulated precipitation (Figure 8c).
We further examine the evolution of the spatial pattern of precipitation, the 6 h accumulated precipitation from the IMERG-L, CTL, DA-CONV, and DA-IMERG for TC Rumbia are shown for comparison at three periods (Figure 9). At the three 6 h periods, the simulated precipitation in the DA-CONV is weaker than the IMERG-L. DA-CONV does not capture the vortex structure of the rainbands for the TC Rumbia. On the contrary, CTL and DA-IMERG experiments better captured the spatial distribution feature of the TC rainbands. This result shows that the 4D-Var assimilated conventional observation data has a negative impact on the forecast precipitation comparing with the CTL. Moreover, compared to Figure 9f,h, it can be seen that the position and intensity of the precipitation center for CTL and DA-IMERG show slightly different. The position of DA-IMERG experiment shows an eastward deviation, which is a reasonable reason for explaining the 4D-Var assimilated IMERG-L precipitation weaken the spatial distribution of heavy rainbands for TC Rumbia in the western YRD. Thus, DA-IMERG experiment shows an advantage for predicting the spatial distribution of TC heavy rain.

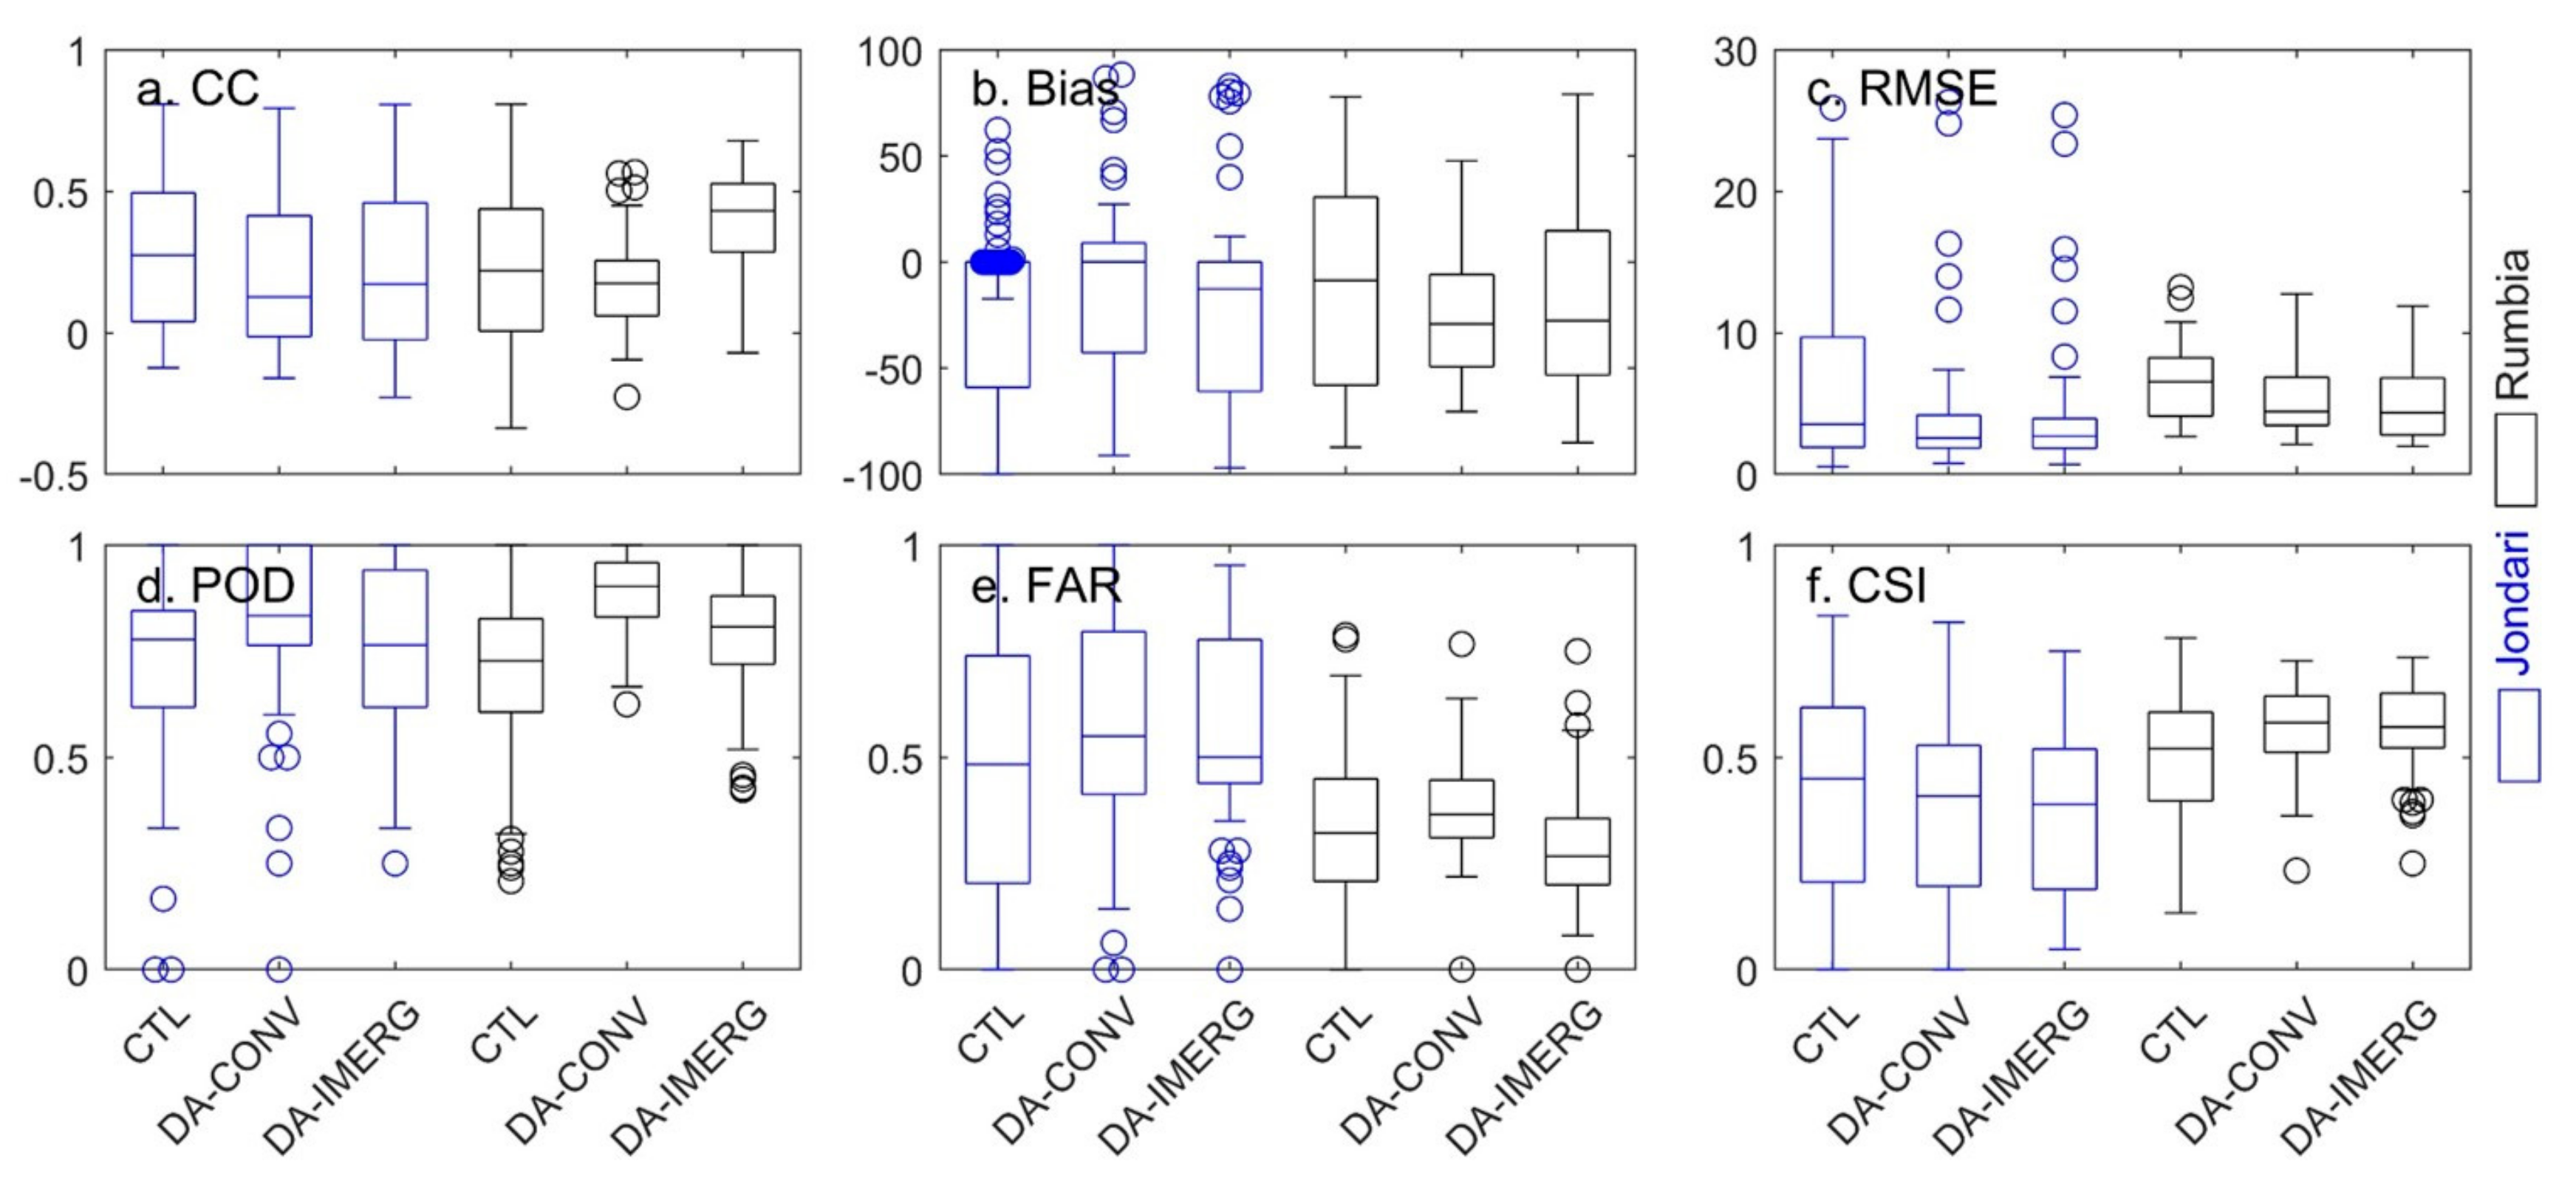
3.2.3. Statistical Performance of Assimilation Experiments at the Grid Scale

To evaluate the simulated precipitation of the TCL, DA-CONV, and DA-IMERG experiments against to IMERG-L, we calculated the CC, Bias, RMSE, POD, FAR, and CSI values. As shown in Figure 10, DA-CONV and DA-IMERG experiments obtain slightly lower CC values than the CTL experiment for TC Jondari. The averaged CC values for the CTL, DA-CONV, and DA-IMERG are 0.28, 0.21, and 0.20, respectively (Table 6). In terms of the systematic error, DA-CONV (averaged RMSE = 4.41 mm) and DA-IMERG (averaged RMSE = 4.32 mm) have slightly smaller errors than CTL with 5.92 mm. For the capability of the rainfall detection, the assimilation experiments improve the ability of detecting for rainfall events with a POD value of 0.60 for DA-CONV and 0.73 for DA-IMERG, but the FAR values are slightly higher than CTL. This suggests that the 4D-Var assimilated observation data into the WRF model improve the ability of forecasting precipitation, but overestimates the occurrence probability of rain events for TC Jondari. For TC Rumbia, the DA-IMERG shows higher CC value and lower Bias and RMSE values than TCL and DA-CONV experiments in Figure 10. This phenomenon is consistent with the results shown in Figure 8, which reconfirm that DA-IMERG has a slight advantage in simulating precipitation events for TCs. Moreover, the DA-CONV and DA-IMERG have a better CSI value (averaged 0.56 and 0.57 for the DA-CONV and DA-IMERG, respectively) than CTL with CSI value 0.49. Thus, we conclude that the detection capability of DA-IMERG experiment for TC Rumbia is better than that for TC Jondari at grid scale.

3.2.4. Evaluated of Rainfall Forecast Skill Scores

In the following section we evaluate the accuracy of the precipitation simulated by CTL, DA-CONV, and DA-IMERG used FSS within domain D2, whose main aim is to present the dependence of forecast quality on the spatial scale [39]. As delineated in Figure 11, the FSSs of the DA-IMERG experiment are superior to the CTL and DA-CONV. This phenomenon is due to assimilation experiments obviously changed the spatial distribution of the precipitation in Figure 7. Especially, the FSSs of the DA-CONV and DA-IMERG are better than CTL is the threshold of 10 mm/h. This result substantially indicated that the 4D-Var assimilated experiments improve the heavy rain forecast for the TC Jondari, which is consistent with similar results presented in the Figure 7. For TC Rumbia, The FSSs values of the DA-IMERG experiment show the best performance than CTL and DA-CONV in the threshold of 10 mm/h. It also shows in Figure 12 that the FSSs values of the DA-CONV experiment are lower than other experiments. This feature is consistent with the spatial distribution of the DA-CONV forecasted precipitation in Figure 8c, the DA-CONV experiment obviously underestimated the precipitation pattern. Overall, although the DA-IMERG experiment only assimilated the precipitation products into the WRF model, it substantially changed the initial conditions for the WRF model by the 4D-Var system and further improved the forecast for the temporal-spatial distribution of the heavy rain than the other experiments.
We also demonstrated the accuracy of the precipitation at different horizontal scales in Figure 13. For TC Jondari, the DA-IMERG shows the best performance, the differences between DA-IMERG and CTL and DA-CONV are more distinct when the hourly precipitation thresholds become higher. As shown in Figure 13d, the FSS is higher in DA-IMERG than in CTL and DA-CONV at the rainfall threshold of 10 mm/h. The FSS skill is the lowest at the grid scale (0.1 degree), as the size of the grid scale is increased; the FSS skills show an increasing trend until it is rapidly asymptoting to be stable at the grid sizes of 0.3 degree. For TC Rumbia, the skill of the CTL experiment performs better at the lower threshold, but it is considerably worse than DA-IMERG at the threshold of 10 mm/h. The DA-CONV generally provides a lower score relative to the others. Figure 13 also shows that the FSS skills of TC Rumbia increased with the spatial scale. After the horizontal scales exceeding 0.3 degree, the FSS skill increases further, but the trend of the forecasted precipitation is limited. This result suggests that the horizontal scale of the simulated precipitation at 0.3 degree performs slightly better for capturing the TC intense rains.

4. Discussion

Numerous existing studies evaluate the performance of satellite precipitation products. Most of the IMERG and TMPA assessment and comparison studies indicated the IMERG products were superior to its predecessor TRMM in the several regions in China, such as the eastern plain region [26], northwest arid area [24], mid-latitude humid basin [40], southwest hilly area [41], Tibetan Plateau [22], Yellow River source region [19], and the whole of China [20,25]. However, IMERG products have different applicability in different geographical conditions and climate conditions, which tend to exhibit relatively poor performance in complex areas, such as, high altitudes and arid regions [24,42]. In this study, we evaluated the IMERG products with gauge observations at the hourly timescale during the TC period over YRD. The performance of the IMERG precipitation products have better correlation (CC value ranging from 0.40 to 0.45) and higher detection capability (POD value ranging from 0.78 to 0.92) against to rain gauge observations at the hourly timescale. In addition, those satellite precipitation products tend to overestimate precipitation during the TC period, which is consistent with He et al. [41] and Xu et al. [26]. As shown in Figure 4, IMERG products underestimate light rain and overestimate heavy rain events associated with TC landfall. Similar results have also been revealed in Singapore [43]. This highlights the variability of satellite rainfall estimates for the TC rainfall evaluation. IMERG-F provides a relatively better estimated for light rain than IMERG-L and IMERG-E. The possible reason is that the IMERG-F calibrated by GPCC gauge data effectively improves the ability of detecting light rain events. However, IMERG-F exhibited the highest Bias and RMSE and the lowest detection capability with higher FAR values, especially in heavy rain conditions. By comparison, IMERG-L performs slightly better than the IMERG-F. This finding contrasts with Jiang et al. [40]. This result indicates that IMERG-L merged all possible satellite microwave precipitation is suitable for monitoring short-term regional precipitation during the TC period than IMERG-F.
The accurate prediction of timing, location, and intensity of the heavy rainfall events is a major challenge for the Numerical Weather Prediction (NWP). Especially in the tropics, NWP has limited skill in forecasting convective type precipitation. One of the major reasons for the lowest performance of NWP models in the convective precipitation forecast is due to its sensitivity towards initial conditions [44]. Although only precipitation data are assimilated, 4D-Var can spread the single observation information spatially, and the initial conditions of the WRF model can be adjusted by the model constraint [45]. Our results indicate that 4D-Var was sensitive to assimilating satellite rainfall observation. The initial conditions, including zonal wind, meridional wind, surface pressure, potential temperature, surface dry air mass pressure, and specific humidity, have been substantially changed by the 4D-Var system (Figure 6). The adjustments of the initial conditions play key roles in improving the precipitation forecasted for the TC. DA-IMERG experiment gives an improved heavy rain prediction over CTL after TC landfall at YRD. Such discrepancy of the precipitation forecasts is mainly ascribed to the differences in the initial field forecasting. Assimilating the IMERG-L precipitation data significantly changed the spatial distribution of humidity field and horizontal wind field (Figure 6). We suspect that changes in DA-IMERG are sufficiently effective not only in improving the accuracy of the WRF model but also advancing the detection capability of heavy rainfall events. These results are almost consistent with the results from Choi et al. [46], who also points to assimilating observation data for improved track and intensity forecasts of TC rainfall.
In summary, the simulated results provide strong justification that assimilation of IMERG-L precipitation product help to improve the accuracy and detection capability of the heavy precipitation systems. However, the 4D-Var experiment shows obvious deviation with the gauge observation data at hourly timescale for different TCs. In a future study, more precipitation products can be assimilated to understand the sensitivity of the 4D-Var model to precipitation products (e.g. Radar). Furthermore, more advanced DA methods (e.g., EnKF, hybrid) will be utilized for assimilating radar data and all-sky/clear-sky satellite radiances to improve precipitation forecasting. Besides, the effect of background error should consider in the later assimilation experiment, which also improves the forecast of the heavy rainfall system [47].

5. Conclusions

NWP models are widely used to provide short-term precipitation forecasts for real-time flood forecasting systems. Previous studies have assessed the suitability of Weather Research and Forecasting (WRF) for tropical cyclone (TC) prediction. In this study, we first examine the satellite precipitation product IMERG (IMERG-E, IMERG-L, and IMERG-F) against observations during a TC period in the Yangtze River Delta (YRD). We then compared the precipitation prediction between the CTL experiment (no assimilated) and the DA-CONV (assimilated conventional observation) and DA-IMERG (assimilated IMERG-L precipitation product). The conclusions are as follows:
(1) The spatial distributions and the amounts of the IMERG precipitation products are larger and wetter than the rain gauge observations. Among the IMERG precipitation products, the IMERG-L product shows a slight overestimation but has the best fit with the observation, which captured the spatial pattern and provided lower systematic bias (higher CC and the lowest Bias and RMSE) of precipitation than IMERG-E and IMERG-F for the landfalling TC precipitation at hourly timescale over YRD.
(2) Assimilating the IMERG-L product into the WRF model with the 4D-Var algorithm substantially affects the magnitude of the WRF model primary state variables, which certainly influences the intensity and distribution of TC heavy rain. Compared to the precipitation simulated by CTL and DA-CONV experiments, DA-IMERG experiment gives a reasonably spatial distribution of the heavy rain after TC landfall in the YRD.
(3) At the grid scale, DA-IMERG experiment further reduces the systematic error and improves the ability of forecasting precipitation than the CTL and DA-CONV experiments. At the spatial scale, DA-IMERG experiment with a higher FSS value in the threshold of 10 mm/h has a superior performance for the heavy rain forecast. The horizontal scale of the simulated precipitation at 0.3 degree performs better for capturing the TC intense rains. Therefore, the WRF assimilated the IMERG-L precipitation has a positive impact on the heavy rain forecast for the landfalling TC, although the improving efficiency of the 4D-Var algorithm is still comparatively limited.

Author Contributions

Conceptualization, J.W., Y.W. and Y.X.; methodology, J.W., L.Y. and Y.W.; software, J.W. and L.Y.; validation, J.W. and Q.W.; investigation, L.Y.; resources, J.W.; data curation, J.W. and Y.W.; writing—original draft preparation, J.W.; writing—review and editing, J.W., L.Y. and Y.W.; visualization, L.Y.; supervision, Y.X. and Y.W.; project administration, Y.X.; funding acquisition, Y.X. and Y.W.; investigation, J.Y.; software, J.W. and L.Y. All authors have read and agreed to the published version of the manuscript.

Funding

This study was funded in part by the Foundation items: National Natural Science Foundation of China (No. 41771032), the National Key Research and Development Program of China (No. 2018YFC1508201), the China Scholarship Council Grant (No. 201906190121), the Science and Technology Research Program of Chongqing Municipal Education Commission (No. KJQN201900513), the Foundation of Chongqing Norma University (No. 19XLB009), and Natural Science Foundation of Jiangsu Province (No. BK20190314).

Acknowledgments

We are very much indebted to the GPM science team for making IMERG precipitation products, and thankful to the Supercomputer Center in the Nanjing University for providing technical assistance.

Conflicts of Interest

The authors declare no conflict of interest.

Appendix A. The Method of WRF 4D-Var

The data assimilation system 4D-Var version 3.9.1, which is a variational assimilation system developed for the WRF model. The 4D-Var system employs incremental 4D-Var formulation with the arm of improving the reproductively of numerical weather simulations. The formulation of the 4D-Var system was been proposed by Huang et al. [13], who presented preliminary results from real-data 4D-Var experiments. The aim of 4D-Var is to find the optimal estimate of the true atmosphere state in the process of analyzing through iteratively minimizing a cost function J,
J = J b + J o + J c
where J b , J o , and J c denoted the background, observation, and balancing cost functions, respectively. J c is included in 4D-Var to remove high-frequency waves in the analysis state. The background cost function J b is given by:
J b = 1 2 x n x b T B 1 x n x b
where x n is the analysis vector of model prognostic variables at the nth outer loop, x b is the background. B is a covariance matrix for background error.
The observation cost function is
J o = 1 2 k = 1 k H k M k x n y k T R 1 H k M k x n y k 1 2 k = 1 k H k M k x n x n 1 d k T R 1 H k M k x n x n 1 d k
where K is the total number of observation windows. H is the linearized observation operator which is approximately transformed into a tangent linear observed operator. M k is the tangent linear model. x n denotes the guess vector, x n 1 is the analysis vector from the previous outer loop. d k is the innovation vector. R is the observation error covariance matrix. The detailed discussion on the theory of the 4D-Var can be found in Ban et al. [45].

References

  1. CRED. Natural Disasters 2018. Brussels: CRED. 2019. Available online: https://emdat.be/sites/default/fles/adsr_2018.pdf (accessed on 1 November 2019).
  2. Smith, J.A.; Villarini, G.; Baeck, M.L. Mixture distributions and the hydroclimatology of extreme rainfall and flooding in the eastern United States. J. Hydrometeorol. 2011, 12, 294–309. [Google Scholar] [CrossRef]
  3. Galvin, J.F.P. The development, track and destruction of Typhoon Haiyan. Weather 2015, 69, 307–309. [Google Scholar] [CrossRef]
  4. Lu, J.; Feng, T.; Li, J.; Cai, Z.; Xu, X.; Li, L.; Li, J. Impact of assimilating Himawari-8-Derived layered precipitable water with varying cumulus and microphysics parameterization schemes on the simulation of Typhoon Hato. J. Geophys. Res. Atmos. 2019, 124, 3050–3071. [Google Scholar] [CrossRef]
  5. Giorgi, F.; Gutowski, W.J. Regional dynamical downscaling and the CORDEX initiative. Annu. Rev. Environ. Resour. 2015, 40, 467–490. [Google Scholar] [CrossRef]
  6. Skamarock, W.C.; Klemp, J.B. A time-split nonhydrostatic atmospheric model for weather research and forecasting applications. J. Comput. Phys. 2008, 227, 3465–3485. [Google Scholar] [CrossRef]
  7. Mure-Ravaud, M.; Ishida, K.; Kavvas, M.L.; Yegorova, E.; Kanney, J. Numerical reconstruction of the intense precipitation and moisture transport fields for six tropical cyclones affecting the eastern United States. Sci. Total. Environ. 2019, 665, 1111–1124. [Google Scholar] [CrossRef]
  8. Bushair, M.T.; Kumar, P.; Gairola, R.M. Evaluation and assimilation of various satellite-derived rainfall products over India. Int. J. Remote Sens. 2019, 40, 5315–5338. [Google Scholar] [CrossRef]
  9. Lopez, P. Direct 4D-Var assimilation of NCEP Stage IV radar and gauge precipitation data at ECMWF. Mon. Weather Rev. 2011, 139, 2098–2116. [Google Scholar] [CrossRef]
  10. Barker, D.M.; Huang, W.; Guo, Y.; Bourgeois, A.J.; Xiao, Q.N. A three-dimensional variational data assimilation system for MM5: Implementation and initial results. Mon. Weather Rev. 2004, 132, 897–914. [Google Scholar] [CrossRef] [Green Version]
  11. Xiao, Q.; Kuo, Y.; Sun, J.; Lee, W.; Lim, E.; Guo, Y.; Barker, D.M. Assimilation of Doppler radar observations with a regional 3DVAR system: Impact of Doppler velocities on forecasts of a heavy rainfall case. J. Appl. Meteorol. Clim. 2005, 44, 768–788. [Google Scholar] [CrossRef]
  12. Zhang, S.Q.; Zupanski, M.; Hou, A.Y.; Lin, X.; Cheung, S.H. Assimilation of precipitation-affected radiances in a cloud-resolving WRF ensemble data assimilation system. Mon. Weather Rev. 2013, 141, 754–772. [Google Scholar] [CrossRef] [Green Version]
  13. Huang, X.; Xiao, Q.; Barker, D.M.; Zhang, X.; Michalakes, J.; Huang, W.; Henderson, T.; Bray, J.; Chen, Y.; Ma, Z.; et al. Four-dimensional variational data assimilation for WRF: Formulation and preliminary results. Mon. Weather Rev. 2009, 137, 299–314. [Google Scholar] [CrossRef] [Green Version]
  14. Tsuyuki, T. Variational data assimilation in the tropics using precipitation data part I: Column model. Meteorol. Atmos. Phys. 1996, 60, 87–104. [Google Scholar] [CrossRef]
  15. Koizumi, K.; Ishikawa, Y.; Tsuyuki, T. Assimilation of precipitation data to the JMA mesoscale model with a four-dimensional variational method and its impact on precipitation forecasts. Sola 2005, 1, 45–48. [Google Scholar] [CrossRef] [Green Version]
  16. Yi, L.; Zhang, W.; Wang, K. Evaluation of heavy precipitation simulated by the WRF model using 4D-Var data assimilation with TRMM 3B42 and GPM IMERG over the Huaihe River Basin, China. Remote Sens. 2018, 10, 646. [Google Scholar] [CrossRef] [Green Version]
  17. Rios Gaona, M.F.; Villarini, G.; Zhang, W.; Vecchi, G.A. The added value of IMERG in characterizing rainfall in tropical cyclones. Atmos. Res. 2018, 209, 95–102. [Google Scholar] [CrossRef] [Green Version]
  18. Huang, C.; Hu, J.; Chen, S.; Zhang, A.; Liang, Z.; Tong, X.; Xiao, L.; Min, C.; Zhang, Z. How well can IMERG products capture typhoon extreme precipitation events over southern China? Remote Sens. 2019, 11, 70. [Google Scholar] [CrossRef] [Green Version]
  19. Yuan, F.; Wang, B.; Shi, C.; Cui, W.; Zhao, C.; Liu, Y.; Ren, L.; Zhang, L.; Zhu, Y.; Chen, T.; et al. Evaluation of hydrological utility of IMERG Final run V05 and TMPA 3B42V7 satellite precipitation products in the Yellow River source region, China. J. Hydrol. 2018, 567, 696–711. [Google Scholar] [CrossRef]
  20. Chen, S.; Hong, Y.; Cao, Q.; Gourley, J.J.; Kirstetter, P.; Yong, B.; Tian, Y.; Zhang, Z.; Shen, Y.; Hu, J.; et al. Similarity and difference of the two successive V6 and V7 TRMM multisatellite precipitation analysis performance over China. J. Geophys. Res. Atmos. 2013, 118, 13060–13074. [Google Scholar] [CrossRef]
  21. Chen, C.; Chen, Q.; Duan, Z.; Zhang, J.; Mo, K.; Li, Z.; Tang, G. Multiscale comparative evaluation of the GPM IMERG v5 and TRMM 3B42 v7 precipitation products from 2015 to 2017 over a climate transition area of China. Remote Sens. 2018, 10, 944. [Google Scholar] [CrossRef] [Green Version]
  22. Lu, D.; Yong, B. Evaluation and hydrological utility of the latest GPM IMERG V5 and GSMaP V7 precipitation products over the Tibetan Plateau. Remote Sens. 2018, 10, 2022. [Google Scholar] [CrossRef] [Green Version]
  23. Tan, M.; Samat, N.; Chan, N.; Roy, R. Hydro-meteorological assessment of three GPM satellite precipitation products in the Kelantan River Basin, Malaysia. Remote Sens. 2018, 10, 1011. [Google Scholar] [CrossRef] [Green Version]
  24. Wang, X.; Ding, Y.; Zhao, C.; Wang, J. Similarities and improvements of GPM IMERG upon TRMM 3B42 precipitation product under complex topographic and climatic conditions over Hexi region, Northeastern Tibetan Plateau. Atmos. Res. 2019, 218, 347–363. [Google Scholar] [CrossRef]
  25. Wu, L.; Xu, Y.; Wang, S. Comparison of TMPA-3B42RT legacy product and the equivalent IMERG products over mainland China. Remote Sens. 2018, 10, 1778. [Google Scholar] [CrossRef] [Green Version]
  26. Xu, F.; Guo, B.; Ye, B.; Ye, Q.; Chen, H.; Ju, X.; Guo, J.; Wang, Z. Systematical evaluation of GPM IMERG and TRMM 3B42V7 precipitation products in the Huang-Huai-Hai Plain, China. Remote Sens. 2019, 11, 697. [Google Scholar] [CrossRef] [Green Version]
  27. Yuan, F.; Zhang, L.; Soe, K.; Ren, L.; Zhao, C.; Zhu, Y.; Jiang, S.; Liu, Y. Applications of TRMM- and GPM-Era multiple-satellite precipitation products for flood simulations at sub-daily scales in a sparsely gauged watershed in Myanmar. Remote Sens. 2019, 11, 140. [Google Scholar] [CrossRef] [Green Version]
  28. Zhang, S.; Wang, D.; Qin, Z.; Zheng, Y.; Guo, J. Assessment of the GPM and TRMM precipitation products using the rain gauge network over the Tibetan Plateau. J. Meteorol. Res. 2018, 32, 324–336. [Google Scholar] [CrossRef]
  29. Zhang, Z.; Tian, J.; Huang, Y.; Chen, X.; Chen, S.; Duan, Z. Hydrologic evaluation of TRMM and GPM IMERG satellite-based precipitation in a Humid Basin of China. Remote Sens. 2019, 11, 431. [Google Scholar] [CrossRef] [Green Version]
  30. Zhang, S.; Wang, J. Review of the Flood Control and Drought Relief in Jiangsu Province of China at 2018. China Flood Drought Manag. 2019, 1, 70–72. [Google Scholar]
  31. Han, L.; Xu, Y.; Yang, L.; Deng, X. Changing structure of precipitation evolution during 1957-2013 in Yangtze River Delta, China. Stoch. Environ. Res. Risk A 2015, 29, 2201–2212. [Google Scholar] [CrossRef]
  32. Huffman, G.J.; Bolvin, D.T.; Braithwaite, D.; Hsu, K.; Joyce, R.; Kidd, C.; Nelkin, E.J.; Xie, P.; Yoo, S.H. NASA Global Precipitation Measurement (GPM) Integrated Multi-Satellite Retrievals for GPM (IMERG), Algorithm Theoretical Basis Document (ATBD); NASA/GSFC: Greenbelt, MD, USA, 2018. Available online: https://pmm.nasa.gov/sites/default/files/document_files/IMERG_ATBD_V5.2_0.pdf (accessed on 1 November 2019).
  33. Karki, R.; Hasson, S.U.; Gerlitz, L.; Talchabhadel, R.; Schenk, E.; Schickhoff, U.; Scholten, T.; Böhner, J. WRF-based simulation of an extreme precipitation event over the Central Himalayas: Atmospheric mechanisms and their representation by microphysics parameterization schemes. Atmos. Res. 2018, 214, 21–35. [Google Scholar] [CrossRef]
  34. Cao, Q.; Yu, D.; Georgescu, M.; Wu, J. Impacts of urbanization on summer climate in China: An assessment with coupled land-atmospheric modeling. J. Geophys. Res. Atmos. 2016, 121, 10505–10521. [Google Scholar] [CrossRef]
  35. Yu, Z.; Ji, C.; Xu, J.; Bao, S.; Qiu, J. Numerical simulation and analysis of the Yangtze River Delta rainstorm on 8 October 2013 caused by binary typhoons. Atmos. Res. 2015, 166, 33–48. [Google Scholar] [CrossRef]
  36. Zhong, S.; Qian, Y.; Zhao, C.; Leung, R.; Wang, H.; Yang, B.; Fan, J.; Yan, H.; Yang, X.; Liu, D. Urbanization-induced urban heat island and aerosol effects on climate extremes in the Yangtze River Delta region of China. Atmos. Chem. Phys. 2017, 17, 5439–5457. [Google Scholar] [CrossRef] [Green Version]
  37. Argüeso, D.; Hidalgo-Muñoz, J.M.; Gámiz-Fortis, S.R.; Esteban-Parra, M.J.; Castro-Díez, Y. High-resolution projections of mean and extreme precipitation over Spain using the WRF model (2070–2099 vs. 1970–1999). J. Geophys. Res. Atmos. 2012, 117. [Google Scholar] [CrossRef] [Green Version]
  38. Lin, L.; Ebtehaj, A.M.; Bras, R.L.; Flores, A.N.; Wang, J. Dynamical precipitation downscaling for hydrologic applications using WRF 4D-Var data assimilation: Implications for GPM Era. J. Hydrometeorol. 2015, 16, 811–829. [Google Scholar] [CrossRef] [Green Version]
  39. Roberts, N.M.; Lean, H.W. Scale-Selective Verification of Rainfall Accumulations from High-Resolution Forecasts of Convective Events. Mon. Weather Rev. 2008, 136, 78–97. [Google Scholar] [CrossRef]
  40. Jiang, S.; Ren, L.; Xu, C.; Yong, B.; Yuan, F.; Liu, Y.; Yang, X.; Zeng, X. Statistical and hydrological evaluation of the latest Integrated Multi-satellitE Retrievals for GPM (IMERG) over a midlatitude humid basin in South China. Atmos. Res. 2018, 214, 418–429. [Google Scholar] [CrossRef]
  41. He, Z.; Yang, L.; Tian, F.; Ni, G.; Hou, A.; Lu, H. Intercomparisons of rainfall estimates from TRMM and GPM multisatellite products over the upper Mekong River Basin. J. Hydrometeorol. 2017, 18, 413–430. [Google Scholar] [CrossRef]
  42. Satgé, F.; Xavier, A.; Pillco Zolá, R.; Hussain, Y.; Timouk, F.; Garnier, J.; Bonnet, M. Comparative assessments of the latest GPM mission’s spatially enhanced satellite rainfall products over the main Bolivian Watersheds. Remote Sens. 2017, 9, 369. [Google Scholar] [CrossRef] [Green Version]
  43. Tan, M.; Ibrahim, A.; Duan, Z.; Cracknell, A.; Chaplot, V. Evaluation of six high-resolution satellite and ground-based precipitation products over Malaysia. Remote Sens. 2015, 7, 1504–1528. [Google Scholar] [CrossRef] [Green Version]
  44. Thiruvengadam, P.; Indu, J.; Ghosh, S. Assimilation of Doppler weather radar data with a regional WRF-3DVAR system: Impact of control variables on forecasts of a heavy rainfall case. Adv. Water Resour. 2019, 126, 24–39. [Google Scholar] [CrossRef]
  45. Ban, J.; Liu, Z.; Zhang, X.; Huang, X.; Wang, H. Precipitation data assimilation in WRFDA 4D-Var: Implementation and application to convection-permitting forecasts over United States. Tellus A 2017, 69, 1368310. [Google Scholar] [CrossRef] [Green Version]
  46. Choi, Y.; Cha, D.H.; Lee, M.I.; Kim, J.; Jin, C.S.; Park, S.H.; Joh, M.S. Satellite radiance data assimilation for binary tropical cyclone cases over the western North Pacific. J. Adv. Model Earth Syst. 2017, 9, 832–853. [Google Scholar] [CrossRef] [Green Version]
  47. Wang, Y.; Chen, Y.; Min, J. Impact of Assimilating China Precipitation Analysis Data Merging with Remote Sensing Products Using the 4DVar Method on the Prediction of Heavy Rainfall. Remote Sens. 2019, 11, 973. [Google Scholar] [CrossRef] [Green Version]
Figure 1. The location of the Yangtze River Delta region and rain gauges. Black dots represent the locations of the gauge stations. Black squares in the right figure represent the IMERG products gridboxs nearest gauge station. The blue and black lines represent the best track of Jondari and Rumbia with 6h interval, respectively. Track data is obtained from IBTrACS (ftp://eclipse.ncdc.noaa.gov/pub/ibtracs/v04r00/provisional/csv/).
Remotesensing 12 00276 g001
Figure 2. Spatial distribution of accumulated precipitation from IMERG: (ac) for TC Jondari during 0600 UTC 02 to 1800 UTC 03 August 2018; (df) for TC Rumbia during 0400 UTC to 1400 UTC 17 August 2018. Each dot represents an observed accumulation precipitation during TC landfalling.
Remotesensing 12 00276 g002
Figure 3. Temporal distribution of hourly rain rate over Yangtze River Delta (YRD).
Remotesensing 12 00276 g003
Figure 4. Temporal distribution of hourly frequency accumulation for: (a,d) light rain (0.1 ≤ R < 2.5 mm) (b,e) moderate rain (2.5 ≤ R < 8 mm), and (c,f) heavy rain (R ≥ 8 mm) over YRD.
Remotesensing 12 00276 g004
Figure 5. Box plots of the statistical indices of IMERG at an hourly scale versus the gauge observations over YRD.
Remotesensing 12 00276 g005
Figure 6. The increments of several variables at the lowest model level from 4D-Var assimilated 6h accumulated precipitation of IMERG-L at 0600 UTC 16 Aug 2018 for TC Rumbia: (a) zonal wind (m/s), (b) meridional wind (m/s), (c) surface pressure (Pa), (d) potential temperature (K), (e) surface dry air mass pressure (Pa), and (f) specific humidity (kg/kg).
Remotesensing 12 00276 g006
Figure 7. Precipitation accumulation of IMERG-L (a), CTL experiment (b), DA-CONV experiment (c), and DA-IMERG experiment (d) for TC Jondari during 0600 UTC 02 to 1800 UTC 3 August 2018.
Remotesensing 12 00276 g007
Figure 8. Precipitation accumulation of IMERG-L (a), CTL experiment (b), DA-CONV experiment (c), and DA-IMERG experiment (d) for TC Rumbia during 0000 UTC 16 to 1800 UTC 17 August 2018.
Remotesensing 12 00276 g008
Figure 9. Spatial distribution of 6 h accumulated precipitation (mm) for: (a,e,i) IMERG, (b,f,j) CTL, (c,g,k) DA-CONV, and (d,h,l) DA-IMERG.
Remotesensing 12 00276 g009
Figure 10. Boxplots of statistical indices of CC (a), Bias (b), RMSE (c), POD (d), FAR (e), and CSI (f) for the CTL, DA-CONV, and DA-IMERG.
Remotesensing 12 00276 g010
Figure 11. Fractions skill scores for the hourly precipitation threshold of (a) 1.0 mm/h, (b) 2.5 mm/h, (c) 5.0 mm/h, and (d) 10 mm/h at grid scale in the domain D2 for the TC Jondari. The precipitation observation used in the score is from the IMERG-L.
Remotesensing 12 00276 g011
Figure 12. Fractions skill scores for the hourly precipitation threshold of (a) 1.0 mm/h, (b) 2.5 mm/h, (c) 5.0 mm/h, and (d) 10 mm/h at grid scale in the domain D2 for the TC Rumbia. The precipitation observation used in the score is from the IMERG-L.
Remotesensing 12 00276 g012
Figure 13. The aggregated fractions skill scores for hourly precipitation threshold of (a,e) 1.0 mm/h, (b,f) 2.5 mm/h, (c,g) 5.0 mm/h, and (d,h) 10 mm/h at different horizontal scales.
Remotesensing 12 00276 g013
Table 1. Overview of the WRF model configuration.
ConfigurationOuter DomainInner Domain
Model VersionVersion 3.9.1
Horizontal grid90 × 9076 × 76
Grid spacing (km)279
Vertical grids38 layer/Top 50hPa
Time step (s)6030
MicrophysicsMorrison two-moment scheme
Longwave radiationRRTMG scheme
Shortwave radiation
Surface layerMonin–Obukhov scheme
Land-surface processNoah land-surface model
Planetary boundary layer processMellor–Yamada–Jajic TKE scheme
Cumulus schemeKain–Fritsch (KF)
Table 2. Brief description of experiment design.
ExperimentAnalysis TimeAssimliation Data
JongdariRumbia
CTL0000 UTC 02 to 1800 UTC 03 August1800 UTC 15 to 0000 UTC 18 AugustNo
DA-CONV0600 UTC 02 to 1800 UTC 03 August0000 UTC 16 to 0000 UTC 18 AugustSurface and upper air observations
DA-IMERG0600 UTC 02 to 1800 UTC 03 August0000 UTC 16 to 0000 UTC 18 AugustIMERG-L
Table 3. Statistical indices for evaluating IMERG and WRF precipitation.
Statistical IndicesUnitEquationTarget Value
Correlation coefficient (CC)None C C = i = 1 n S i S ¯ G i G ¯ 2 i = 1 n S i S ¯ 2 i = 1 n G i G ¯ 2 1
Relative bias (Bias)None B i a s = i = 1 n S i G i i = 1 n G i 0
Root-mean-square error (RMSE)mm R M S E = 1 n i = 1 n S i G i 2 0
Probability of detection (POD)None P O D = a a + c 1
False alarm ratio (FAR)None F A R = b a + b 0
Critical success index (CSI)None C S I = a a + b + c 1
Fractions skill score (FSS)None F S S = 1 M S E n M S E n r e f
M S E n = 1 N x N y i = 1 N x j = 1 N y O n i , j M n i , j 2
M S E n r e f = 1 N x N y i = 1 N x j = 1 N y O n i , j 2 + i = 1 N x j = 1 N y M n i , j 2
1
Where n is the total number of gauge, satellite or WRF precipitation data. i is the index of gauge, satellite or WRF precipitation number. G i , S i are gauge observation precipitation and the satellite or WRF precipitation. G ¯ , S ¯ are the mean precipitation of observation precipitation and the satellite or WRF precipitation. a denoted the precipitation events that ware detected by satellite and gauge. b represents the precipitation events that were captured by satellite but missed by observed. c indicated the precipitation events missed by satellite but captured by the gauge. N x and N y are the number of columns and rows in the verification domain respectively. O and M are observed and simulated are fractions within verification domain that contains values exceeding a threshold respectively.
Table 4. Statistical metrics of satellite rainfall products for frequency at different intensities within the YRD. Bias, RMSE, and CC represent mean bias, root mean square error, and correlation coefficient, respectively.
JongdariRumbia
IMERG-EIMERG-LIMERG-FIMERG-EIMERG-LIMERG-F
CCR < 2.50.560.590.520.410.830.81
2.5 ≤ R < 80.750.680.790.550.890.89
R ≥ 80.780.830.850.180.800.90
Bias(%)R < 2.5−27.82−25.9713.91−13.3714.4562.55
2.5 ≤ R < 811.0621.2822.55−8.4021.5829.45
R ≥ 8−18.18−16.5849.2012.0317.82138.55
RMSE(mm)R < 2.510.279.9011.2313.245.717.39
2.5 ≤ R < 84.254.824.0711.785.864.32
R ≥ 83.303.065.7915.786.0512.2
Table 5. Statistical indices of mean hourly precipitation from IMERG over YRD.
CCBias (%)RMSE (mm)PODFARCSI
JondariIMERG-E0.357.123.930.560.410.38
IMERG-L0.3517.174.080.600.450.40
IMERG-F0.4246.434.320.730.500.41
RumbiaIMERG-E0.4082.386.650.780.310.58
IMERG-L0.4349.855.200.830.300.61
IMERG-F0.45135.117.520.920.390.58
Table 6. Statistical indices of mean hourly precipitation for the CTL, DA-CONV, and DA-IMERG.
CCBias (%)RMSE (mm)PODFARCSI
JondariCTL0.283.735.920.710.470.42
DA-CONV0.2115.884.410.810.570.39
DA-IMERG0.20−4.814.320.730.580.36
RumbiaCTL0.2325.296.440.690.350.49
DA-CONV0.18−19.255.440.890.390.56
DA-IMERG0.41−13.845.090.780.300.57

