1. Introduction
With the development of space technologies, Global Navigation Satellite Systems (GNSSs) have been widely applied in various applications and have been playing an extremely important role in many fields [
1,
2,
3]. In a GNSS, GNSS navigation satellites need to be widely distributed and used as radiation sources. Among existing GNSSs [
4,
5,
6,
7], Global Positioning System (GPS) has been broadly recognized and acknowledged as an advanced and mature technology in target detection due to its wider coverage and shorter observation time compared to other GNSSs, such as the Beidou satellite system [
8] and Golbal navigation satellite system (GLONASS). Generally, target detection is conducted using a single GPS as the radiation source [
9]. However, due to the widely deployed GNSSs, a GPS satellite signal receiver will inevitably receive multiple GPS signals, causing signal contamination and the failure of echo signal detection. Hence, instead of relying on only a single GPS satellite radiation source, effective weak echo signal detection methods using multiple GPS satellite radiation sources need to be studied.
Due to the benefits of global coverage, 24-h operation, and easy-to-access signal sources, GPS navigation satellite signals will be employed as third-party illumination sources to study GPS-based external radiation source target detection methods in this paper. For weak echoes of GPS satellites, many researchers have made preliminary explorations [
10,
11,
12,
13,
14]. These works focus on studying the detection of a single GPS satellite signal. In fact, different GPS satellites in the zenith may share the same frequency bands to send GPS signals. On the other hand, a near-Earth orbit target may be simultaneously covered by multiple satellite beams. As a result, reference signals transmitted on reference channels may be contaminated by other unexpected GPS signals [
15], which makes the estimation of reference signals very difficult. In addition, interference caused by other GPS signals may degrade the performance of direct-path interference (DPI)/multi-path interference (MPI) suppression and the subsequent echo detection on an echo channel [
16]. For effective echo detection, multiple GPS signals received on the reference channels and the DPI/MPI on monitoring channels should be purified and suppressed.
On the other hand, the received power of GPS signals is very low due to a long-distance propagation [
17,
18]. Furthermore, the signals after the target reflection, also referred to as the target echo, would be even weaker. Even under the condition that the clutter and interference suppression could be realized, the extremely weak GPS echo still needs a long coherent accumulation time to be detected. In order to improve the detection probability of the target echo, the existing methods improved the detection performance by constructing a multi-station joint detection system and merging the detection results of multiple radiation sources [
19,
20,
21]. Unfortunately, the signal processing methods introduced in these works are not suitable for GPS signals. Therefore, effective use of the received multiple GPS signals to construct a joint detection system with high signal-to-noise ratio (SNR) is an important technical problem that has to be tackled.
The main contributions of this paper can be summarized as follows. A GPS weak echo signal detection method is proposed based on multi-star data fusion. To be specific, under the condition of multiple satellite sources, multiple reference signals will be mixed into a reference channel, resulting in degrading the DPI and MPI suppression effects on a monitoring channel. Therefore, firstly, the proposed method separates and reconstructs multiple GPS reference signals on the reference channel, based on which the Extensive Cancellation Algorithm (ECA) is used to monitor and suppress DPI and MPI. Then, to address the problem of the weak target reflection echo, which is very difficult to be detected, a coordinate conversion algorithm is applied to fuse detection statistics of multiple GPS satellites and obtain a final detection statistic. By this way, the peak value of weak echo detections and the probability of weak echo detections could be improved. Finally, by defining an adaptive detection threshold, the weak echo could be adaptively detected.
The reminder of this paper is organized as follows. In
Section 2, the system model under multiple GPS satellite radiation sources is presented. A novel method of joint target detection is proposed and the corresponding technical details are described in the third
Section 3, including the separation and reconstruction of direct wave in a reference channel, the suppression of direct and multi-path interference in a monitoring channel, and the construction of detection quantity and the design of detector. In the
Section 4, the extensive simulation studies are conducted.
2. System Model
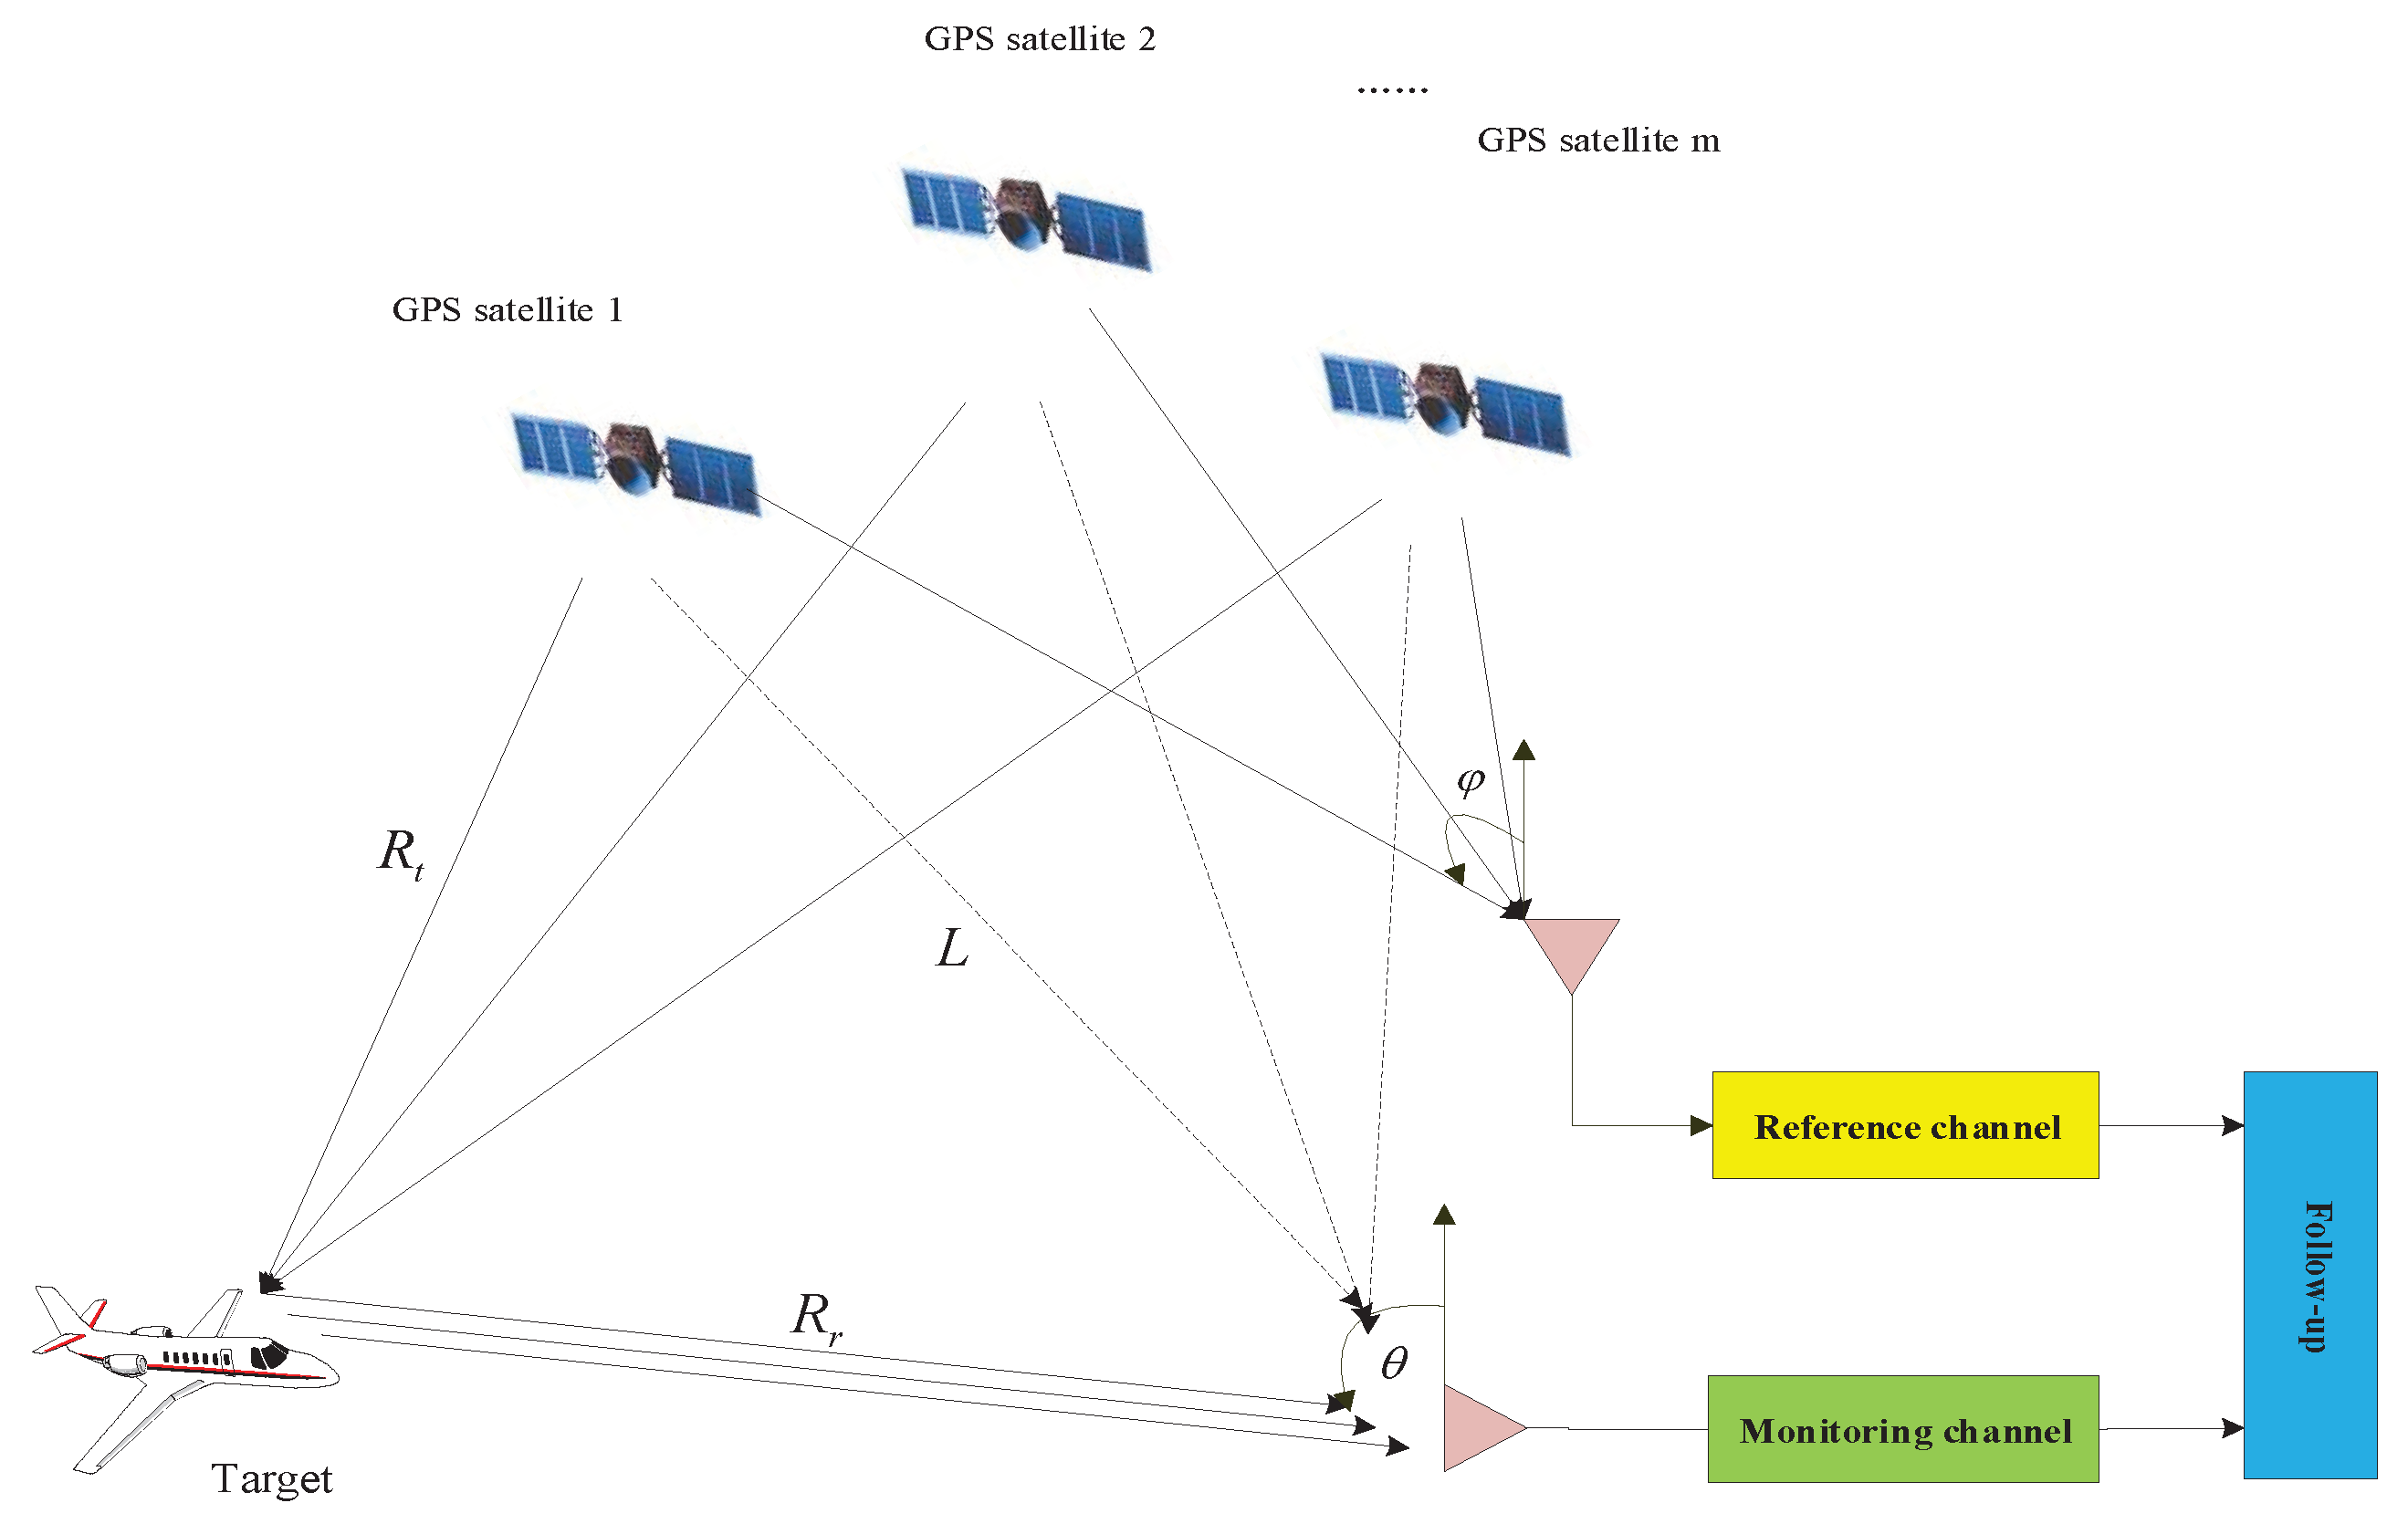
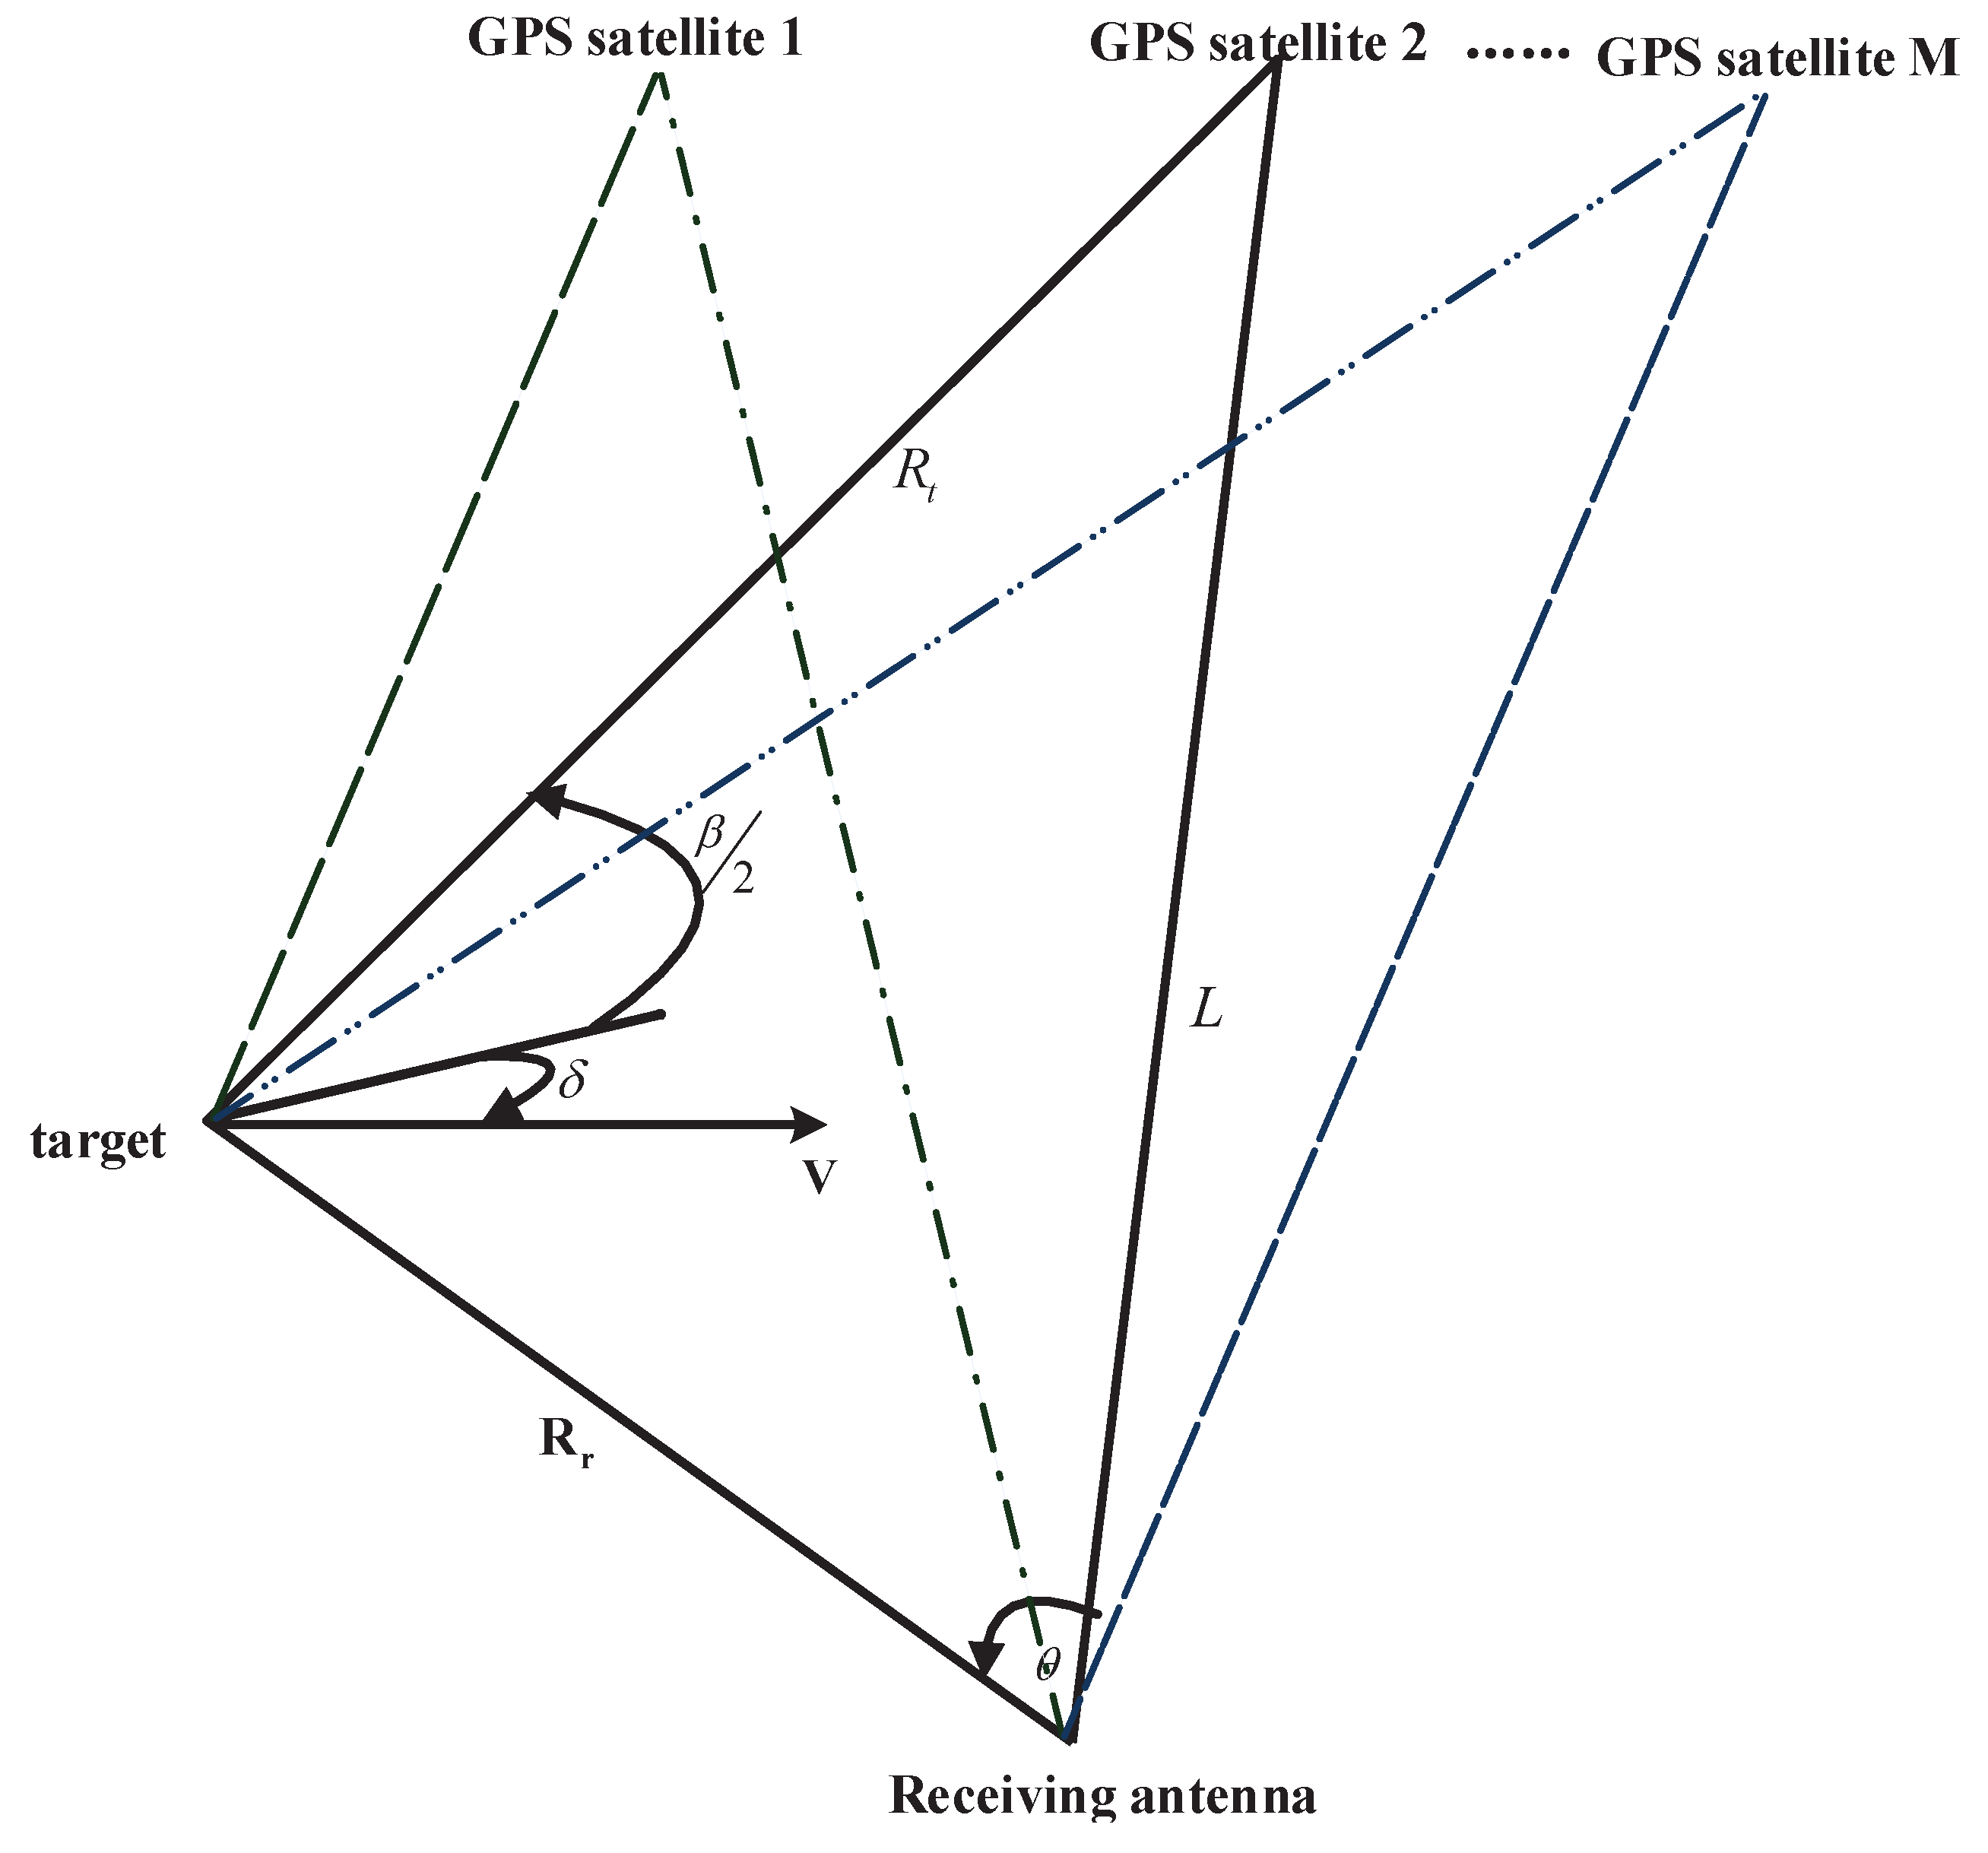
The system model of the echo signal detection and reception system based on data fusion of multiple GPS satellites is shown in
Figure 1, where
is the distance from the satellite to a target,
L is the distance from a satellite to a receiver,
is the arrival angle of the echo,
is the arrival angle of the direct wave, and
is the distance from a target to a receiver.
As shown in
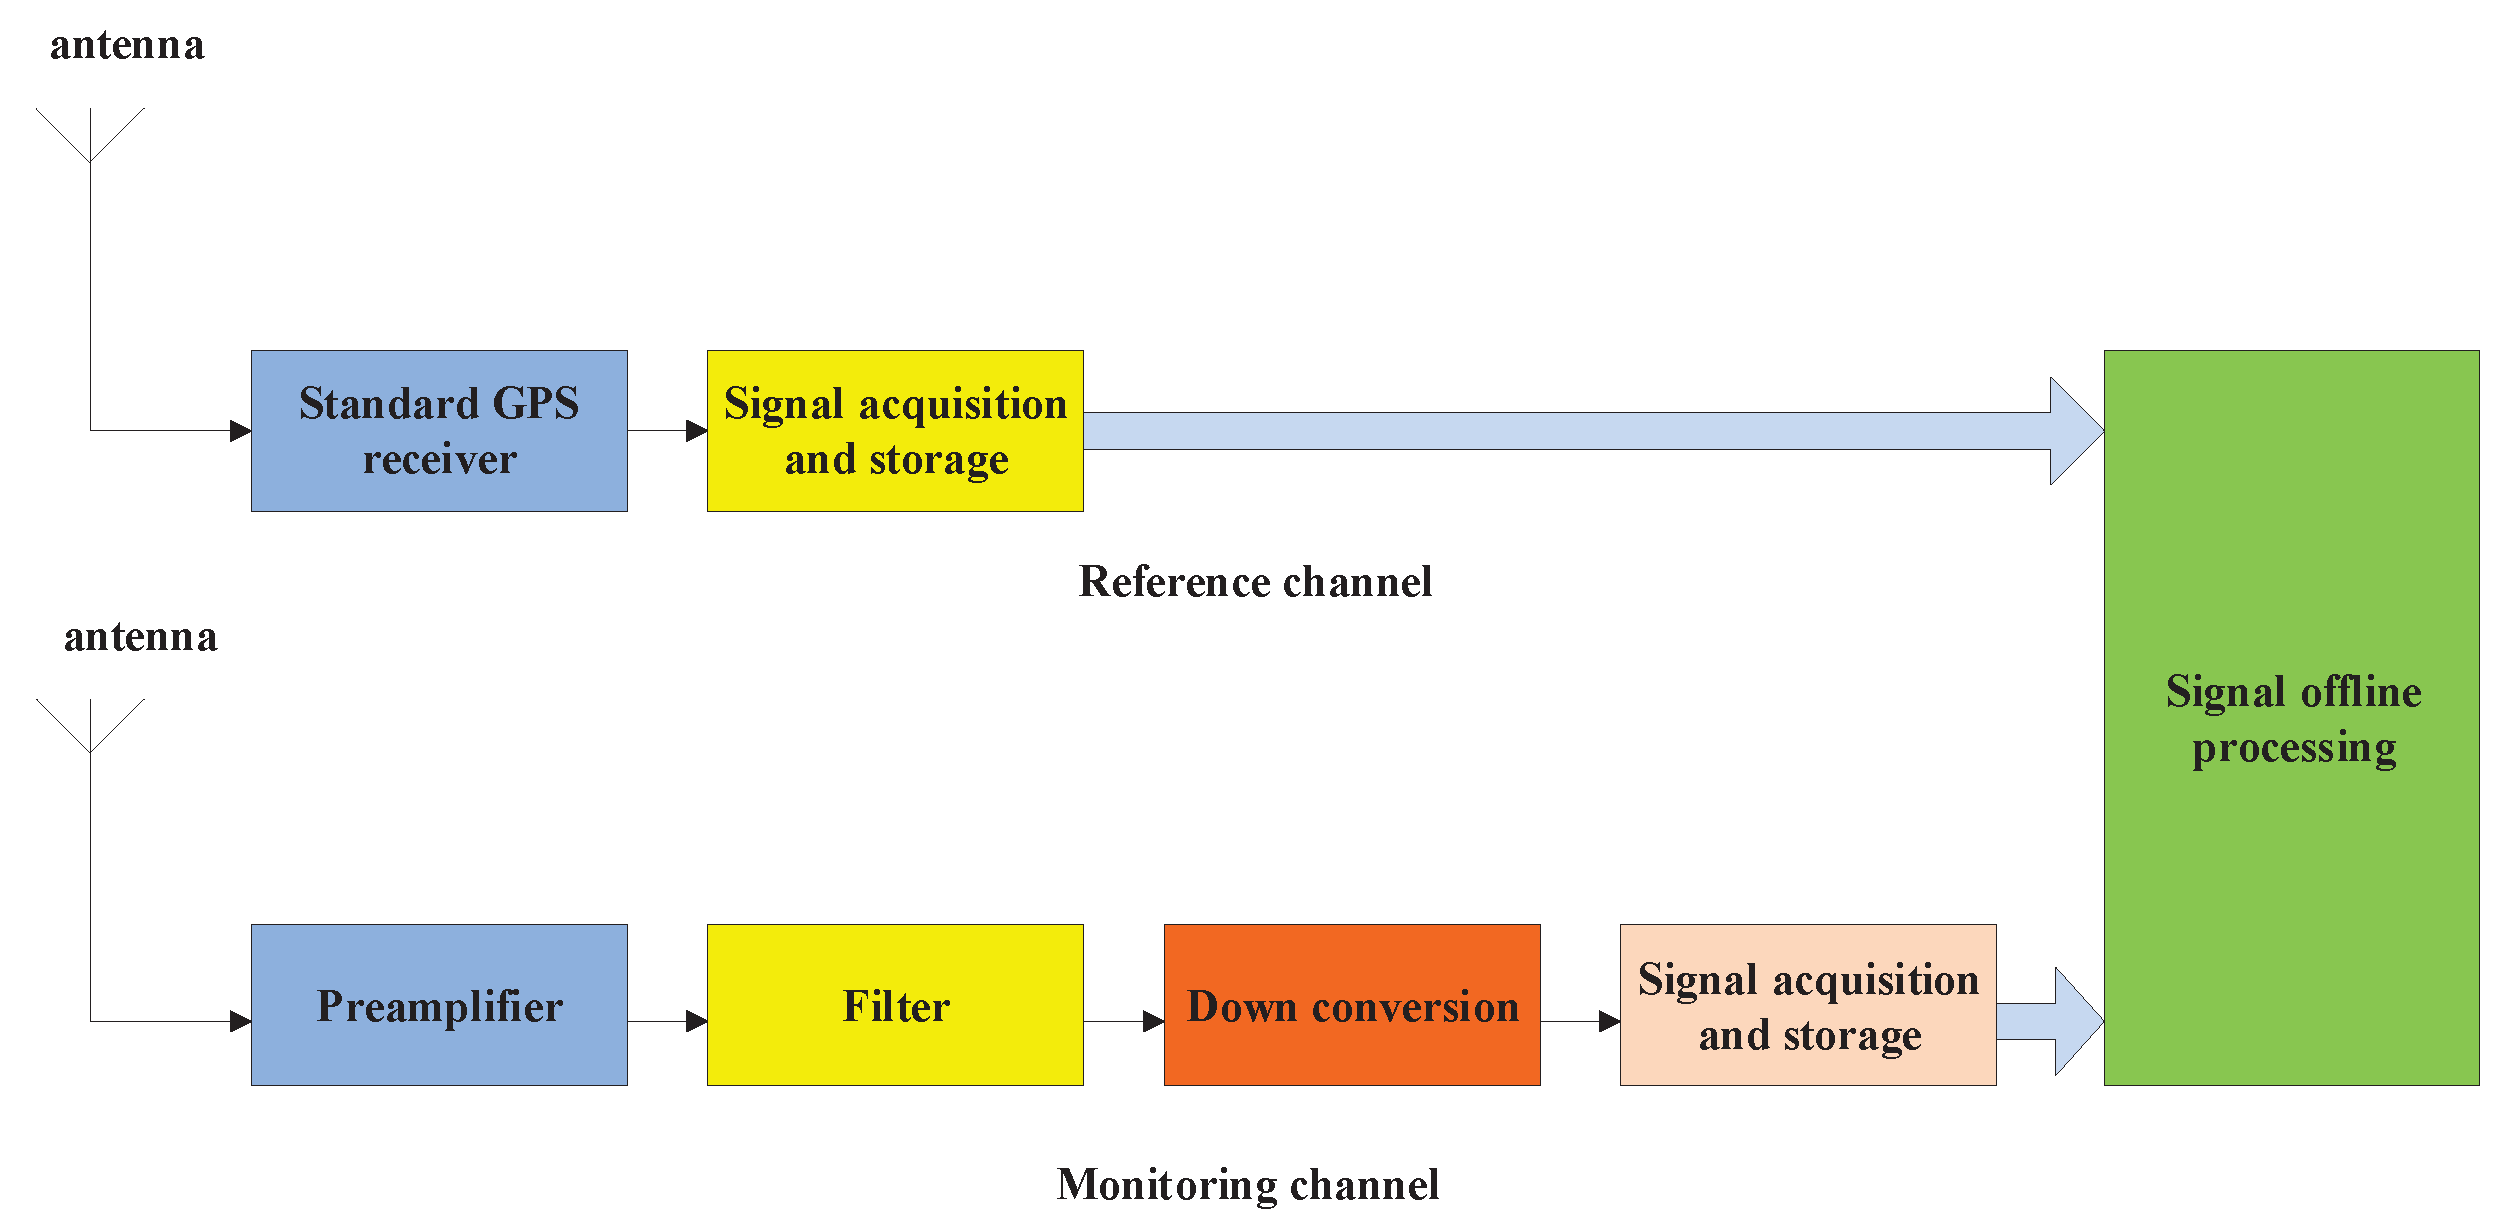
Figure 2, a standard GPS receiver exists in the reference channel, which is vertically pointed to the zenith in order to receive the reference signals. Then, the received reference signals will be used for the DPI and MPI suppression in the monitoring channel. Through the monitoring channel, the receiver is able to realize the self-positioning of the detection system, the baseline measurement, and the tracking of the current satellite, obtaining the ephemeris position information of the zenith at the current moment. These measurements will facilitate subsequent offline signal processing.
The monitoring channel for reflected echo receptions is mainly composed of a GPS receiving antenna, an amplifier, a filter, a down conversion circuit, and a digital storage oscilloscope. In the GPS receiving antenna, a left-handed circularly polarized receiving antenna is deployed, which is tilted towards the target. The amplifier amplifies the GPS echo signal to achieve a 20 dB to 30 dB amplification. The filter is employed for interference cancellation of clutter signals outside the GPS L-band, reducing the influence of out-of-band clutter on subsequent detection processes. The down-conversion module is applied to down-convert the GPS signal from the L-band to the intermediate frequency to reduce the complexity of the processing. The digital storage oscilloscope is used for the rapid sampling and storage of data to enable following offline processing.
In the monitoring channel, it is assumed that there are
M GPS satellites as the radiation source. In addition to the reflected echoes received by the plurality of GPS satellite signals from the target, on the monitoring channel, direct wave signals and multipath interference can be received, which are produced by the reflection of GPS direct wave signals from close ground objects. Accordingly, the received signals of the monitoring channel can be expressed as
where
represents the echo signal of the
Mth GPS satellite,
represents the amplitude of the echo signal, and
is the
Mth GPS satellite signal. In addition,
and
are the delay and frequency offset of that signal, respectively,
is the noise of the monitoring channel,
stands for the multipath of the
Mth GPS satellite affected by multipath interference,
i represents the subscript of the
ith path in the multipath,
is the number of multipath components of the
Mth GPS signal,
is the gain of the
ith path in the
Mth GPS satellite signal, and
is the delay of the
ith path in the
Mth GPS satellite signal.
In the reference channel, GPS satellites share and reuse the same frequency band due to the characteristics of GPS satellite system distribution and Code Division Multiple Access (CDMA) modulation. Thus, the ground receiver is likely to receive more than four frequency-overlapped GPS signals. The received signal by the GPS receiver could be given by
where
is the direct wave signal of the
kth GPS satellite, and
represents the noise of the reference channel.
3. Interference Suppression
Since GPS signals may be transmitted on the same frequency bands and the zenith can simultaneously have multiple GPS satellites, a near-earth orbit target can be simultaneously illuminated by multiple satellite beams. Therefore, multiple different GPS signals may be received on the reference channel, contaminating desired reference signals and degrading the suppression of DPI and MPI.
3.1. Influence of Reference Channel Interference on DPI and MPI Suppression
To suppress DPI and MPI, an adaptive filtering algorithm was adopted [
22,
23,
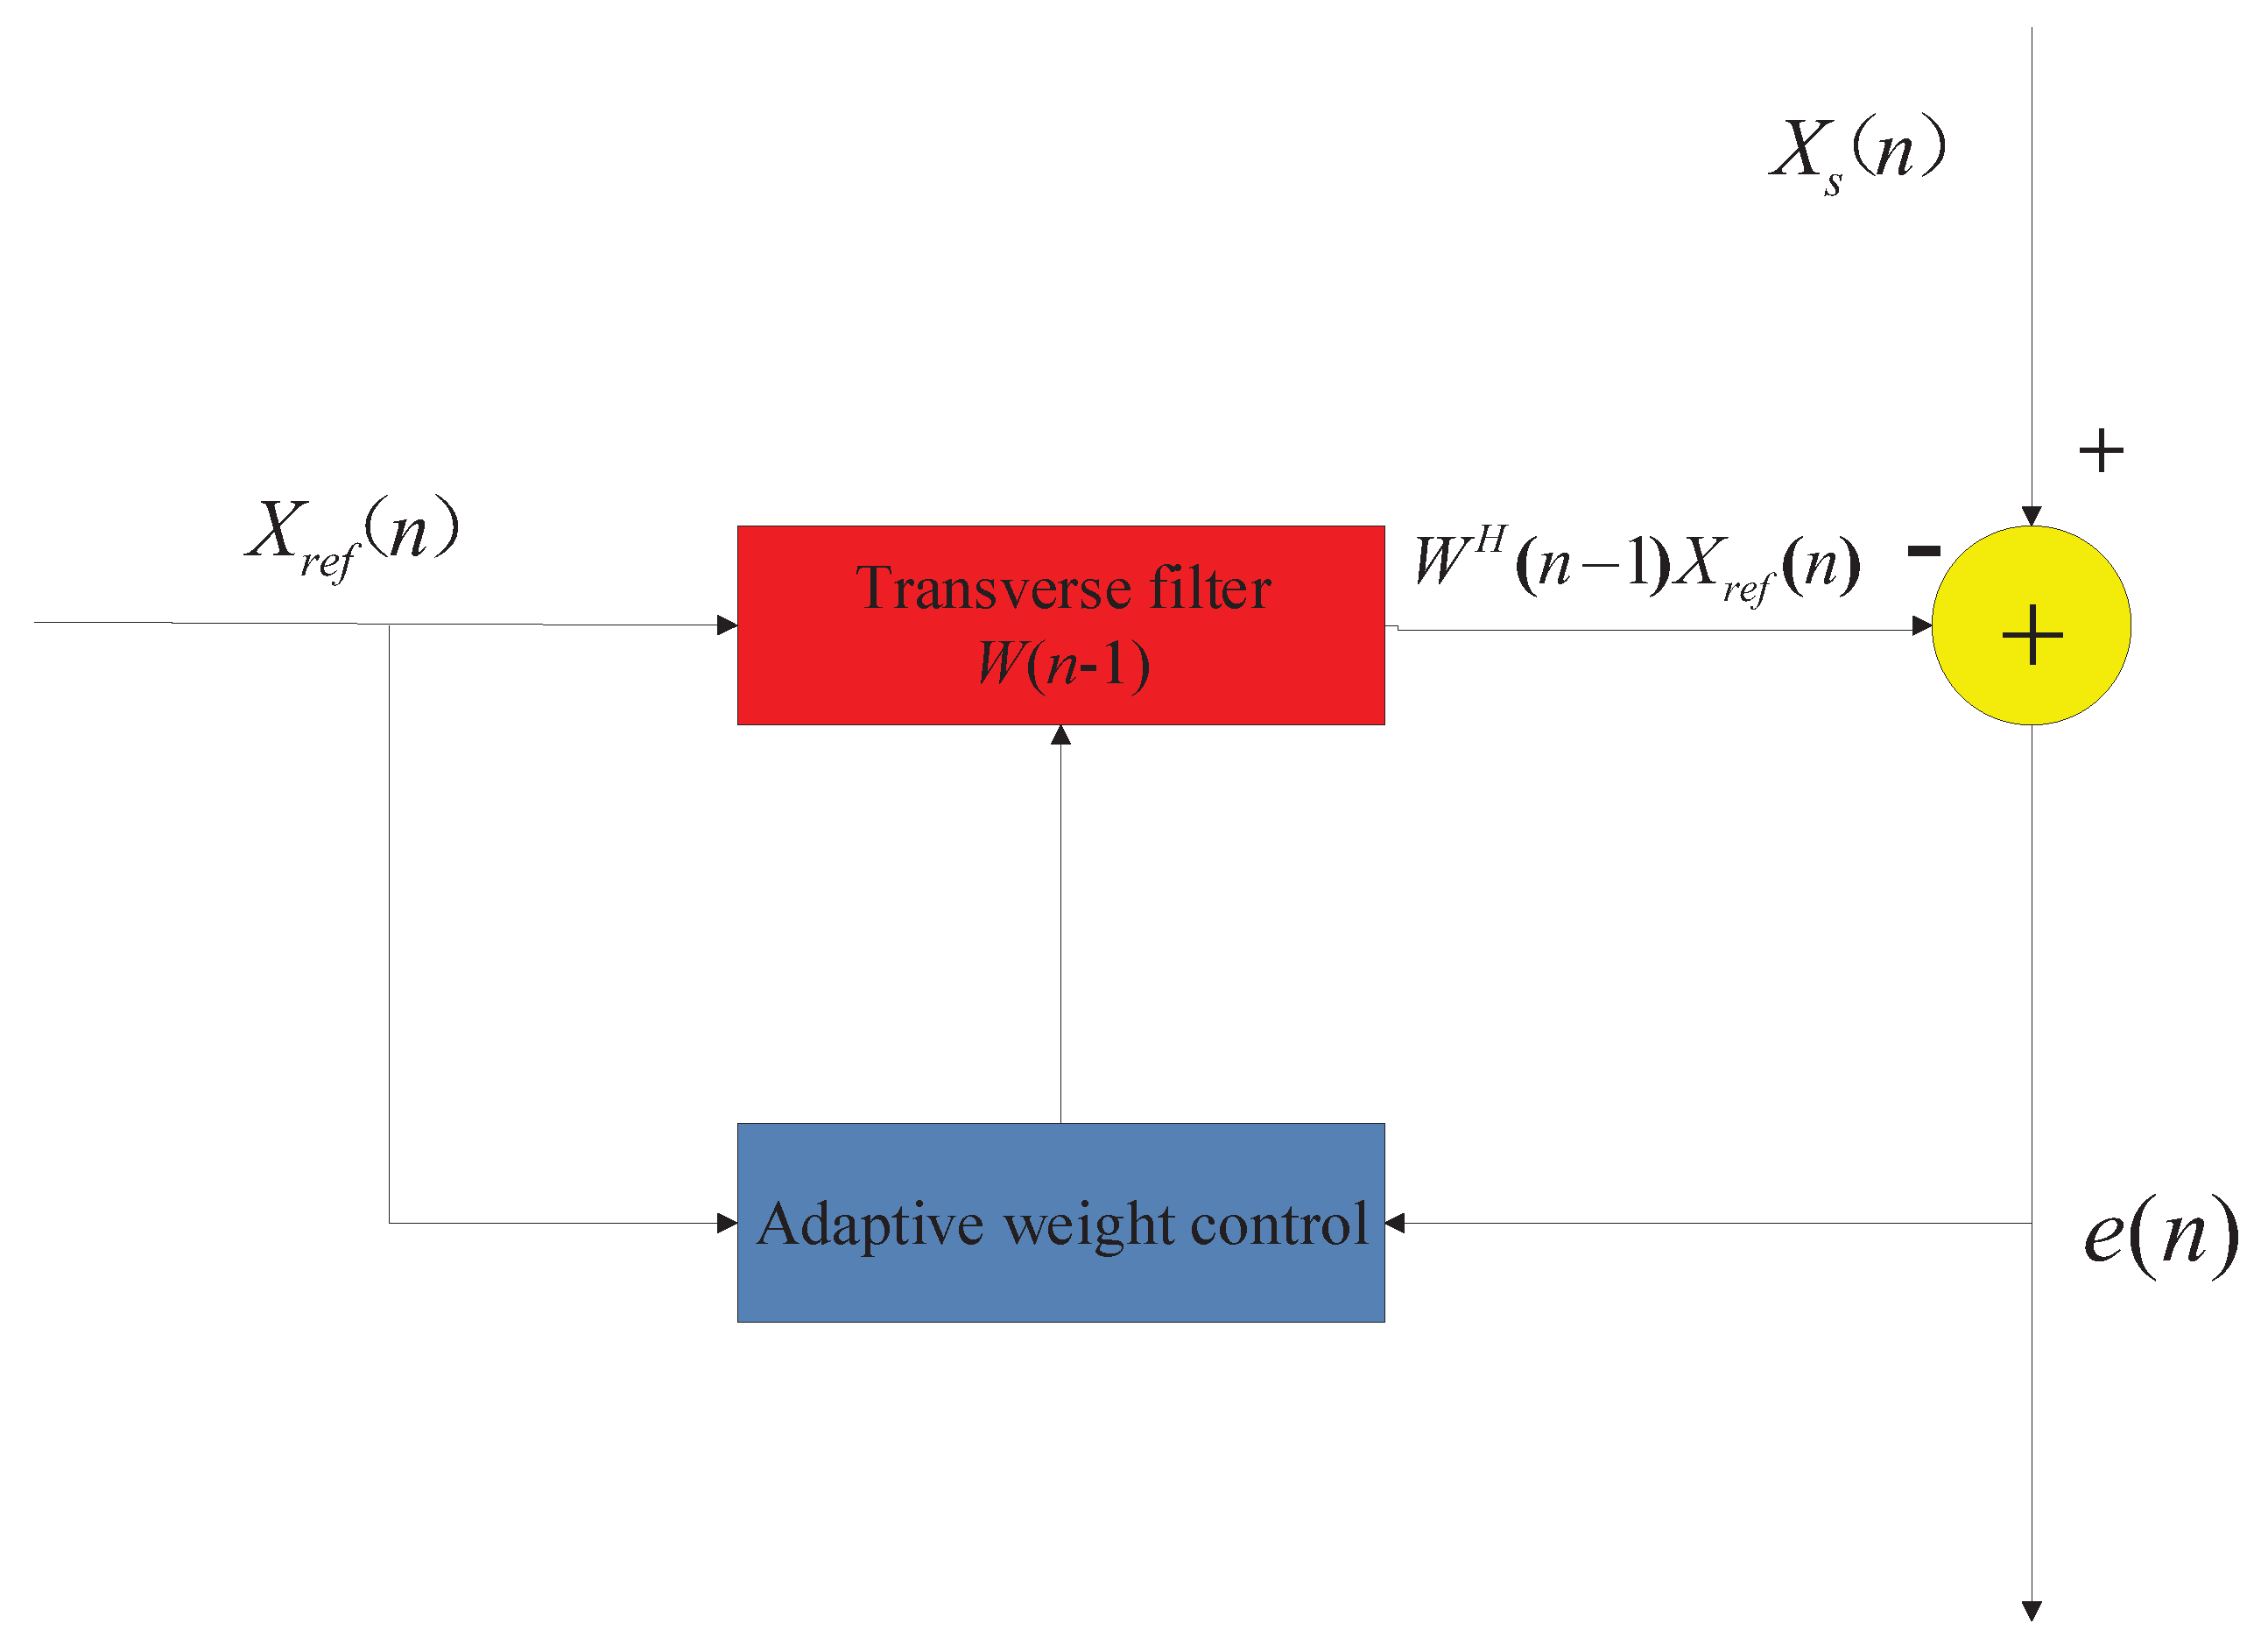
24]. The direct wave signal received on the reference channels is used as reference signals to cancel the DPI and MPI on the monitoring channels. The specific suppression principle is shown in
Figure 3, where
is the direct wave signal of the reference channel,
is the mixed signal received by the monitoring channel, and
is the coefficient of the filter. The algorithm is able to adjust the filter coefficients adaptively to minimize the output error
of the filter, and
also gives the signal for the monitoring channel after interference suppression, which is obtained by
From
Figure 3, reference signals are required in this method. The reference signal is used to cancel the DPI and MPI in the monitoring channel, and is also used as a reference signal for time-frequency two-dimensional correlation with the echo signal in the monitoring channel. Therefore, the reference signal is very important throughout the process. This section analyzes the influence of reference channel noise and interference signals on the direct wave multipath suppression. In
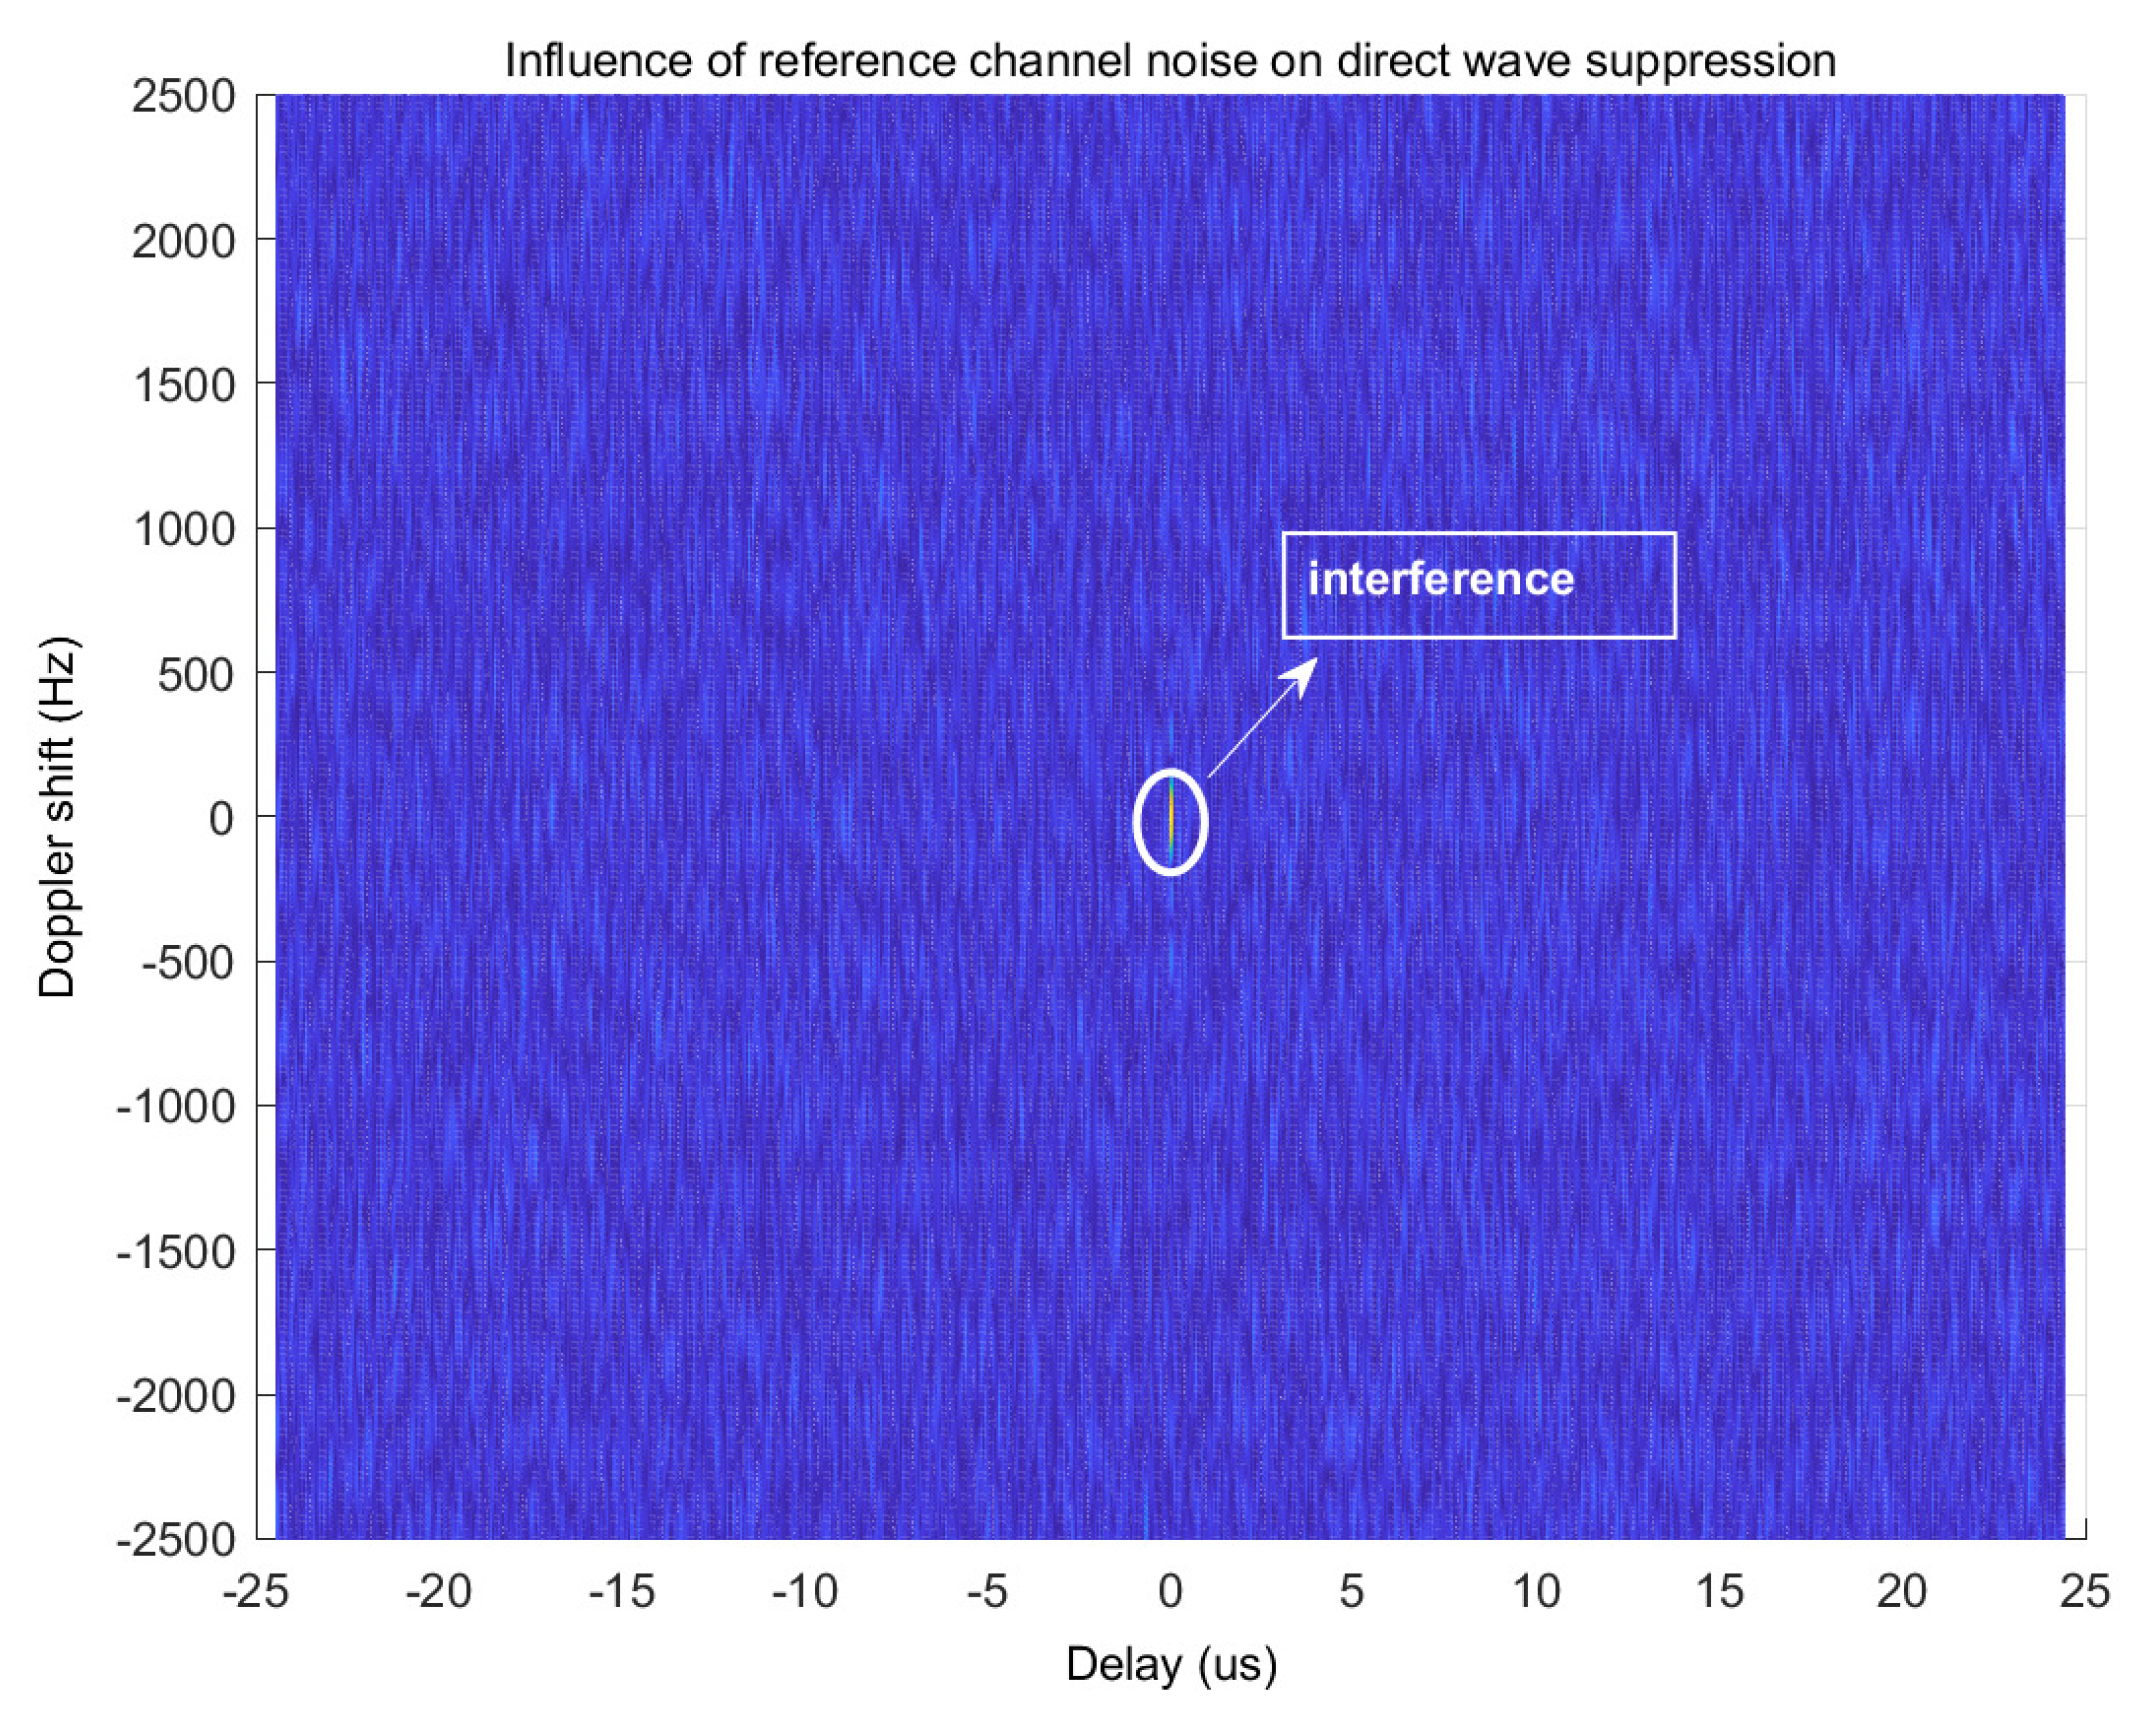
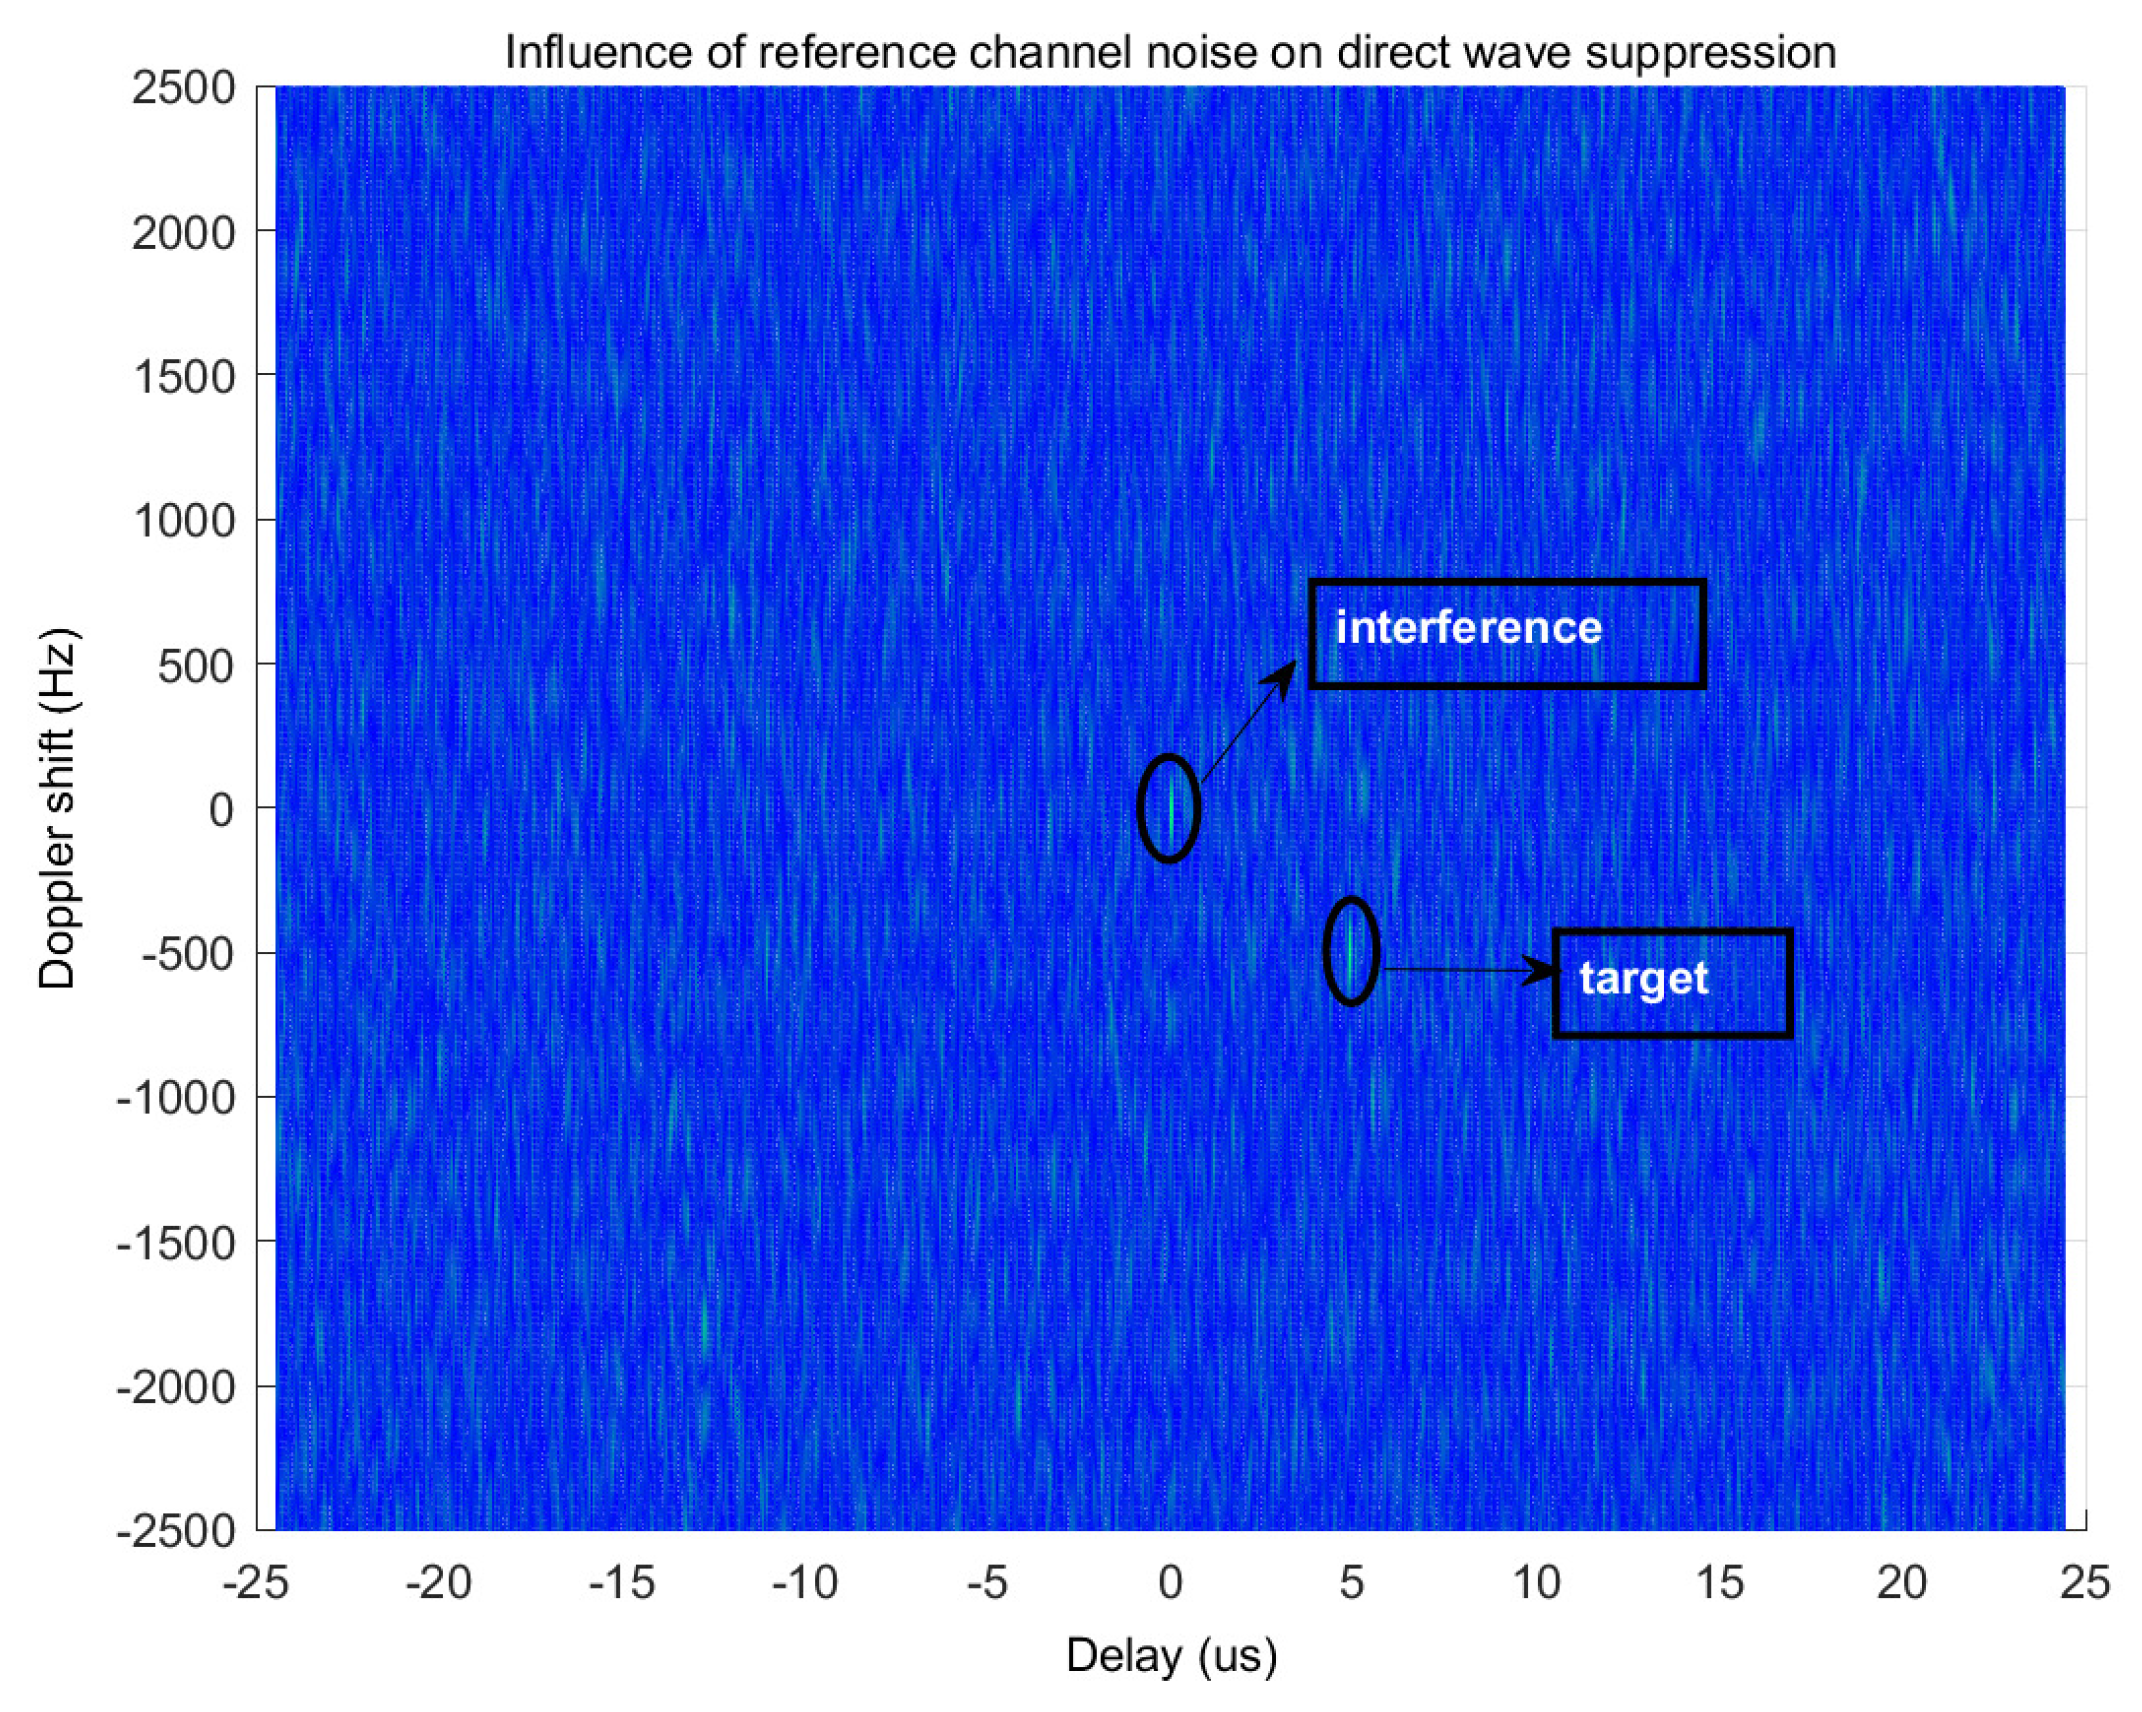
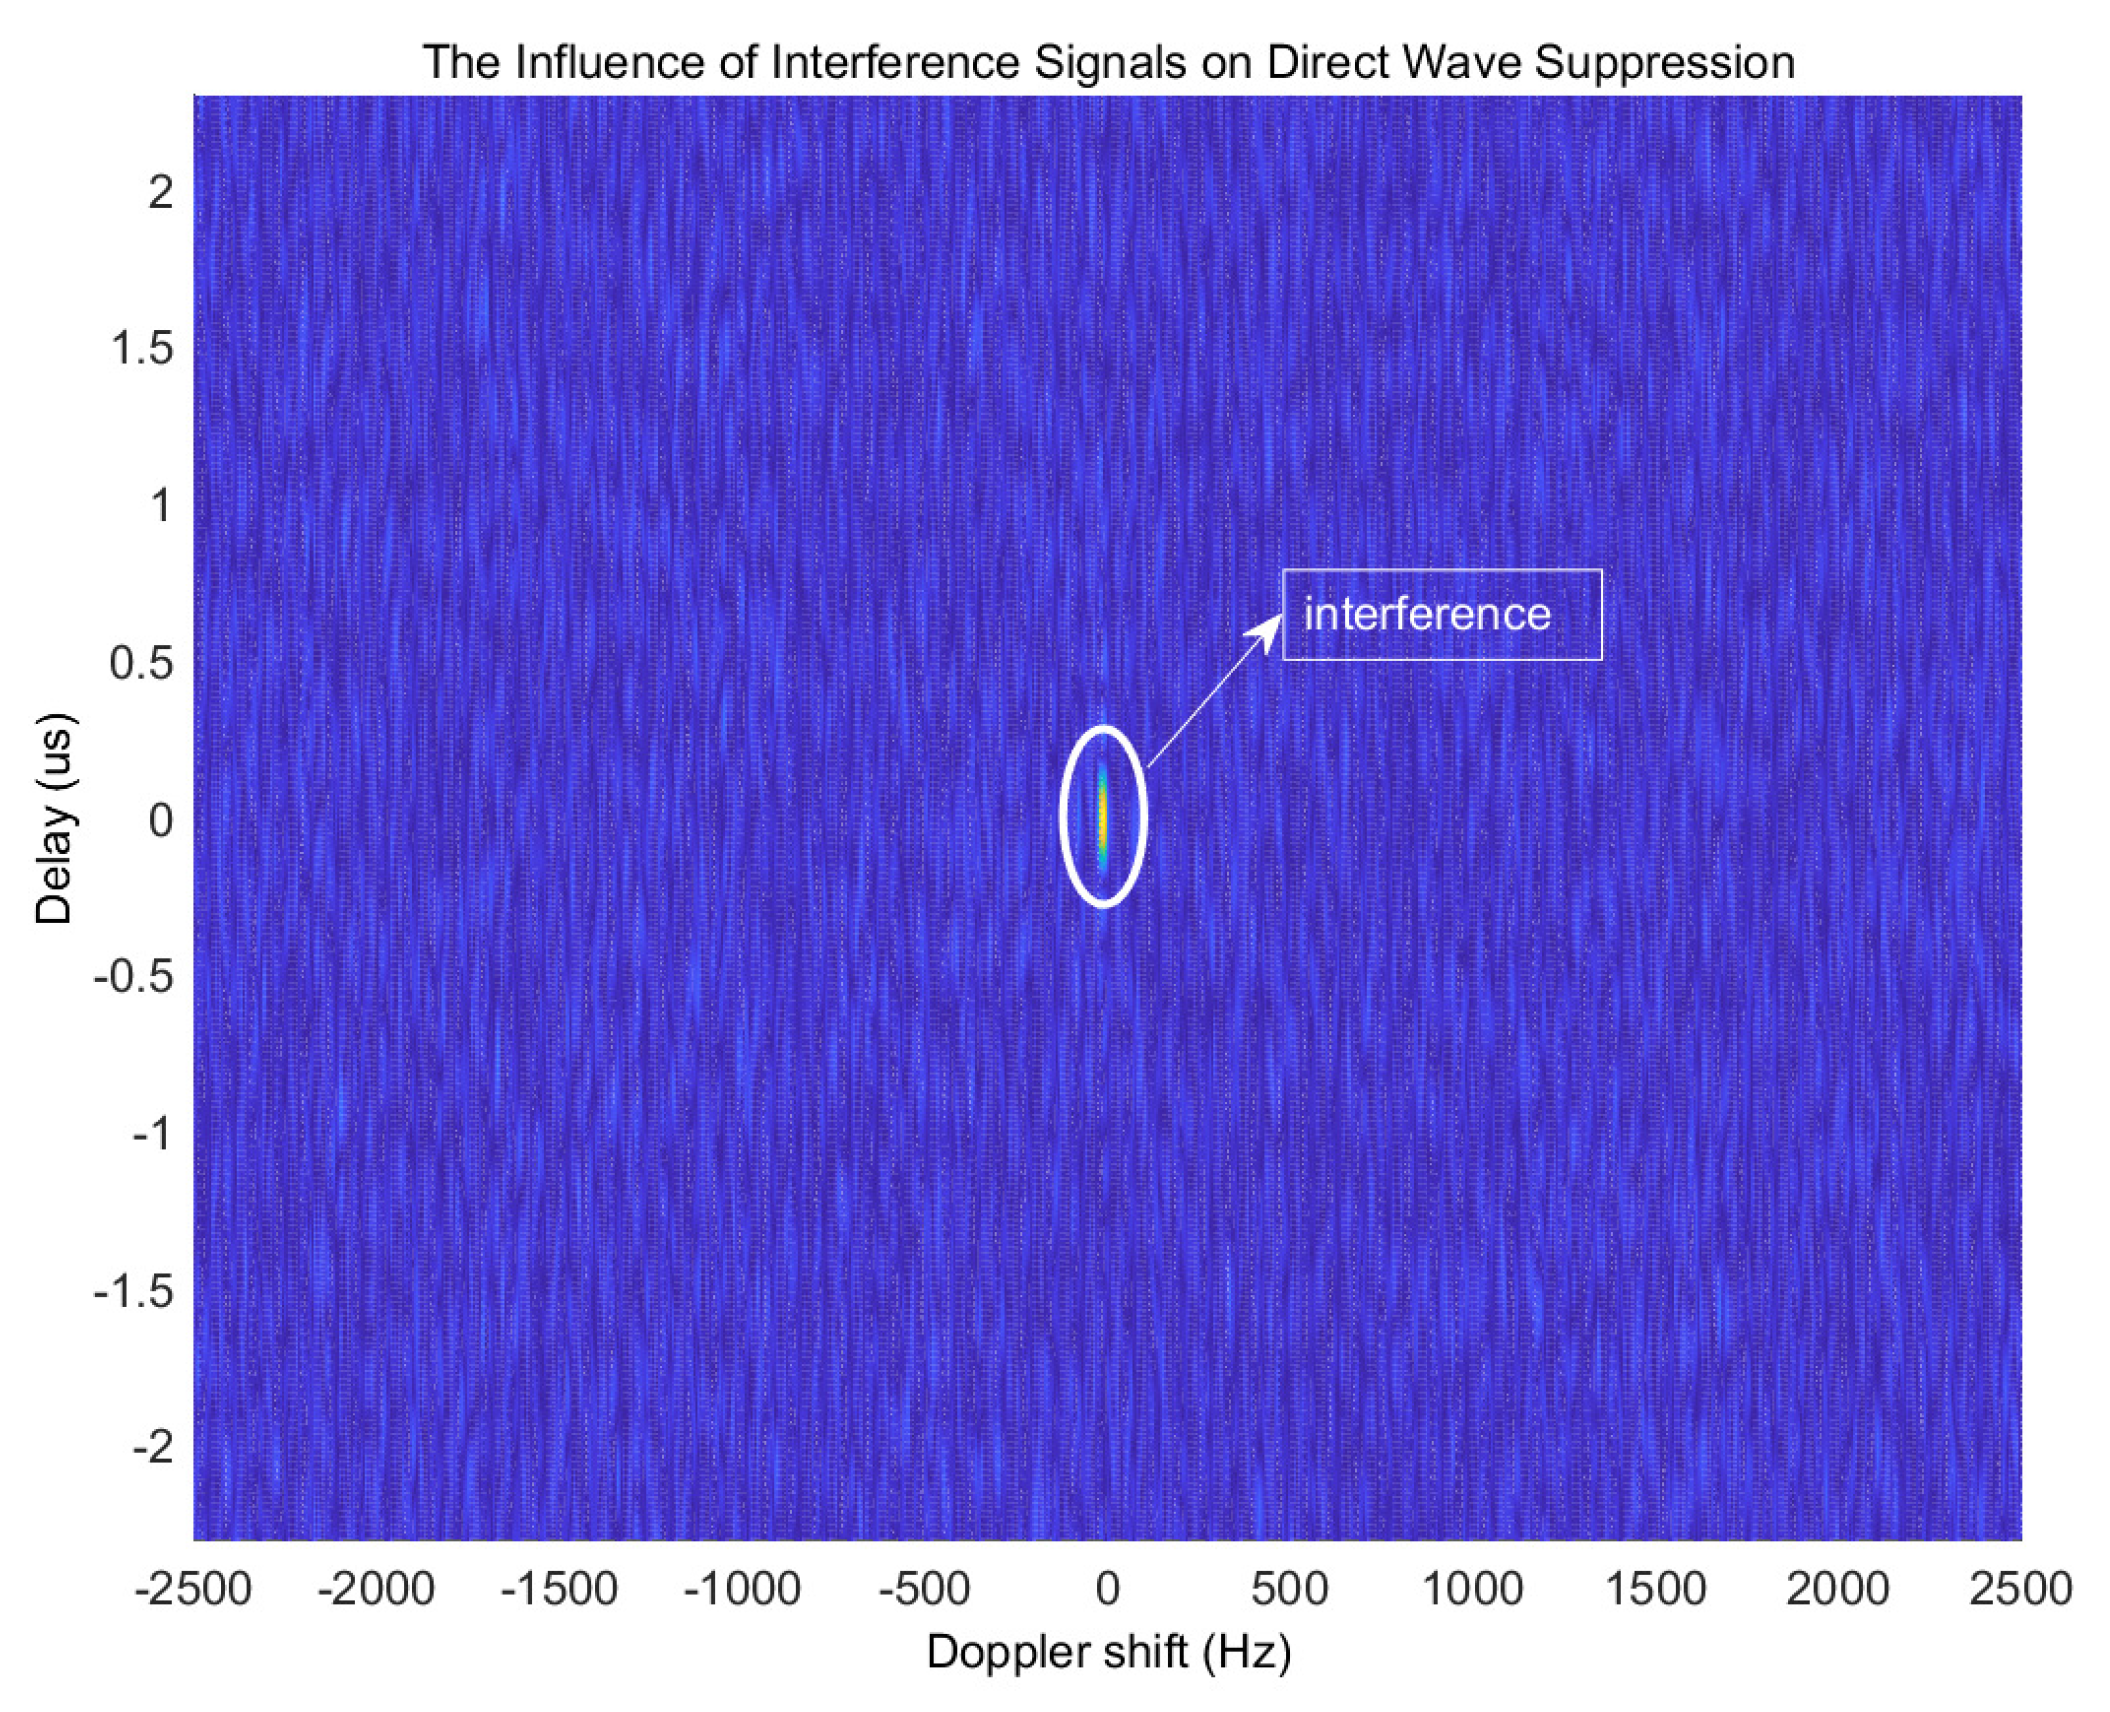
Figure 4, the DPI and MPI suppression are performed by using the algorithm in
Figure 3, and the monitoring channel signal and the reference signal after suppression are used as fuzzy functions, and the DPI and MPI inhibition effects are judged by observing whether or not there is a peak corresponding to the echo on the time delay-Doppler spectrum.
First, set the monitoring channel to include both the target echo and DPI and MPI. The reference channel only has the reference signal and noise corresponding to the target echo. There are no other GPS interference signals. The parameter settings are shown in
Table 1. The DPI and MPI suppression effects are assessed by observing whether there is a peak corresponding to the echo on the delay-Doppler spectrum, which are shown in
Figure 4 and
Figure 5. As can be seen from
Figure 4, when the SNR of the reference signal is −15 dB, after using this reference signal to perform DPI and MPI suppression on the monitoring channel, the interference peak in the delay-Doppler spectrum is still strong, making the peak corresponding to the target echo invisible. When the SNR of the reference signal is 5 dB, after the suppression of the direct wave, it can be seen from
Figure 5 that, although the interference peaks of DPI and MPI still exist, the peak of the echo can be seen in the delay-Doppler spectrum. If the SNR is gradually increased, DPI and MPI can be completely suppressed. Therefore, it can be concluded that the noise of the reference channel has a great influence on the suppression process of DPI and MPI.
Second, set the echo channel to include the target echo plus DPI and MPI. In this case, only the reference signal and other GPS interference signals are in the reference channel. The parameter settings are shown in
Table 2.
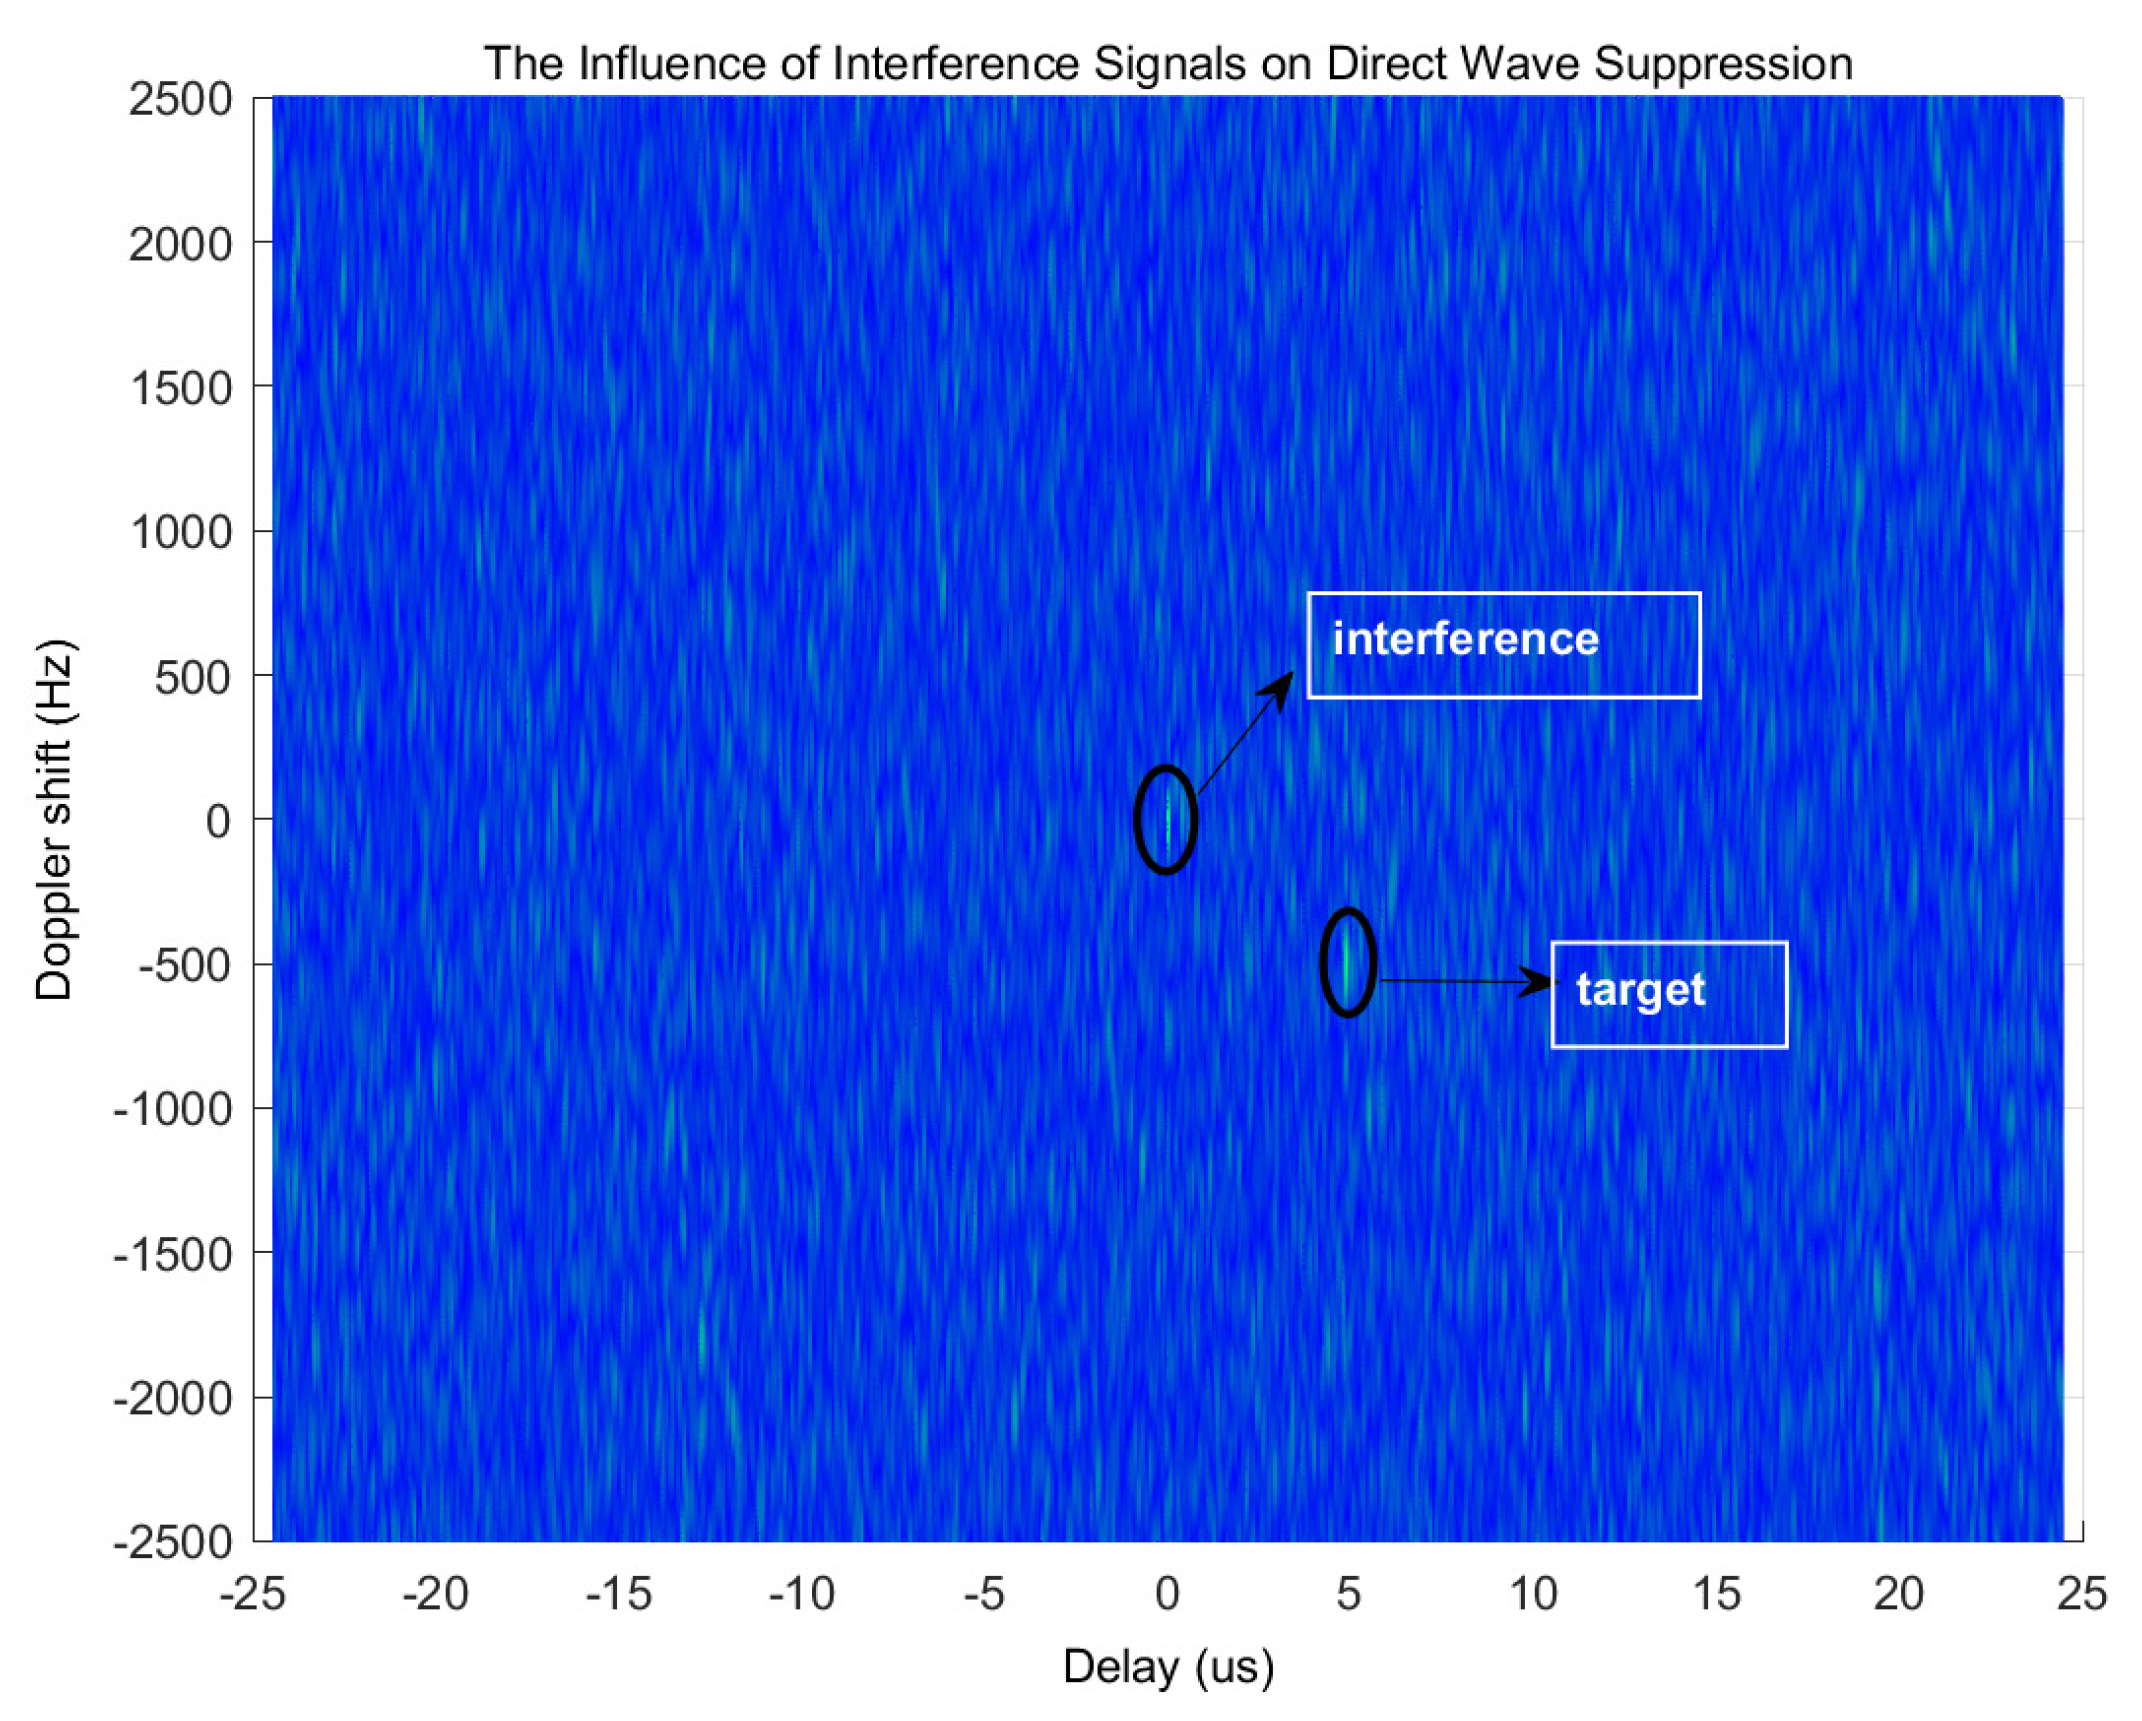
As can be seen from
Figure 6, when the power of the interference signal in the reference channel is −110 dBm, that is, the signal-to-interference ratio (SIR) is 10 dB, the peak corresponding to the target is still invisible after interference suppression, and the DPI and MPI suppression methods fail in this scenario. As can be seen from
Figure 7, when the power of the interference signal in the reference channel is reduced to −140 dBm and the SIR is 30 dB, the peak corresponding to the target can be seen after interference suppression, but the interference is still not eliminated. Therefore, it can be concluded that, under normal circumstances, the reference channel inevitably receives signals from multiple GPS satellites as co-channel interference, and it has a great influence on the suppression process of DPI and MPI.
Based on the above analysis, the noise and interference signals in the reference channel have a great influence on DPI and MPI suppression. The traditional external source detection system does not process the reference channel signal and uses it directly as a reference signal for the DPI and MPI interference suppression algorithms. In order to correctly detect the echo signal, the GPS reference signal of the reference channel must be purified and separated.
3.2. Multiple GPS Signals Separation and Reconstruction
The GPS signal uses C/A code
and P code
to spread the data code
. This paper only considers the GPS satellite signal modulated by C/A code [
25,
26]. The signal received by the reference channel can be expressed as
where
is the power of the transmitted signal of the kth GPS satellite,
represents the C/A code of the kth GPS satellite,
represents the navigation data of the kth GPS satellite,
is the carrier frequency of the received signal, and
is the delay of the received signal. By using the CDMA principle of the GPS system and the characteristics of the C/A code disclosure, a successive interference canceller (SIC) can be used to effectively separate and reconstruct multiple GPS signals
by the reference channel.
SIC is implemented in multiple steps, where each step requires signal acquisition to reconstruct the signal; then, the interference signal is removed from the received signal, and the “detection-reconstruction-cancel” step is repeated until all GPS signals are recovered. The steps of the method are as follows:
Step 1: Using a GPS acquisition algorithm to detect the GPS signal in the received signal of the reference channel, and obtain its corresponding spreading code information , amplitude estimation value , phase offset value , and frequency offset value ;
Step 2: Demodulate and reconstruct the signal
; the received signal is down-converted by using the frequency offset information
, and then the phase offset
is obtained by the lth local C/A code
to obtain
, and, according to the orthogonality of the C/A codes of different satellites, the information
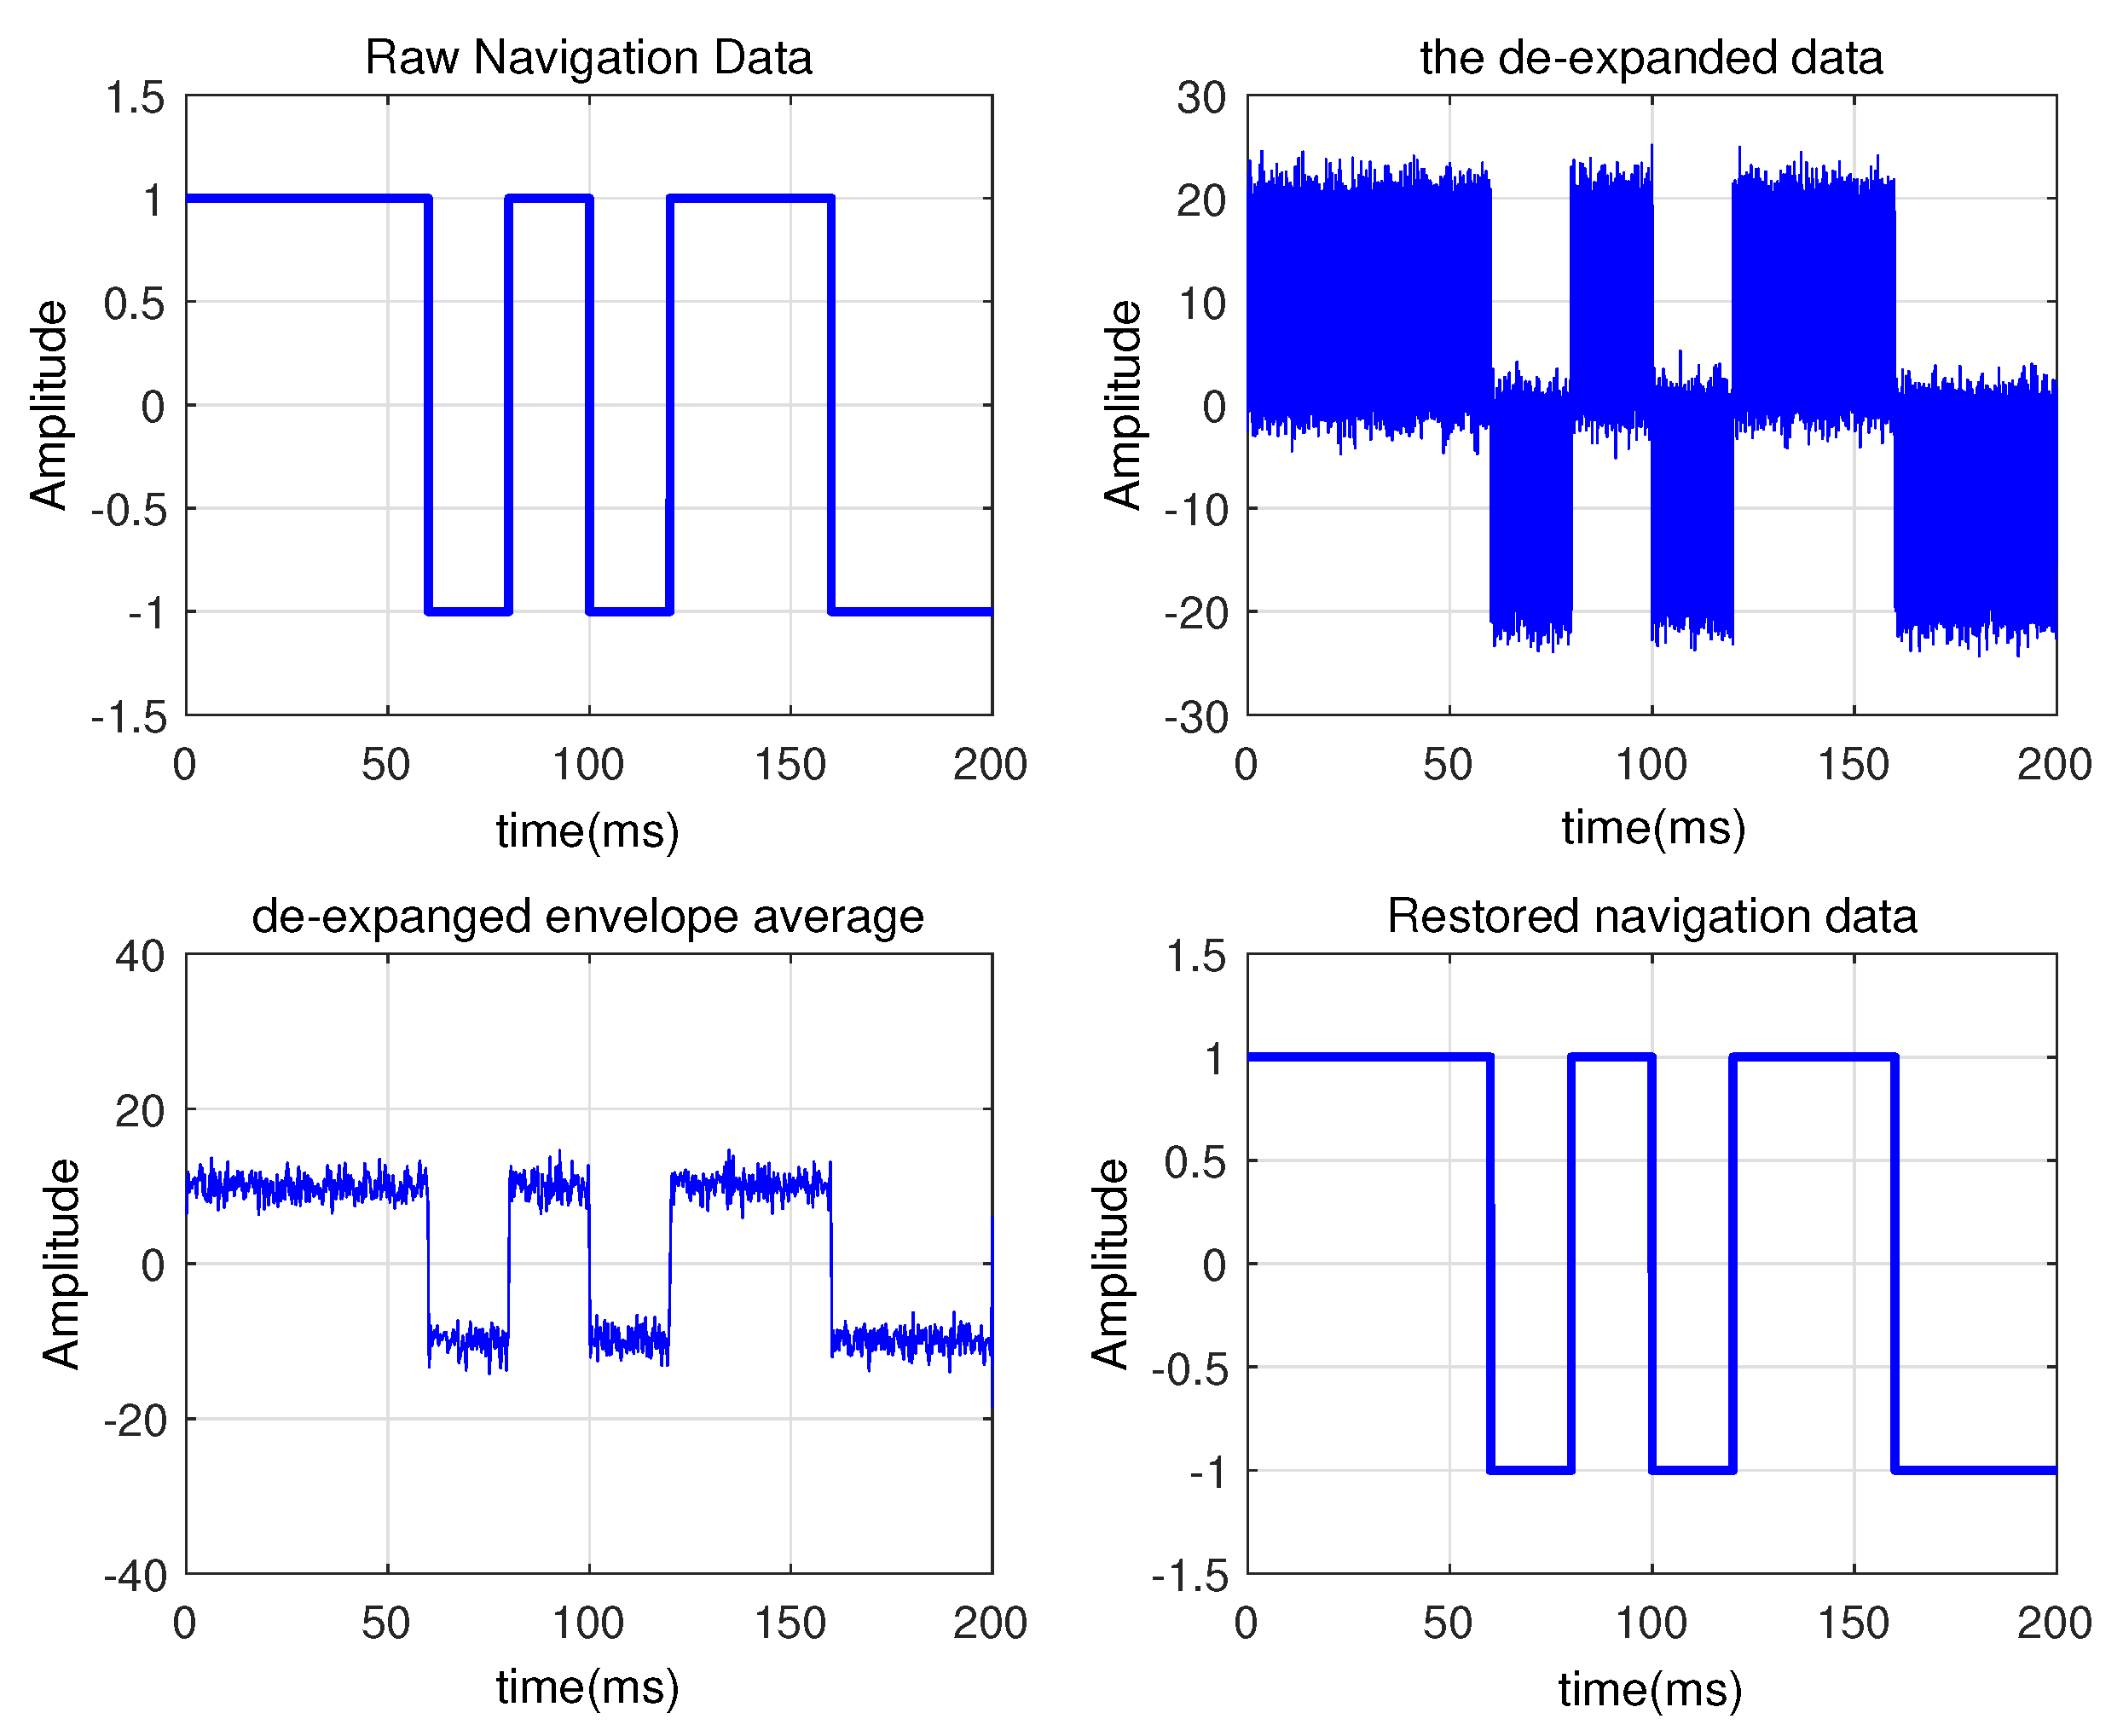
of the satellite is de-spreaded. In order to correctly recover the navigation data, the de-spreaded data are processed by the envelope averaging method, and finally the navigation data
are determined. The process is shown in
Figure 8.
The recovered navigation data
is modulated using the phase-synchronized local C/A code, and the reconstructed reference signal
is obtained by using the amplitude
of the signal and then up-converting, which is expressed as
The correlation coefficient between the original signal and the reconstructed signal obtained by simulation calculation is 0.99. As shown in
Figure 9, it shows that the original signal is well reconstructed.
Step 3: Subtract the signal recovered in step 2 from the received signal of the reference channel to reduce the interference when reconstructing the next signal. In this paper, the adaptive filtering method is used to eliminate the interference signal, that is, the input end of the reference signal in
Figure 3 is replaced by the reconstructed signal
, and the input end of the monitoring channel signal is replaced by
, so that the signal after strong interference cancellation can be obtained
Step 4: Repeat the “capture-reconstruction-cancellation” process from step one to step three for the signal of the output signal of step three until the GPS signal is not detected in the reference channel. Finally, a plurality of reconstructed GPS reference signals can be obtained. At this time, the reference signals have been separated and there is no noise, so there is no other GPS signals and noise interfering with the reference signals. The process not only eliminates the noise in the reference signal, but also separates multiple GPS signals in the reference channel, providing a good reference signal for the DPI and MPI suppression processes of multiple GPS satellites in the monitoring channel. At the same time, it also provides a useful reference signal for the joint detection of multiple GPS weak echoes. In addition, the GPS signal that interferes with the original reference channel is converted into a reference signal that is advantageous to the system.
3.3. DPI and MPI Suppression Based on ECA
After the reference signal separation and reconstruction, the DPI and MPI of multiple satellites can be suppressed. Different from the DPI and MPI suppression processes of a single GPS satellite, this section suppresses the DPI and MPI brought by multiple GPSs in the surveillance channel based on the extensive cancellation algorithm (ECA).
Firstly, the ECA uses multiple GPS reference signals
to construct a delay spread matrix
of multi-satellite signals, which can be expressed as
where
is the reconstructed matrix of the reconstructed ith reference signal
through different delays, and the extension matrix
is an element in the matrix
and can be expressed as
where
N is the number of sampling points, and
K is the maximum delay, which can be obtained by dividing the maximum detection distance by the speed of light(
). DPI and MPI can be expressed as
Then, adjust the value of
to make
approach the direct wave and multipath interference. The problem is transformed into the following problem:
The solution of Equation (
10) uses the least squares criterion [
27,
28,
29]; then, Equation (
10) is equivalent to the following:
Thus,
is obtained, where
is the transpose of
, and the signal in the monitoring channel after interference suppression is expressed as
where
only contains the echo signal and noise
.
The proposed algorithm does not need to know the gain value, and the DMPI can be directly solved by the proposed algorithm. In order to verify the DPI and MPI suppression algorithms based on signal separation and reconstruction proposed in this paper, the specific parameter settings are shown in
Table 3 as follows: the reference channel contains noise, five GPS signals; the monitoring channel contains noise, three GPS echoes, and DPIs corresponding to five reference channel GPS signals. Firstly, the reference signal separation and reconstruction algorithms are used to separate and reconstruct the reference signals 1, 2, 3, 4, and 5 of the reference channel. Then, the purified reference signal is used together with the suppression algorithm proposed in this section to perform DPI suppression on the signal of the monitoring channel. Finally, the signal of the monitoring channel after the suppression and the reference signal are subjected to cross ambiguity function (CAF) processing [
30,
31,
32], and the DPI suppression effect is judged by observing whether there is a peak corresponding to the echo on the delay-Doppler spectrum.
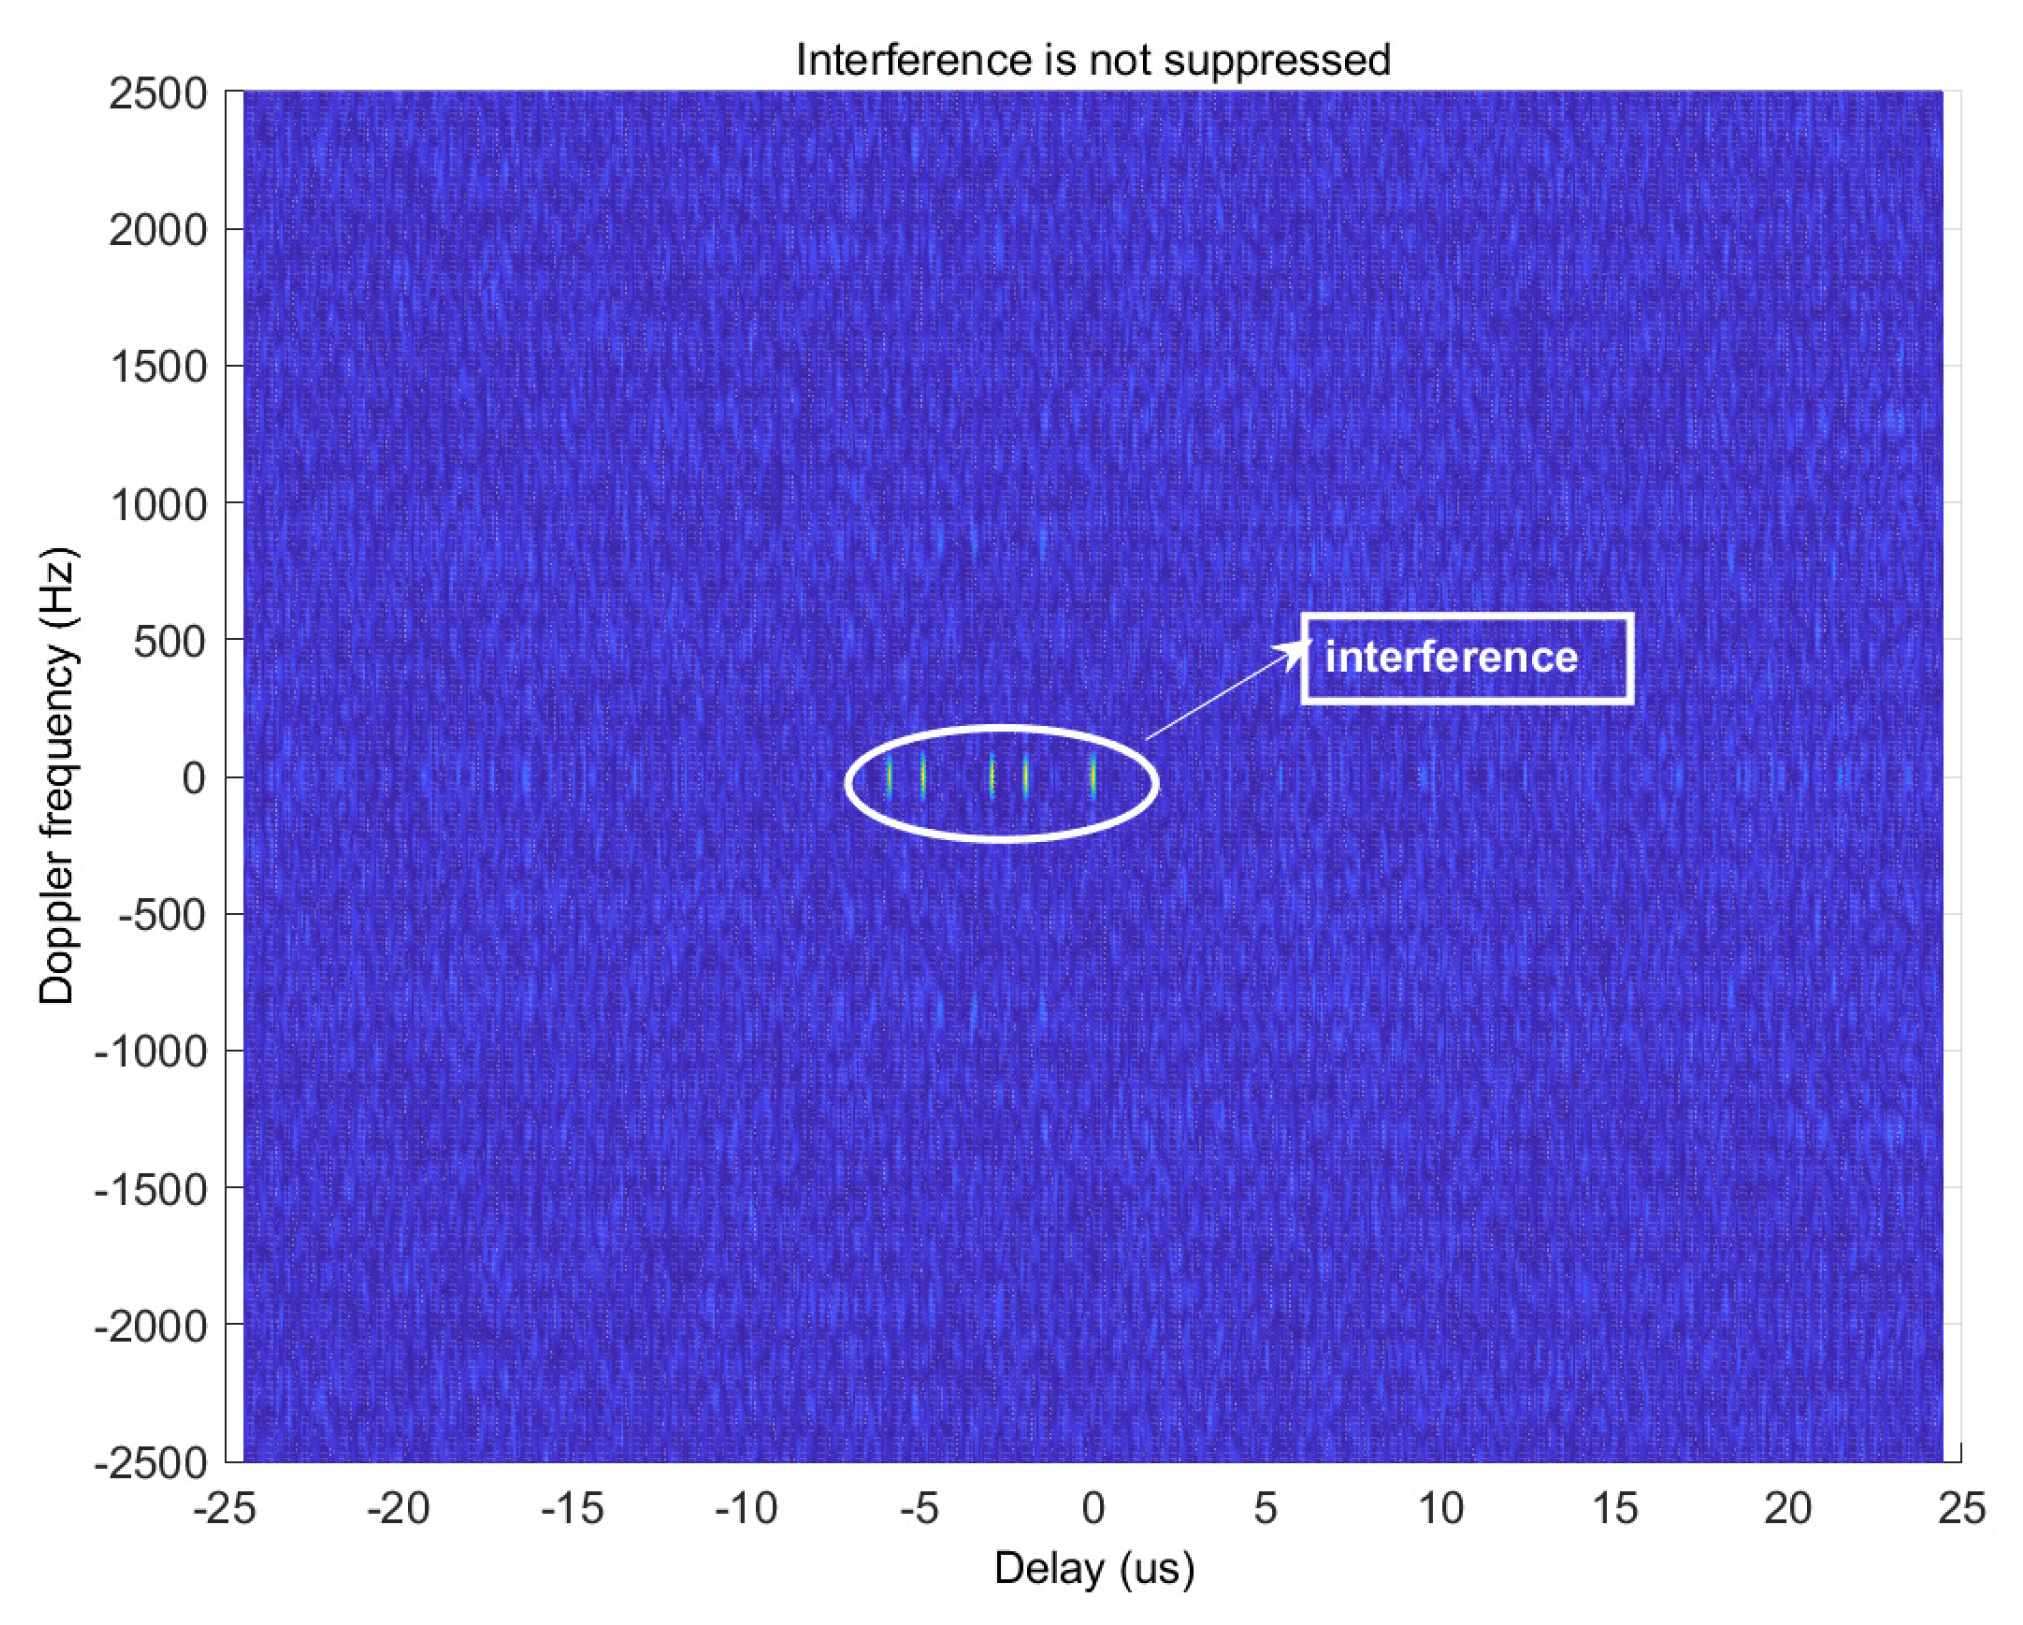
Figure 10 shows the time-frequency two-dimensional correlation of un-suppressed DPI of multiple GPS satellites. It can be seen that the echo generated by the target is completely submerged in the peak generated by DPI.
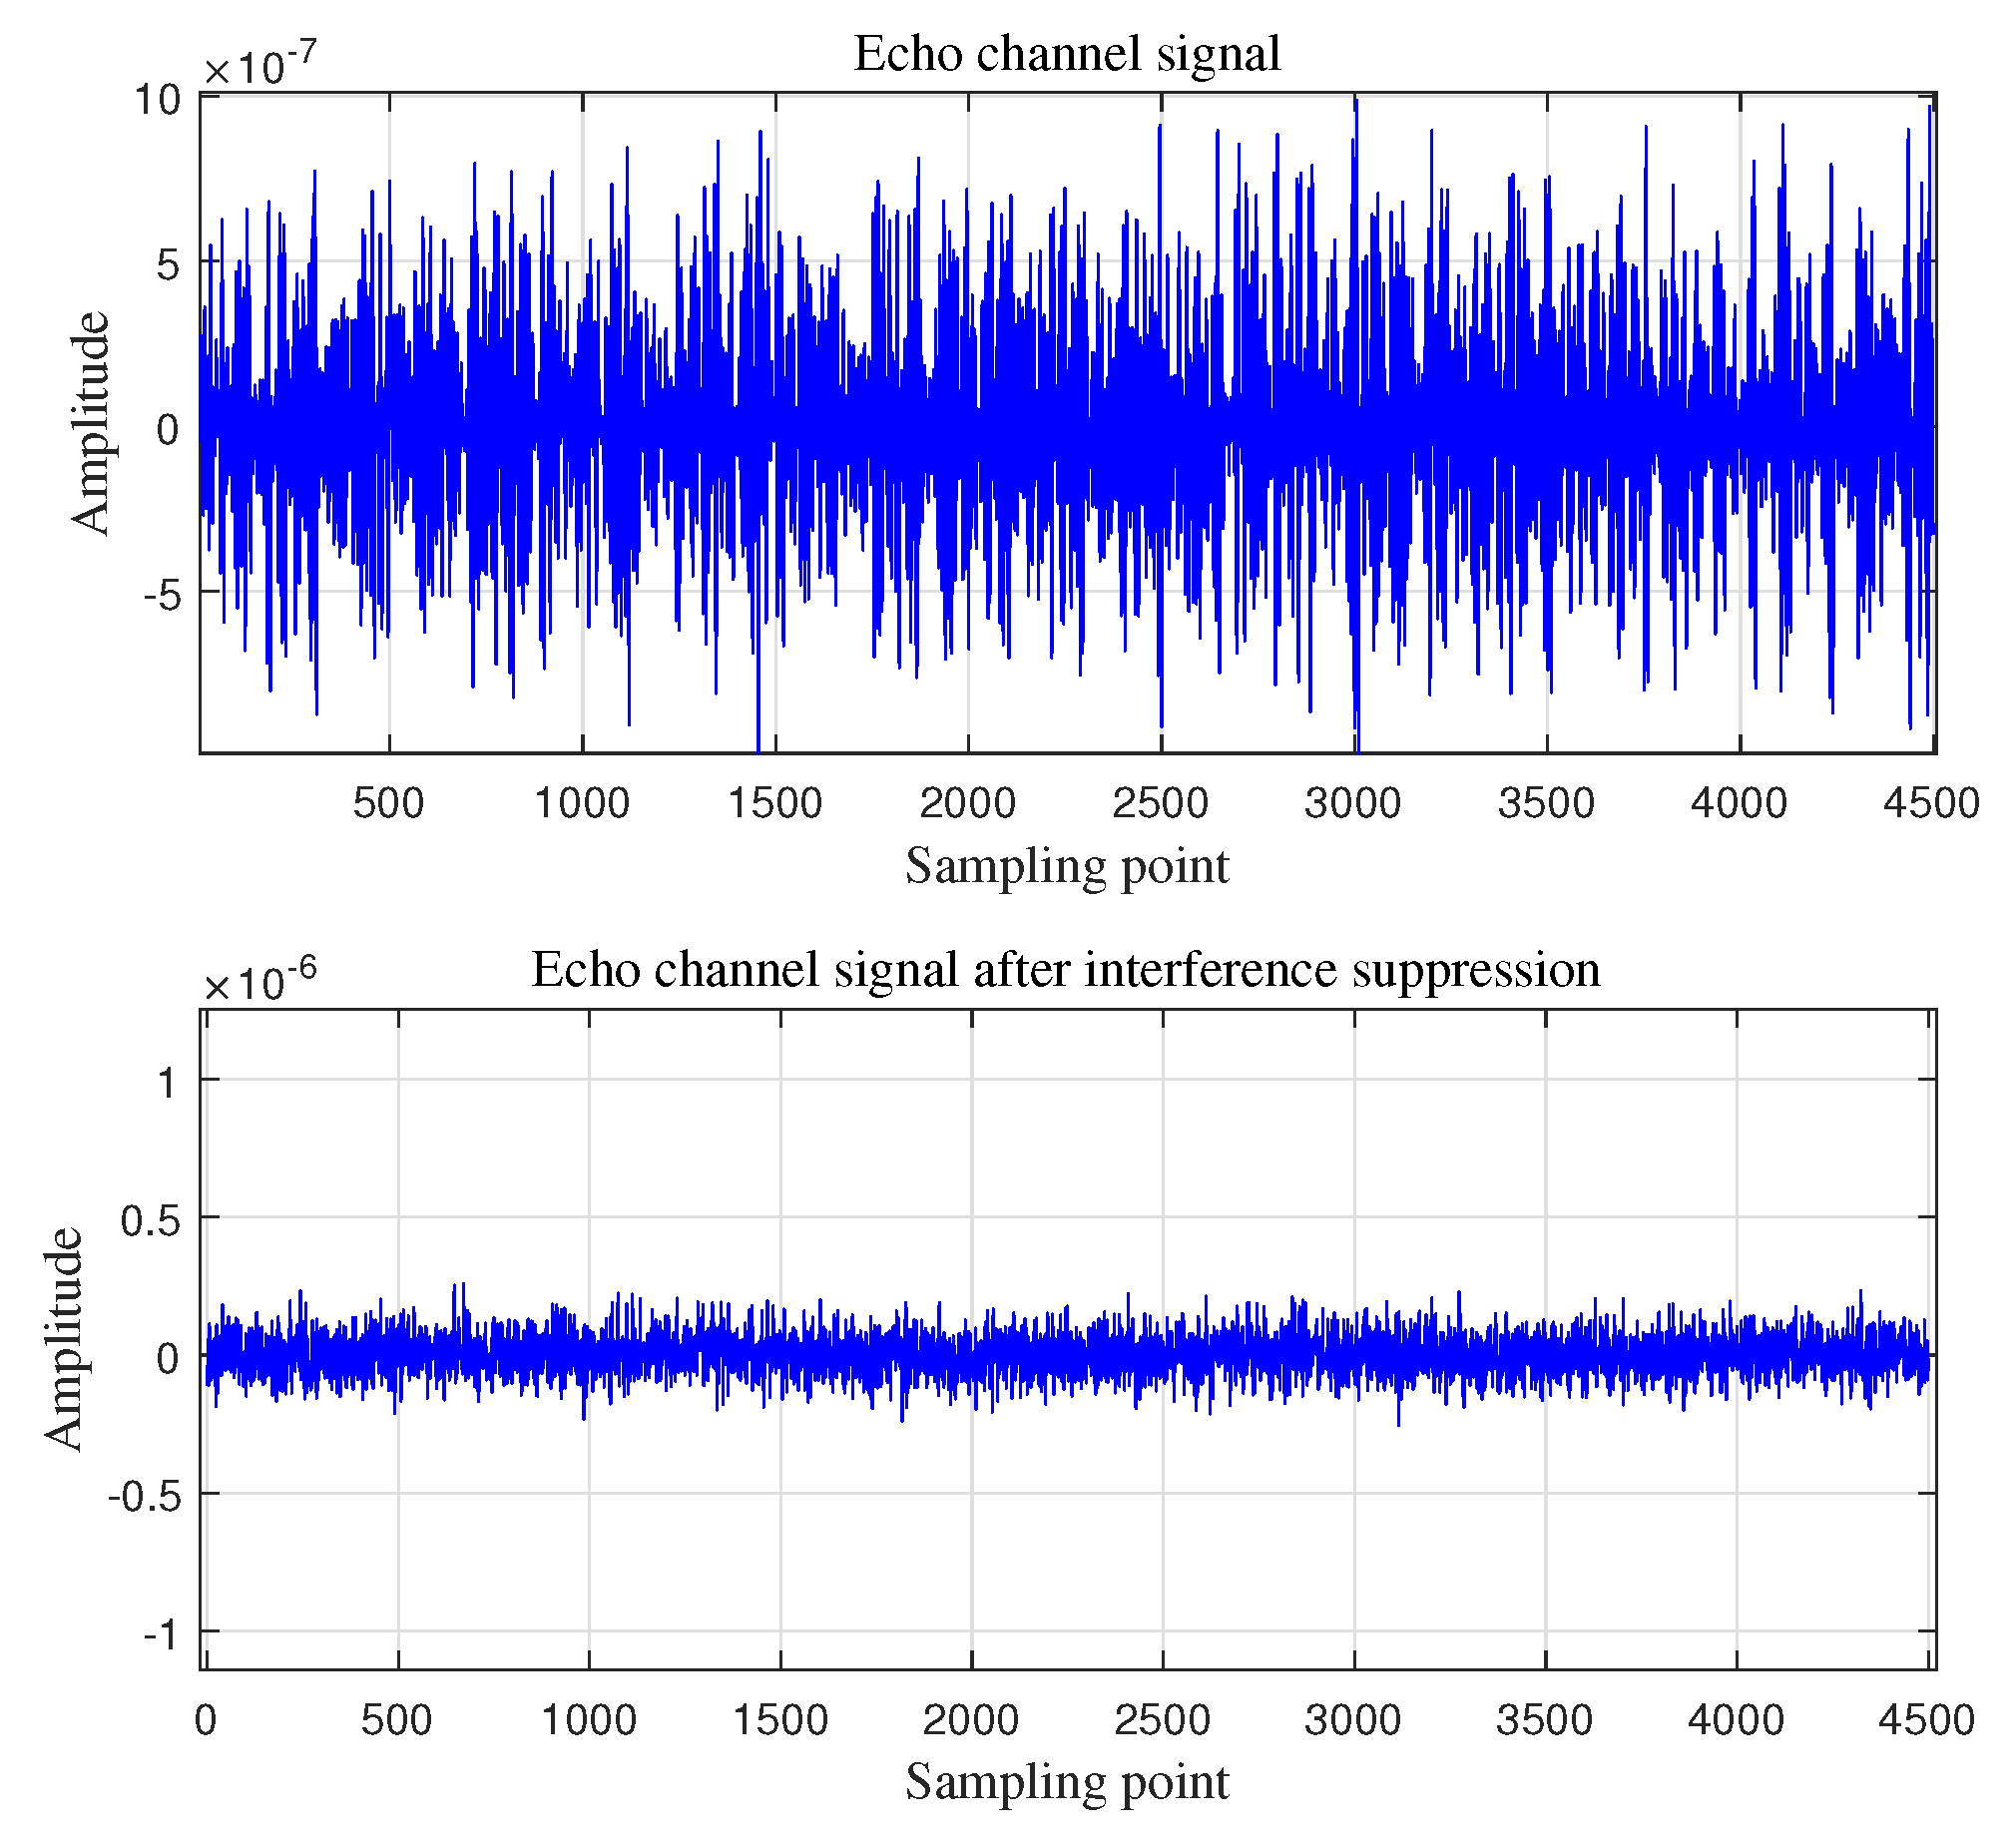
Figure 11 shows the comparison of the monitoring channel signals before and after the DPI and MPI suppression methods proposed in this paper. It can be seen that the amplitude of the monitoring channel signal decreases after interference suppression, which proves that strong DPI interference has been effectively suppressed.
Figure 12 shows the CCF of the reference and echo signals after DPI interference suppression. It can be seen that the peak of the echo signal is clearly highlighted after the DPI interference suppression.
Figure 12 proves that the interference suppression scheme proposed in this paper can effectively suppress the DPI of the monitoring channel when the reference channel SNR is as low as −15 dB, and the reference channel has multiple GPS signals with similar power.
This section uses the multiple GPS reference signals separated and reconstructed to construct the delay spread matrix of the multiple satellite signals, and then finds the optimal weight based on the least squares criterion. Then, let approach multipath and then subtract from the monitoring channel to get the monitoring channel signal after DPI and MPI suppression.
4. Detection Statistics Construction
Due to the characteristics of the external radiation source detection system and the weak power of the GPS itself, the target echo power is relatively low. The traditional CAF often needs to increase the coherence time of the direct wave and the echo to accumulate the energy of the weak echo [
33]. However, long-term coherent accumulation leads to an increase in computational complexity, and, since the range of detection is limited and the target moves faster, the accumulation time is greatly limited. In order to effectively enhance the signal-to-noise ratio of the detected quantity under the condition of equivalent coherence time, in this section, the anti-jamming properties of cycle cross ambiguity function (CCAF) are used to construct the detection statistics of multiple GPS weak echoes, and the coordinate detection algorithm is used to fuse multiple detection statistics to obtain the final detection statistics. This process enhances the signal-to-noise ratio of the detection statistic from the two aspects of detection structure and multi-star data fusion, and improves the detection probability of weak echo. In order to judge the performance of CCAF in the multi-satellite system compared with the traditional CAF detection structure, in this paper, the CAF-based detection statistic and the CCAF-based detection metric are constructed respectively, and the theoretical analysis and simulation performance verification are carried out, respectively.
4.1. Detection Statistic Construction with a Single GPS Satellite
(1) Detection statistics based on CAF
The signal
of the reconstructed reference signal
is selected, and the carrier frequency information
of the locally known reference signal
is used for down-conversion processing to obtain the down-converted reference signal
. Then, the same down-conversion process is performed on the monitoring channel signal
after DPI and MPI suppression, and the down-converted reference signal
is obtained. In addition, calculate the CAF of
and
to obtain the Doppler-time delay spectrum of the i-th GPS satellite, which is expressed as
The discretization of Equation (
13) is expressed as
where
is the delay,
f is the Doppler shift,
T represents the accumulation time,
stands for the sampling period, and
N is the number of sampling points.
(2) Detection statistics based on CCAF
To construct a detection using CCAF, we first need to do a cyclic autocorrelation of the reference signal
as
Then, the cyclic cross-correlation of the reference signal
and the echo signal
is
where
is the delay,
represents the cyclic frequency, and
N stands for the number of sampling points.
The vectors at the cyclic frequencies
and
corresponding to the maximum peak values of
and
are respectively extracted, and are recorded as
and
. The mutual fuzzy function processing is performed on these two vectors to obtain
where
represents the CCAF between the monitoring channel signal and the reference signal,
u is the delay, and
f is the Doppler shift.
4.2. Detection Statistics Construction with Multiple GPS Satellites
Due to the different distribution positions of different GPS satellites, the peak coordinates of multiple GPS satellite echo detections and are also different. Thus, it is impossible to add a plurality of detection amounts to the fusion structure detection statistic. Aiming at this problem, this section unifies the detection peak coordinates of different satellites by coordinate transformation, which can superimpose the echo detection spectrum of several different GPS satellites to achieve the purpose of non-correlated cumulative enhanced signal-to-noise ratio. Thereby, a detection statistic with a higher SNR is constructed.
Figure 13 shows the geometry of the receiving system, where
is the signal arrival angle,
is the angle between the bistatic angle bisector and the speed
of the aircraft, and
is the bistatic angle. It can be seen from the figure that the positions of different GPS satellites are different, so the delay
and the Doppler shift
corresponding to the peak values of the two-dimensional correlation between the different satellite reference signals and the monitoring channel echo signals are different. However, the common edge
and the velocity
corresponding to different peak coordinates
and
are the same, so the detection spectrum can be converted from the delay-Doppler dimension to the distance velocity dimension so that the coordinate peaks are the same. Thereby, it is possible to accumulate different detection amounts. The relationship between
and
and
and
is
Solving Equation (
18) can obtain:
where
, and
represents the speed
v of the target on the bisecting angle bisector, and
can be obtained from
The detection quantities
and
obtained by different methods are transformed by Equations (
19) and (
21) to obtain distance-velocity spectra
and
, which are expressed as:
At this time, the detection amount
or
of the plurality of GPS satellites can be non-coherently superimposed in the distance-speed domain. The final superimposed detection statistics obtained by the two methods as
where
represents the distance from the target to the receiver and
V represents the speed of the target. It can be seen from the above process that this paper uses the multiple GPS reference signals separated and reconstructed to calculate the detection quantity of different GPS satellites as the illumination source, which provides more favorable information for target detection. However, due to the different peak values of the detected quantities obtained by multiple GPSs, these detection quantities cannot be effectively fused, so this paper uses the coordinate fusion algorithm to combine them to obtain the final detection amount after peak enhancement.
5. Moving Aerial Target Detection Performance Analysis
In order to better design the decision threshold of the detector and evaluate the detection performance of the two detection quantities, this section analyzes the probability distributions of and , respectively.
For convenience, the reference baseband signal
of the GPS satellite is first discretized and expressed as
where
is the amplitude of the baseband reference signal,
is the baseband reference signal after the amplitude normalized, and
stands for the sampling period.
The signal
of the monitoring channel is discretized and then expressed as
where
is the amplitude of the echo signal,
is the amplitude-normalized echo signal,
is the complex Gaussian noise obeying the
distribution, and
is the Gaussian distribution.
The binary hypothesis of echo signal detection is: assuming that
is the target existence, the signal
of the monitoring channel contains the echo signal
corresponding to a certain reference signal
. Assuming that
indicates that the target does not exist, the signal
of the monitoring channel does not contain any echo signal corresponding to
, which is expressed as follows:
5.1. Performance Analysis of Detection Based on CAF
Lemma 1. The distribution of the detection statistic under the hypothesis iswhere represents the complex Gaussian process. As with the analysis under the
hypothesis, it can be concluded that the detection statistic distribution under the
hypothesis is
Using the data fusion technique of multiple GPS satellites, according to the cumulative nature of the Gaussian distribution, the distribution of the final detection statistic
is
The false alarm probability of detecting weak echo signals from different GPS satellite sources by Equations (
28) and (
31) is given by
where
is the probability density function of
.
From Equation (
33), it can be concluded that the adaptive detection threshold
is
According to Equationss (
A2), (
32), and (
34), the detection probability can be obtained by using signal detection theory:
where
is the Marcum Q function, and
is the probability density function of
.
From Equation (
35), it can be seen that the theoretical detection probability of the multi-star weak echo joint detection based on the CCA detection quantity construction method is related to the parameters such as the monitoring channel noise, the number of sampling points
N, the number of satellites, and the false alarm probability. It can be seen that the detection probability is proportional to the number of satellites
M, that is, the detection probability increases with the number of satellites. It is theoretically proved that the weak echo combined detection of multiple GPS satellites has a higher detection probability than the weak echo detection of a single GPS satellite, but the method does not reflect the noise suppression performance.
5.2. Performance Analysis of Detection Based on CCAF
Lemma 2. The probability distribution of under hypothesis is Using the same analysis method to analyze the
hypothesis, the distribution of the detection quantity
of a single GPS satellite under the
hypothesis is given by
Using the data fusion technique of multiple GPS satellites, according to the cumulative nature of the Gaussian distribution, the distribution of the final detection statistic
is
and
According to Equation (
38), the false alarm probability can finally obtain:
where
is the probability density function of
.
The detection threshold
in the solution Equation (
40) is
According to Equations (
A14), (
39), and (
41), the detection probability can be obtained by using the signal detection theory
where
is the Marcum Q function.
It can be seen from Equation (
42) that the theoretical detection probability of the GPS weak echo signal detection method based on multi-star data fusion is related to the parameters, such as the monitoring channel noise, the number of sampling points
N, the number of satellites, and the false alarm probability. It can be seen that the detection probability is proportional to the number of sampling points
N and the number of satellites, that is, the detection probability increases with the number of sampling points
N and the number of satellites. It is theoretically proved that the GPS weak echo signal detection method based on multi-star data fusion can improve the detection performance from the number of sampling points and the number of satellites. In addition, by comparing Equation (
32) and Equation (
39), it can be found that the power of the noise of the detection statistic constructed based on the CCAF algorithm decreases as the number of sampling points increases. However, the detection statistic based on the CAF algorithm does not have this property, so the CCAF-based detection statistic construction method has good noise immunity in the proposed algorithm.
6. Numerical Results and Discussion
In order to analyze and verify the effectiveness of the proposed detection algorithm and the influence of various factors on detection, this section presents several simulation experiments using MATLAB (9.5.0.944444 (R2018b), MathWorks Company, Natick, MA, USA) and simulation parameter setting according to [
34,
35].
Experiment 1: In order to compare the detection performance of CAF and CCAF, this experiment fixes the false alarm probability, the power difference between the reference signal and the echo signal, the number of sampling points, the number of satellites, etc. The delay and Doppler shift of the echo relative to the direct wave are set as 1 us and 500 Hz, respectively. The SNR of the echo is in the range from −90 dB to −30 dB. For different detection quantity construction methods, 2000 Monte Carlo simulation experiments are carried out on the GPS weak echo detection method based on multiple satellites data fusion. The parameters are substituted into the theoretical detection probability Equations (
35) and (
42) to compare them with the simulation. The specific simulation parameters are shown in
Table 4.
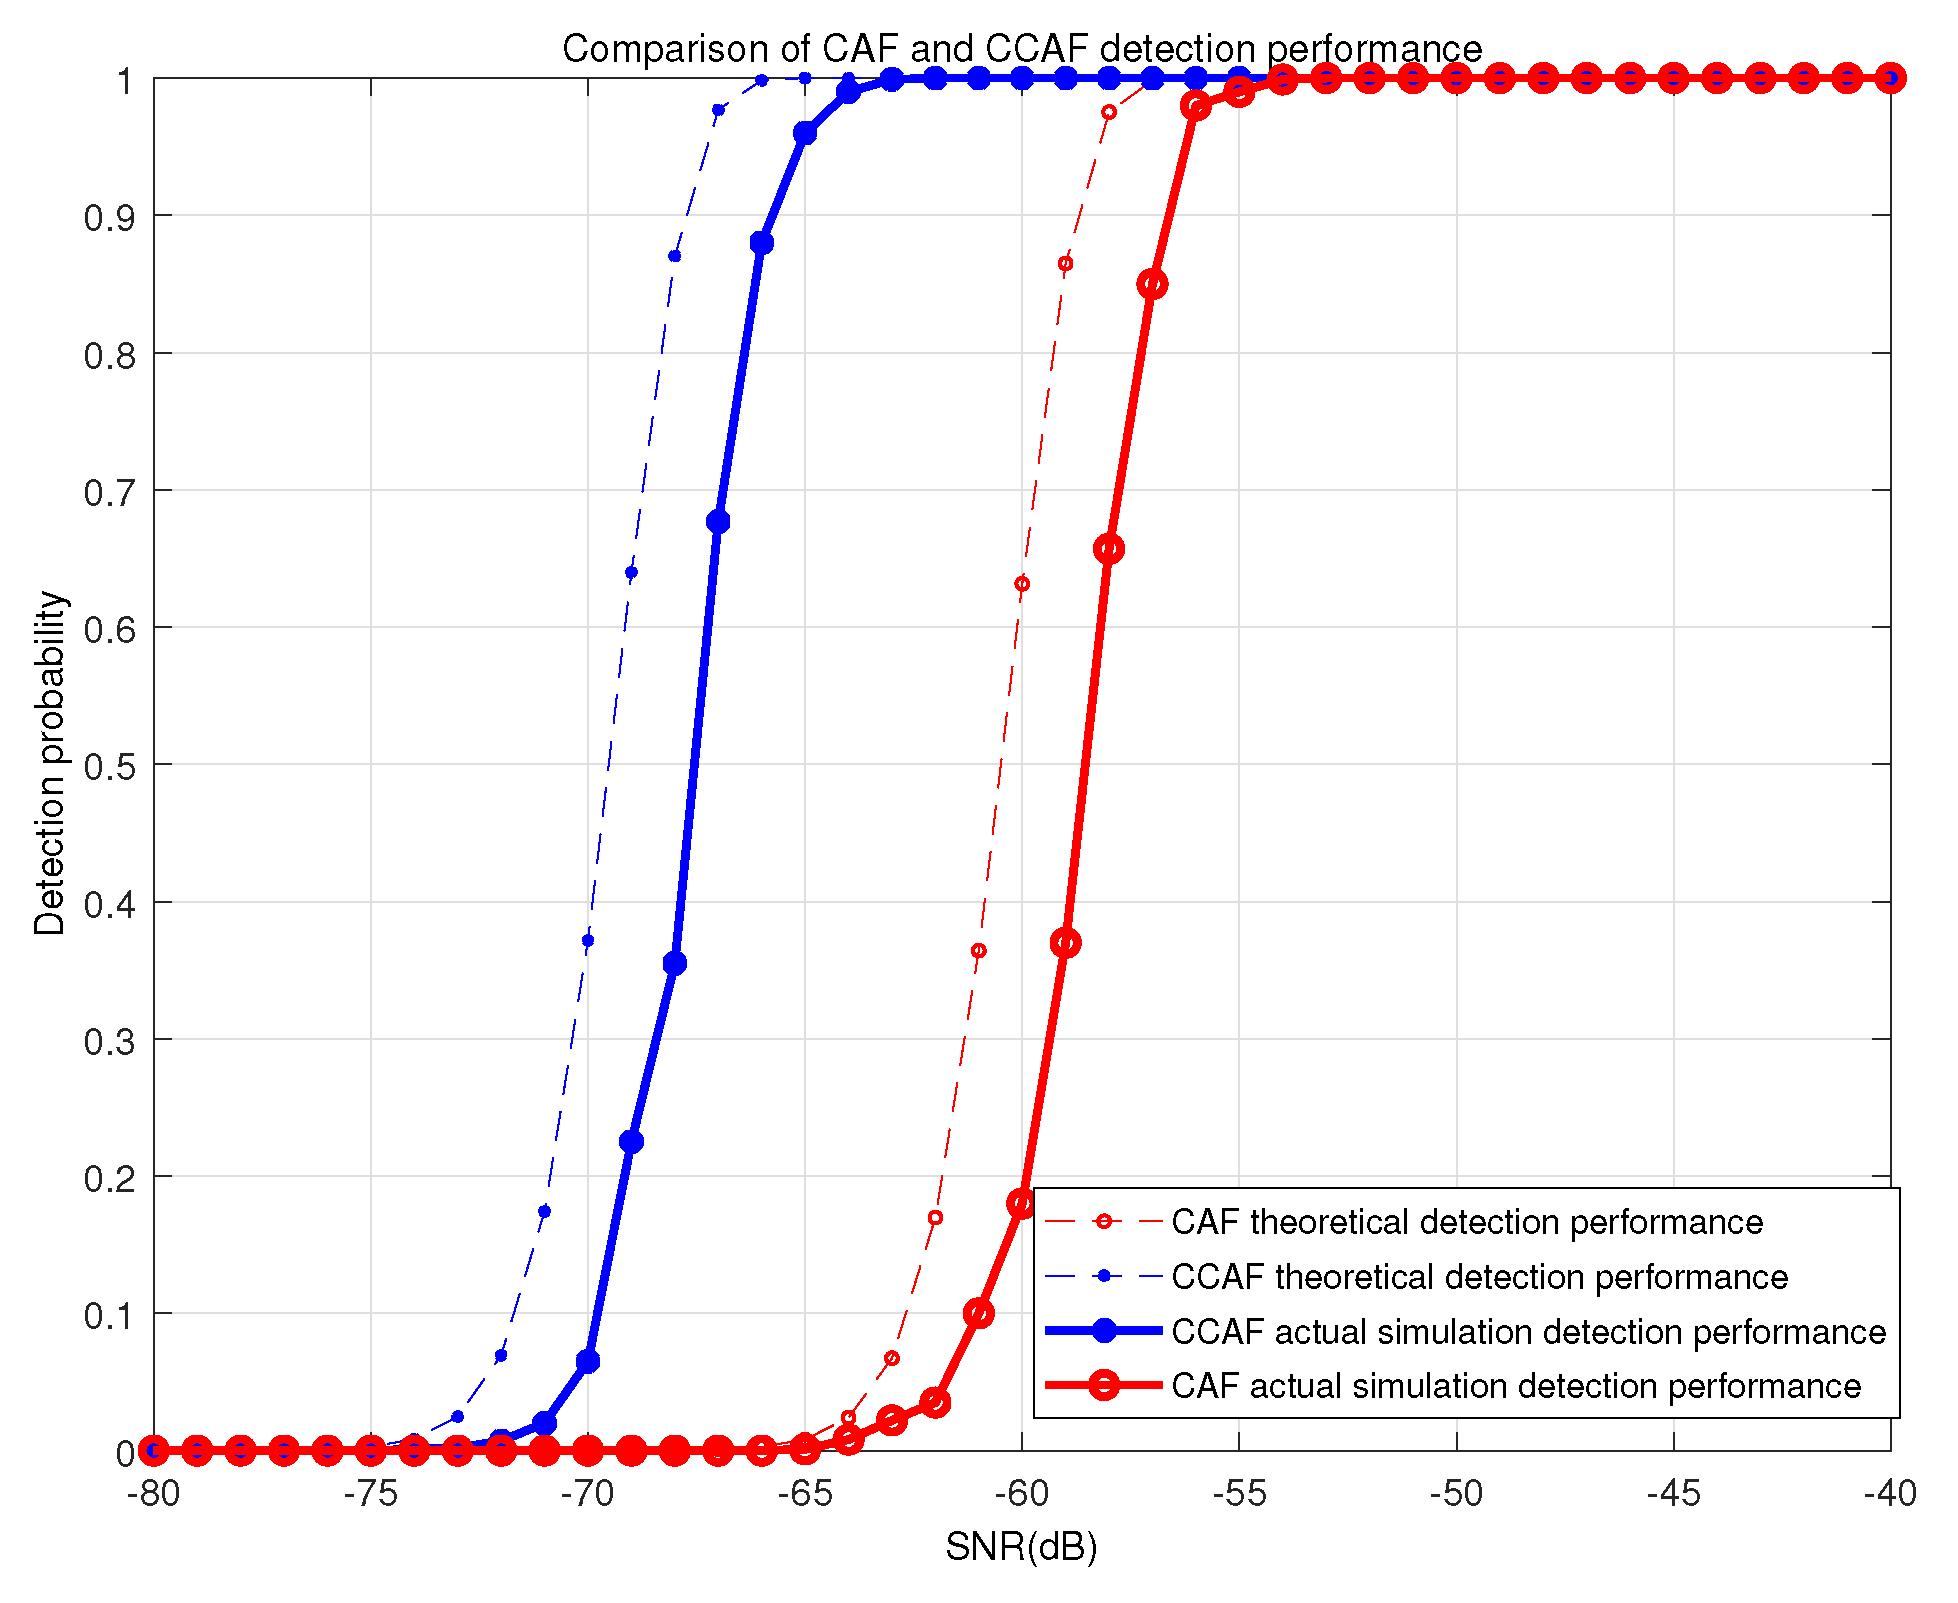
It can be seen from
Figure 14 that, under the same conditions, the simulated detection probability could reach 99% at a SNR of −55 dB. When the SNR of the CCAF algorithm is −64 dB, the simulated detection probability also reaches 99%. Therefore, the CCAF algorithm is about 9 dB better than the CAF algorithm, and the difference between simulation results and theoretical results is 2 dB, which verifies the effectiveness of the method. The above simulation results show that CCAF has a certain noise suppression capability compared with CAF because the noise does not have cyclostationarity. Moreover, according to Equation (
A19), it can be seen that the noise power in the CCAF-based detection decreases as the number of points increases, while CAF does not have this property. This experiment verifies the validity of the theory, showing the noise resistance of the CCAF.
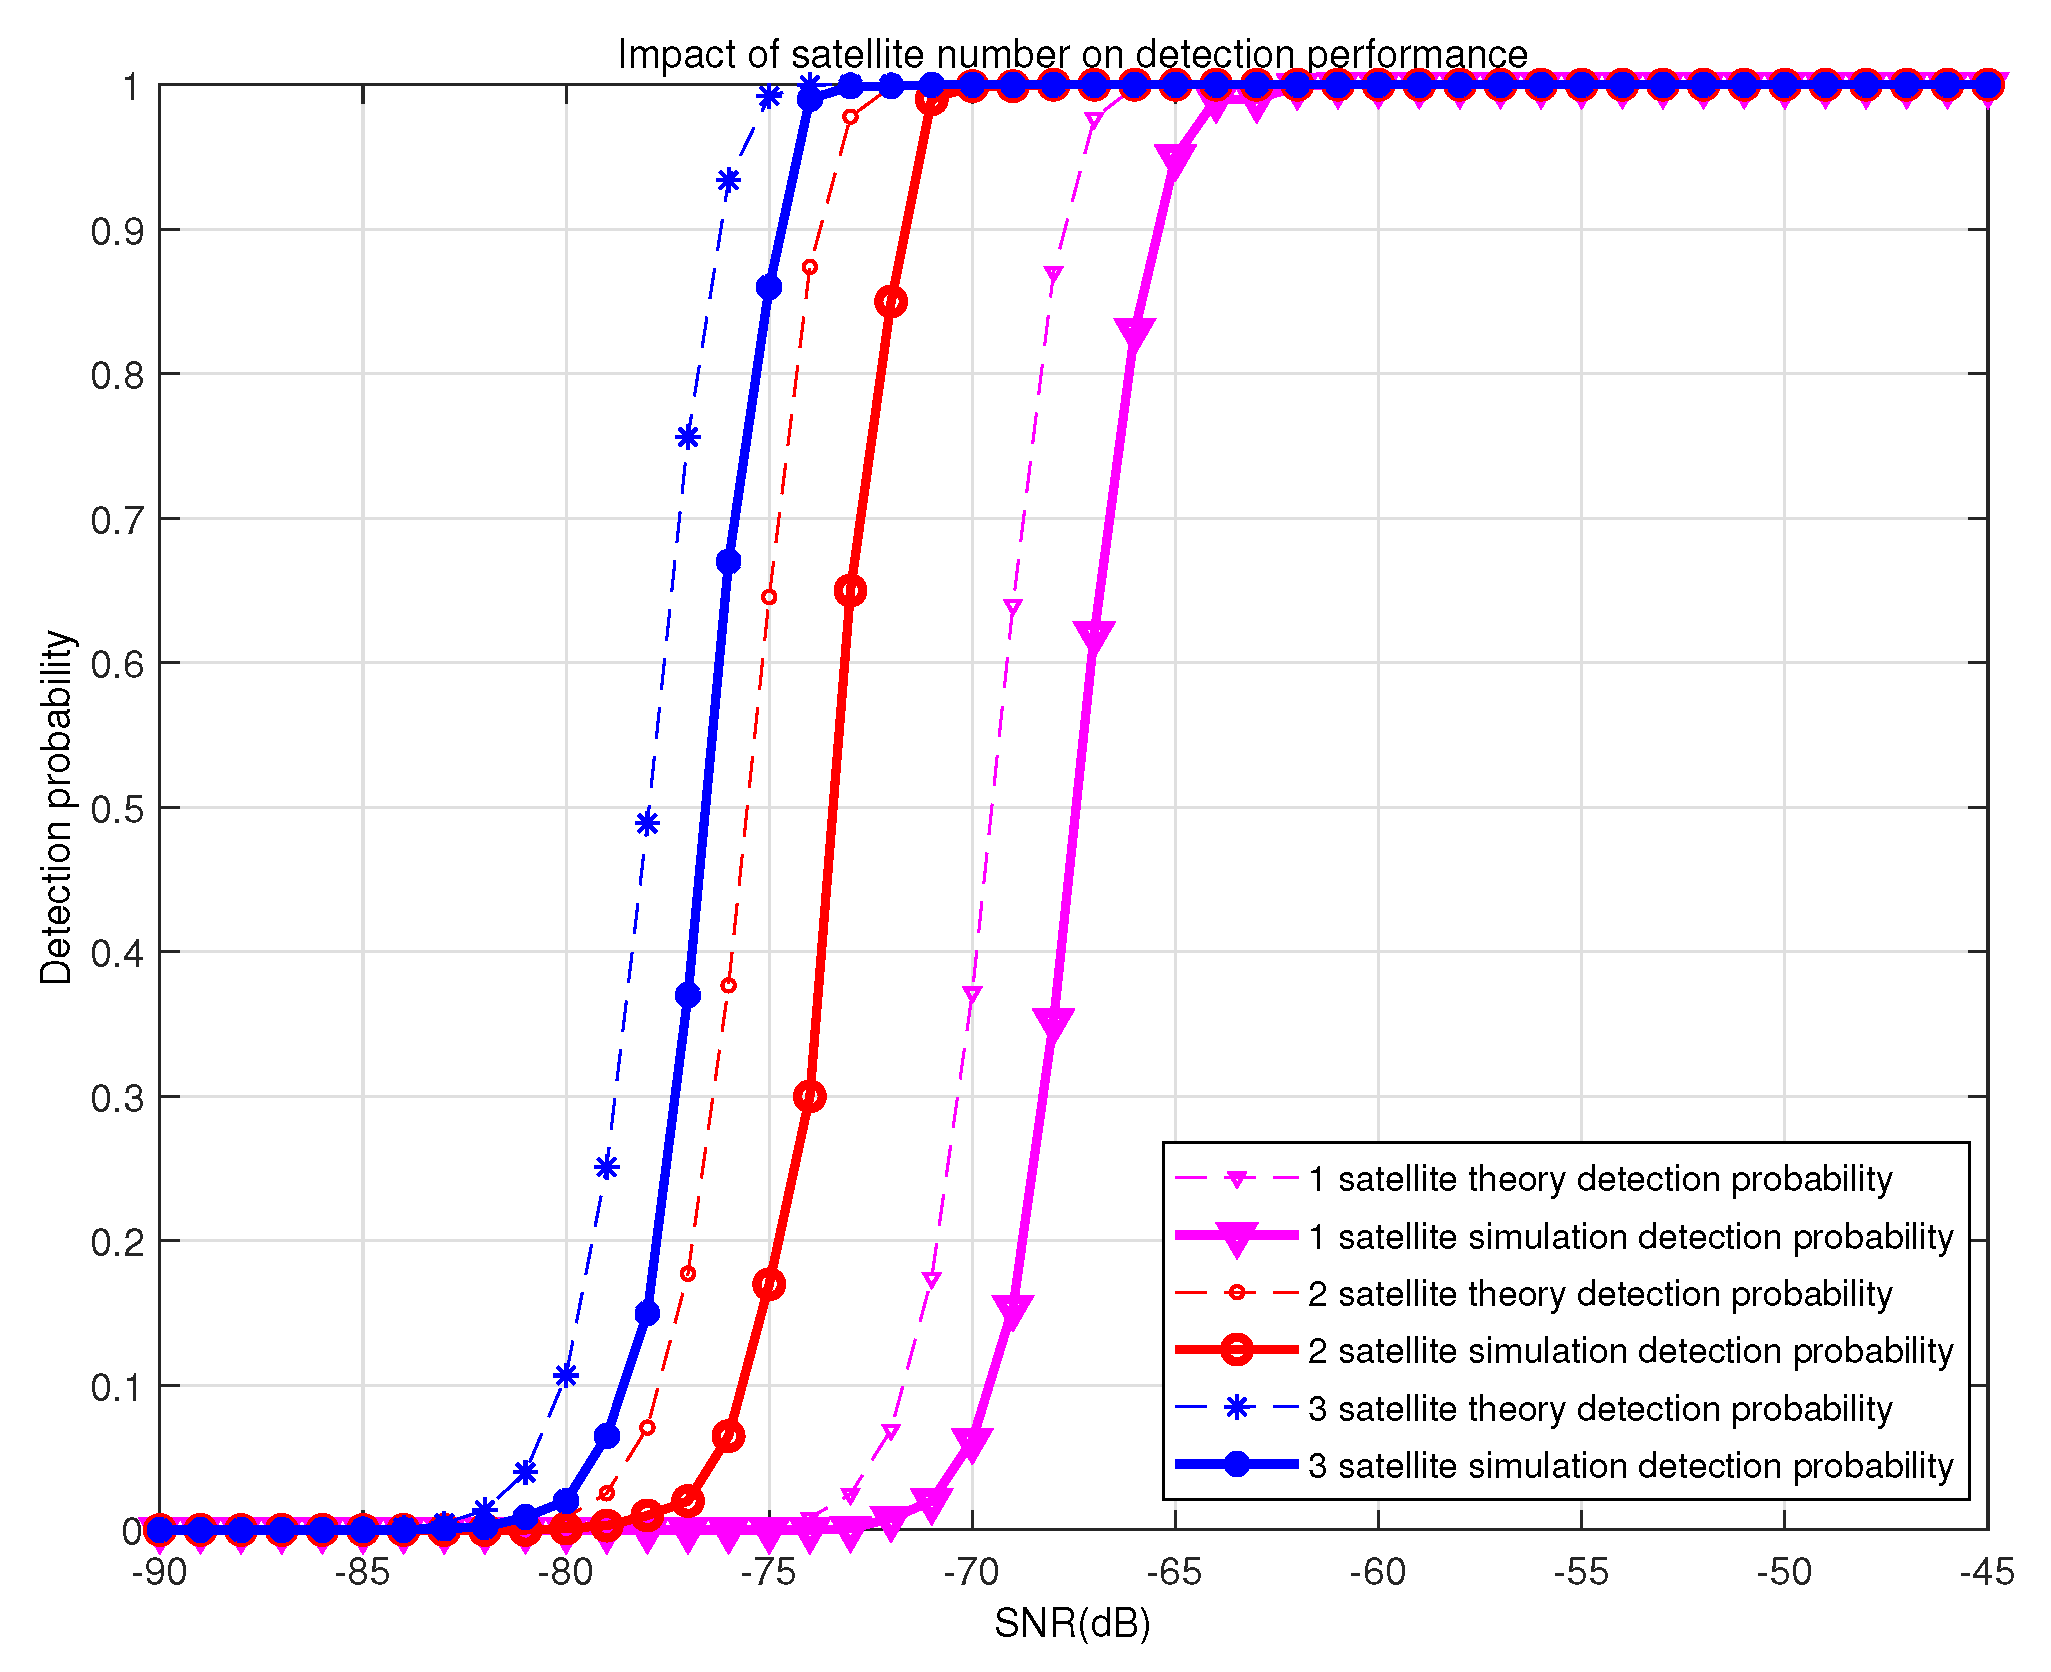
Experiment 2: This verifies the detection performance of the GPS weak echo signal detection method based on multi-star data fusion for different satellite number conditions, the false alarm probability, GPS direct wave power, and sampling points. Assuming that the target is 10 km away from the receiver, the speed is 600 m/s, and the arrival angles
of the three echoes are
,
,
, respectively. It is concluded that the time delay and Doppler shift of the echo relative to the direct wave are 10 us, 3157 Hz, 11 us, 2669 Hz, 16 us, 2467 Hz, and the echo power is 70 dB different from the direct wave power. The SNR range of the echo is from −90 dB to −30 dB. For different satellite numbers, 2000 Monte Carlo experiments are carried out on the detection method of the GPS weak echo signal based on data fusion of multiple satellites. Finally, the parameters are substituted into Equations (
35) and (
42), and the theoretical detection probability is compared with the simulation. The specific simulation parameters are shown in
Table 5.
From
Figure 15, it can be seen that, under the same conditions, the detection probability of a satellite is 99% when the echo SNR is −65 dB, and the detection probability of two satellites is 99% when the echo SNR is −71 dB, and the detection probability of three satellites is 99% when the echo SNR is −74 dB, and the simulation and the theoretical detection performances are only about 2 dB in difference. The validity of the method is verified. The above simulation results show that, compared with the traditional single satellite detection, the fusion of multiple satellite detections can effectively enhance the detection performance. On the one hand, the algorithm can effectively convert multiple GPS delay–Doppler detection peak coordinates (10 us, 3157 Hz), (11 us, 2669 Hz), (16 us, 2467 Hz) to distance–speed detection peak (10 km, 600 m/s). Furthermore, a plurality of echo peaks can be superimposed, thereby enhancing the peak value of the echo peak. On the other hand, the method uses the CCAF algorithm to construct the detection amount, which suppresses the noise caused by the cross terms. Therefore, the method enhances the detection performance from two aspects: the cumulative effect of the multi-star detection fusion on the echo peak and the de-noise of the CCAF detection structure. However, it is necessary to consider that there are only 7–8 GPS satellites in the zenith at the same time, and detection performance improves as the number of satellites increases.
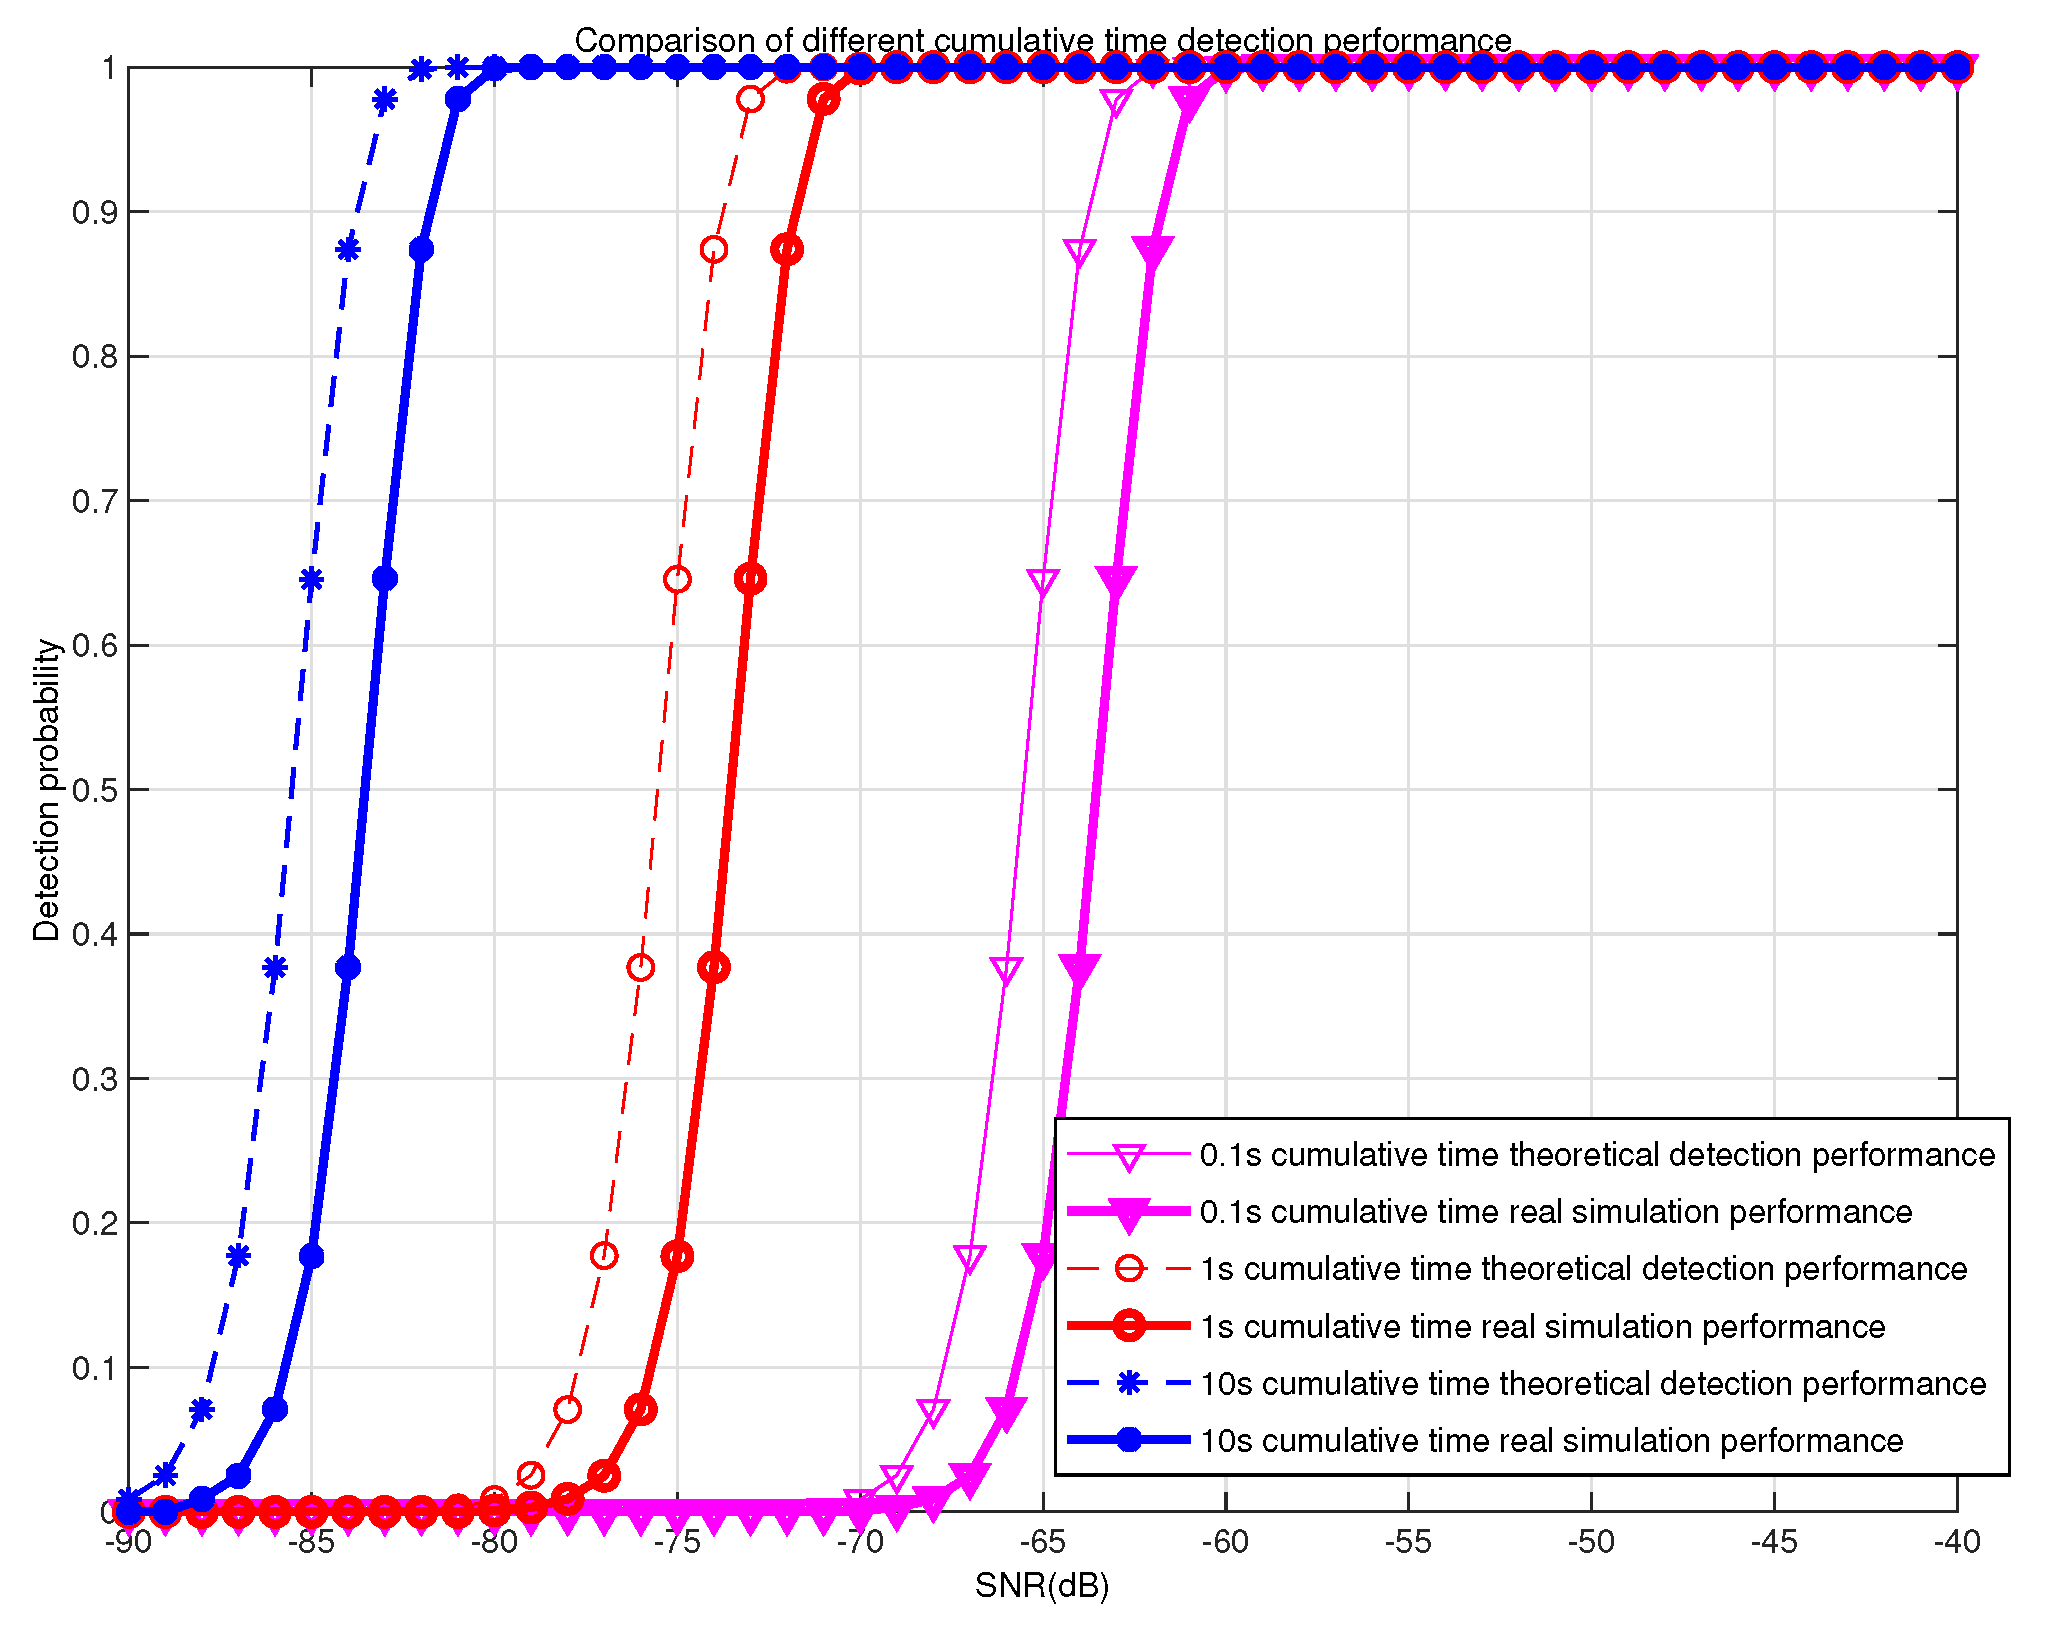
Experiment 3: In order to verify the influence of the accumulated time of the signal on the detection performance, we set the parameters of the false alarm probability, the direct wave power of GPS, the number of satellites, etc. The echo parameters are set according to Experiment 2. The SNR of the echo ranges from −90 to −30 dB. The Monte Carlo experiment was performed on the proposed algorithm under the condition that the number of sampling points changed from
to
points. Finally, the parameters are substituted into Equation (
35) and Equation (
42), and the theoretical detection probability is compared with the actual simulation. The specific simulation parameters are shown in
Table 6.
From the results in
Figure 16, it can be seen that, under the same conditions, in the case of echo SNR of −60 dB, the detection probability of the cumulative time of 0.1 s reaches 99%; in the case of echo SNR of −71 dB, the detection probability of the cumulative time of 1 s reaches 99%, in the case of echo SNR of −78 dB, the detection probability of the cumulative time of 10 s reaches 99%, and the simulated and theoretical detection performances are only 2 dB in difference, which verifies the effectiveness of the method. From the simulation results, it can be found that, as the accumulation time increases, the detection probability of the algorithm will increase. This is because CCAF is two-dimensional correlation. Therefore, the longer the correlation accumulation time, the larger the energy accumulated by the target echo will be. At the same time, as the accumulation time increases, the noise floor of the detection amount is also suppressed. Therefore, the number of sampling points
N is one of the key factors affecting the detection performance of the proposed method. It is possible to increase the detection probability by using a longer accumulation time as much as possible, but the accumulation time cannot be increased indefinitely due to the limited detection area.
Experiment 4: When the detection system detects the target of the specified area, the detection performance is mainly affected by the radar cross section (RCS) area of the target due to the fixed detection distance, and the change of the RCS size causes the change of the direct wave and the echo power ratio (SDR). In order to verify the influence of the attenuation of GPS signal caused by RCS on the detection performance of the proposed algorithm, the experimental fixed false alarm probability, reference signal power, noise power, number of satellites, and sampling points. The echo parameters are set according to the second experiment. Under the condition that the SDR variation range is 105 dB to 60 dB, the RCS corresponding variation range is 0.01
to 96.3
, and 2000 Monte Carlo experiments are performed on the proposed algorithm. Finally, these parameters are substituted into Equations (
35) and (
42) to compare with the actual simulation. The specific simulation parameters are shown in
Table 7.
From the results in
Figure 17, it can be seen that the detection probability can reach 99% when the difference between the direct wave and echo power reaches 80 dB. At the same time, when the detection distance is about 10 km, the weak echo detection algorithm based on the multiple satellites data fusion proposed in this paper can effectively detect the weak GPS signal with an 80 dB attenuation. Both theoretical analysis and simulation verify that the proposed algorithm can effectively detect close-range targets.
