Article

Bridging the Semantic Gap between Land Tenure and EO Data: Conceptual and Methodological Underpinnings for a Geospatially Informed Analysis

Chair of Land Management, Department of Aerospace and Geodesy, Technical University of Munich (TUM), Arcisstrasse 21, 80333 Munich, Germany
*
Author to whom correspondence should be addressed.
Remote Sens. 2020, 12(2), 255; https://doi.org/10.3390/rs12020255
Submission received: 4 November 2019 / Revised: 28 December 2019 / Accepted: 6 January 2020 / Published: 10 January 2020
(This article belongs to the Special Issue Remote Sensing for Land Administration)

Abstract

:
When spatial land tenure relations are not available, the only effective alternative data method is to rely on the agricultural census at the regional or national scale, based on household surveys and a participatory mapping at the local scale. However, what if even these are not available, which is typical for conflict-affected countries, administrations suffering from a lack of data and resources, or agencies that produce a sub-standard quality. Would it, under such circumstances, be possible to rely on remotely sensed Earth Observation (EO) data? We hypothesize that it is possible to qualify and quantify certain types of unknown land tenure relations based on EO data. Therefore, this study aims to standardize the identification and categorization of certain objects, environments, and semantics visible in EO data that can (re-)interpret land tenure relations. The context of this study is the opportunity to mine data on North Korean land tenure, which would be needed in case of a Korean (re-)unification. Synthesizing land tenure data in conjunction with EO data would align land administration practices in the respective parts and could also derive reliable land tenure and governance variables. There are still many unanswered questions about workable EO data proxies, which can derive information about land tenure relations. However, this first exploration provides a relevant contribution to bridging the semantic gap between land tenure and EO data.

1. Introduction

Land tenure data contain geospatial, anthropological and socioeconomic attributes since it builds on both the physical delineation of land and the identification of social relations governing land use, land access and land ownership [1,2]. Collecting land tenure data is, however, neither administratively straightforward nor always technically feasible or financially affordable. There are even many challenges which make collecting land tenure data complex, such as data availability and data accessibility [3,4]. However, new data collection technologies, including, amongst others, voluntary geographic information in connection to social media technologies, Unmanned Aerial Vehicles (UAVs) and big data mining may overcome some of these barriers. Yet, there is a dearth of the methodological reflections in how such geospatial technologies can identify and formalize land tenure relations. What these technologies are currently able to do includes: (1) underpinning land tenure-enabling environments; (2) mining land tenure data; (3) transforming land tenure relations [5]. However, the quality of all these heavily depends on the completeness and full access of the terrain and the data sources. In many cases these basic criteria cannot be guaranteed, leaving the land tenure information scarce [1].
A promising and yet unexplored technology to derive socio-legal land tenure information is Earth Observation technology. The utilization of Earth Observation (EO) data has increased significantly in many disciplines. Literature shows applications ranging from environmental and regional studies to economics, and peace and conflict research, for example [6,7,8,9]. More specific to the interest of this paper, there is growing body of literature on methods to extract and map cadastral boundaries using EO data [10,11,12,13,14,15,16,17,18,19]. However, this literature rarely effectively bridges the knowledge gap between social land tenure and spatial descriptions of boundaries. In other words, the (even automated/machine-learning based) spatial descriptions do not identify the underlying social or legal relations to land, such as effective land ownership, private or communal land use or land access rights or presumed land claims.
The methods in detecting, extracting and identifying land tenure relations always require both geometric or topographic characteristics and ground-truth information of land tenure. However, spatially explicit land tenure relations through EO data remains one of the foremost challenges. As a societal institution, land tenure has a great influence on how people decide on land use. Such decisions are observable in land cover changes and spatio-temporal patterns of land use (inducted from similarities, differences, repetitions or sudden changes in space and time). The dynamics of landscape changes are intrinsically linked to land tenure relations and decisions [20,21,22]. Detecting and extracting physical features is possible by connecting spectral reflectance values, shapes, and texture features of ground components to be pre-defined. By sampling and generalizing these connections, one can construct algorithms, which detect and predict spatio-temporal patterns with EO data, such as the (rate of) land fragmentation, land ceiling and urban encroachment [16,23,24]. Such spatio-temporal processes could be connected to land tenure information if these are aligned with automated identification and reconstruction of cadastral boundaries. For example, the morphology of a cadastral boundary is associated with the spatial nature of land tenure on the aspects of, physical realm of land interests, temporal practices of land use rights and the legal nature of boundaries [25].
Then, how do we derive the features or characteristics of land tenure if we only have access to the physical objects or spectral changes in objects in time and in space? According to [26], land tenure aspects may cross multiple spatially observable boundaries in a given landscape. Additionally, tenure and land right boundaries are also not always visible through specific elements in the landscape or through specific spectral reflectance values. One still needs to combine the location of specific landscape elements to alternative data source, such as agricultural census data at the regional or national scale, and/or household surveys and a participatory mapping at the local scale [1,27]. Nevertheless, what if these locally collated datasets are not available? Is it in such cases still possible to rely on EO data only, combined with a set of basic assumptions about the spatial nature of land tenure? We hypothesize that this is possible; however, this requires a set of fundamental proxies connected to specific documented knowledge on land tenure. This article will describe how this is possible and under which conditions this is possible.
The first challenge to overcome this problem is to address the degree of semantic information connected to spatial information. When it comes to extracting socio-spatial aspects of land tenure using EO data, the formalized and proven semantic rules do not yet exist. Or more precisely, the rules and assumptions, which induce a land tenure relation type, do not yet exist. EO data only distinguishes “low-level semantic features” of land cover information such as physical features, spatial objects and configuration of ground components. In contrast, land tenure information requires “high-level semantic features” connected to knowledge-based information, and reflecting institutionalized human-land relationships and based upon the varying human socio-economic activities on land such as land use and ownership trajectories. In other words, the low-level semantic features provided by direct EO data acquisition methods are insufficient for the derivation of land tenure relations. One needs some sort of socialization of the pixels, i.e., a high-level semantic data collection and interpretation procedure which represents knowledge epitomized by indirect access to EO data. In practice, there is a discrepancy between the levels of detected low and high-level semantic features and it is labelled as the “semantic gap” [24,28,29]. Therefore, it is important see how the process of socialization of pixels can take place and how EO data can be (re-)interpreted into semantic land tenure relations with a rational and rigorous methodology. Only then, it is possible to identify, bridge and close the semantic gap.
Hence, this paper makes a review of the challenges posed by the identification of land tenure relations from Earth Observation data. In order to overcome some of these challenges, we propose to use a mix of methods and information fusion to identify proxies that may help derive unknown land tenure relations. This illustrates our approach by constructing proxies for land tenure relations over North Korea. The research questions are:
  • Which kind of land tenure-related data can one derive and acquire when information access is limited?
  • Which proxies can help to derive currently unknown land tenure relations in conjunction with EO data?
We first present the conceptual foundations of EO data applications for identifying land tenure relations. The next section addresses substantive and methodological considerations. Then, we explore a set of proxies in relation to five land tenure related questions. Finally, the conclusion gives brief summary and provides recommendation on how to proceed with this research.

2. Fundamentals of EO data Applications for Identifying Land Tenure Relations

2.1. The Conceptual Models of Semantic Land Tenure Relations

The lists in Table 1 are a number of key models and concepts capturing land tenure relations. Henssen [30] depicts land tenure as institutionalized people-to-land relationships with his “Subject-Right-Object model” [31]. This basic model of land administration has been further modified by for example highlighting the dynamics of land tenure [32]. The “Land Administration Domain Model (LADM)” is to a large degree an extended and more sophisticated model of the basic model, and has become both a conceptual and descriptive standard (ISO 19152). The LADM covers all land tenure-related data components including parties, legal/administrative units, spatial objects, and data on surveying and spatial representation. The LADM can bridge the gap between land policies and information management opportunities and is adaptable to local situations [33,34].
Furthermore, the “Continuum of Land Rights” approach emphasizes that land tenure arrangements vary along a continuum of land rights. Not only documented formal land rights are legitimate, but also undocumented informal land rights may exist, and society may accept or condone these alongside formal rights. The continuum of land rights approach is useful in describing de facto land tenure, which is much more fluid and flexible than the static and unchanging (spatio-temporal) description of land rights. It allows more flexibility to define and recognize land tenure based on evidence from the field [35].
The “Fit-For-Purpose land administration” approach mainly focuses on building geospatial data framework of large-scale mapping that can address emerging land tenure issues where no reliable land information exists. This framework highlights following constituent principles in order to not only improve recognition of “value-of information” and maximize “cost-effectiveness”, but also decrease “capacity-demanding”: (1) general boundaries rather than fixed boundaries; (2) aerial imageries rather than field surveys; (3) accuracy relates to the purpose rather than technical standards and; (4) opportunities for upgrading and improvement [36].
“Responsible land administration” expands the conventional notions of land administration with a normative framework. What is distinctive about this concept is that it takes the following aspects into account: the requirement for any land administration system to ensure the representation of multi-stakeholders in order to foster institutional innovation and inclusion; the incorporation of a broad array of scholarly disciplines into the methodological repertoire, in particular, connecting from technical and information sciences to the social sciences and humanities; the need for a proactive stance in laying the foundation of cutting-edge land administration systems design; connecting the global context to the local and vice versa; the continued need to transfer knowledge into the practice, and vice versa [37]. Technical and operational designs of land information systems can only be innovative if particular societal needs embedded in the design process and in the manner in which land administration is based on shared responsibilities.

2.2. Advancement of EO and AI Applications in Identifying Land Tenure Relations

One of the significant discussion in EO applications for land tenure relations is to provide the institutional and spatial aspects of cadastral boundaries by identifying relationships between physical objects and visual boundaries based on the notion of cadastral morphology [15,16] and cadastral intelligence [17]. The early experiment demonstrates that over 80% of cadastral boundaries coincide with visible physical objects [15]. In line with a previous endeavor, more tailored object-based workflows using extraction algorithms delineate about 50% of parcel boundaries successfully [16]. Investigating technically transferable workflows is a continuing concern within UAV-based cadastral mapping. For instance, both the gPb contour detection method and the ENVI feature extraction (FX) module has proven accurate results of visible object delineation that coincide with cadastral boundaries at completeness and correctness of up to 80% [11,13]. To extract visible cadastral boundaries within Object-Based Image Analysis (OBIA) environment from High Resolution Satellite Imagery (HRSI), the (semi-)automatic feature extraction methods have been employed and tested in rural areas: mean-shift segmentation with the buffer overlay method [18], and both multi-resolution segmentation (MRS) and estimation of scale parameter (ESP) (only able to automatically extract 47.4%) [17].
In light of state-of-the-art methods in land administration, a deep-learning is becoming highly prominent for the detection of cadastral boundaries [12,19]. Recent evidence suggests that deep fully convolutional networks (FCNs) ensures the high accuracy rather than gPb and MRS, with results of 0.79 in precision, 0.37 in recall and 0.50 in F-score [19]. For optimizing image segmentation, one study by [12] not only introduced the interactive boundary delineation workflow, but also examined the better suitability of the deep learning in cadastral mapping with convolutional neural networks (CNNs) by comparing random forest (RF) in machine learning: RF-derived boundary likelihoods (accuracy: 41%, precision: 49%), CNN-derived boundary likelihoods (accuracy: 52%, precision: 76%).
Several attempts make to extract, classify and quantify cadastral boundaries using EO data in association with AI technologies (see Table 2). Along with these varying workflows and its image segmentation techniques that employed, however, there is increasing concern over further investigating deep-learning driven image analysis in land administration including image fusion, image registration, scene classification and retrieval and object detection. For remote-sensing image interpretation, the most applicable deep-learning models in remote sensing are: supervised CNN, recurrent neural network (RNN), unsupervised authencoders (AE), deep belief networks (DBN), and generative adversarial networks (GAN) [38]. Although research on effective use of spatial contextual information in remote sensing for land administration is still in infancy, it can substitute the interpreter to a certain extent (not completely) by delving deeply into AI technologies with computer-vision and deep-learning algorithms.

3. Methodological considerations

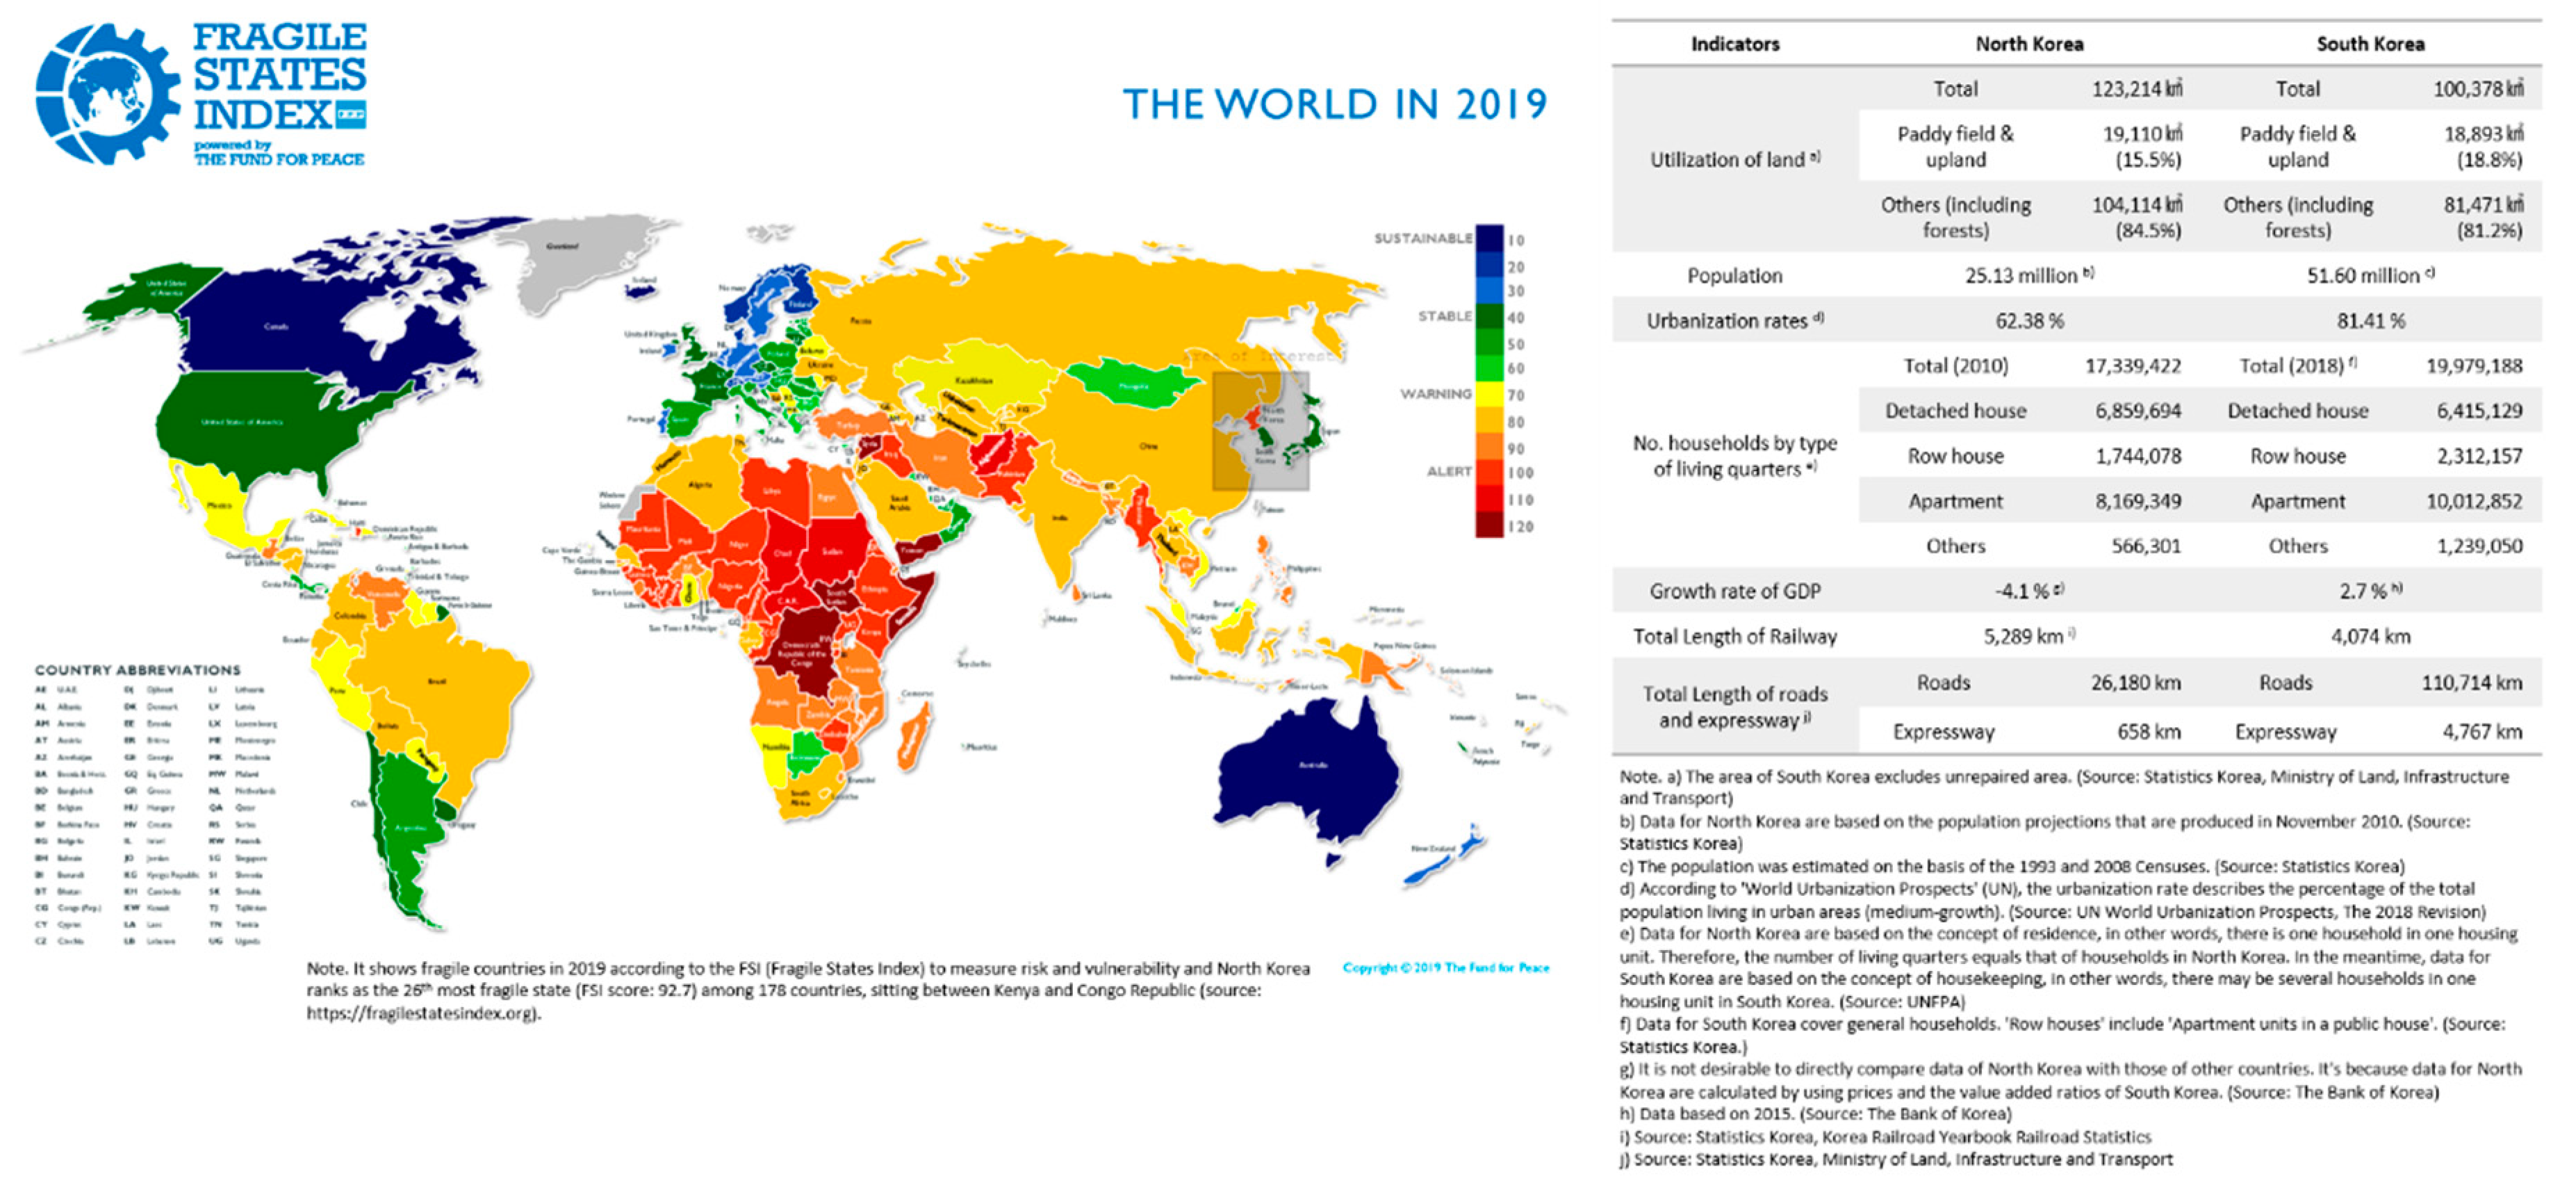
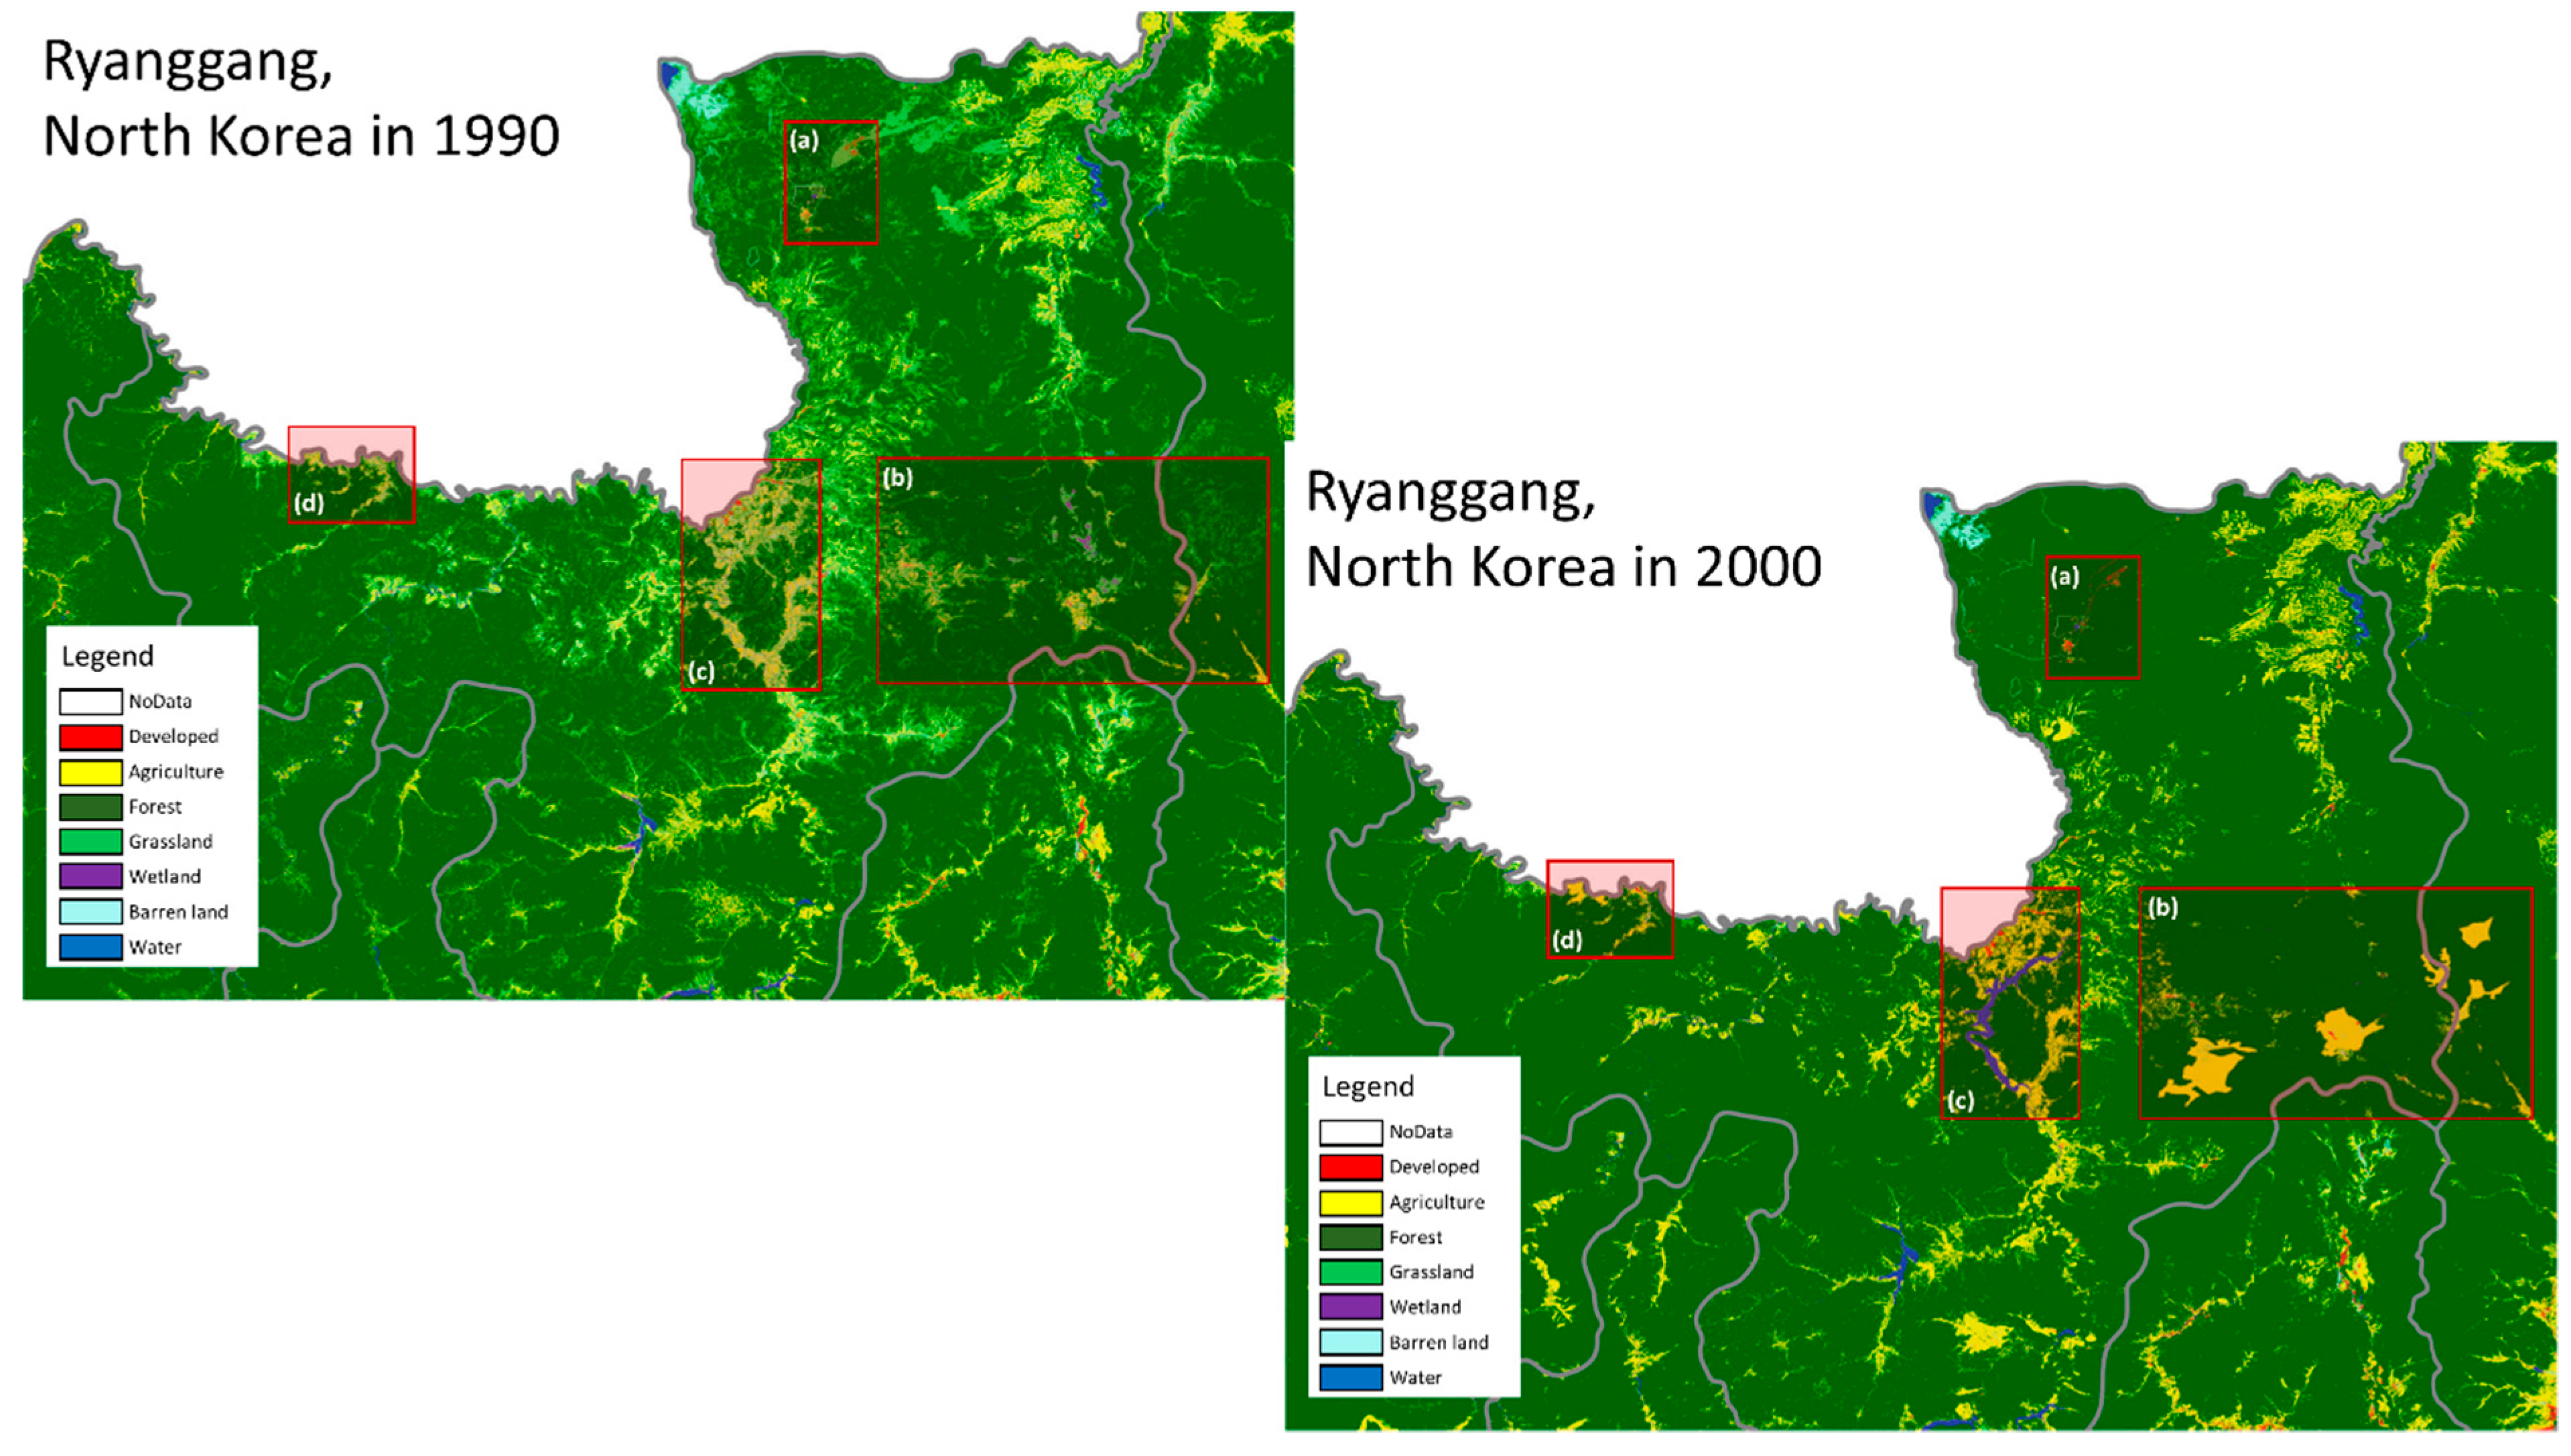
3.1. A Difficult-to-Access Region: North Korea in the Contexts of Fragile and Conflict-Affected Areas

There is increasing concern that remotely obtained data using disruptive technologies in fragile and conflict-affected areas (See Figure 1), where has been named hard-to-reach areas, is more worthwhile in optimal decision-making rather than a limited groundtruthing provided by direct observation (for example, [39,40,41]). According to [42], some countries such as Somalia, North Korea, and some Caribbean and Pacific island economies do not consistently render an account of internal data owing to conflict, lack of data capacity, or other reasons including quality of sources. An additional encounter with data scarcity and reliability is associated with national security issues in any contexts of fragile and conflict-affected regions worldwide.
Gathering and establishing reliable information for policy-making in pursuing Korean (re-)unification is more significant than ever during a peace-building process. In this process, re-shaping land governance are a fundamental question focusing on land tenure security, transferability, legitimacy and identity in (re-)unification setting [43,44]. Despite the passive attitude of the North Korean government to disclose information, it is possible to obtain data in a direct or indirect manner, such as [45]: official government reports (e.g., Korean Central News Agency: KCNA and Rodong Sinmun); materials from international organizations dealing with humanitarian aid (e.g., FAO, UNDP, UNFPA, WFP, WHO, UNICEF (For the resources, [46] etc.); information from external agencies or observers in cooperation with local authorities or residents (e.g., Hanns Seidel Foundation for EU-funded project on sustainable forestry in North Korea etc.); data acquired through the joint projects (e.g., the North Korean Ministry of Land and Environment Protection: MoLEP, Swiss Agency of Development and Cooperation: SDC, World Agroforestry Centre’s East and Central Asia Office for the Sloping Land Management Program (See further details for the project, [47] etc.).
However, there are still great difficulties in collecting land tenure-related information in North Korea since the government rarely discloses or distributes any policy-related documents, data and statistics. The scope of current research on mapping land tenure relations has been very limited such as restoring historical cadastral maps [48,49,50] that include both geographical and textual land information. However, most research is still highly dependent on secondary data sources. Many studies using EO data for North Korea have been proposed for monitoring land use and land cover (LULC) over the past several decades (for example, [51,52,53,54,55]). Furthermore, a number of government institutes and think-tanks have already established different types of thematic maps in North Korea using EO data (e.g., agricultural maps; deforestation maps; land cover maps, etc.). More internationally, a platform called 38 NORTH (https://www.38north.org), provides informed analysis of events in and around North Korea using HRSI, as well as develops the digital atlas that was built in the Google Earth platform. Nevertheless, researchers and policy-makers still have faced with difficulties in incorporating land tenure-related data with EO data due to: (1) levels of accessibility: the limited access to North Korean data; (2) methodological levels: complexity of integrating land tenure attributes with EO data; (3) analytical levels: its lower reliability and validity of acquired information.

3.2. Existing Rules for Defining Land Tenure Relations and LULC classifications

This section provides an overview of the existing rules for land tenure relations in South and North Korea that can identify the data gap between them. The classification methods of land tenure relations are based on diverse land trajectories: by land ownership, land (use) categories, 3Rs, land characteristics and urban planning facilities (See Table 3).
In South Korea (SK), land is divided into private land, government-owned land including State, province and county land, land owned by corporation or judicial person and land owned by non-judicial person, according to the land ownership trajectories. Contrastingly, the Constitution and the Land Law in North Korea (NK) does not tolerate private transactions with land. The State, collective farms, institutions, enterprises and organizations only govern land and local residents have land use rights (LURs). According to the Constitution (Article 21; 22) and the Civil Law (Article 45; 53) in NK, there is no restrictions on the subject of State ownership and only the State can own land. The cooperative entity refers to the form of collective ownership in which cooperatives assume the ultimate authorities for the land that are restricted by the State.
According to the Act on the Establishment and Management of Spatial data in SK (Article 2), a land category means a type of land that is classified under its primary use, and registered in the cadastral record. Land is currently classified into 28 categories to represent the nature, purpose and status of the land. Meanwhile, in NK the Land Law (Article 7) distinguishes six categories of land use classes: agricultural-purpose land; settlement land; forestry land; industry land; waterstock land; and special-purpose land. However, it is not yet clear whether these land use categories correspond to the zoning system or land category system in SK [56]. Based upon the Civil Law and LADM (focusing on 3Rs), the right type in SK includes co-ownership, servitude, lease, ownership, partitioned ownership, superficies, sectional superficies, tenancy, usufruct, and fishing. The responsibility types include keeping a snow free pavement and cleaning a ditch, and the restriction type includes servitude and servitude partly [57]. For NK, we assume that there is no land use regulation through the restriction of private rights (3Rs), since NK does not recognize private land ownership.
A land characteristics survey investigates land-related data from physical, spatial and socio-economic conditions in SK [58]. The 45 types of land use indicators are basic data for the land classification aforementioned. Moreover, land infrastructure (urban planning facilities) refers to facilities determined by urban management plan among infrastructures. The legal grounds is the National Land Planning and Utilization Act (Article 2) [59]. In NK, land use classifications are different. It follows the land characteristics in the same way as the six types of land prescribed in the Land Law. The diversity of land use appears to be very simple when compared to that in SK, although the Urban Management Law in NK does not explicitly stipulate land infrastructure, it identifies buildings and facilities, which need to be managed. These include residential and factory buildings, water and sewage and heating operation, urban roads and river arrangements, landscaping and urban beautification. Roughly, one can distinct 29 types of land infrastructure elements in NK.
Earth observation (EO) is one of the most essential methods for monitoring the earth’s surface and its dynamics at regional to global scales [29]. The term land use defines how a certain portion of the surface is being utilized. In other words, a particular land use label identifies the purpose for which humans exploit the land cover [60,61]. The land cover denotes to the biophysical appearance on the land and determined by the elements of the Earth’s (sub) surface. For example, a State park may be used for recreation but have a deciduous forest cover [60,61]. In some countries, a formal/ government LULC classification system exists which can easily describe the actual condition and changes of spatial structures of the land and its attached attributes: the U.S. National Land Cover Database (NLCD, USA [62]), the national Dynamic Land Cover Dataset (DLCD, Australia [63]), the European CORINE land cover (CLC, EU [64]), the Land Cover Map (LCM, Korea), and the National Land Use/Cover Database of China (NLUD-C, China [65]). Although these datasets have been developed with different mapping methodologies and criteria (e.g., variations in the classes and thresholds applied, time of data collection, sensor types, classification techniques, use of in situ data etc.) [65], one can utilize it as basic spatial data to support the design of scientific and efficient policies.

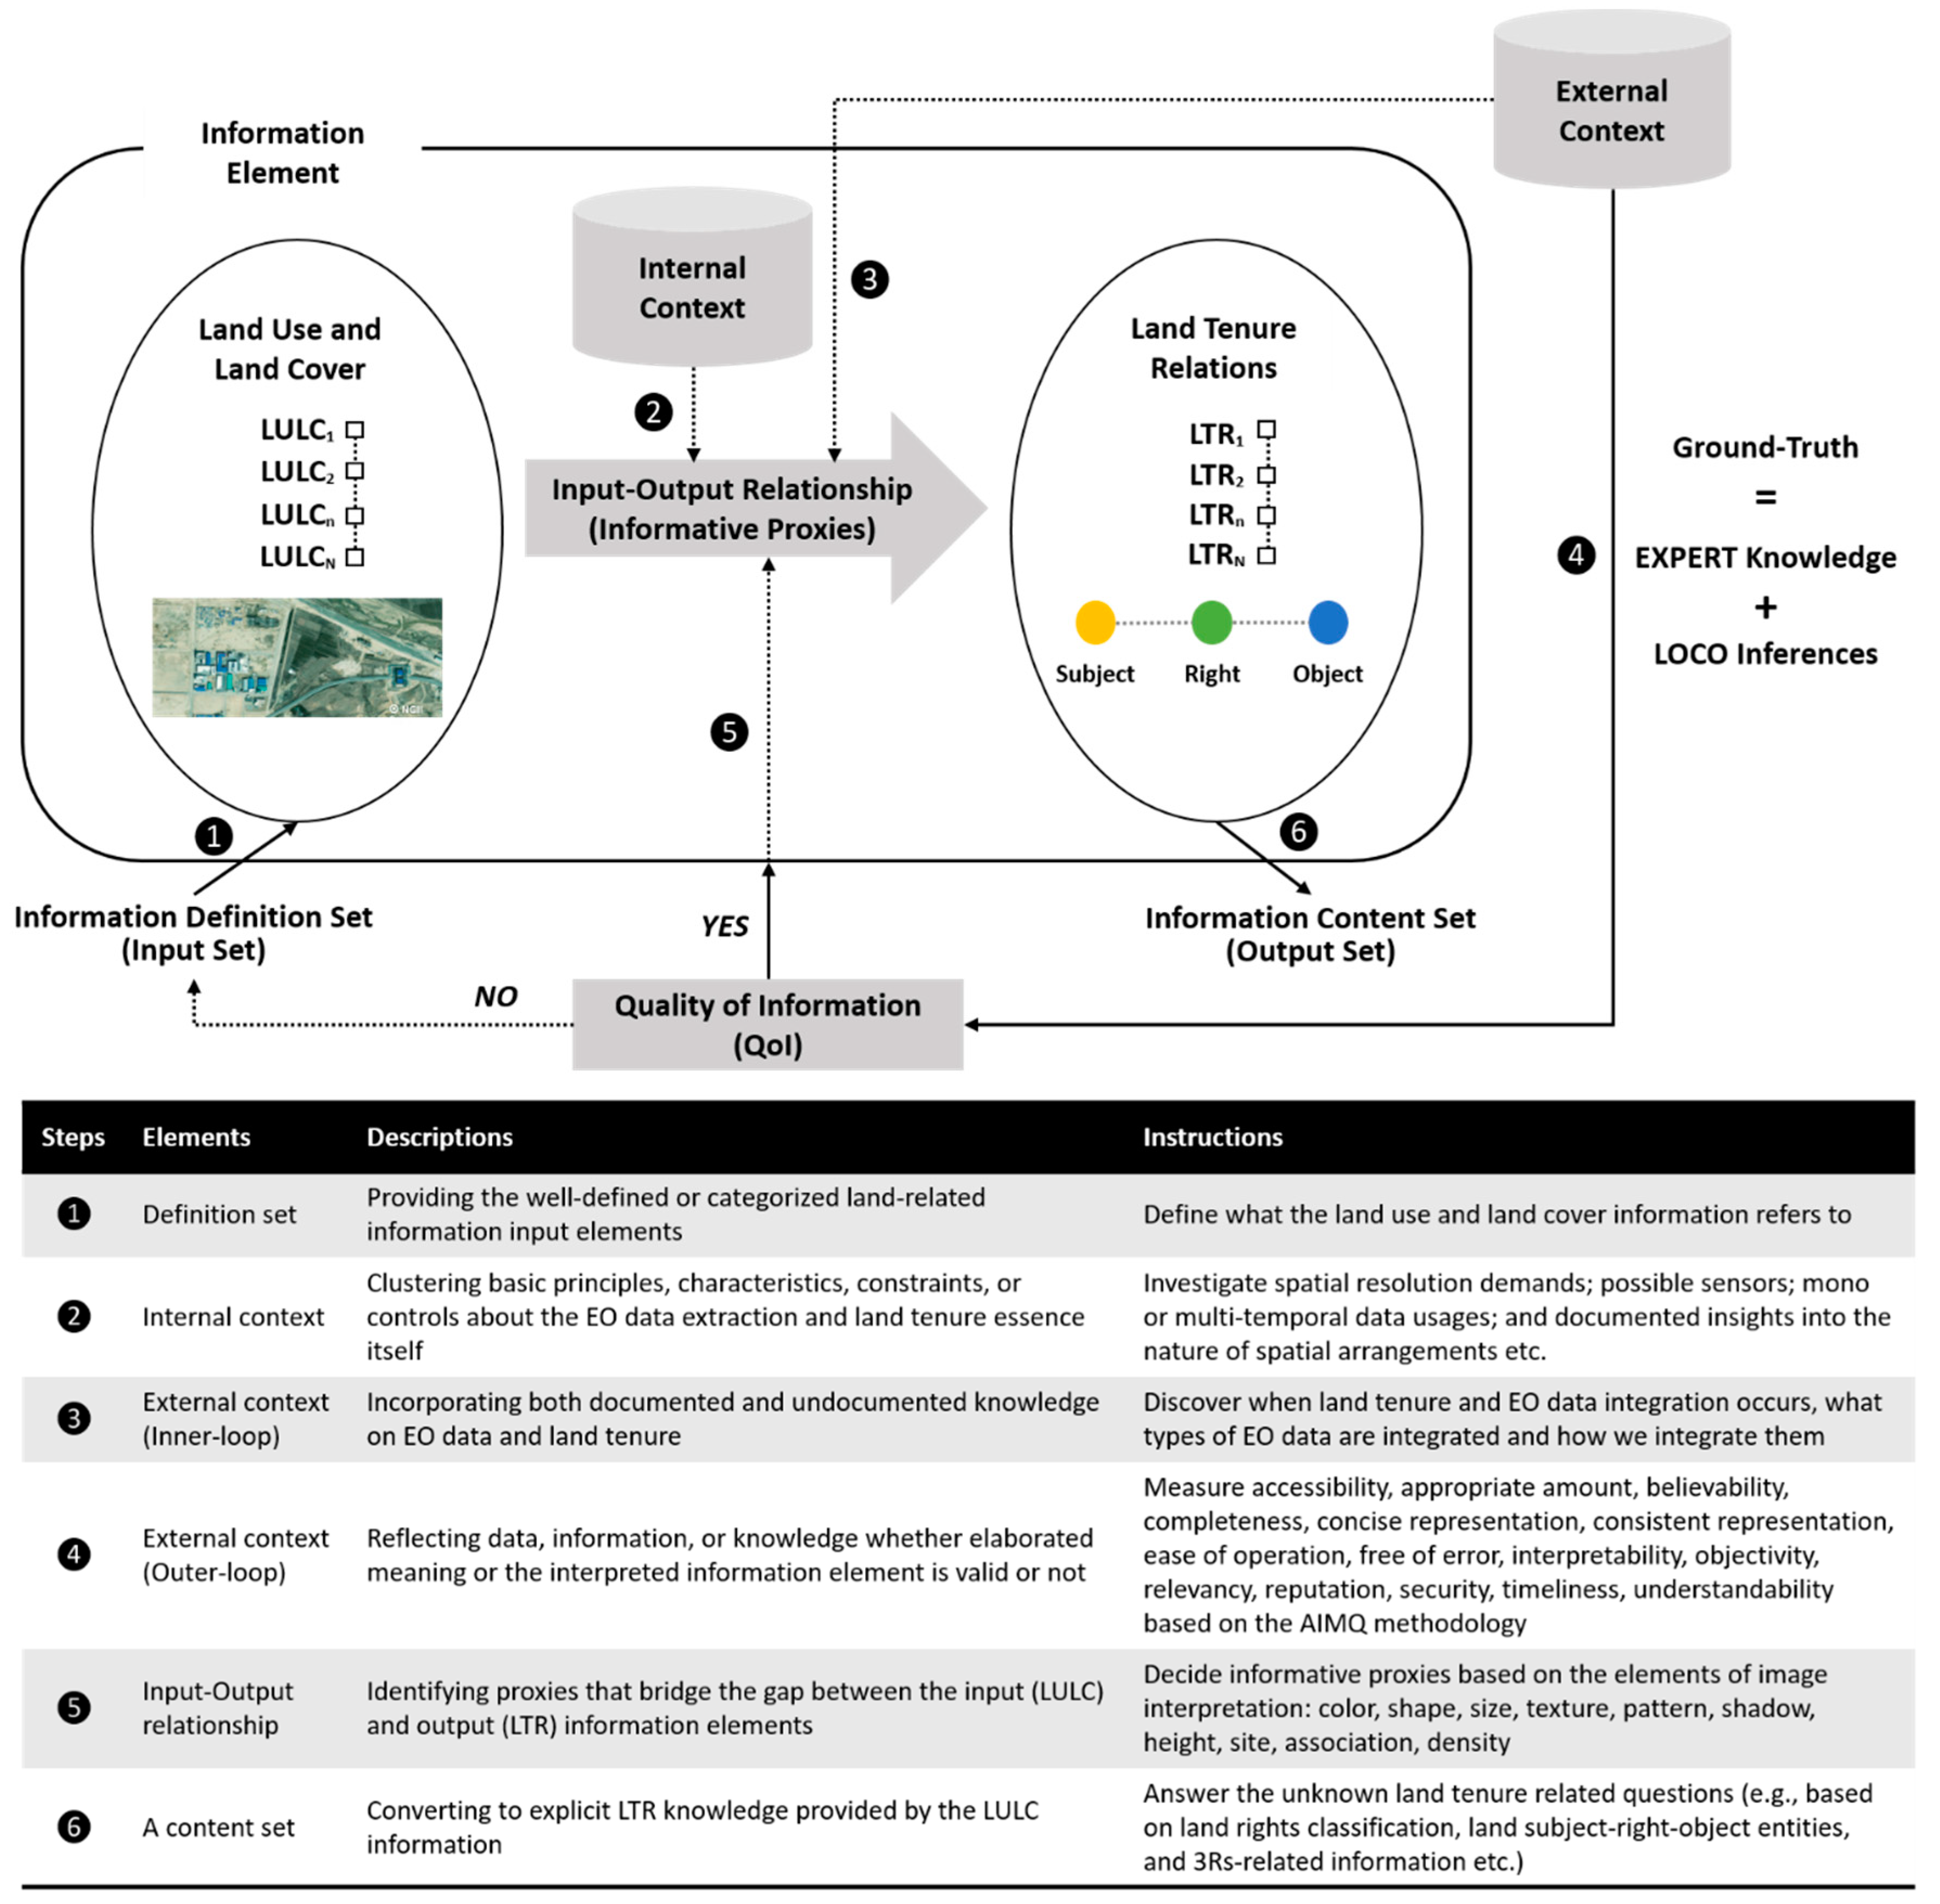
3.3. Adopting a New Methodology: Mixed Methods Design and Information Fusion Approach

A number of image segmentation techniques and workflows have been developed to detect visible land tenure relations with EO data. Each has its advantages (e.g., automation, coverage, up-to-date, cost-effective etc.) and drawbacks (e.g., technological bias, methodological rationale, lack of social sensing etc.). To especially overcome these constraints, a further advancement with more focus on the idea of ‘triangulation’ is therefore considered which is particularly associated with methods of investigation and sources of data [66]. A triangulation logic is chosen because land tenure relations are unknown in a given context and monoscopic EO data interpretation without valid inferences would misguide to identify transferrable and applicable proxies. Data integration is at the heart of discerning epistemological assumptions from multiple sources to attain narrative illustration, convergent validation and analytic density [67]. In this regard, this study makes an original contribution to when land tenure and EO data integration occurs, what types of EO data are integrated and how we integrate them.
In aiming to derive informative land tenure relations from EO data, one has to rely on both the characteristics of tenure itself and a number of proxies derived from EO data and spatio-temporal combinations of EO that may capture a particular land tenure characteristic. Our research started by adopting the subjects (e.g., who is the right holder?), rights (e.g., what is included in a certain right?), and objects (what physical extension of a right has?) model of land administration [68]. In parallel with ownership, rights may embrace complex set of rules related to the access, use, develop or transfer [69]. In other words, a household can be associated with a particular land parcel where people can live, own, rent or have the right to use [70]. Thus, the analytical premise has been questioned on the basis of underlying assumptions: (1) is it possible to distinguish collective farmland from State land?; (2) can one see land use rights (LURs)?; (3) is there a use right that can be linked to an individual or group?; (4) are there land transfer rights (LTRs)?; (5) are there land access rights (LARs) and restrictions?
However, methodological difficulties, using EO data in accurately conjoining a household and physical extension of a right over land parcels and measuring the quality of linking information, have existed. There have been only few empirical investigations into decision-making what proxies shall be operationalized based on both theoretical and practical grounds. In terms of using terms ‘proxy’ rather than similar terminologies such as ‘interpretation key’, ‘index’, ‘indicator’ or ‘variable’, we follow a definition labelled by [71] that refers to “use of observable physical features or directly measurable variables to understand and extract what actually exists on the ground, but what is not directly observable or measurable from remote sensing data.”
Our approach comes from multiple sources, namely EO data, especially focusing on LULC information, prior (expert) and contextual knowledge on land tenure relations acquired through previous experiences and perceptions. In view of all that has been mentioned so far, one may suppose that ‘information fusion’ approach must be considered in order to extract and conciliate significant elements for the semantic (re-)interpretation and, subsequently, for decision-making [72]. Generally accepted disciplines for the notion of information fusion include: psychology, human factors, knowledge representation, artificial intelligence, mathematical logic, and signal processing [73]. It has been noted that transforming data into knowledge is most striking feature of information fusion and must be converted into a certain language or presented by other means such as visualization techniques [73]. Moreover, this method emphasizes that a wide range of structured/unstructured or primary/secondary data sources address semantic relationships and co-occurrence between them [74].
According to [75], an information element is regarded as “an entity composed of a definition set and a content set linked by a functional relationship called informative relation, associated with internal and external contexts”. This highlights that one given single data set do not qualify or quantify to make it informative. When answering the research questions or testing relationship between proposed proxies and ground-truth, it is important to quantify recurring spatial attributes and uniformity or distinctiveness in qualitative data allowing rigorous analysis and to determine rational and optimal proxies. It is therefore considered that triangulation logic and information fusion approach would usefully supplement and extend the methodological and epistemological assumptions of semantic land tenure relations through EO data interpretation. Having defined what EO data proxies and information element meant, different types of information element, thus, should be included that enable the EO data proxies to identify land tenure relations logically. Figure 2 depicts the workflow and the main components of the information acquisition and interpretation process of the semantic land tenure relations.

4. Deriving Workable EO Data Proxies for Interpreting Land Tenure Relations

This section explores a number of workable proxies based on the land related categories defined in Table 2, whereby the proxies are derived from the existing EO data. We, then, discuss hereunder how one can evaluate the five key land tenure-related questions defined in Section 3.3. The exact spatial information and point of interest (POI) in this section were pre-identified from the openly accessible platform.

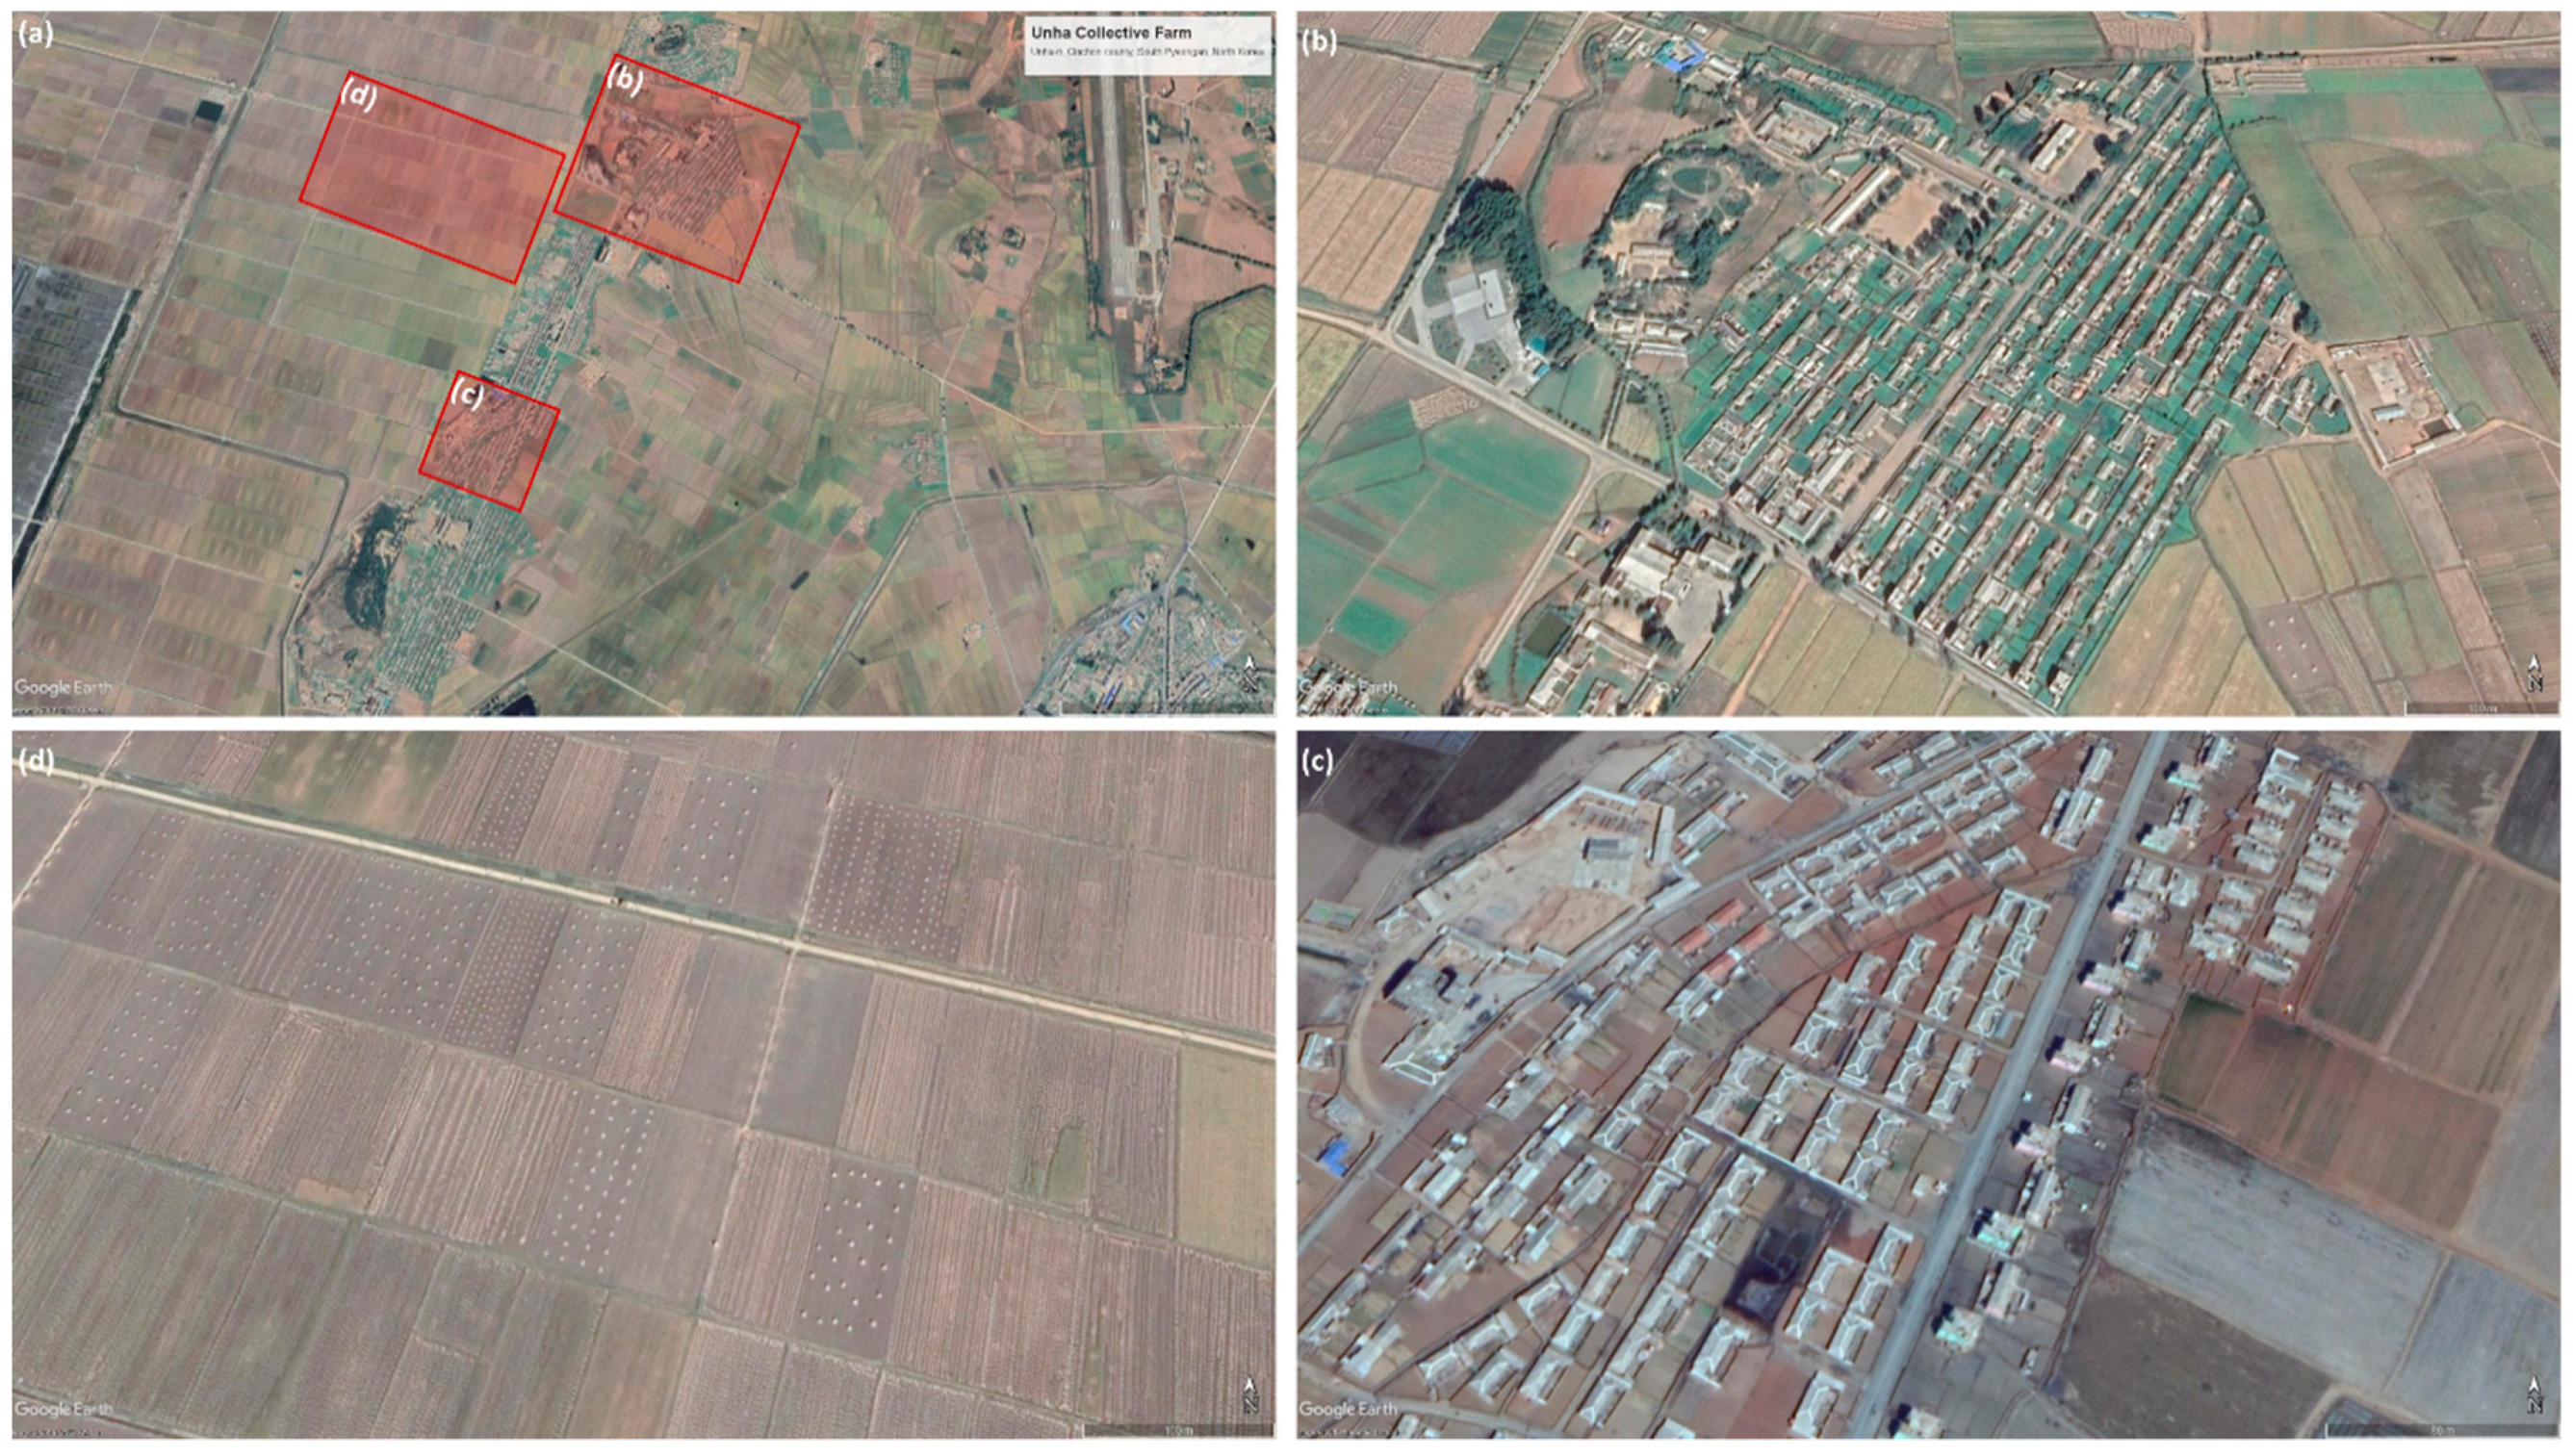
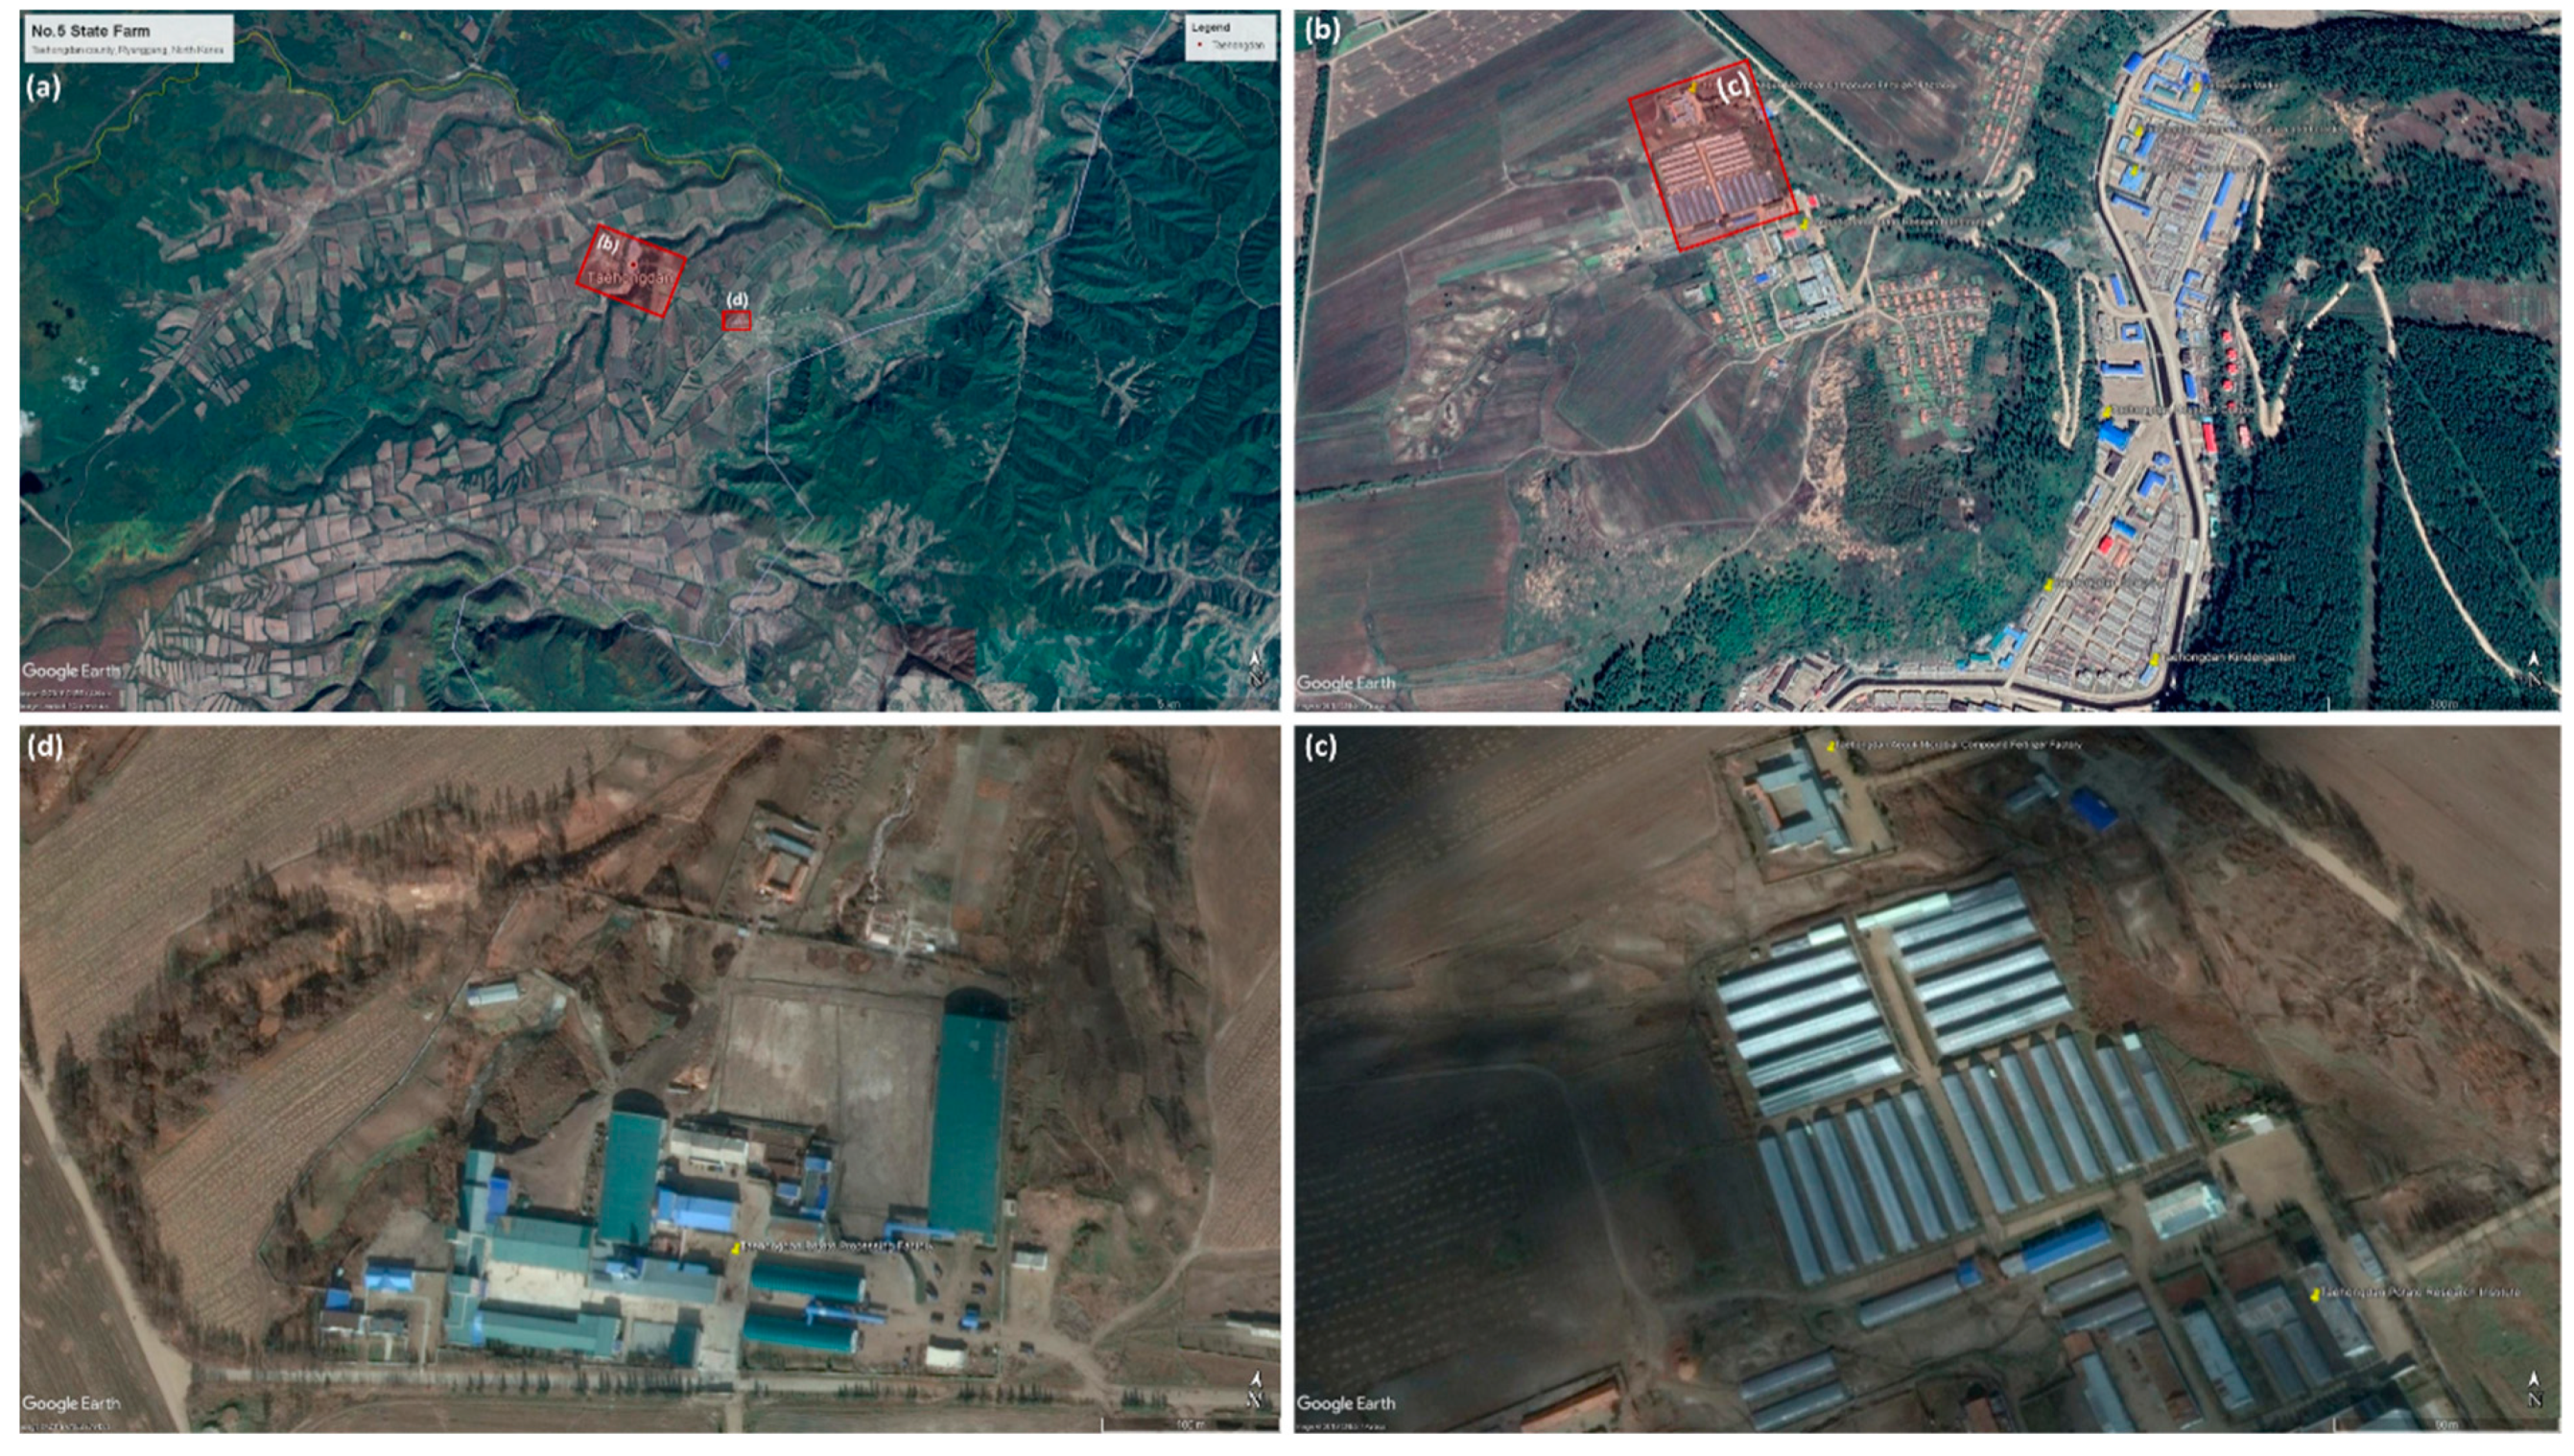
4.1. Is It Possible to Distinguish Collective Farmland from State Land?

A characteristic and distinctive feature of collective land (as compared to State land) is both the type and number of buildings/dwellings adjacent to the land and the spatial distribution of buildings/dwellings. Another characteristic is the state and density of infrastructure. Clusters of buildings suggest the presence of a collective only if: buildings look similar and simultaneous changes in structures occur. If spatial patterns of buildings and farm sizes and shapes re-occur in different places, it is probably part of a joint collective spatial planning strategy, so it is more likely collective land than State land. (See Figure 3b,c).
It has commonly been stated that North Korea (NK) collective farmland plays a pivotal role in major food production (approximately 85%~90% of total production), such as rice, corn, beans, and potatoes [76]. In this regard, most collective farmlands are utilized as a (dry) paddy-field, so it can therefore be assumed that the collective farmland can be confirmed through the presence of (dry) paddy-fields. An area linked to or surrounded by a substantial portion of (dry) paddy-fields can be considered as a collective farmland, which is following the association element of the image interpretation (See Figure 3a). According to [77], rice fields include periodically flooded flat surfaces with the rice plant, open water surfaces on fields, stubble or rice, irrigation channels between land parcels and embankments between rice fields. These can be interpreted with the rough (or coarse) image texture caused by variation in tonal values of an image that helps to identify single objects (See Figure 3d).
The collective farmlands include ranging between 80 and 300 households and operates on a large-scale from approximately 1,300,000 to 5,000,000 m2 [76]. Thus, the relative size and high density or compactness of the settlement helps to distinguish when compared with State (farm) lands. Collective farmlands accompany a farming equipment, materials, and production facilities from the State and benefit from all the new building construction including rural dwellings (See Figure 3c). The characteristics of rural dwellings in collective farmlands are homogenous building colors in grey scales, a signature line of the tiled roof, and densely built-up block structure with single-story detached houses. This indicates a need to understand physically detectable proxies that the farming-related objects will be more captured on the ground (in spring/summer) or stored in warehouses (autumn/winter) rather than State farmlands. In addition, since agricultural production is mainly concentrated in the springtime, changes of agricultural activities and its densification, which implies collective farmlands, may be compared using time-series analysis. However, these proxies tend to be unreliable unless used with other complementary sets of proxies. It therefore requires a rigorous image interpretation of EO data in combination with other interpretation elements as well as secondary data.
On the other hand, State-owned (farm)land in NK refers to nationalized (farm)land in the process of land reforms in the past, consisting of agricultural testbed, farms for the seed-production and livestock [76]. As far as this assumption is concerned, the combination of the geometric properties of an object such as shape and (building and roof) size, orientation, density, height as well as (building and roof) colors/tones that identifies agriculture-based patches or infrastructures can be considered as workable proxies. These include small dot-shaped (for orchards) and smooth (for pastures) textures, out-buildings (sheds), dispersion value (low building density), irregularly shaped object boundaries, complex, elongated or irregular building shapes, and distinctive roof colors (e.g., blue, green, yellow and red as well as brightness etc.) and the association with agriculture-based infrastructures, monumental buildings, and welfare facilities (See Figure 4). However, the association elements should be synthesized with documented or local knowledge as the exact points of information has not yet clarified.

4.2. Can One See Land Use Rights (LURs)?

A typical feature of LURs is that it usually relates to consistent patterns in space and there exists regularity in time such as seasons. The right itself must be inducted or assumed if such patterns and consistencies exist. Reversely, finding such consistencies is an indication of the right. This implies that from EO data over a number of years one can see similarities each similar season. If all indicate the same type of land use, at the same points in time over a number of years, then one may assume consistent land use, and LURs. If conversely there is a large variation in this, one has to assume that the LURs are not consistent, or do not belong to a single person or group. The variations in land use itself suggests an allocation of what the land may be used for over a longer period of time, yet in a specific time of the year. This suggest the presence of a consistent LUR of single land user. Any land use which is not observed suggests a restriction in land use or a specific allocation of land use.
The LULC in most areas between 1990 and 2000 remains unchanged, assuming existing consistent LURs due to strict land use restrictions for nature reserves, military sites, and public heritages, or unplanned and poor land management (see Figure 5). However, Figure 5a reveals more intensely developed lands (red color) are shown in POI and we note that the development is mostly associated with constructing new dwellings (with LURs) in fallow land. Moreover, Figure 5b highlights that land for agricultural use (yellow color) has significantly increased in POI. This is due to the increase of farmlands to cultivate, especially with collective farmlands, and hence the State provide new houses for the farmer households that grants LURs. In addition, Figure 5c shows more intense LULC changes in an urban area with the development of water bodies (blue color) and these provide additional evidence with respect to LURs. It demands sufficient quantity and quality of water resources for increasing urban households, and it can be inferred that developing water bodies are correlated with LURs since the increased number of urban households represents an increase in granting LURs. Lastly, Figure 5d underlines that LULC changes have occurred more in a border region than inland areas. This, we assume, is because the border in NK started allowing LURs to be sold, transferred, and leased to foreign corporations in Special Economic Zones (SEZs) by modifying socialist land tenure system for economic recovery.
All the means of production and socio-cultural facilities, including land, are jointly used in NK. Meanwhile, housing and the allotment with an average size from 60 to 130 m2 are owned by the State [79], but LURs are granted to individuals, and the product is allowed to belong to them. We therefore assume that the presence of all types of houses and their accompanying allotments can be chosen to confirm the existence of LURs. To identify the (semi-) detached houses, it includes the following proxies: low building density, 1 or 2 storied houses, uniformly shaped settlement, proximity to roads, and low to intermediate imperviousness. In terms of condominium-related proxies, we consider large rectangular simple form buildings, regular alignment, more than three stories, and low to intermediate imperviousness and shadow silhouettes (see Figure 6). When it comes to the workable proxies for allotments, the following “if” statements are considered: if the land (or site) has detached small-sized buildings, if it is low built-up land, if it is low imperviousness, if it has plants or vegetation, and if it is used as buffer between houses (see Figure 6b, Figure 7, and Figure 8b).
Before 1998, a new housing reverted to the State, and only the right to use was given to individual households by permission. However, after the amendment of the Constitution, the building was excluded from collective ownership, enabling the possession of new housing. For the sake of legal certainty, the form of housing is divided into State-owned, cooperative-owned and individual-owned, but its ownership is very limited regarding use and transaction. According to [80], three types of housing have been investigated, with a semidetached house (or row house) being the highest proportion at 43.9%, a detached house (or single-family house) has been estimated as 33.8%, and apartments (or condominium) account for nearly one-fifth (21.4%) of housing [81].
More specifically, in the rural areas of North Korea, the ‘harmonica houses’ have often been observed where two or three households, and even five to six or more households, live together in a detached house. A variety of identifiable proxies such as a small roof with slate materials, chimneys on rooftops (small dot-shaped objects or a light shadow Silhouette) and a fence (with line-shaped objects) installed to distinguish garden plots have been detected in the images. The evidence reviewed here seems to suggest that the physical attributes of varying forms of dwellings through EO data acquisition have significant correlations with granting LURs. Moreover, the growing new construction/extension of residential buildings and expansion of construction activities in certain regions over time may confirm the significant increases in authorities’ awareness on LURs. As shown in Figure 6, (a) shows varying geometrical attributes of apartments along Ryomyong Street in Pyeongyang in 2019, while (b) provides a typical example of detached houses that displays the roofing, chimneys and a fence for defining spatial boundaries between neighborhoods. Furthermore, (c) presents a normative sample of semidetached houses and the building shadows that determine building heights. In addition, (d) demonstrates different forms of residential building shapes such as linear, curved, rectangular fit and different colors of roofing.

4.3. Is There a Use Right that Can be Linked to an Individual or Group?

Another possible explanation for the linkage of individual or group-based LURs might be that land use is homogenous between adjacent land parcels and buildings. A characteristic feature of an individual right as compared to a group right is that there is a large variety in land use between neighboring parcels. In a group land tenure, people tend to converge to similar crops or building and housing types. The observed land use can be connected to an observed set of combined proxies on the land rights: similarity or dissimilarity of neighboring land use in space and over time; changes in the adjacent buildings or houses; changes in the road infrastructure; number of buildings in a certain vicinity.
Cooperative farms in NK are based on collective ownership. Along with economic activities, cooperative farms function as rural communities that manage collective socio-cultural activities. However, property rights are exercised by the State, and households only have exclusive LURs. Therefore, all the means of production and socio-cultural facilities, including land, are entitled to group-based LURs. The multiple objects of socio-cultural facilities incorporate ‘cultural houses’ (rural houses with welfare facilities), various community amenities, and nurseries and kindergartens. These possible proxies could define multiple LURs of groups over the same piece of land with specific characteristics such as building geometry, arrangement pattern, roofing color, and site characteristics with EO data.
Figure 7 presents an amalgamation of diverse community amenities: government offices (e.g., a cooperative farm management committee and a party committee), educational institutions (e.g., a middle school and a kindergarten), medical facilities (e.g., hospital), and socio-cultural facilities (e.g., station, a park, a skate park, a restaurant and hotel, revolutionary museum, monuments—see Figure 7a,b). These regular arrangement patterns of building objects are a common feature that appears in collective farms, thus representing group-based LURs. As (c) indicated, we found that significant land use changes from the cultivated farmlands to residential areas (confirmed by the presence of multiple building objects with similar looks, a high density of settlement, simple rectangular forms and same roof colors in red scales) occurred. The objects with a similar appearance are perceived as a group figure or shape, and thus the similarity/dissimilarity of neighboring land use in space and over time with other contextual knowledge (such as relationship, adjacency, inclusion, composition, and neighborhood) can be regarded as workable proxies for defining group LURs.
Indeed, the site, situation and structure of objects in the urban/rural landscape on the image helps identify their significance and (d) depicts changes of former settlements as a newly built community asset (for a skate park) in line with improved access to road (types: paved road and wider widths) surrounded areas. Therefore, the (re-)construction/extension of community buildings or infrastructure by the existing building removal could become proxies for LURs linked to group tenure. In the same vein, (e) indicates that agriculture infrastructure is not newly located where it was fallow or barren land, but also adjacent to the residential dwellings. With the acquired EO data, (vinyl) greenhouses as a particular form of non-irrigated arable land have been identified with some elements of image interpretation: building materials (plastic or glass), roof colors (white or grey), brightness (light), and texture (rough). Hence, the changes of association elements with the close proximity or adjacency to the agriculture-related objects or neighborhood and specific characteristics of the objects might quantify group-based LURs. Then, (f) interprets the increase of the number of houses (high building density) in a certain vicinity over time. While this phenomenon can be seen as an increase in an individuals’ LUR, it can also be regarded as an increase in the group-based LUR, as NK’s housing supply is mainly carried out on cooperative farms to improve agricultural productivity. Therefore, there have to be more proxies to make this argument complete.
The existence of undivided shared areas of the common property or public infrastructures between the roads or buildings can be regarded as a proxy that can be related to the collective LURs. Under the socialist urban planning system in NK, the arrangement standards for housing and neighboring residential structures are based on the sub-district plan that housing and production facilities should be located adjacent and in the vicinity of the planned area. Within the sub-district, diverse socio-cultural facilities are located and observed with relatively low building density in scope. This is a proxy that emphasizes the straightforward approach and characterizes the socialist lifestyle based on a community unit rather than the individual [81].

4.4. Are There Land Transfer Rights (LTRs)?

When selling, mortgaging, or conveying the land to others, it exhibits a considerable variation in transfer of land. However, what is actually transferred is not the land or building, but rather a bundle of rights pertaining to it [82], and this could be interpreted as land transfer rights (LTRs). A characteristic feature of when land or houses are being bought or sold is that the LTRs are accompanied by changes in the objects, which are not occurring in the neighboring objects. One can think of constructing a new roof, painting the house, construction of fences, construction of new objects or infrastructural works on the land. Moreover, the changes in structure, type and shape of the object are occurring in a relatively short time span. We would then assume that there might have been an LTR related to these objects.
According to [83], there is a tendency for households or farmers, those who suffered from tenure insecurity, to utilize tools of land conversion or reclamation as a way of building informal LTRs. In the same vein, in the mid-1990s, as a result of the massive food insecurity in the NK, unauthorized households reclaimed and cultivated vacant land as well as cleared the forests and occupied so-called ‘small-land (sotoji)’. ‘Sotoji’ is located in the mountain slope and its transactions are being made publicly among the households. Three types of ‘sotoji’ existed: garden plot (GP); side-job plot (SJP); and tiny patch of land (TPL) [84]. In principle, the law prohibits the sale of land in NK. In reality, GP, having a large share to produce their foods, is explicitly recognized by the Constitution, the Civil Law and the Land Law (Article 13). GP was originally allowed to use in individual households within the collective farmlands and it was common to situate at the front yard of houses or on an empty space between them. The size of GP is approximately 66 to 100 m2, but, in fact, it covers about 100 to 165 m2. In addition, if the house is sparse and the vacant land is immense in size, it is reported that an even larger-sized GP is allowed. Likewise, since the mid-1990s, the GP was built in a vacant land attached to a detached house or a balcony of an apartment in urban areas.
SJP was developed from the early 1980s to cultivate the barren land, which has not cultivated by the farmers of collective farmlands. If the GP is individual farming units, the SJP is a group units (cf. the scale is approximately 3000 to 6600 m2). Unlike the SJP, TPL is illegally cultivated private land. This originally refers to a small-scale farmland rather than linking the subject or illegality of cultivation. TPL is deemed an object of their own since households put considerable effort into cultivation. The authorities, however, investigate the TPL and impose land use fees to place it under the State control. In this process, land transaction has actually occurred and there are also certain cases where it is handed over to the neighboring landowner, or it is exchanged with other corresponding goods or cash. Although it is different from SK’s land transaction that transfers ownership through such transaction processes, it can be assumed that land transaction of TPL would inevitably occur.
Figure 8 reveals that (a) describes the major feature of TPL located in the mountain slope with the evidence of forest farming. TPL may be located in a relatively lower elevation and land parcels where slopes have gentle or stable slopes. As the population grows in areas where arable land is scarce, people tend to take advantage of reclaiming land in fallow on the terraced hillsides that are easily accessible. Therefore, the proxies for TPL include: lower elevation using a digital elevation model (DEM) and slopes have a gradient less than 15%. With HRSI, the small patches of vegetation cover between neighboring lands on the mountain can be considered as a proxy to detect and identify TPL. Meanwhile, (b) illustrates GP where individual households officially are allowed to cultivate and produce SJP in their front yard or at the rear of a house. Other indicators of SJP in the cooperative farmlands where a group of farmers can cultivate the barren land are the length or width of image features (small parcel size for GP and large parcel size for SJP), location-specific features (front/back yard or attached to each other), and natural colors of features (GP and SJP are often depicted in green on the imagery). In addition, (c) is an exemplary attribute of TPL where individual households cultivate vacant lands along the streams, so adjacency to the streams or ditches and the small and regular/irregular patches of vegetation cover along the streams or ditches can be interpreted as transferrable and applicable proxies.
To sum, the authorities in NK drag ‘sotoji’ within the public land management sphere to restrict (illegal) land use. On the other hand, households generate more income out of the management area with the sense of personal land tenure. Therefore, ‘sotoji’ can be important proxies that prove the existence of LTRs with some of the aforementioned elements of image interpretation.

4.5. Are There a Land Access Rights (LARs) and Restrictions?

What is known about LARs is largely derived from a private land tenure system that gives priority to the rights of individuals. The main segment of LARs frequently addressed are: an easement (servitude) and rights of way. A characteristic of LARs is that multiple objects are connected to single or multiple types of objects. An easement generally places an emphasis on allowing for separate usage of land which could refer to the right to use another household’s land for different purposes. There may be varying activities over the single parcel of land or an entire property over the land that represents LARs. For instance, one of the best known is installing public utilities into a certain land parcels [85]. Another major illustration is reaching inaccessible properties or linking two separated objects through road-related infrastructure.
Turning now to the LARs in the given context of this paper, it is important to bear in mind that we may accompany a possible bias in describing unknown land tenure relations since private land tenure is not recognized in NK and there is no land use regulation through the restriction of private rights. Although all land belongs to the State, we assume that both the State and collectives can restrict the use by restricting access for public purpose. We thus, for the purpose of analysis, assume that the State, collectives and the households in NK may acknowledge LARs.
If our assumptions are to be accepted, they enable us to provide a number of available proxies (see Figure 9). We also need to derive whether the object under consideration is connected to any form of infrastructure or not, as well as if other objects (such as silos) are connected to infrastructure. In this regard, identifying several utility networks offer an effective way of confirming the presence of LARs in NK. Moreover, when newly creating a parcel (called “division”) and two or more parcels of land from the existing one (called “subdivision”) for the commercial or residential purpose, these properties commonly generate different types of easements under certain physical characteristics of the objects. Therefore, the subdivision of land parcels or (in)consistent land use may implicate whether LARs exist or not.
As shown in Figure 9, we were able to detect and label what objects are especially linked to the public rights of way and servitude (focusing on restrictions on the use of land) rather than individual rights of way. These include: solar panels, railroads, drinking water production facilities, a transmission tower, pipelines, footpaths, military site, and reservoir. We noted that there are some site characteristics near public utility networks, nature reserves, and a public heritage site. However, defining which proxies are workable for LARs is highly context-dependent due to the lack of formalized and proven rules as well as its application in different contexts. It also requires forming an ensemble with other types of proxies to describe the socio-legal status of the objects. Among the elements of image interpretation, only site or situation elements are valid and reliable in detecting the public rights of way. We then produced only few proxies by deriving similar site and situational features from nine images as follows: proximity to hazardous or isolated locations, poor accessibility (lack of access roads), elongated object shapes, and less green and open spaces.

4.6. Summary of Discussion

This section summarizes the findings to identify proxies to derive unknown land tenure relations over North Korea (see Table 4). The first set of questions aimed to address that whether the observed land is State or collective farmlands. There was no significant difference between two groups in both the general spatial arrangements in scope. However, we found that the location-specific features in line with physical and temporal characteristics helps to identify single objects on (dry) paddy fields. This is one of the most significant characteristics for detecting visually analogues arrangements of collective farmlands. On the other hand, what stands out in the State (farm) land is the combination of the geometric properties of objects characterizes a common feature of agriculture-based patches and infrastructures.
In order to assess the feasible proxies of LURs without having access to the ground, the different EO data sources have been utilized to not only detect LULC changes, but also ascertain a variety of dwellings and its morphological features. These EO datasets present a plausible interpretation with the association element that addresses the probable occurrence among different sets of entities as well as socio-legally documented local knowledge that leads to confirmation of LURs.
The cooperative farms under the collective ownership regime typically accompany a socialist morphology, with the unification of forms and construction to distinguish whether individual or group-based LURs, proxies such as building geometry, arrangement pattern, and site characteristics could define multiple LURs of a group over the same piece of land. The regular arrangement patterns of sites and building objects with other contextual knowledge is a common feature, thus representing group-based LURs that can be jointly used by the multiple groups of people.
Another question sought to determine whether there are LTRs or not. With respect to this subject, it was hypothesized that households reclaimed and cultivated vacant land as well as cleared the forests, and made transactions between households after illegal occupation. Based upon the normative concept of ‘small-land (Sotoji)’, the discernable proxies that prove the existence of LTRs with following elements of image interpretation are: the low elevation, slopes have gentle slopes less than 15%, small and regular/irregular patches of vegetation cover, the length or width, location, colors and adjacency to the specific objects.
The combination of multiple man-made structures over a single parcel of land or entire property over the land provides some support for the conceptual premise. Although all land belongs to the State, both the State and the collectives can restrict the use by restricting access for public purpose. Among the elements of image interpretation, only site or situational elements are valid and reliable in detecting the public rights of way. We then produced only few proxies by deriving similar site and situational features from nine images as shown in Table 4.
While some progress has been made for cadastral mapping, very little was found on the question of how we bridge the semantic gap between land tenure and EO data. Thus, this account, in methodological terms, seeks to propose a new notion of remote-sensing based proxies for interpreting land tenure relations that could be transferable and applicable in land administration domain at a semantic level. With regard to the research findings, some limitations need to be acknowledged. A first limitation is that since this study was only conducted from steps 1 to 3, validating was beyond the scope of this work (see Figure 2). However, the preliminary investigations indicated that the subsequent steps for validation (steps 4 to 6) will further move us closer to developing a full picture of the identification of transferrable and applicable proxies for geospatially informed analysis. In other words, it is possible that these results are only valid when a holistic methodological approach takes place. This experiment also has not suggested any technological advancements yet and the proposed proxies require a rigorous AI-based (semi-)automated image interpretation of EO data with other complementary sets of proxies. One possible implication of this is that algorithmic approaches and methodologies concerning deep-learning networks will be able to mine land tenure relations from EO data and these are divided into: supervised learning approaches trained from scratch, pre-training and fine-tuning approaches, advanced learning techniques, and novel technologies developed by the remote-sensing community [86].

5. Concluding Remarks

Land tenure relations, which are relevant in the Korean (unification) context, include the difference between private, State and collective land, the type and location of land use rights, the spatial allocation of rights and restrictions, the ability and spatio-temporal changes of transferring land rights, and the spatial restrictions in access and use. So far, such land tenure relations could only be derived when combining topographic data with agricultural census data at the regional or national scale, and household surveys and a participatory mapping at the local scale. However, given documented insights into the nature of spatial arrangements and the similarities and patterns when observing in features of typical land use structures in North Korea, it was possible to derive proxies for particular types of land tenure from openly accessible EO data.
The proxies consist of specific combinations and patterns of shapes, colors, textures related to physical structures such as roofs, types of buildings, infrastructures, types of land use and vicinity of comparable features. The assumptions connected to these proxies relate to fundamental notions of tenure claims and interests such as collective ownership, land lease and use, occupation (reclamation), transaction (sell and convey) and land access (servitude and rights of way). Overall, this study strengthens the idea that data mining for North Korea related land (tenure) information in the context of Korean (re-)unification is possible and feasible.
The application of EO data involves image processing and data mining technologies which can help to generate a better insight in current land and property interests (such as land tenure, land rights, land responsibilities and duties related to land and properties), and to better prepare, execute, enforce, assess and monitor land interventions. In the context of (re-)unification, the sample tests are particularly relevant for re-uniting countries where different land tenure systems exist and where the data are not coherent. For example, prior to the (re-)unification in Germany, there were two different systems of land tenure, which co-existed next to each other. Unifying the system in Germany was difficult at first partly because each of the previous countries had recorded and administrated in a significantly different manner. A similar situation exists in anticipation of a unified Korea, especially considering that little information is available about the varieties of land tenure and the missing links to individual people in North Korea.
One way to overcome this challenge is to detect land tenure with the use of remote sensing and open access aerial and satellite images. Normally, this technique is possible when having access to ground control points, civil registers and semantic interpretation of both the tenure and the people’s components. When this information is however missing or this data source is unreliable—as is the case in North Korea—one has to rely on a number of assumptions and a set of test trials, which if proven right, can be generalized with artificial intelligence connected to image processing. In other words, one has to understand the socio-legal relations to land with pixel. This socio-legalizing the pixel is still largely an idea rather than an available set of techniques. In order to develop such techniques, which will ultimately facilitate the land tenure unification process in Korea, and possibly also improve existing land tenure records (including both public/private land rights, restrictions and responsibilities), one needs a collaborative research development.
The next step is to enrich and test the information quality of the above assumptions and proxies with empirical data tests, inclusion and reflections of local knowledge on the ground (focusing on North Korean defectors’ perspectives) and expert knowledge in EO and land administration sciences in North and South Korea. The findings in Section 4 could also help for creating more machine-learning and deep-learning algorithms that provide reference to other papers. The construction of these algorithms was, however, beyond the scope of this paper.

Author Contributions

Conceptualization, C.L. and W.T.d.V.; Data curation, C.L.; Formal analysis, C.L.; Investigation, C.L.; Methodology, C.L.; Project Administration, C.L.; Resources, C.L.; Supervision, W.T.d.V.; Validation, C.L. and W.T.d.V.; Visualization, C.L.; Writing—original draft, C.L.; Writing—review and editing, C.L. and W.T.d.V. All authors have read and agreed to the published version of the manuscript.

Funding

This work was supported by the German Research Foundation (DFG) and the Technical University of Munich (TUM) in the framework of the Open Access Publishing Program.

Acknowledgments

We thank three anonymous reviewers for their insightful comments in narrowing the gap between our claims and the actual content of the manuscript. We are also immensely grateful to colleagues who provided insight and expertise that greatly assisted the research, although any errors are our own and should not tarnish the reputations of these esteemed persons.

Conflicts of Interest

The authors declare no conflict of interest.

References

  1. Robinson, B.E.; Holland, M.B.; Naughton-Treves, L. Does secure land tenure save forests? A meta-analysis of the relationship between land tenure and tropical deforestation. Glob. Environ. Chang. 2014, 29, 281–293. [Google Scholar] [CrossRef]
  2. Payne, G.; Durand-Lasserve, A. Holding on: Security of Tenure-Types, Policies, Practices and Challenges. Research Paper Prepared for an Expert Group Meeting of Tenure Convened by the United Nations Special Rapporteur on Adequate Housing, October 2012. Available online: https://www.ohchr.org/Documents/Issues/Housing/SecurityTenure/Payne-Durand-Lasserve-BackgroundPaper-JAN2013.pdf (accessed on 18 January 2019).
  3. Petersen, R.; Stevens, C. Putting People on the Map: The Land Tenure Data Challenge and Global Forest Watch. Global Forest Watch. Available online: https://blog.globalforestwatch.org/data-and-research/land-tenure-gfw (accessed on 2 October 2018).
  4. Chaturvedi, R.; Shelar, K.; Singh, K.K. MAPTenure: Enabling Tenurial Clarity for Orange Areas of Central India; WRI: Mumbai, India, 2018. [Google Scholar]
  5. Biscaye, P.; Callaway, K.; Chen, K.; McDonald, M.; Morton, E.; Reynolds, T.; Anderson, L. Land Tenure Technologies Summary of Services and Implementation; Evans School Policy Analysis and Research (EPAR): Washington, DC, USA, 2017. [Google Scholar]
  6. Schweik, C.M.; Thomas, C.W. Using Remote Sensing to Evaluate Environmental Institutional Designs: A Habitat Conservation Planning Example. Soc. Sci. Q. 2002, 83, 244–262. [Google Scholar] [CrossRef]
  7. Hall, O. Remote sensing in social science research. Open Remote Sens. J. 2010, 3, 1–16. [Google Scholar] [CrossRef] [Green Version]
  8. Donaldson, D.; Storeygard, A. The View from Above: Applications of Satellite Data in Economics. J. Econ. Perspect. 2016, 30, 171–198. [Google Scholar] [CrossRef] [Green Version]
  9. Patino, J.E.; Duque, J.C. A review of regional science applications of satellite remote sensing in urban settings. Comput. Environ. Urban Syst. 2013, 37, 1–17. [Google Scholar] [CrossRef]
  10. Crommelinck, S.; Bennett, R.; Gerke, M.; Nex, F.; Yang, M.; Vosselman, G. Review of Automatic Feature Extraction from High-Resolution Optical Sensor Data for UAV-Based Cadastral Mapping. Remote Sens. 2016, 8, 689. [Google Scholar] [CrossRef] [Green Version]
  11. Crommelinck, S.; Bennett, R.; Gerke, M.; Yang, M.; Vosselman, G. Contour Detection for UAV-Based Cadastral Mapping. Remote Sens. 2017, 9, 171. [Google Scholar] [CrossRef] [Green Version]
  12. Crommelinck, S.; Koeva, M.; Yang, M.Y.; Vosselman, G. Application of Deep Learning for Delineation of Visible Cadastral Boundaries from Remote Sensing Imagery. Remote Sens. 2019, 11, 2505. [Google Scholar] [CrossRef] [Green Version]
  13. Fetai, B.; Oštir, K.; Kosmatin Fras, M.; Lisec, A. Extraction of Visible Boundaries for Cadastral Mapping Based on UAV Imagery. Remote Sens. 2019, 11, 1510. [Google Scholar] [CrossRef] [Green Version]
  14. Konecny, G. Cadastral Mapping with Earth Observation Technology. In Geospatial Technology for Earth Observation; Li, D., Shan, J., Gong, J., Eds.; Springer: Boston, MA, USA, 2009; pp. 397–409. [Google Scholar] [CrossRef]
  15. Luo, X.; Bennett, R.; Koeva, M.; Lemmen, C.; Quadros, N. Quantifying the Overlap between Cadastral and Visual Boundaries: A Case Study from Vanuatu. Urban Sci. 2017, 1, 32. [Google Scholar] [CrossRef] [Green Version]
  16. Luo, X.; Bennett, R.M.; Koeva, M.; Lemmen, C. Investigating Semi-Automated Cadastral Boundaries Extraction from Airborne Laser Scanned Data. Land 2017, 6, 60. [Google Scholar] [CrossRef] [Green Version]
  17. Nyandwi, E.; Koeva, M.; Kohli, D.; Bennett, R. Comparing Human Versus Machine-Driven Cadastral Boundary Feature Extraction. Remote Sens. 2019, 11, 1662. [Google Scholar] [CrossRef] [Green Version]
  18. Wassie, Y.A.; Koeva, M.N.; Bennett, R.M.; Lemmen, C.H.J. A procedure for semi-automated cadastral boundary feature extraction from high-resolution satellite imagery. J. Spat. Sci. 2018, 63, 75–92. [Google Scholar] [CrossRef] [Green Version]
  19. Xia, X.; Persello, C.; Koeva, M. Deep Fully Convolutional Networks for Cadastral Boundary Detection from UAV Images. Remote Sens. 2019, 11, 1725. [Google Scholar] [CrossRef] [Green Version]
  20. Lambin, E.F.; Turner, B.L.; Geist, H.J.; Agbola, S.B.; Angelsen, A.; Bruce, J.W.; Coomes, O.T.; Dirzo, R.; Fischer, G.; Folke, C.; et al. The causes of land-use and land-cover change: Moving beyond the myths. Glob. Environ. Chang. 2001, 11, 261–269. [Google Scholar] [CrossRef]
  21. Cumming, G.S.; Barnes, G. Characterizing land tenure dynamics by comparing spatial and temporal variation at multiple scales. Landsc. Urban Plan. 2007, 83, 219–227. [Google Scholar] [CrossRef]
  22. Donnelly, S.; Evans, T.P. Characterizing spatial patterns of land ownership at the parcel level in south-central Indiana, 1928–1997. Landsc. Urban Plan. 2008, 84, 230–240. [Google Scholar] [CrossRef]
  23. National Research Council. People and Pixels: Linking Remote Sensing and Social Science; The National Academies Press: Washington, DC, USA, 1998. [Google Scholar] [CrossRef]
  24. Liu, X.; He, J.; Yao, Y.; Zhang, J.; Liang, H.; Wang, H.; Hong, Y. Classifying urban land use by integrating remote sensing and social media data. Int. J. Geogr. Inf. Sci. 2017, 31, 1675–1696. [Google Scholar] [CrossRef]
  25. Bennett, R.; Kitchingman, A.; Leach, J. On the nature and utility of natural boundaries for land and marine administration. Land Use Policy 2010, 27, 772–779. [Google Scholar] [CrossRef]
  26. Whittal, J. A new conceptual model for the continuum of land rights. S. Afr. J. Geomat. 2014, 3, 13–32. [Google Scholar]
  27. Herrera, M. Land Tenure Data and Policy Making in Latin America. In Proceedings of the Conclusive Expert Meeting on FAO Normative Work on Land Tenure Data, Rome, Italy, 22–23 September 2005. [Google Scholar]
  28. Bratasanu, D.; Nedelcu, I.; Datcu, M. Bridging the Semantic Gap for Satellite Image Annotation and Automatic Mapping Applications. IEEE J. Sel. Top. Appl. Earth Obs. Remote Sens. 2011, 4, 193–204. [Google Scholar] [CrossRef] [Green Version]
  29. Yang, D.; Fu, C.-S.; Smith, A.C.; Yu, Q. Open land-use map: A regional land-use mapping strategy for incorporating OpenStreetMap with earth observations. Geospat. Inf. Sci. 2017, 20, 269–281. [Google Scholar] [CrossRef] [Green Version]
  30. Henssen, J. Basic Principles of the Main Cadastral Systems in the World, Modern Cadastres and Cadastral Innovations. In Proceedings of the One Day Seminar Held During the Annual Meeting of FIG Commission 7, Cadastre and Rural Land Management, International Federation of Surveyors (FIG), Delft, The Netherlands, 16 May 1995; pp. 5–12. [Google Scholar]
  31. Zevenbergen, J.A.; Frank, A.; Stubkjaer, E. Real Property Transactions: Procedures, Transaction Costs and Models; IOS Press: Amsterdam, The Netherlands, 2007. [Google Scholar]
  32. Van der Molen, P. The Future Cadastres—Cadastres After 2014. In Proceedings of the FIG Working Week 2003, Paris, France, 13–17 April 2003. [Google Scholar]
  33. Lemmen, C.; van Oosterom, P.; Bennett, R. The Land Administration Domain Model. Land Use Policy 2015, 49, 535–545. [Google Scholar] [CrossRef] [Green Version]
  34. Lemmen, C.H.J. A Domain Model for Land Administration. Ph.D. Thesis, Delft University of Technology, Delft, The Netherlands, 2012. Available online: http://www.itc.nl/library/papers_2012/phd/lemmen.pdf (accessed on 29 March 2019).
  35. UN-Habitat. Secure Land Rights for All; UN Habitat: Nairobi, Kenya, 2008. [Google Scholar]
  36. Enemark, S.; Bell, K.C.; Lemmen, C.; McLaren, R. Fit-For-Purpose Land Administration; International Federation of Surveyors (FIG): Copenhagen, Denmark, 2014. [Google Scholar]
  37. Zevenbergen, J.; De Vries, W.; Bennett, R.M. Advances in Responsible Land Administration; CRC Press: Boca Raton, FL, USA, 2015. [Google Scholar]
  38. Ma, L.; Liu, Y.; Zhang, X.; Ye, Y.; Yin, G.; Johnson, B.A. Deep learning in remote sensing applications: A meta-analysis and review. ISPRS J. Photogramm. Remote Sens. 2019, 152, 166–177. [Google Scholar] [CrossRef]
  39. Levin, N.; Ali, S.; Crandall, D. Utilizing remote sensing and big data to quantify conflict intensity: The Arab Spring as a case study. Appl. Geogr. 2018, 94, 1–17. [Google Scholar] [CrossRef]
  40. Schoepfer, E.; Spröhnle, K.; Kranz, O.; Blaes, X.; Kolomaznik, J.; Hilgert, F.; Bartalos, T.; Kemper, T. Towards a multi-scale approach for an Earth observation-based assessment of natural resource exploitation in conflict regions. Geocarto Int. 2017, 32, 1139–1158. [Google Scholar] [CrossRef]
  41. Gbanie, S.; Griffin, A.; Thornton, A. Impacts on the urban environment: Land cover change trajectories and landscape fragmentation in Post-War Western Area, Sierra Leone. Remote Sens. 2018, 10, 129. [Google Scholar] [CrossRef] [Green Version]
  42. World Bank. Why Are Some Data Not Available? Available online: https://datahelpdesk.worldbank.org/knowledgebase/articles/191133-why-are-some-data-not-available (accessed on 21 September 2019).
  43. Lee, C.; de Vries, W.T. A divided nation: Rethinking and rescaling land tenure in the Korean (re-)unification. Land Use Policy 2018, 75, 127–136. [Google Scholar] [CrossRef]
  44. Lee, C.; de Vries, W.T.; Chigbu, U.E. Land Governance Re-Arrangements: The One-Country One-System (OCOS) Versus One-Country Two-System (OCTS) Approach. Adm. Sci. 2019, 9, 21. [Google Scholar] [CrossRef] [Green Version]
  45. Gyeon, Y.; Lee, S. North Korea Forum Seminar: Collection and Management of North Korea Data and Statistics. Plan. Policy 2006, 292, 102–107. [Google Scholar]
  46. United Nations. UN Entities in DPR Korea. Available online: https://dprkorea.un.org/about/un-entities-in-country (accessed on 23 September 2019).
  47. He, J.; Xu, J. Is there decentralization in North Korea? Evidence and lessons from the sloping land management program 2004–2014. Land Use Policy 2017, 61, 113–125. [Google Scholar] [CrossRef]
  48. Kim, N.; Lee, J.; Lee, H.; Seo, J. Accurate segmentation of land regions in historical cadastral maps. J. Vis. Commun. Image Represent. 2014, 25, 1262–1274. [Google Scholar] [CrossRef]
  49. Lee, H.; Lee, S.; Kim, N.; Seo, J. JigsawMap: Connecting the past to the future by mapping historical textual cadasters. In Proceedings of the SIGCHI Conference on Human Factors in Computing Systems, Austin, TX, USA, 5–10 May 2012; pp. 463–472. [Google Scholar]
  50. Ko, Y.; Yun, H. Analysis of Land Use in North Korea Using the Original of Cadastral Map. J. Korean Soc. Cadastre 2016, 32, 49–57. [Google Scholar]
  51. Yu, J.; Lim, J.; Lee, K.-S. Investigation of drought-vulnerable regions in North Korea using remote sensing and cloud computing climate data. Environ. Monit. Assess. 2018, 190, 126. [Google Scholar] [CrossRef]
  52. Um, D.-B.; Um, J.-S. Informed consent utilizing satellite imagery in forestry carbon trading with North Korea. Int. Environ. Agreem. Politics Law Econ. 2017, 17, 531–552. [Google Scholar] [CrossRef]
  53. Lim, J.; Lee, K.-S. Flood Mapping Using Multi-Source Remotely Sensed Data and Logistic Regression in the Heterogeneous Mountainous Regions in North Korea. Remote Sens. 2018, 10, 1036. [Google Scholar] [CrossRef] [Green Version]
  54. Lim, J.; Lee, K.-S. Investigating flood susceptible areas in inaccessible regions using remote sensing and geographic information systems. Environ. Monit. Assess. 2017, 189, 96. [Google Scholar] [CrossRef]
  55. Ernst, M.; Jurowetzki, R. Satellite Data, Women Defectors and Black Markets in North Korea: A Quantitative Study of the North Korean Informal Sector Using Night-Time Lights Satellite Imagery. North Korean Rev. 2016, 12, 64–83. [Google Scholar]
  56. Lim, H.-T.; Yang, S.-C.; Lee, S.-H.; Shin, D.-B.; Ahn, J.-W. An Experimental Project on Land Information Establishment in North Korea Regarding Rapid Unification; LX Spaital Information Research Institute: Seoul, Korea, 2015. [Google Scholar]
  57. Lee, B.-M.; Kim, T.-J.; Kwak, B.-Y.; Lee, Y.-H.; Choi, J. Improvement of the Korean LADM country profile to build a 3D cadastre model. Land Use Policy 2015, 49, 660–667. [Google Scholar] [CrossRef]
  58. Choi, J.-H.; Kim, B.-J.; Shim, J.-W. A Study on Improvement of Land Characteristic Survey; KAB Real Estate Research & Development Institute: Daegu, Korea, 2015. [Google Scholar]
  59. LX Spatial Information Research Institute. Study on Efficient Implementation of Cadastral Resurvey Project—Improvement of Land Category System by Land Use; Ministry of Land, Transport and Maritime Affairs: Gwacheon, Korea, 2012.
  60. Jensen, J.R.; Cowen, D.C. Remote sensing of urban suburban infrastructure and socio-economic attributes. Photogramm. Eng. Remote Sens. 1999, 65, 611–622. [Google Scholar]
  61. Ramankutty, N.; Graumlich, L.; Achard, F.; Alves, D.; Chhabra, A.; DeFries, R.S.; Foley, J.A.; Geist, H.; Houghton, R.A.; Goldewijk, K.K.; et al. Global Land-Cover Change: Recent Progress, Remaining Challenges. In Land-Use and Land-Cover Change: Local Processes and Global Impacts; Lambin, E.F., Geist, H., Eds.; Springer: Berlin/Heidelberg, Germany, 2006; pp. 9–39. [Google Scholar] [CrossRef]
  62. Wickham, J.; Stehman, S.V.; Homer, C.G. Spatial patterns of the United States National Land Cover Dataset (NLCD) land-cover change thematic accuracy (2001–2011). Int. J. Remote Sens. 2018, 39, 1729–1743. [Google Scholar] [CrossRef] [PubMed] [Green Version]
  63. Lymburner, L.; Tan, P.; Mueller, N.; Thackway, R.; Lewis, A.; Thankappan, M.; Randall, L.; Islam, A.; Senarath, U. The national dynamic land cover dataset - Technical Report; Record 2011/031; Geoscience Australia: Canberra, Australia, 2011. Available online: http://pid.geoscience.gov.au/dataset/ga/71069 (accessed on 5 April 2019).
  64. Büttner, G. CORINE Land Cover and Land Cover Change Products. In Land Use and Land Cover Mapping in Europe: Practices & Trends; Manakos, I., Braun, M., Eds.; Springer: Dordrecht, The Netherlands, 2014; pp. 55–74. [Google Scholar] [CrossRef]
  65. Zhang, Z.; Wang, X.; Zhao, X.; Liu, B.; Yi, L.; Zuo, L.; Wen, Q.; Liu, F.; Xu, J.; Hu, S. A 2010 update of National Land Use/Cover Database of China at 1:100,000 scale using medium spatial resolution satellite images. Remote Sens. Environ. 2014, 149, 142–154. [Google Scholar] [CrossRef]
  66. Bryman, A. Social Research Methods; Oxford University Press: Oxford, UK, 2016. [Google Scholar]
  67. Fielding, N.G. Triangulation and Mixed Methods Designs: Data Integration with New Research Technologies. J. Mixed Methods Res. 2012, 6, 124–136. [Google Scholar] [CrossRef] [Green Version]
  68. Larsson, G. Land Management: Public Policy, Control and Participation; Coronet Books: London, UK, 1997. [Google Scholar]
  69. Payne, G. Land tenure and property rights: An introduction. Habitat Int. 2004, 28, 167–179. [Google Scholar] [CrossRef]
  70. Fox, J.; Rindfuss, R.R.; Walsh, S.J.; Mishra, V. People and the Environment: Approaches for Linking Household and Community Surveys to Remote Sensing and GIS; Springer Science & Business Media: Berlin, Germany, 2003; Volume 1. [Google Scholar]
  71. Ghaffarian, S.; Kerle, N.; Filatova, T. Remote Sensing-Based Proxies for Urban Disaster Risk Management and Resilience: A Review. Remote Sens. 2018, 10, 1760. [Google Scholar] [CrossRef] [Green Version]
  72. Ghazouani, F.; Farah, I.R.; Solaiman, B. Semantic remote sensing scenes interpretation. In Ontology in Information Science; IntechOpen: London, UK, 2018. [Google Scholar]
  73. Bosse, E.; Roy, J.; Wark, S. Concepts, Models, and Tools for Information Fusion; Artech House Inc.: Norwood, MA, USA, 2007. [Google Scholar]
  74. Altaweel, M.R.; Alessa, L.N.; Kliskey, A.D.; Bone, C.E. Monitoring Land Use: Capturing Change through an Information Fusion Approach. Sustainability 2010, 2, 1182–1203. [Google Scholar] [CrossRef] [Green Version]
  75. Bossé, É.; Solaiman, B. Information Fusion and Analytics for Big Data and IoT; Artech House: Norwood, MA, USA, 2016. [Google Scholar]
  76. Kim, Y.-H. Changes in Agricultural Farms in North Korea—Focusing on Cooperative Farms. Q. Agric. Trends North Korea 2010, 12, 3–17, UCI: I410-ECN-0102-2018-500-004168983. [Google Scholar]
  77. Kosztra, B.; Büttner, G.; Hazeu, G.; Arnold, S. Updated CLC Illustrated Nomenclature Guidelines; European Environmental Agency: Copenhagen, Denmark, 2017. [Google Scholar]
  78. Choi, W.; Kang, S.; Choi, J.; Larsen, J.J.; Oh, C.; Na, Y.-G. Characteristics of deforestation in the Democratic People’s Republic of Korea (North Korea) between the 1980s and 2000s. Reg. Environ. Chang. 2017, 17, 379–388. [Google Scholar] [CrossRef]
  79. Kim, Y.-H.; Kwon, T.-J.; Lim, S.-K.; Choi, S.-K. A Study on North Korea’s Agricultural Reform Measures after the Economic Crisis; Korea Rural Economic Institute: Jeollanam-do, Korea, 2013; pp. 1–146. [Google Scholar]
  80. Kim, C.S. DPR Korea 2008 Population Census National Report; Central Bureau of Statistics: Pyongyang, DPR Korea, 2009.
  81. Choi, S.-H.; Choi, D.-S.; Lee, J.-K.; Hong, S.-W. North Korea Housing Survey and Analysis; Land and Housing Institute: Deajeon, Korea, 2015. [Google Scholar]
  82. Reenberg, A.; Lund, C. Land Use and Land Right Dynamics—Determinants for Resource Management Options in Eastern Burkina Faso. Hum. Ecol. 1998, 26, 599–620. [Google Scholar] [CrossRef]
  83. Hettig, E.; Lay, J.; Sipangule, K. Drivers of Households’ Land-Use Decisions: A Critical Review of Micro-Level Studies in Tropical Regions. Land 2016, 5, 32. [Google Scholar] [CrossRef] [Green Version]
  84. Lim, S.H. Coexistence of Planning and Markets; Samsung Economic Research Institute: Seoul, Korea, 2008. [Google Scholar]
  85. Stoter, J.E.; van Oosterom, P. 3D Cadastre in an International Context: Legal, Organizational, and Technological Aspects; CRC Press: Boca Raton, FL, USA, 2006. [Google Scholar]
  86. Li, J.; Huang, X.; Gong, J. Deep neural network for remote-sensing image interpretation: Status and perspectives. Natl. Sci. Rev. 2019. [Google Scholar] [CrossRef]
Figure 1. Contextualization of Area of Interest (left: Fragile States Index 2019 (https://fragilestatesindex.org), right: background information of South and North Korea based on Major Statistics Indicators of North Korea 2019 (https://kosis.kr/bukhan/index/index.do) (devised by authors).
Remotesensing 12 00255 g001
Figure 2. The general structure of an information element and its processes for the interpretation of the semantic land tenure relations (devised by authors).
Remotesensing 12 00255 g002
Figure 3. Spatial characteristics of cooperative farmlands extracted from high-resolution EO data. (a) stands for the Unha collective farmlands surrounded by (dry) paddy-fields (georeferenced: Onchon county, South Pyeongan); (b) represents planned spatial arrangements and a centralized cluster of buildings and dwellings; (c) highlights buildings and houses utilize homogeneous materials and retains its similar physical shapes and simple roof structures; (d) includes textures of irrigation channels and features of rice (dry) paddy-fields. (Image sources: Google Earth, date of access: 9 October 2019).
Remotesensing 12 00255 g003
Figure 4. Spatial characteristics of State farmlands extracted from high-resolution EO data; (a) describes whole region of the No. 5 State farmland in Taehongdan county in Ryanggang; (b) shows key spatial arrangements of State farmlands embracing: agriculture-based infrastructures (e.g., fertilizer and processing factories and colleges and research institutes etc.); monumental buildings (e.g., revolutionary museums etc.); welfare facilities (e.g., house of culture, markets and shop, and kindergarten etc.); (c) is a site of microbial compound fertilizer factory (upper) and agricultural testbed or greenhouses (middle); (d) a site for potato processing factory (image sources: Google Earth, date of access: 9 October 2019).
Remotesensing 12 00255 g004
Figure 5. The example of land use and cover changes in Ryanggang between 1990 (upper) and 2000 (lower) with the currently available data set produced by the Ministry of Environment (MoE) using Landsat TM imagery (1991–1999) and Landsat 7 ETM+ imagery (2008–2010) (image sources: [78] and revised by authors).
Remotesensing 12 00255 g005
Figure 6. Different types of housing and their morphological features. (a) Condominium or residential block buildings; (b) detached houses; (c) (semi-)detached houses; (d) showing different forms of housing shapes (e.g., linear, curved, rectangular patterns and different colors of roofs etc.) (Image sources: Google Earth, date of access: 16 October 2019).
Remotesensing 12 00255 g006
Figure 7. Morphology and urban structures of the Socialist lifestyle are discovered in the cooperative farmland in 2002 (a) and 2018 (b). (c) Changes in land use from farmland to residential areas; (d) changes in land use with more community-oriented development; (e) showing newly-built agricultural facilities; (f) changes of residential development at higher densities (image sources: Google Earth, date of access: 17 October 2019).
Remotesensing 12 00255 g007
Figure 8. Spatial characteristics of the ‘sotoji’. (a): between Onsong and Sambong, North Hamgyong; (b) the Sambong cooperative farm, Phyeongwon; (c) Hyesan, Ryanggang (Image sources: Google Earth, date of access: 17 October 2019).
Remotesensing 12 00255 g008
Figure 9. Multiple examples of urban structures on certain land parcels: (a) solar panels (in Kumsanpho solar power station), (b) railroads (in Rajin), (c) drinking water production facilities (in Kaesong), (d) a transmission tower (in Electric power transmission office in Sepho), (e) pipelines (in Seungri chemical complex refinery in Rason), (f) footpaths (in Pyeongyang), (g) public heritage (in Hyesan), (h) military site (in Pukchang), (i) reservoir (in Ryongrim) (image sources: Google Earth, date of access: 17 October 2019).
Remotesensing 12 00255 g009
Table 1. The conceptual models of semantic land tenure relations.
Semantic Land Tenure RelationsLand Tenure Data SpecificationEO Data Application
Subject-Right-Object Model [30]The model only distinct three categories: “subject-rights-objects”. Subjects are persons, groups, firms or States. Rights are ownership, use, control, access and transfer rights. Objects are physical features. The model puts in principle the accent on the relation “subject-right (who and how)”, and on the relation on “right-object (where and how much)”.Scalability: currently EO data only looks at physical objects. This includes identifying cadastral (parcel and building) boundary-mapping approaches and land use attributes. However, other attributes can be derived using technical advances of Earth Observation (EO).
Land Administration Domain Model (LADM) [33]The Land Administration Domain Model (LADM) facilitates the management of different tenures in “one environment”; it covers all land tenure-related data components including parties (person or organization), legal/administrative units (right, responsibility and restrictions), spatial objects (parcel, buildings and utility networks), and data on surveying and spatial representation (geometric/topological data).Inter-operability: to capture semantics of the land administration and data-related components, a range of data acquisition methods is emphasized (e.g., satellite images, Unmanned Aerial Vehicles (UAVs) and automatic feature extraction).
Continuum of Land Rights [35]It refers to recognizing, recording, administering a variety of appropriate and legitimate land tenure data. It, thus, focuses on the “tenurial pluralism” (diversity of tenure arrangements) and duality in subjects.Flexibility: underlining importance of data robustness and accuracies using more sophisticated technologies to systemically accumulate land tenure data
Fit-For-Purpose Land Administration [36]Capturing spatial land tenure data should be “flexible and participatory” that covers all tenure data in scope. Moreover, acquired land tenure data is used affordable technologies and needs to provide adequate reliability within a limited time and resources. All land tenure data should be kept up-to-date.Accuracy: application of general boundary mapping (rural); the use of high resolution satellite imagery (urban); high accuracy of information; on-going updating, sporadic upgrading and incremental improvement
Responsible Land Administration [37] It addresses changes in people to land relations based on “socio-technical and institutional advances”. New geoICT-driven and thought-restructuring land data capture, visualization, and sharing techniques with a clear understanding of a legal, organizational, and governance context can acquire specific characteristics of land tenure.Legitimacy: emerging geospatial technologies including high-resolution satellite imagery for data collection and management offers new insights on legitimizing land rights and documentation as well as acknowledging different forms of land tenure.
Table 2. Earth Observation (EO) data and Artificial Intelligence (AI) delves deeper into the future of land administration and the advanced techniques substitute to a certain extent the feature and boundary extraction for cadastral mapping. However, a number of critical questions remain about the interpretation of semantic land tenure relations using both EO and AI.
TechnologiesTechniquesSources
EOAI
CVDL
Aerial imagery (Orthophoto)NoNoCadastral morphology investigation: visual interpretation from the overlay of the cadastral map over orthophotos[15]
Airborne Laser Scanning (ALS) Semi-automatic boundary extraction: Alpha shape (α-shapes), Canny, and Skeleton algorithm[16]
Unmanned Aerial Vehicles (UAVs) Automatic feature extraction: Globalized Probability of Boundary (gPb) contour detections[11]
High Resolution Satellite Imagery (HRSI) Semi-automatic boundary feature extraction: mean-shift segmentation plug-in QGIS, the buffer overlay methods[18]
Unmanned Aerial Vehicles (UAVs) Automatic boundary extraction: ENVI feature extraction (FX) module[13]
High Resolution Satellite Imagery (HRSI) Automatic boundary extraction: Multi-Resolution Segmentation (MRS), estimation of scale parameter (ESP)[17]
Unmanned Aerial Vehicles (UAVs) Automatic cadastral boundary detection: deep Fully Convolutional Networks (FCNs)[19]
Aerial imagery and UAVs Automatic boundary classification: Random Forest (RF), Convolutional Neural Networks (CNN)[12]
Table 3. Existing rules for defining land tenure relations in the context of Korean (re-)unification (functional classifications).
CategoriesExisting Rules for Identifying Land Tenure Relations in SKExisting Rules for Identifying Land Tenure Relations in NKLegal Grounds
3Rs (rights, responsibility and restrictions)Private land; State land; province land; county land; land owned by corporation (judicial person); land owned by a clan; land owned by a religious group; land owned by other groups; others (9 types)Common ownership; lease; ownership; partitioned ownership; tenancy; superficies; partitioned superficies; usufruct; easement; fishing; keeping a snow-free pavement; cleaning a ditch; servitude; servitude partly (14 types)State land; collective farmland (2 types)(cf. Since North Korea does not recognize private ownership; there is no land use regulation through the restriction of private rights. Although all land belongs to the State, both the State and the individual or collective can restrict the use by restricting the access. Nature reserves, military sites, public heritage are typically locations where the State wants to restrict access, use and control through such restrictions.)The Constitution (NK)
The Civil Law (NK)
The Civil Act (SK)
LADM (SK);
Land (use) categories Building site; dry paddy-field; paddy-field; orchard; forestry; pasture site; mineral spring site; saltern; factory site; school site; parking lot; gas station site; warehouse site; road; railway site; water supply site; river; ditch; fish-farm; park; historic site; gymnasium site; recreation area; religious site; graveyard; miscellaneous land (28 types)Agricultural-purpose land (arable land); settlement land (construction land and its attached land in local labor areas as well as public land); forestry land (land used in the hills and fields); industry land (sites of industrial facilities such as mine, factories, and the land pertaining to it); waterstock land (land for coast, territorial waters, river and streams, lake, reservoir and irrigation ditch); special-purpose land (cultural heritage sites, historical landmarks, sanctuary and military) (6 types)The Act on the Establishment, Management, etc. of Spatial data (SK);
The Land Law (NK)
Land (use) characteristics detached-house lot, row-house lot, multiplex-house lot, apartment lot, residential vacant lot, other residential lots; commercial lot, office lot, commercial/office lot, other commercial/office lots; mixed-use lot, mixed-use vacant lot, other mixed-used lots; industrial lot, industrial vacant lot, other industrial lots; dry paddy-field, orchard, other dry paddy-fields; paddy-field, other paddy-fields; afforestation, natural forest, forest land, pasture, other forestry; mineral spring site, mining site, saltern site, recreation area, cemetery park, golf course, racecourse, passenger transport terminal, condominium, other special-purpose lands; roads etc., rivers etc., parks etc., playgrounds etc., parking lot etc., high-risk establishments, obnoxious facilities and Others (45 types)Agricultural-purpose land (arable land); settlement land (construction land and its attached land in local labor areas as well as public land); forestry land (land used in the hills and fields); industry land (sites of industrial facilities such as mine, factories, and the land pertaining to it); waterstock land (land for coast, territorial waters, river and streams, lake, reservoir and irrigation ditch); special-purpose land (cultural heritage sites, historical landmarks, sanctuary and military) (6 types)The Act on the Public Announcement of Values and Appraisal of Real Estate (SK);
The Land Law (NK)
Land (use) infrastructureRoad; park; railway; (public) open space; waste treatment facilities and water-pollution preventive facilities; heat/gas/oil supplying and storing installations; electric supplying installations; slaughterhouse; graveyards; markets and distribution facilities; recreation area; parking lot; car stations; square; playground and sport facilities; water supplying instalments; public buildings (e.g., school and library); communication facilities; cultural, research, social welfare, public vocational training, youth training facilities, others (21 types)Dwelling house; public buildings; production buildings; water supplying instalments; heat/gas/oil supplying facilities; road; street green; footpath; streetlight; bridge; tunnel; underground passage; road safety facilities; road markings; bus/tram station; car washing facilities; river (stream); park; recreation area; open space; urban forest; protection forest; zoo/botanical gardens; greenhouse; tree nursery; flower garden; cultural facilities; sanitation facilities; cremation facilities (assumed 29 types)The National Land Planning And Utilization Act (SK);
The Urban Management Law (NK)
Table 4. Identifying proxies to derive unknown land tenure relations over North Korea in conjunction with EO data (devised by authors).
No.Land Tenure RelationsProposed ProxiesElements of EO Data Interpretation
4.1Collective (farm) landPresence of (dry) paddy fields
Area linked to or surrounded by (dry) paddy fields
(Dry) paddy fields: rough (or coarse) image texture
Settlements: high density or compactness
Rural dwellings: object colors in grey scales, a signature line of the tiled roof, densely built-up block structure with single-story detached houses
Presence of portable farming-related objects on the ground
Seasonal changes of agricultural activities
State (farm) landOrchards: small dot-shaped patch
Pastures: smooth textures
Warehouses (or sheds): out-buildings
Building sites: low building density
Buildings: complex, elongated or irregular object boundaries
Roofs: blue, green, yellow and red and light (brightness)
Agriculture-based infrastructures, monumental buildings, and welfare facilities
4.2LURsLand uses: intense land development
Land uses: an increase of agricultural land
LULC changes: urban areas with the development of water bodies
LULC changes: in border regions than inland areas
Presence of different types of houses (and allotments)
(Semi-)detached houses: low building density, 1 or 2 storied houses, uniformly shaped settlement, in close proximity to roads, low to intermediate imperviousness
Apartments: large rectangular simple form, regular alignment, more than three stories, and low to intermediate imperviousness and shadow silhouettes
Allotments: detached small-sized buildings, low built-up land, low imperviousness, buffer between houses
Harmonica houses (in rural areas): small roof with slate materials, chimneys on rooftops (small dot-shaped objects or a light shadow Silhouette) and fences (line-shaped objects)
New construction or extension of residential building and expansion of construction activities
4.3Group LURsAmalgamation of diverse community amenities
Conversion: presence of multiple building objects with similar patterns, high density of settlement, simple rectangular forms, and same roof colors
Adjacent land uses: similarity or dissimilarity
Construction/extension of community buildings or infrastructure by the existing building removal
Accessibility: improved access to roads (paved road and wider widths)
Greenhouses: new construction in a barren land and adjacency to dwellings (materials: plastic or glass, roof colors: white or grey, brightness: light, and texture: rough)
Increase of the number of houses in a certain vicinity (high density)
Existence of undivided shared areas of the common property or public infrastructure
4.4LTRsPresence of small land (sotoji): garden plot (GP), side-job plot (SJP), and tiny patch of land (TPL)
Garden plot (GP): small parcel size, in front/back yards or attached to each other, green color
Side-job plot (SJP): large parcel size, in front/back yards or attached to each other, green color
Tiny patch of land (TPL): lower elevation, gentle slope less than 15%, the small patches of vegetation cover between neighboring lands on the mountain (hillsides) or along the streams or ditches
4.5LARsPublic utility networks, nature reserves, and heritage sites: in close proximity to hazardous or isolated locations, poor accessibility (lack of access roads; low to intermediate imperviousness), elongated object shapes, and less green and open spaces (fewer green colors and rough textures)
Subdivision of land parcels
Note.
ColorShapeSizeTexturePatternShadowHeightSiteAssociationDensity

