A Sentinel-1 Based Processing Chain for Detection of Cyclonic Flood Impacts

 , ,
, ,
Abstract
1. Introduction
2. Materials and Methods
2.1. Study Area
2.1.1. Marsh Harbour, Great Abaco, Bahamas (Dorian)
2.1.2. Beira, Mozambique (Idai)
2.2. Data
2.3. Methods
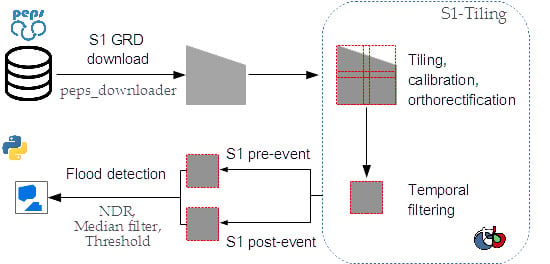
2.3.1. General Framework
2.3.2. Sentinel-1 Pre-Processing (S1-Tiling)
2.3.3. Normalized Difference Ratio
2.3.4. Data Validation and Comparison
- (1)
- The observed agreement rate or accuracy:
- (2)
- The probability of flooded (Pf), non-flooded (Pnf) and the probability of random agreement (Pe):
- (3)
- Cohen’s Kappa:
- <0.01 → no agreement
- 0.01–0.20 → slight agreement
- 0.21–0.40 → fair agreement
- 0.41–0.60 → moderate agreement
- 0.61–0.80 → substantial agreement
- 0.81–1.00 → almost perfect agreement.
3. Results
3.1. Bahamas
3.2. Beira
3.3. Time-Series Processing
3.3.1. Marsh Harbour
3.3.2. Beira
4. Discussion
5. Conclusions
Author Contributions
Funding
Acknowledgments
Conflicts of Interest
References
- The CEOS Database: Catalogue of Satellite Instruments. Available online: http://database.eohandbook.com/database/instrumenttable.aspx (accessed on 17 December 2019).
- Joyce, K.E.; Belliss, S.E.; Samsonov, S.V.; McNeill, S.J.; Glassey, P.J. A review of the status of satellite remote sensing and image processing techniques for mapping natural hazards and disasters. Prog. Phys. Geogr. Earth Environ. 2009, 33, 183–207. [Google Scholar] [CrossRef]
- Kossin, J.P.; Emanuel, K.A.; Vecchi, G.A. The poleward migration of the location of tropical cyclone maximum intensity. Nature 2014, 509, 349–352. [Google Scholar] [CrossRef] [PubMed]
- Climate Phenomena and their Relevance for Future Regional Climate Change. In Climate Change 2013: The Physical Science Basis; Cambridge University Press: Cambridge, UK, 2013; pp. 1–92.
- Fitchett, J.M.; Grab, S.W. A 66-year tropical cyclone record for south-east Africa: temporal trends in a global context. Int. J. Climatol. 2014, 34, 3604–3615. [Google Scholar] [CrossRef]
- Kuleshov, Y.; Fawcett, R.; Qi, L.; Trewin, B.; Jones, D.; McBride, J.; Ramsay, H. Trends in tropical cyclones in the South Indian Ocean and the South Pacific Ocean. J. Geophys. Res. 2010, 115, D01101. [Google Scholar] [CrossRef]
- Fitchett, J.M. Recent emergence of CAT5 tropical cyclones in the South Indian Ocean. S. Afr. J. Sci. 2018, 114. [Google Scholar] [CrossRef]
- Revilla-Romero, B.; Hirpa, F.; Pozo, J.; Salamon, P.; Brakenridge, R.; Pappenberger, F.; De Groeve, T. On the Use of Global Flood Forecasts and Satellite-Derived Inundation Maps for Flood Monitoring in Data-Sparse Regions. Remote Sens. 2015, 7, 15702–15728. [Google Scholar] [CrossRef]
- Bioresita, F.; Puissant, A.; Stumpf, A.; Malet, J.-P. A Method for Automatic and Rapid Mapping of Water Surfaces from Sentinel-1 Imagery. Remote Sens. 2018, 10, 217. [Google Scholar] [CrossRef]
- Martinis, S.; Twele, A.; Voigt, S. Unsupervised Extraction of Flood-Induced Backscatter Changes in SAR Data Using Markov Image Modeling on Irregular Graphs. IEEE Trans. Geosci. Remote Sens. 2011, 49, 251–263. [Google Scholar] [CrossRef]
- Sanyal, J.; Lu, X.X. Application of Remote Sensing in Flood Management with Special Reference to Monsoon Asia: A Review. Nat. Hazards 2004, 33, 283–301. [Google Scholar] [CrossRef]
- Klemas, V. Remote Sensing of Floods and Flood-Prone Areas: An Overview. J. Coast. Res. 2015, 314, 1005–1013. [Google Scholar] [CrossRef]
- Lin, L.; Di, L.; Yu, E.G.; Kang, L.; Shrestha, R.; Rahman, M.S.; Tang, J.; Deng, M.; Sun, Z.; Zhang, C.; et al. A review of remote sensing in flood assessment. In Proceedings of the IEEE 2016 Fifth International Conference on Agro-Geoinformatics (Agro-Geoinformatics), Tianjin, China, 18–20 July 2016; pp. 1–4. [Google Scholar]
- Shen, X.; Wang, D.; Mao, K.; Anagnostou, E.; Hong, Y. Inundation Extent Mapping by Synthetic Aperture Radar: A Review. Remote Sens. 2019, 11, 879. [Google Scholar] [CrossRef]
- Bovolo, F.; Bruzzone, L. A detail-preserving scale-driven approach to change detection in multitemporal SAR images. IEEE Trans. Geosci. Remote Sens. 2005, 43, 2963–2972. [Google Scholar] [CrossRef]
- Gamba, P.; Dell’Acqua, F.; Trianni, G. Rapid Damage Detection in the Bam Area Using Multitemporal SAR and Exploiting Ancillary Data. IEEE Trans. Geosci. Remote Sens. 2007, 45, 1582–1589. [Google Scholar] [CrossRef]
- Martinez, J.; Letoan, T. Mapping of flood dynamics and spatial distribution of vegetation in the Amazon floodplain using multitemporal SAR data. Remote Sens. Environ. 2007, 108, 209–223. [Google Scholar] [CrossRef]
- Cian, F.; Marconcini, M.; Ceccato, P. Normalized Difference Flood Index for rapid flood mapping: Taking advantage of EO big data. Remote Sens. Environ. 2018, 209, 712–730. [Google Scholar] [CrossRef]
- Zhang, S.; Lu, H. Learning Texture Classifier for Flooded Region Detection in SAR Images. In Proceedings of the IEEE International Conference on Computer Graphics, Imaging and Visualization (CGIV’05), Beijing, China, 26–29 July 2005; pp. 93–98. [Google Scholar]
- Gong, M.; Li, Y.; Jiao, L.; Jia, M.; Su, L. SAR change detection based on intensity and texture changes. ISPRS J. Photogramm. Remote Sens. 2014, 93, 123–135. [Google Scholar] [CrossRef]
- Ouled Sghaier, M.; Hammami, I.; Foucher, S.; Lepage, R. Flood Extent Mapping from Time-Series SAR Images Based on Texture Analysis and Data Fusion. Remote Sens. 2018, 10, 237. [Google Scholar] [CrossRef]
- Twele, A.; Cao, W.; Plank, S.; Martinis, S. Sentinel-1-based flood mapping: a fully automated processing chain. Int. J. Remote Sens. 2016, 37, 2990–3004. [Google Scholar] [CrossRef]
- Li, Y.; Martinis, S.; Plank, S.; Ludwig, R. An automatic change detection approach for rapid flood mapping in Sentinel-1 SAR data. Int. J. Appl. Earth Obs. Geoinformation 2018, 73, 123–135. [Google Scholar] [CrossRef]
- Amitrano, D.; Di Martino, G.; Iodice, A.; Riccio, D.; Ruello, G. Unsupervised Rapid Flood Mapping Using Sentinel-1 GRD SAR Images. IEEE Trans. Geosci. Remote Sens. 2018, 56, 3290–3299. [Google Scholar] [CrossRef]
- Zhang, Y.; Wang, S.; Wang, C.; Li, J.; Zhang, H. SAR Image Change Detection Using Saliency Extraction and Shearlet Transform. IEEE J. Sel. Top. Appl. Earth Obs. Remote Sens. 2018, 11, 4701–4710. [Google Scholar] [CrossRef]
- Bayik, C.; Abdikan, S.; Ozbulak, G.; Alasag, T.; Aydemir, S.; Balik Sanli, F. Exploiting multi-temporal Sentinel-1 SAR data for flood extend mapping. ISPRS Int. Arch. Photogramm. Remote Sens. Spat. Inf. Sci. 2018, XLII-3/W4, 109–113. [Google Scholar] [CrossRef]
- Weismiller, R.A.; Kristof, S.J.; Scholz, D.K.; Anuta, P.E.; Momin, S.A. Change Detection in Coastal Zone Environments. Photogramm. Eng. Remote Sens. 1977, 43, 1533–1539. [Google Scholar]
- Rignot, E.J.M.; van Zyl, J.J. Change detection techniques for ERS-1 SAR data. IEEE Trans. Geosci. Remote Sens. 1993, 31, 896–906. [Google Scholar] [CrossRef]
- Gianinetto, M.; Villa, P. Mapping Hurricane Katrina’s widespread destruction in New Orleans using multisensor data and the normalized difference change detection (NDCD) technique. Int. J. Remote Sens. 2011, 32, 1961–1982. [Google Scholar] [CrossRef]
- Jackson, B.B. Multivariate Data Analysis; The Irwin Series in Marketing; Irwin: Homewood, IL, USA, 1983; ISBN 978-0-256-02848-5. [Google Scholar]
- Nielsen, A.; Conradsen, K. Multivariate Alteration Detection (MAD) in Multispectral, bi-Temporal Image Data: A New Approach to Change Detection Studies; Technical University of Denmark: Copenhagen, Denmark, 1997. [Google Scholar]
- Chehata, N.; Orny, C.; Boukir, S.; Guyon, D. Object-based forest change detection using high resolution satellite images. ISPRS Int. Arch. Photogramm. Remote Sens. Spat. Inf. Sci. 2013, XXXVIII-3/W22, 49–54. [Google Scholar] [CrossRef]
- Jensen, J.R. Introductory Digital Image Processing: A Remote Sensing Perspective, 4th ed.; Pearson Series in Geographic Information Science; Pearson Education: Glenview, IL, USA, 2016; ISBN 978-0-13-405816-0. [Google Scholar]
- Neagoe, V.-E.; Stoica, R.-M. A New Neural Approach of Supervised Change Detection in SAR Images Using Training Data Generation with Concurrent Self-Organizing Maps. In Proceedings of the IGARSS 2018—2018 IEEE International Geoscience and Remote Sensing Symposium, Valencia, Spain, 22–27 July 2018; pp. 4792–4795. [Google Scholar]
- Rodríguez, E.; Morris, C.S.; Belz, J.E. A Global Assessment of the SRTM Performance. Photogramm. Eng. Remote Sens. 2006, 72, 249–260. [Google Scholar] [CrossRef]
- Landsea, C.W.; Franklin, J.L. Atlantic Hurricane Database Uncertainty and Presentation of a New Database Format. Mon. Weather Rev. 2013, 141, 3576–3592. [Google Scholar] [CrossRef]
- Hurricane Dorian Causes Devastation in Bahamas. Available online: https://public.wmo.int/en/media/news/hurricane-dorian-causes-devastation-bahamas (accessed on 9 January 2020).
- METEO FRANCE LA REUNION—Alerte cyclonique sur les saisons passées. Available online: http://www.meteofrance.re/cyclone/saisons-passees/2018-2019/dirre/IDAI (accessed on 9 January 2020).
- Filipe D.F., L.; Abdoulaye, H.; Mark, M.; Nyree, P.; Jake, B.; John, W.; Sebastien, L.; Firas, J.; Angel, L.A.V. Reducing Vulnerability to Extreme Hydro-Meteorological Hazards in Mozambique after Cyclone IDAI; World Meteorological Organization: Geneva, Switzerland, 2019. [Google Scholar]
- Thierry Koleck/S1TemporalSeries|GitLab. Available online: http://tully.ups-tlse.fr/koleckt/s1tiling (accessed on 9 January 2020).
- Available online: https://github.com/olivierhagolle/peps_download (accessed on 2 January 2020).
- Quegan, S.; Le Toan, T.; Yu, J.J.; Ribbes, F.; Floury, N. Multitemporal ERS SAR analysis applied to forest mapping. IEEE Trans. Geosci. Remote Sens. 2000, 38, 741–753. [Google Scholar] [CrossRef]
- Mishra, B.; Susaki, J. Optical and SAR data integration for automatic change pattern detection. ISPRS Ann. Photogramm. Remote Sens. Spat. Inf. Sci. 2014, II–7, 39–46. [Google Scholar] [CrossRef]
- Baghdadi, N.; Bernier, M.; Gauthier, R.; Neeson, I. Evaluation of C-band SAR data for wetlands mapping. Int. J. Remote Sens. 2001, 22, 71–88. [Google Scholar] [CrossRef]
- Henry, J.-B.; Chastanet, P.; Fellah, K.; Desnos, Y.-L. Envisat multi-polarized ASAR data for flood mapping. Int. J. Remote Sens. 2006, 27, 1921–1929. [Google Scholar] [CrossRef]
- Clement, M.A.; Kilsby, C.G.; Moore, P. Multi-temporal synthetic aperture radar flood mapping using change detection: Multi-temporal SAR flood mapping using change detection. J. Flood Risk Manag. 2018, 11, 152–168. [Google Scholar] [CrossRef]
- Cohen, J. A Coefficient of Agreement for Nominal Scales. Educ. Psychol. Meas. 1960, 20, 37–46. [Google Scholar] [CrossRef]
- Lukin, V.; Rubel, O.; Kozhemiakin, R.; Abramov, S.; Shelestov, A.; Lavreniuk, M.; Meretsky, M.; Vozel, B.; Chehdi, K. Despeckling of Multitemporal Sentinel SAR Images and Its Impact on Agricultural Area Classification. In Recent Advances and Applications in Remote Sensing; Hung, M.-C., Wu, Y.-H., Eds.; InTech: London, UK, 2018; ISBN 978-1-78923-536-4. [Google Scholar]
- Zhao, W. Multitemporal SAR images denoising and change detection-Applications to Sentinel-1 data. Ph.D. Thesis, University Paris-Saclay, Paris, France, 2019. [Google Scholar]
- Wegmüller, U.; Santoro, M.; Werner, C. Multi-temporal SAR data filtering for land applications. In Proceedings of the SA Living Planet Symposium, Edinburgh, UK, 9–13 September 2013; p. 5. [Google Scholar]
- Huang, W.; DeVries, B.; Huang, C.; Lang, M.; Jones, J.; Creed, I.; Carroll, M. Automated Extraction of Surface Water Extent from Sentinel-1 Data. Remote Sens. 2018, 10, 797. [Google Scholar] [CrossRef]
- Pham-Duc, B.; Prigent, C.; Aires, F. Surface Water Monitoring within Cambodia and the Vietnamese Mekong Delta over a Year, with Sentinel-1 SAR Observations. Water 2017, 9, 366. [Google Scholar] [CrossRef]
- Muro, J.; Canty, M.; Conradsen, K.; Hüttich, C.; Nielsen, A.; Skriver, H.; Remy, F.; Strauch, A.; Thonfeld, F.; Menz, G. Short-Term Change Detection in Wetlands Using Sentinel-1 Time Series. Remote Sens. 2016, 8, 795. [Google Scholar] [CrossRef]


| Site | Image order | Sentinel-1 | Sentinel-2 | Pléiade/GeoEye |
|---|---|---|---|---|
| Marsh Harbour (Great Abaco, Bahamas) | Pre-event | 21 August 2019 | 4 December 2018 | |
| Post-event | 2, 8, 14 September 2019 | 5 September 2019 | ||
| Beira (Mozambique) | Pre-event | 18 February 2019 | 2 December 2018 | |
| Post-event | 20–26 March to 1–7 April 2019 |
| Observed | Predicted Flooded | Predicted Non-Flooded |
|---|---|---|
| Actual flooded | TP 1 | FN |
| Actual non-flooded | FP | TN |
| Observed by EMS Copernicus | Predicted by NDR | ||
|---|---|---|---|
| Flooded | Non-flooded | Total EMS | |
| Flooded | 0.8 | 0.4 | 1.2 |
| Non-flooded | 9.4 | 55.4 | 64.8 |
| Total predicted | 10.2 | 55.8 | 66 |
| Observed by EMS Copernicus | Predicted by NDR | ||
|---|---|---|---|
| Flooded | Non-flooded | Total EMS | |
| Flooded | 71.6 | 23.5 | 95.1 |
| Non-flooded | 19.2 | 728.7 | 747.9 |
| Total predicted | 90.8 | 752.2 | 843 |
| Date | 2 September 2019 | 8 September 2019 | 14 September 2019 |
|---|---|---|---|
| Flooded area | 10.2 | 8.4 | 3.3 |
| Date | 20 March 2019 | 26 March 2019 | 1 April 2019 | 7 April 2019 |
|---|---|---|---|---|
| Flooded area | 90.8 | 46.1 | 65.2 | 65.4 |
© 2020 by the authors. Licensee MDPI, Basel, Switzerland. This article is an open access article distributed under the terms and conditions of the Creative Commons Attribution (CC BY) license (http://creativecommons.org/licenses/by/4.0/).
Share and Cite
Alexandre, C.; Johary, R.; Catry, T.; Mouquet, P.; Révillion, C.; Rakotondraompiana, S.; Pennober, G. A Sentinel-1 Based Processing Chain for Detection of Cyclonic Flood Impacts. Remote Sens. 2020, 12, 252. https://doi.org/10.3390/rs12020252
Alexandre C, Johary R, Catry T, Mouquet P, Révillion C, Rakotondraompiana S, Pennober G. A Sentinel-1 Based Processing Chain for Detection of Cyclonic Flood Impacts. Remote Sensing. 2020; 12(2):252. https://doi.org/10.3390/rs12020252
Chicago/Turabian StyleAlexandre, Cyprien, Rosa Johary, Thibault Catry, Pascal Mouquet, Christophe Révillion, Solofo Rakotondraompiana, and Gwenaelle Pennober. 2020. "A Sentinel-1 Based Processing Chain for Detection of Cyclonic Flood Impacts" Remote Sensing 12, no. 2: 252. https://doi.org/10.3390/rs12020252
APA StyleAlexandre, C., Johary, R., Catry, T., Mouquet, P., Révillion, C., Rakotondraompiana, S., & Pennober, G. (2020). A Sentinel-1 Based Processing Chain for Detection of Cyclonic Flood Impacts. Remote Sensing, 12(2), 252. https://doi.org/10.3390/rs12020252