Article

Role and Mechanisms of Black Carbon Affecting Water Vapor Transport to Tibet

1
Key Laboratory for Semi-Arid Climate Change of the Ministry of Education, College of Atmospheric Sciences, Lanzhou University, Lanzhou 730000, China
2
Department of Physics, University of Peshawar, Peshawar 25000, Pakistan
*
Author to whom correspondence should be addressed.
Remote Sens. 2020, 12(2), 231; https://doi.org/10.3390/rs12020231
Submission received: 10 December 2019 / Revised: 3 January 2020 / Accepted: 7 January 2020 / Published: 9 January 2020

Abstract

:
Although some studies reported the impact of black carbon (BC) on the climate over the Tibetan Plateau (TP), the contribution and mechanisms of BC affecting the water vapor transport to Tibet are not fully understood yet. Here, utilizing the satellite observations and reanalysis data, the effects of BC on the climate over the TP and water vapor transport to the Tibet were investigated by the Community Earth System Model (CESM 2.1.0). Due to the addition of BC, a positive net heat forcing (average is 0.39 W/m2) is exerted at the surface, which induces a pronounced warming effect over the TP and consequently intensifies the East Asian Summer monsoon (EASM). However, significant cooling effects in northern India, Pakistan, Afghanistan and Iran are induced due to the BC and related feedbacks, which reduces significantly the meridional land–sea thermal contrast and finally weakens the South Asian summer monsoon (SASM). Consequently, the water vapor transport to the south border will be decreased due to addition of BC. Moreover, through affecting the atmospheric circulation, the BC could induce an increase in the imported water vapor from the west and east borders of the TP, and an increase outflowing away from the north border of the TP. Overall, due to the BC, the annual mean net importing water vapor over TP is around 271 Gt, which could enhance the precipitation over the TP. The results show that the mean increase in the precipitation over TP is about 0.56 mm/day.

Graphical Abstract

1. Introduction

The black carbon (BC) aerosol emitted from the combustion of some biomass and fossil fuel has a strong “Greenhouse Effect” by absorbing solar radiation and longwave radiation [1,2] in the atmosphere with a few days’ lifetime [3,4]. Moreover, the BC can also affect the earth–atmosphere energy balance through indirect and semi-direct effects [5], having a profound influence on the hydrological cycle and climate [2,6,7]. However, the uncertainties in estimating the magnitude of the hydrological cycle and regional climate responses to the BC are still pronounced [8].
During recent years, the aerosol emissions, including the BC over Asia are obviously increasing, and these particles can be transported to the Tibetan Plateau (TP) by atmospheric circulations [9,10,11]. The BC could be deposited into snow and exert a pronounced “snow darking” effect [12], and further affect the radiation budget [13,14]. The annual mean snow albedo direct radiative forcing of BC may reach 2.9 W/m2 [15], which will reduce the snow albedo and accelerate the melting of glaciers [16,17,18,19]. Moreover, the BC over the TP can affect the properties of cloud [20,21,22], precipitation [22,23,24] and the monsoon circulations [25].
Furthermore, the BC-in-snow effect can induce an increase in surface temperature over the TP and cause the earlier onset of the South Asian summer monsoon (SASM) [26]. Besides, the “Elevated Heat Pump” (EHP) effect suggests that the BC can induce an updraft motion with a warm anticyclone circulation in the upper atmosphere over the TP in late spring or early summer [27,28], the EHP effect could reduce the SASM in summertime by its dynamic and thermal forcing [28,29]. Additionally, the decreased meridional temperature gradient from the Indian Ocean to Northern India caused by absorbing aerosols could also reduce the SASM significantly [6,30,31]. On the other hand, the BC-in-snow effect could enhance the East Asian summer monsoon (EASM) by increasing the land–sea thermal contrast [26]. The changes in EASM are closely related to the aerosols disturbing the thermal contrast between land and ocean [32]. Li et al. [33] observed that the greenhouse gases and aerosols could increase the thermal contrast between the East China and the adjacent sea, and hence the EASM. The warming effect of BC over East Asia is the main factor, which could induce the enhanced EASM [34].
Generally, the SASM and EASM are the main dynamic factors in terms of the water vapor transport. The water vapor can be carried from the ocean to the land by the circulations of SASM and EASM [35], in which the northward transport is mainly caused by the lower southerly wind [36]. The TP, which is named the “Asian water tower”, is feeding several major rivers in Asia and providing fresh water for more than one third of the populations of the world [37], and has been receiving much attention [37,38,39,40,41,42]. Generally, the water vapor may be gathered in the western and southern TP, and advected to the rest of the TP [40]. The water vapor could be transported to the TP by upslope transport and up-and-over patterns [37,38]. In addition, the perturbed cyclone and anticyclone over Lake Baikal are closely related to the water situations of TP, and the warming in the northwestern Atlantic Ocean is the key factor contributing to the wetting TP [42]. However, under the global dryland expansion and warming [43,44], the potential role and mechanism of the BC affecting the water vapor transport and the burden over TP is poorly studied.
Although previous researchers have revealed that the BC has a pronounced climate effect on the SASM and EASM, which are closely related to the water vapor transport from the ocean to the TP, there are few studies focused on the effects of BC on the water vapor transport from the surrounding to the TP. In this study, the role and mechanisms of BC affecting the water vapor budget over the TP are investigated by utilizing the CESM, which is fully coupled including atmosphere, ocean, sea ice, land and land–ice components.

2. Data and Methods

2.1. The Uncertainties and Applicability of Each Data

To evaluate the model performance on the climate and water vapor transport over the TP, the product of Multi-angle Imaging Spectro Radiometer (MISR) and several reanalysis data were used to compare with simulations. The resolutions of observations and reanalysis data sets depend on the assimilation system and the accuracy of the equipment. Before the analysis, we have interpolated the results of simulations whose resolution is 0.9° (latitude) × 1.25° (longitude) to the resolutions of observations and reanalysis data sets.

2.1.1. Multi-Angle Imaging Spectro Radiometer (MISR)

The MISR measures the aerosol optical depth (AOD) at a spatial resolution from 275 to 1100 m globally. Because the atmospheric path contribution from the surface-leaving radiance can be removed by taking advantage of differences in multi-angular signatures, the MISR aerosol retrieval algorithm is less sensitive to surface type especially over the bright surfaces [45]. Therefore, compared with the ground-based remote sensing, the AOD products from MISR have good accuracy over the TP. However, MISR has a limited swath coverage that is much too narrow, which has a lower frequency of observations at the given ground-based site in each orbital cycle. In this study, the MISR-3 product derived from multiple orbits monthly with a resolution of 0.5° × 0.5° [46] was used to evaluate the simulated AOD by a model.

2.1.2. Cloud and Earth’s Radiant Energy System (CERES)

The CERES is used to investigate the cloud/radiation feedback, the data sets are measured by the broadband scanning radiometers [47]. The all sky surface net radiation fluxes (longwave and shortwave radiation, W/m2) were obtained from the CERES 4.0 product, whose spatial and temporal resolutions are 1.25° × 1.25° and monthly, respectively. The CERES data sets have a strong correlation with meteorological station data [48]. For the CERES products, the uncertainties in surface net radiation are attributable to the environmental parameters, including surface water vapor pressure, surface temperature, the Normalized Difference Vegetation Index (NDVI) and surface albedo. Studies show that the errors of each radiation component of the CERES product are within 20 W/m2 at the monthly scale [49].

2.1.3. ERA-Interim

The ERA-interim data sets are obtained from the European Center for Medium-Range Weather Forecasts (ECMWF) covering the period from 1979 to the present. It has a good performance on describing the actual atmosphere over Asia [50]. In this study, the monthly mean skin temperatures (K) with a spatial resolution of 0.75° × 0.75° are used. Compared with the observations, the root mean square error (RMSE) of temperature is about 3.2 °C, and the correlation coefficient is 0.709. Generally, the ERA-interim is closer to the ground observations than many other reanalysis data over Asia [51].

2.1.4. Global Precipitation Climatology Project (GPCP)

The GPCP is a merged precipitation reanalysis data which incorporates information from the low-orbit-satellite microwave, the geosynchronous-orbit-satellite infrared, and the rain observations. The GPCP can figure out the temporal and spatial features of precipitation (mm/month) quite well, having a good performance over Asia [52]. Here, the monthly mean accumulated precipitation data at the surface from GPCP-2 with a spatial resolution of 2.5° × 2.5° were used. Some studies reported that the GPCP data may overestimate the precipitation, especially when the precipitation rate increases. This observed uncertainty may be due to the shortcomings of GPCP for the retrieval of summer precipitation over land, such as mistaking higher clouds as precipitation clouds [53,54].

2.1.5. Modern-Era Retrospective Analysis for Research and Applications (MERRA)

The MERRA-2 is an assimilation which includes different ground-based and space-based remote sensing information. The monthly mean surface mass concentration of BC (kg/m3) is obtained from the version 2 of MERRA (MERRA-2), which has a spatial resolution of 2.5° × 2.5°. The MERRA data can describe the distribution of the BC mass concentration over Asia very well [55]. The aerosol AODs from the MERRA-2 data have a high correlation but low bias relative to the ground-based observations (e.g. sun photometer) [56]. Here, we use the surface concentration of BC from the MERRA-2 data.

2.1.6. National Centers for Environment Prediction (NCEP)

The NCEP reanalysis data covers the information of satellite, and it is produced by a forecast model together with a data assimilation system. Because the NCEP data sets have a good performance on describing the winds and free atmosphere of the temperate region in the Northern Hemisphere [57], the horizontal wind (u and v component, m/s) and specific humidity (kg/kg) in NCEP data sets are used to evaluate the simulated water vapor in the atmosphere. The spatial resolution of the monthly NCEP reanalysis data used in this study is 2.5° × 2.5° [58]. For the NCEP data, due to the topographical height and systematic deviations of the assimilation model, it was a false trend on the longer time scale in the middle and lower troposphere over the TP [59].

2.1.7. Emission Data of Aerosols and Greenhouse Gases

In this study, the emission data of aerosols and greenhouse gases for the year 2000 are used to be the background reference. The anthropogenic aerosol emissions from industrial production, agriculture activities and human activities are derived from the emission data of the Intergovernmental Panel on Climate Change (IPCC) Fifth Assessment Report (AR5) [60]. The emissions of BC together with sulfur dioxide are updated from Smith et al. [61]. Besides, the aerosol size distribution is classified as three lognormal modes: Aitken (ranging from 0.015 mm to 0.053 mm), accumulation (ranging from 0.058 mm to 0.27 mm), and coarse modes (ranging from 0.80 mm to 3.65 mm) [62]. The concentrations of greenhouse gases for the year 2000 are derived from the specific concentration [63].

2.2. Methods of Calculating Asian Summer Monsoon and Water Vapor Transport Changes

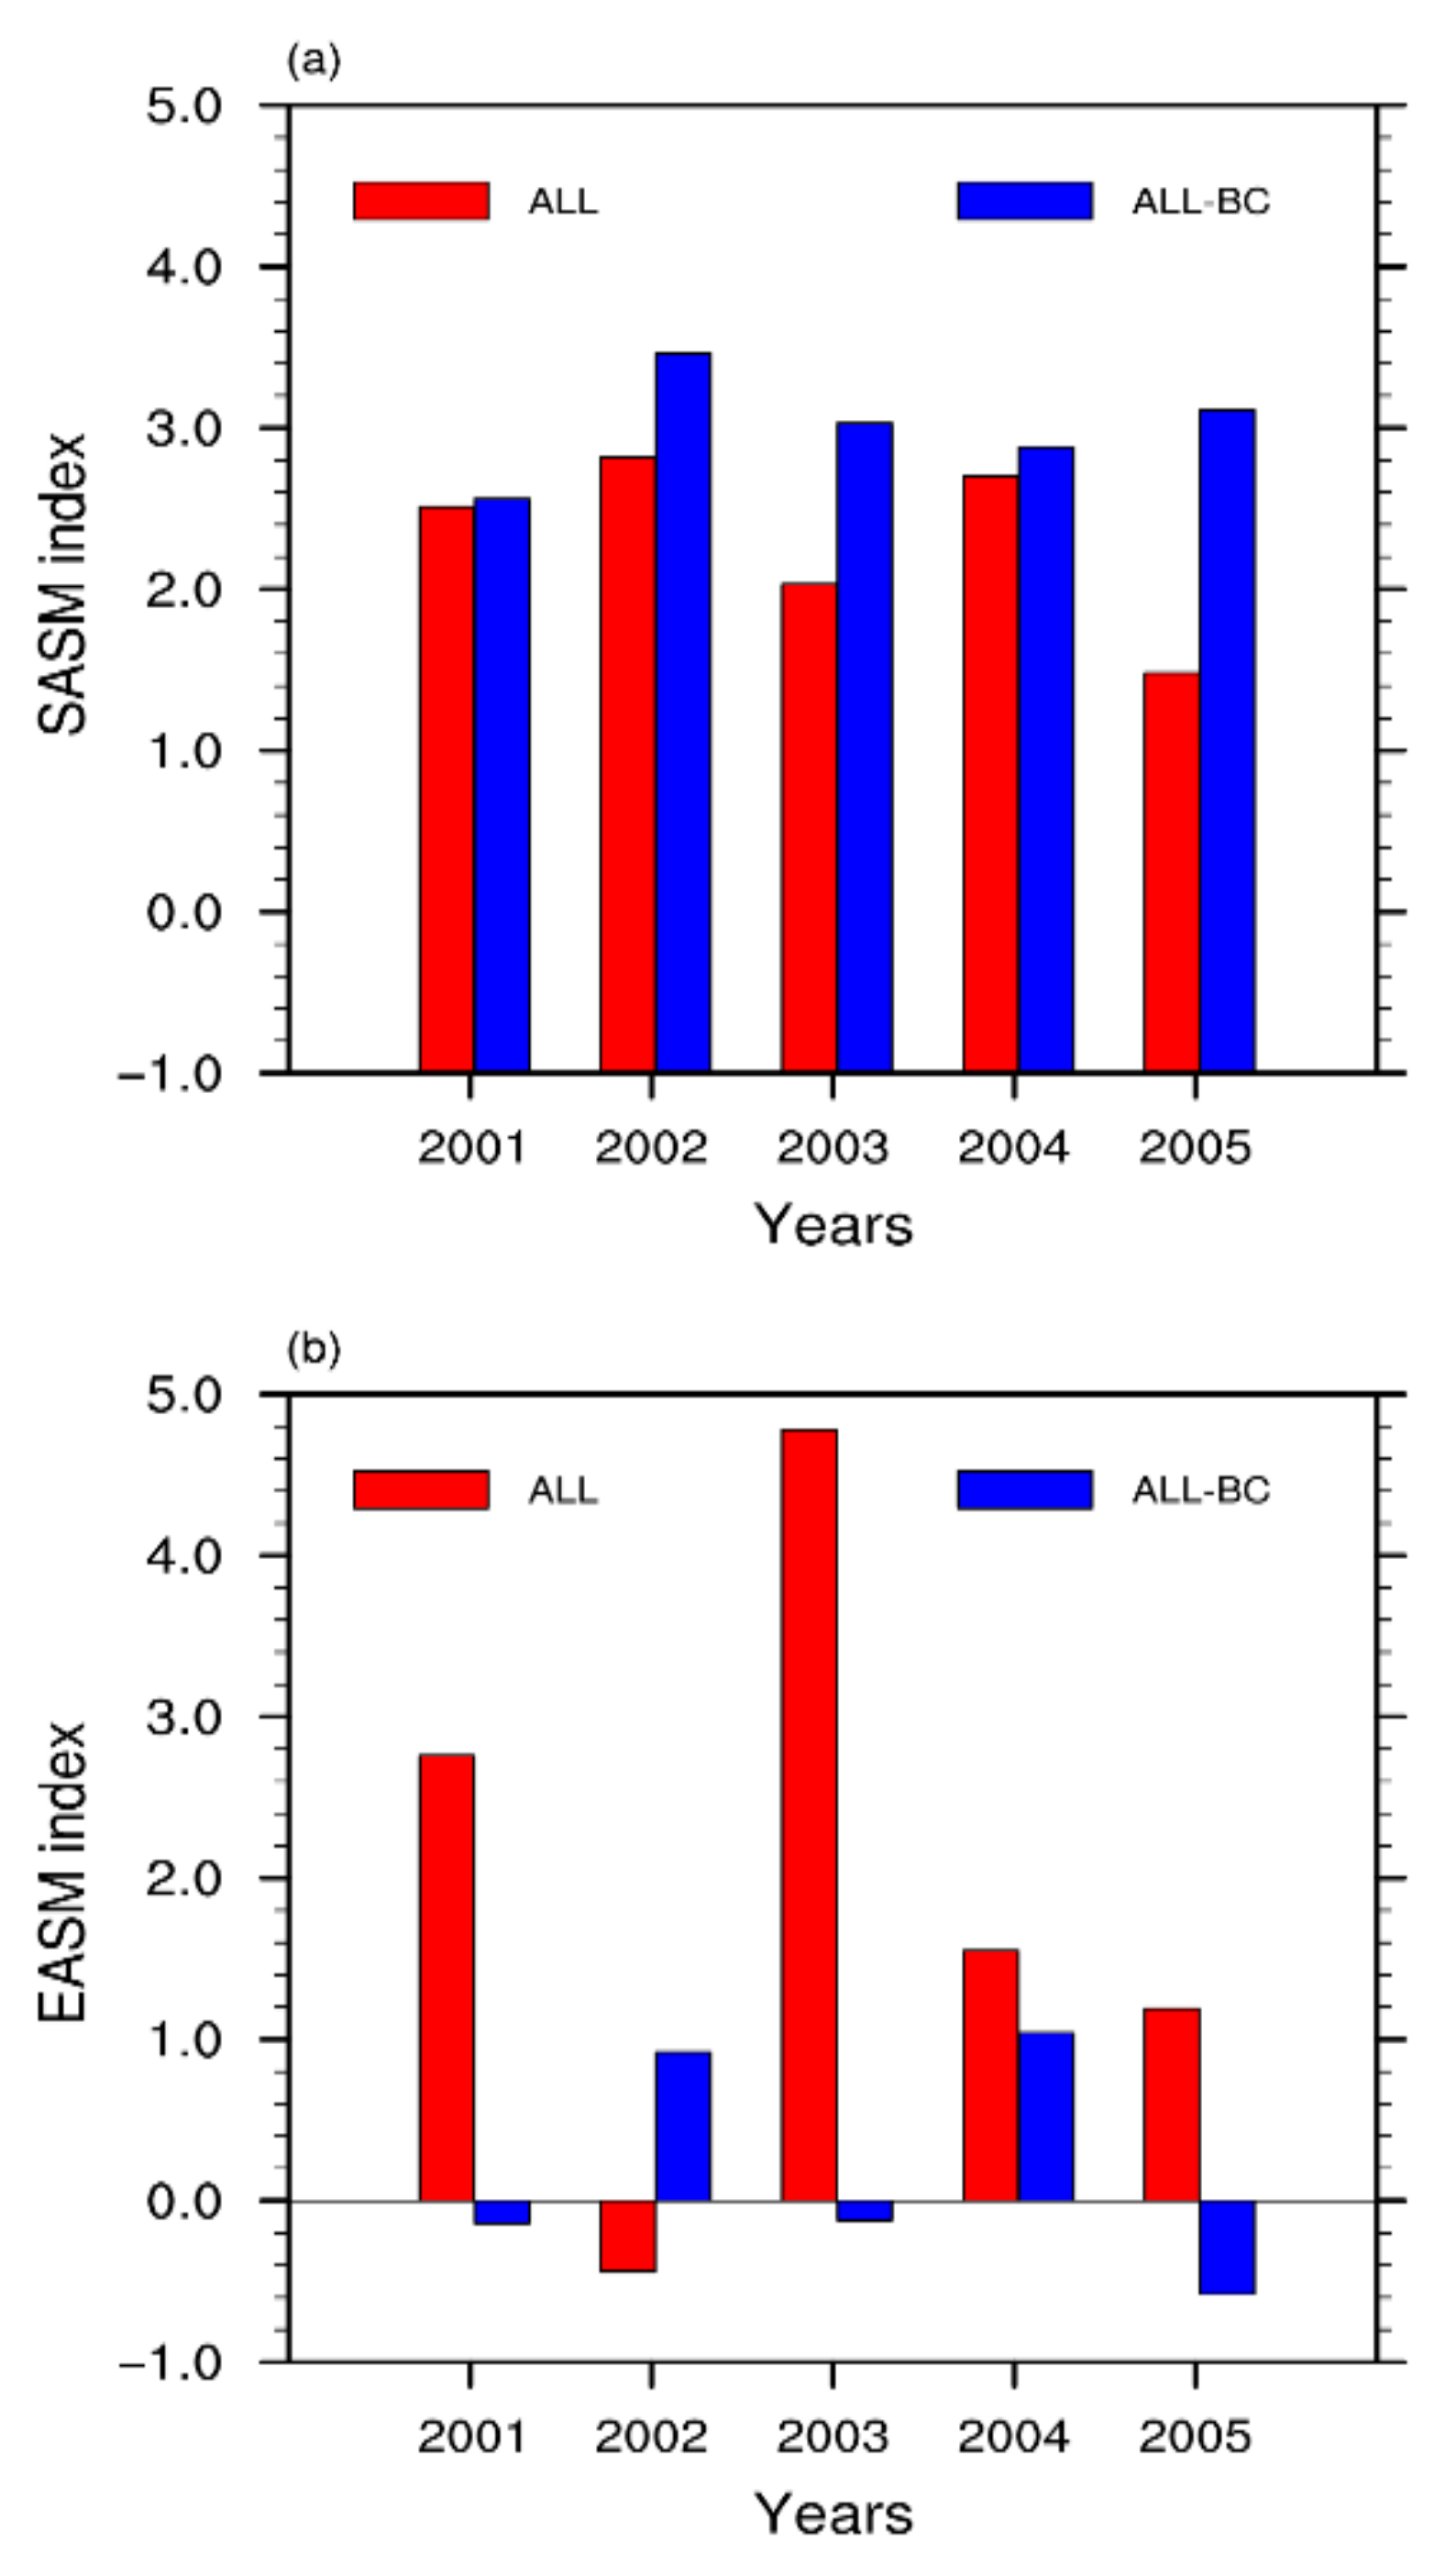
2.2.1. Estimation of Summer Monsoon

To estimate the strength of the summer monsoon, the dynamical normalized seasonality index (DNS) was used in this paper [64], and can be calculated as using the following Equation (1):
D N S = V 1 V m , n V   2
where the V 1 is the climatological wind vector in January, the V is the mean wind vector of January and July, while the V m , n is the wind vector in the year ‘n’ and month ‘m’.

2.2.2. Changes of Water Vapor

The water vapor flux in the whole atmospheric layer (Q) is calculated from the land surface to 100 hPa and the water vapor budget (N) [42] are calculated as follows:
Q = 1 g p s p q   V d p
N = Q d l
where q denotes the specific humidity (kg/kg), V denotes the horizontal wind vector (u and v component, m/s), g denotes the constant of gravity acceleration (9.8 m/s2). Here, the atmospheric pressure at the top of atmosphere (TOA) is set as 100 hPa, and l denotes the border of the TP. In this study, the border of TP is considered as the east, south, west and north borders separately.

2.3. Description of Model Setting
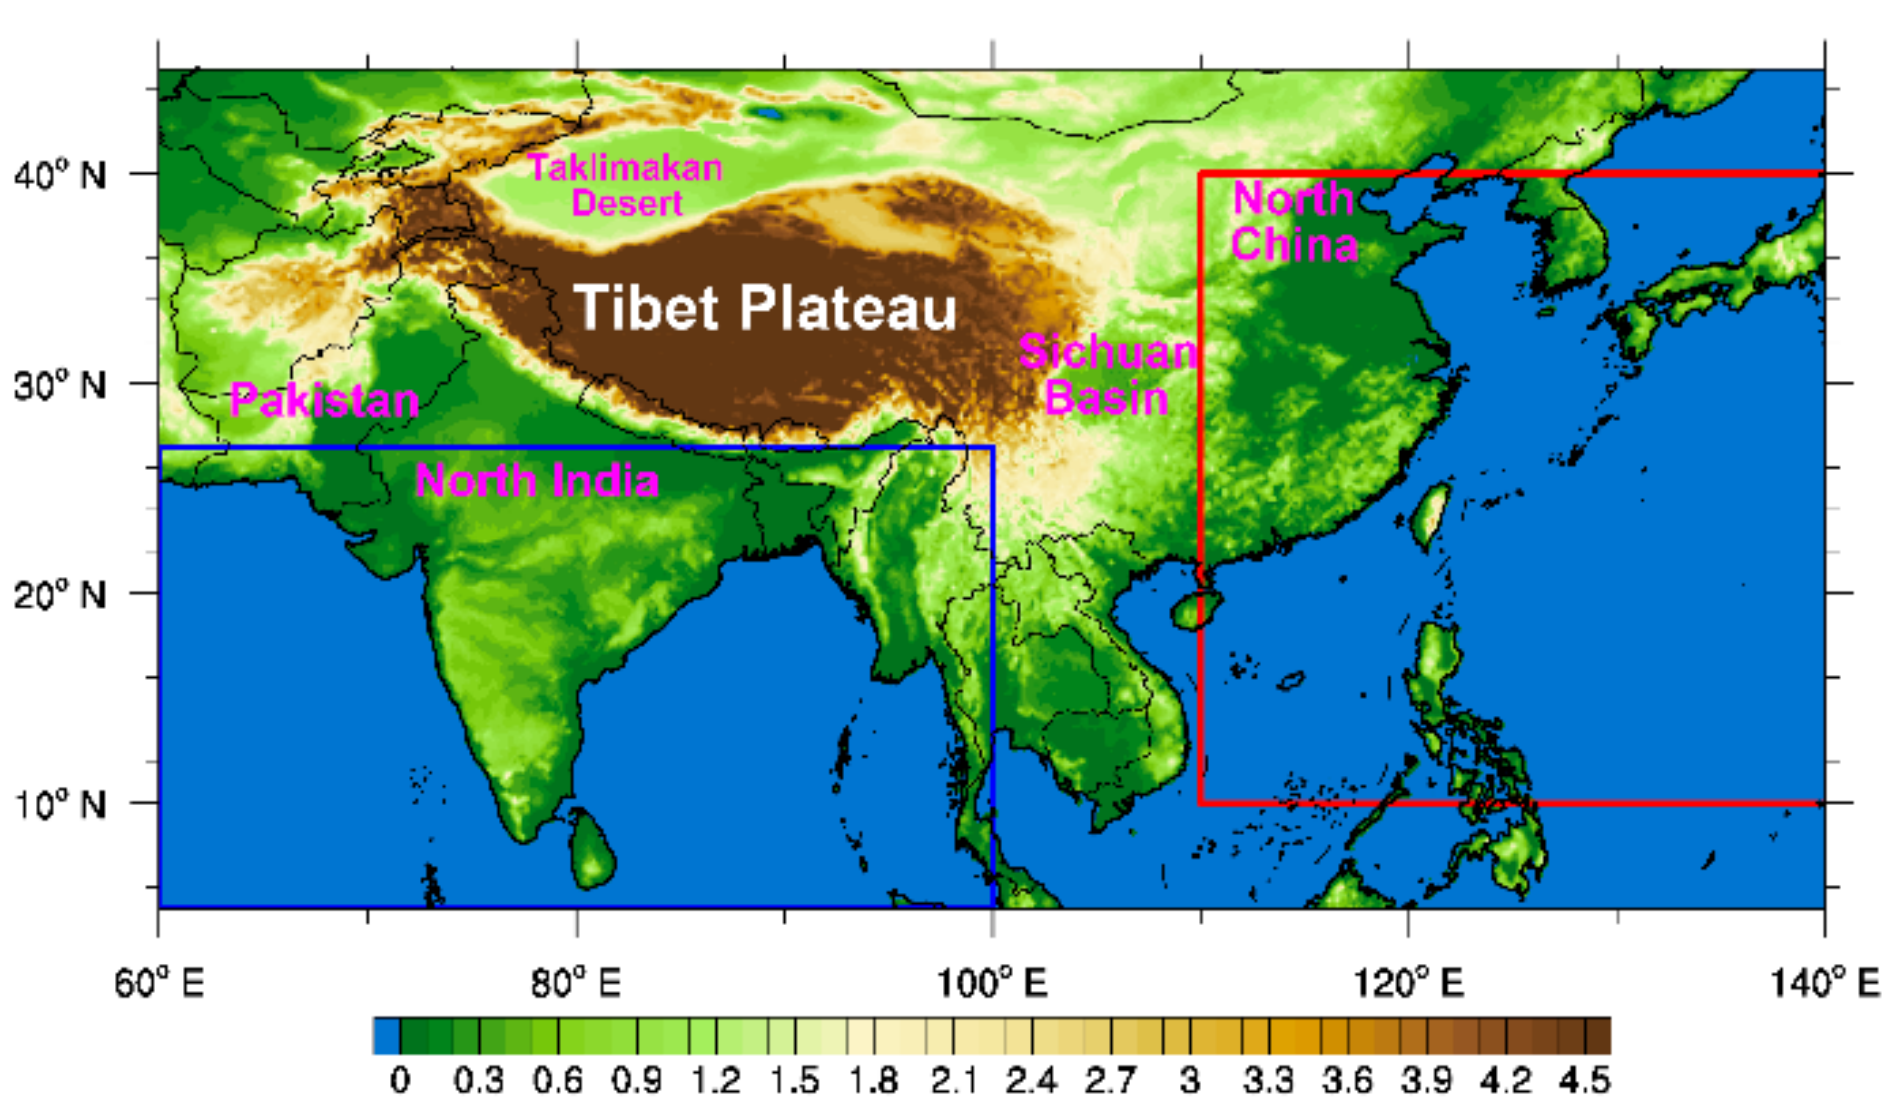
In this study, CESM (version 2.1.0) is used to study the effects of BC on the climate over the TP. The atmospheric, land and ocean models are the Community Atmosphere Model (CAM) 5.0, Community Land Model (CLM) 4.5 and three-dimensional active Parallel Ocean Program (POP) 2.0, respectively, in CESM.
The default aerosol configuration coupled to the Modal Aerosol Model (MAM) is adopted to investigate the climate effects of BC [65]. The CAM 5.0 of CESM includes BC, dust, precursors of sulfate (SO2 and SO4), sea salt, particulate organic matter, and secondary organic aerosol in the MAM3 aerosol module [65]. The dust and sea salt modes are merged into a coarse mode in MAM3 for the online calculating of the emissions. The dry deposition process of aerosols is calculated by a parameterization which includes the information of land use and land cover [66], while the wet deposition process is calculated by the wet removal routine [67]. Meanwhile, the revised cloud macrophysics processes are considered in CESM-CAM5, in terms of the cloud fractions, and the interconversion rates between water vapor and cloud condensation.
The parameterization of cloud microphysics is utilized to calculate the droplet and ice number concentration [68]. Besides, the CAM 5.0 forms the main atmospheric components in CESM and has the capacity of simulating the aerosol–cloud interaction, which includes the cloud droplet activation by aerosols, precipitation process affected by particles and the radiative interactions of cloud particles [69,70,71].
In this study, two experiments are carried out to study the climatic effects of BC. The control experiment, named the ‘ALL’ experiment, considers the emissions of BC, particulate organic matter (POM), dust, SO2, SO4 and second organic aerosol gases (SOAG). The contrast experiment, named as the ‘ALL-BC’ experiment, is run with the same emissions as the ALL experiment, except for the BC emissions. The simulations started from January 2000 to December 2005 with a spin-up time in the year of 2000. The finite volume (FV) dynamical core with a resolution of 0.9° × 1.25° and a hybrid sigma-p vertical coordinate of 30 layers from the land surface to 3.64 hPa are utilized in CESM. The details of the model setup and experiment design are presented in Table 1.

2.4. The Study Area

Considering the typical topography of the TP and distribution of BC, we focused on the region with latitude and longitude coordinate ranges of 60° E–140° E and 5° N–45° N (see Figure 1). It covers most parts of China, the whole Indo-China Peninsula, India and Pakistan. The areas marked by the blue and the red rectangle in Figure 1 are adopted to calculate the changes in the intensity of the SASM and the EASM, respectively. Besides, the climatic effects caused by BC over the TP are analyzed for the summertime (June–July–August). Before analyzing water vapor changes due to BC, the assessment for the model ability of CESM is performed first.

3. Results

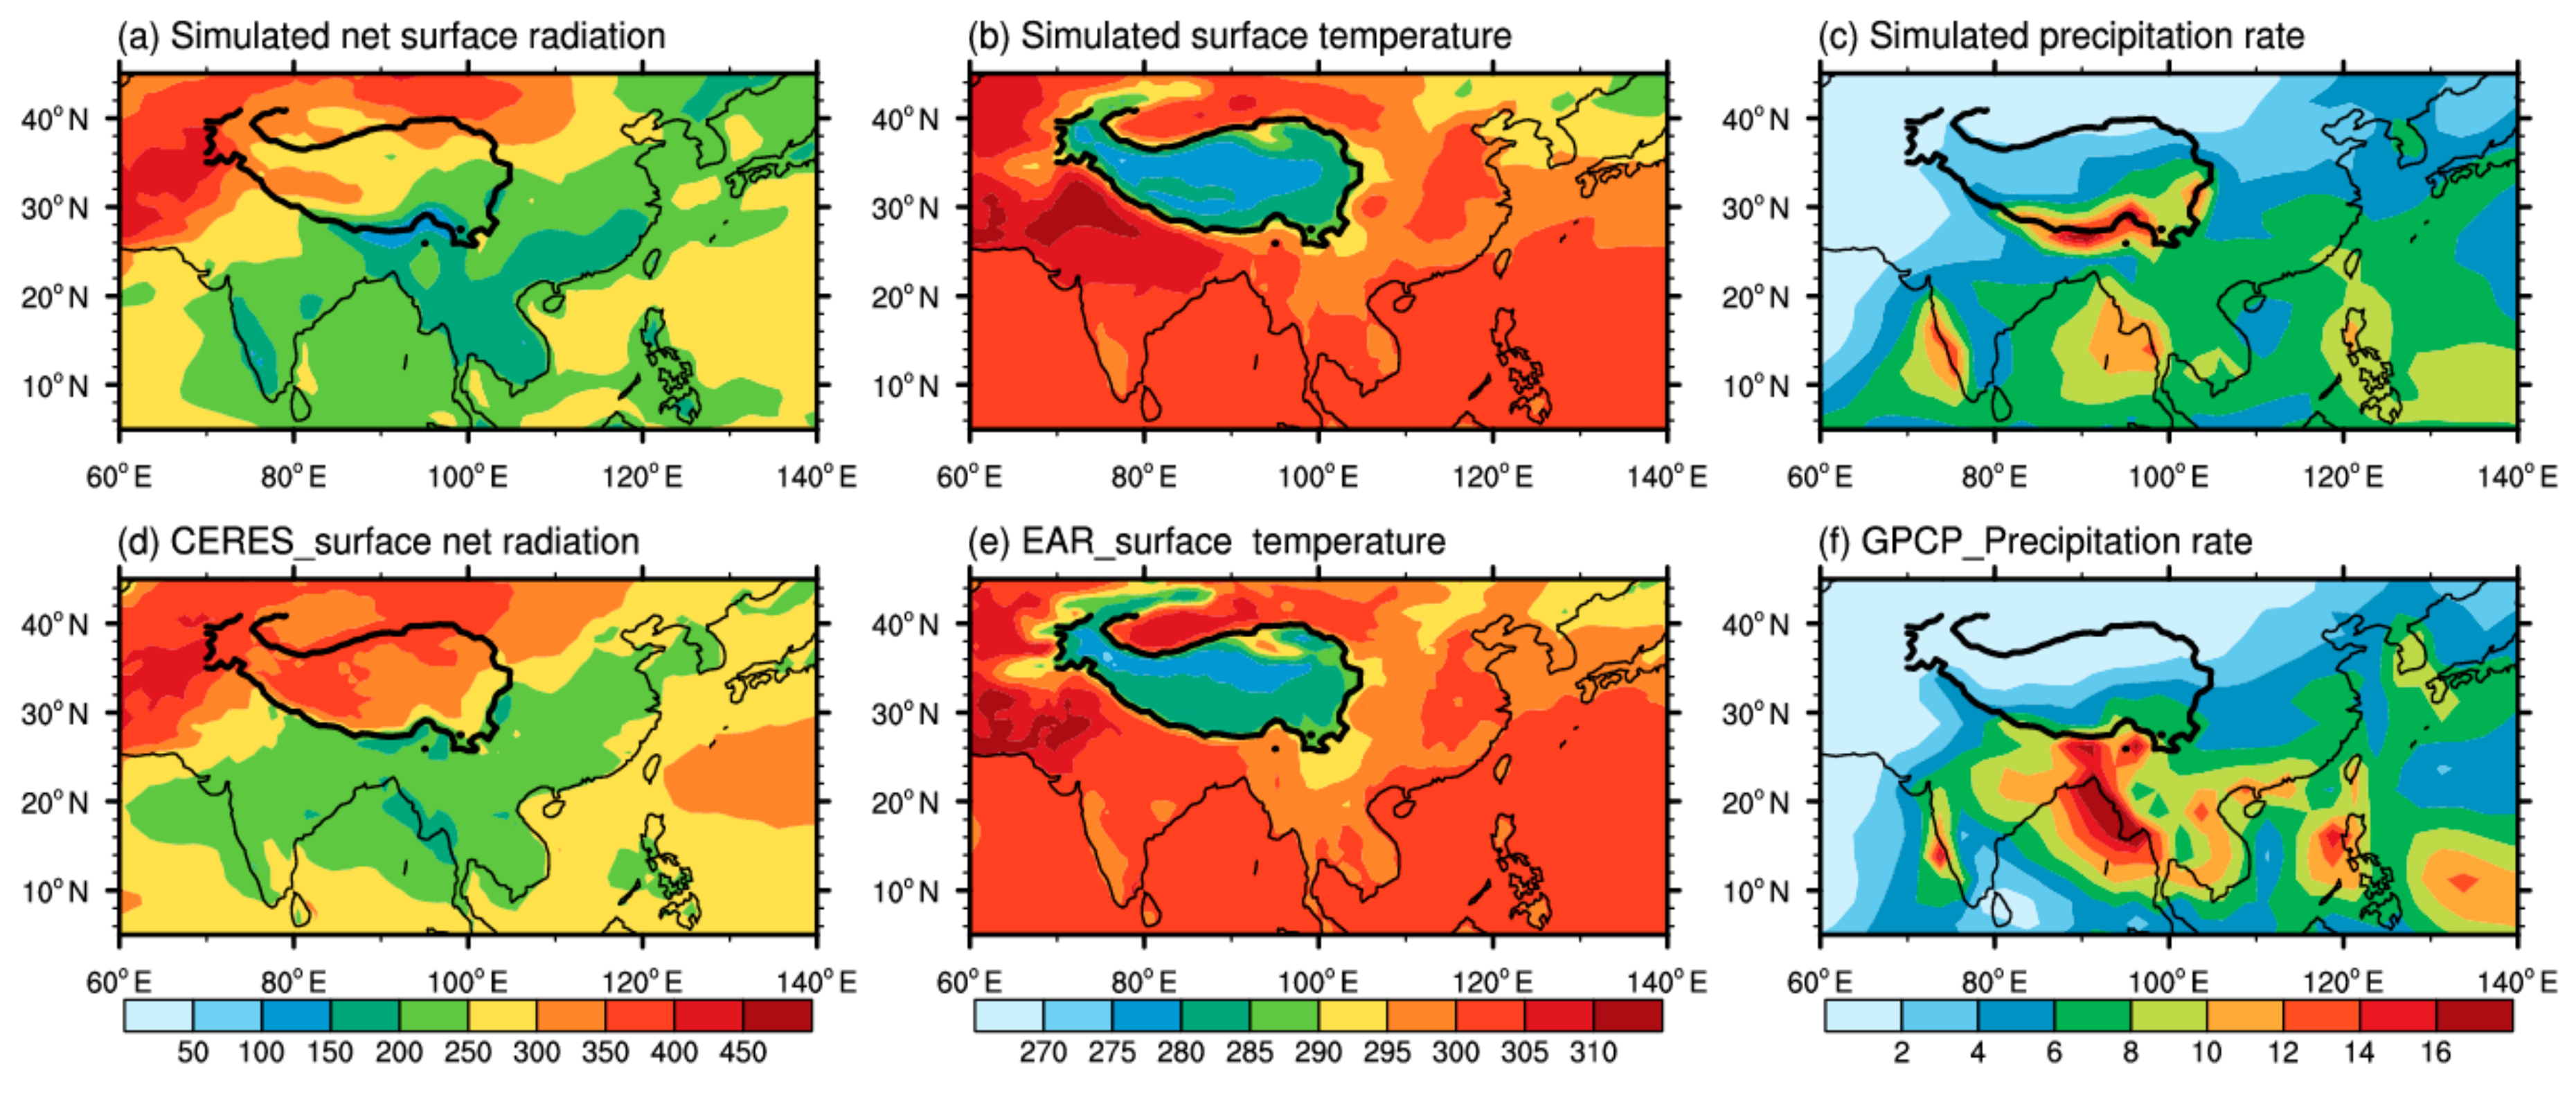
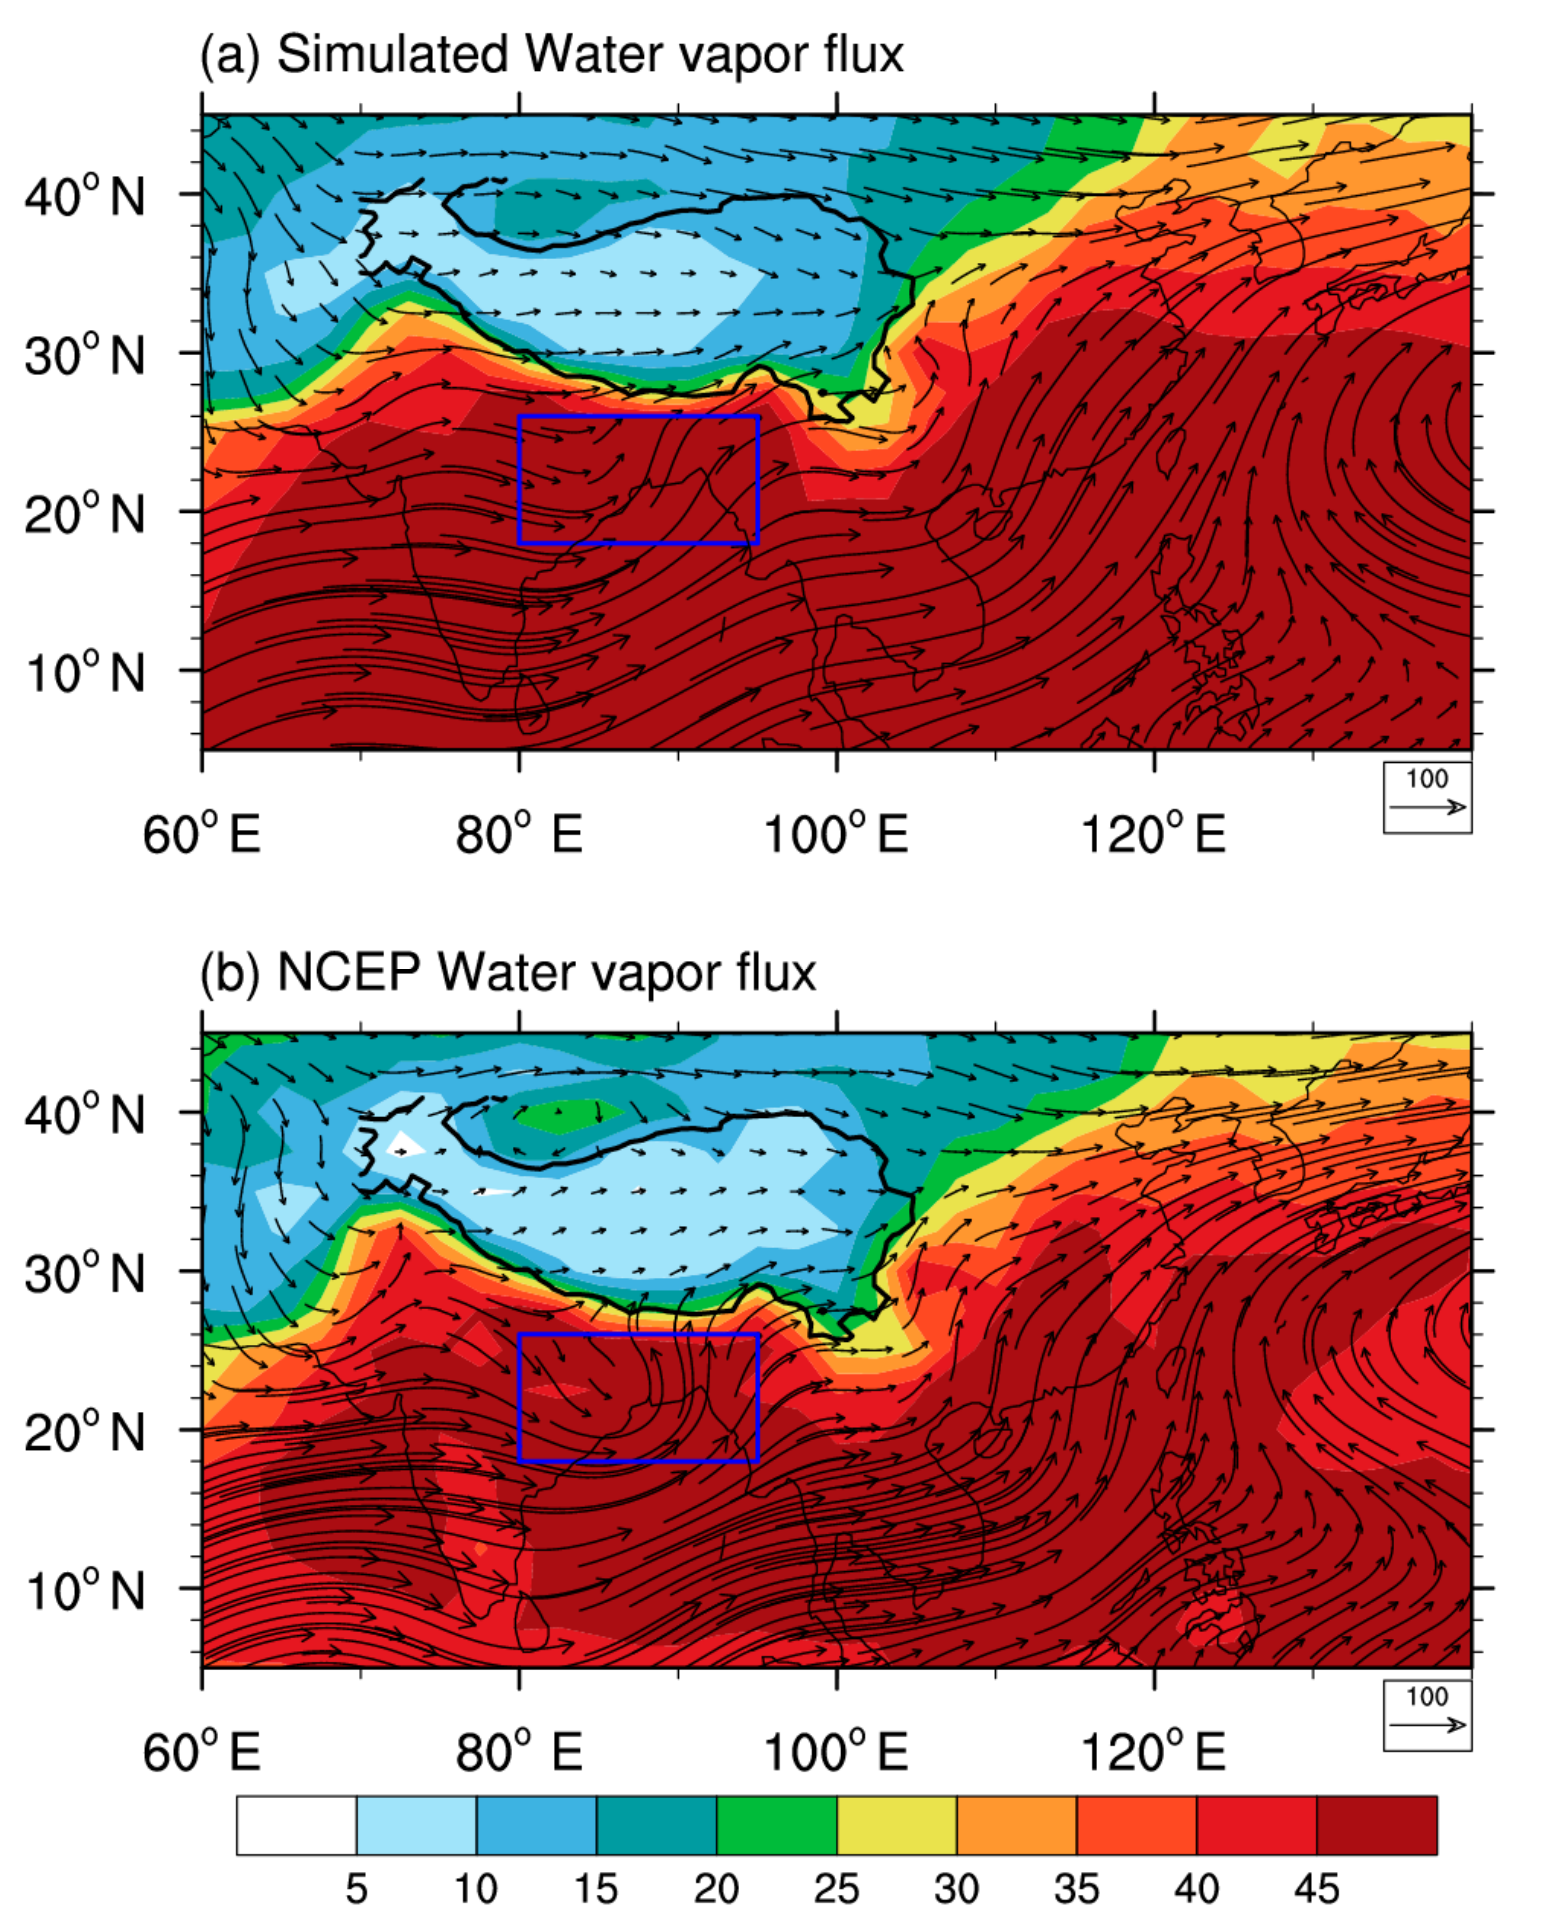
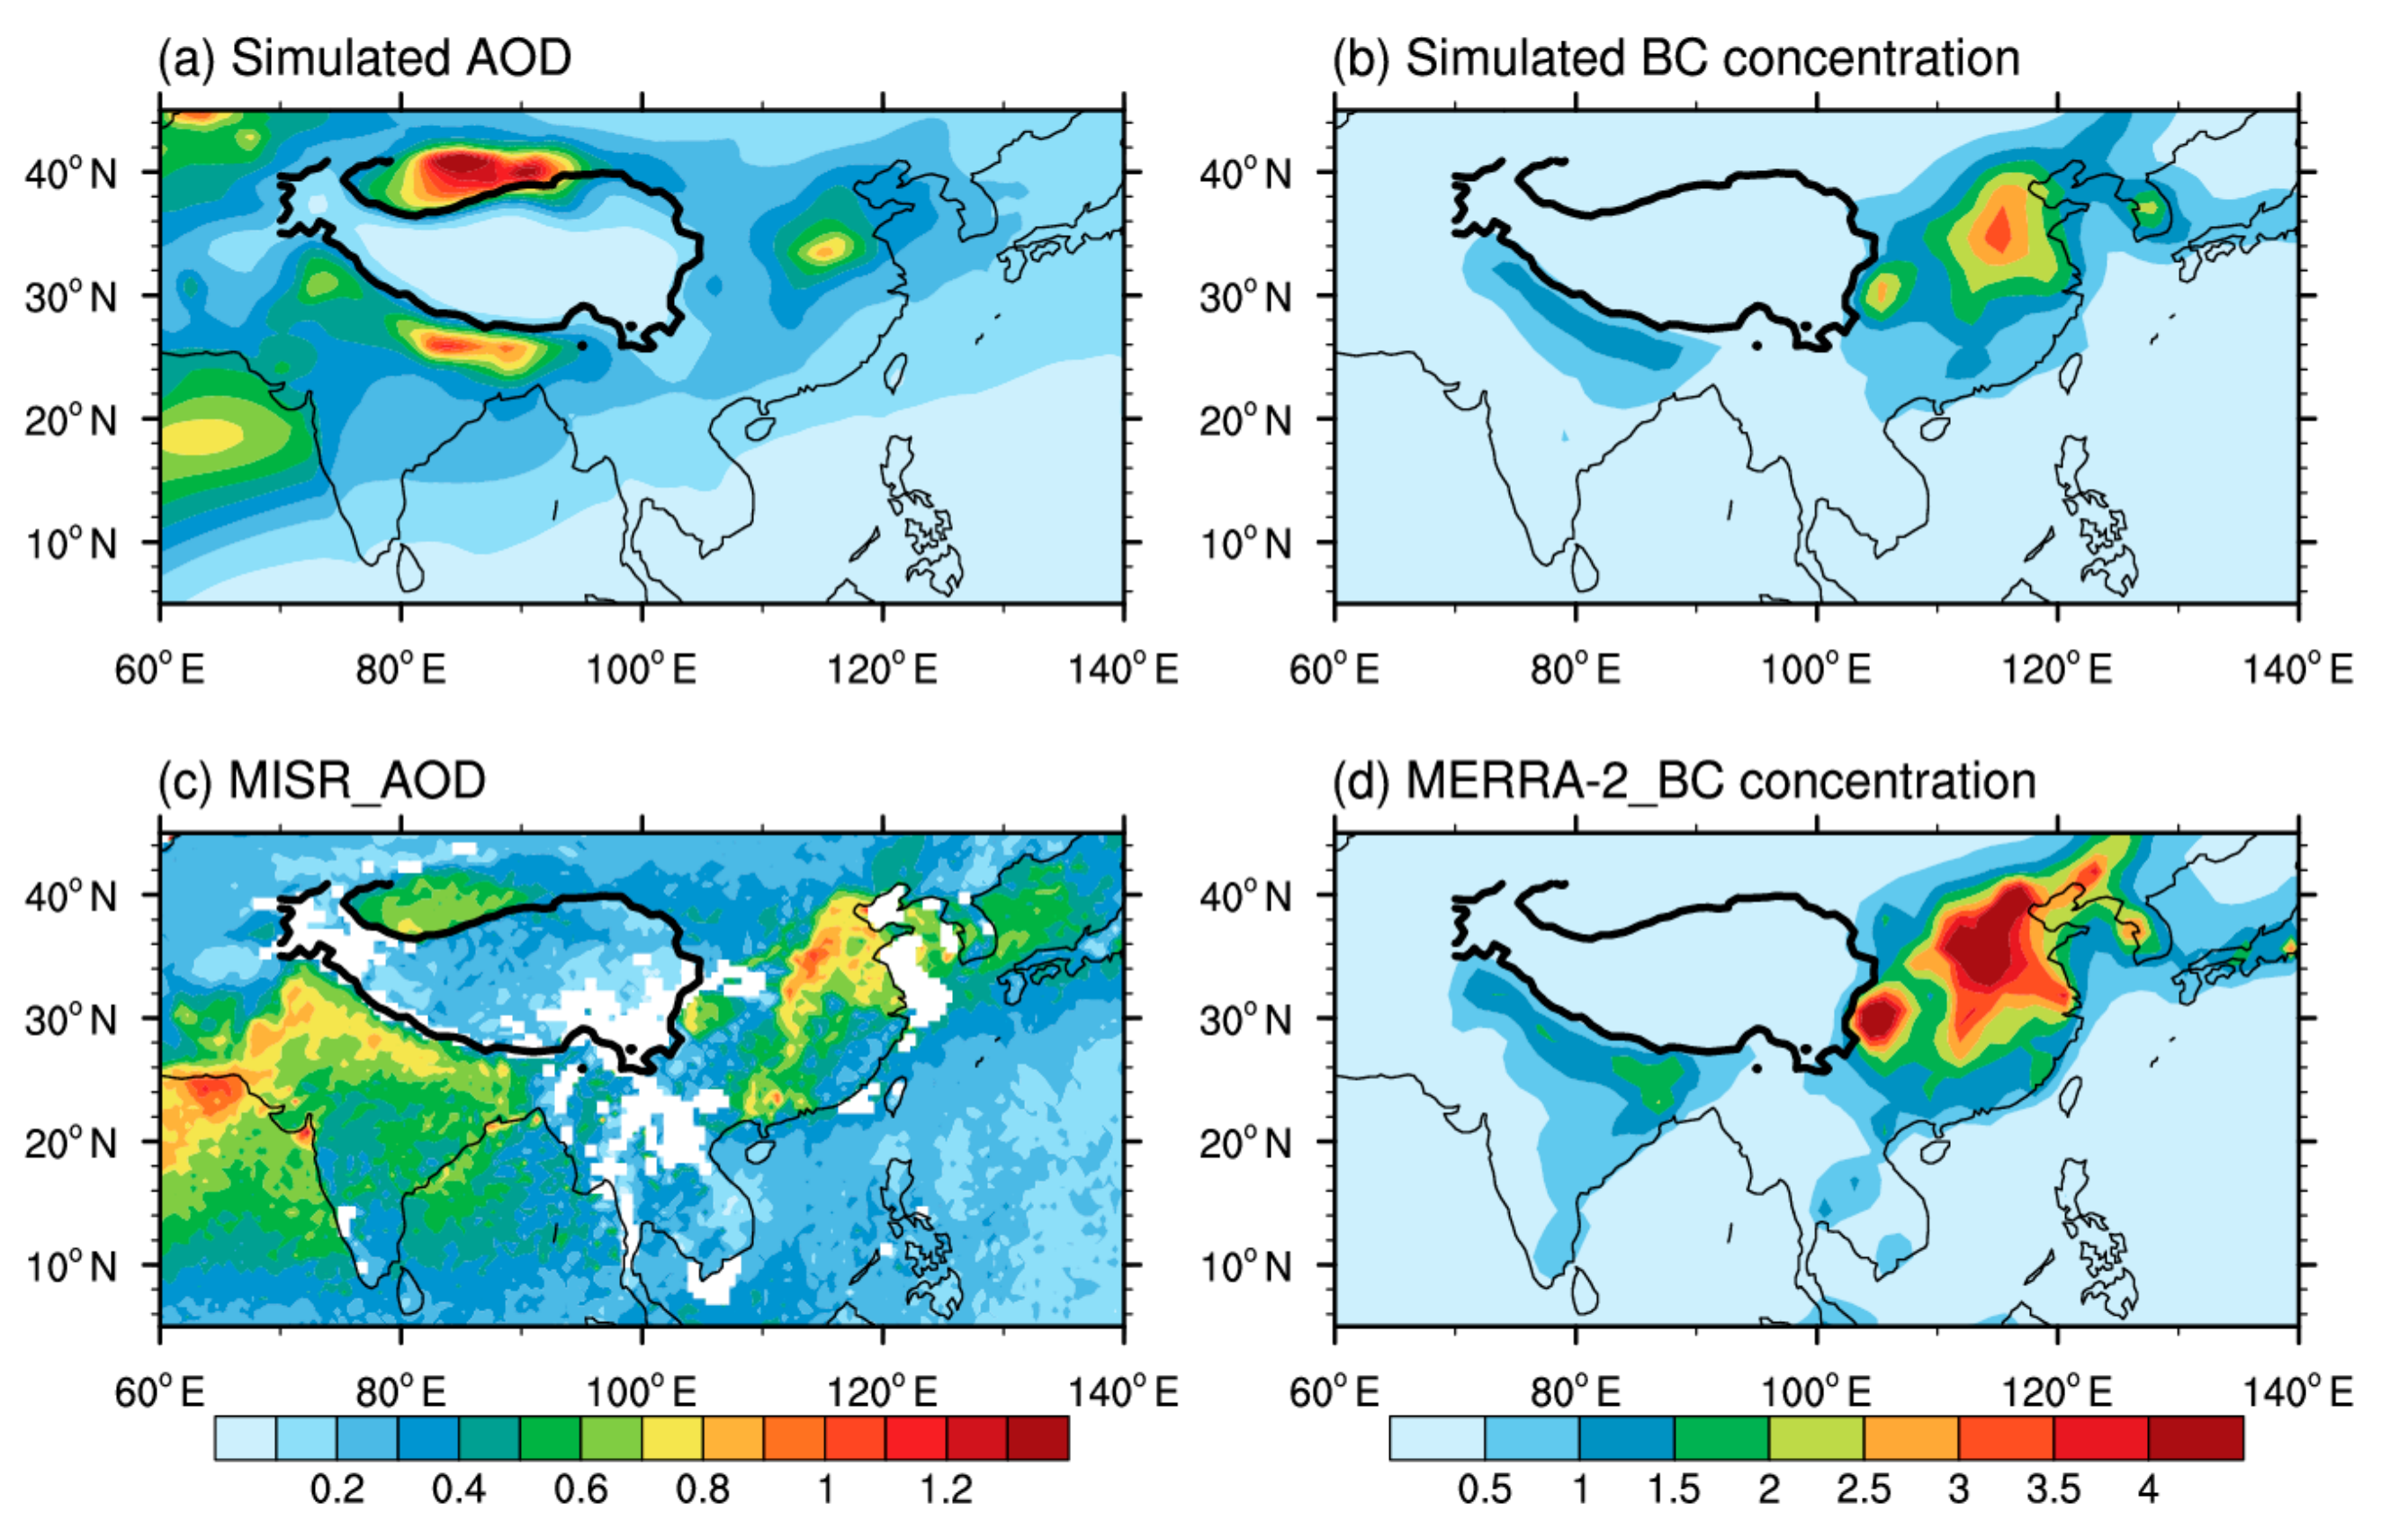
3.1. Model Assessment

Figure 2 shows the comparisons of the simulated net surface radiation budget, surface temperature (ST) and precipitation rate with observations. It shows that the “northern high and southern low” pattern of all sky surface net radiation (integrated by shortwave and longwave radiation) is simulated well (Figure 2a,d). The values of net surface radiation over South Asia, together with East Asia, the Taklimakan Desert and Pakistan range from 150–300W/m2, 300–400 W/m2 and 400–450 W/m2, respectively. While the net surface radiation is underestimated over TP. Because of the bias in surface net radiation over TP, the simulated ST is also underestimated slightly (Figure 2b,e). Generally, the distributions of simulated ST are consistent with the ERA-interim. Overall, the heavy precipitation values are found over the Western India, Bay of Bengal and Indo-China Peninsula in model simulations. The areas of simulated heavy precipitation are consistent with the results from GPCP. In Figure 2c,f, over the south slopes of TP, the model overestimates the precipitation compared with the GPCP results.
Furthermore, the comparisons of simulated water vapor transports and that from the NCEP are presented in Figure 3. In general, both the simulated and observed water vapor burdens over the TP ranges from 5 to 10 kg/m2, with almost the same water vapor gradients over the borders of the TP. Over the TP, the westerly winds control the water vapor transportation. As shown in Figure 3, the water vapors are mainly imported from the south and west borders and exported from the east borders. It shows that the southwest water vapor transport channel from the Arabian Sea to the TP is important, which is consistent with the result reported by [72].
Besides, as given in Figure 3, comparing the water vapor fluxes from the model simulation and NCEP reanalysis over the Bay of Bengal, a weaker, southwest vortex (blue rectangle in Figure 3) is found in the simulation (Figure 3a). In our model simulation, the weaker southwest vortex induced more water vapor northward transport to the south border of the TP, resulting in more precipitation over the south slopes of the TP (Figure 2c).
Before analyzing the BC’s impact on the Tibet climate further, an assessment of aerosol optical depth (AOD) and BC concentration distributions is needed. Figure 4 shows the comparisons of AOD from model simulations and MISR satellite observations, and BC distributions from simulations and MERRA-2 reanalysis data. Figure 4a,c, show a similar distribution feature of AOD over the East China, Northern India, Arabian Sea and Taklimakan Desert, both in model simulation and MISR data. Overall, the simulated values of AOD are higher than those from MISR, especially over the Taklimakan Desert. In contrary, the simulated AOD over other regions is lower than the reanalysis data, and that is similar to the features of surface concentration. It is found that the simulated distributions of the surface BC concentration are also consistent with the results from MERRA-2. Both the model and the reanalysis data indicated three centers with a high concentration of BC over Northern India, the Sichuan Basin and Northern China. The model simulated BC concentration over Northern India, the Sichuan Basin and Northern China ranges from 0.5–2.0 µg/m3, 2.5–3.0 µg/m3 and 1–1.5 µg/m3 (Figure 4b,d). Due to the lower concentration simulated by the model, the effects of BC on the water vapor transport and climate may be underestimated over the TP. Generally, the coupled model has a good simulated ability on the precipitation, ST, water vapor flux, BC concentration and AOD distributions over the TP. Based on the model simulation, the effects of BC on water vapor transport and its mechanism are further investigated.

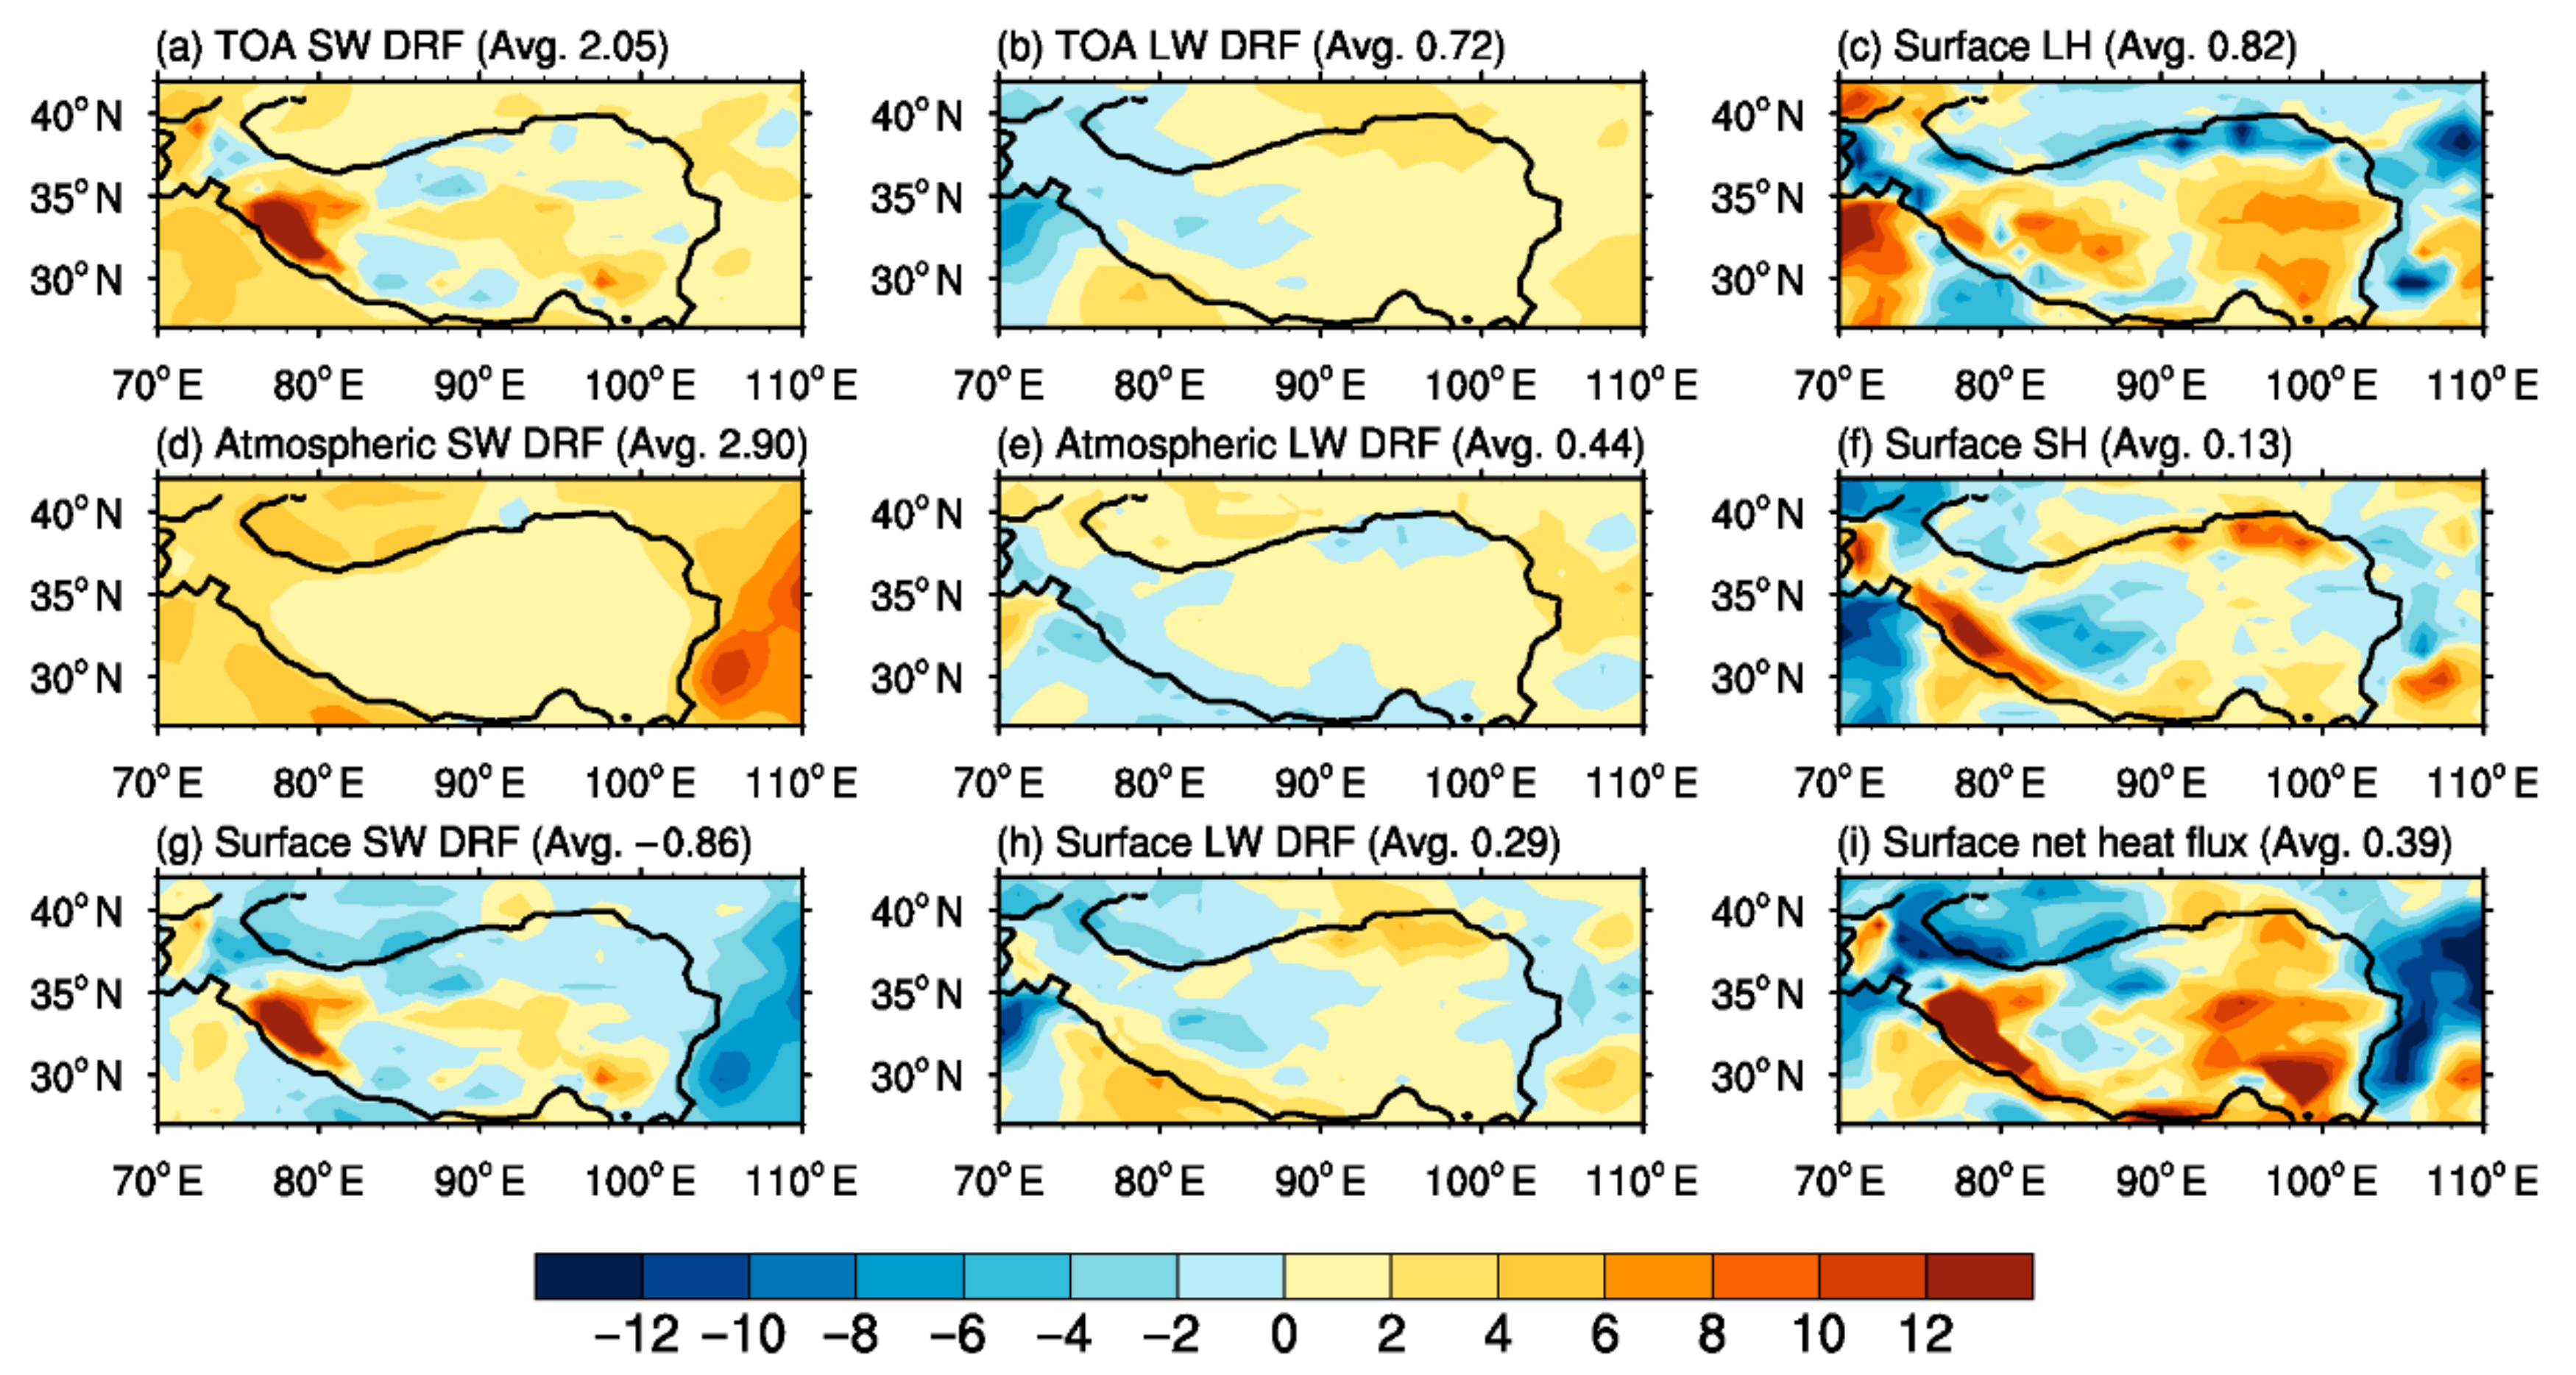
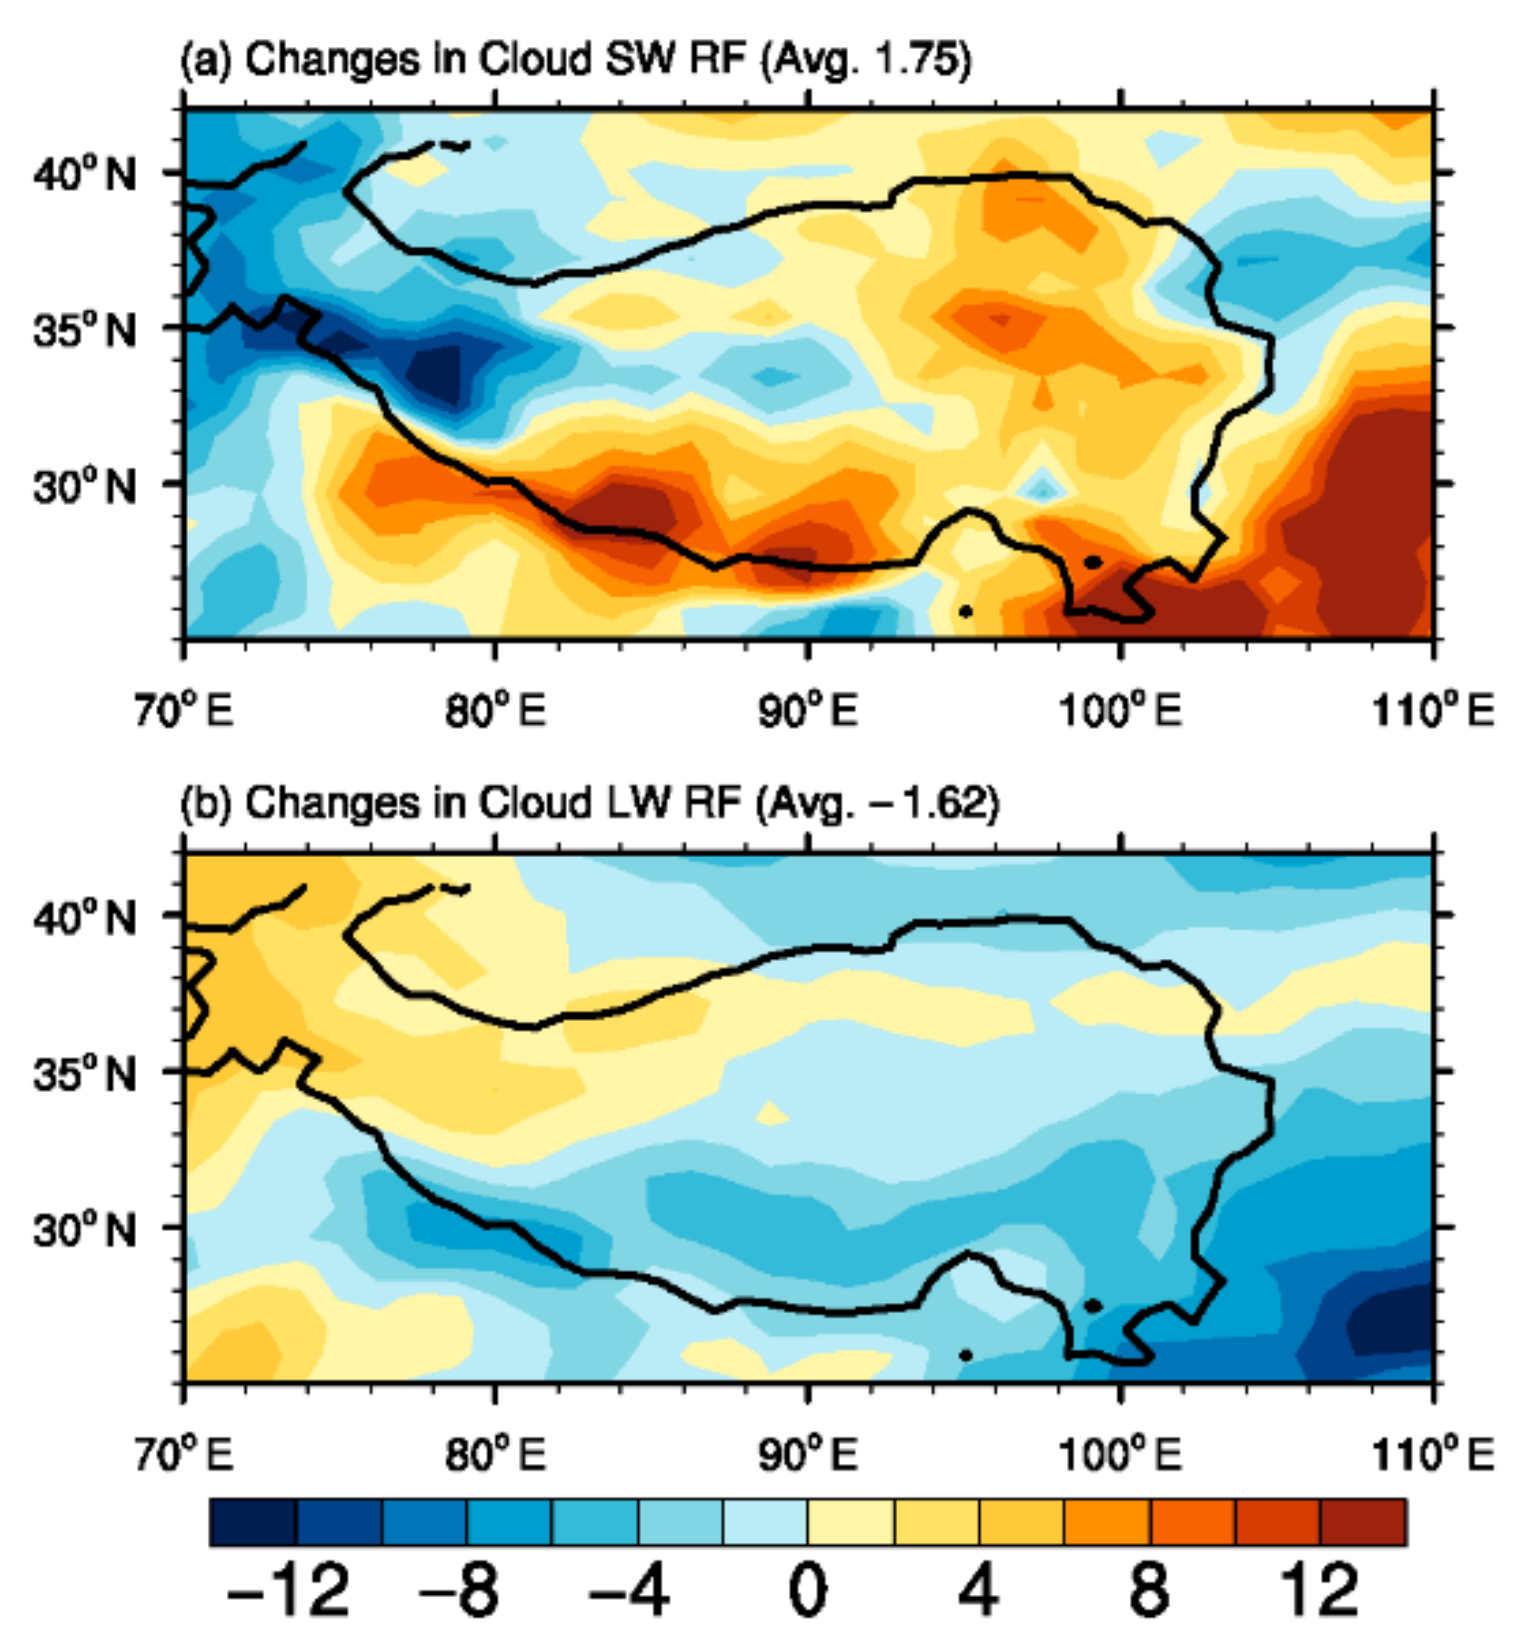
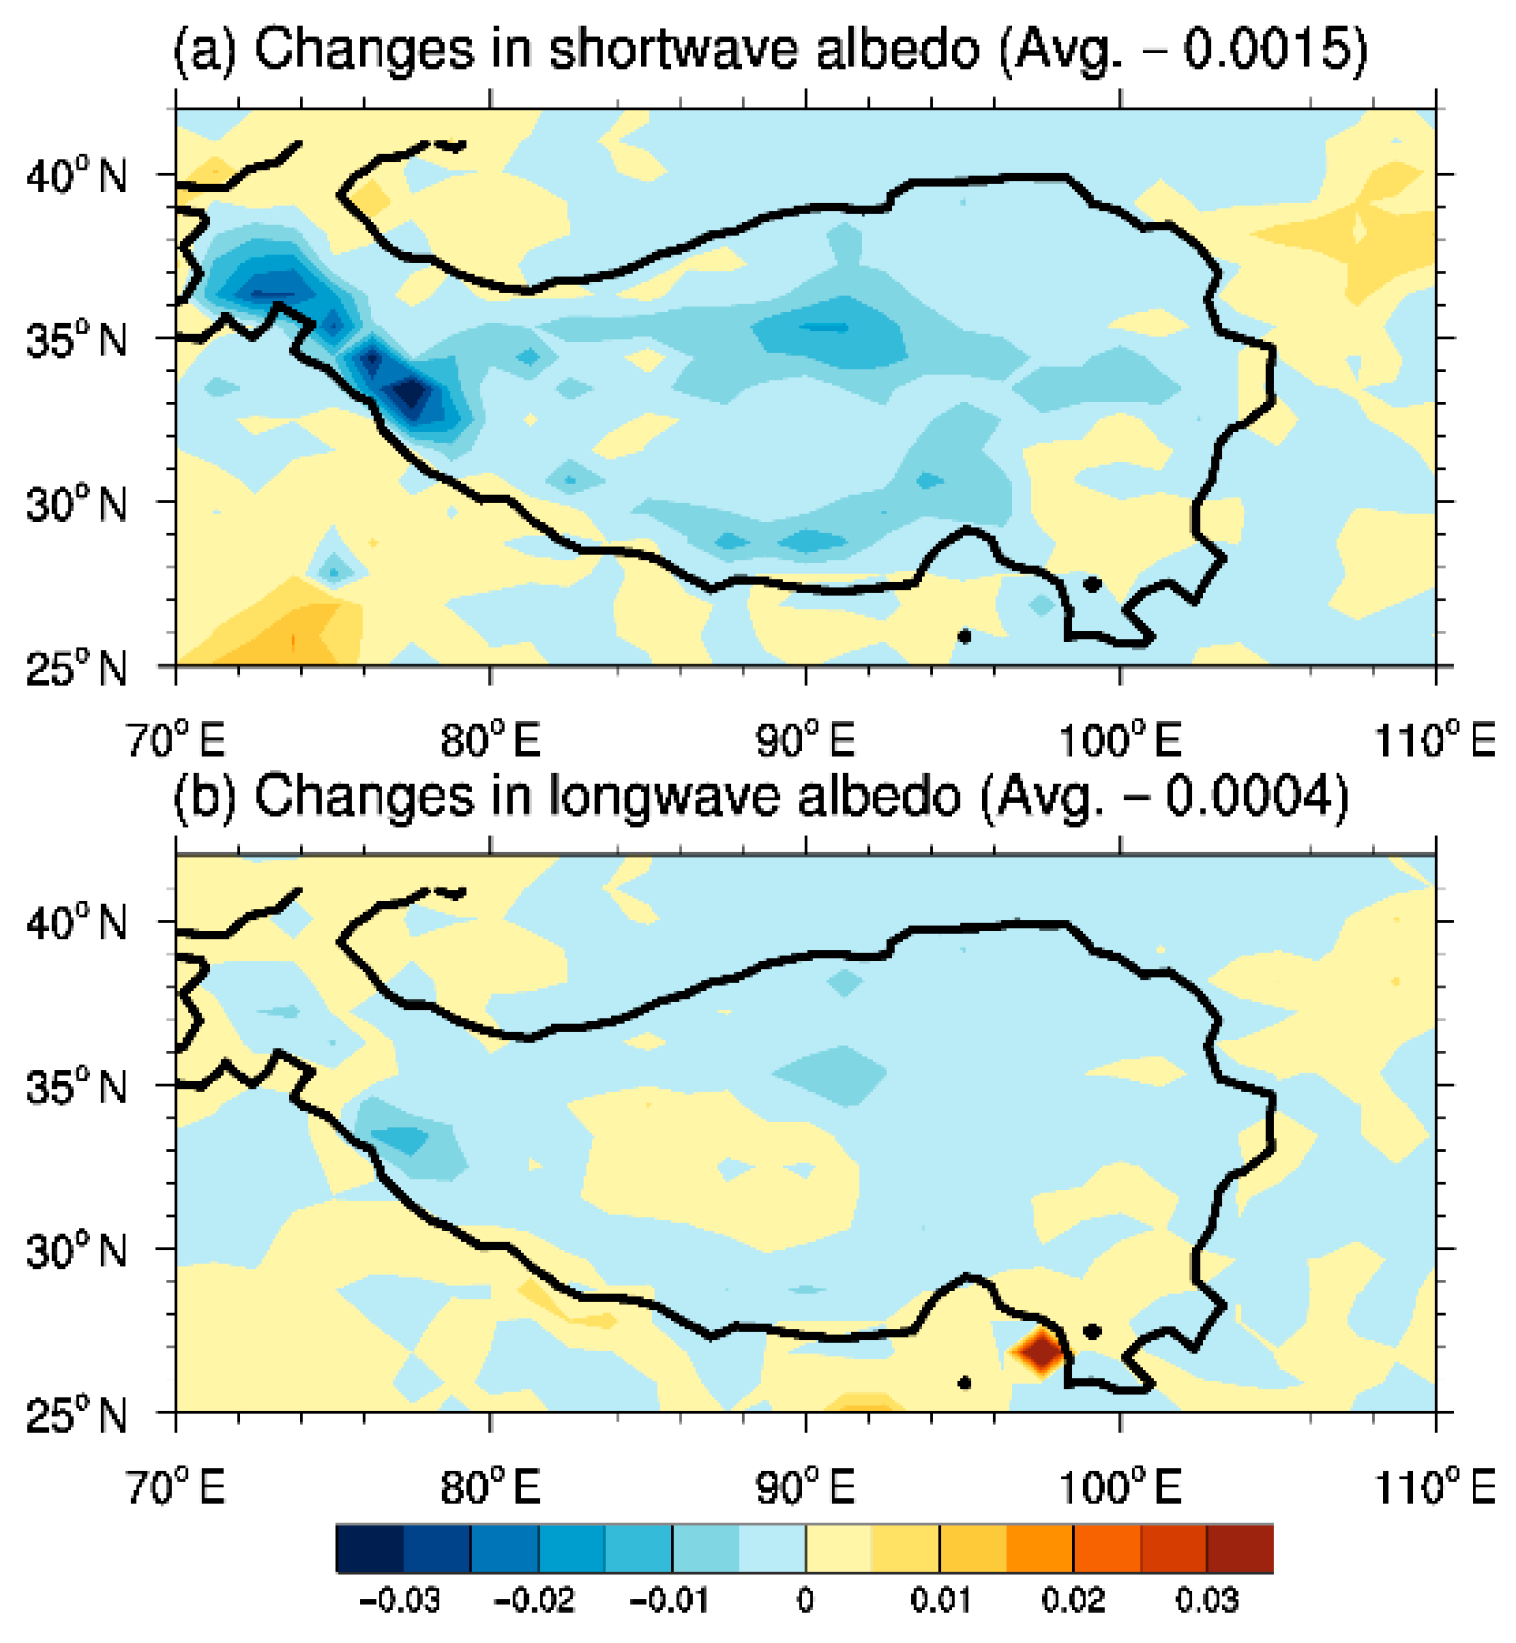
3.2. The Radiative Forcing

In this study, both the direct and indirect effects of BC are considered in the CESM model. Figure 5 shows the clear sky direct radiative forcing (DRF), latent heat (LH) at the surface and the surface sensible heat (SH) fluxes. The results revealed that the shortwave and longwave DRFs at TOA in clear sky are positive with the values about 2.05 and 0.72 W/m2, respectively (Figure 5a,b). The positive shortwave DRF at TOA indicated that the earth–atmosphere system absorbs more solar radiation, while the positive longwave DRFs are due to less outgoing longwave radiation caused by the absorption of BC. In this study, the results of the TOA DRFs are in agreement with the previous researches, in which some studies show the clear sky DRFs at TOA ranges 0.3–2.4 W/m2 over east Asia [73,74] and 2–6 W/m2 over East China [75,76]. In contrast, the surface shortwave DRFs of clear sky is negative with a mean value of −0.86 W/m2 (Figure 5g), while the longwave DRF is positive with an average of about 0.29 W/m2 (Figure 5h). Obviously, the shortwave radiative forcing plays a dominant role. Because of the absorption of BC, the reduction of solar radiation at the surface is obvious, resulting in a cooling effect. However, the surface longwave radiative forcing is positive, the reason of which is that the cooled surface emits less longwave radiation, while the warmed atmosphere emits more longwave radiation downward to the surface. In addition, the BC-in-snow effect could reduce the surface longwave albedo, which contributes to the surface positive longwave radiative forcing also.
It is found that both the shortwave and longwave DRFs in the atmosphere are positive with the mean values of 2.9 W/m2 and 0.44 W/m2, respectively (Figure 5d,e). The positive DRFs in the atmosphere presents a pronounced warming effect of BC upon the atmosphere. In addition, due to the BC, the LH at the surface is about 0.82 W/m2 (Figure 5c), and the SH is about 0.13 W/m2 (Figure 5f). The positive heat flux at the surface could significantly offset the surface cooling effect. The net surface heat change is about 0.39 W/m2 (Figure 5i), dominated by the disturbed latent heat flux (0.82 W/m2), and followed by the longwave radiative forcing (0.29 W/m2).
Simultaneously, the effects of BC on the cloud radiative forcing (CRF) is another important aspect for the radiation transfer process [7]. Here, we mainly analyze the changes in shortwave and longwave CRFs caused by BC. It is found that the mean change in shortwave CRF is about 1.75 W/m2 (Figure 6a), while the longwave one is about −1.62 W/m2 (see Figure 6b), thus the comprehensive change in CRF is warming the earth–atmosphere system. Furthermore, the shortwave and longwave CRFs showed an opposite variation. The change in shortwave CRF is positive over the eastern TP but negative over the western TP. In contrary, the change in longwave CRF is positive over the western TP and negative over the eastern TP. Overall, the net positive changes in CRF denotes a warming effect. The changes in CRF are associated with the cloud microphysics. Due to the indirect effects, BC can affect the cloud microphysics and hence the cloud albedo. In the semi-direct effects, the BC could evaporate the cloud by absorbing more solar radiation. As a result, the increased cloud fraction over the western TP could strengthen the cloud longwave radiative forcing and reduce the shortwave radiative forcing. The decreased cloud is mainly distributed over the southeast TP, that may increase the shortwave radiative forcing while reducing the longwave radiative forcing.

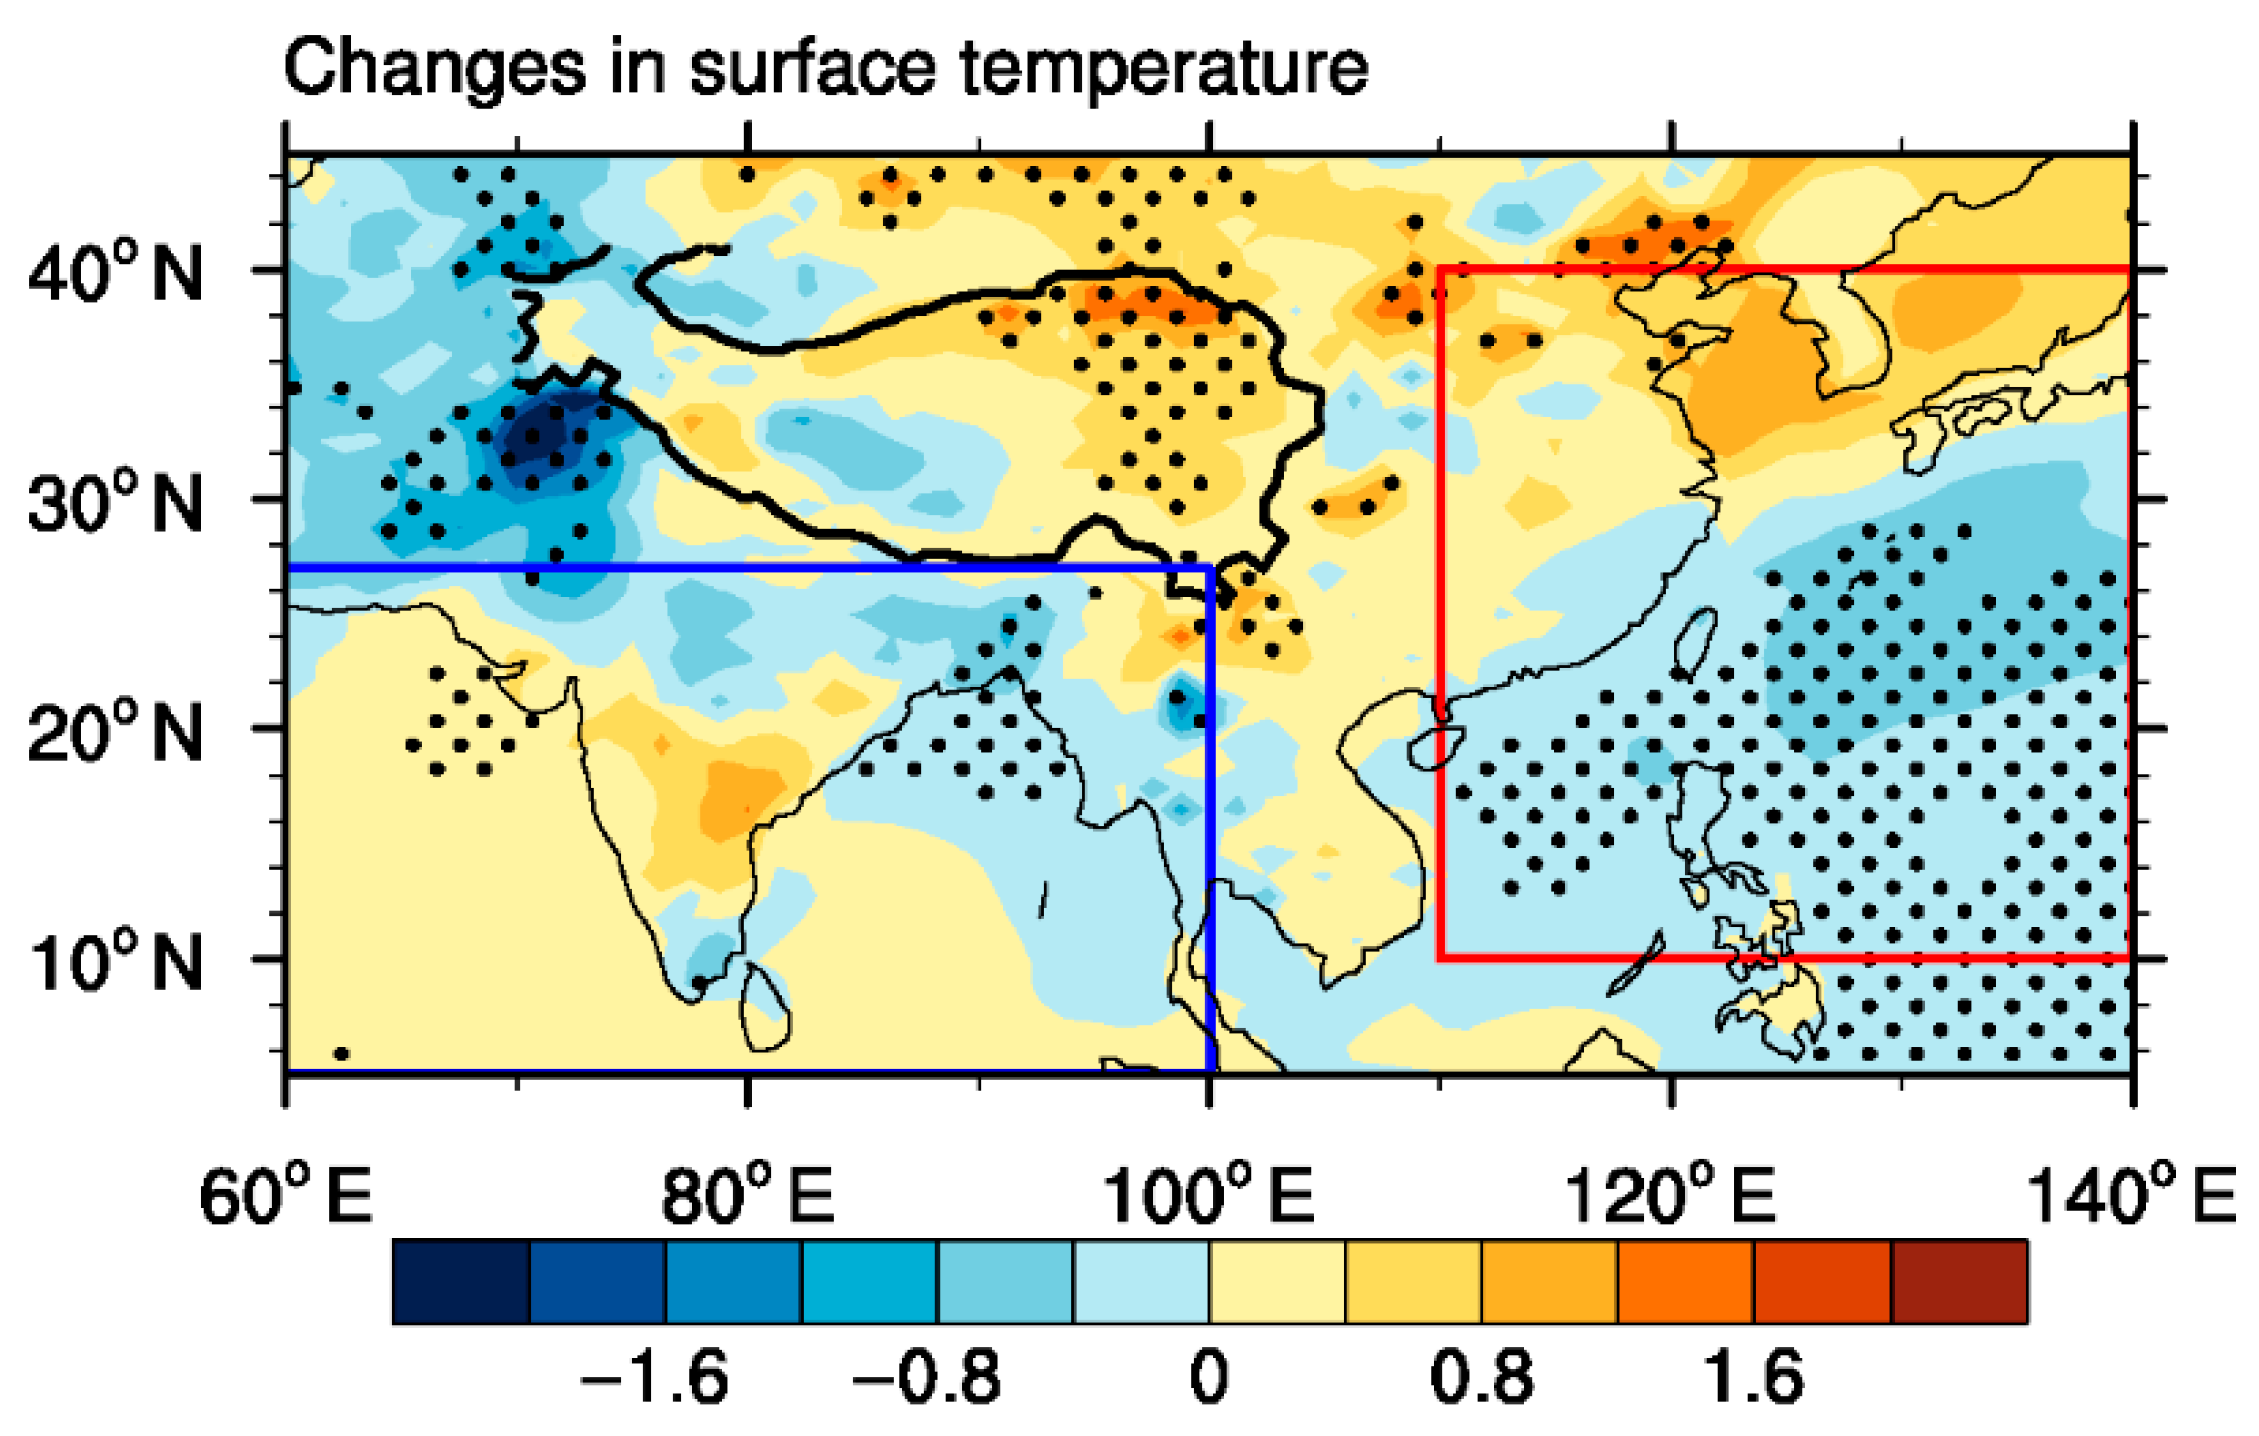
3.3. Changes in Surface Temperature

The anomalies in the earth–atmosphere heat equilibrium caused by BC are reflected by the perturbed ST. Based on the former studies, the changes in sea surface temperature (SST) gradients are important in terms of the monsoon dynamics [6,30], especially over the areas of tropical seas [33]. As some previous studies reported [6,30,31], the anomaly meridional SST gradients over the region (5°–27°N, 60°–100°E) tightly relates to the SASM. In this study, the region (5° N–27° N, 60° E–100° E), enclosed by the blue rectangle in Figure 7, is used to calculate the SASM changes. For EASM, the latitudinal land land–sea thermal contrast is more important compared with the meridional thermal contrast [77]. The area enclosed by the red rectangle in Figure 7 is taken as the critical area to calculate the change of EASM.
Figure 7 shows that, because of the addition of BC, the surface temperature increases by 0.8–1.6 K over most parts of the TP. The warmer TP is closely related to the surface positive heat flux and the reduced surface albedo (Figure 8).
The reduced surface albedo means more solar radiation will be absorbed by the land surface. Besides, the increased SST is mainly distributed in the equatorial Arabian Sea and the Southern Bay of Bengal because of the positive heat flux at the surface. In contrast, a pronounced decrease is found over Northern India, Pakistan, Afghanistan and Iran because of the dimming effect of BC. Consequently, the surface temperature shows a decreased meridional gradient. On the other hand, the surface temperature increases over East China, but decreases over the Northwest Pacific Ocean, which could enhance the land-sea thermal contrast.
Generally, the anomalous meridional temperature gradient and the enhanced land–sea thermal contrast could affect the SASM and EASM circulations and further the water vapor transport significantly. More details would be discussed in the following sections.

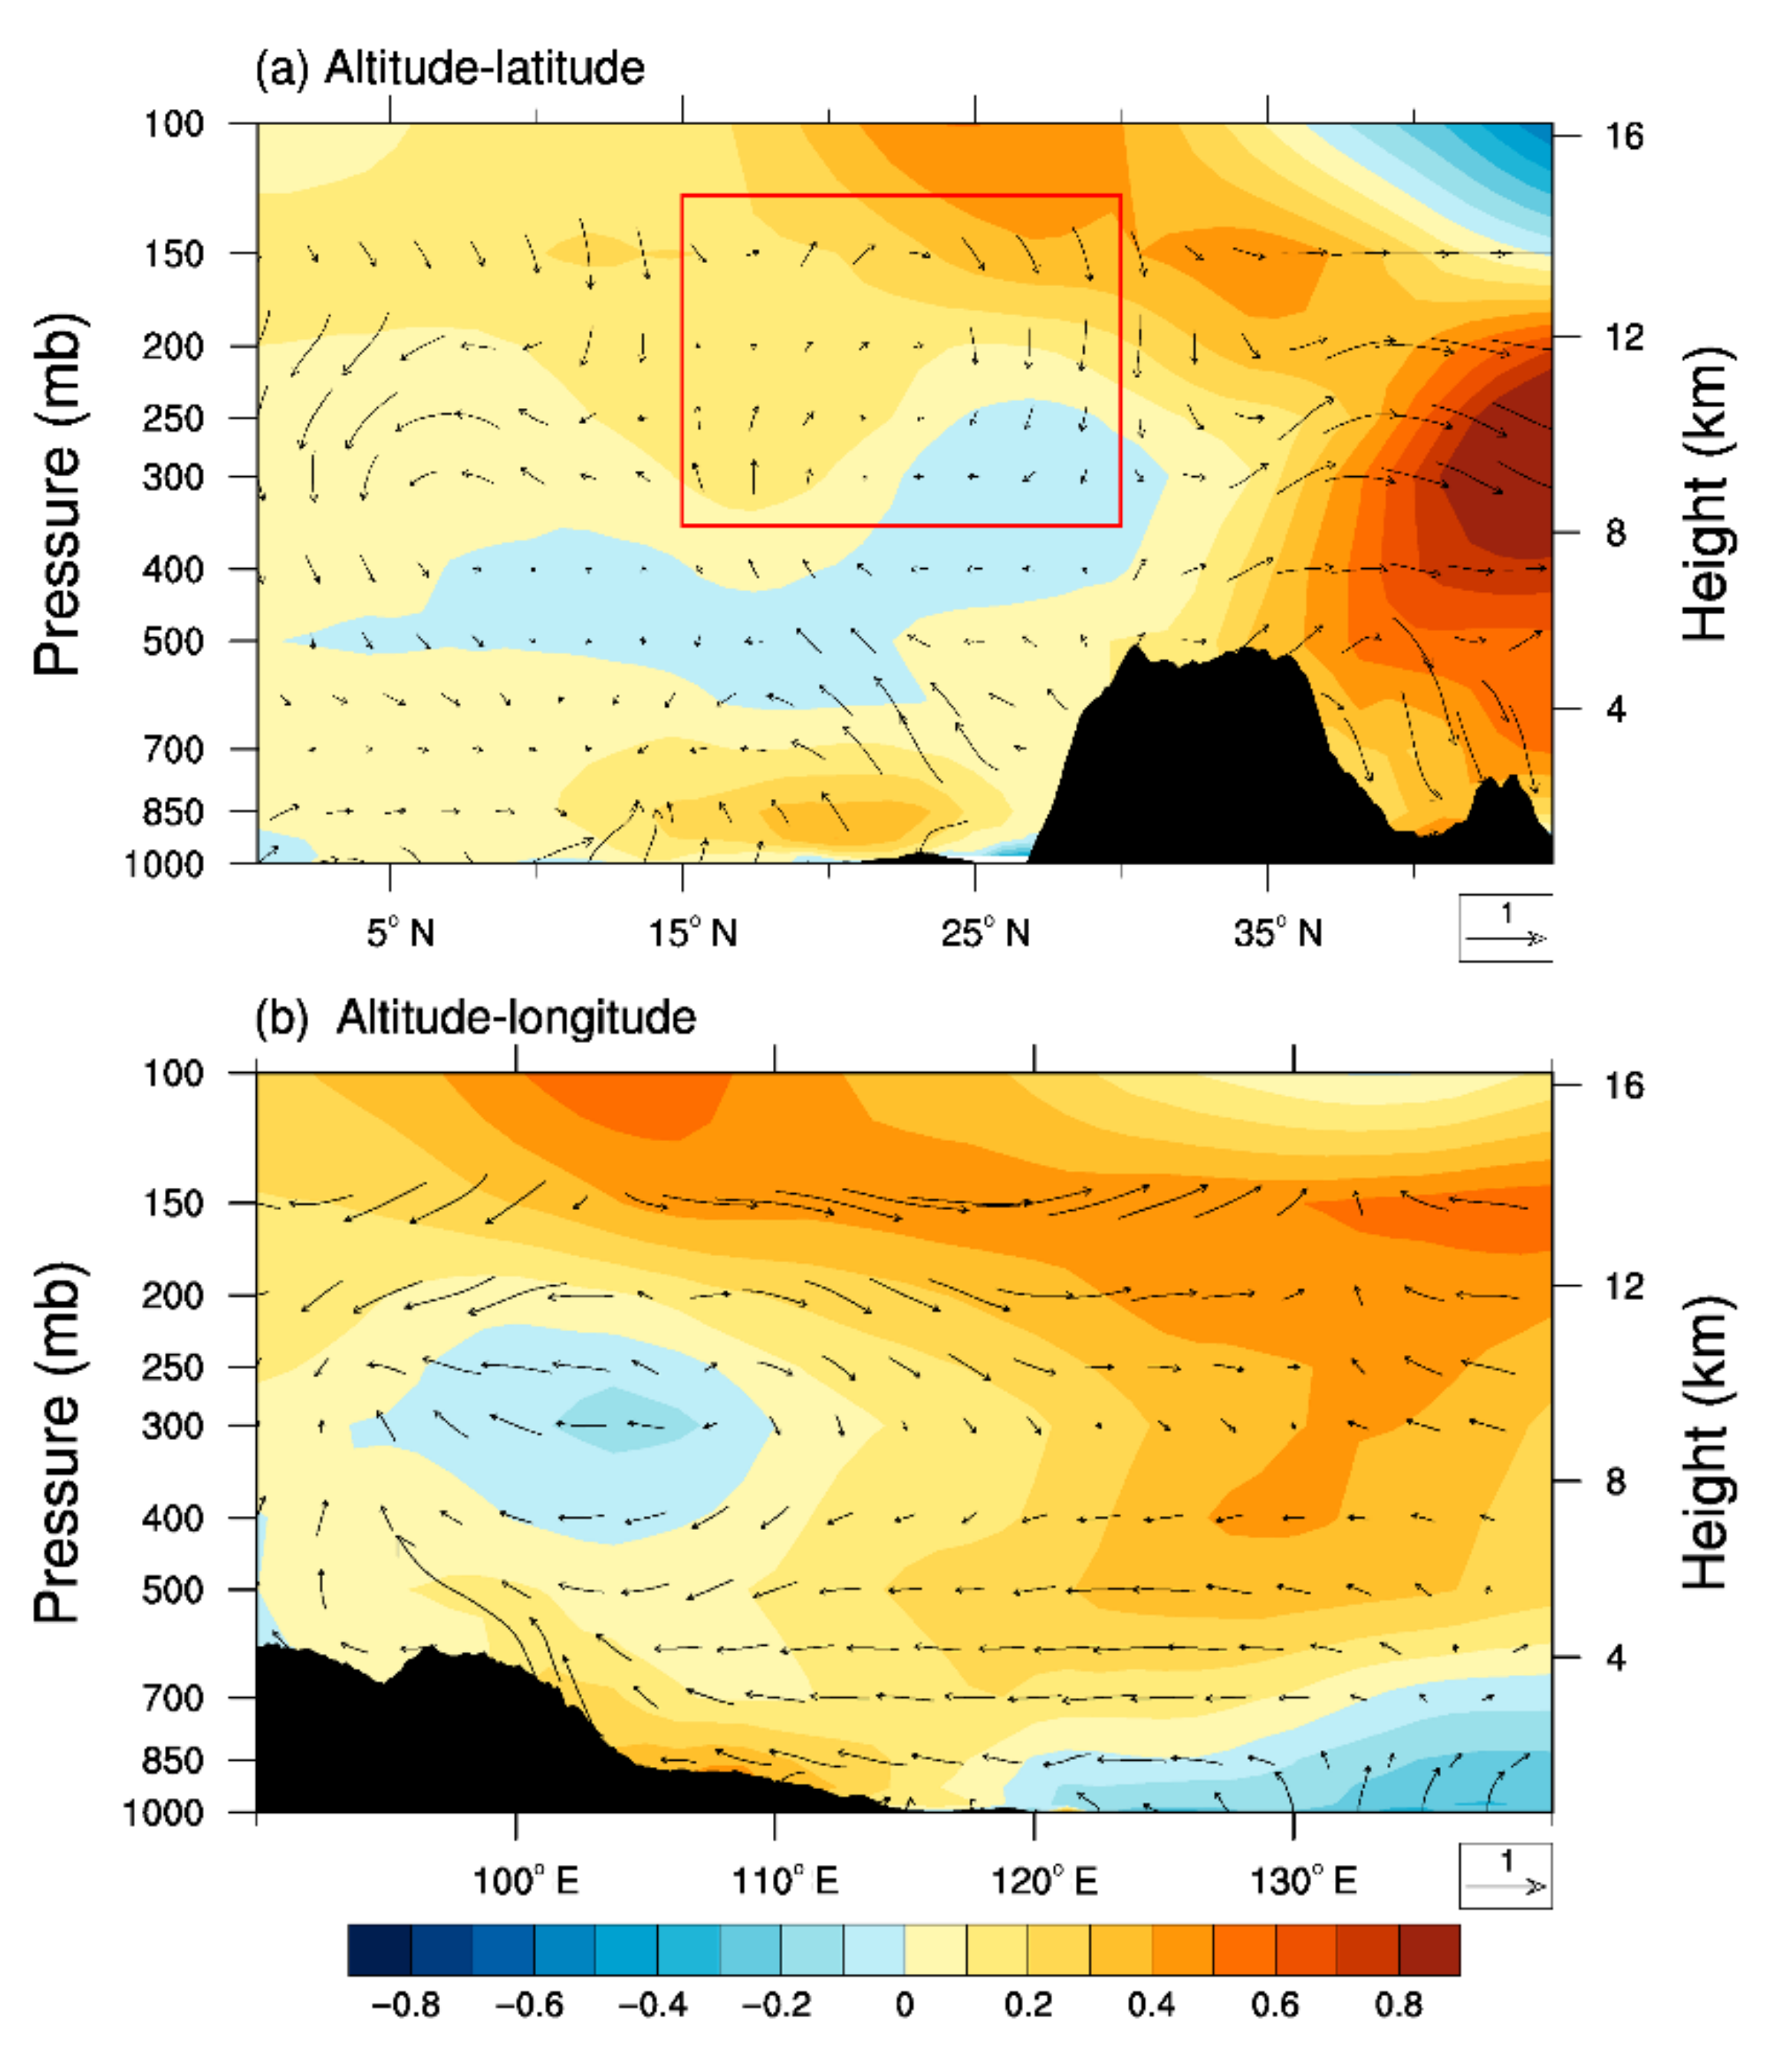
3.4. Changes in Atmospheric Circulation

Figure 9 describes the altitude–latitude cross-section of zonal mean (60° E–120° E) air temperature and wind field changes. As shown in Figure 9a, over South Asia, the upper atmosphere which is marked by the red rectangle has a warming affect. Meanwhile, an anticyclonic circulation is stimulated due to the addition of BC over the area from 15° N to 25° N, which is consistent with the “Elevated Heat Pump” (EHP) effect of BC reported by Lau and Kim [28]. Due to the EHP effect induced by BC, the anomalous circulation appears opposite to the Hadley circulation, resulting in a northerly wind at the lower atmosphere, which may further reduce the water vapor transport from the Indian Ocean to the TP.
Figure 9b describes the altitude–longitude cross-section of changes in meridional mean (27° N–42° N) air temperature and wind field over East Asia. Generally, East Asia is affected by the subtropical summer monsoon, which attributes the intensity mainly to the latitudinal thermal contrast and secondarily to the meridional thermal contrast [77]. Thus, we analyzed the latitudinal land–sea thermal contrast from 100° E to 140° E. Besides, the pattern of “western warm eastern cold” induces easterlies from the Northwest Pacific Ocean to the east border of the TP, leading to an enhanced EASM.
To estimate the changes in SASM and EASM due to the BC, the DNS indices are calculated according to Li et al. [64], as shown in Figure 10. Figure 10a shows that the SASM indices under the ALL experiment are smaller than that under the ALL-BC experiment, indicating a weak SASM. Conversely, the EASM index has the opposite variations, in which an enhanced EASM is caused by including BC in the model (Figure 10b).

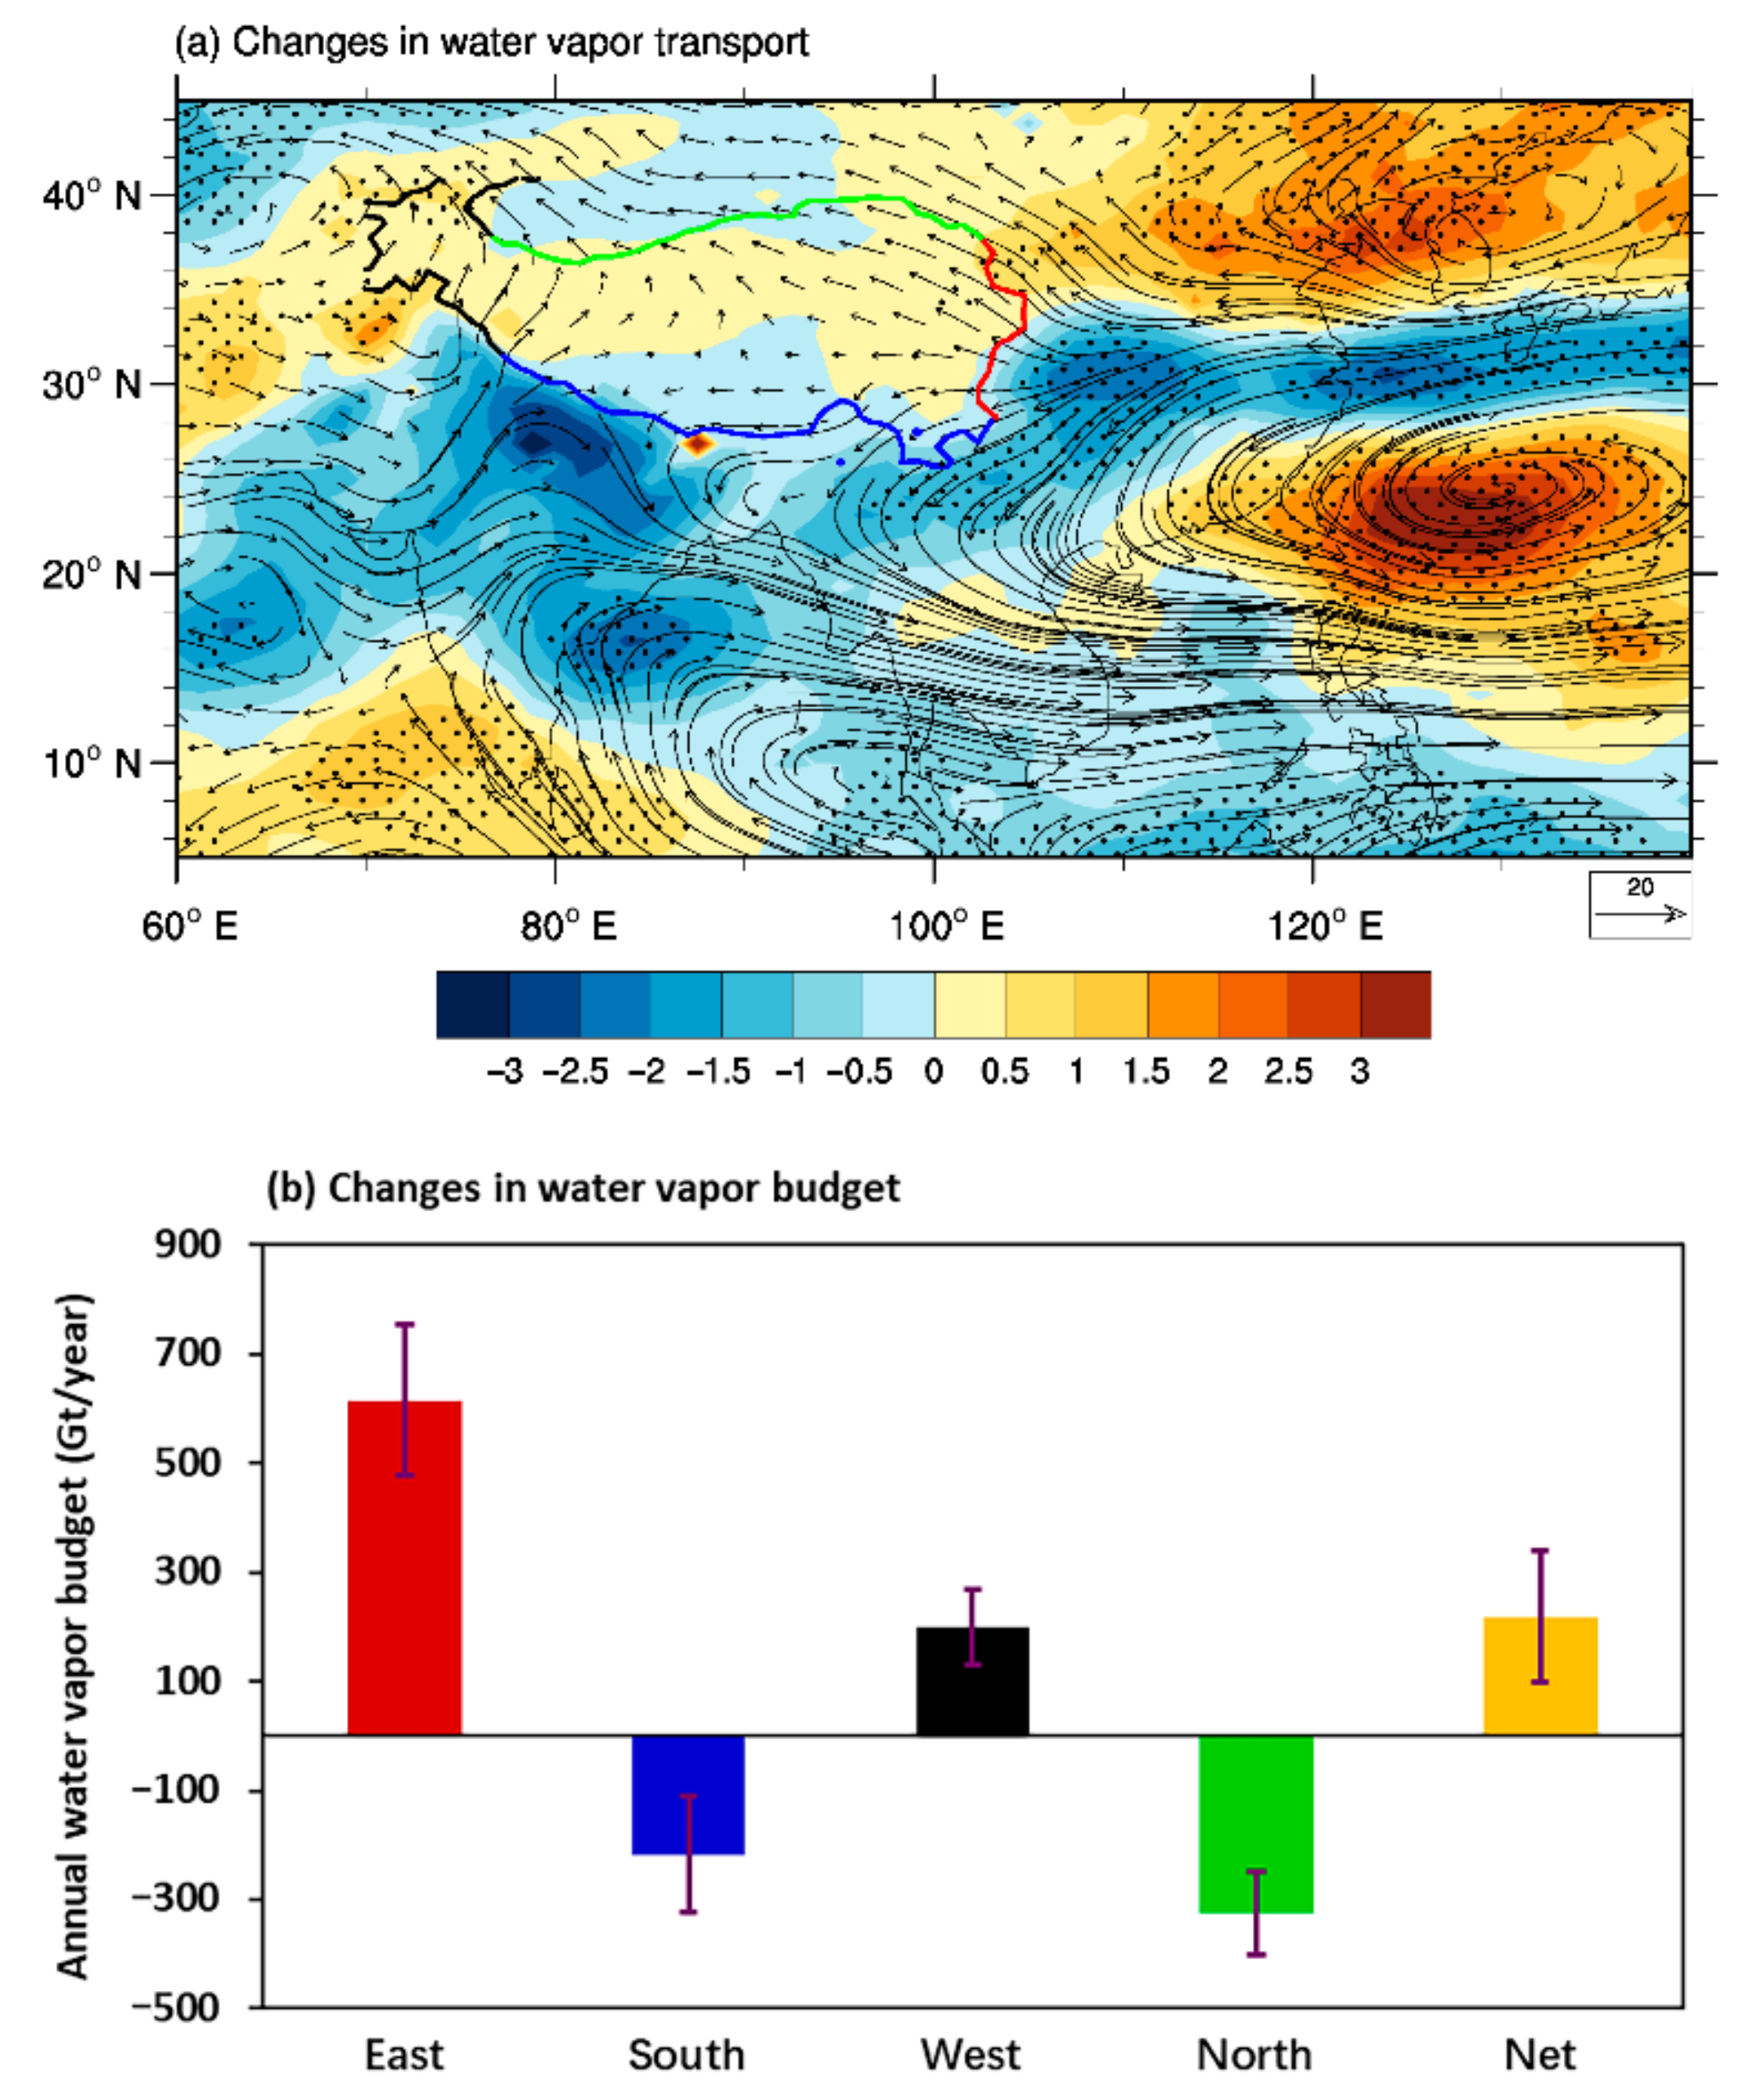
3.5. Effects of BC on the Water Vapor Budget

It should be noted that the EHP effect can reduce the SASM in summertime. The anticyclone in the upper atmosphere, which is caused by BC, can induce a northerly wind in the lower atmosphere from the south slope of the Tibetan Plateau to Northern India (see Figure 9a). The northerly wind is contrary to the southerly wind over the region of 0° N–15° N, where can represent the SASM. Thus, the EHP effect can reduce the SASM in summertime. In addition, the strong cooling effect over North India, Pakistan, Afghanistan and Iran, and the warming effect over South India, together with the surrounding ocean area, could reduce the meridional temperature gradient and hence weaken the SASM. Meanwhile, the warmer TP caused by BC can increase the land–sea thermal contrast and the EASM. Overall, the BC could induce a weak SASM but an enhanced EASM and further affect the water vapor transport from the ocean to the TP.
Water vapor plays a significant role in adjusting the air temperature and precipitation. As reported by previous researchers [78], the water vapor from the west and southwest borders contributed mostly to the precipitation over the TP region. Besides, the net importing water vapor to the TP is mainly attributed to the east and west borders with the values of 1991.47 kg/(m·s) and 160.13 kg/(m·s), respectively. Likewise, the exporting water vapor away from the TP is attributed mainly to the north and south borders with the values of 267.77 kg/(m·s) and 381.97 kg/(m·s), respectively [37]. Generally, the four borders of the TP have different characteristics on the water vapor transport. The importing water vapor from the west border serves as the primary contribution to the water vapor over the TP, and that from the southern border is the second contribution [37,79]. Besides, the eastern border has the main export channels, which are closely related to the atmospheric circulations [42].
Figure 11a shows that a pronounced anomalous cyclone over the Northwest Pacific Ocean and a weak cyclone system over Pakistan and Afghanistan are stimulated because of the addition of BC in the simulation. The TP, located at the north side of the cyclone over the Northwest Pacific Ocean, was affected by the perturbed east airflows extending from the Northwest Pacific Ocean to the east border of the TP. Over the western TP, the anomalous southeast flow exerted an impact on the TP because of the weak cyclone system over Pakistan and Afghanistan.
Over the south and north borders of the TP, it was controlled by the anomalous north and southeast flows, respectively. Consequently, more water vapor was exported from the TP. The mean flux of water vapor imported from the west and east borders are 6.3 × 10⁶ kg/s and 19.5 × 10⁶ kg/s, repsectively. The water vapors exported from the south and north border are about 6.9 × 10⁶ kg/s and 10 × 106 kg/s, respectively. Thus, the horizontal net water vapor budget of TP is about 8.6 × 10⁶ kg/s. The net annual mean water vapor budget is about 271Gt/year (see Figure 11b). This net budget is dominated by the east border of TP than others.

4. Discussion

As mentioned in Section 3.3, the pronounced increase in ST over the TP is caused by the positive surface net heat flux with the value of 0.39 W/m2. The warmer TP is dominated by the surface latent heat flux, followed by the longwave radiative forcing and sensible heat flux.
In Section 3.5, we noted that the net annual mean positive importing water vapor caused by BC over the TP is about 271 Gt/year, in which the positive feature is consistent with the previous study [72]. The anomalous water vapor could partially modify the precipitation pattern. Figure 12 shows the anomalous precipitation rate over the TP. As given in Figure 12, precipitation was mainly increased over the northern and western TP, with a maximum value of 2 mm/day. Simultaneously, the precipitation was decreased over the southern TP with a maximum decreasing about 3 mm/day. The average value of increased precipitation due to BC over the TP is 0.56 mm/day. The increased precipitation over TP is attributed to the anomalous water vapor transport and atmospheric circulations caused by BC [2,3].
As shown in Figure 11a, the cyclone induced by the surface cooling effect of BC over Pakistan and Afghanistan is beneficial to increase the precipitation over the Western TP. Besides, the perturbed easterly wind and the orographic lifting are in favor of increasing the precipitation over the Northern TP.
As illustrated above, the BC aerosol can induce a warmer and wetter plateau. The results are consistent with current studies [42,73,80]. Our results suggest that the heating of LH, SH and longwave radiative forcing could offset the surface cooling effect. Besides, the BC-in-snow effect could contribute to the warmer TP also [16,17,18,19].
In this study, the net surface radiative forcing has included the BC-in-snow effect already. Based on the previous studies, the “snow darkening” effect of BC could also contribute to the warmer TP [81,82], and leads to a reduced snow cover by about 10%–20%, accompanied with a decreased surface albedo. This feedback could heat the TP significantly [82]. In this study, the changes in surface albedo are shown in Figure 8. The results indicate that the mean shortwave and longwave albedo are decreased by 0.0015 and 0.0004, respectively, because of the addition of black carbon. The magnitude of the reduced shortwave albedo is about four times greater than that of the surface longwave albedo. Besides, the reduced shortwave albedo could reach to −0.03 at the south slope of the TP. It is closely related to the high concentration of BC. Generally, the reduced albedo means that the BC-in-snow could absorb more downward solar radiation and longwave radiation to heat the TP.
Moreover, the BC-in-snow effect could further significantly affect the SASM and EASM by the thermal and dynamical forcing. Based on the current study, the warmer TP could increase the land–sea thermal contrast to enhance the EASM in summertime [26], which is consistent with the result of this study. Besides, the BC-in-snow can strengthen the upward motion over the TP to advance the SASM in pre-monsoon [26], which is similar to the EHP effect of BC [27].
The premise of the EHP is that BC can stack up against the south slope of the TP in the springtime and then induce an anomalous warming anticyclone in the upper atmosphere [27]. Because of the latent heat warming effect over the TP, the meridional temperature gradient and the SASM could be enhanced in springtime. It should be noted that Lau and Kim [27] proposed the EHP by the results from the GCM model, neglecting the indirect effects by the off-line method. On the contrary, our results include the direct and indirect effects and the feedback of the ocean. The results show that EHP could induce a warm anticyclone in the upper atmosphere over BC-contaminated regions from Northern India to TP. The northerly wind of the anticyclone in the lower atmosphere and the reduced meridional ST gradient could reduce the SASM in summertime. The results are consistent with the previous studies [28,29].
In the following, a mechanism analysis is performed (Figure 13). Because of the absorption of BC, the solar radiation reaching the surface is reduced obviously, leading to a surface cooling effect. Furthermore, the ST increased over the TP because of the addition of BC. Therefore, a warmer TP can be induced by the BC.
Though the thermal effects of BC on the lower atmosphere over the TP are warming, spatial discrepancies over the other regions exist. On the one hand, over the regions surrounding Pakistan, Afghanistan and Northern India, the addition of BC can decrease the ST. However, it can increase the SST of Indian Ocean. Thus, a weak thermal contrast between the land and ocean is induced, leading to a weak SASM, then to less water vapor transporting from the south border of the TP. On the other hand, the land–sea thermal contrast is intensified over East Asia, inducing an intensified EASM. The changes in SASM and EASM dramatically impact the water vapor to the TP. Furthermore, a cyclone is stimulated in the upper atmosphere due to the decreased ST over Pakistan, Afghanistan and the Northwest Pacific Ocean. Thus, the western TP is controlled by the southwest winds, leading to more water vapor being transported to the TP. Besides, the eastern TP is controlled by the east winds which is on the north side of the cyclone, resulting in more water vapor being transported to the TP also. Consequently, due to the BC, though the water vapor imported from south side is weak, and the exported water vapor from north side of TP is enhanced, more water vapor is transported from the east and west to the TP. Therefore, because of BC addition, the TP will be wetter.
The uncertainties in the results apply mostly to the aerosol–clouds interactions (ACI, indirect effects) because of the lack of an accurate resolution to represent ACI. Current understanding and classification of this ACI regime is based on the response of the droplet number concentration (Nc) to the aerosol number concentration (Na) and vertical velocity (w) [83], and that are represented by empirical parameterizations. The ACI could affect the performance of the climate model strongly [83]. The other uncertainties mainly derived from the short records of the horizontal and vertical BC distributions. An accurate distribution of BC data sets may help to interpret the transport and buildup of the BC well. Recently, using the observations which include aerosol physical and chemical properties and mixing state to constrain the simulations is an effective approach to limit the uncertainties.

5. Conclusions

The BC could significantly affect the climate over the TP especially in the summer. Here, combining satellite observations and reanalysis data, we studied the climate effect of BC over the TP by using a fully coupled model. In this study, we have estimated the results of BC affecting the water vapor transport, and we have revealed the concerning mechanism.
The simulation indicates that the BC can induce the positive radiative effects (including direct and indirect effects) and thus exert a pronounced warming over the TP. Based on a detailed analysis, the mean shortwave and longwave radiative forcing at the TOA over TP are 2.05 W/m2 and 0.72 W/m2, respectively.
Besides, considering the LH and SH, the surface net heat forcing presents positive with a value of 0.39 W/m2. Furthermore, the BC can induce an anomalous temperature and then change the atmospheric circulations. As mentioned above, because of the addition of BC, there is a pronounced decreased temperature over Pakistan and Afghanistan, but an increased surface temperature over Southern India and its surrounding ocean. Such temperature patterns can induce a weak thermal contrast between the land and sea, leading to a weak SASM. Thus, less water vapor could be transported from the Indian Ocean to the TP. Besides, over East Asia, the “western warm and eastern cold” pattern enhanced the land–sea thermal contrast over East Asia and the surrounding ocean, inducing an intensified EASM significantly. Consequently, more water vapor is transported from the east of TP. Overall, due to the BC, the net water vapor is positive over the TP, implying a net import of water vapor from the surroundings to the TP. Furthermore, the increased water vapor is closely related to the anomalies in precipitation over the TP.

Author Contributions

Conceptualization, Y.L.; methodology, Y.L. and M.L.; investigation, Y.L and M.L.; writing—original draft preparation, M.L.; writing—review and editing, Y.L., M.L., K.A. and Y.T.; visualization, M.L., Q.Z. and Y.T.; funding acquisition, Y.L. All authors have read and agreed to the published version of the manuscript.

Funding

This research was mainly supported by the Strategic Priority Research Program of Chinese Academy of Sciences (Grant No. XDA2006010301) and the National Natural Science Foundation of China (91737101 and 91744311). This work was also jointly supported by the Foundation of Key Laboratory for Semi-Arid Climate Change of the Ministry of Education in Lanzhou University.

Acknowledgments

We acknowledge the MISR (http://eosweb.larc.nasa.gov/PRODOCS/misr/table_misr.html), CERES (https://ceres.larc.nasa.gov/), EAR-interim (https://www.ecmwf.int/en/forecasts/datasets/reanalysis-datasets/era-interim), MERRA-2 (https://gmao.gsfc.nasa.gov/reanalysis/MERRA-2/) and NCEP (https://www.esrl.noaa.gov/psd/data/gridded/data.ncep.reanalysis.html) science teams for providing excellent and accessible products which favor this study. We also thank the Intergovernmental Panel on Climate Change (IPCC) Fifth Assessment Report (AR5) for providing us the data sets of anthropogenic aerosol emissions (ftp://ftp.cgd.ucar.edu/cesm/inputdata/atm/cam/chem/trop_mozart_aero/emis/).

Conflicts of Interest

The authors declare no conflict of interest.

References

  1. Roberts, D.L.; Jones, A. Climate sensitivity to black carbon aerosol from fossil fuel combustion. J. Geophys. Res. Atmos. 2004, 109, D16202. [Google Scholar] [CrossRef]
  2. Wu, J.; Fu, C.; Xu, Y.; Tang, J.P.; Wang, W.; Wang, Z. Simulation of direct effects of black carbon aerosol on temperature and hydrological cycle in Asia by a Regional Climate Model. Meteorol. Atmos. Phys. 2008, 100, 179–193. [Google Scholar] [CrossRef]
  3. Booth, B.; Bellouin, N. Black carbon and atmospheric feedbacks. Nature 2015, 519, 167–168. [Google Scholar] [CrossRef]
  4. Ji, D.; Li, L.; Pang, B.; Xue, P.; Wang, Y.; Wang, L.; Wu, Y.; Zhang, H. Characterization of black carbon in an urban-rural fringe area of Beijing. Environ. Pollut. 2017, 223, 524–534. [Google Scholar] [CrossRef] [PubMed]
  5. Stjern, C.W.; Samset, B.H.; Myhre, G.; Forster, P.M.; Hodnebrog, Ø.; Andrews, T.; Boucher, O.; Faluvegi, G.; Iversen, T.; Kasoar, M.; et al. Rapid Adjustments Cause Weak Surface Temperature Response to Increased Black Carbon Concentrations. J. Geophys. Res. Atmos. 2017, 122, 462–481. [Google Scholar] [CrossRef]
  6. Ramanathan, V.; Chung, C.; Kim, D.; Bettge, T.; Buja, L.; Kiehl, J.; Washington, W.; Fu, Q.; Sikka, D.; Wild, M. Atmospheric brown clouds: Impacts on South Asian climate and hydrological cycle. Proc. Natl. Acad. Sci. USA 2005, 102, 5326–5333. [Google Scholar] [CrossRef] [Green Version]
  7. Liu, Y.; Jia, R.; Dai, T.; Xie, Y.; Shi, G. A review of aerosol optical properties and radiative effects. J. Meteor. Res. 2014, 28, 1003–1028. [Google Scholar] [CrossRef]
  8. Chen, B.; Chen, J.; Bai, Z.; Cui, X.; Andersson, A.; Gustafsson, Ö. Light absorption enhancement of black carbon from urban haze in Northern China winter. Environ. Pollut. 2017, 221, 418–426. [Google Scholar] [CrossRef]
  9. Liu, Y.; Sato, Y.; Jia, R.; Xie, Y.; Huang, J.; Nakajima, T. Modeling study on the transport of summer dust and anthropogenic aerosols over the Tibetan Plateau. Atmos. Chem. Phys. 2015, 15, 12581–12594. [Google Scholar] [CrossRef] [Green Version]
  10. Liu, Y.; Zhu, Q.; Wang, R.; Xiao, K.; Cha, P. Distribution, source and transport of the aerosols over Central Asia. Atmos. Environ. 2019, 210, 120–131. [Google Scholar] [CrossRef]
  11. Jia, R.; Luo, M.; Liu, Y.; Zhu, Q.; Hua, S.; Wu, C.; Shao, T. Anthropogenic Aerosol Pollution over the Eastern Slope of the Tibetan Plateau. Adv. Atmos. Sci. 2019, 36, 847–862. [Google Scholar] [CrossRef]
  12. Ming, J.; Xiao, D.; Du, C.; Yang, G. An overview of black carbon deposition in High Asia glaciers and its impacts on radiation balance. Adv. Water Res. 2013, 55, 80–87. [Google Scholar] [CrossRef]
  13. Liu, Y.; Huang, J.; Shi, G.; Takamura, T.; Khatri, P.; Bi, J.; Shi, J.; Wang, T.; Wang, X.; Zhang, B. Aerosol optical properties determined from sky-radiometer over Loess Plateau of Northwest China. Atmos. Chem. Phys. 2011, 11, 23883–23910. [Google Scholar] [CrossRef] [Green Version]
  14. Jia, R.; Liu, Y.; Hua, S.; Zhu, Q.; Shao, T. Estimation of the aerosol radiative effect over the Tibetan Plateau based on the latest CALIPSO product. J. Meteorol. Res. 2018, 32, 707–722. [Google Scholar] [CrossRef]
  15. He, C.; Li, Q.; Liou, K.; Takano, Y.; Gu, Y.; Qi, L.; Mao, Y.; Leung, L. Black carbon radiative forcing over the Tibetan Plateau. Geophys. Res. Lett. 2014, 41, 7806–7813. [Google Scholar] [CrossRef]
  16. Flanner, M.; Zender, C.; Randerson, J.; Rasch, P. Present-day climate forcing and response from black carbon in snow. J. Geophys. Res. Atmos. 2007, 112, D11202. [Google Scholar] [CrossRef] [Green Version]
  17. Xu, B.; Cao, J.; Hansen, J.; Yao, T.; Joswia, D.; Wang, N.; Wu, G.; Wang, M.; Zhao, H.; Yang, W.; et al. Black soot and the survival of Tibetan glaciers. Proc. Natl. Acad. Sci. USA 2009, 106, 22114–22118. [Google Scholar] [CrossRef] [Green Version]
  18. Jacobi, H.; Lim, S.; Ménégoz, M.; Ginot, P.; Laj, P.; Bonasoni, P.; Stocchi, P.; Marinoni, A.; Arnaud, Y. Black carbon in snow in the upper Himalayan Khumbu Valley, Nepal: Observations and modeling of the impact on snow albedo, melting, and radiative forcing. Cryosphere 2015, 9, 1685–1699. [Google Scholar] [CrossRef] [Green Version]
  19. He, C.; Flanner, M.; Chen, F.; Barlage, M.; Liou, K.; Kang, S.; Ming, J.; Qian, Y. Black carbon-induced snow albedo reduction over the Tibetan Plateau: Uncertainties from snow grain shape and aerosol–snow mixing state based on an updated SNICAR model. Atmos. Chem. Phys. 2018, 18, 11507–11527. [Google Scholar] [CrossRef] [Green Version]
  20. Hua, S.; Liu, Y.; Jia, R.; Chang, S.; Wu, C.; Zhu, Q.; Shao, T.; Wang, B. Role of Clouds in Accelerating Cold-Season Warming During 2000-2015 over the Tibetan Plateau. Int. J. Climatol. 2018, 38, 4950–4966. [Google Scholar] [CrossRef]
  21. Liu, Y.; Hua, S.; Jia, R.; Huang, J. Effect of aerosols on the ice cloud properties over the Tibetan Plateau. J. Geophys. Res. Atmos. 2019, 124, 9594–9608. [Google Scholar] [CrossRef]
  22. Liu, Y.; Zhu, Q.; Huang, J.; Hua, S.; Jia, R. Impact of dust-polluted convective clouds over the Tibetan Plateau on downstream precipitation. Atmos. Environ. 2019, 209, 67–77. [Google Scholar] [CrossRef]
  23. Liu, Y.; Li, Y.; Huang, J.; Wang, S.; Zhu, Q. Attribution of Tibetan Plateau to the northern drought. Natl. Sci. Rev. 2019, nwz191. [Google Scholar] [CrossRef] [Green Version]
  24. Liu, Y.; Luo, R.; Zhu, Q.; Hua, S.; Wang, B. Cloud Ability to Produce Precipitation over Arid and Semiarid Regions of Central and East Asia. Int. J. Climatol. 2019, 1–14. [Google Scholar] [CrossRef]
  25. Liu, Y.; Wu, C.; Jia, R.; Huang, J. An overview of the influence of atmospheric circulation on the climate in arid and semi-arid region of Central and East Asia. Sci. China Earth Sci. 2018, 61, 31–42. [Google Scholar] [CrossRef]
  26. Qian, Y.; Flanner, M.; Leung, L.; Wang, W. Sensitivity studies on the impacts of Tibetan Plateau snowpack pollution on the Asian hydrological cycle and monsoon climate. Atmos. Chem. Phys. 2011, 11, 1929–1948. [Google Scholar] [CrossRef] [Green Version]
  27. Lau, K.; Kim, M.; Kim, K. Asian summer monsoon anomalies induced by aerosol direct forcing: The role of the Tibetan Plateau. Clim. Dyn. 2006, 26, 855–864. [Google Scholar] [CrossRef] [Green Version]
  28. Lau, W.; Kim, K. Fingerprinting the impacts of aerosols on long-term trends of the Indian summer monsoon regional rainfal. Geophys. Res. Lett. 2010, 37, 127–137. [Google Scholar] [CrossRef] [Green Version]
  29. D’Errico, M.; Cagnazzo, C.; Fogli, P.; Lau, W.; von Hardenberg, J.; Fierli, F.; Cherchi, A. Indian monsoon and the elevated-heat-pump mechanism in a coupled aerosol-climate model. J. Geophys. Res. Atmos. 2015, 120, 8712–8723. [Google Scholar] [CrossRef] [Green Version]
  30. Chung, C.; Ramanathan, V. Weakening of North Indian SST gradients and the monsoon rainfall in India and the Sahel. J. Clim. 2006, 19, 2036–2045. [Google Scholar] [CrossRef] [Green Version]
  31. Meehl, G.A.; Arblaster, J.M.; Collins, W.D. Effects of black carbon aerosols on the Indian monsoon. J. Clim. 2008, 21, 2869–2882. [Google Scholar] [CrossRef] [Green Version]
  32. Wu, G.; Li, Z.; Fu, C.; Zhang, X.; Zhang, R.; Zhang, R.; Zhou, T.; Li, J.; Zhou, D.; Wu, L.; et al. Advances in studying interactions between aerosols and monsoon in China. Sci. Chin. Earth Sci. 2016, 59, 1–16. [Google Scholar] [CrossRef]
  33. Li, H.; Dai, A.; Zhou, T.; Lu, J. Responses of EASM to historical SST and atmospheric forcing during 1950–2000. Clim. Dyn. 2010, 34, 501–514. [Google Scholar] [CrossRef] [Green Version]
  34. Zhuang, B.; Chen, H.; Li, S.; Wang, T.; Liu, J.; Zhang, L.; Liu, H.; Xie, M.; Chen, P.; Li, M.; et al. The direct effects of black carbon aerosols from different source sectors in East Asia in summer. Clim. Dyn. 2019, 53, 5293–5310. [Google Scholar] [CrossRef] [Green Version]
  35. Renhe, Z. Relations of Water Vapor Transport from Indian Monsoon with That over East Asia and the Summer Rainfall in China. Adv. Atmos. Sci. 2001, 18, 1005–1017. [Google Scholar] [CrossRef]
  36. Zhou, T.; Yu, R. Atmospheric water vapor transport associated with typical anomalous summer rainfall patterns in China. J. Geophys. Res. Atmos. 2005, 110, D8. [Google Scholar] [CrossRef] [Green Version]
  37. Ma, Y.; Lu, M.; Chen, H.; Pan, M.; Hong, Y. Atmospheric moisture transport versus precipitation across the Tibetan Plateau: A mini-review and current challenges. Atmos. Res. 2018, 209, 50–58. [Google Scholar] [CrossRef]
  38. Dong, W.; Lin, Y.; Wright, J.; Xie, Y.; Xu, F.; Xu, W.; Wang, Y. Indian Monsoon Low-Pressure Systems Feed Up-and-Over Moisture Transport to the Southwestern Tibetan Plateau. J. Geophys. Res. Atmos. 2017, 122, 12–140. [Google Scholar] [CrossRef]
  39. Li, C.; Zuo, Q.; Xu, X.; Gao, S. Water vapor transport around the Tibetan Plateau and its effect on summer rainfall over the Yangtze River valley. J. Meteorol. Res. 2016, 30, 472–482. [Google Scholar] [CrossRef]
  40. Wu, H.; Li, X.; Zhang, J.; Li, J.; Liu, J.; Tian, L.; Fu, C. Stable isotopes of atmospheric water vapour and precipitation in the northeast Qinghai-Tibetan Plateau. Hydrol. Process. 2019, 33, 2997–3009. [Google Scholar] [CrossRef]
  41. Zhao, Y.; Zhou, T. Asian water tower evinced in total column water vapor: A comparison among multiple satellite and reanalysis data sets. Clim. Dyn. 2019, 1–15. [Google Scholar] [CrossRef] [Green Version]
  42. Zhou, C.; Zhao, P.; Chen, J. The Interdecadal Change of Summer Water Vapor over the Tibetan Plateau and Associated Mechanisms. J. Clim. 2019, 32, 4103–4119. [Google Scholar] [CrossRef]
  43. Huang, J.; Yu, H.; Guan, X.; Wang, G.; Guo, R. Accelerated dryland expansion under climate change. Nat. Clim. Change 2016, 6, 166–171. [Google Scholar] [CrossRef]
  44. Huang, J.; Li, Y.; Fu, C.; Chen, F.; Fu, Q.; Dai, A.; Shinoda, M.; Ma, Z.; Guo, W.; Li, Z.; et al. Dryland climate change Recent progress and challenges. Rev.Geophys. 2017, 55, 719–778. [Google Scholar] [CrossRef]
  45. Martonchik, J.V.; Diner, D.J.; Crean, K.A.; BullRegional, M.A. Regional aerosol retrieval results from MISR. IEEE Trans. Geosci. Remote Sens. 2002, 40, 1520–1531. [Google Scholar] [CrossRef]
  46. Diner, D.; Beckert, J.; Reilly, T.; Bruegge, C.; Conel, J.; Kahn, R.; Martonchik, J.; Ackerman, T.; Davies, R.; Gerstl, S.; et al. Multi-angle Imaging SpectroRadiometer (MISR) instrument description and experiment overview. IEEE Trans. Geosci. Remote Sens. 1998, 36, 1072–1087. [Google Scholar] [CrossRef]
  47. Wielicki, B.; Barkstrom, B.; Harrison, E.; Lee, R.; Smith, G.; Cooper, J. Clouds and the Earth’s Radiant Energy System (CERES): An Earth Observing System Experiment. Bull. Am. Meteorol. Soc. 1996, 77, 853–868. [Google Scholar] [CrossRef] [Green Version]
  48. Almorox, J.; Ovando, G.; Sayago, S.; Bocco, M. Assessment of surface solar irradiance retrieved by CERES. Int. J. Remote Sens. 2017, 38, 3669–3683. [Google Scholar] [CrossRef]
  49. Kato, S.; Loeb, N.G.; Rutan, D.A.; Rose, F.G.; Sun-Mack, S.; Miller, W.F.; Chen, Y. Uncertainty estimate of surface irradiances computed with MODIS-, CALIPSO-, and CloudSat-derived cloud and aerosol properties. Surv. Geophys. 2012, 33, 395–412. [Google Scholar] [CrossRef] [Green Version]
  50. Dee, D.P.; Uppala, S.M.; Simmons, A.J.; Berrisford, P.; Poli, P.; Kobayashi, S.; Andrae, U.; Balmaseda, M.A.; Balsamo, G.; Bauer, D.P.; et al. The ERA-Interim reanalysis: Configuration and performance of the data assimilation system. Q. J. R. Meteorol. Soc. 2011, 137, 553–597. [Google Scholar] [CrossRef]
  51. Wang, S.; Zhang, M.; Sun, M.; Wang, B.; Huang, X.; Wang, Q.; Feng, F. Comparison of surface air temperature derived from NCEP/DOE R2, ERA-Interim, and observations in the arid northwestern China: A consideration of altitude errors. Theor. Appl. Climatol. 2015, 119, 99–111. [Google Scholar] [CrossRef]
  52. You, Q.L.; Min, J.Z.; Zhang, W.; Pepin, N.; Kang, S.H. Comparison of multiple datasets with gridded precipitation observations over the Tibetan Plateau. Clim. Dyn. 2014, 45, 791–806. [Google Scholar] [CrossRef]
  53. Gao, Y.; Liu, M. Evaluation of high-resolution satellite precipitation products using rain gauge observations over the Tibetan Plateau. Hydrol. Earth Syst. Sci. 2013, 17, 837–849. [Google Scholar] [CrossRef] [Green Version]
  54. Adler, R.F.; Huffman, G.J.; Chang, A.; Ferraro, R.; Xie, P.; Janowiak, J.; Rudolf, B.; Schneider, U.; Curtis, S.; Bolvin, D.; et al. The Version-2 Global Precipitation Climatology Project (GPCP) Monthly Precipitation Analysis (1979–Present). J. Hydrol. 2003, 4, 1147–1167. [Google Scholar] [CrossRef]
  55. Randles, C.; Coauthors. The MERRA-2 aerosol reanalysis, 1980 onward. Part I: System description and data assimilation evaluation. J. Clim. 2017, 30, 6823–6850. [Google Scholar] [CrossRef]
  56. Gelaro, R.; McCarty, W.; Suarez, M.; Todling, R.; Molod, A.; Takacs, L.; Randles, C.; Darmenov, A.; Bosilovich, M.; Reichle, R.; et al. The Modern-Era Retrospective Analysis for Research and Applications, Version 2 (MERRA-2). J. Clim. 2017, 30, 5419–5454. [Google Scholar] [CrossRef]
  57. Bao, Q.; Liu, Y.; Shi, J.C.; Wu, G.X. Comparisons of Soil Moisture Datasets over the Tibetan Plateau and Application to the Simulation of Asia Summer Monsoon Onset. Adv. Atmos. Sci. 2010, 27, 303–314. [Google Scholar] [CrossRef]
  58. Kanamitsu, M.; Ebisuzaki, W.; Woollen, J.; Yang, S.; Hnilo, J.; Fiorino, M.; Potter, G. NCEP-DOE AMIP-II reanalysis (R-2). Bull. Am. Meteorol. Soc. 2002, 83, 1631–1643. [Google Scholar] [CrossRef]
  59. Kalnay, E.; Kanamitsu, M.; Kistler, R.; Collins, W.; Deaven, D.; Gandin, L.; Iredell, M.; Saha, S.; White, G.; Woollen, J.; et al. The NCEP/NCAR 40-Year Reanalysis Project. Bull. Am. Meteor. Soc. 1996, 77, 461–468. [Google Scholar] [CrossRef] [Green Version]
  60. Lamarque, J.; Bond, T.; Eyring, V.; Granier, C.; Heil, A.; Klimont, Z.; Lee, D.; Liousse, C.; Mieville, A.; Owen, B.; et al. Historical (1850–2000) gridded anthropogenic and biomass burning emissions of reactive gases and aerosols: Methodology and application. Atmos. Chem. Phys. 2010, 10, 7017–7039. [Google Scholar] [CrossRef] [Green Version]
  61. Smith, S.J.; Pitcher, H.; Wigley, T.M.L. Global and regional anthropogenic sulfur dioxide emissions. Glob. Planet. Change 2001, 29, 99–119. [Google Scholar] [CrossRef]
  62. Yang, Y.; Russell, L.M.; Lou, S.; Lamjiri, M.A.; Liu, Y.; Singh, B.; Ghan, S.J.; Richland, W.A. Changes in Sea Salt Emissions Enhance ENSO Variability. J. Clim. 2016, 29, 8575–8588. [Google Scholar] [CrossRef]
  63. Kiehl, J.; Hack, J.; Bonan, G.; Boville, B.; Williamson, D.; Rasch, P. The National Center for Atmospheric Research Community Climate Model: CCM3. J. Clim. 1998, 11, 1131–1149. [Google Scholar] [CrossRef]
  64. Li, J.P.; Feng, J.; Li, Y. A possible cause of decreasing summer rainfall in northeast Australia. Int. J. Climatol. 2011, 32, 995–1005. [Google Scholar] [CrossRef]
  65. Liu, X.; Easter, R.; Ghan, S.; Zaveri, R.; Rasch, P.; Shi, X.; Lamarque, J.; Gettelman, A.; Morrison, H.; Vitt, F.; et al. Toward a minimal representation of aerosols in climate models: Description and evaluation in the Community Atmosphere Model CAM5. Geosci. Model Dev. 2012, 5, 709–739. [Google Scholar] [CrossRef] [Green Version]
  66. Zhang, L.M.; Gong, S.L.; Padro, J.; Barrie, L. A size-segregated particle dry deposition scheme for an atmospheric aerosol module. Atmos. Environ. 2001, 35, 549–560. [Google Scholar] [CrossRef]
  67. Rasch, P.J.; Barth, M.C.; Kiehl, J.T.; Schwartz, S.E.; Benkovitz, C.M. A description of the global sulfur cycle and its controlling processes in the National Center for Atmospheric Research Community Climate Model, Version 3. J. Geophys. Res. Atmos. 2000, 105, 1367–1385. [Google Scholar] [CrossRef]
  68. Morrison, H.; Curry, J.A.; Khvorostyanov, V.I. A new double-moment microphysics parameterization for application in cloud and climate models. part I: Description. J. Atmos. Sci. 2005, 62, 1665–1677. [Google Scholar] [CrossRef]
  69. Morrison, H.; Gettelman, A. A new two-moment bulk stratiform cloud microphysics scheme in the NCAR Community Atmosphere Model (CAM3), Part I: Description and numerical tests. J. Clim. 2008, 21, 3642–3659. [Google Scholar] [CrossRef]
  70. Bretherton, C.S.; Park, S. A new moist turbulence parameterization in the community atmosphere model. J. Clim. 2009, 22, 3422–3448. [Google Scholar] [CrossRef]
  71. Park, S.; Bretherton, C. The university of washington shallow convection and moist turbulence schemes and their impact on climate simulations with the community atmosphere model. J. Clim. 2009, 22, 3449–3469. [Google Scholar] [CrossRef]
  72. Zhang, W.; Zhou, T.; Zhang, L. Wetting and greening Tibetan Plateau in early summer in recent decades. J. Geophys. Res. Atmos. 2017, 122, 11–5808. [Google Scholar] [CrossRef]
  73. Yang, Y.; Wang, H.; Smith, S.; Ma, P.; Rasch, P. Source attribution of black carbon and its direct radiative forcing in China. Atmos. Chem. Phys. 2017, 17, 4319–4336. [Google Scholar] [CrossRef] [Green Version]
  74. Gnanadesikan, A.; Scott, A.; Pradal, M.; Seviour, W.; Waugh, D. Regional Responses to Black Carbon Aerosols: The Importance of Air-Sea Interaction. J. Geophys. Res. Atmos. 2017, 122, 12–982. [Google Scholar] [CrossRef]
  75. Zhuang, B.; Liu, Q.; Wang, T.; Yin, C.; Li, S.; Xie, M.; Jiang, F.; Mao, H. Investigation on semi-direct and indirect climate effects of fossil fuel black carbon aerosol over China. Theor. Appl. Climatol. 2013, 114, 651–672. [Google Scholar] [CrossRef]
  76. Li, K.; Liao, H.; Mao, Y.; Ridley, D.A. Source sector and region contributions to concentration and direct radiative forcing of black carbon in China. Atmos. Environ. 2016, 124, 351–366. [Google Scholar] [CrossRef]
  77. He, J.; Qi, L.; Wei, J.; Chi, Y. Reinvestigations on the East Asian Subtropical Monsoon and Tropical Monsoon. Chin. J. Atmos. Sci. 2007, 31, 1257–1265. [Google Scholar]
  78. Zhang, C.; Tang, Q.; Chen, D. Recent changes in the moisture source of precipitation over the Tibetan Plateau. J. Clim. 2017, 30, 1807–1819. [Google Scholar] [CrossRef]
  79. Lin, C.; Chen, D.; Yang, K.; Ou, T. Impact of model resolution on simulating the water vapor transport through the central Himalayas: Implication for models’ wet bias over the Tibetan Plateau. Clim. Dyn. 2018, 51, 3195–3207. [Google Scholar] [CrossRef] [Green Version]
  80. Kuang, X.; Jiao, J. Review on climate change on the Tibetan Plateau during the last half century. J. Geophys. Res. Atmos. 2016, 121, 3979–4007. [Google Scholar] [CrossRef]
  81. Yang, S.; Xu, B.; Cao, J.; Zender, C.; Wang, M. Climate effect of black carbon aerosol in a Tibetan Plateau glacier. Atmos. Environ. 2015, 111, 71–78. [Google Scholar] [CrossRef] [Green Version]
  82. Yang, J.; Kang, S.; Ji, Z.; Chen, D. Modeling the Origin of Anthropogenic Black Carbon and Its Climatic Effect Over the Tibetan Plateau and Surrounding Regions. J. Geophys. Res. Atmos. 2018, 123, 671–692. [Google Scholar] [CrossRef]
  83. Reutter, P.; Su, H.; Trentmann, M.; Simmel, D.; Rose, S.; Gunthe, H.; Wernli, M.; Andreae, M.O.; Pöschl, U. Aerosol-and updraft-limited regimes of cloud droplet formation: Influence of particle number, size and hygroscopicity on the activation of cloud condensation nuclei (CCN). Atmos. Chem. Phys. 2009, 9, 7067–7080. [Google Scholar] [CrossRef] [Green Version]
Figure 1. The topography (km) of study area, red and blue rectangles correspond to the East Asian Summer monsoon (EASM) and the South Asian summer monsoon (SASM) regions, respectively.
Remotesensing 12 00231 g001
Figure 2. Evaluations of simulated summer all sky net surface radiation (W/m2), surface temperature (ST) (K) and precipitation rate (mm/day) by the Community Earth System Model (CESM) model for the period from 2001–2005. Where, (ac) are model simulations, while the (df) are derived from the data of CERES, EAR-interim and the Global Precipitation Climatology Project (GPCP), respectively. The down direction in (a) and (d) is defined as the positive value, otherwise the upward direction is defined as the negative value. The area of the Tibetan Plateau (TP) is enclosed by a black line.
Remotesensing 12 00231 g002
Figure 3. Evaluation of simulated atmospheric water vapor flux (kg/(m·s)) and column water vapor burden (kg/m2) from surface to 100 hPa by CESM model in the summer for period from 2001–2005. (a) Denotes the model simulations. (b) Derived from the NCEP. The area of TP is enclosed by a black line. The blue rectangle indicates the region of southwest vortex.
Remotesensing 12 00231 g003
Figure 4. Distributions of aerosol optical depth (AOD) and black carbon (BC) mass concentration (µg/m3) in the summer for a period from 2001 to 2005, (a,b) simulated by the CESM model. (c,d) are derived from the data of Multi-angle Imaging Spectro Radiometer (MISR) satellite observations and MERRA-2 reanalysis data sets. The area of the TP is enclosed by a black line.
Remotesensing 12 00231 g004
Figure 5. Shortwave and longwave direct radiative forcing (DRF) (W/m2) at the top of atmosphere (TOA) (a,b), in the atmosphere (d,e) and on the surface (g,h), latent heat flux (c), sensible heat flux (f) and the net heat flux (i) during the summer for period from 2001–2005. The area of the TP is enclosed by a black line. the down direction is defined as the positive value, otherwise the upward direction is defined as the negative value.
Remotesensing 12 00231 g005
Figure 6. Changes in cloud radiative forcing (W/m2) during summer for the period (2001–2005) for (a) Shortwave and (b) Longwave. The area of the TP is enclosed by a black line.
Remotesensing 12 00231 g006
Figure 7. Changes in surface temperature (K) in the summer for period from 2001 to 2005. The area of the TP is enclosed by a black line. The dots denote the changes in surface temperatures that are significant above the 90% confidence level. The blue and red rectangles denote the areas to calculate the changes in the SASM and EASM indices, respectively.
Remotesensing 12 00231 g007
Figure 8. Changes in (a) surface shortwave albedo and (b) longwave albedo.
Remotesensing 12 00231 g008
Figure 9. (a) Altitude–latitude cross-section of the changes in zonal mean air temperature (colors, K) and wind field (arrows) averaged along meridian region of 60° E–120° E in the latitude zone of 27° N–42° N in the summer for period from 2001 to 2005. (b) Same as (a) but for altitude–longitude cross-section of meridional means along latitude region of 27° N–42° N in the longitude zone of 60° E–120° E. Red rectangle indicates the area of anticyclonic circulation induced by BC.
Remotesensing 12 00231 g009
Figure 10. Changes in the (a) SASM and (b) EASM index from 2001–2005. The red and blue bars denote the simulations under the ‘ALL’ and ‘ALL-BC’ experiments, respectively.
Remotesensing 12 00231 g010
Figure 11. Effects of BC on (a) water vapor flux (kg/m/s) and (b) water vapor budget (Gt/year). The red, green, black and blue lines denote the west, east, north and south borders of the TP, respectively. The dots in (a) denote the changes in water vapor that are significant above the 90% confidence level. The purple short lines in the bar in (b) denote the error ranges from a negative to a positive standard deviation.
Remotesensing 12 00231 g011
Figure 12. Changes in precipitation rate (mm/day) over the TP. The dots denote the changes in precipitation that are significant above the 90% confidence level.
Remotesensing 12 00231 g012
Figure 13. Mechanism of BC affecting water vapor transport over the TP.
Remotesensing 12 00231 g013
Table 1. Physical and chemical schemes used in the Community Earth System Model (CESM) simulation.
Model SettingsConfigurations
Horizontal resolutions0.9° × 1.25°
Vertical resolutions30 layers from the surface to 3.64 hPa
Physical schemesUsed schemes
Radiation schemes
(Longwave, Shortwave)
Rapid radiative transfer model RRTMG
Cloud Microphysics schemeMG scheme
Cloud Macrophysics schemePark scheme
Chemical schemesUsed schemes
Aerosol schemeA 3-mode modal aerosol scheme MAM3
Aerosol data setsIPCC AR5 emissions of 2000
Dry depositionA resistance-based parameterization
Wet depositionThe wet removal routine

