Article

Measuring Surface Moisture on a Sandy Beach based on Corrected Intensity Data of a Mobile Terrestrial LiDAR

1
Department of Geography, Ghent University, Krijgslaan 281 S8, 9000 Ghent, Belgium
2
Department of Real-estate and Applied Geomatics, University College Ghent, Valentin Vaerwyckweg 1, 9000 Ghent, Belgium
3
Department of Civil Engineering, Ghent University, Technologiepark 904, 9052 Ghent, Belgium
4
Hydrology and Hydraulic Engineering, Vrije Universiteit Brussel, Pleinlaan 2, 1050 Elsene, Belgium
*
Author to whom correspondence should be addressed.
Remote Sens. 2020, 12(2), 209; https://doi.org/10.3390/rs12020209
Submission received: 25 November 2019 / Revised: 5 January 2020 / Accepted: 6 January 2020 / Published: 8 January 2020
(This article belongs to the Special Issue Remote Sensing Applications in Coastal Environment)

Abstract

:
Surface moisture plays a key role in limiting the aeolian transport on sandy beaches. However, the existing measurement techniques cannot adequately characterize the spatial and temporal distribution of the beach surface moisture. In this study, a mobile terrestrial LiDAR (MTL) is demonstrated as a promising method to detect the beach surface moisture using a phase-based Z&F/Leica HDS6100 laser scanner mounted on an all-terrain vehicle. Firstly, two sets of indoor calibration experiments were conducted so as to comprehensively investigate the effect of distance, incidence angle and sand moisture contents on the backscattered intensity by means of sand samples with an average grain diameter of 0.12 mm. A moisture estimation model was developed which eliminated the effects of the incidence angle and distance (it only relates to the target surface reflectance). The experimental results reveal both the distance and incidence angle influencing the backscattered intensity of the sand samples. The standard error of the moisture model amounts to 2.0% moisture, which is considerably lower than the results of the photographic method. Moreover, a field measurement was conducted using the MTL system on a sandy beach in Belgium. The accuracy and robustness of the beach surface moisture derived from the MTL data was evaluated. The results show that the MTL is a highly suitable technique to accurately and robustly measure the surface moisture variations on a sandy beach with an ultra-high spatial resolution (centimeter-level) in a short time span (12 × 200 m per minute).

Graphical Abstract

1. Introduction

The measurement of surface moisture on a beach is a fundamental component of field studies that seek to model the aeolian transport from the beach (which contributes to dune growth and recovery after erosion from storm-wave processes) [1,2,3,4,5,6,7,8,9], or investigate the distribution of the beach groundwater [10,11,12,13]. However, the surface moisture is determined by complex hydraulics of tidal and wave action, groundwater and capillary flow, and evaporation and precipitation. As a result, the distribution of surface moisture can vary greatly over space and time [14]. This requires measuring techniques to adequately detect the surface moisture on a substantial beach section and over timescales of seconds to months [15]. The techniques which have been used for measuring the beach surface moisture could generally be classified into three approaches: (a) soil moisture probes, (b) sample gravimetric method, (c) the optical remote sensing methods. The soil moisture probes are mainly applied to detect the near-surface moisture through inserting probes in the sand rather than the actual top surface, which is most important for the aeolian sand transport [1,2,3,4,10,16,17,18,19]. Although the probes could be modified to reduce the sampling depth, their measurement results overestimate the actual surface moisture by an average of 2.5% and 4.4% gravimetric moisture contents for the 1.5 cm and 6 cm sampling depths respectively, according to [1]. By means of the sample gravimetric method, one needs to collect sand samples from the beach surface (i.e., 5 mm thickness) for a laboratory analysis. After drying the samples, one determines the gravimetric moisture contents by calculating the difference between the wet and dry samples [1,5,8,20]. While it is time-consuming to sample the moisture contents across large areas with a detailed resolution, this method is more accurate than the soil moisture probes. Secondly, the ability to repetitively sample at the exact same location is compromised due to the surface destruction of sampling sites, which restrict the utility of this approach for many applications (e.g., an analysis of temporal variation in the surface moisture).
Instead of using destructive/disturbing and time-consuming methods, the optical remote sensing method holds great promise with a faster and repeatable detection of the real surface moisture [1]. This approach is based on the principle that wet sand darkens upon wetting because of a reduced reflectance and there are at least two different theoretical hypotheses explaining this phenomenon. The first hypothesis is the reasoning that the total internal reflection within water films surrounding the sand grains decreases the sand reflectance [14,21,22]. Another explanation is that the relative index of the refraction between water and sand is lower than the one between air and sand. As with the case of internal reflection, this increases the interaction of light with sand and results in more light absorption by the sand [23,24]. Philpot [25] attributed the darkening of wetted soil to multiple mechanisms and believed this two fundamental explanations are both important. Several studies employed the optical remote sensing techniques so as to calculate the beach surface moisture by relating the beach surface brightness derived from digital cameras to the surface moisture contents [9,15,26,27,28,29]. However, this technique only works during daylight hours and requires careful control for changing illumination. In addition, the accuracy level of the approach is comparatively small, with the lowest standard error of 3–4% moisture [15,30]. According to [23,25], the reliance on the visible wavelengths is the main contributing factor to the low accuracy in these cases. Once the pore water surrounding the sand grains is sufficient to cover the sand grains, the increasing moisture contents no longer have a significant impact on the surface reflectance. The infrared wavelengths are considered to have better characteristics than the visible wavelengths for determining the moisture contents of the beach surface due to a stronger absorption of the light energy by water. Using infrared spectroscopy, a portable narrow band radiometer ( λ = 1940 nm) [30] and a spectroradiometer ( λ = 970 nm) [1] were tested for measuring the beach surface moisture, the standard error of the narrow band radiometer averaged to about 1% moisture, which is comparable to the gravimetric moisture contents determined from the 1.5 mm deep surface scrapes. While the narrow band radiometer slightly outperforms the spectroradiometer [30], the two instruments are still time-consuming to deploy on a large spatial scale.
Terrestrial laser scanning (TLS) is a more convenient remote sensing technique for measuring beach surface moisture, which records both the target position and backscattered intensity of the beach surface. Because the TLS is an active sensor, it can scan the beach repetitively without correction for changes in illumination [7,31,32,33,34]. Based on the LiDAR equation, the backscattered intensity is a function of the beach surface properties and scanning geometry, which can be calibrated to the beach surface moisture when the other surface properties remain constant (e.g., the mineral composition, grain size distribution, packing density and surface roughness) [14,33,35,36,37,38,39]. The potential of terrestrial laser scanning was first demonstrated for measuring the beach surface moisture by [7,31,32], where a Leica Scanstation 2 with a wavelength of 532 nm was used to quantify the relation between the beach surface moisture contents and the TLS backscattered intensity. The experimental results revealed that the latter could discriminate within 1–2% gravimetric moisture contents in the moisture below 7% [32]. The same principle was tested by [33] and [34] with a RIEGL VZ-400 on a sandy beach, where the RIEGL VZ-400 is a laser scanner with a higher moisture sensitivity utilizing a 1550 nm wavelength. A robust negative relation between the beach surface reflectance and surface moisture was found for the full range of possible surface moisture contents (0–25%) with a standard error of 2.7% moisture. However, because of the existence of intensity reducing in the near-distance, only the intensity values within 20 to 60 m were used. In addition, the intensity values were only corrected by a factor of 1 / R 2 and the impact of incidence angles was ignored [33]. For the sandy beach of (very) fine sand (grain diameter < 0.25 mm), the roughness level of the beach surface is comparatively low and thus the effects of the incidence angles (especially when > 60°) on the backscattered intensity should also be taken into account.
Here, we examine the suitability of a mobile terrestrial LiDAR (MTL) to measure the sandy beach surface moisture, where a red laser scanner Z&F/Leica HDS6100 ( λ = 650–690 nm) was mounted on an all-terrain vehicle. Although the most notable absorption peaks of light in water occur at the infrared wavelengths (e.g., 760, 970, 1200, 1470 and 1940 nm), there are still two small absorption peaks visible between the wavelengths 650 nm and 690 nm [14]. In this study, two sets of indoor calibration experiments were conducted in order to investigate the effect of the distance, incidence angles and sand moisture contents on the backscattered intensity in detail using the Z&F/Leica HDS6100, where the moisture contents of sand samples vary from 0% to 25%, the incidence angles from 0° to 80° and the scanning distance from 1 to 20 m. Afterwards, a moisture estimation model was developed so as to correct the influence of the incidence angles and distance on the backscattered intensity and to relate the corrected intensity values to the sand moisture contents. At last, a field measurement was carried out using the MTL system on a Belgian beach with very fine sand (and the accuracy and robustness of the derived beach surface moisture from the MTL data was evaluated). We also explored how the derived surface moisture from the MTL data could be utilized to compute the variation on the beach surface moisture with a high spatial and temporal resolution. We start with a theoretical introduction on the manner in which the distance, incidence angles and sand moisture contents’ impact on the backscattered intensity should be quantified, followed by the indoor calibration experiments and data processing.

2. Theory

2.1. Surface Moisture-Reflectance Models

The surface reflectance of a sandy beach depends predominantly on its surface moisture contents, assuming that other surface properties such as the mineral composition, grain size distribution, packing density and surface roughness are relatively constant. Hence, it is possible to quantify the relation between the beach surface moisture and its reflectance [14,33,35,36,37,38,39,40]. The interaction between the incident light and wetted sand is a complex optical phenomenon which encompasses reflection, refraction and diffraction. It is determined by the light’s wavelength, incidence angle and optical properties of the medium [14,41]. Based on the hypothesis of Philpot, a light portion is directly reflected from the surface water film of saturated sand (path R 1 ), as shown in Figure 1. The remaining fraction of the incidental light is transmitted through the water surface and is subject to reflection from the sand grains and absorption by the water (path R 2 ).
Philpot [25] proposed an exponential model to express the effect of various moisture conditions on the soil surface reflectance (Equation (1)), which is also applicable to describe the relation between the sand surface moisture and its reflectance. Several previous studies also used exponential models [14,15,23,42,43] but the meaning of coefficients and variables are not exactly the same. The exponential model as proposed by Philpot is given by
ρ = f w ρ w + ( 1 f w ) ρ s e α d
where   ρ , ρ w and ρ s denote the total reflectance, the Fresnel reflectance from the water surface and the reflectance from sand grains, respectively. f w is a fraction which describes the contribution of the water surface reflection to the total reflectance. d is the optical path length of light through the pore water which describes the contribution of the water absorption to the reduction of reflectance, and α (a negative value) represents the wavelength dependent absorption coefficient for liquid water. In the special case of absence of surface water, f w equals zero and a simplified reflectance expression would be
ρ = ρ s e α d
Here, only the reflection from sand grains and pore water absorption have an impact on the final reflectance. According to the study findings of [14,25], the optical path length d increases almost linearly upon the soil wetting. We try to describe d with = b M , b and M demonstrating the slope coefficient and the moisture contents in sand respectively. When the optical path length d = 0 , the reflectance ρ is equal to the ρ s . Furthermore, based on the LiDAR equation [44,45], the backscattered intensity is proportional to the spectral reflectance of the target surface. We try to describe the backscattered intensity   I with = k ρ , where k represents the slope coefficient. Thus, the Equation (2) could be modified as
I = k ρ s e α b M
setting δ 0 = k ρ s and c = α b , the Equation (3) could be expressed as
I = δ 0 e c M
where parameters δ 0 and c are two constants for a fixed laser wavelength and sand type and their values can be obtained by means of a regression analysis.

2.2. Correction of the Backscattered Intensity

In this study, a simplified LiDAR formula is adopted to explain the effect of the distance, incidence angle and surface reflectance on the backscattered intensity. As given by
I = ρ cos θ R 2 C
where I shows the backscattered intensity, ρ stands for the reflectance of the target’s surface, θ is the incidence angle and R denotes the range. The parameter C describes the system and the atmospheric factor. Numerous studies [33,39,45,46,47,48] revealed that the original backscattered intensity is inapplicable to discriminate the target surface properties directly. The radiometric correction is necessary to eliminate the impact of the distance and incidence angle on the intensity data and to convert the raw intensity into a corrected value that is proportional or equal to the target’s reflectance [39,45,46,49,50,51,52,53,54,55,56,57,58,59,60,61]. However, regarding the distance effect, due to the possible existence of automatic reducers for the near-distance backscattered signals and amplifiers for weak backscattered signals [46,62], only the part of the intensity data within a specific distance follows the theoretical LiDAR formula [39,48,61,63] and can be corrected effectively through 1 / R 2   [33,34]. On the other hand, the effect of the incidence angle is mainly related to the target surface properties and surface irregularities [35,39,64,65] and the cosine law is the most common method to rectify the effect of the incidence angles on the backscattered intensity [45]. Tan [47] proposed an empirical method in order to rectify the impact of the incidence angle using four standard Lambertian targets. However, considering the possible differences between the standard Lambertian targets and the real sand surface, the empirical method should be investigated by means of real sand samples at various incidence angles. However, few studies [35,39,65] investigated the effect of the incidence angle (from 0° to 40°) on the TLS intensity using sandblasting sand samples of two different grain sizes (0.1–0.6 mm and 0.5–1.2 mm). Nield [32] and Smit [33] believe that the influence of the incidence angle could be ignored when detecting the sandy beach surface moisture using TLS. It is noteworthy that the roughness level of the beach surface is comparatively lower in this study due to the smaller grain size, which means that the effect of the incidence angle on the backscattered intensity increases. Moreover, the height of the MTL scanner used in this study is merely about 1.75 m, where the incidence angle exceeds 81° at a corresponding scanning distance of 12 m. Thus, the impact of incidence angles should also be taken into account. In this study, an empirical correction method is adopted using sand collected from the selected research area. Based on the LiDAR formula, the effects of the distance and incidence angle on the intensity are independent from each other and could be corrected separately by a regression analysis [46,47,58,59,60,65]. The original backscattered intensity I can be expressed as [46,47,58,59,60]
I = F 1 ( ρ ) · F 2 ( cos θ ) · F 3 ( R )
where F 1 , F 2 and F 3 represent a function of the target reflectance ρ , the cosine of the incidence angle cos θ and the distance from the laser scanner R respectively and 0     cos θ     1 , R m i n     R     R m a x ( R m i n   and R m a x denote the minimum and maximum distance that the TLS could detect respectively). According to the Weierstrass approximation theorem, a continuous function on a closed interval can be approximated by a polynomial series [47]. Therefore, the functions F 2 and F 3 can be expressed by a polynomial. Combining Equations (4) and (6) generates:
I = δ 0 e c M · i = 0 N 2 [ β i ( cos θ ) i ]   · i = 0 N 3 ( γ i R i )
with
{ F 1 ( ρ ) =   δ 0 e c M   F 2 ( cos θ ) = i = 0 N 2 [ β i ( cos θ ) i ]   F 3 ( R ) =   i = 0 N 3 ( γ i R i )
where N 2 and N 3 denote the degree of the polynomials and β i and γ i are the polynomial coefficients. In previous studies, the intensity correction normally converts the original intensity into a corrected value that is proportional or equal to the target reflectance [46,47,58,59,60]. In this study, we directly convert the original intensity into the target moisture contents, which are also independent of the scanning distance and incidence angle but exponentially correlate to the target reflectance. Therefore, the function of the target moisture contents M can be described by
M = 1 c l n ( I δ 0 ( i = 0 N 2 [ β i ( cos θ ) i ] · i = 0 N 3 ( γ i R i ) ) )
For the determination of the parameters of Equation (8), a number of indoor calibration experiments were conducted using the sand samples. The principle is similar to the methods in [46,47,59] but in the calibration experiments commercial target panels of known reflectance were adopted rather than natural targets. In order to estimate the parameters of function F 1 ( ρ ) , the incidence angle and scanning distance of the target samples should be unchanged, while the moisture contents of the samples vary in the indoor experiments. In these conditions, F 2 ( cos θ ) and F 3 ( R ) are considered as two constants, setting c 1 = F 2 ( cos θ ) · F 3 ( R ) and the intensity is merely related to the moisture contents M expressed as
I = c 1 δ 0 e c M
Through a least-squares fit, the values of c 1 δ 0 and c can be estimated. To reduce random errors, several sets of c 1 δ 0 and c should be considered, defining a total average of c as the final parameter of the function F 1 ( ρ ) . Similarly, to estimate the parameters of the polynomial F 2 ( cos θ ) , the target samples should be scanned at various incidence angles, keeping the moisture and distance constant. In these conditions, F 1 ( ρ ) and F 3 ( R ) are two constants, setting c 2 = F 1 ( ρ ) · F 3 ( R ) . The intensity level I can be expressed as
I = c 2 i = 0 N 2 [ β i ( cos θ ) i ]
the value c 2 β i could be obtained by a least-squares fit. The value of N 2 is determined to maintain a balance of the simplicity and accuracy of the model. Setting the coefficient of the highest degree β N 2 = 1 resulted in c 2 = c 2 β N 2 and β i = c 2 β i / c 2 . The average of β i is calculated as the final polynomial coefficients of F 2 ( cos θ ) based on several sets of incidence angle experiments. Similarly, setting c 3 = F 1 ( ρ ) · F 2 ( cos θ ) , the intensity value I can be expressed as Equation (12). The parameters of the polynomial F 3 ( R ) can be estimated based on the distance control experiments where the target samples are scanned at a variable distance but with a constant moisture level and incidence angle.
I =   c 3 i = 0 N 3 ( γ i R i )
After estimating the parameters F 1 ( ρ ) , F 2 ( cos θ ) and F 3 ( R ) , the intensity value I can be expressed as
I = K e c M · i = 0 N 2 [ β i ( cos θ ) i ] ·   i = 0 N 3 ( γ i R i )
The value of K can be obtained by substituting the intensity data obtained from the calibration experiments and the known values of the incidence angles, distance and moisture contents into the Equation (13) and then determining the average of K. The final function of the target moisture contents M can be expressed as
M = 1 c l n ( I K ( i = 0 N 2 [ β i ( cos θ ) i ] ·   i = 0 N 3 ( γ i R i ) ) )
It is noteworthy that Equation (14) not only derives the target moisture contents but it also eliminates the effects of the incidence angles and distance at the same time. In previous studies [7,31,32,33,34], the intensity correction and target moisture derivation were mostly conducted in two steps, which can contribute to additional errors. In terms of the calculation of the incidence angle, we conduct a plane-fitting with the adjacent points surrounding the target points and then obtain the normal vector of the fitted planes. The equation of the incidence angle is expressed as
cos θ = | v p s · v n R |
where v p s and v n denote the vectors from the target points to the scanner centre and the normal vectors of the fitted planes respectively. R represents the distance between the target points and the scanner centre. The length of the normal vector v n is equal to 1.

3. Indoor Calibration Experiments

3.1. Terrestrial Laser Scanner

A phase-based laser scanner Z&F/Leica HDS6100 was used in the indoor calibration experiments, with the main parameters listed in Table 1. It utilizes a red laser with a sampling frequency of up to 508,000 points/second and a position accuracy of 5 mm within a 1–25 m range. Its scan density is up to 1.6 × 1.6 mm at a 10 m distance and 4.0 × 4.0 mm at 25 m for the ‘ultra-high’ density mode; 6.3 × 6.3 mm at 10 m and 15.9 × 15.9 mm at 25 m for the ‘high density’ mode. In this study, we adopt the ultra-high density mode for the indoor calibration experiments and the high density mode for the field beach measurements. The point cloud data are recorded in the form of x, y and z coordinates and the intensity of the return signal. Raw intensity values are stored as dimensionless numbers to denote the target reference level and do not have any physical meaning. It should be noted that the Z&F/Leica HDS6100 can theoretically measure distances up to 50 m at 18% albedo but in actual scans, the maximum measured distance measures considerably less than 50 m, especially on a wet beach.

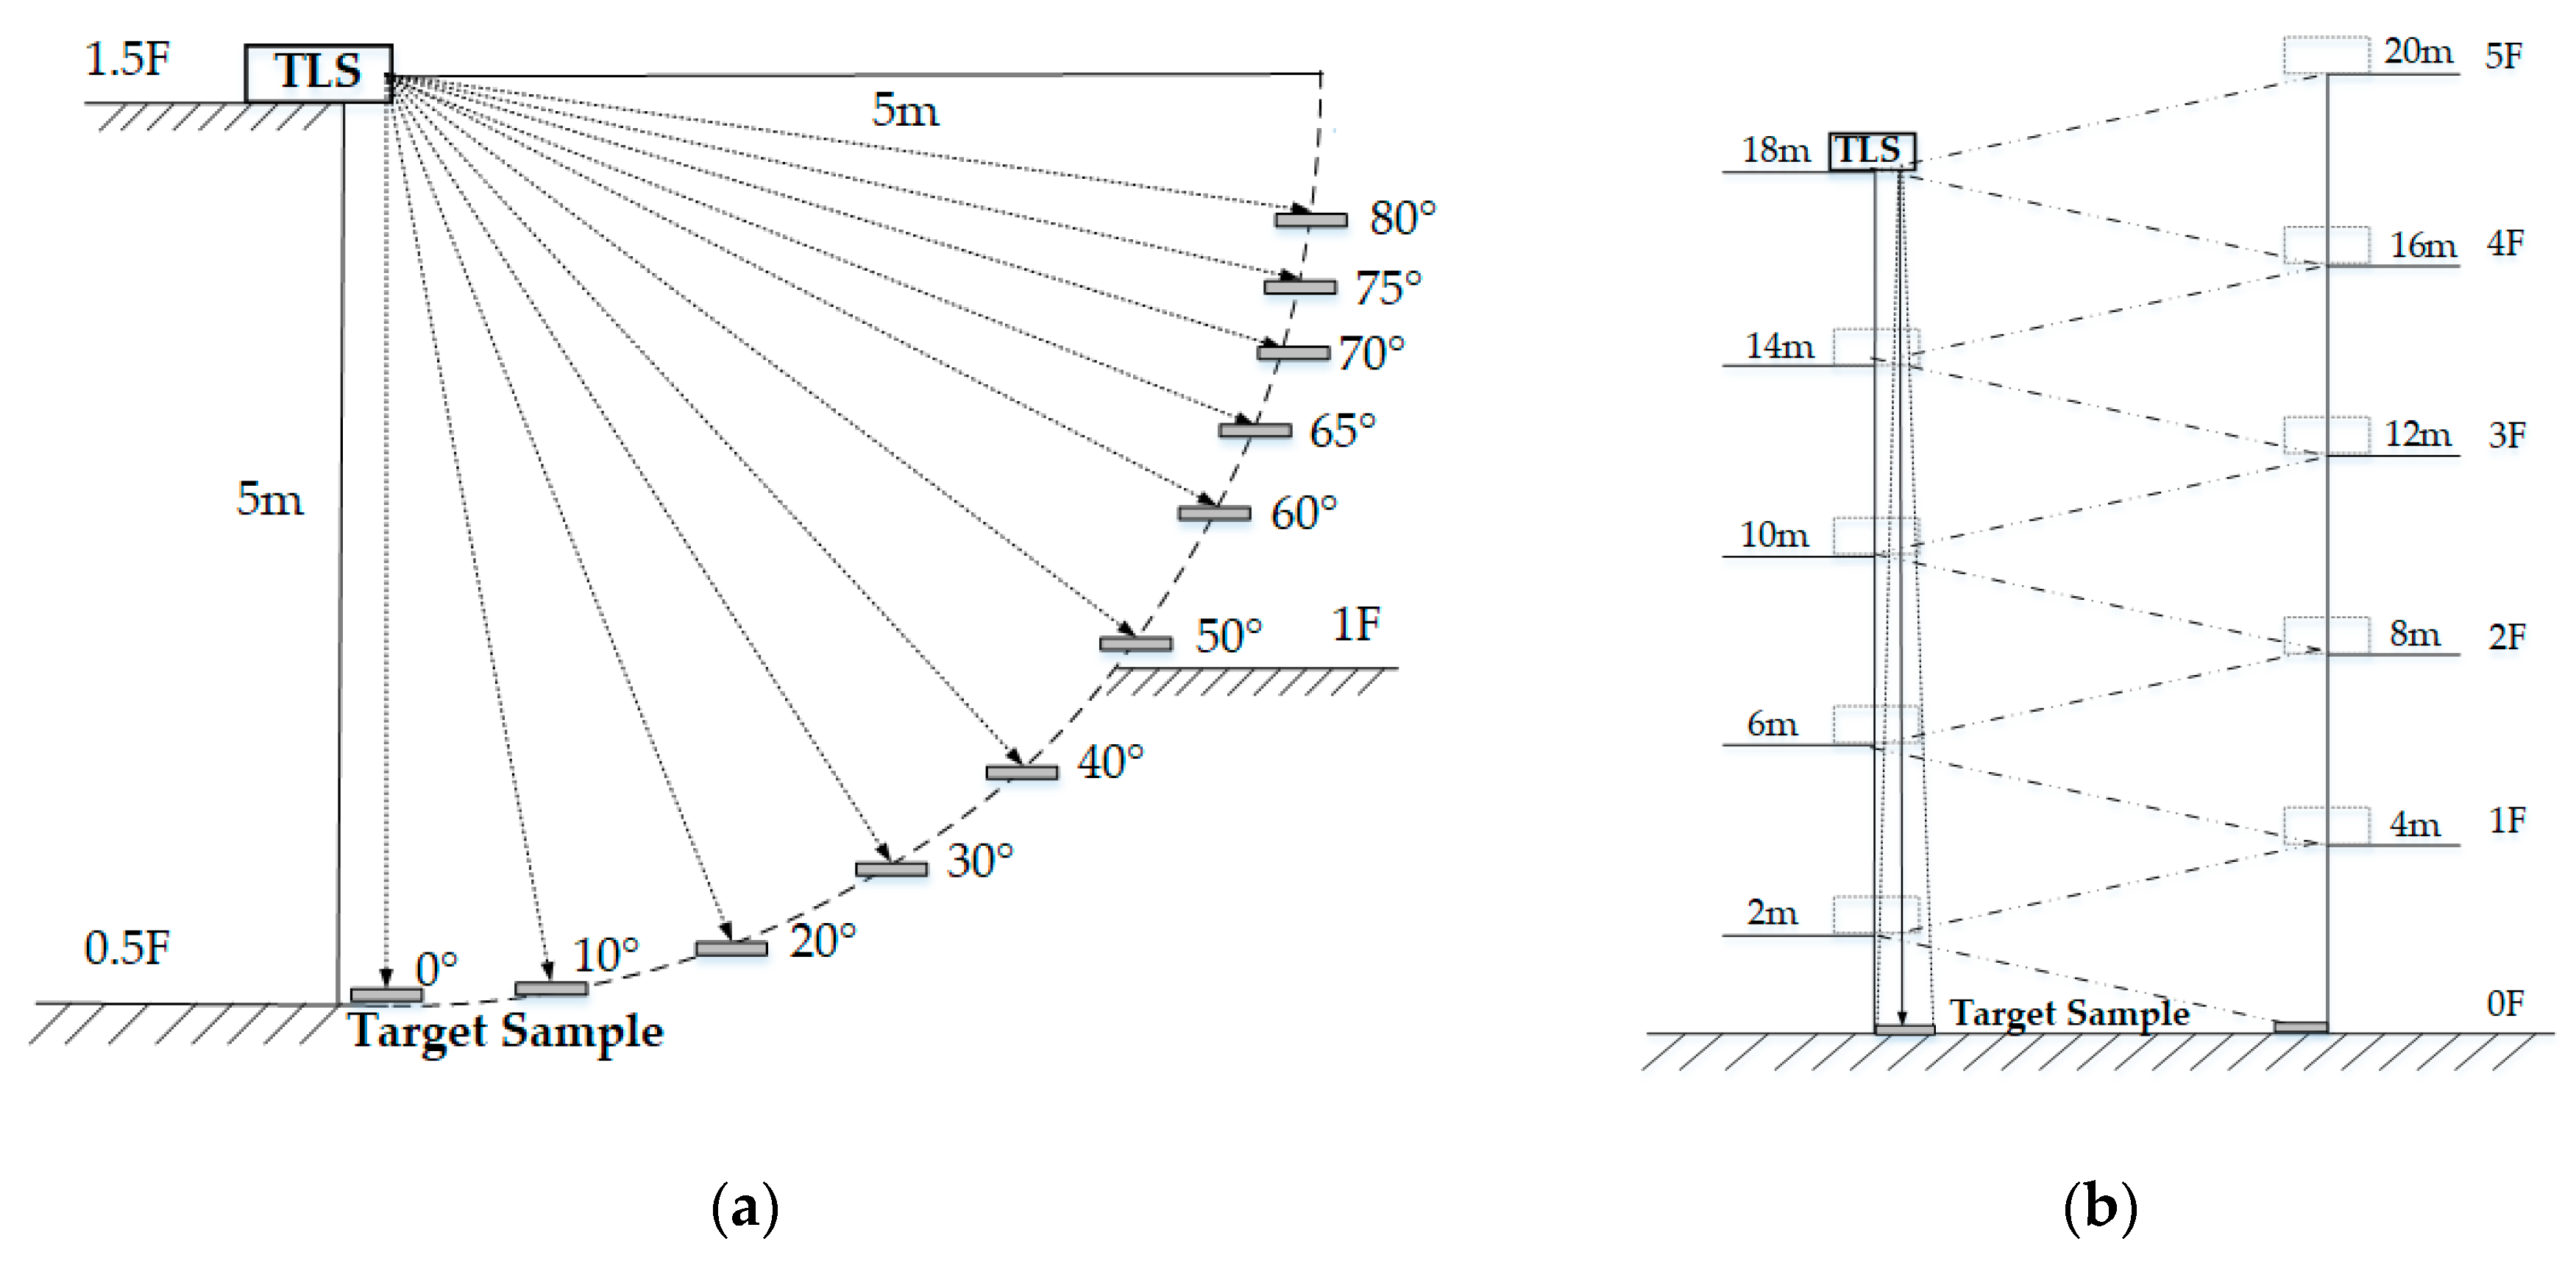
3.2. Incidence Angle Experiments

Several studies have investigated the relation between the surface reflectance and moisture contents in sand or soil over the full range of the gravimetric moisture contents (0–25%) [14,17,19,29]. However, few studies [31,35,61] investigated the effect of various incidence angles (0–40°) on the sand surface reflectance at a fixed TLS scanning distance, because it is hard to avoid disturbing the surface of the sand samples due to movement of dry sand and flowing of water inside the sand samples. In this study, we placed the sand samples horizontally by means of the specific structure of an indoor staircase. As shown in Figure 2a, the laser scanner was placed on the stair landing of a staircase. Eleven black platforms were horizontally fixed at the stairs, using triangle brackets which had the same distance (5 m) from the scanner centre but various incidence angles ranging from 0 to 80° in steps of 10°, supplemented with 2 platforms at 65 and 75°. The black platforms avoid the disturbing influence of the environmental lightning on the backscattered intensity signal, the positions and levelness were checked by a pre-scanning. The sand used in these experiments were collected from the study area of Groenendijk beach (Koksijde, Belgium) and was oven dried at 105 °C for 24 hours before executing the experiments. The sand grain size was analyzed by a sieving device which sorts the sand particles according to their size. Once the sand is sieved, it is weighed and the ratio of the total weight is computed. The final results show the grain size distribution of the sand used in this study, which is a mixture of very fine sand (70.5%), fine sand (26.6%), medium sand (2%) and coarse sand (0.3%) with an average sand grain diameter of 0.12 mm.
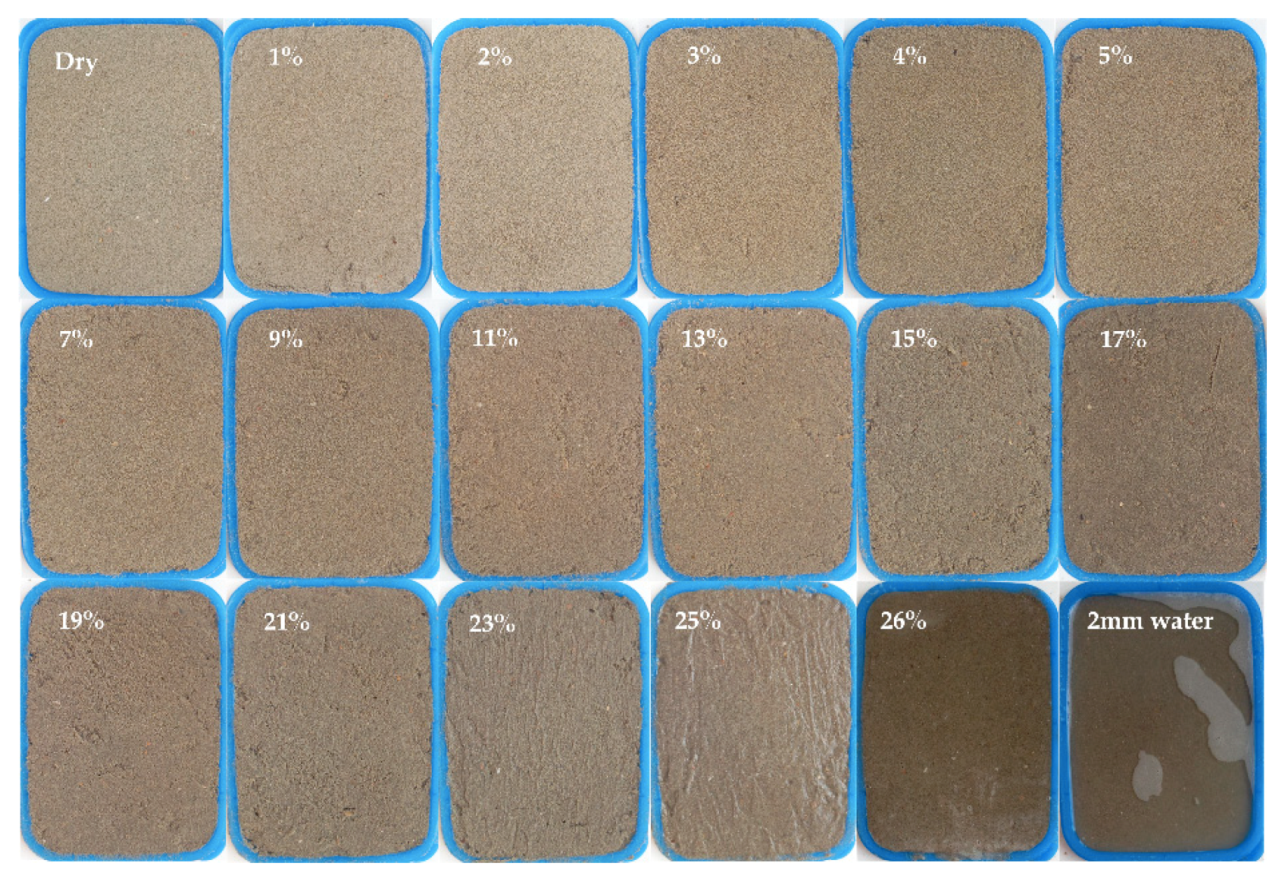
For each scan, a certain weight of dry sand was mixed with a certain weight of pure water and then carefully put in a 5 mm depth plastic container that was laid on each of the eleven horizontal platforms. As shown in Figure 3, in the experiment of the incidence angles, the gravimetric moisture contents of the samples includes 0%, 1%, 2%, 3%, 4%, 5% and then, in steps of 2%, up from a 7% to a 25% moisture. In order to test the reflection of the surface water film of saturated sand, two additional sand samples (the sample of 26% moisture and the sample with a 2 mm water layer) were scanned too. The samples were weighed using an electronic scale with a milligram precision. According to the studies of [35,53,64], the roughness and irregularity of the natural target surface plays a key role in the incidence angle effect. In this study, in order to approximate the real irregularity level of a sandy beach surface, a scraper was used to flat the sand surface by means of gently removing the overflow sand from the plastic containers. A total of 18 scans were executed.

3.3. Distance Experiments

Numerous studies [39,46,47,53,65] investigated the effect of the TLS scanning distance on the target surface intensity using standard reflectance panels. However, to our knowledge, no study has investigated the distance effect on the backscattered intensity by means of sand samples of various moisture contents. In this study, a distance experiment was conducted using the sand samples whose moisture contents ranged from 0% to 25% moisture.
As shown in Figure 2b, the target sand samples were placed on the ground level. Through setting up the scanner at different floors, the distance from the scanner centre to the target samples varied in 1 m increments from 1 to 4 m and then in 2 m increments from 6 to 20 m, the incidence angle was kept constant at a normal incidence. Each time the scanner setup was established at a new height, a pre-scanning was conducted to check the distance to the target samples, then the heights of the target samples were fine-tuned to meet the designed scanning distances. Based on the prior experiments of beach scanning using Z&F/Leica HDS6100, the effective maximum scanning range on the wet beach amounted to approximately 12 m with a scanner height of 1.75 m. Considering that the goal of the calibration experiments is the application of the MTL on the beach, longer-distance experiments were not conducted. The preparation process of the sand samples is similar to the experiment of the incidence angles. At each scanner position, 16 sand samples with different moisture contents were scanned in turn and then the scanner moved to the next floor. A total of 192 scans were executed.

4. Results

4.1. Experimental Data Analysis

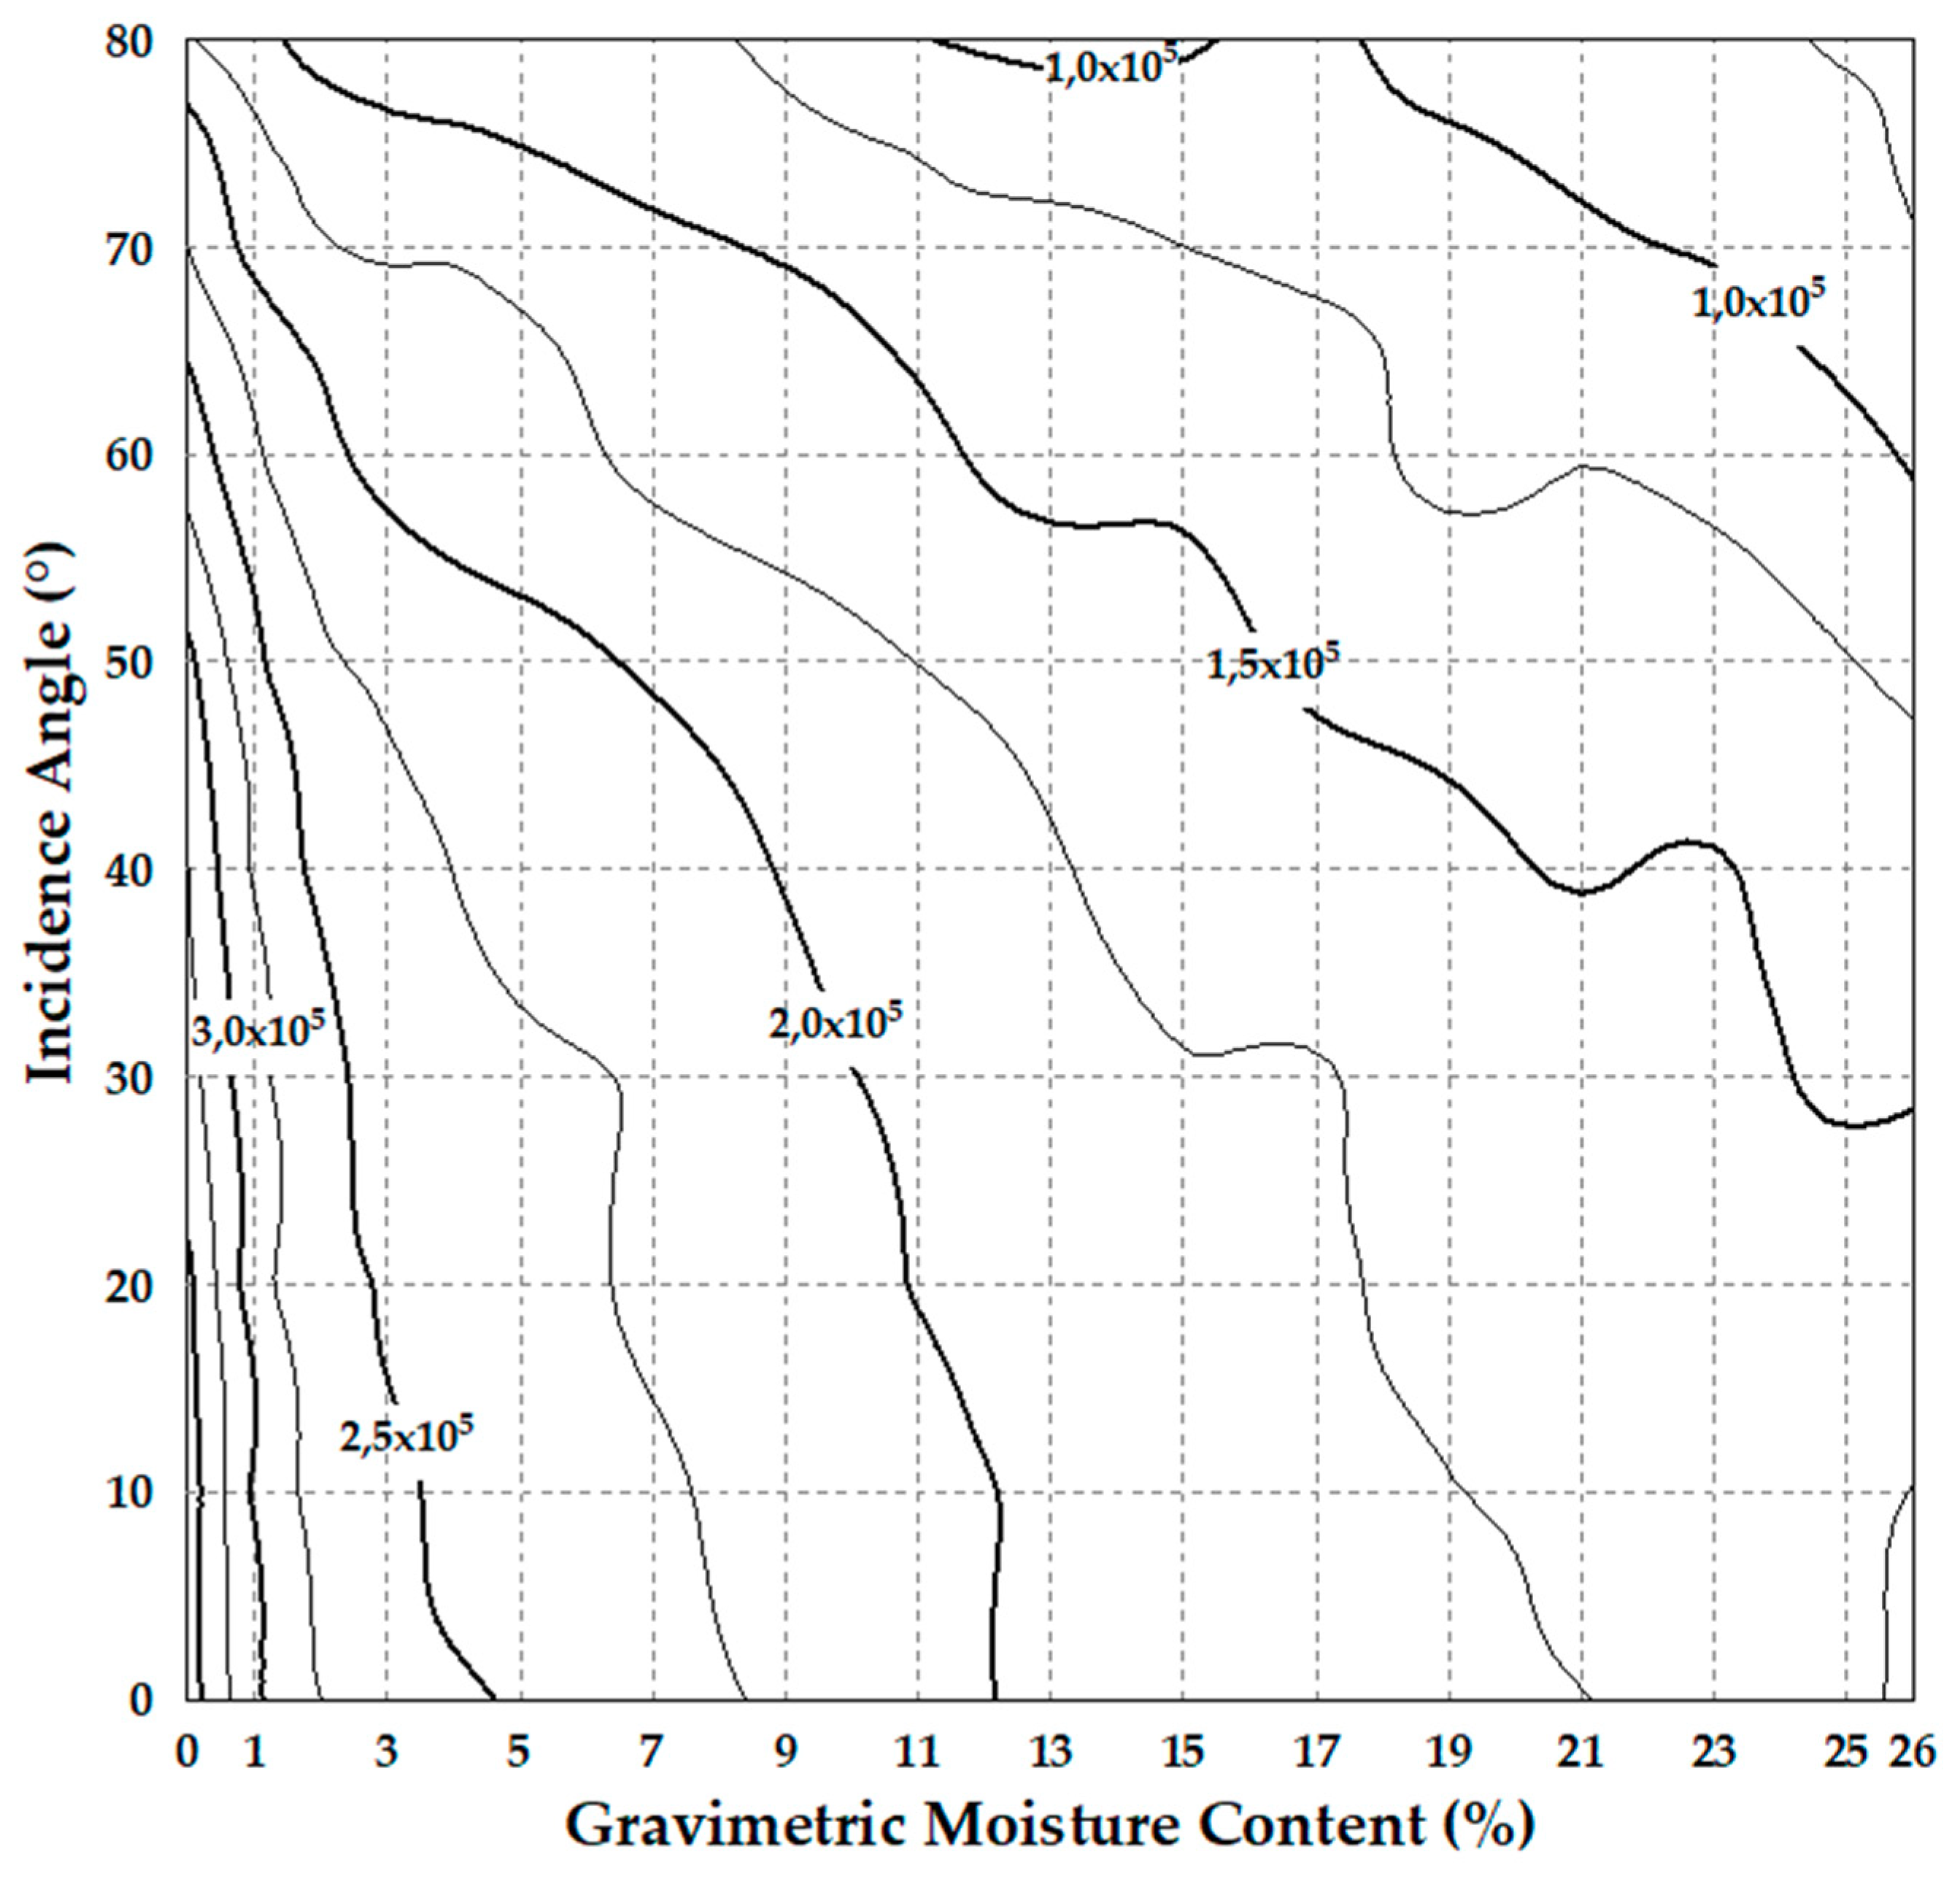
After executing the indoor calibration experiments, the point clouds were manually sampled over the centre area (5 × 5 cm) of each plastic container using CloudCompare v2.11, the average intensity of each sample was calculated for the subsequent analysis. The effect of the incidence angle on the intensity is presented in Figure 4. One could notice that the overall decreasing trend of the original intensity upon the increasing incidence angle is similar for different moisture contents, with, as expected, the dry sand sample showing the highest intensities. The value of the original intensity decreases slightly with the increasing incidence angles from 0° to 30°, which is similar to the results in [65] and then declines gradually until 80°. Comparing with the experiments of [35,39,65], the incidence angle effect on the original intensity of TLS seems to be more significant in this study. A possible reason is the grain size of the sand used in this study, which is comparatively smaller. Consequently, the incidence angle effect should be eliminated for a further exploitation of the intensity data. On the other hand, the overall trend of the original intensity data upon the increasing gravimetric moisture contents is almost the same for different incidence angle from 0° to 80° and the impact of the sand moisture contents on the backscattered intensity seems to follow the exponential model Equation (4), which is similar to the findings of the studies [14,33,53]. The intensity values initially decrease dramatically from 0% to 3%. This means that a little water inside the sand samples has a huge effect on the backscattered intensity of the TLS. Beyond a 3% moisture, the intensity value decreases more gradually from 3% to 26%. Therefore, we could draw the conclusion that the intensity data of the Z&F/Leica HDS6100 have potential to discriminate the sand moisture contents for a full range of 0% to 25 % when scanning at non-normal incidence angles. It is noteworthy that the intensity evolution in the incidence angles near 80° fluctuate due to the decreased point density.
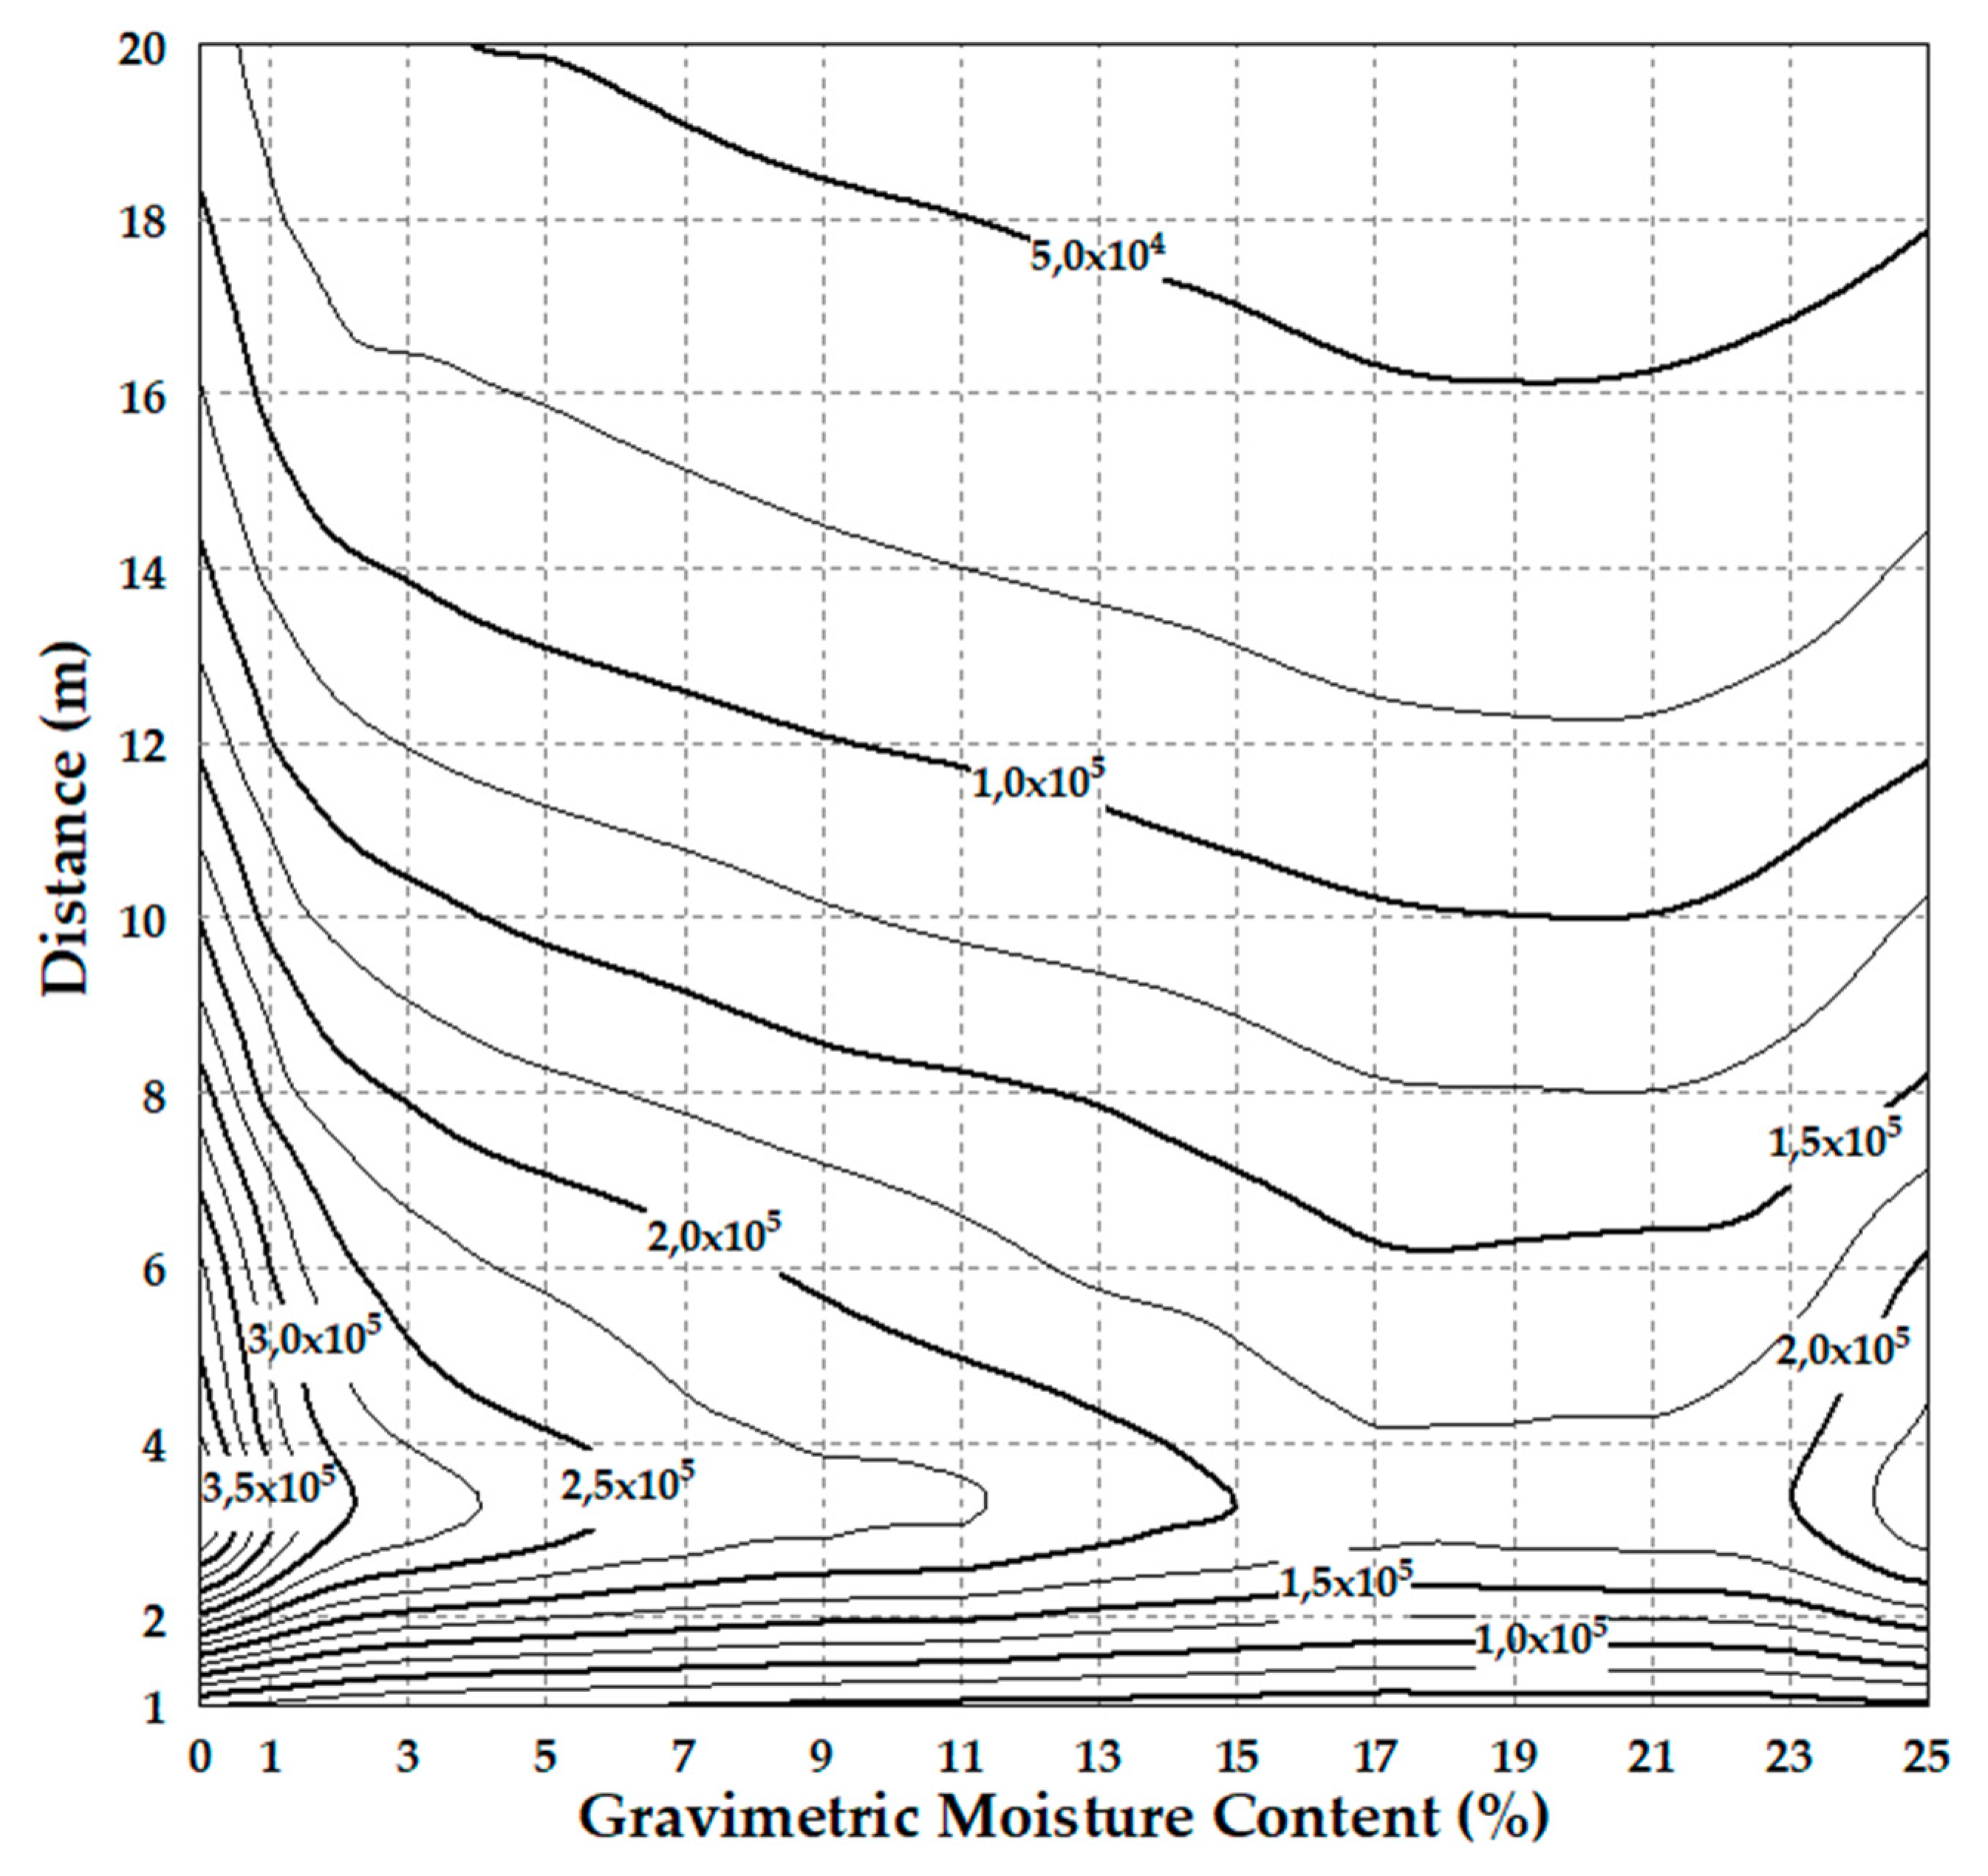
The effect of the distance on the intensity is presented in Figure 5. Initially, the original intensity increases drastically and reaches the intensity peak at about 3 m. Afterwards, the intensity decreases gradually until 20 m. Therefore, the intensity trend upon the increasing scanning distance does not follow the LiDAR formula. Similar trends were observed in the studies of [39,45,47,65] and the most probable reason is the effect of the near-distance reducers of TLS. In the studies [33,34], only the intensity data of a specific distance following the LiDAR formula were adopted and corrected by 1 / R 2 to fit the curve of the beach surface moisture. In this study, the intensity data from the distance below 3 m, which do not follow the LiDAR formula, were also drawn.
The overall trend (of the original intensity data upon the increasing sand moisture) is similar at different scanning distance from 1 to 20 m. Comparing with the results of the incidence angle experiments in Figure 4, an obvious difference includes the fact that the intensity values have been increasing gradually from 21% to 25%. The reflection of the surface water film coating upon the sand grains is considered to contribute to this phenomenon. More obvious evidence is the original backscattered intensity of the sand sample with a 2 mm water layer (in the additional incidence angles experiments, not presented in Figure 6), which peaked at 249 × 104, which is factor 7 above the intensity value of dry sand at a normal incidence angle. This means that the effect of the sand moisture contents on the backscattered intensity of the TLS does not completely follow the exponential model of the Equation (4) when scanning orthogonally.

4.2. Moisture Estimation

The surface moisture of the sand samples was estimated according to Equation (14). Before the parameter estimation, the intensity value of the dry sand scanned from 5 m and 70° had been normalized to 1. Considering the height of the MTL scanner used in the beach measurement, which is merely about 1.75 m where the effective scanning range measures from about 2 to 12 m with incidence angles varying from about 30 to 80°. Only this part of the experimental data was adopted to fit the best moisture model parameters for the next usage of the MTL data in this study. On the other hand, based on the analysis in Section 4.1, the intensity data of a 23% and a 25% moisture (when scanning at normal incidence) obviously do not follow the exponential model and were therefore not adopted to estimate the parameters. Based on the method introduced in Section 2, a first-degree polynomial and a fifth-degree polynomial were adopted to fit the F 2 ( cos θ ) and F 3 ( R ) , respectively, after testing different degrees of polynomials. Afterwards, the parameters of F 1 ( ρ ) ,   F 2 ( cos θ ) and F 3 ( R ) were estimated by the least-squares adjustment with the mean correlation-coefficient square ( R 2 ) 0.90 ± 0.05, 0.98 ± 0.01 and 0.99 ± 0.003 respectively. Finally, the mean values of these parameters were calculated (see Table 2) and after obtaining the average of K , the surface moisture of the sand samples could be calculated based on Equation (14). If the derived moisture values were negative, we set them to zero. The process of the moisture estimation was executed in MATLAB 2014a.
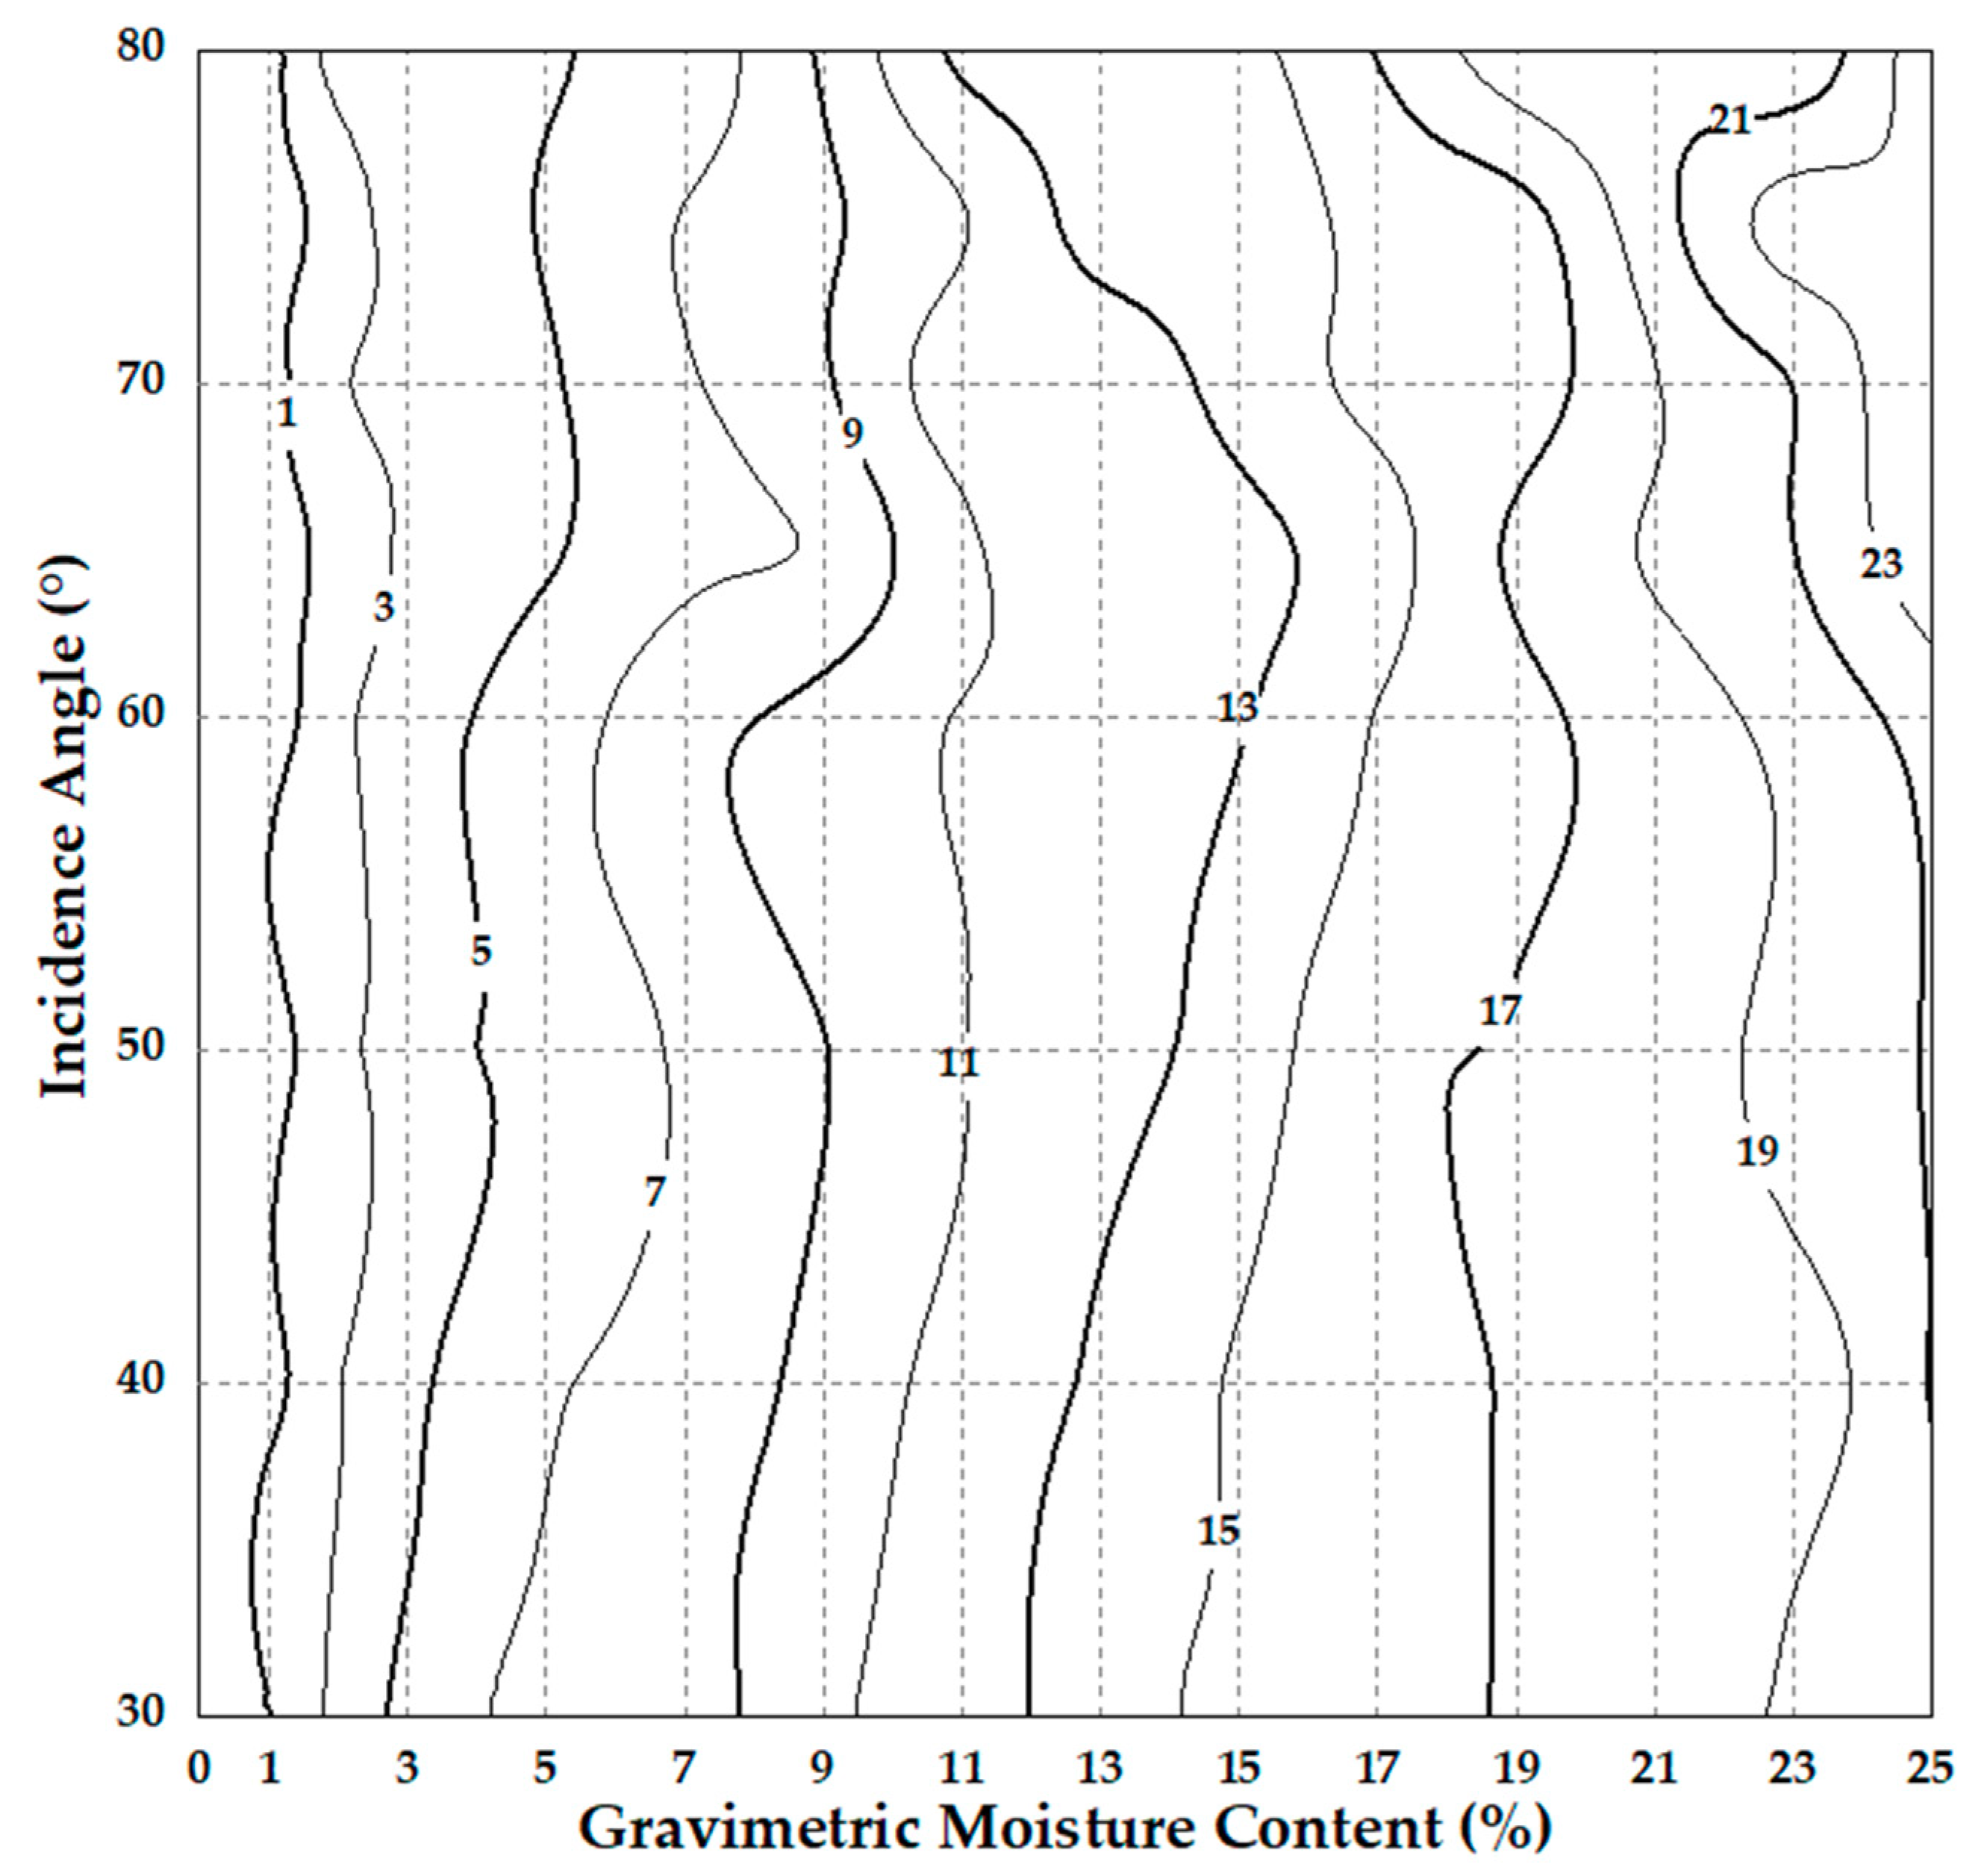
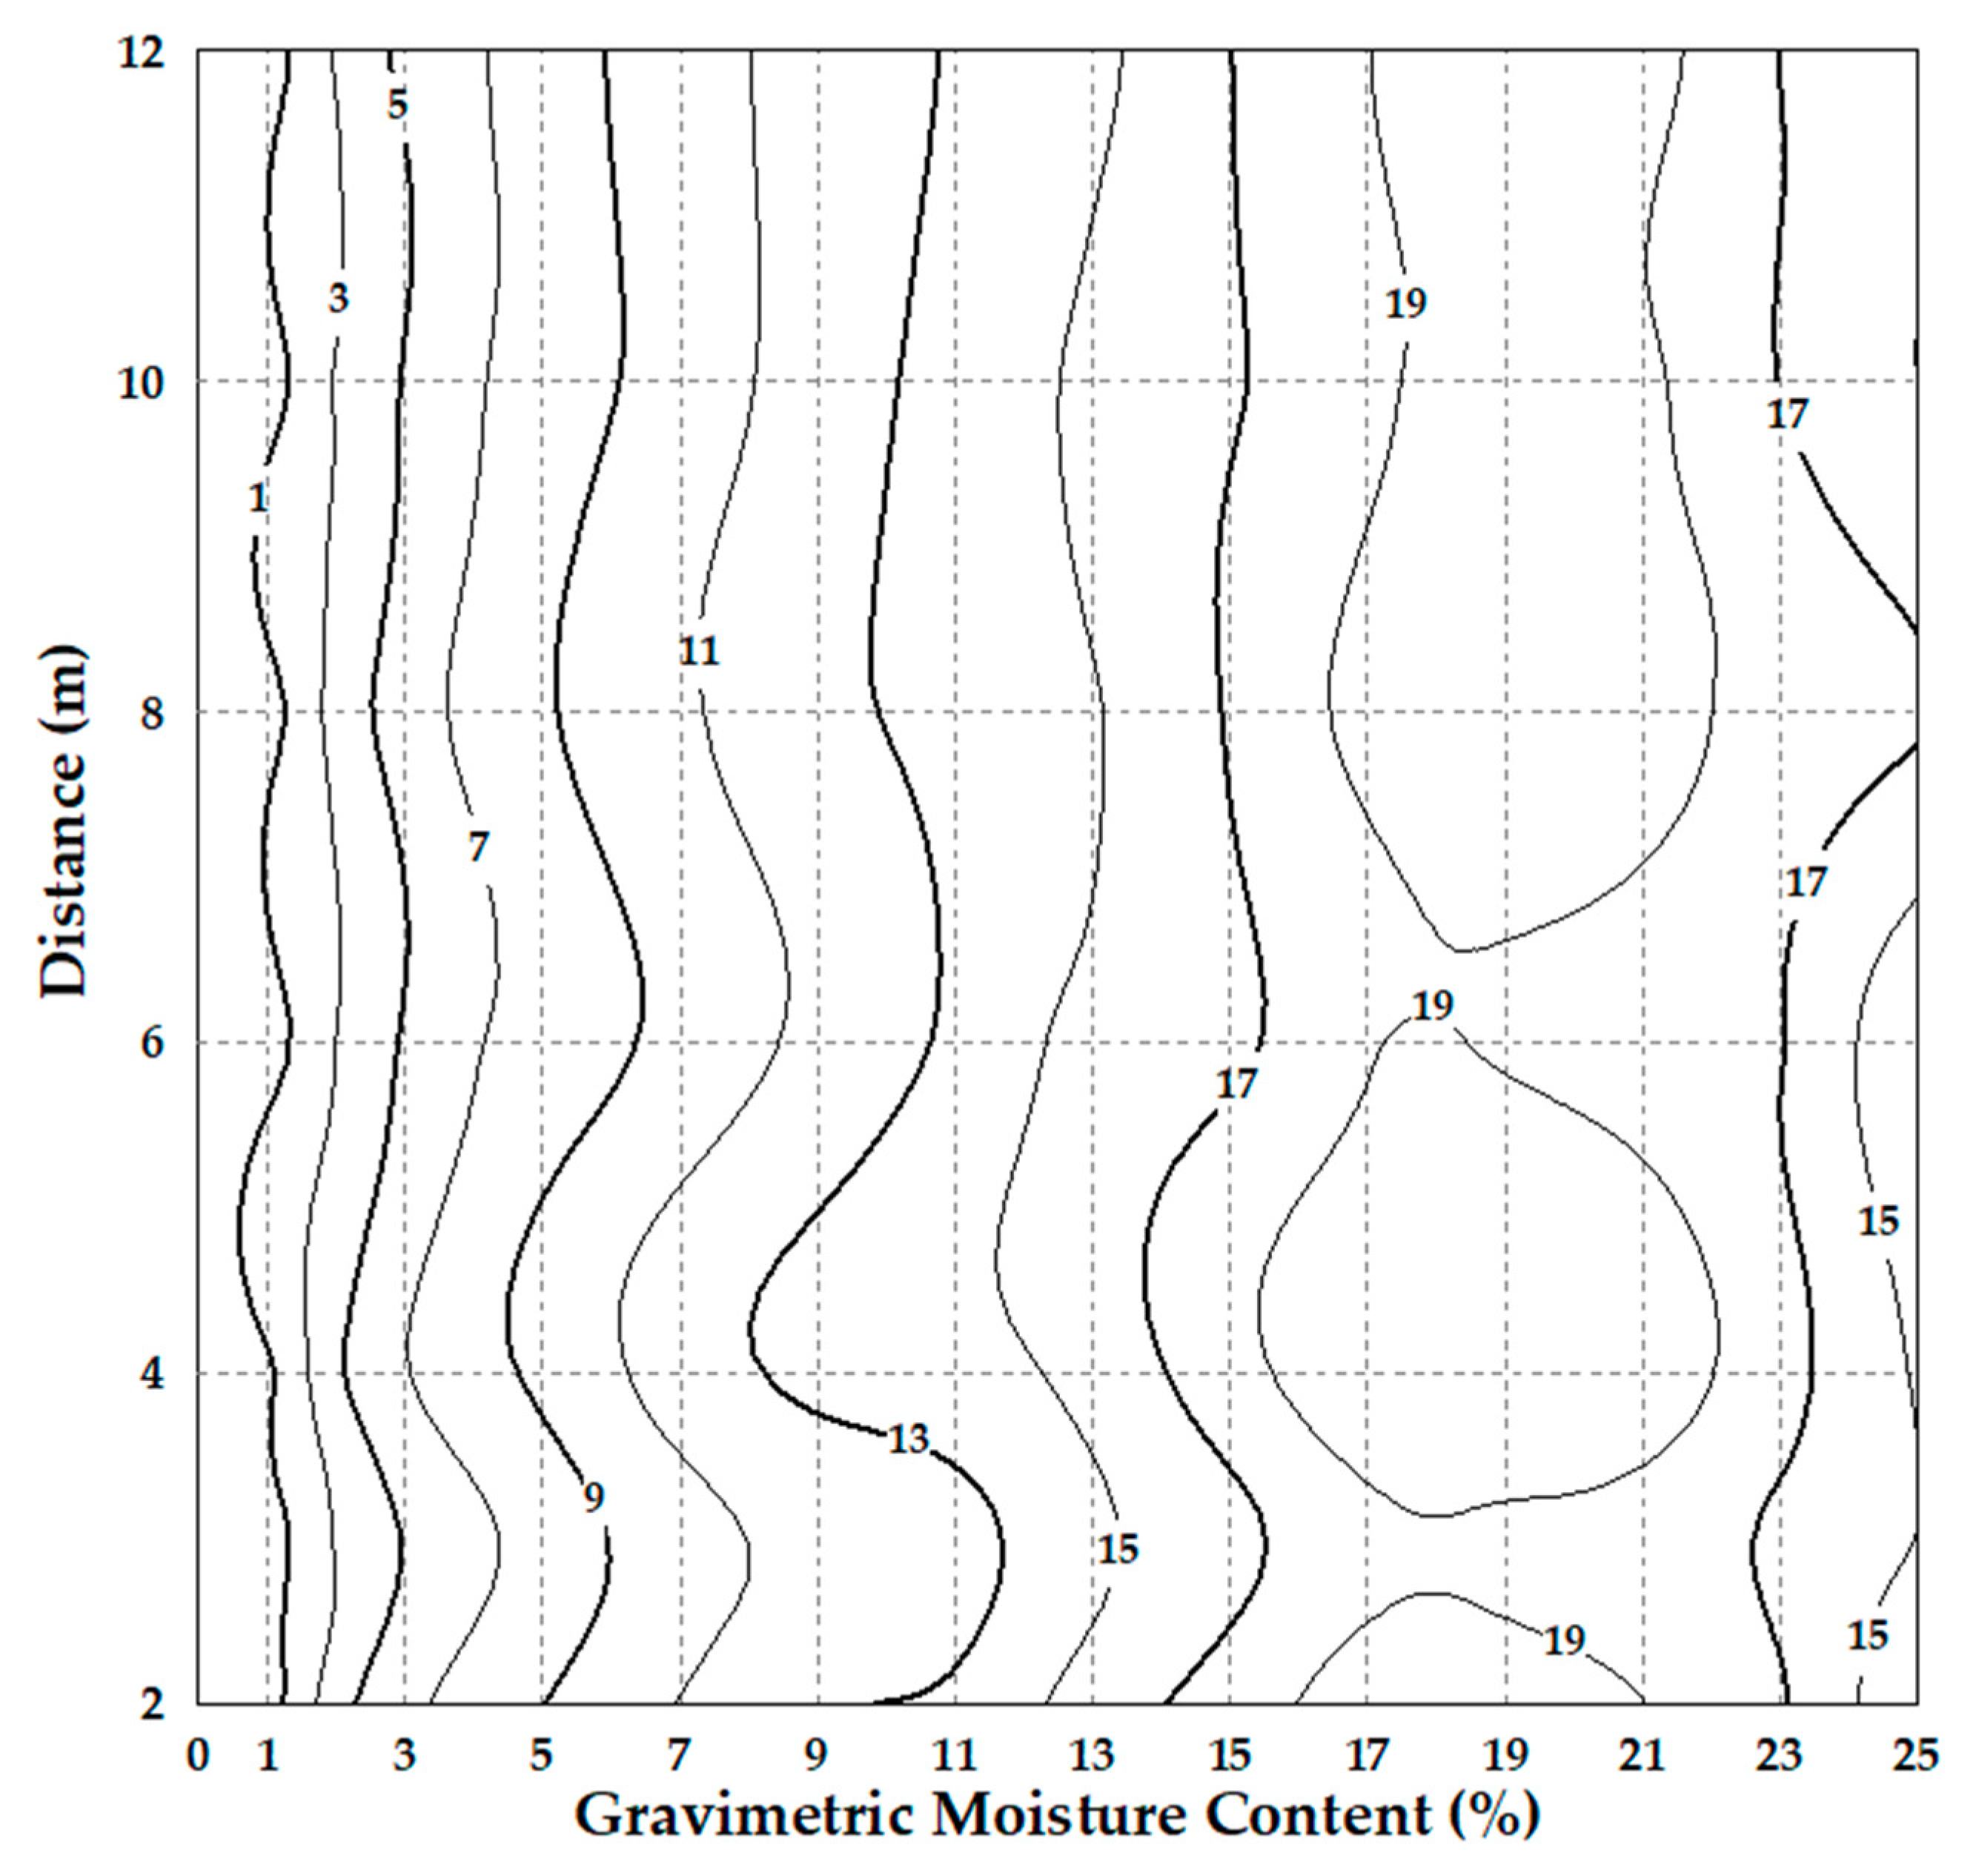
Figure 6 and Table 3 present the derived sand moisture from the intensity data of the incidence angle experiments. Before correction, the original intensity data (scanned from different incidence angles) varied significantly despite the fact that they have the same moisture contents and scanning distance as shown in Figure 4. However, the values of the derived sand moisture are almost equal except for the values near the incidence angle of 80°, where the fluctuation of the derived moisture values is high due to the decreased point density. The maximum standard deviation is 1.8% (moisture), meaning that the impact of incidence angles on the moisture measurements of sand samples seem to have been eliminated. There are better correction results for the data of the distance experiments as shown in Figure 7 and Table 4. The standard deviations of the derived sand moisture are even less than 1.0% except for the sample of 25% moisture. Therefore, we can draw the conclusion that the derived moisture contents of sand samples no longer depend on the scanning incidence angles and distance after correction and that they are therefore solely associated with the intrinsic reflectance of the sand samples.
It has to be mentioned that the derived sand moisture from the samples of 23% and 25% moisture are less than the real moisture values, especially those based on the data of the distance experiments (where the scans were conducted orthogonally). Their standard errors measure up to 5.8% and 10.0% moisture, respectively. The remarkable increase of the backscattered intensity, due to the reflection of the significant surface water film, contributes to the errors. In other moisture levels (0–21%), including the range of a 0% to 8% moisture where the threshold lies for the aeolian transport [33], the derived moisture values show good concordance with the maximum standard error of 2.1% for the non-normal incidence scanning and 3.5% for the orthogonal scanning. The total average standard error of all computed moisture contents is only around 2.0%. The average error is 1.2% moisture for the non-normal angle experiments in Table 3 and 2.9% for the distance experiments in Table 4. Both results are considerably better than the results of the photographic methods [1,30] and the formerly mentioned TLS method with a wavelength of 532 nm [31,32]. In the actual measurements of the TLS or MTL, the incidence angle of scanning is non-normal; therefore, we could theoretically compute quite accurate moisture levels using this method. Regarding the sand samples with moisture contents ranging from 19% to 25% (cfr. Table 3), the moisture values could be further corrected by adding a 2% moisture to the initially calculated value.

5. Application of MTL

5.1. Study Site

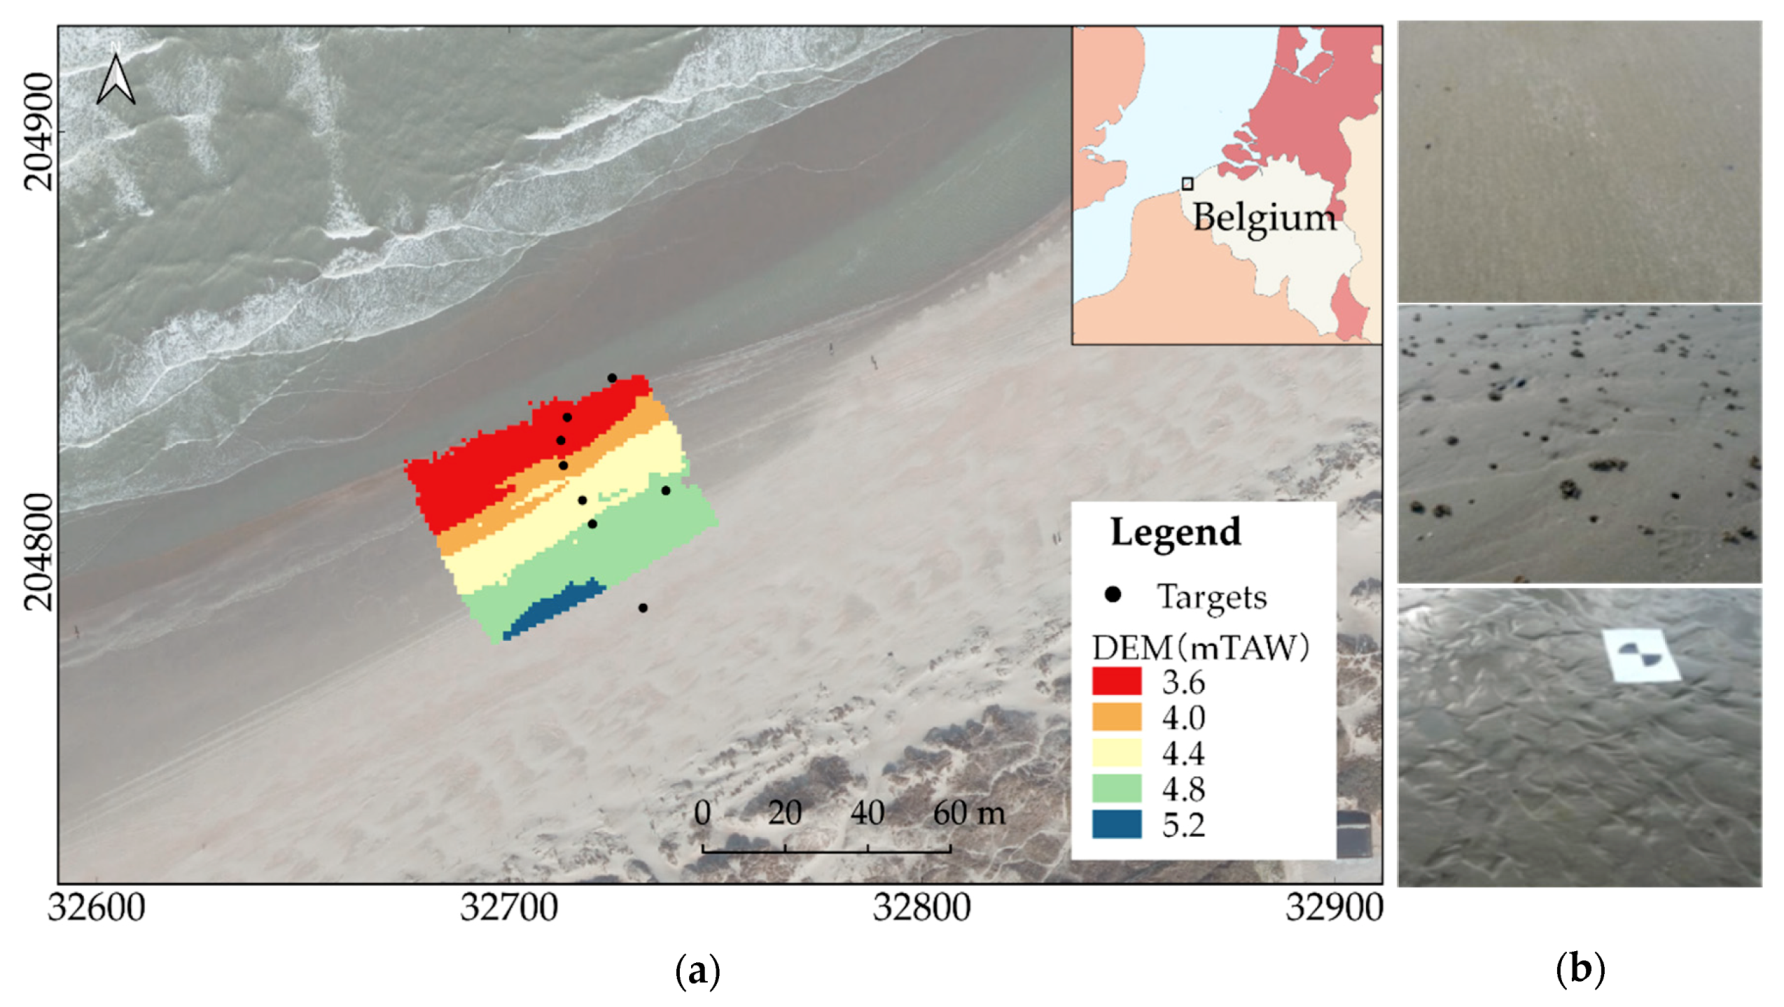
A field measurement using the MTL was conducted at the North Sea beach of Groenendijk (Koksijde, Belgium) as shown in Figure 8a. It is a gently sloping (1–1.5%) and ultra-dissipative natural beach with a width of about 500 m at low tide. There are three main beach surface morphologies except the inundated bar-troughs on the measurement beach (Figure 8b): flat surface, flat surface with razor shell dumps and flat surface with ripples. The Belgian coast is situated in a macro-tidal regime ranging from 3.5 m at neap tide to 5 m at spring tide [66]. The orthometric height values in Belgium are generally taken towards the TAW reference level (Tweede Algemene Waterpassing), which is an equipotential gravity surface of approximately 2.3 m under the conventional geoid EGM96. The coordinate reference system used in this study is called the Belgian Lambert 72, an orthogonal cone projection with two intersecting parallels at 49d50’ and 51d10’.

5.2. MTL System and Beach Measurements

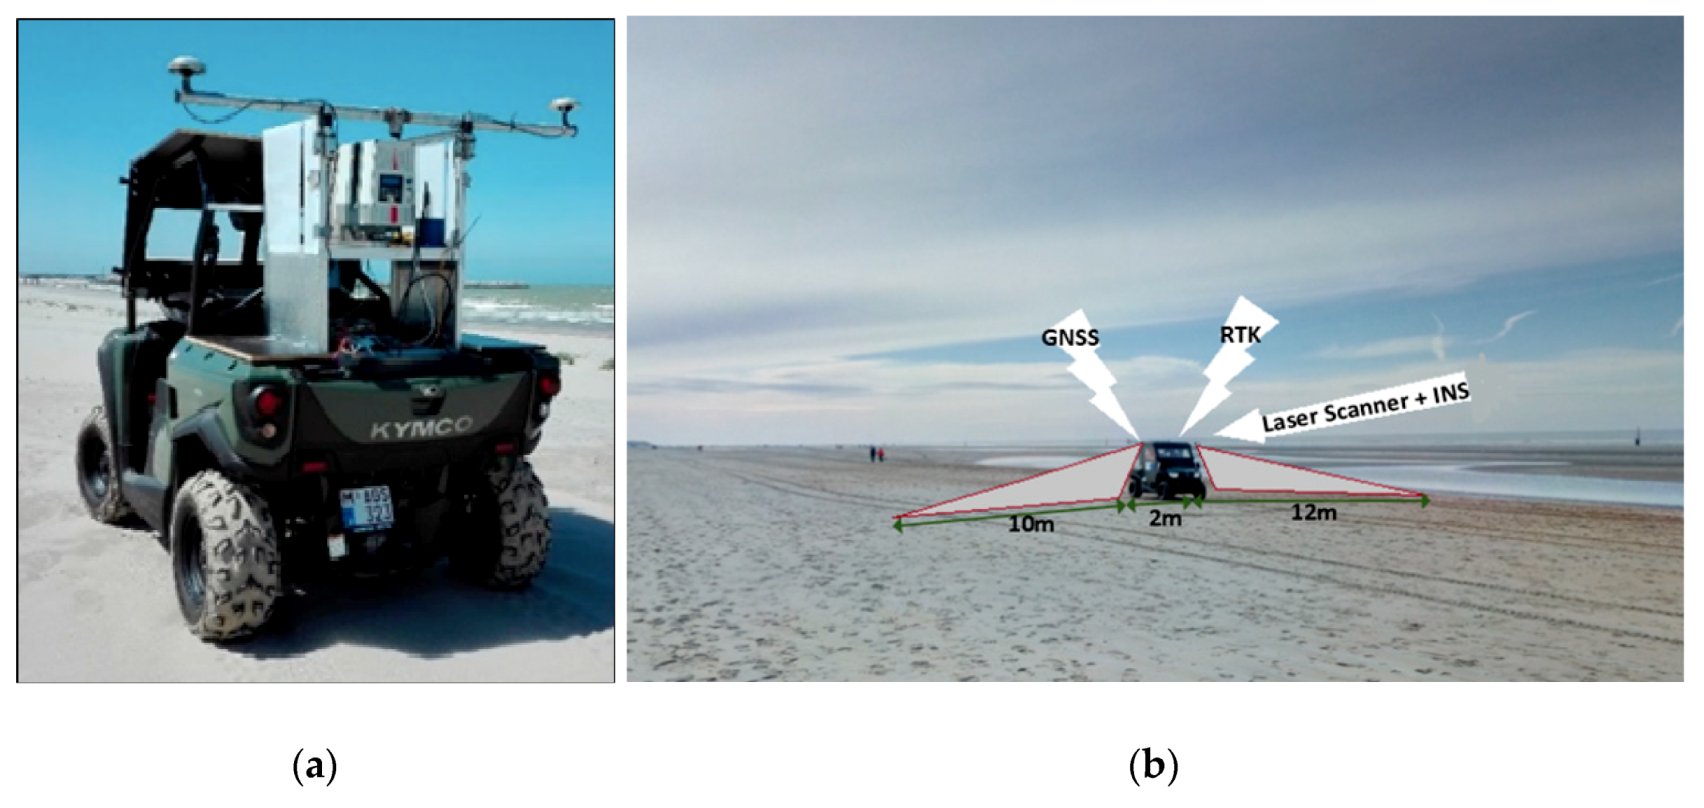
MTL is a complex real-time, multi-tasking and multi-sensor system and in this study, all the sensors were mounted on an all-terrain vehicle (Kymco) (Figure 9). The main devices include the same Z&F/Leica HDS6100 laser scanner used in the calibration experiments, an inertial measurement unit (IMU), two GNSS antennas with Real-Time Kinematic (RTK) precision and a rugged PC with hydrographic data acquisition software (QINSy). By the aid of RTK, the GNSS could provide positioning accuracy at centimeter level. However, it is virtually impossible to maintain the GNSS signal throughout the entire mobile survey because of the multipath effects and periods of GNSS outage [67], and as a result, the combination of GNSS with IMU was adopted in this study. It is noteworthy that the calibration must be executed to find the mounting angle errors (roll, pitch and heading) of the MTL system before the measurements. The time delay errors were solved by the PPS device and a latency check was done by surveying a line with two different speeds over a slope (based on the principle that the two slopes should be on top of each other when there is no latency) [68].
The field measurement using MTL was carried out on 14 November 2018 and the weather was cloudy. The surveying area measured about 200 × 200 m from the dyke to the intertidal zone in which a small area of 40 × 50 m near the high-tidal line was repeatedly scanned three times at 12:30, 14:00 and 15:30, respectively, between the low (11:31) and high tide (17:19). The DEM of the repeated scanning area was shown in Figure 8a. On the other hand, eight representative samples of beach sand were collected by a scraper from the sites next to the targets (Figure 8) after the first scanning. The sand samples taken demonstrated a 5 mm thickness over an area of 0.4 × 0.4 m. Their gravimetric moisture contents were calculated by double weighing, before and after the oven drying.

5.3. Beach Surface Moisture

Before the calculation of the beach surface moisture, a pre-processing of the point cloud data was performed by CloudCompare v2.11 and MATLAB 2014a. The non-ground outliers were manually removed and the incidence angles were calculated using Equation (15) based on a plane-fitting of a 10 cm radius. In order to eliminate the difference between the outdoor and indoor backscattered intensity at similar scanning conditions, all intensity values of the MTL point cloud were normalized against the original intensity values of dry sand (scanned at a 5 m distance and 70° incidence angle). In this study, a known dry sand area near the dunes was selected as the reference area where surface sand grains could move easily by breeze blowing. The point cloud at a 5 m distance and 70° incidence angle was extracted from this reference region and the mean intensity (215,386) of these points was calculated as the final denominator of normalization. In fact, the mean intensity was almost equal to the intensity value (224,820) of the indoor experiments.
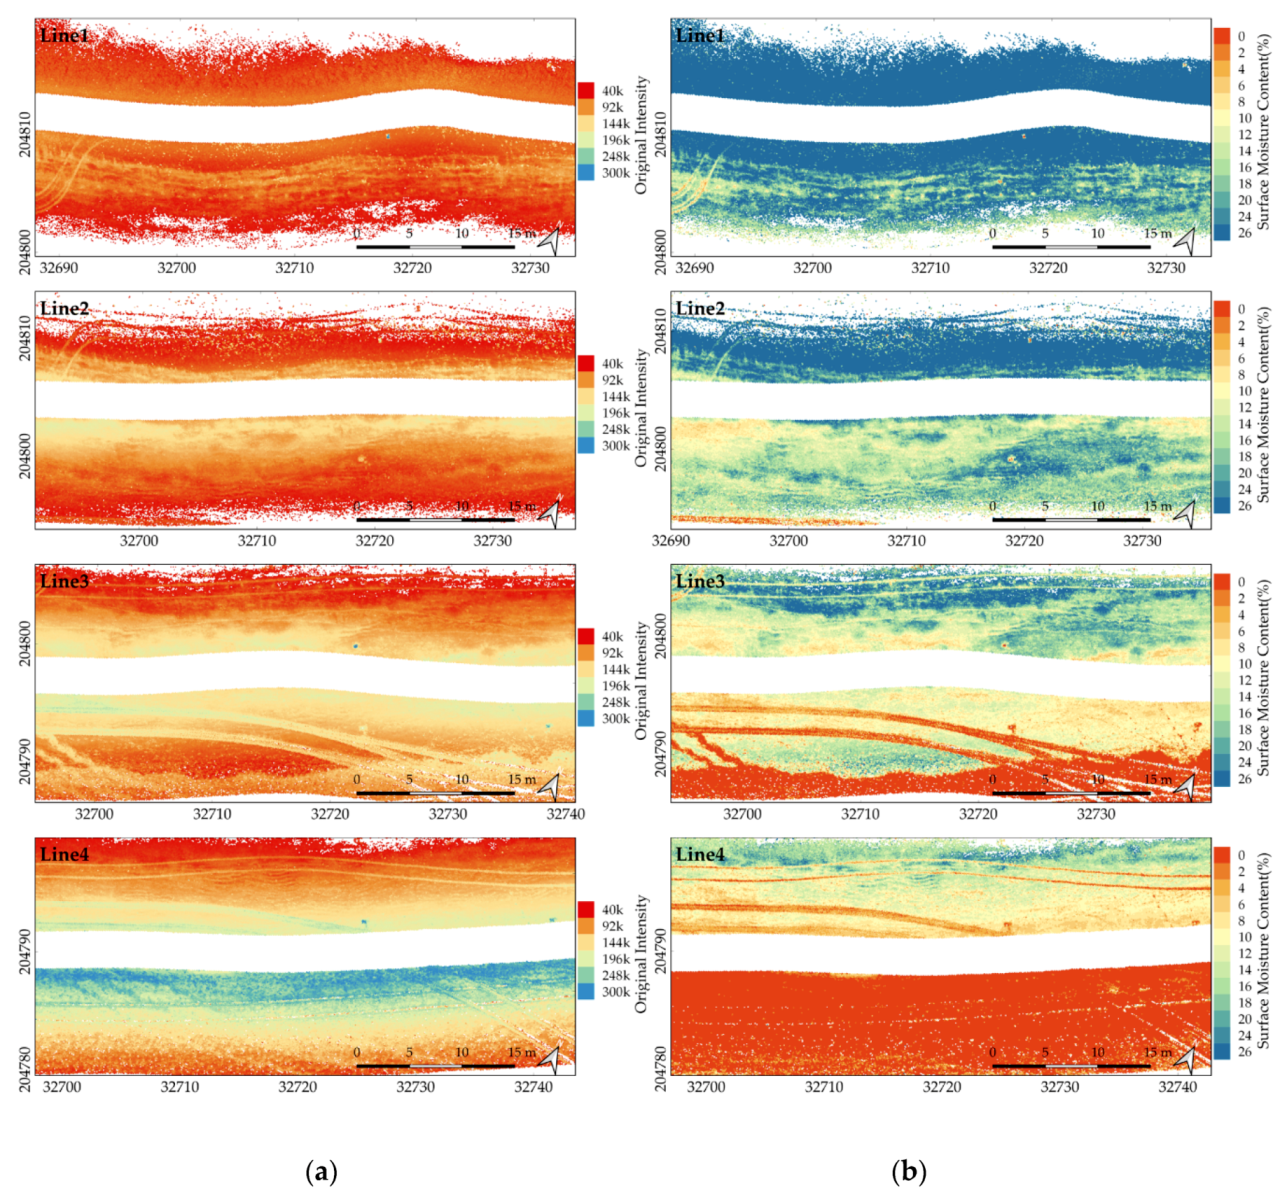
Based on the parameter values in Table 3, the beach surface moisture was calculated using Equation (14). The negative derived values were set to zero denoting dry sand and the values larger than 26% were set to 26% denoting saturated sand or water surface. Afterwards, the point cloud data were transferred to a raster (DEM) with a 10 × 10 cm cell size. As shown in Figure 10a, before correction, the original intensity data heavily depend on the scanning incidence angles and distance. In contrast, the beach surface moisture in Figure 10b is independent of the scanning geometry. The details of the beach terrain also become clearer, such as the ripples in Line 1 and 2 and the tire tracks in Line 3 and 4. In order to further assess the accuracy of the derived beach surface moisture, the average moisture values at eight sampling sites were computed from the point cloud data over a 0.4 × 0.4 m area and compared with the real moisture contents using the sample gravimetric method. Besides, the average moisture values over a larger area of 1 × 1 m at eight sampling sites were also calculated for comparison. As shown in Table 5, the moisture contents of the sampling sites is representative and the surface of the sampling area is relative flat (except for the inundated trough area of S1 and S7). Overall, the derived surface moisture is relatively accurate with a maximum difference of a 2.7% moisture in S3 compared to the real moisture contents. It is noteworthy that in S3 and S4, the differences between the real and the derived moisture are relative large but at the same time, the standard deviation of the surface moisture in these areas is also larger than others. Moreover, a lot of shell debris is present at the sampling site of S3 (as shown in the close-up image of S3 in Table 5). For the sampling site of S1 and S7, several points were obtained from the non-water areas.
The robustness of the overlapping strips is also important for the MTL measurements. Figure 11a depicts the absolute values of the surface moisture differences in the overlapping strip of adjacent survey lines for the first scan. The moisture raster maps were subtracted using the GIS raster calculator of QGIS. As shown in Figure 11a, the difference of almost overlapping areas amounts to less than a 2% moisture. Relative larger differences exist along the tracks and the edge of scanning strips, such as in the overlapping area of Line 2–Line 3. The possible reason is the distortion of the laser footprint at a great scanning distance and incidence angles. Another explanation could be the scanning areas of Line 2 and 3 at the transition zone from trough area to flat beach, in which the beach surface moisture varies greatly as shown in Line 1 of Figure 10b and the existence of tided debris also influences the accuracy of the derived surface moisture. In Figure 11b, there are relatively greater standard deviations of the surface moisture content noticeable along the tire tracks and in the transition zone from the trough area to the flat beach.

5.4. Beach Surface Moisture Variation

Figure 12a shows the rasterized surface moisture maps on three different moments in time, 12:30, 14:00 and 15:30, on 14 November 2018 during the rising tide. The red colours indicate dry sand, which are visible on the back beach in front of the dunes. The surface moisture varies spatially from 0% to 25%. Towards the sea, the beach surface moistures increase, depicted with green, yellow, blue to dark blue colours. The tire tracks have a lower moisture than their surroundings. Only few points are noticeable in the trough during the first scan but over time, more data points become visible. Figure 12b visualizes the surface moisture differences between the three time moments which give a clear illustration of the manner in which the beach surface moisture varies over time. Over three hours, the latter shows great variation, especially in the area between the dry sand and trough. The tire tracks demonstrate the greatest moisture variation in which the majority of the moisture variation is exceeds the 8% moisture.
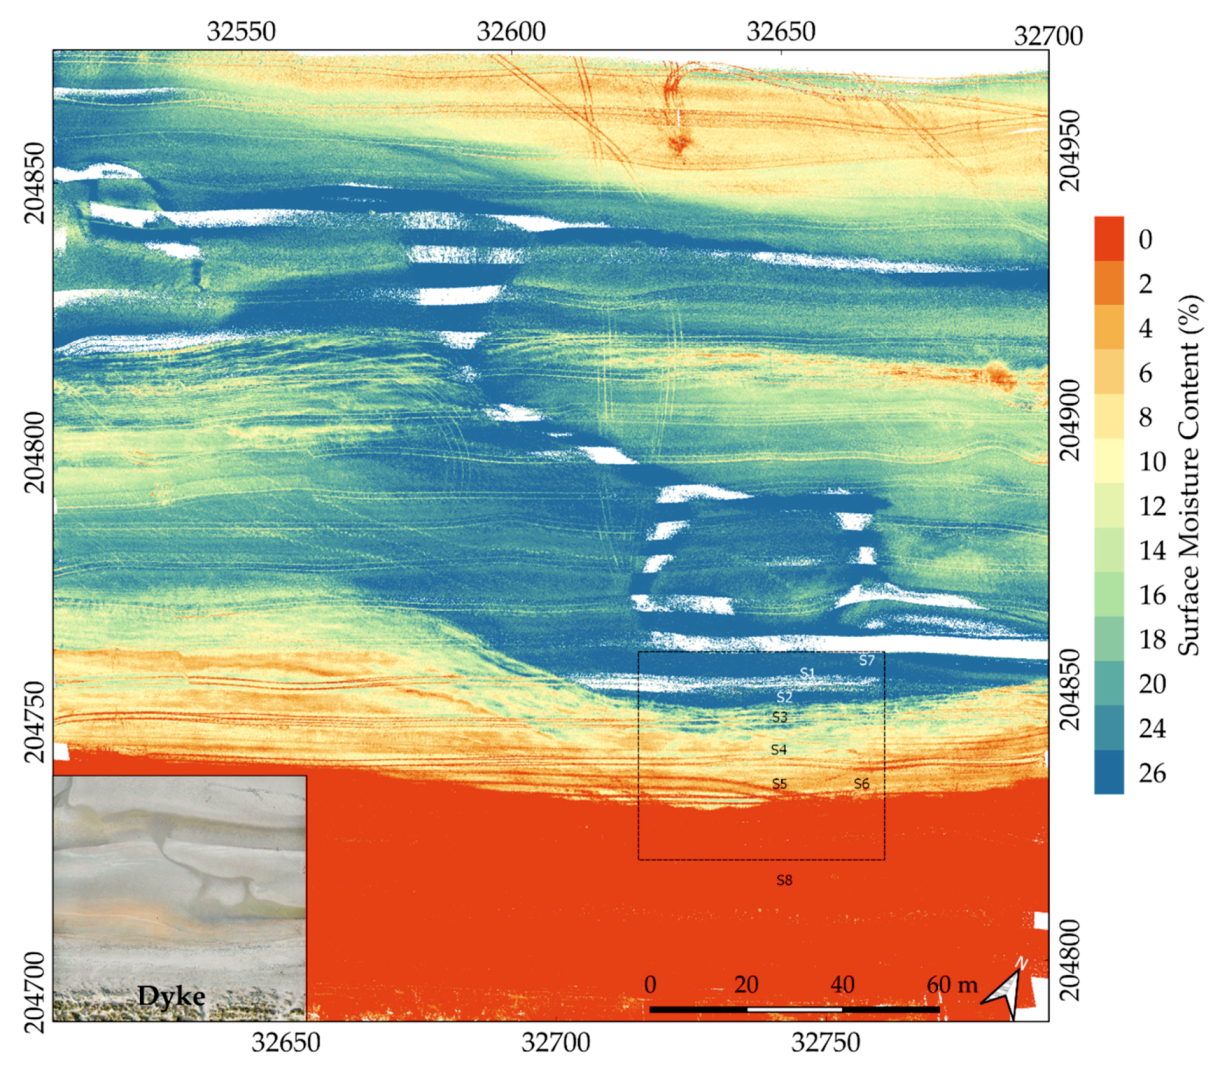
Additionally, a moisture map of a 200 × 200 m area is shown in Figure 13, which integrates 24 survey lines of MTL. In the left corner, a simultaneously acquired orthophoto of the study site is given (which was obtained through UAV photogrammetry). The black dotted box indicates the repeated scanning area in Figure 12 and the points S1–S8 localize the eight sampling sites. By comparing with the orthophoto, the derived moisture map could accurately describe the distribution of the dry sand area (red colour) and trough (dark blue colour or no data points). The division between the areas with a different surface moisture is very clear. It is noteworthy that it took in total only 40 min to measure the 200 × 200 m area and each survey line (12 × 200 m) lasted about one minute, which means that the MTL could map the moisture variations of the mesoscale beach surface in a timescale of minutes.

6. Conclusions

This study comprehensively investigates the effect of the sand moisture contents on the backscattered intensity with moisture contents of sand samples from 0% to 25%, scanning incidence angles from 0 to 80° and measuring distances from 1 to 20 m using a Z&F/Leica HDS6100 laser scanner. Based on the experimental calibration data, a moisture estimation model was developed which eliminates the impact of the incidence angle and scanning distance and only reflects the surface reflectance. Moreover, to our knowledge, this is the first time that an MTL system was used to measure the beach surface moisture on a sandy beach. The main conclusions of this study include:
  • Both the scanning incidence angle and scanning distance have an influence on the backscattered intensity of the flat sand samples (the average sand grain diameter is 0.12 mm), in which the intensity values decrease gradually with incidence angles between 30 to 80°. When scanning orthogonally, the surface water film coating sand grains could contribute to a remarkable increase of the backscattered intensity (which is factor 7 above the intensity value of dry sand).
  • The original intensity values decrease strongly from dry sand to a 3% moisture. This means that even a little moisture in sandy areas has a huge effect on the backscattered intensity of TLS.
  • The proposed moisture model could effectively eliminate the effect of the scanning geometry on the backscattered intensity of TLS. The accuracy of the derived surface moisture amounts to a total standard error of a 2.0% moisture. Regarding the non-normal scanning, the method could accurately derive the full range of the sand moisture contents from 0% to 25% with a standard error of a 1.2% moisture. The result is considerably better than the previous TLS methods (using a Leica Scanstation 2 or a RIEGL VZ-400).
  • Based on the proposed moisture model, the MTL system (using a Z&F/Leica HDS6100 laser scanner) is a promising technique to accurately and robustly measure the surface moisture on a sandy beach with an ultra-high spatial resolution (centimeter level) in a short time span (12 × 200 m per minute).
  • On the other hand, some improvements should be considered in future studies. For example, the calibration experiments for varying distances could be conducted with a non-normal incidence angle. In addition, more sand samples could be collected from the target beach, in Groenendijk-Belgium, by a multi-person cooperation and the scanning efficiency of MTL could be increased by augmenting the laser scanner height or using a long-range LiDAR.

Author Contributions

J.J. provided the overall conception of this research, planned the indoor experiments and the MTL beach measurements, carried out the indoor experiments and most of the data analyses and wrote the majority of the manuscript. L.D.S. and J.V. executed the MTL beach measurements, performed the data pre-processing, helped with the production of maps and writing the manuscript. C.S. and A.-L.M. helped with providing the overall conception of this research and commented on the manuscript. G.D., P.D.M. and A.D.W. provided guidance, proposed the overall research field, provided the MTL system and commented on the manuscript. All authors have read and agreed to the published version of the manuscript.

Funding

This research was funded by the Chinese Scholarship Council, grant number 201406410069. The MTL measurements were performed within the CREST Project (www.crest-project.be), funded by the Strategic Basic Research (SBO) programme of the ‘Instituut voor Innovatie door Wetenschap en Technologie’ (IWT), grant number 150028.

Acknowledgments

The authors wish to thank Paul Schaepelynck, Bart De Wit and Samuel Van Ackere (Ghent University) for their logistic and technical assistance while performing the MTL measurements. The MTL measurements would not have been possible without the cooperation of Wijnand Vanhille (MOW-ATO) and the people of Surf Club Windekind (Oostduinkerke). We also thank Sabine Cnudde for the thorough proofreading of the manuscript.

Conflicts of Interest

The authors declare no conflict of interest.

References

  1. Edwards, B.L.; Schmutz, P.P.; Namikas, S.L. Comparison of surface moisture measurements with depth-integrated moisture measurements on a fine-grained beach. J. Coast. Res. 2013, 29, 1284–1291. [Google Scholar]
  2. Bauer, B.; Davidson-Arnott, R.; Hesp, P.; Namikas, S.; Ollerhead, J.; Walker, I. Aeolian sediment transport on a beach: Surface moisture, wind fetch, and mean transport. Geomorphology 2009, 105, 106–116. [Google Scholar] [CrossRef]
  3. Davidson-Arnott, R.G.; Yang, Y.; Ollerhead, J.; Hesp, P.A.; Walker, I.J. The effects of surface moisture on aeolian sediment transport threshold and mass flux on a beach. Earth Surf. Process. Landf. J. Br. Geomorphol. Res. Group 2008, 33, 55–74. [Google Scholar] [CrossRef]
  4. Oblinger, A.; Anthony, E.J. Surface moisture variations on a multibarred macrotidal beach: Implications for aeolian sand transport. J. Coast. Res. 2008, 24, 1194–1199. [Google Scholar] [CrossRef]
  5. Wiggs, G.; Baird, A.; Atherton, R. The dynamic effects of moisture on the entrainment and transport of sand by wind. Geomorphology 2004, 59, 13–30. [Google Scholar] [CrossRef]
  6. Nield, J.M.; Wiggs, G.F.; King, J.; Bryant, R.G.; Eckardt, F.D.; Thomas, D.S.; Washington, R. Climate–surface–pore-water interactions on a salt crusted playa: Implications for crust pattern and surface roughness development measured using terrestrial laser scanning. Earth Surf. Process. Landf. 2016, 41, 738–753. [Google Scholar] [CrossRef] [Green Version]
  7. Nield, J.M.; Wiggs, G.F.; Squirrell, R.S. Aeolian sand strip mobility and protodune development on a drying beach: Examining surface moisture and surface roughness patterns measured by terrestrial laser scanning. Earth Surf. Process. Landf. 2011, 36, 513–522. [Google Scholar] [CrossRef]
  8. Davidson-Arnott, R.G.; MacQuarrie, K.; Aagaard, T. The effect of wind gusts, moisture content and fetch length on sand transport on a beach. Geomorphology 2005, 68, 115–129. [Google Scholar] [CrossRef]
  9. McKenna Neuman, C.; Langston, G. Measurement of water content as a control of particle entrainment by wind. Earth Surf. Process. Landf. J. Br. Geomorphol. Res. Group 2006, 31, 303–317. [Google Scholar] [CrossRef]
  10. Namikas, S.; Edwards, B.; Bitton, M.; Booth, J.; Zhu, Y. Temporal and spatial variabilities in the surface moisture content of a fine-grained beach. Geomorphology 2010, 114, 303–310. [Google Scholar] [CrossRef]
  11. Atherton, R.J.; Baird, A.J.; Wiggs, G.F. Inter-tidal dynamics of surface moisture content on a meso-tidal beach. J. Coast. Res. 2001, 17, 482–489. [Google Scholar]
  12. Smit, Y.; Donker, J.J.; Ruessink, G. Spatiotemporal surface moisture variations on a barred beach and their relationship with groundwater fluctuations. Hydrology 2019, 6, 8. [Google Scholar] [CrossRef] [Green Version]
  13. Schmutz, P.P.; Namikas, S.L. Measurement and modeling of moisture content above an oscillating water table: Implications for beach surface moisture dynamics. Earth Surf. Process. Landf. 2013, 38, 1317–1325. [Google Scholar] [CrossRef]
  14. Nolet, C.; Poortinga, A.; Roosjen, P.; Bartholomeus, H.; Ruessink, G. Measuring and modeling the effect of surface moisture on the spectral reflectance of coastal beach sand. PLoS ONE 2014, 9, e112151. [Google Scholar] [CrossRef] [PubMed]
  15. Darke, I.; Davidson-Arnott, R.; Ollerhead, J. Measurement of beach surface moisture using surface brightness. J. Coast. Res. 2009, 25, 248–256. [Google Scholar] [CrossRef]
  16. Yang, Y.; Davidson-Arnott, R.G. Rapid measurement of surface moisture content on a beach. J. Coast. Res. 2005, 21, 447–452. [Google Scholar] [CrossRef]
  17. Tsegaye, T.D.; Tadesse, W.; Coleman, T.L.; Jackson, T.J.; Tewolde, H. Calibration and modification of impedance probe for near surface soil moisture measurements. Can. J. Soil Sci. 2004, 84, 237–243. [Google Scholar] [CrossRef] [Green Version]
  18. Edwards, B.L.; Namikas, S.L. Small-scale variability in surface moisture on a fine-grained beach: Implications for modeling aeolian transport. Earth Surf. Process. Landf. 2009, 34, 1333–1338. [Google Scholar] [CrossRef]
  19. Schmutz, P.P.; Namikas, S.L. Utility of the Delta-T Theta Probe for obtaining surface moisture measurements from beaches. J. Coast. Res. 2011, 27, 478–484. [Google Scholar]
  20. Sherman, D.J.; Jackson, D.W.; Namikas, S.L.; Wang, J. Wind-blown sand on beaches: An evaluation of models. Geomorphology 1998, 22, 113–133. [Google Scholar] [CrossRef]
  21. Williams, R.; Brasington, J.; Vericat, D.; Hicks, D. Hyperscale terrain modelling of braided rivers: Fusing mobile terrestrial laser scanning and optical bathymetric mapping. Earth Surf. Process. Landf. 2014, 39, 167–183. [Google Scholar] [CrossRef]
  22. Ångström, A. The albedo of various surfaces of ground. Geogr. Ann. 1925, 7, 323–342. [Google Scholar]
  23. Lobell, D.B.; Asner, G.P. Moisture effects on soil reflectance. Soil Sci. Soc. Am. J. 2002, 66, 722–727. [Google Scholar] [CrossRef]
  24. Twomey, S.A.; Bohren, C.F.; Mergenthaler, J.L. Reflectance and albedo differences between wet and dry surfaces. Appl. Opt. 1986, 25, 431–437. [Google Scholar] [CrossRef] [PubMed]
  25. Philpot, W. Spectral reflectance of wetted soils. Proc. ASD IEEE GRS 2010, 2. [Google Scholar] [CrossRef]
  26. Darke, I.; Neuman, C.M. Field study of beach water content as a guide to wind erosion potential. J. Coast. Res. 2008, 24, 1200–1208. [Google Scholar] [CrossRef]
  27. Delgado-Fernandez, I.; Davidson-Arnott, R.; Ollerhead, J. Application of a remote sensing technique to the study of coastal dunes. J. Coast. Res. 2009, 25, 1160–1167. [Google Scholar] [CrossRef]
  28. Delgado-Fernandez, I. Meso-scale modelling of aeolian sediment input to coastal dunes. Geomorphology 2011, 130, 230–243. [Google Scholar] [CrossRef] [Green Version]
  29. Delgado-Fernandez, I.R. Davidson-Arnott. Meso-scale aeolian sediment input to coastal dunes: The nature of aeolian transport events. Geomorphology 2011, 126, 217–232. [Google Scholar] [CrossRef] [Green Version]
  30. Edwards, B.L.; Namikas, S.L.; D’sa, E.J. Simple infrared techniques for measuring beach surface moisture. Earth Surf. Process. Landf. 2013, 38, 192–197. [Google Scholar] [CrossRef]
  31. Nield, J.M.; Wiggs, G.F. The application of terrestrial laser scanning to aeolian saltation cloud measurement and its response to changing surface moisture. Earth Surf. Process. Landf. 2011, 36, 273–278. [Google Scholar] [CrossRef]
  32. Nield, J.M.; King, J.; Jacobs, B. Detecting surface moisture in aeolian environments using terrestrial laser scanning. Aeolian Res. 2014, 12, 9–17. [Google Scholar] [CrossRef]
  33. Smit, Y.; Ruessink, G.; Brakenhoff, L.B.; Donker, J.J. Measuring spatial and temporal variation in surface moisture on a coastal beach with a near-infrared terrestrial laser scanner. Aeolian Res. 2018, 31, 19–27. [Google Scholar] [CrossRef]
  34. Ruessink, G.; Brakenhoff, L.; van Maarseveen, M. Measurement of surface moisture using infra-red terrestrial laser scanning. In Proceedings of the EGU General Assembly 2014, Vienna, Austria, 27 April–2 May 2014; Volume 16. EGU2014–2797. [Google Scholar]
  35. Kukko, A.; Kaasalainen, S.; Litkey, P. Effect of incidence angle on laser scanner intensity and surface data. Appl. Opt. 2008, 47, 986–992. [Google Scholar] [CrossRef]
  36. Franceschi, M.; Teza, G.; Preto, N.; Pesci, A.; Galgaro, A.; Girardi, S. Discrimination between marls and limestones using intensity data from terrestrial laser scanner. ISPRS J. Photogramm. Remote Sens. 2009, 64, 522–528. [Google Scholar] [CrossRef]
  37. Kaasalainen, S.; Kukko, A.; Lindroos, T.; Litkey, P.; Kaartinen, H.; Hyyppa, J.; Ahokas, E. Brightness measurements and calibration with airborne and terrestrial laser scanners. IEEE Trans. Geosci. Remote Sens. 2008, 46, 528–534. [Google Scholar] [CrossRef]
  38. González-Jorge, H.; Gonzalez-Aguilera, D.; Rodriguez-Gonzalvez, P.; Arias, P. Monitoring biological crusts in civil engineering structures using intensity data from terrestrial laser scanners. Constr. Build. Mater. 2012, 31, 119–128. [Google Scholar] [CrossRef]
  39. Kaasalainen, S.; Jaakkola, A.; Kaasalainen, M.; Krooks, A.; Kukko, A. Analysis of incidence angle and distance effects on terrestrial laser scanner intensity: Search for correction methods. Remote Sens. 2011, 3, 2207–2221. [Google Scholar] [CrossRef] [Green Version]
  40. Kaasalainen, S.; Niittymaki, H.; Krooks, A.; Koch, K.; Kaartinen, H.; Vain, A.; Hyyppa, H. Effect of target moisture on laser scanner intensity. IEEE Trans. Geosci. Remote Sens. 2010, 48, 2128–2136. [Google Scholar] [CrossRef]
  41. Bohren, C.F.; Huffman, D.R. Absorption and Scattering of Light by Small Particles; John Wiley & Sons: New York, USA, 2008; pp. 3–9. [Google Scholar]
  42. Duke, C.; Guérif, M. Crop reflectance estimate errors from the SAIL model due to spatial and temporal variability of canopy and soil characteristics. Remote Sens. Environ. 1998, 66, 286–297. [Google Scholar] [CrossRef]
  43. Shin, H.; Yu, J.; Jeong, Y.; Wang, L.; Yang, D.-Y. Case-Based Regression Models Defining the Relationships Between Moisture Content and Shortwave Infrared Reflectance of Beach Sands. IEEE J. Sel. Top. Appl. Earth Obs. Remote Sens. 2017, 10, 4512–4521. [Google Scholar] [CrossRef]
  44. Wagner, W.; Ullrich, A.; Ducic, V.; Melzer, T.; Studnicka, N. Gaussian decomposition and calibration of a novel small-footprint full-waveform digitising airborne laser scanner. ISPRS J. Photogramm. Remote Sens. 2006, 60, 100–112. [Google Scholar] [CrossRef]
  45. Höfle, B.; Pfeifer, N. Correction of laser scanning intensity data: Data and model-driven approaches. ISPRS J. Photogramm. Remote Sens. 2007, 62, 415–433. [Google Scholar] [CrossRef]
  46. Fang, W.; Huang, X.; Zhang, F.; Li, D. Intensity correction of terrestrial laser scanning data by estimating laser transmission function. IEEE Trans. Geosci. Remote Sens. 2015, 53, 942–951. [Google Scholar] [CrossRef]
  47. Tan, K.; Cheng, X. Intensity data correction based on incidence angle and distance for terrestrial laser scanner. J. Appl. Remote Sens. 2015, 9, 094094. [Google Scholar] [CrossRef]
  48. Tan, K.; Cheng, X.; Ding, X.; Zhang, Q. Intensity data correction for the distance effect in terrestrial laser scanners. IEEE J. Sel. Top. Appl. Earth Obs. Remote Sens. 2016, 9, 304–312. [Google Scholar] [CrossRef]
  49. Coren, F.; Sterzai, P. Radiometric correction in laser scanning. Int. J. Remote Sens. 2006, 27, 3097–3104. [Google Scholar] [CrossRef]
  50. Errington, A.F.; Daku, B.L.; Prugger, A.F. A model based approach to intensity normalization for terrestrial laser scanners. In Proceedings of the International Symposium on Lidar and Radar Mapping 2011: Technologies and Applications, Nanjing, China, 26–29 May 2011; p. 828605. [Google Scholar]
  51. Jutzi, B.; Gross, H. Normalization of LiDAR intensity data based on range and surface incidence angle. Int. Arch. Photogramm. Remote Sens. Spat. Inf. Sci. 2009, 38, 213–218. [Google Scholar]
  52. Teo, T.-A.; Yu, H.-L. Empirical radiometric normalization of road points from terrestrial mobile LiDAR system. Remote Sens. 2015, 7, 6336–6357. [Google Scholar] [CrossRef] [Green Version]
  53. Kaasalainen, S.; Hyyppa, H.; Kukko, A.; Litkey, P.; Ahokas, E.; Hyyppa, J.; Lehner, H.; Jaakkola, A.; Suomalainen, J.; Akujarvi, A. Radiometric calibration of LIDAR intensity with commercially available reference targets. IEEE Trans. Geosci. Remote Sens. 2009, 47, 588–598. [Google Scholar] [CrossRef]
  54. Ahokas, E.; Kaasalainen, S.; Hyyppä, J.; Suomalainen, J. Calibration of the Optech ALTM 3100 laser scanner intensity data using brightness targets. Int. Arch. Photogramm. Remote Sens. Spat. Inf. Sci. 2006, 36, 1Á6. [Google Scholar]
  55. Bitenc, M. Evaluation of a laser Land-Based Mobile Mapping System for Measuring Sandy Coast Morphology. Master Thesis, Delft University of Technology, Delft, The Netherlands, 8 March 2010. [Google Scholar]
  56. Ding, Q.; Chen, W.; King, B.; Liu, Y.; Liu, G. Combination of overlap-driven adjustment and Phong model for LiDAR intensity correction. ISPRS J. Photogramm. Remote Sens. 2013, 75, 40–47. [Google Scholar] [CrossRef]
  57. Tan, K.; Cheng, X. Specular reflection effects elimination in terrestrial laser scanning intensity data using Phong model. Remote Sens. 2017, 9, 853. [Google Scholar] [CrossRef] [Green Version]
  58. Xu, T.; Xu, L.; Yang, B.; Li, X.; Yao, J. Terrestrial laser scanning intensity correction by piecewise fitting and overlap-driven adjustment. Remote Sens. 2017, 9, 1090. [Google Scholar] [CrossRef] [Green Version]
  59. Tan, K.; Cheng, X. Correction of incidence angle and distance effects on TLS intensity data based on reference targets. Remote Sens. 2016, 8, 251. [Google Scholar] [CrossRef] [Green Version]
  60. Tan, K.; Chen, J.; Qian, W.; Zhang, W.; Shen, F.; Cheng, X. Intensity Data Correction for Long-Range Terrestrial Laser Scanners: A Case Study of Target Differentiation in an Intertidal Zone. Remote Sens. 2019, 11, 331. [Google Scholar] [CrossRef] [Green Version]
  61. Kaasalainen, S.; Krooks, A.; Kukko, A.; Kaartinen, H. Radiometric calibration of terrestrial laser scanners with external reference targets. Remote Sens. 2009, 1, 144–158. [Google Scholar] [CrossRef] [Green Version]
  62. Tan, K.; Zhang, W.; Shen, F.; Cheng, X. Investigation of tls intensity data and distance measurement errors from target specular reflections. Remote Sens. 2018, 10, 1077. [Google Scholar] [CrossRef] [Green Version]
  63. Hofle, B. Radiometric correction of terrestrial LiDAR point cloud data for individual maize plant detection. IEEE Geosci. Remote Sens. Lett. 2014, 11, 94–98. [Google Scholar] [CrossRef]
  64. Pesci, A.; Teza, G. Effects of surface irregularities on intensity data from laser scanning: An experimental approach. Ann. Geophys. 2008, 51, 839–848. [Google Scholar]
  65. Kaasalainen, S.; Vain, A.; Krooks, A.; Kukko, A. Topographic and distance effects in laser scanner intensity correction. Int. Arch. Photogramm. Remote Sens. Spat. Inf. Sci. 2009, 38, 219–222. [Google Scholar]
  66. Deronde, B.; Houthuys, R.; Henriet, J.P.; Lancker, V.V. Monitoring of the sediment dynamics along a sandy shoreline by means of airborne hyperspectral remote sensing and LIDAR: A case study in Belgium. Earth Surf. Process. Landf. J. Br. Geomorphol. Res. Group. 2008, 33, 280–294. [Google Scholar] [CrossRef]
  67. Stal, C.; Incoul, A.; de Maeyer, P.; Deruyter, G.; Nuttens, T.; de Wulf, A. Mobile Mapping and the Use of Backscatter Data for the Modelling of Intertidal Zones of Beaches. In Proceedings of the 14th SGEM GeoConference on Informatics, Geoinformatics and Remote Sensing, Sofia, Bulgaria, 19–25 June 2014. [Google Scholar]
  68. Qinsy Support Desk. Available online: https://confluence.qps.nl/qinsy/latest/en/how-to-calibrate-a-multibeam-echosounder-35587229.html (accessed on 15 August 2019).
Figure 1. Illustration of the interaction between the incidence light and wetted sand. The path R 1 denotes the light directly reflected from the surface water film of saturated sand. Path R 2 demonstrates the remaining light that is transmitted through the water surface and subject to reflection from sand grains and absorption by water.
Remotesensing 12 00209 g001
Figure 2. (a) The sketch of incidence angle experiments: the laser scanner is placed on the stair landing of a staircase and the sand samples are laid on eleven horizontal platforms. These eleven platforms have a fixed distance (5 m) from the scanner centre but different incidence angles varying from 0° to 80°. (b) The sketch of the distance experiments: the distance from the laser scanner to the target samples varied in steps of 1 m from 1 to 4 m and then in steps of 2 to 20 m by setting up the scanner at different floors. The sand samples were placed on the ground floor.
Remotesensing 12 00209 g002
Figure 3. The close-up images of the sand samples with different moisture contents. The size of each plastic container has a 5 mm depth × a 10 cm width × a 20 cm length.
Remotesensing 12 00209 g003
Figure 4. Contour lines of the Z&F/Leica HDS6100 original intensity versus the incidence angle (0–80°) and the gravimetric moisture contents (0–26%) when scanning sand samples from a fixed 5 m distance.
Remotesensing 12 00209 g004
Figure 5. Contour lines of the Z&F/Leica HDS6100 original intensity versus the distance (1–20 m) and the gravimetric moisture contents (0–25%) when scanning sand samples orthogonally.
Remotesensing 12 00209 g005
Figure 6. Contour lines of the derived moisture versus the incidence angle (30–80°) and the gravimetric moisture contents (0–25%) based on the incidence angle experiments.
Remotesensing 12 00209 g006
Figure 7. Contour lines of the derived moisture versus the distance (2–12 m) and the gravimetric moisture contents (0–25%) based on the distance experiments.
Remotesensing 12 00209 g007
Figure 8. (a) Study site at the beach of Groenendijk and DEM of a 40 × 50 m area scanned three times. The black points denote the positioning targets. The photos in (b) represent three main morphologies on the measurement beach: flat surface, flat surface with razor shell dumps and flat surface with ripples.
Remotesensing 12 00209 g008
Figure 9. (a) Kymco mobile platform equipped with the following sensors: a Z&F/Leica HDS6100 laser scanner, an IMU and two RTK-GNSS antennas and (b) MTL measurement on the beach where the effective scanning range on the wet beach is about 12 m with a scanner height of 1.75 m.
Remotesensing 12 00209 g009
Figure 10. (a) Beach surface with the original intensity of four survey lines before correction and (b) beach surface moisture content of the same four survey lines after correction.
Remotesensing 12 00209 g010
Figure 11. (a) Absolute values of the surface moisture difference in the overlapping strip of adjacent survey lines and (b) standard deviation of the derived moisture contents with grid cells of 10 × 10 cm.
Remotesensing 12 00209 g011
Figure 12. (a) The beach surface moisture at 12:30, 14:00 and 15:30, respectively and (b) the moisture differences between these three time moments. The moisture map of 12:30 also presents the position of the samples S1–S7.
Remotesensing 12 00209 g012
Figure 13. The beach surface moisture map of 200 × 200 m on the beach of Groenendijk, Belgium based on 24 survey lines of MTL. In the left corner, a simultaneously acquired orthophoto of the study site is given where we clearly see the distribution of the trough. The black dotted box indicates the repeated scanning area and the points S1–S8 localize the eight sampling sites.
Remotesensing 12 00209 g013
Table 1. Main parameters of the Z&F/Leica HDS6100.
AttributeValue
Wavelength650–690 nm
Maximum range50 m at 18% albedo
Field of View360° × 310°
Laser beam divergence0.22 mrad
Position accuracy5 mm (1–25 m), 9 mm (25–50 m)
Table 2. Mean values of the parameters in Equation (14).
F 1   c
−3.23   ±   0.28
F 2 N 2 β 0 β 1
10.75   ±   0.131
F 3 N 3 γ 0 γ 1 γ 2 γ 3 γ 4 γ 5
5−10,398.95   ±   1509.6213,064.05   ±   2391.26−3990.40   ±   540.70564.62   ±   47.56−38.29   ±   1.481
K 1.65 × 10 4
Table 3. Derived samples’ moisture contents based on the incidence angle experiments.
Moisture (%)Incidence AngleMeanStd.Dev.Std.Error
30°40°50°60°65°70°75°80°
000000000000
10.80.20000.300.10.20.30.8
23.73.12.72.61.82.82.04.32.90.80.9
35.54.53.64.23.33.83.94.74.20.71.2
46.95.85.15.04.13.44.04.44.91.11.0
57.46.85.35.94.74.75.34.95.61.00.8
78.17.77.38.46.66.87.15.87.20.80.7
910.69.78.99.67.28.78.79.39.11.00.7
1112.111.811.011.110.712.210.813.511.61.00.8
1314.013.312.211.312.111.913.713.912.81.00.9
1515.415.213.912.812.413.713.914.414.01.11.2
1715.316.216.615.114.115.615.617.115.70.91.3
1917.417.217.116.417.415.916.220.217.21.32.1
2118.618.718.418.019.218.920.320.619.10.91.9
2319.217.919.419.620.920.924.019.420.21.83.1
2520.821.221.221.924.525.023.224.422.81.72.2
Total Std. Error:1.2
Table 4. Derived samples’ moisture contents based on the data of the distance experiments.
Moisture (%)DistanceMeanStd.Dev.Std.Error
2m3m4m6m8m10m12m
00000000000
1000.400000.10.20.9
24.43.34.93.24.03.33.43.80.71.8
36.55.06.95.25.95.15.55.70.72.7
47.86.58.36.97.66.86.77.20.73.2
59.07.89.47.68.87.98.08.40.73.4
711.110.112.09.610.79.810.010.50.93.5
912.911.513.511.512.512.011.912.30.83.3
1113.312.214.213.313.513.713.113.30.62.3
1316.014.615.715.714.815.414.515.30.62.3
1517.916.318.316.417.216.717.017.10.72.1
1720.018.620.418.919.618.719.019.30.72.3
1919.618.720.318.820.019.419.919.50.60.7
2119.018.320.218.220.119.319.819.30.81.7
2317.316.617.717.217.916.916.917.20.55.8
2513.215.014.813.217.315.016.515.01.510.0
Total Std.Error:2.9
Table 5. The difference between the real sample moisture contents and the derived moisture content based on eight sand samples collected from the target beach.
Moisture (%)S1
Remotesensing 12 00209 i001
S2
Remotesensing 12 00209 i002
S3
Remotesensing 12 00209 i003
S4
Remotesensing 12 00209 i004
S5
Remotesensing 12 00209 i005
S6
Remotesensing 12 00209 i006
S7
Remotesensing 12 00209 i007
S8
Remotesensing 12 00209 i008
Real moistureTrough 26.920.113.58.15.9Trough 1.2
0.4 × 0.4 mDerived moisture
(Std.Dev.)
No points26.0 ± 0.222.8 ± 4.215.2 ± 5.29.4 ± 1.87.3 ± 3.425.4 ± 1.90.1 ± 1.4
Difference−0.92.71.71.31.4None−1.1
1 × 1 mDerived moisture
(Std.Dev.)
22.8 ± 3.925.7 ± 2.422.0 ± 5.016.7 ± 4.39.6 ± 2.17.9 ± 3.625.5 ± 1.70.1 ± 1.0
DifferenceNone−1.21.93.21.52.0None−1.1