Generating the Baseline in the Early Detection of Bud Rot and Red Ring Disease in Oil Palms by Geospatial Technologies

 ,
,  ,
,  ,
,  and
and
Abstract
:
1. Introduction
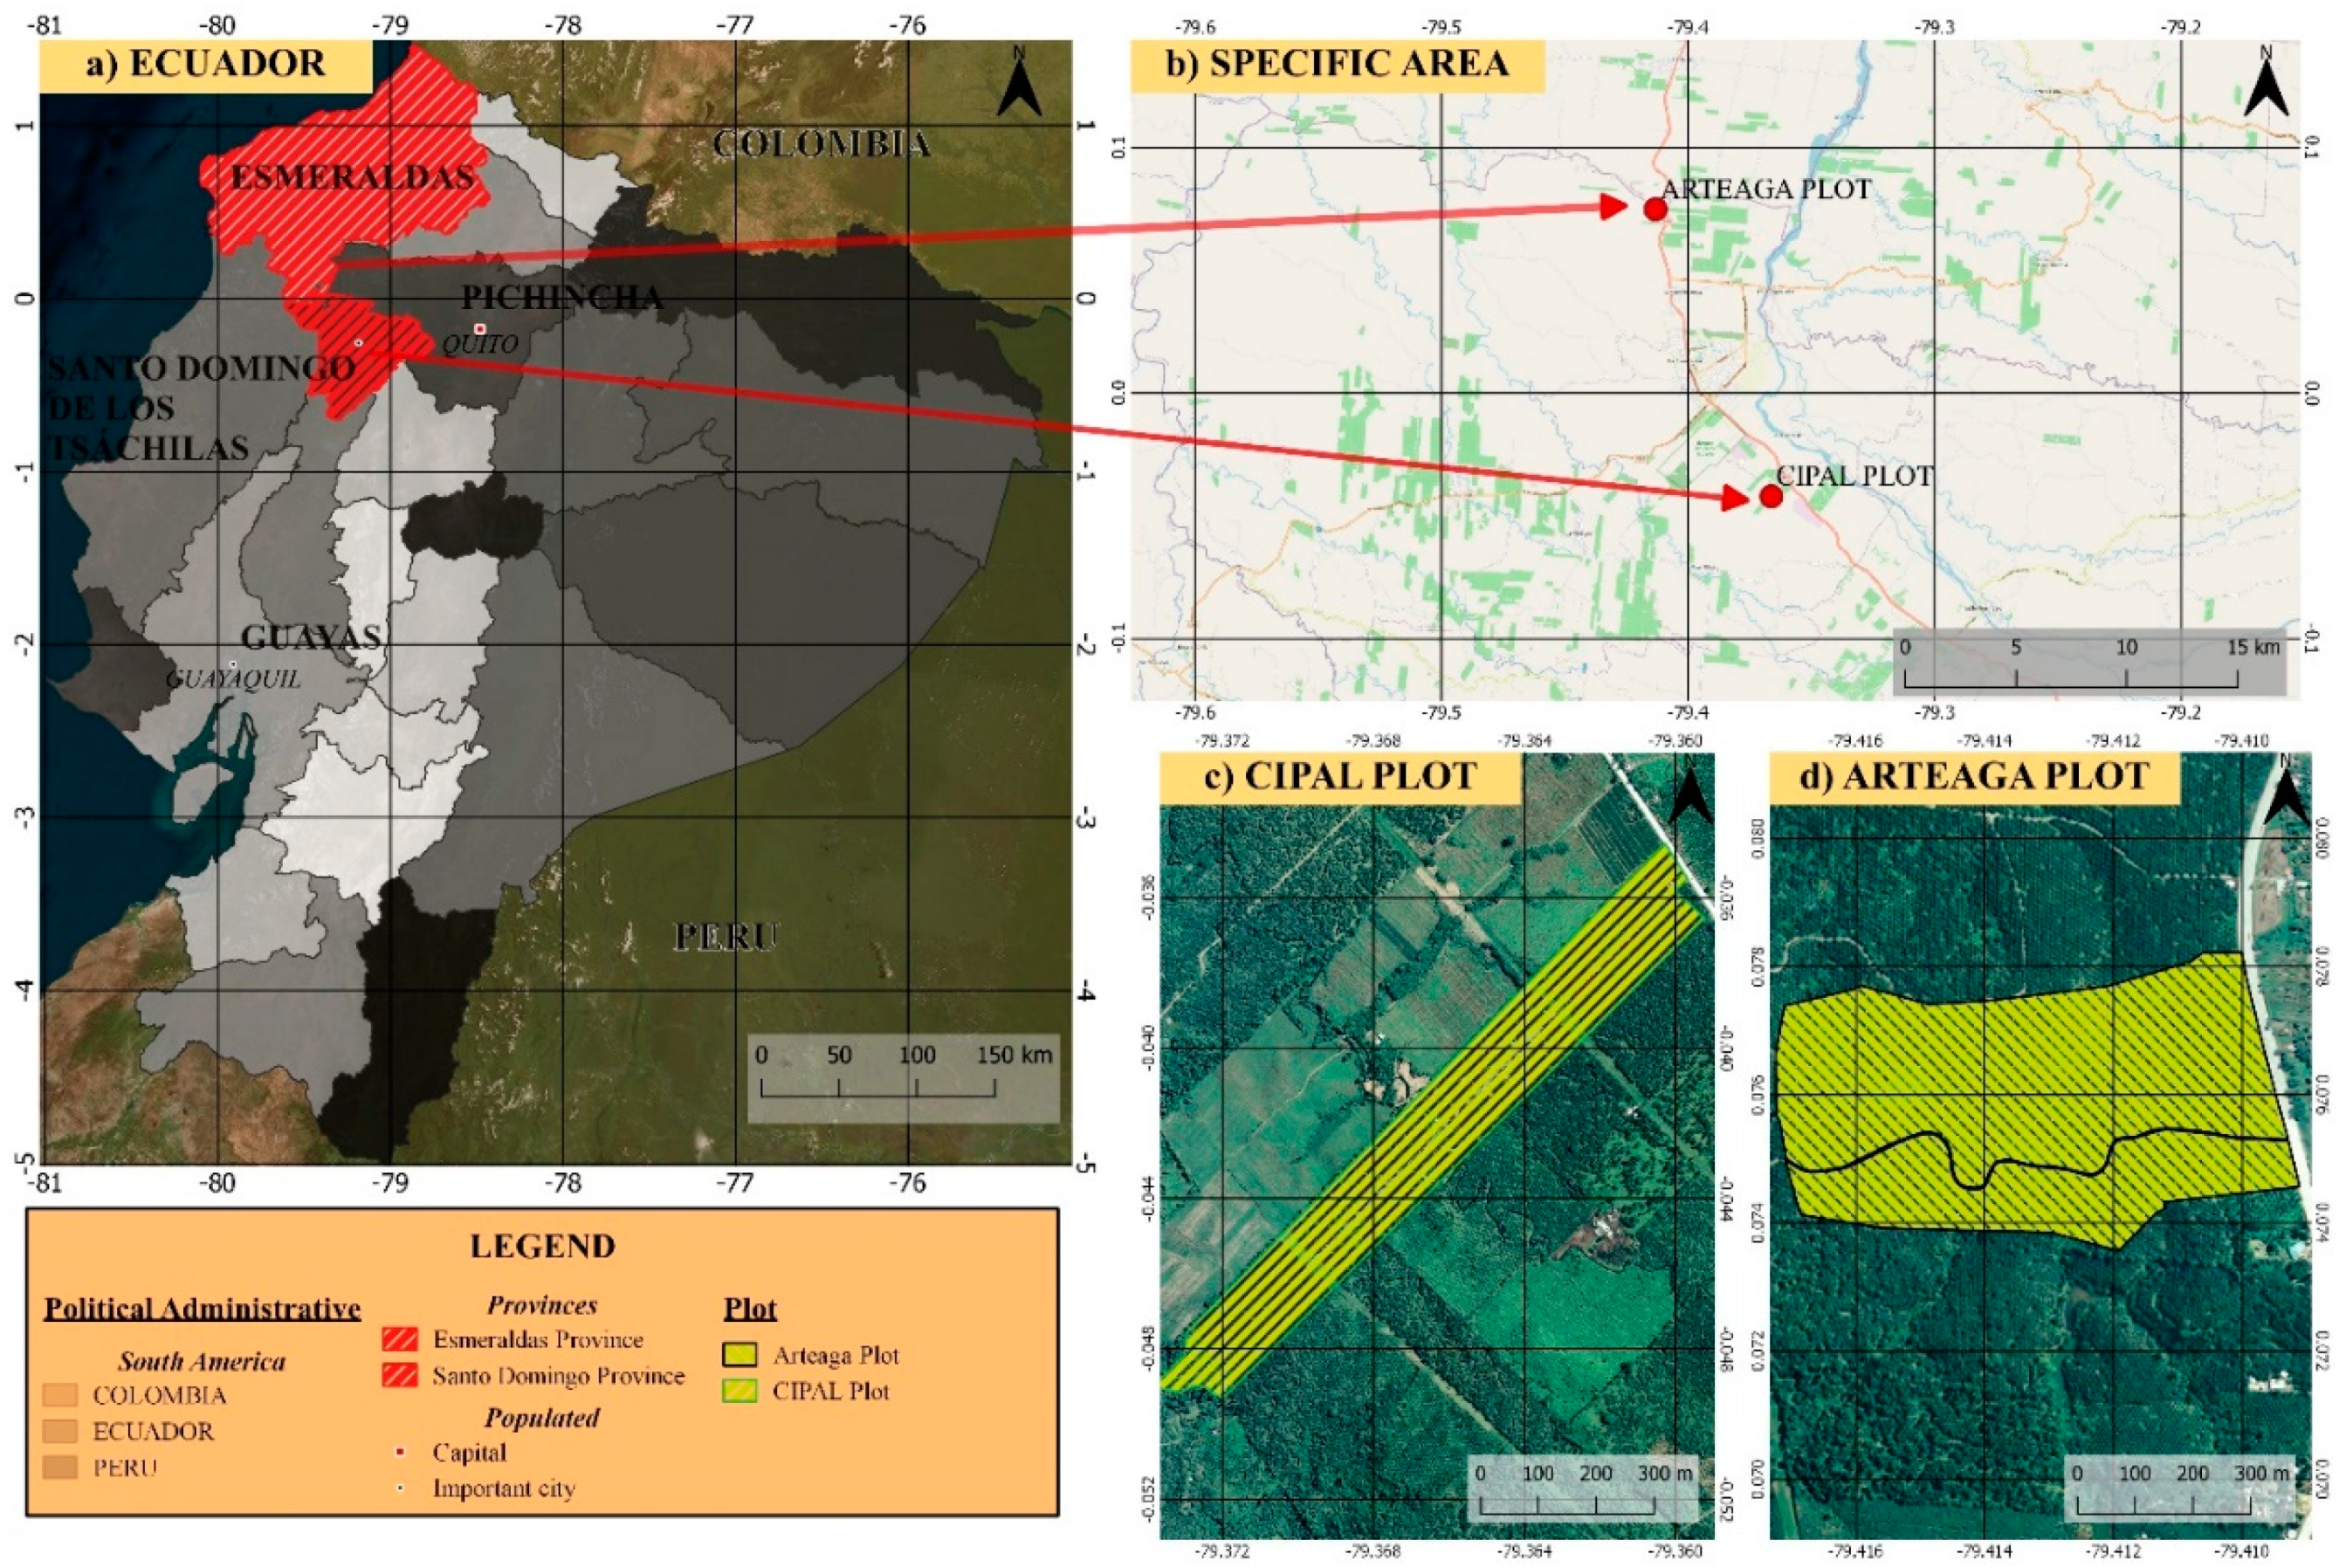
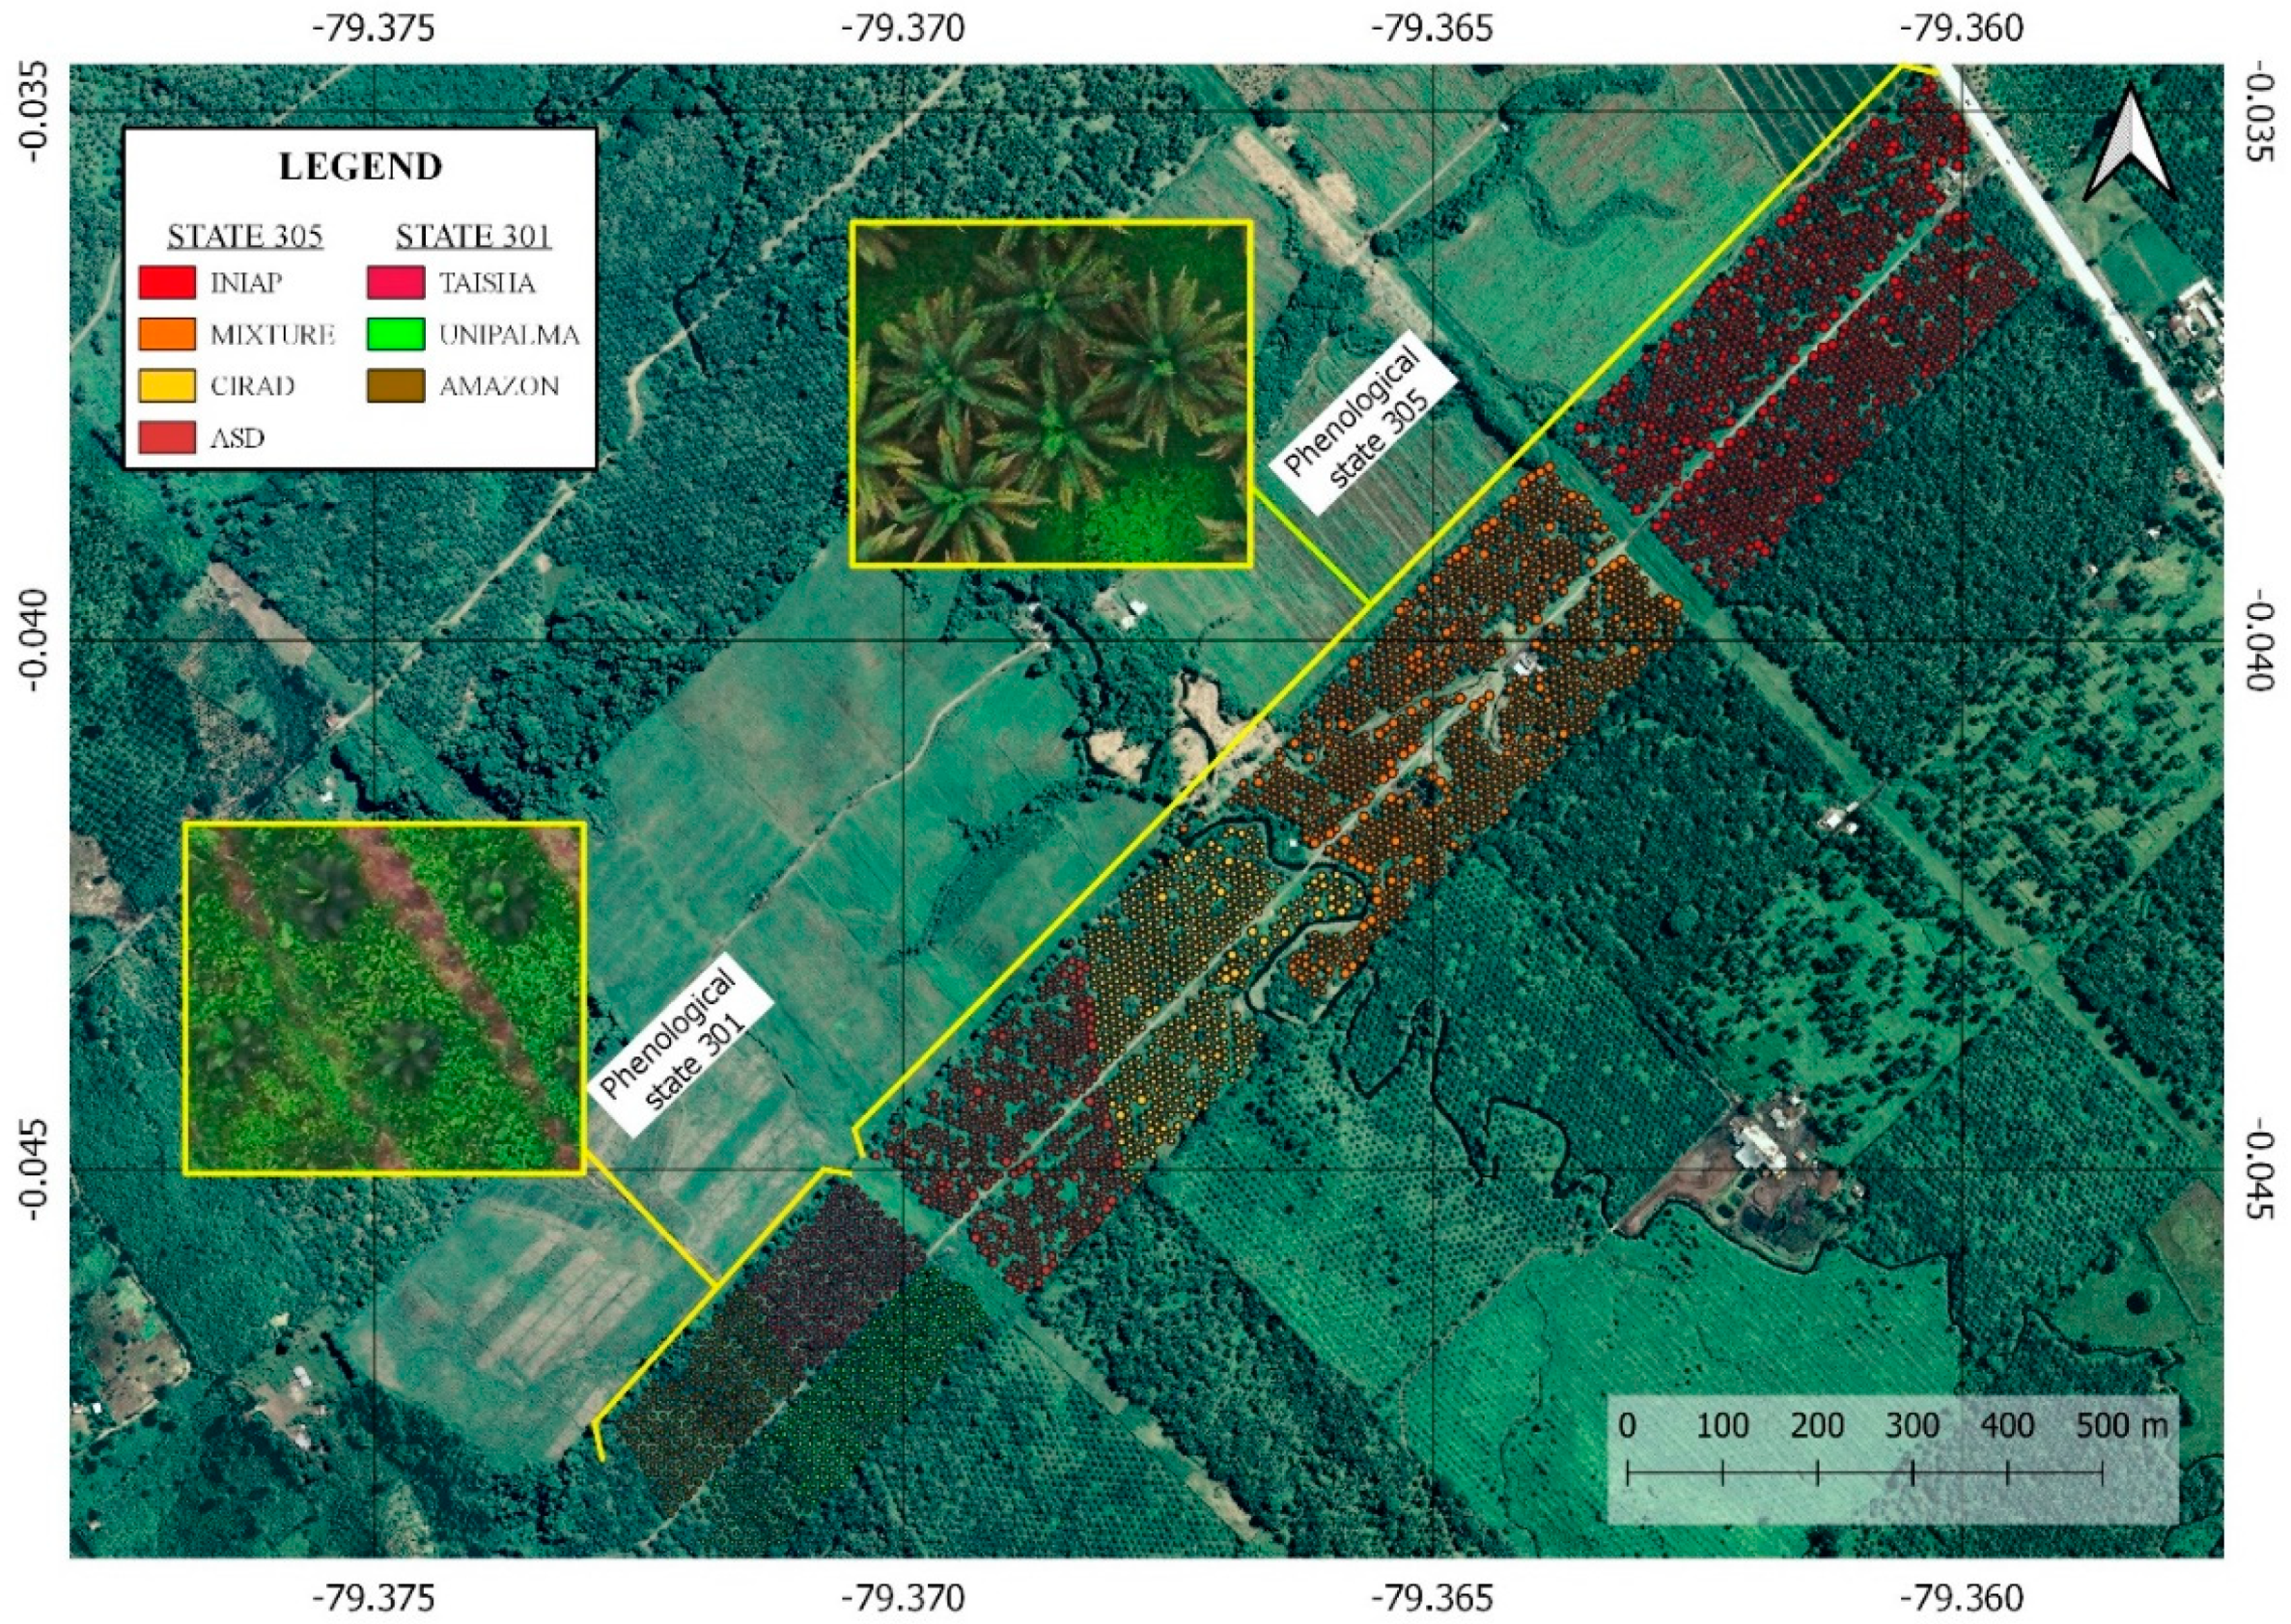
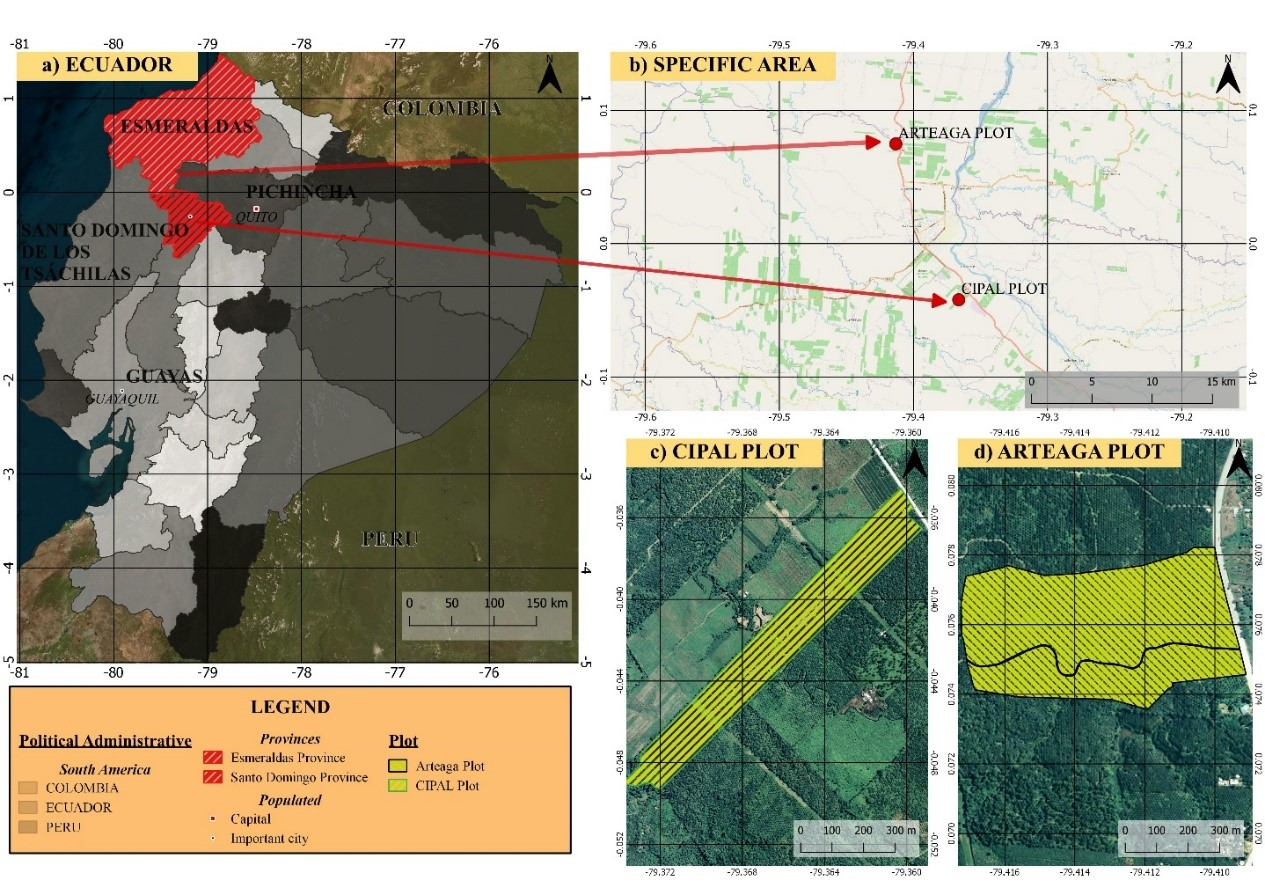
2. Study Area
3. Material
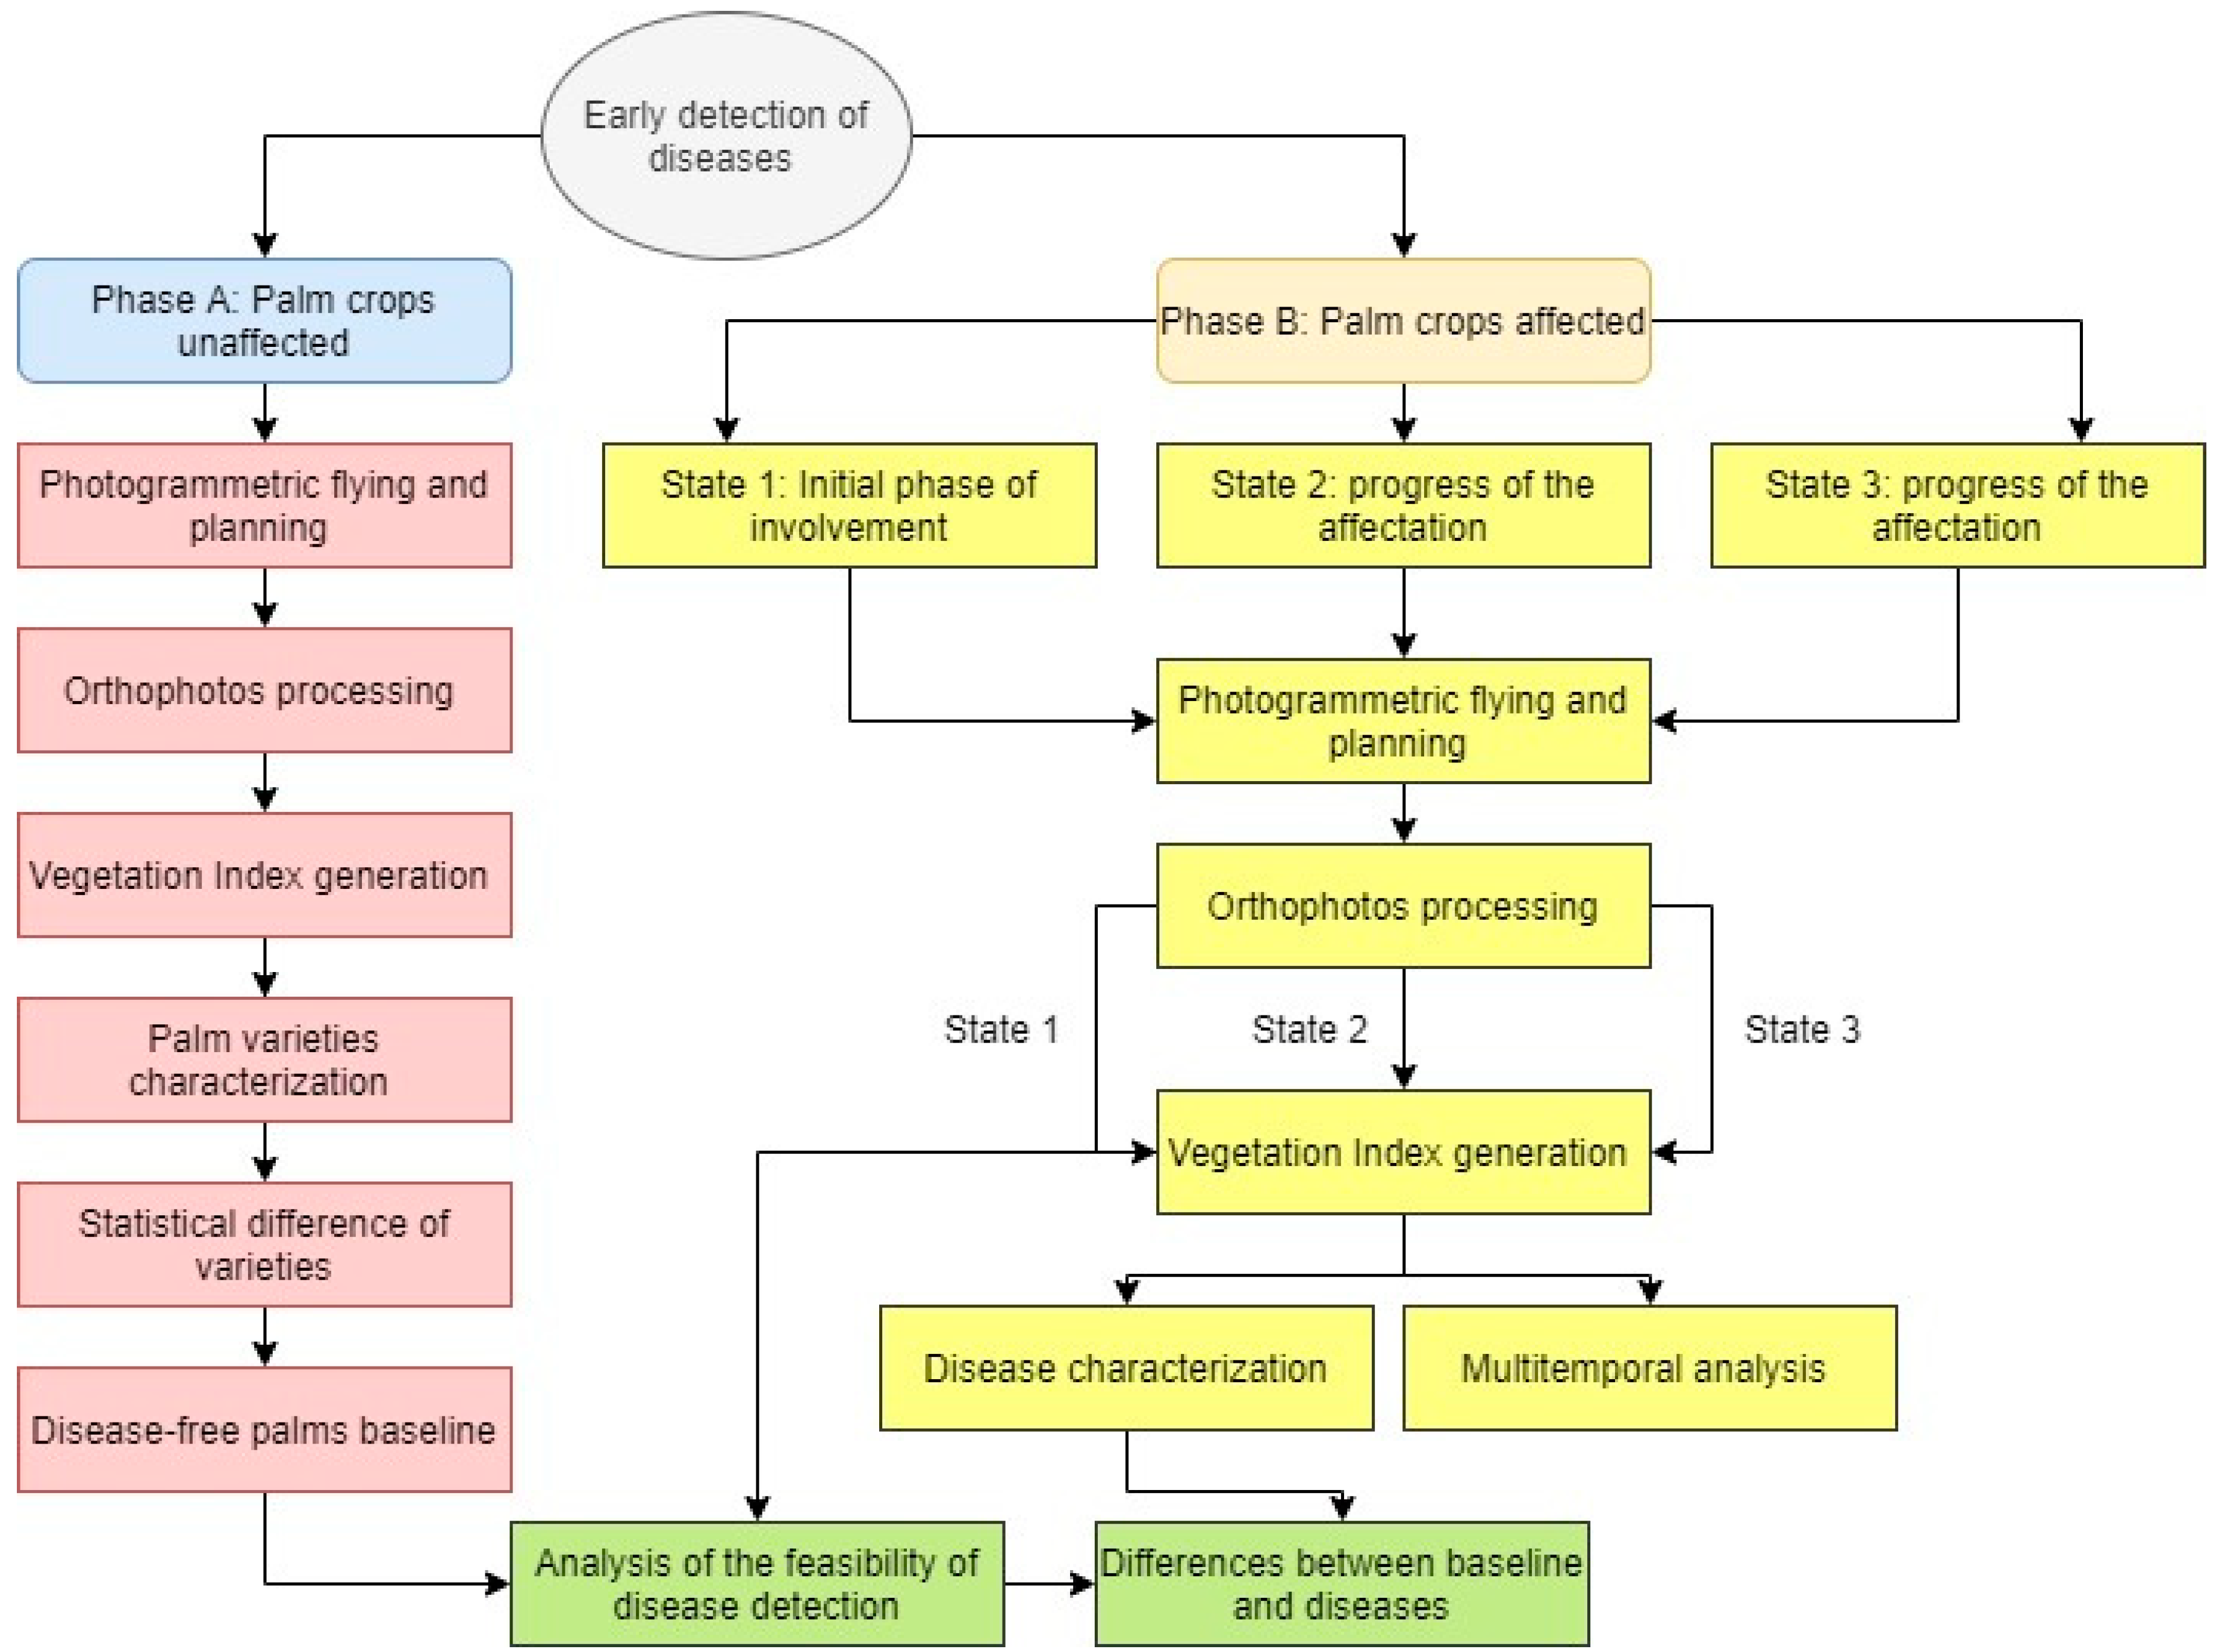
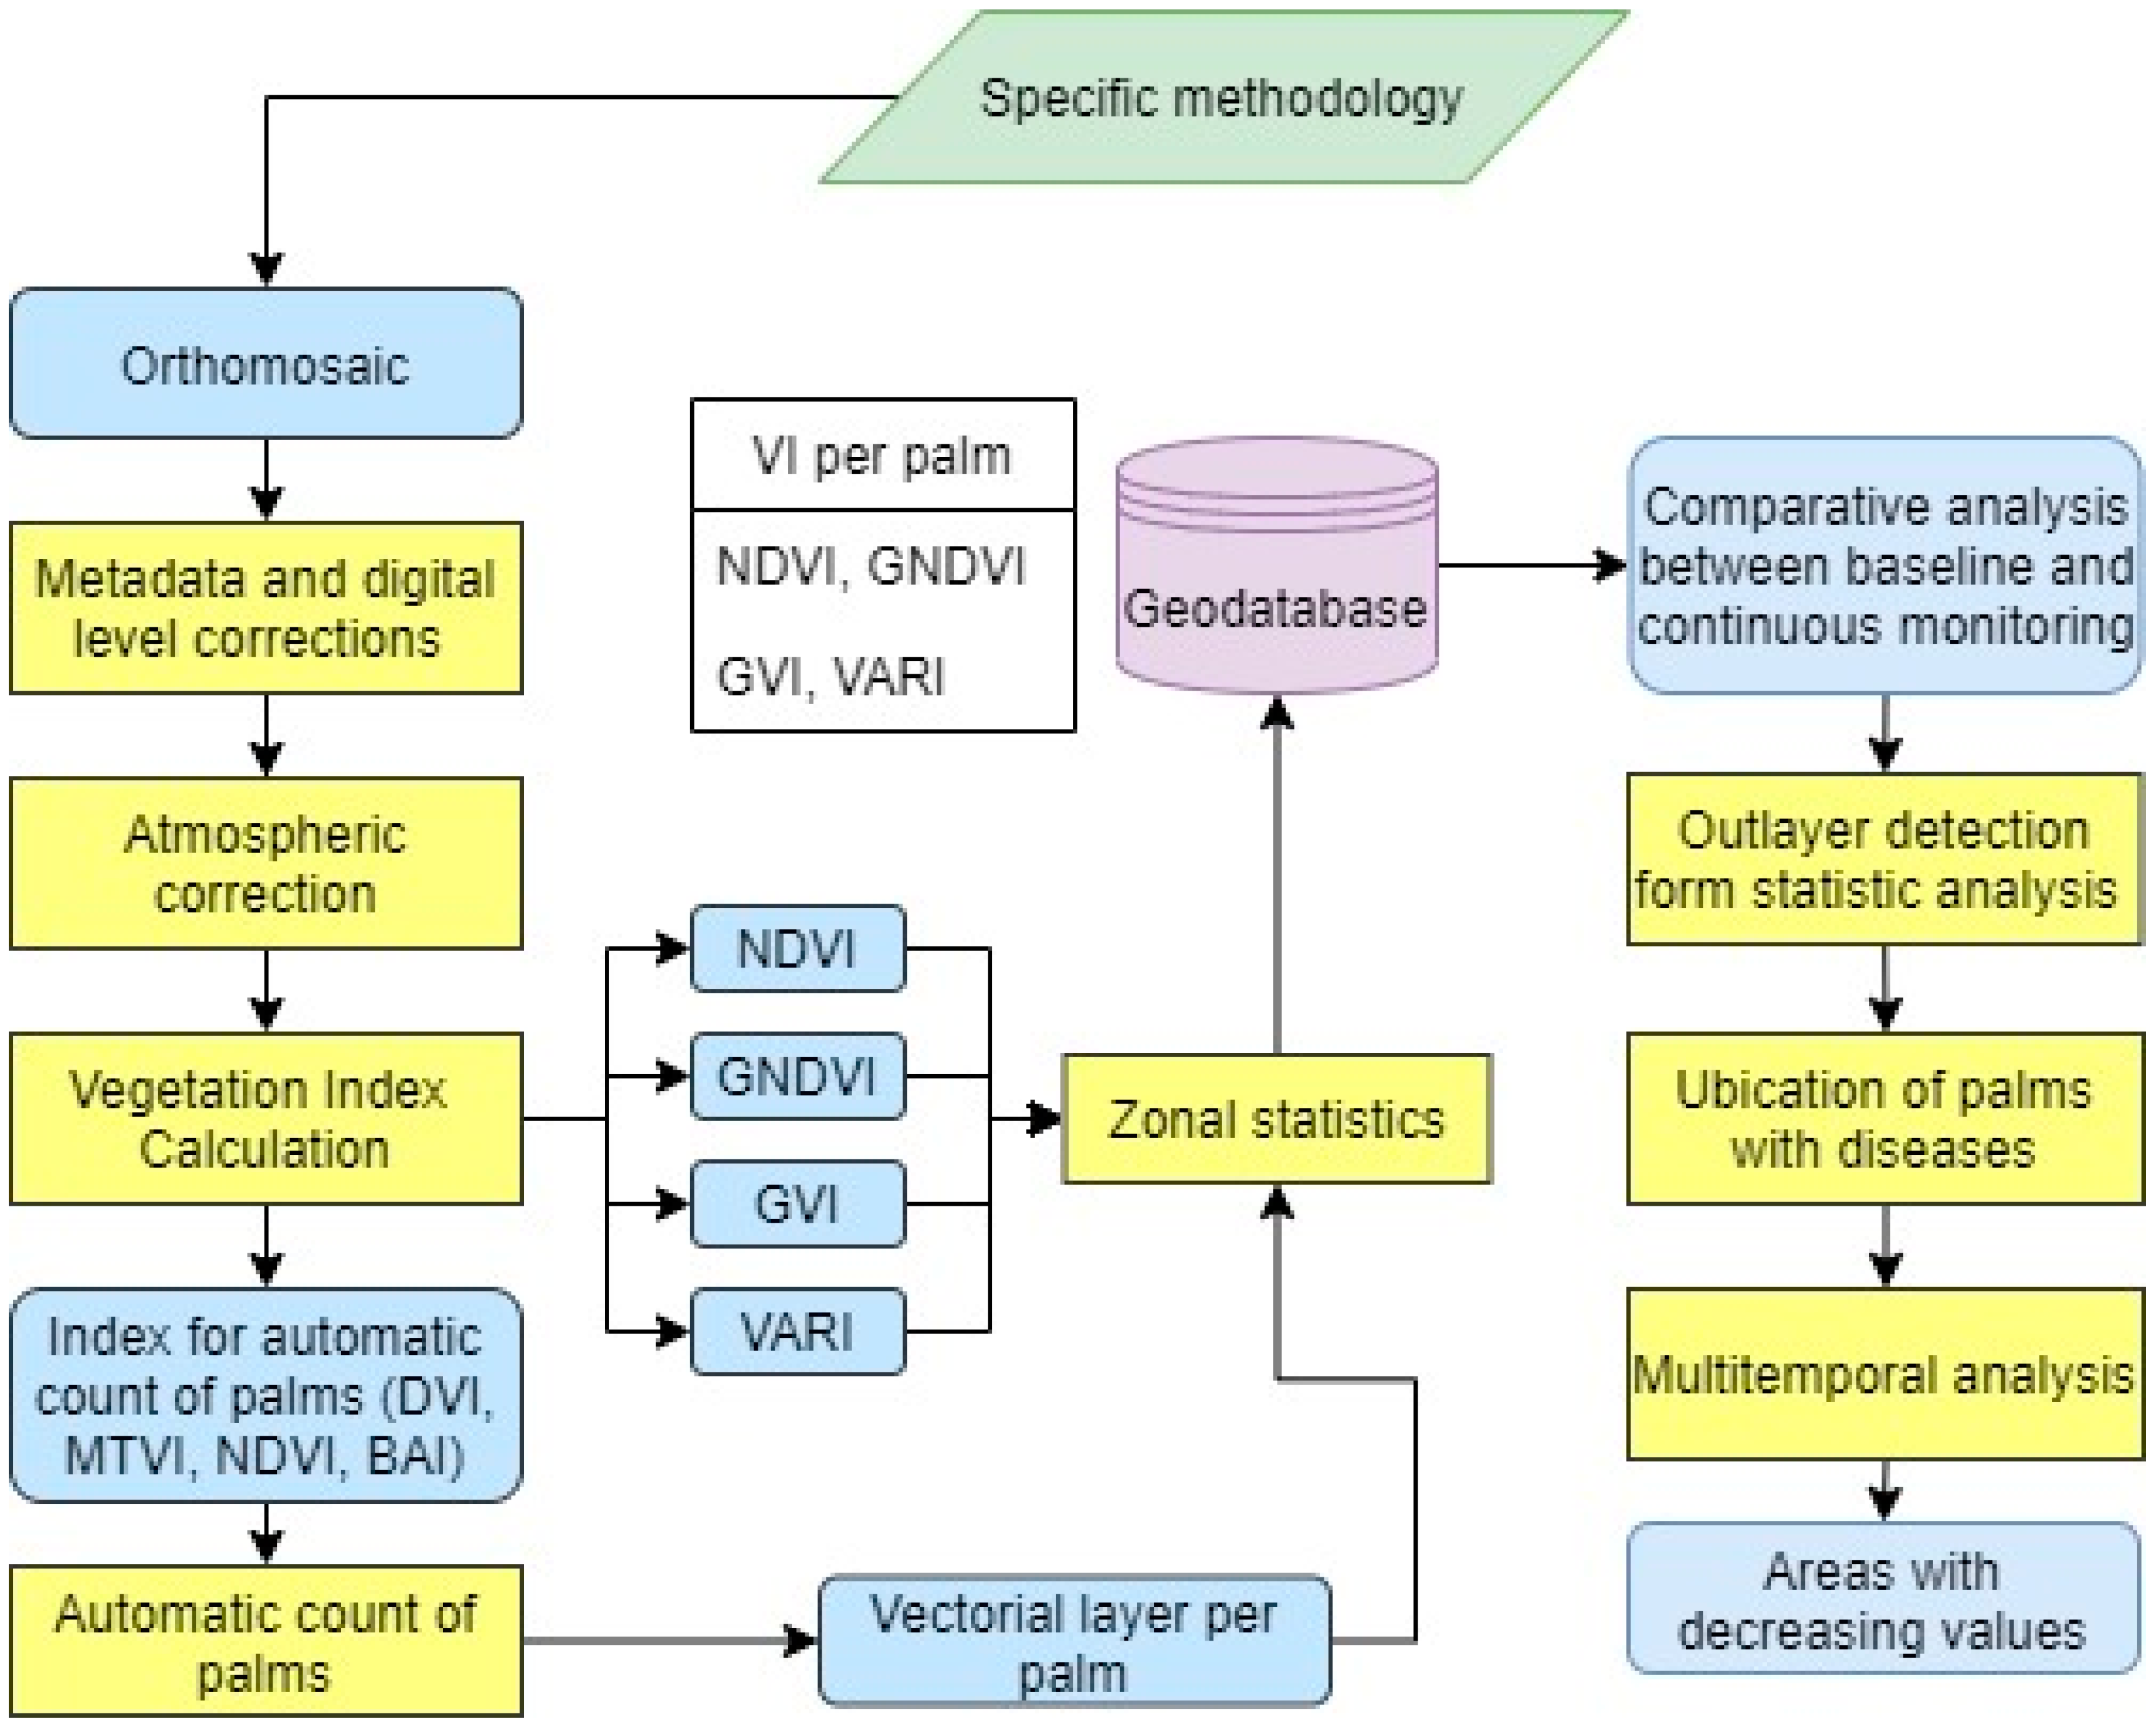
4. Methodology
4.1. Phase A
4.2. Phase B
4.3. Detection of Diseases and Control
4.4. Multitemporal Analysis
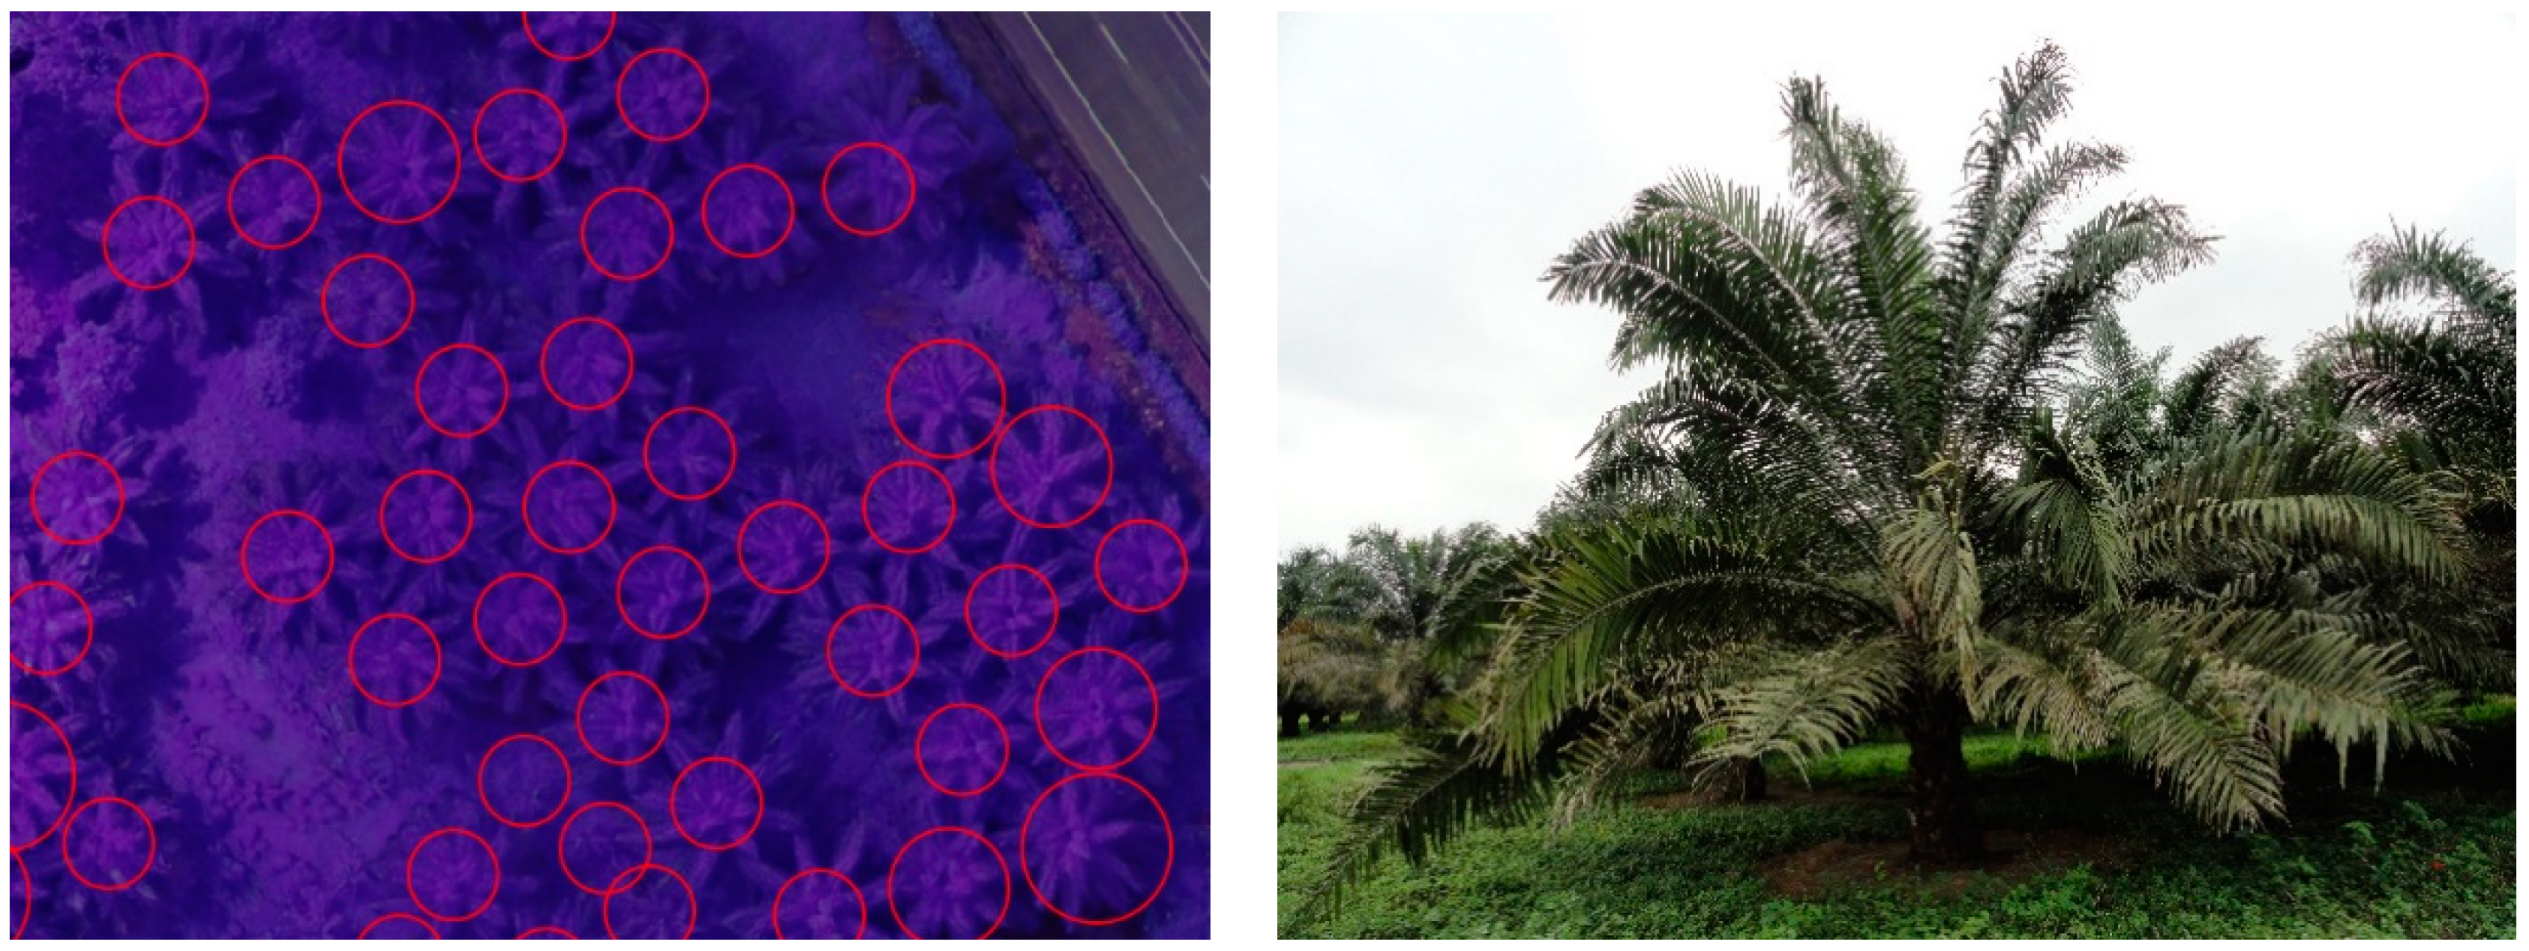
4.5. Ground-Truth
5. Results
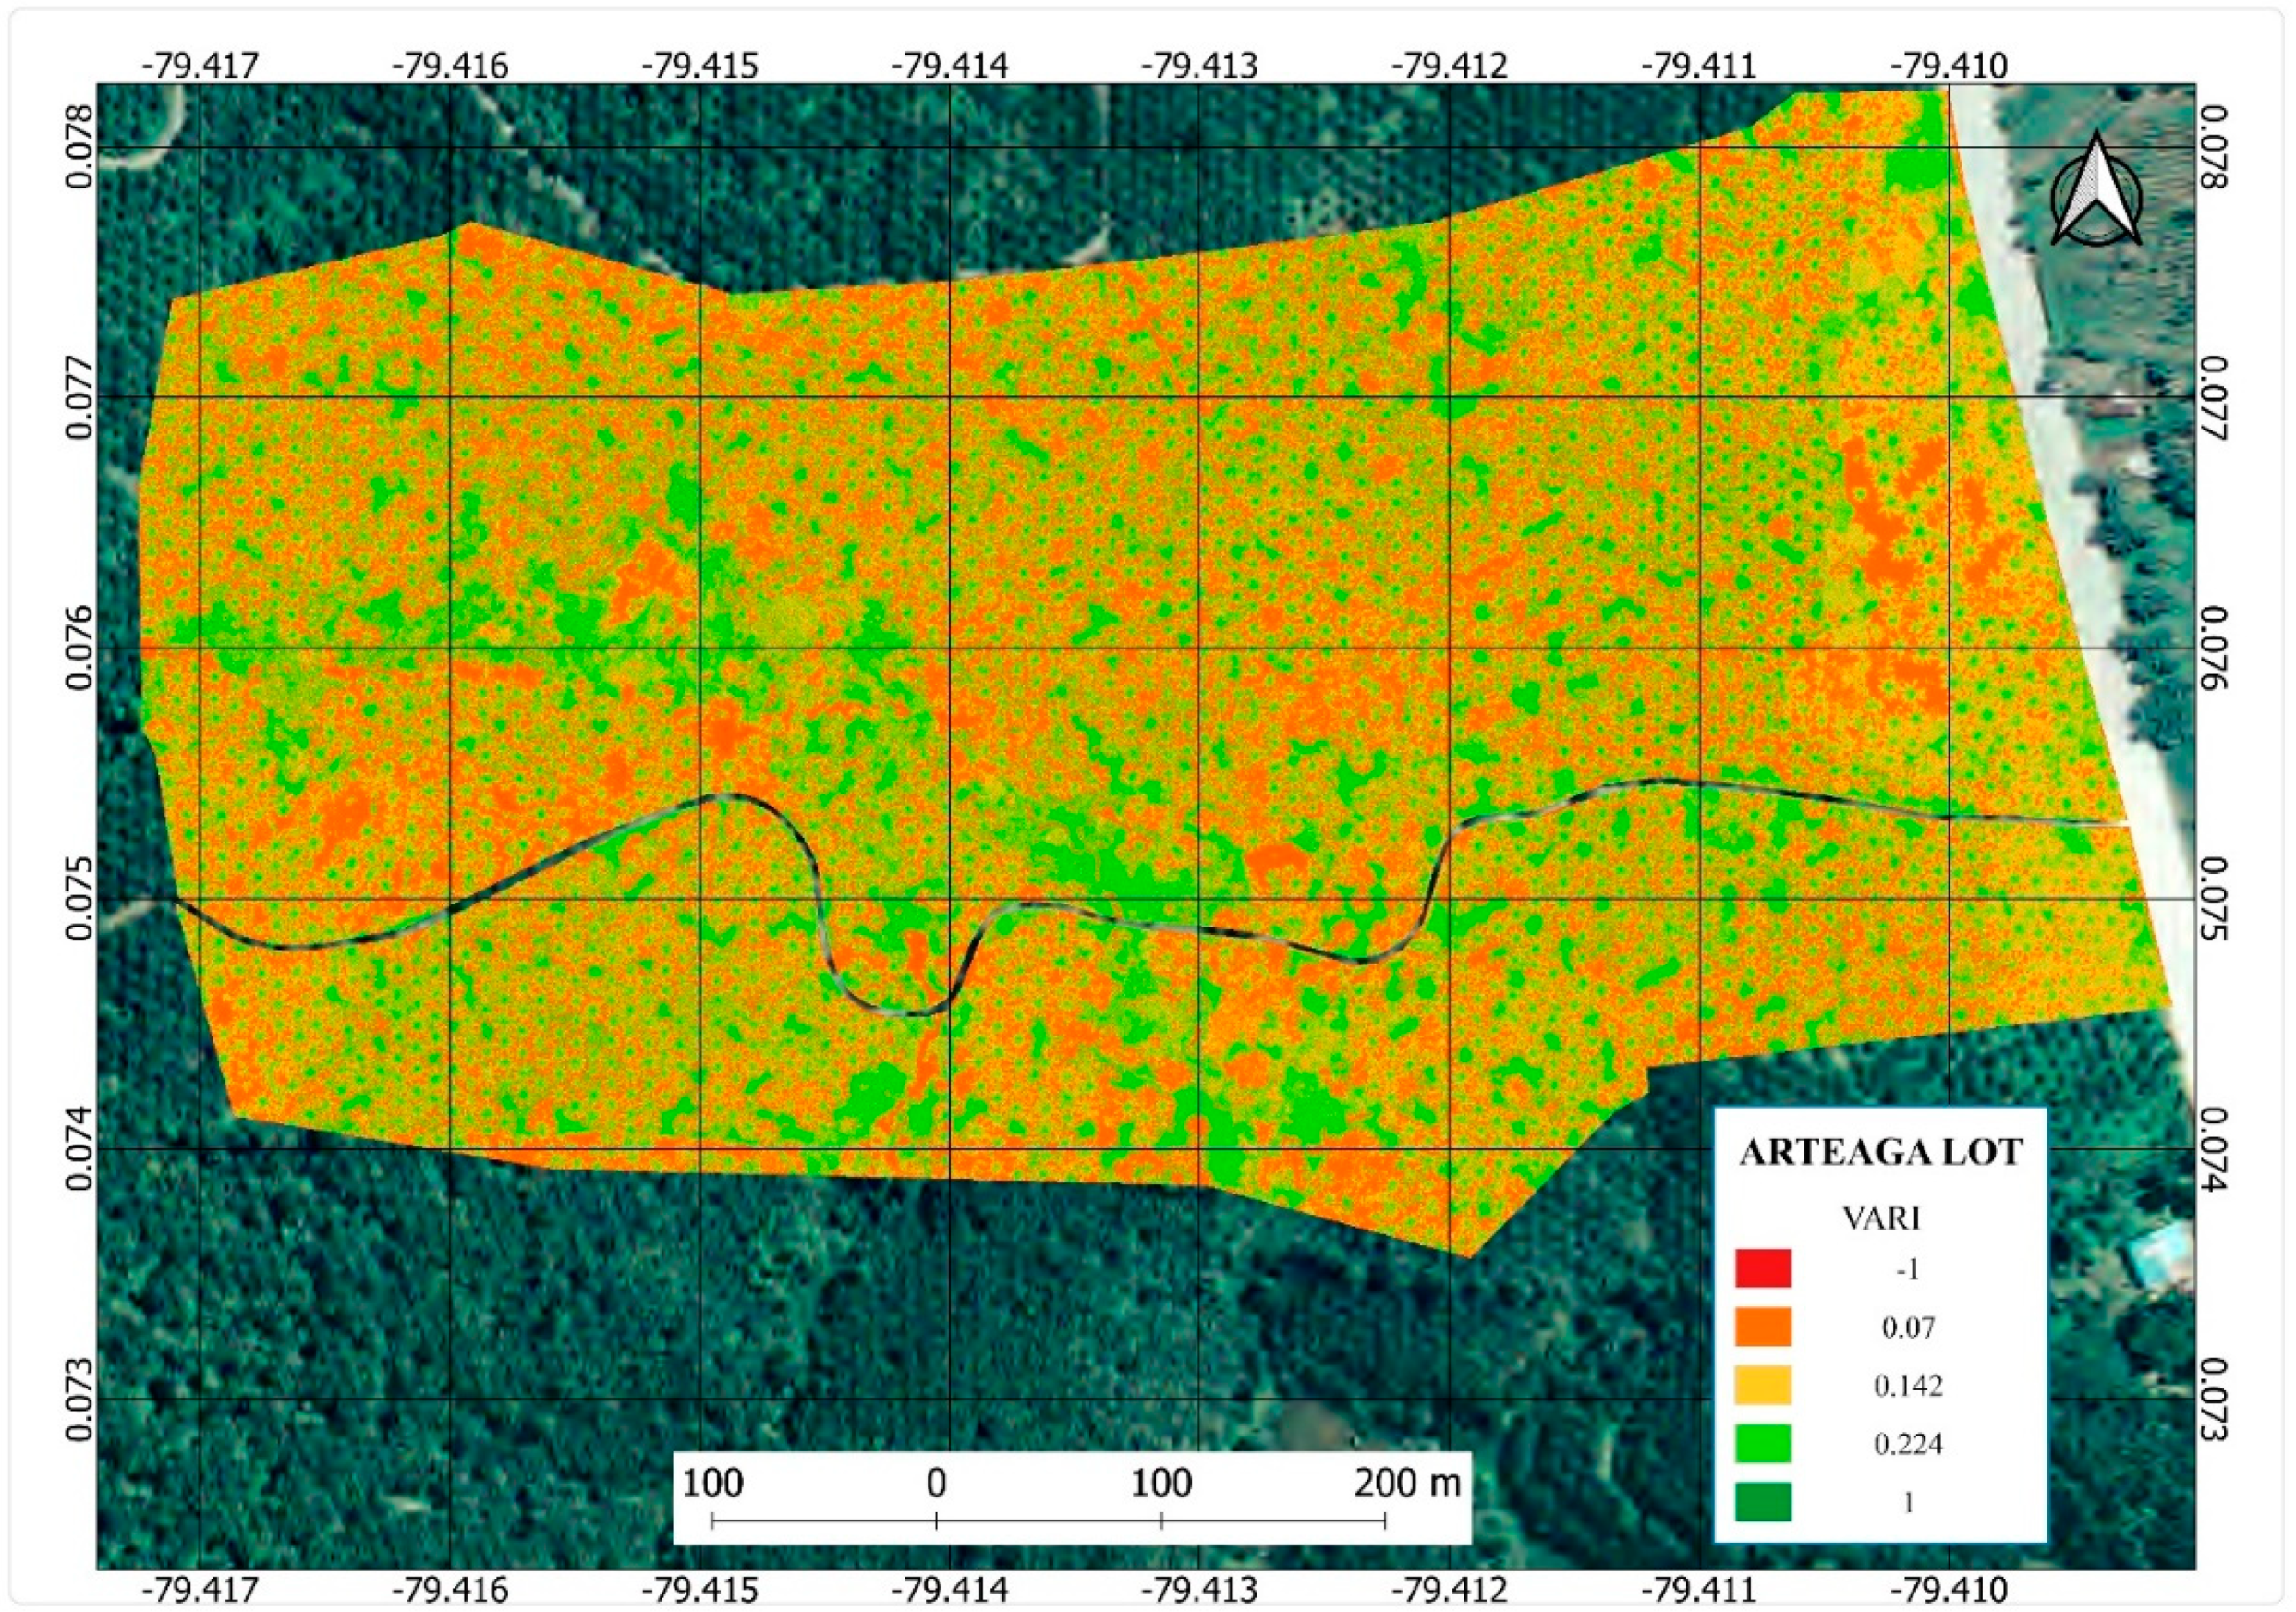
5.1. Phase A
5.2. Phase B
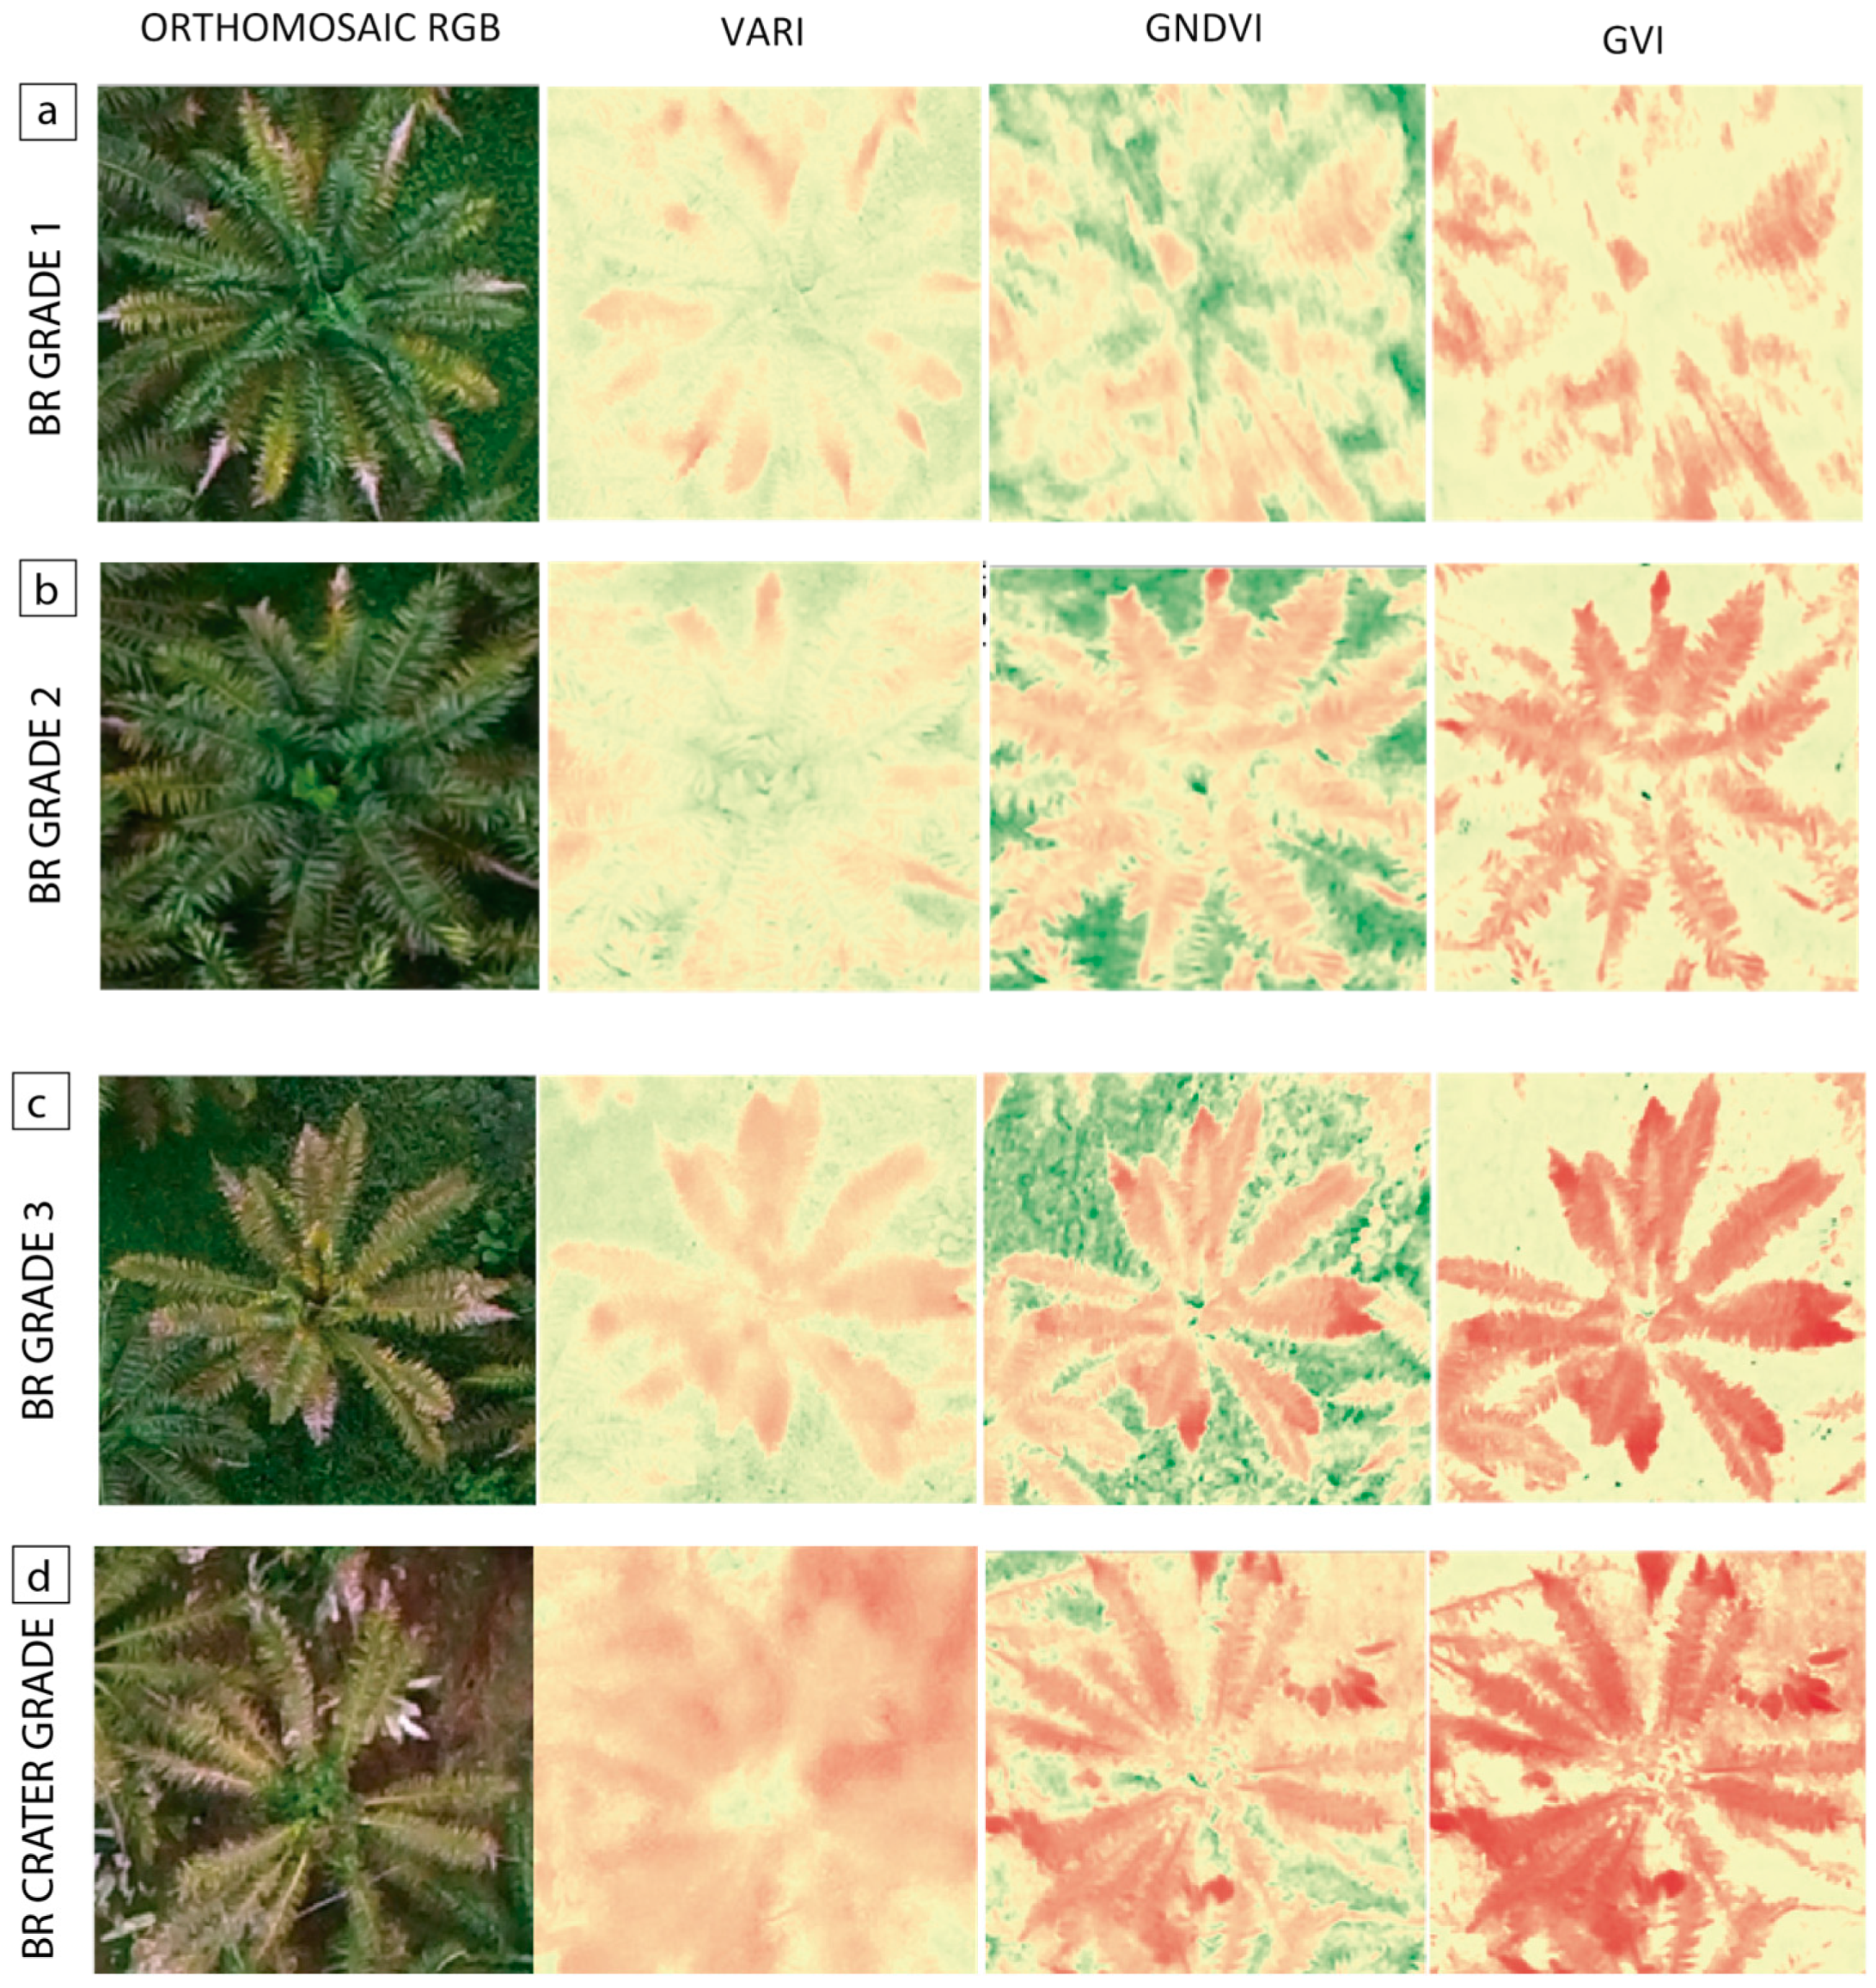
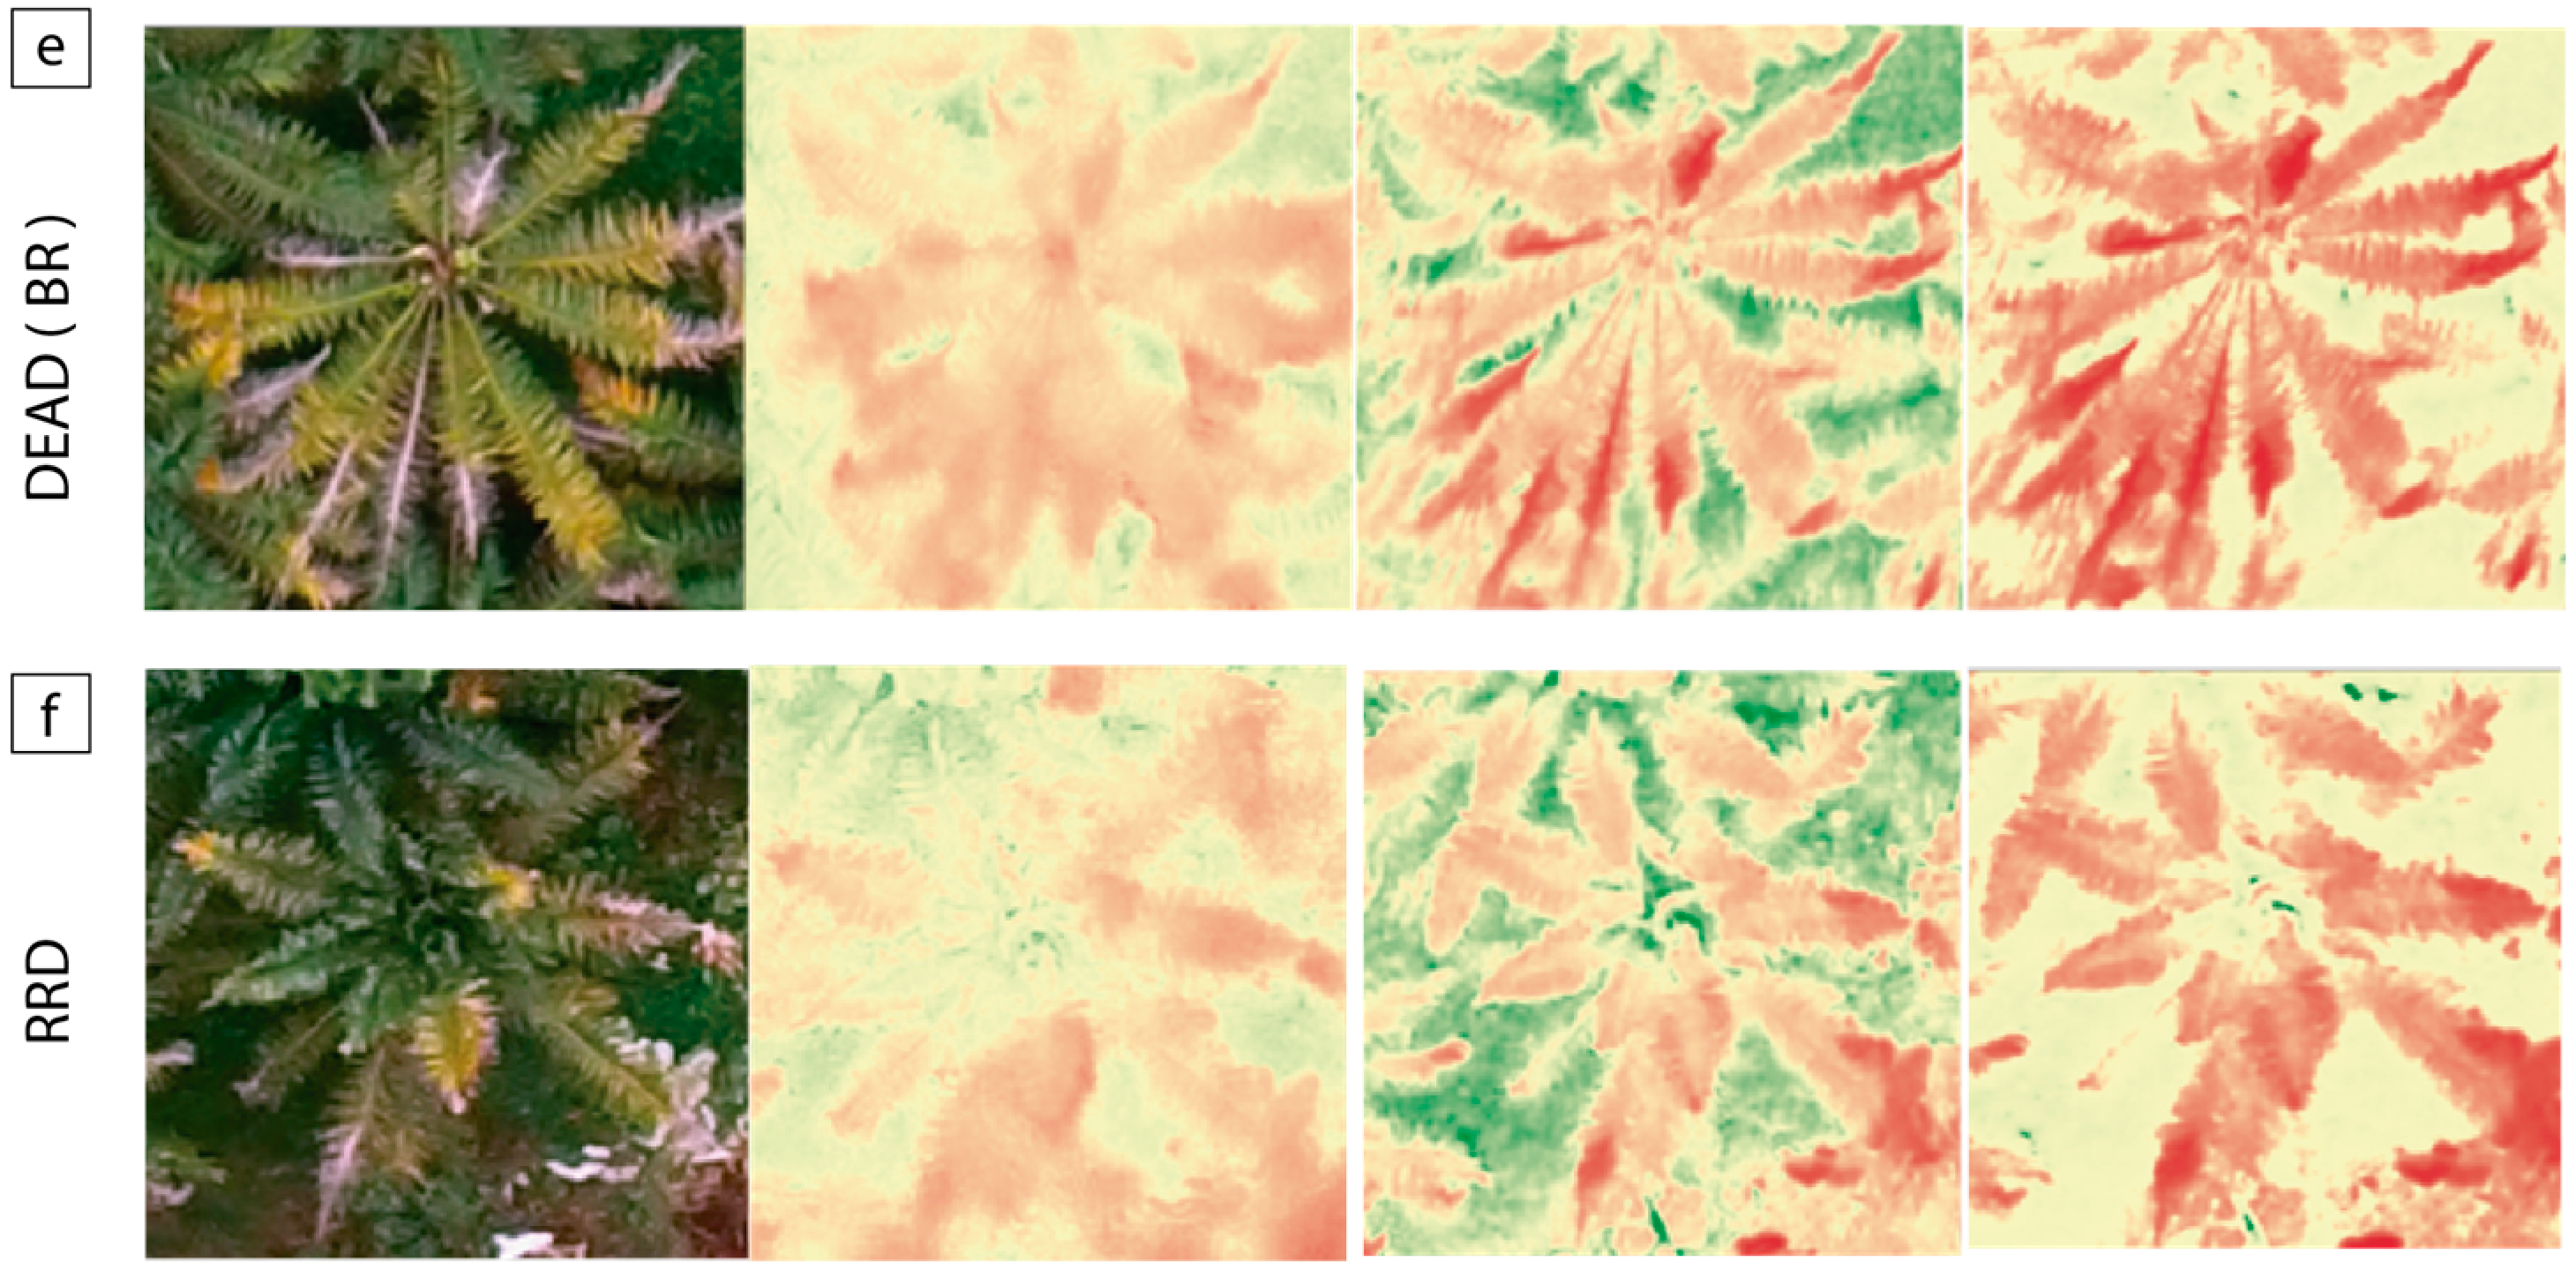
5.3. Detection of Diseases and Control
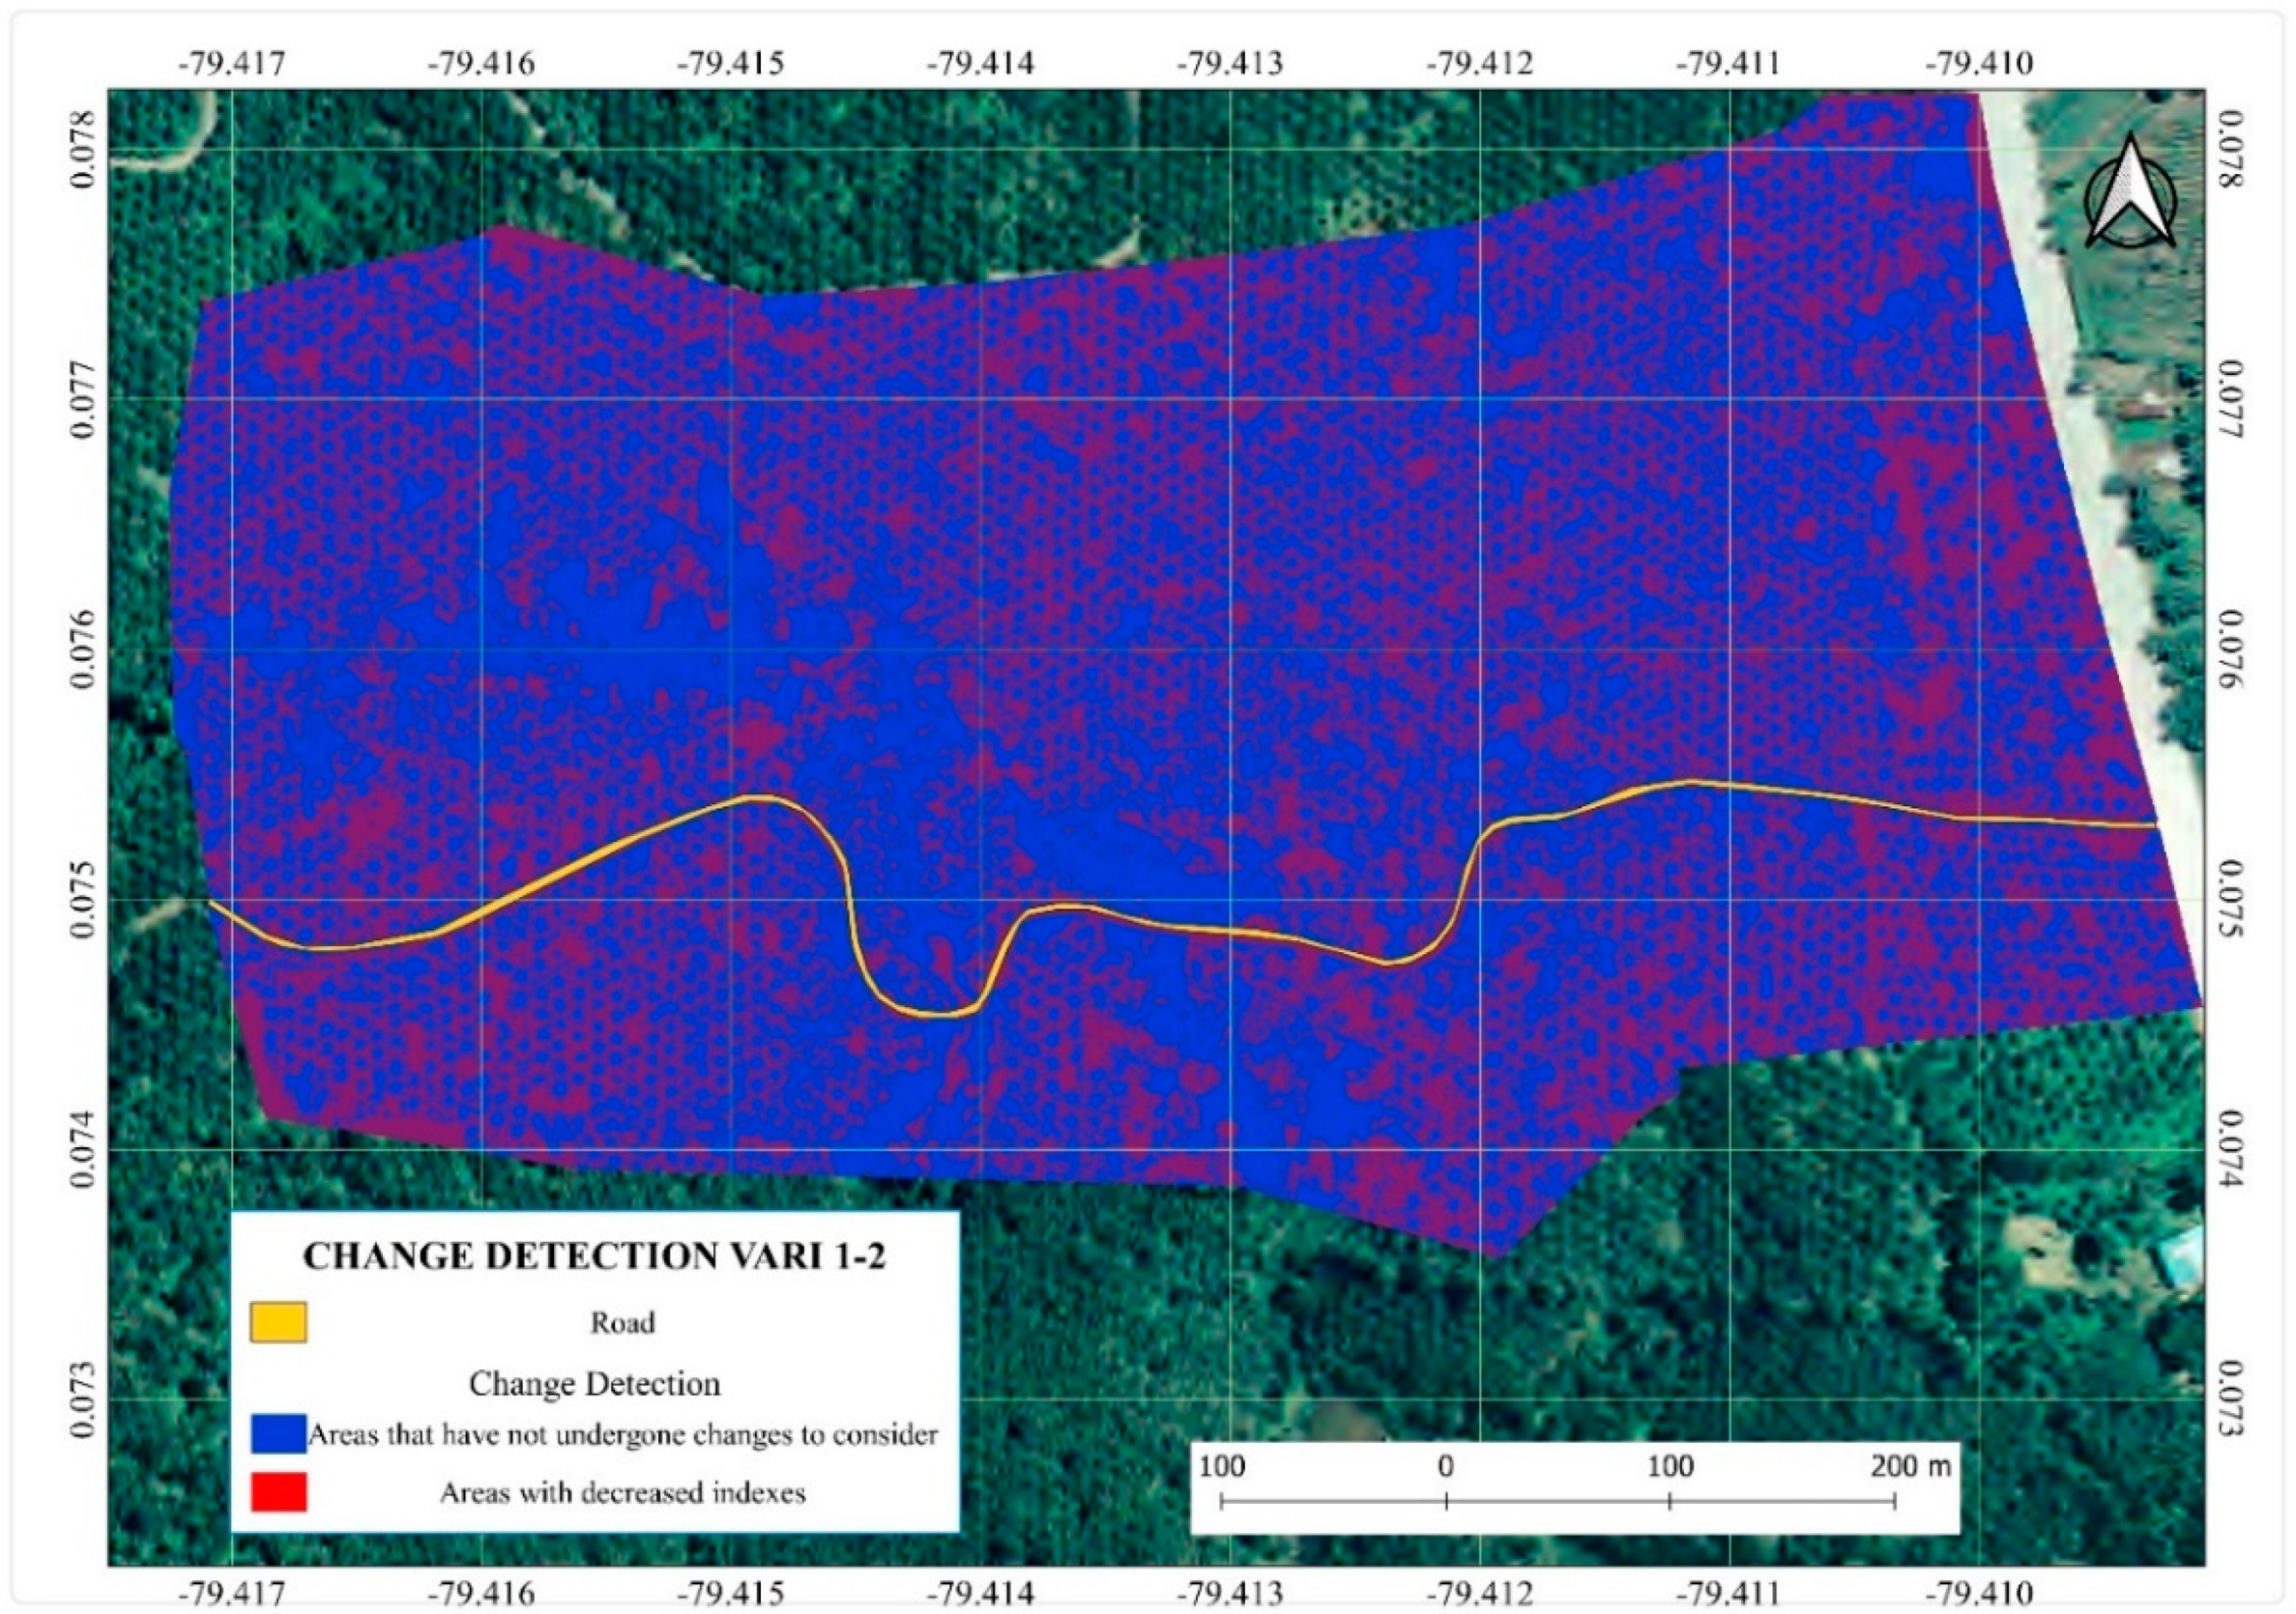
5.4. Multitemporal Analysis
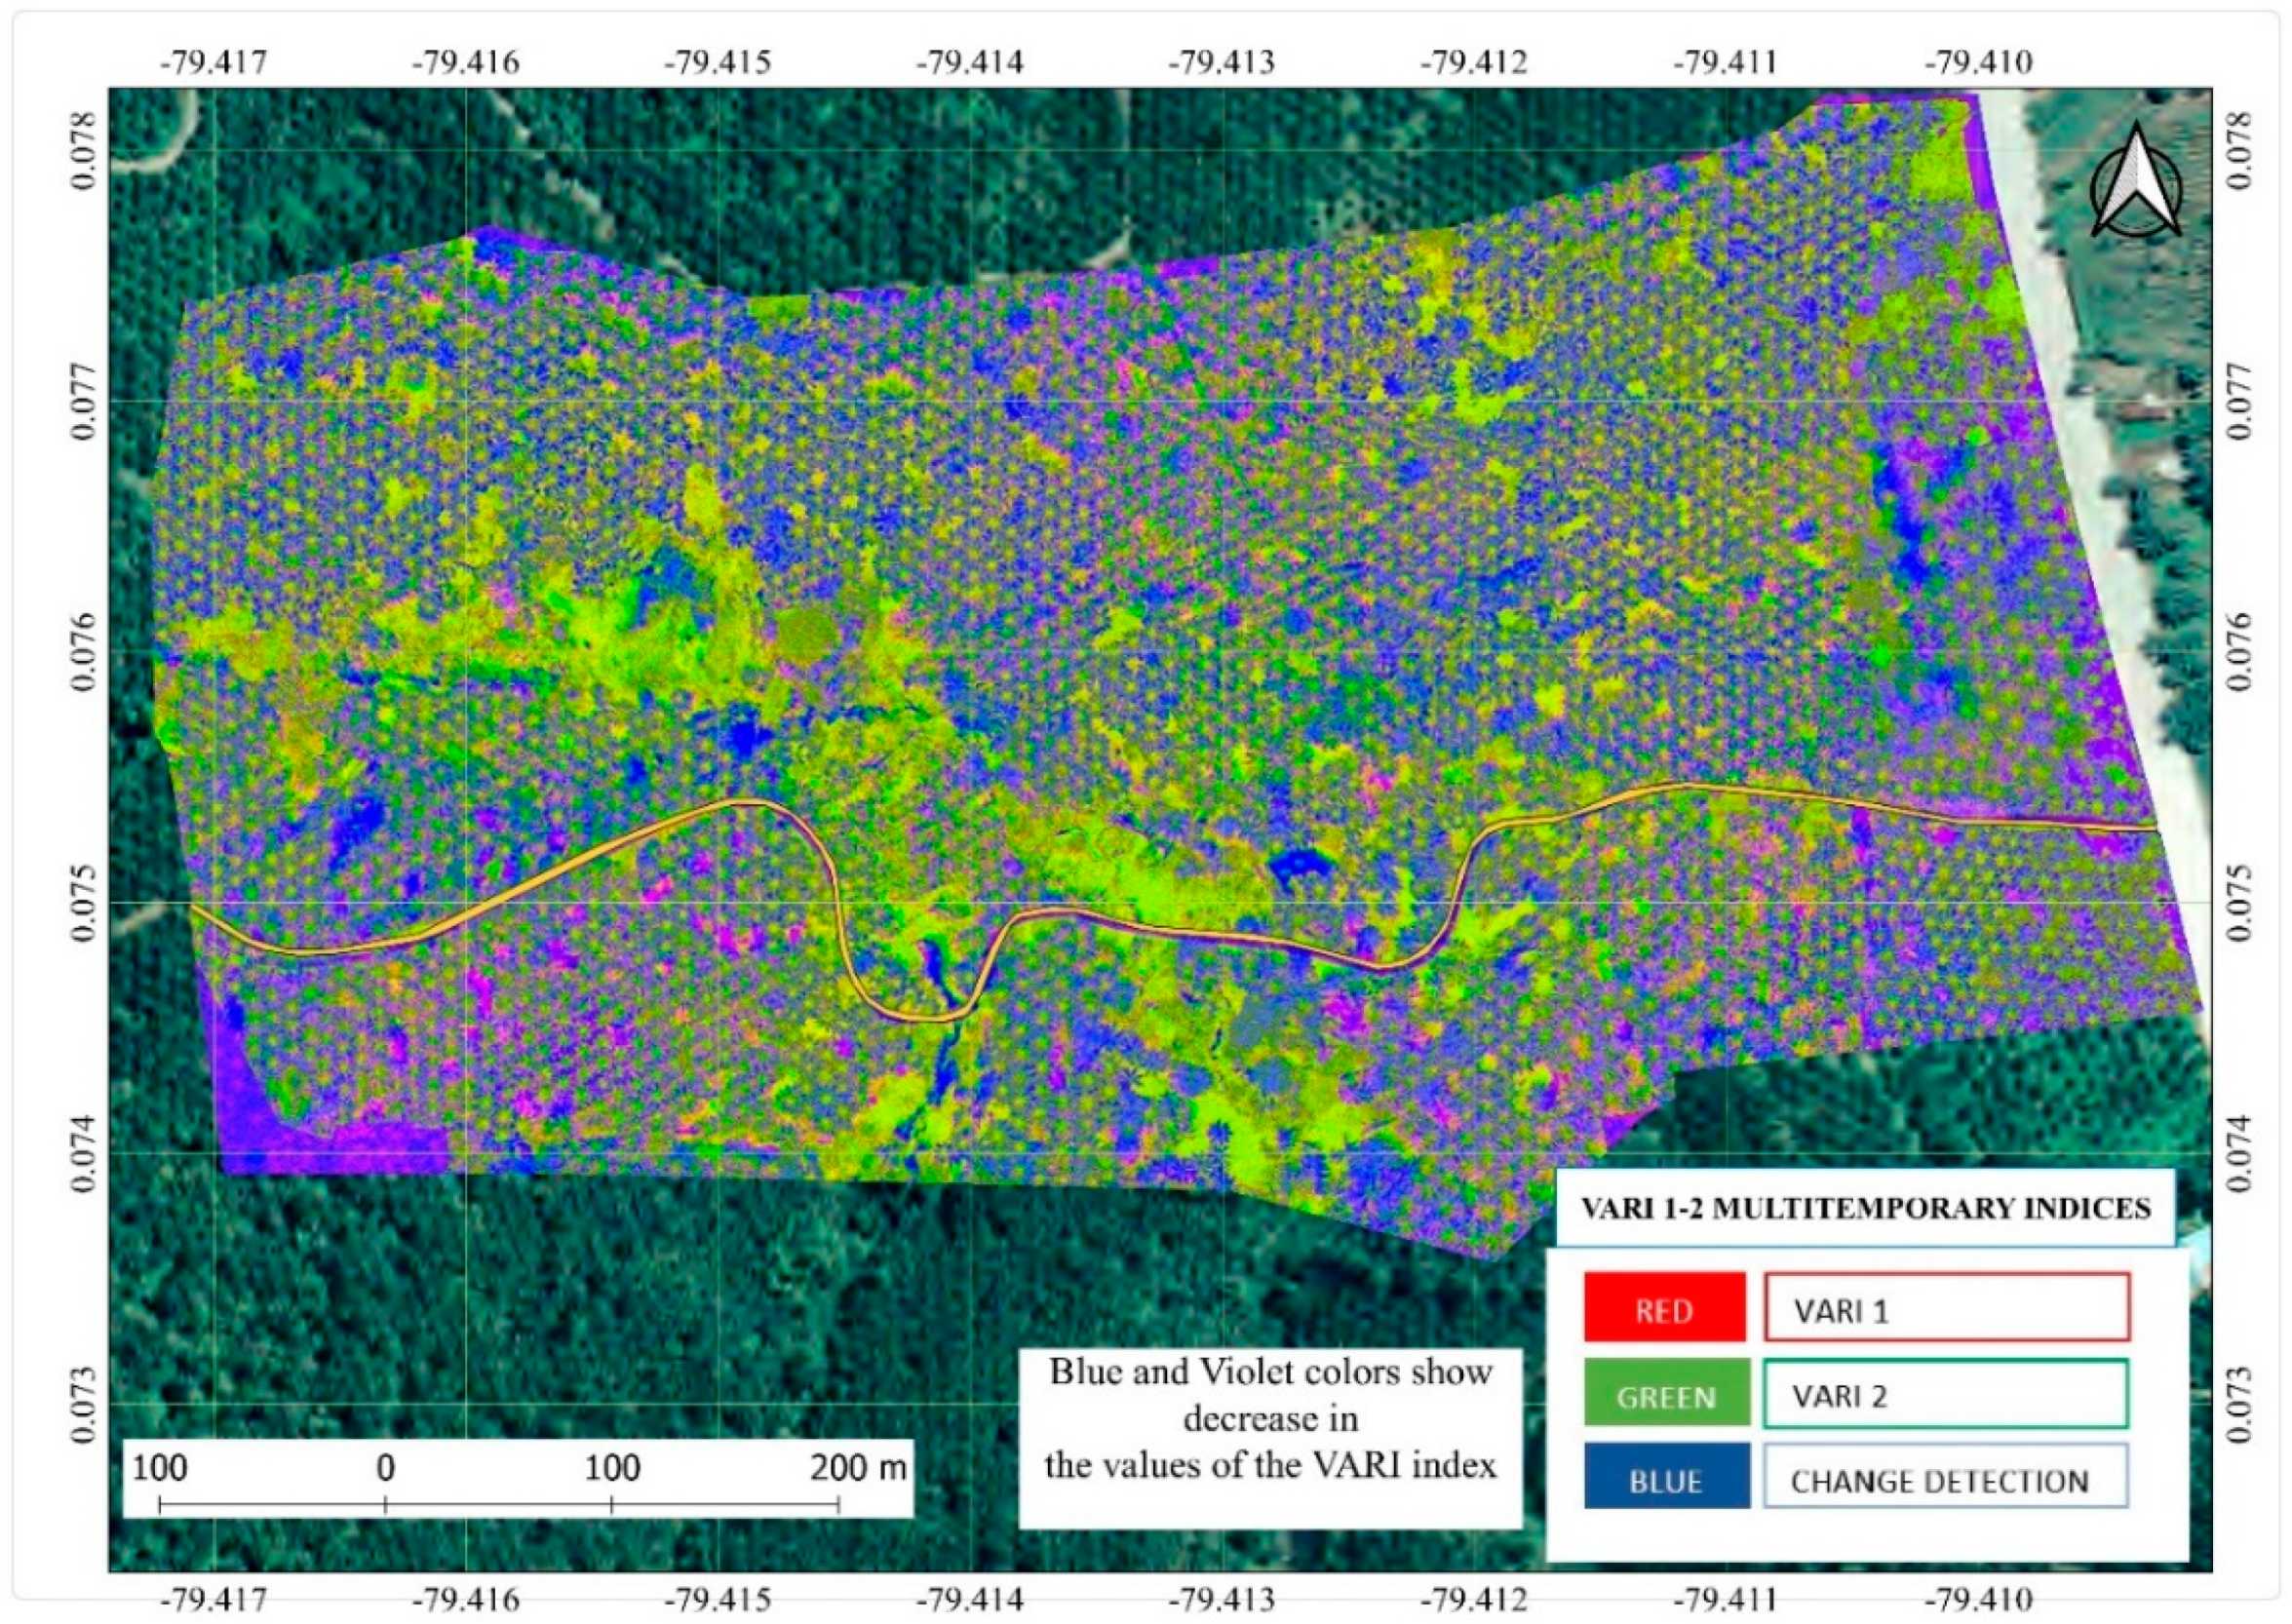
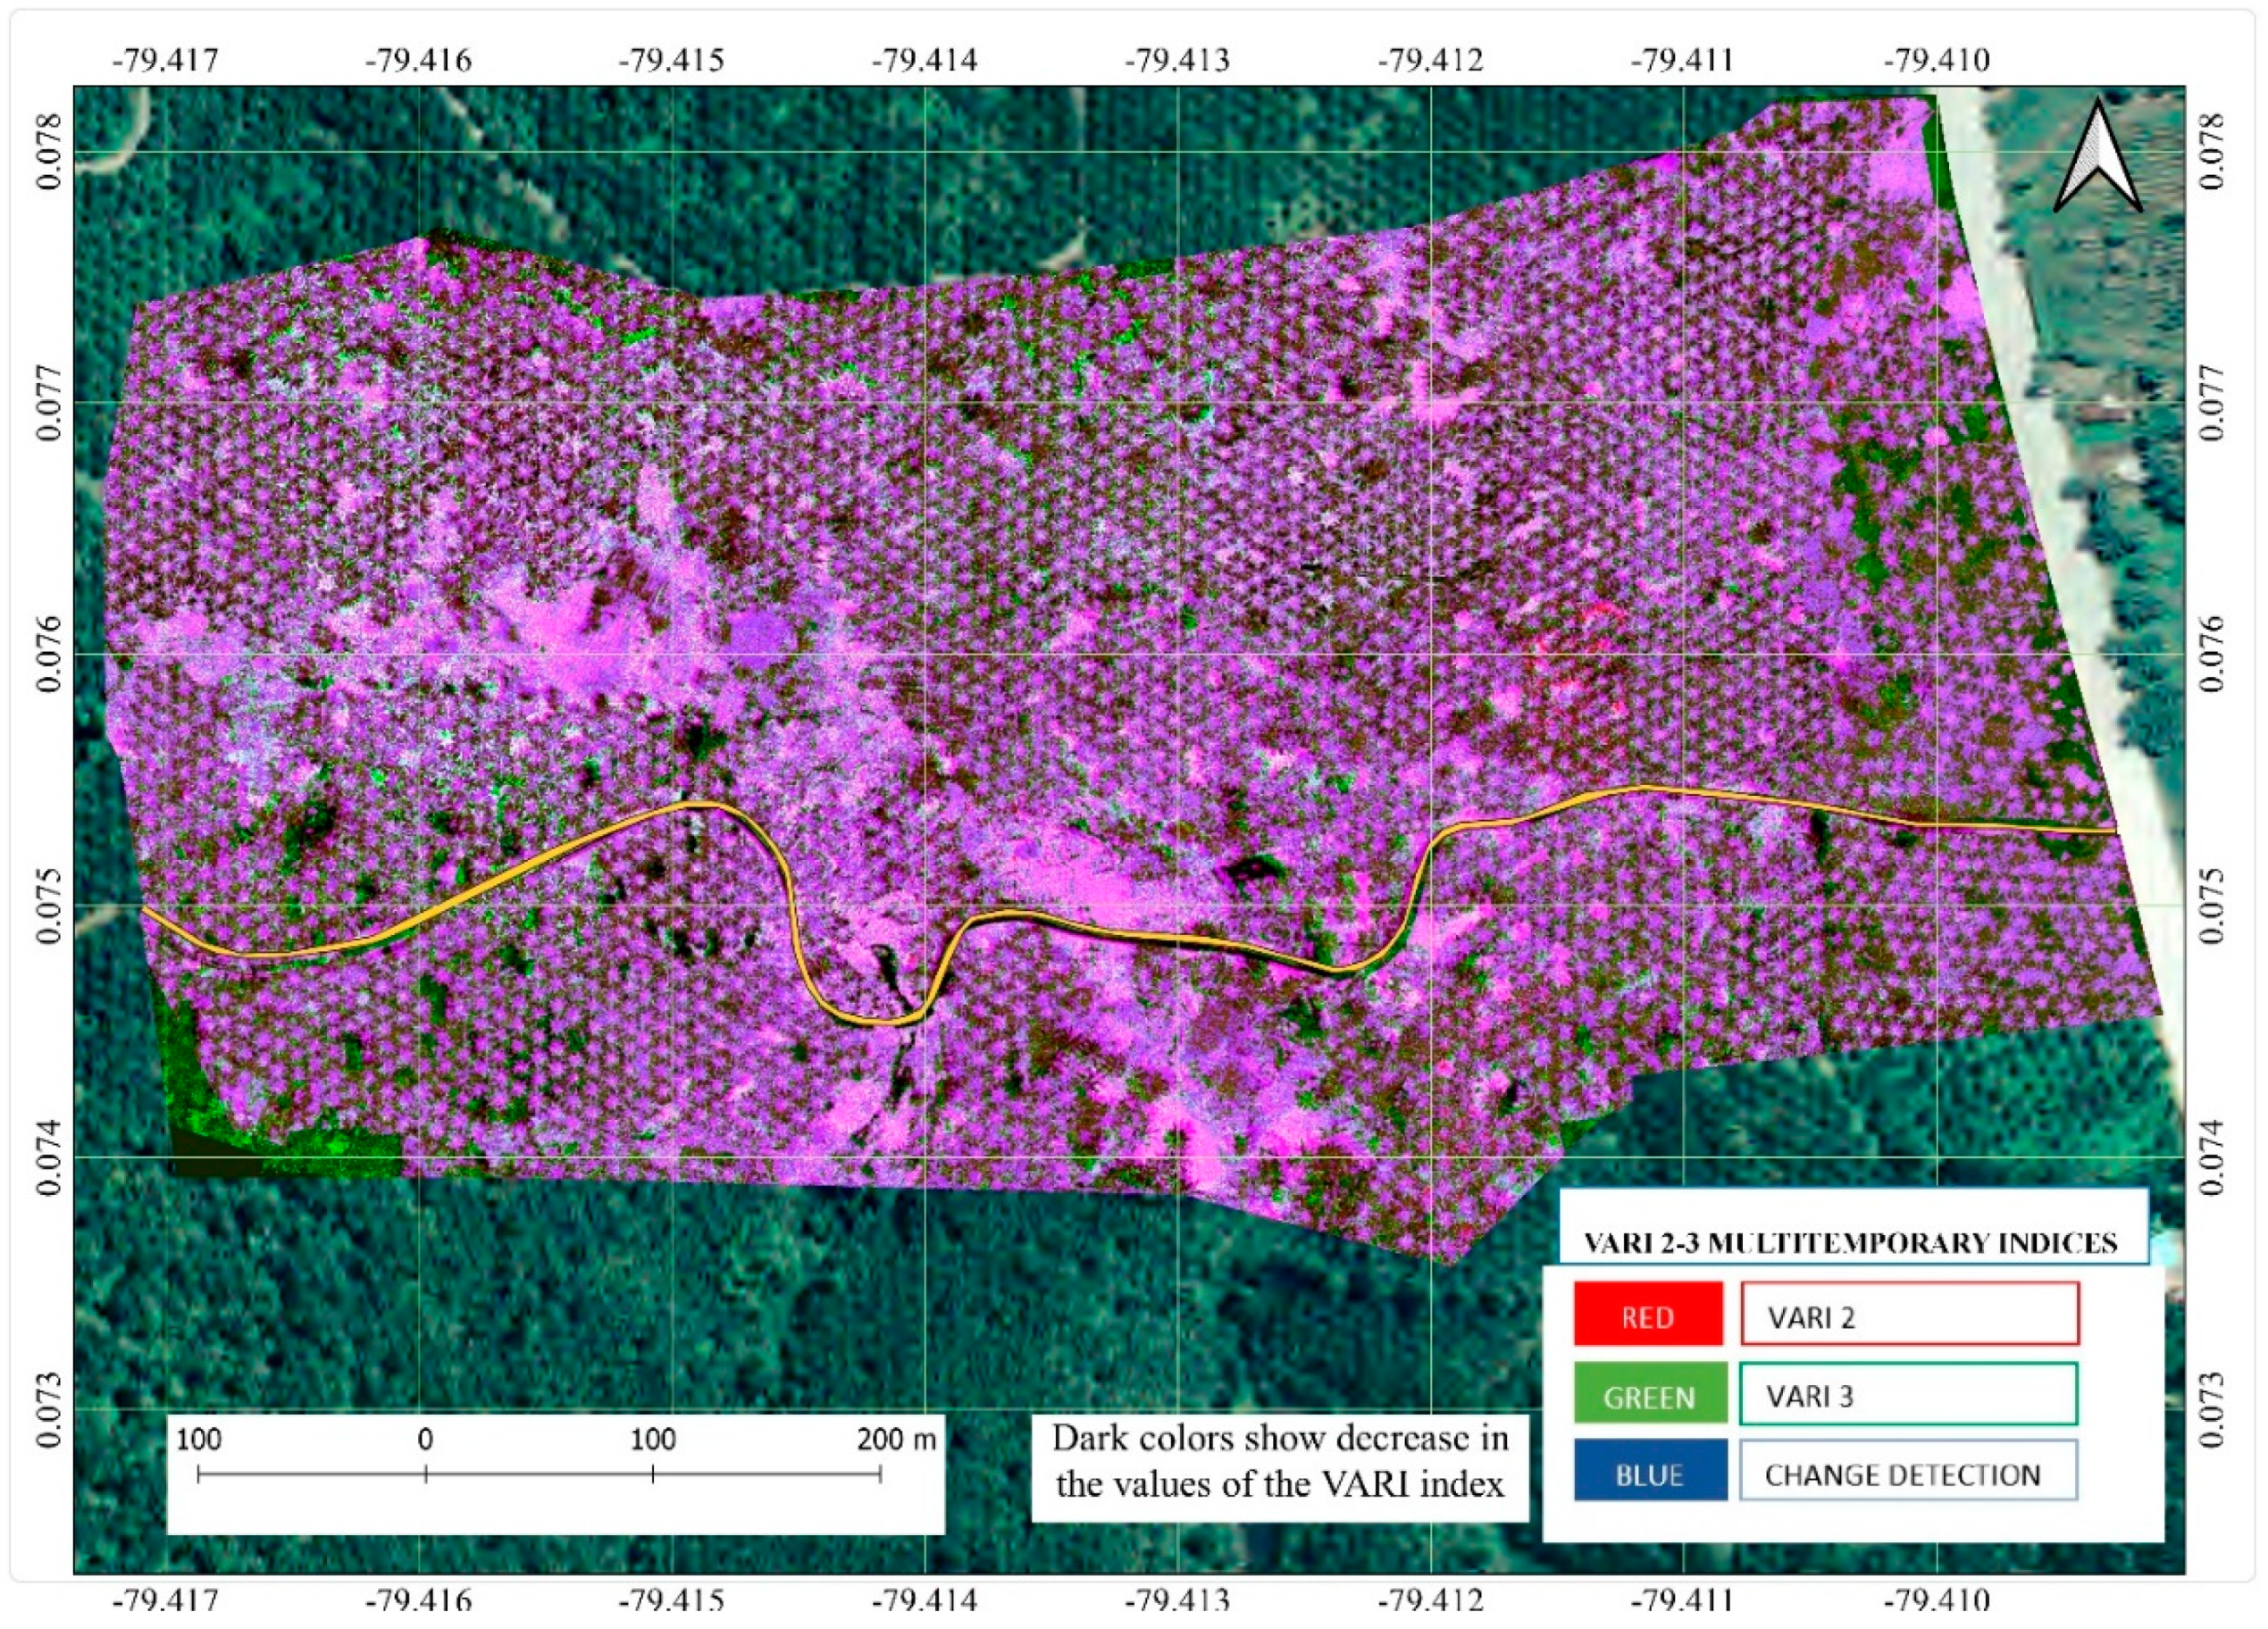
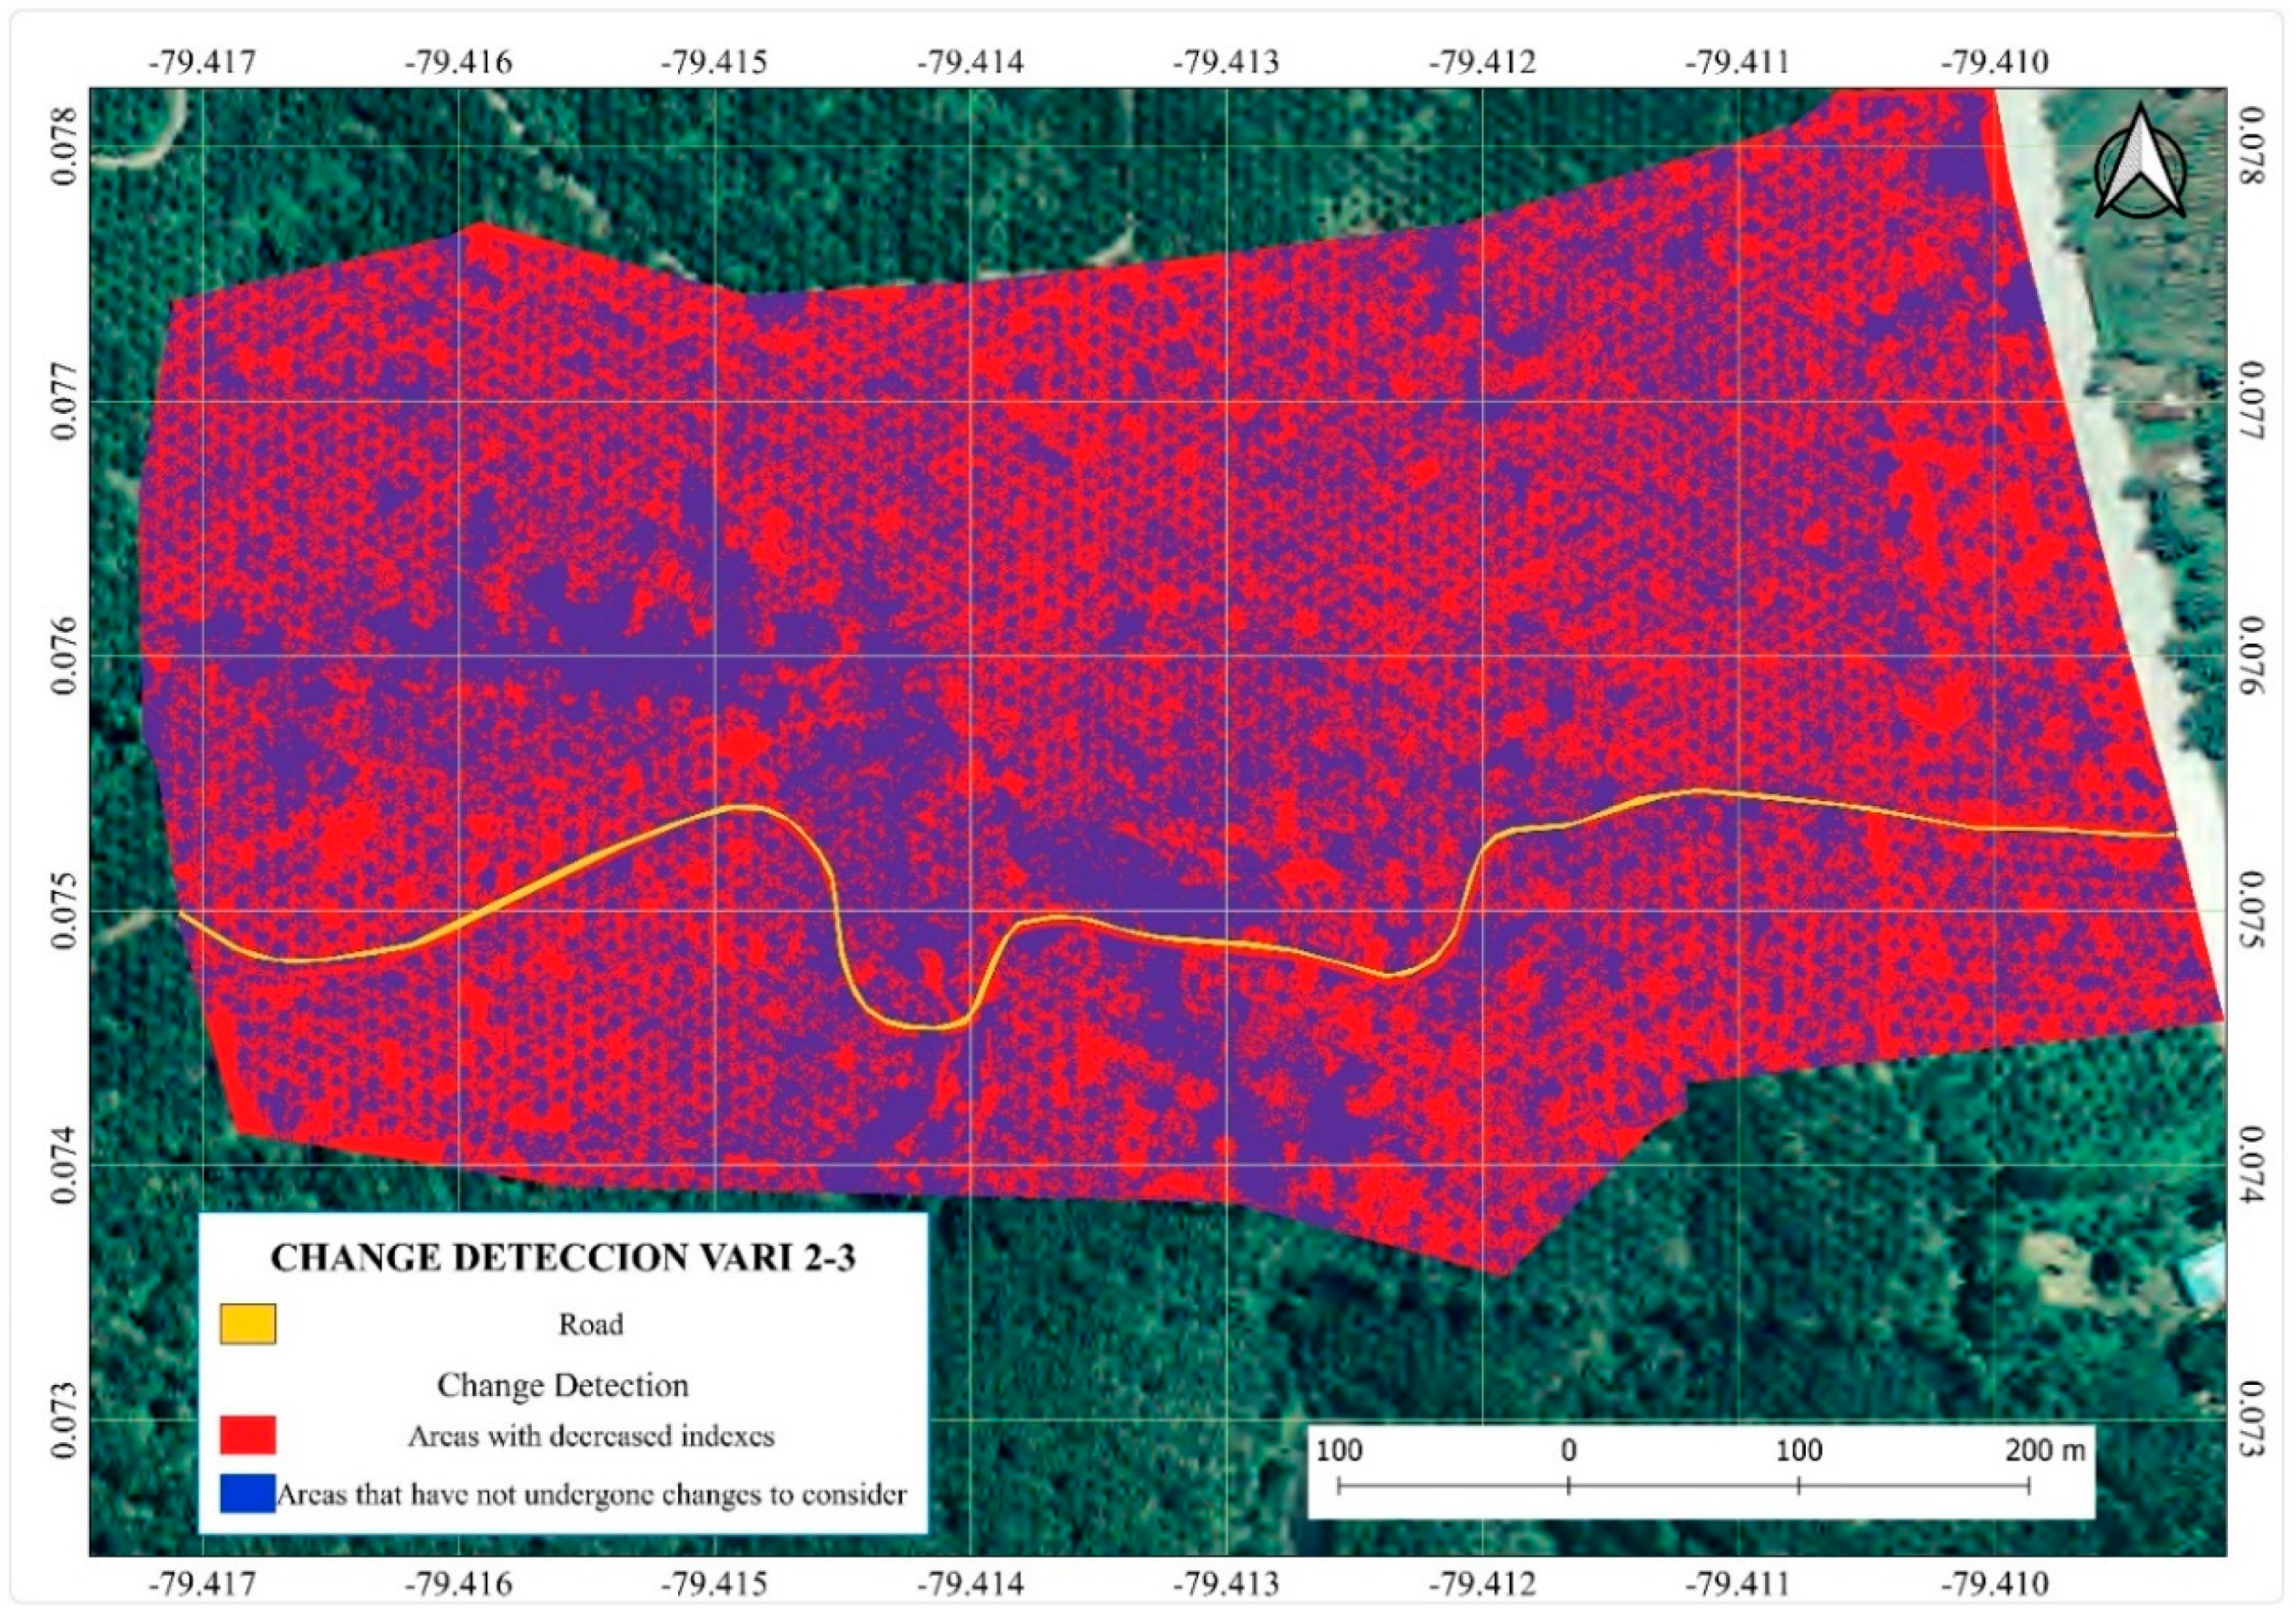
5.4.1. Change Detection
5.4.2. Multitemporal Indexes
5.5. Ground-Truth
6. Discussion
7. Conclusions
Author Contributions
Funding
Acknowledgments
Conflicts of Interest
References
- Abawi, G.; Widmer, T. Impact of soil health management practices on soilborne pathogens, nematodes and root diseases of vegetable crops. Appl. Soil Ecol. 2000, 15, 37–47. [Google Scholar] [CrossRef]
- Oerke, E.-C. Crop losses to pests. J. Agric. Sci. 2006, 144, 31–43. [Google Scholar] [CrossRef]
- Oerke, E.-C.; Dehne, H.-W. Safeguarding production—Losses in major crops and the role of crop protection. Crop. Prot. 2004, 23, 275–285. [Google Scholar] [CrossRef]
- Huang, W.-J.; Luo, J.; Zhang, J.; Zhao, J.; Zhao, C.; Wang, J.; Yang, G.; Huang, M.; Huang, L.; Du, S. Crop Disease and Pest Monitoring by Remote Sensing. Remote Sens. Appl. 2012, 32–76. [Google Scholar] [CrossRef] [Green Version]
- Mahlein, A.-K. Plant Disease Detection by Imaging Sensors—Parallels and Specific Demands for Precision Agriculture and Plant Phenotyping. Plant Dis. 2016, 100, 241–251. [Google Scholar] [CrossRef] [Green Version]
- Jacobsen, B.J. Role of Plant Pathology in Integrated Pest Management. Annu. Rev. Phytopathol. 1997, 35, 373–391. [Google Scholar] [CrossRef]
- Gullino, M.L.; Albajes, R.; Nicot, P.C. Integrated Pest and Disease Management in Greenhouse Crops (Volume 14), 2nd ed.; Springer Science & Business Media: Berlin, Germany, 2000; Volume 9, 691p. [Google Scholar]
- Waage, J.; Mumford, J. Agricultural biosecurity. Philos. Trans. R. Soc. B Boil. Sci. 2008, 363, 863–876. [Google Scholar] [CrossRef] [Green Version]
- Memoria Técnia, Inventario de Plantaciones de Palma Aceitera en el Ecuador. Available online: https://fliphtml5.com/wtae/jtil/basic (accessed on 27 August 2020).
- Torres, G.A.; Sarria, G.A.; Martinez, G.; Varon, F.; Drenth, A.; Guest, D. Bud Rot Caused byPhytophthora palmivora: A Destructive Emerging Disease of Oil Palm. Phytopathology 2016, 106, 320–329. [Google Scholar] [CrossRef] [Green Version]
- Torres, G.; Sarria, G.; Martínez, G. Identificación Temprana y Manejo de la Pudrición del Cogollo de la Palma de Aciete; Cenipalma-Fedepalma-Sena SAC: Bogotá, Colombia, 2010. [Google Scholar]
- Silva, A.; Martínez, G. Plan Nacional de Manejo de la Pudrición de Cogollo Fedepalma—Cenipalma. Rev. Palmas 2009, 30, 98–99. [Google Scholar]
- Griffith, R. Red ring disease of coconut palm. Plant Dis. 1987, 71, 193–196. [Google Scholar]
- Gerber, K.; Giblin-Davis, R.M. Association of the Red Ring Nematode and Other Nematode Species with the Palm Weevil, Rhynchophorus palmarum. J. Nematol. 1990, 22, 143. [Google Scholar] [PubMed]
- Oehlschlager, A.C.; Chinchilla, C.; Castillo, G.; Gonzalez, L. Control of red ring disease by mass trapping of Rhynchophorus palmarum (Coleoptera: Curculionidae). Fla. Èntomol. 2002, 85, 507–513. [Google Scholar] [CrossRef]
- Oehlschlager, A.C.; McDonald, R.S.; Chinchilla, C.M.; Patschke, S.N. Influence of a Pheromone-Based Mass-Trapping System on the Distribution of Rhynchophorus palmarum (Coleoptera: Curculionidae) in Oil Palm. Environ. Èntomol. 1995, 24, 1005–1012. [Google Scholar] [CrossRef]
- Magalhães, J.A.S.; Neto, A.H.A.D.M.; Miguens, F.C. Nematodes of Rhynchophorus palmarum, L. (Coleoptera: Curculionidae), vector of the Red Ring disease in coconut plantations from the north of the Rio de Janeiro State. Parasitol. Res. 2008, 102, 1281–1287. [Google Scholar] [CrossRef] [PubMed]
- Aldana, R.; Aldana, J.; Moya, O. Biología. Hábitos y Manejo de Rhynchoporus palmarun L. (Coleoptera: Curculionidae); Centro de investigación en Palma de Aceite. Cofinanciado por Fedepalma-Fondo de Fomento Palmero: Bogotá, Colombia, 2010. [Google Scholar]
- Vega, C. Establecimiento de Redes de Trampeo. Un Componente Clave Para el Manejo y Captura de Rhynchophorus Palmarum. Pasos Para la Elaboración de Trampas; ANCUPA: La Concordia, Ecuador, 2016. [Google Scholar]
- Seelan, S.K.; Laguette, S.; Casady, G.M.; Seielstad, G.A. Remote sensing applications for precision agriculture: A learning community approach. Remote Sens. Environ. 2003, 88, 157–169. [Google Scholar] [CrossRef]
- Zhang, C.; Kovacs, J. The application of small unmanned aerial systems for precision agriculture: A review. Precis. Agric. 2012, 13, 693–712. [Google Scholar] [CrossRef]
- Cambouris, A.N.; Zebarth, B.J.; Ziadi, N.; Perron, I. Precision Agriculture in Potato Production. Potato Res. 2014, 57, 249–262. [Google Scholar] [CrossRef]
- Doering, D.; Vizzotto, M.; Bredemeier, C.; Da Costa, C.; Henriques, R.; Pignaton, E.; Pereira, C.E. MDE-based Development of a Multispectral Camera for Precision Agriculture. IFAC-PapersOnLine 2016, 49, 24–29. [Google Scholar] [CrossRef]
- Villacís, M.G.M.; Ruiz, D.A.C.; Powney, E.P.K.; Guzmán, J.A.M.; Toulkeridis, T. Index Relationship of Vegetation with the Development of a Quinoa Crop (Chenopodium quinoa) in its First Phenological Stages in Central Ecuador Based on GIS Techniques. In Proceedings of the 2020 Seventh International Conference on eDemocracy & eGovernment (ICEDEG), Buenos Aires, Argentina, 22–24 April 2020; pp. 191–200. [Google Scholar]
- Ruiz, D.A.C.; Villacís, M.G.M.; Kirby, E.; Guzmán, J.A.M.; Toulkeridis, T. Correlation of NDVI Obtained by Different Methodologies of Spectral Data Collection in a Commercial Crop of Quinoa (Chenopodium Quinoa) in Central Ecuador. In Proceedings of the 2020 Seventh International Conference on eDemocracy & eGovernment (ICEDEG), Buenos Aires, Argentina, 22–24 April 2020; pp. 208–215. [Google Scholar]
- Chen, J.M.; Pavlic, G.; Brown, L.; Cihlar, J.; Leblanc, S.; White, H.P.; Hall, R.; Peddle, D.; King, D.J.; Trofymow, J.; et al. Derivation and validation of Canada-wide coarse-resolution leaf area index maps using high-resolution satellite imagery and ground measurements. Remote Sens. Environ. 2002, 80, 165–184. [Google Scholar] [CrossRef]
- Metternicht, G. Vegetation indices derived from high-resolution airborne videography for precision crop management. Int. J. Remote Sens. 2003, 24, 2855–2877. [Google Scholar] [CrossRef]
- Siart, C.; Bubenzer, O.; Eitel, B. Combining digital elevation data (SRTM/ASTER), high resolution satellite imagery (Quickbird) and GIS for geomorphological mapping: A multi-component case study on Mediterranean karst in Central Crete. Geomorphology 2009, 112, 106–121. [Google Scholar] [CrossRef]
- Everaerts, J. The use of unmanned aerial vehicles (UAVs) for remote sensing and mapping. Int. Arch. Photogramm. Remote Sens. Spat. Inf. Sci. 2008, 37, 1187–1192. [Google Scholar]
- Laliberte, A.; Winters, C.; Steele, C.; Browning, D.M.; Rango, A.; Herrick, J.E.; Havstad, K. Unmanned aerial vehicle-based remote sensing for rangeland assessment, monitoring, and management. J. Appl. Remote Sens. 2009, 3, 033542. [Google Scholar] [CrossRef]
- Swain, K.C.; Thomson, S.J.; Jayasuriya, H.P.W. Adoption of an Unmanned Helicopter for Low-Altitude Remote Sensing to Estimate Yield and Total Biomass of a Rice Crop. Trans. ASABE 2010, 53, 21–27. [Google Scholar] [CrossRef] [Green Version]
- Colomina, I.; Molina, P. Unmanned aerial systems for photogrammetry and remote sensing: A review. ISPRS J. Photogramm. Remote. Sens. 2014, 92, 79–97. [Google Scholar] [CrossRef] [Green Version]
- Haghighattalab, A.; González-Pérez, L.; Mondal, S.; Singh, D.; Schinstock, D.E.; Rutkoski, J.E.; Ortiz-Monasterio, J.I.; Singh, R.P.; Goodin, D.G.; Poland, J.A. Application of unmanned aerial systems for high throughput phenotyping of large wheat breeding nurseries. Plant Methods 2016, 12, 35. [Google Scholar] [CrossRef] [PubMed] [Green Version]
- Samseemoung, G.; Jayasuriya, H.P.W.; Soni, P. Oil palm pest infestation monitoring and evaluation by helicopter-mounted, low altitude remote sensing platform. J. Appl. Remote Sens. 2011, 5, 53540. [Google Scholar] [CrossRef]
- Vanegas, F.; Bratanov, D.; Powell, K.S.; Weiss, J.; Gonzalez, F. A Novel Methodology for Improving Plant Pest Surveillance in Vineyards and Crops Using UAV-Based Hyperspectral and Spatial Data. Sensors 2018, 18, 260. [Google Scholar] [CrossRef] [PubMed] [Green Version]
- Du, Z.; Dong, C.H.; Wang, K.; Yao, Y.J. Classification, Biological Characteristics and Cultivations of Ganoderma. In Ganoderma and Health; Springer: Singapore, 2019; pp. 15–58. [Google Scholar]
- Shafri, H.Z.; Hamdan, N. Hyperspectral imagery for mapping disease infection in oil palm plantationusing vegetation indices and red edge techniques. Am. J. Appl. Sci. 2009, 6, 1031–1035. [Google Scholar]
- Hurtado, R.; Rincón, V. La agricultura de precisión al servicio del manejo agronómico de la palma de aceite. Palmas 2009, 30, 11–20. [Google Scholar]
- Hurtado, R.; Rincón, V. La geomática como instrumento para modelar y hacer seguimiento a la Pudrición del Cogollo (PC) y al insecto plaga: Rhynchophorus palmarum. Zona Occidental-Tumaco (Colombia). Palmas 2009, 30, 21–35. [Google Scholar]
- Araque, L.; Jiménez, A. Caracterización de firma espectral a partir de sensores remotos para el manejo de sanidad vegetal en el cultivo de palma de aceite. Palmas 2009, 30, 65–79. [Google Scholar]
- Reyes, D.; Bone, C.; Padilla-Almedia, O.; Ananganó, P.; Guamán, S.; Kirby, E.; Toulkeridis, T. Use of Multitemporal Indexes in the Identification of Forest Fires—A case study of southern Chile. In Proceedings of the 2019 Sixth International Conference on eDemocracy & eGovernment (ICEDEG), Quito, Ecuador, 24–26 April 2019; pp. 203–210. [Google Scholar]
- Rogan, J.; Franklin, J.; Roberts, D.A. A comparison of methods for monitoring multitemporal vegetation change using Thematic Mapper imagery. Remote Sens. Environ. 2002, 80, 143–156. [Google Scholar] [CrossRef]
- Franqueville, H.D. La Pudrición Del Cogollo de la Palma Aceitera en América Latina. Revisión Preliminar de Los Hechos y Logros Alcanzados (No. D-1372); BuroTrop Cirad-Cp Departamento de Cultivos Perennes: Montpellier, Francia, 2001. [Google Scholar]
- Xie, Q.; Huang, W.-J.; Liang, N.; Chen, P.; Wu, C.; Yang, G.; Zhang, J.; Huang, L.; Zhang, N. Leaf Area Index Estimation Using Vegetation Indices Derived from Airborne Hyperspectral Images in Winter Wheat. IEEE J. Sel. Top. Appl. Earth Obs. Remote Sens. 2014, 7, 3586–3594. [Google Scholar] [CrossRef]
- Jones, H.G.; Vaughan, R.A. Remote Sensing of Vegetation: Principles, Techniques, and Applications; Oxford University Press: Oxford, UK, 2010. [Google Scholar]
- Liu, L.-Y.; Huang, W.-J.; Pu, R.-L.; Wang, J.-H. Detection of Internal Leaf Structure Deterioration Using a New Spectral Ratio Index in the Near-Infrared Shoulder Region. J. Integr. Agric. 2014, 13, 760–769. [Google Scholar] [CrossRef]
- Forero, D.; Hormaza, P.; Romero, H.M. Phenological growth stages of African oil palm (Elaeis guineensis). Ann. Appl. Boil. 2012, 160, 56–65. [Google Scholar] [CrossRef]
- ANCUPA. Executive Report on Agronomic Management, Pests and Diseases of CIPAL, Ecuador, 2019; 44p, Unpublished Technical Document.
- Goh, Y.K.; Marzuki, N.F.; Pa, T.N.F.T.; Goh, T.-K.; Kee, Z.S.; Goh, Y.K.; Yusof, M.T.; Vujanovic, V.; Goh, K.J. Biocontrol and Plant-Growth-Promoting Traits of Talaromyces apiculatus and Clonostachys rosea Consortium against Ganoderma Basal Stem Rot Disease of Oil Palm. Microorganisms 2020, 8, 1138. [Google Scholar] [CrossRef]
- Hayter, A.J. The maximum familywise error rate of Fisher’s least significant difference test. J. Am. Stat. Assoc. 1986, 81, 1000–1004. [Google Scholar] [CrossRef]
- Glantz, S.A. Primer of Biostatistics; McGraw Hill Professional: New York, NY, USA, 2002. [Google Scholar]
- Bernstein, L.S.; Jin, X.; Gregor, B.; Adler-Golden, S.M. Quick atmospheric correction code: Algorithm description and recent upgrades. Opt. Eng. 2012, 51, 111719. [Google Scholar] [CrossRef]
- Wu, J.; Yang, G.; Yang, X.; Xu, B.; Han, L.; Zhu, Y. Automatic Counting of in situ Rice Seedlings from UAV Images Based on a Deep Fully Convolutional Neural Network. Remote Sens. 2019, 11, 691. [Google Scholar] [CrossRef] [Green Version]
- Otsu, N. A Threshold Selection Method from Gray-Level Histograms. IEEE Trans. Syst. Man Cybern. 1979, 9, 62–66. [Google Scholar] [CrossRef] [Green Version]
- Khosrokhani, M.; Bejo, S.K.; Pradhan, B. Geospatial technologies for detection and monitoring of Ganoderma basal stem rot infection in oil palm plantations: A review on sensors and techniques. Geocarto Int. 2018, 33, 260–276. [Google Scholar] [CrossRef]
- Yuan, L.; Zhang, J.; Shi, Y.; Nie, C.; Wei, L.; Wang, J. Damage Mapping of Powdery Mildew in Winter Wheat with High-Resolution Satellite Image. Remote Sens. 2014, 6, 3611–3623. [Google Scholar] [CrossRef] [Green Version]
- Everitt, J.; Yang, C.; Escobar, D.; Webster, C.; Lonard, R.; Davis, M. Using Remote Sensing and Spatial Information Technologies to Detect and Map Two Aquatic Macrophytes. J. Aquat. Plant Manag. 1999, 37, 71–80. [Google Scholar]
- Izzuddin, M.A.; Idris, A.S.; Nisfariza, N.M.; Ezzati, B. Spectral based analysis of airborne hyperspectral remote sensing image for detection of ganoderma disease in oil palm. In Proceedings of the International Conference on Biological and Environmental Science (BIOES 2015), Phuket, Thailand, 1–2 October 2015; pp. 13–20. [Google Scholar]
- Tomita, A. Monitoring the Historical Development of Oil Palm Plantations with Combined Use of Landsat Time Series, Multitemporal Google Earth Images And ALOS-2/PALSAR-2. In Proceedings of the IGARSS 2019—2019 IEEE International Geoscience and Remote Sensing Symposium, Yokohama, Japan, 28 July–2 August 2019; pp. 5984–5987. [Google Scholar]
- Oon, A.; Shafri, H.Z.M.; Lechner, A.M.; Azhar, B. Discriminating between large-scale oil palm plantations and smallholdings on tropical peatlands using vegetation indices and supervised classification of LANDSAT-8. Int. J. Remote Sens. 2019, 40, 7312–7328. [Google Scholar] [CrossRef]
- Miyoshi, G.T.; Imai, N.N.; Tommaselli, A.M.G.; De Moraes, M.V.A.; Honkavaara, E. Evaluation of Hyperspectral Multitemporal Information to Improve Tree Species Identification in the Highly Diverse Atlantic Forest. Remote Sens. 2020, 12, 244. [Google Scholar] [CrossRef] [Green Version]
- Van Iersel, W.K.; Straatsma, M.; Addink, E.A.; Middelkoop, H. Monitoring height and greenness of non-woody floodplain vegetation with UAV time series. ISPRS J. Photogramm. Remote. Sens. 2018, 141, 112–123. [Google Scholar] [CrossRef]
- Martínez-Barbáchano, R.; Solís-Miranda, G. Caracterización espectral y detección de Flecha Seca en Palma Africana en Puntaneras, Costa Rica. Rev. Geogr. Am. Cent. 2018, 61, 349–377. [Google Scholar]


| Camera | Resolution | Focal Length | Spectral Resolution | GSD (120 m.) | Cost |
|---|---|---|---|---|---|
| MAPIR Survey3W (RGNIR) | 12 Mpx. | 3.34 mm. | 660 nm, 550 nm, 850 nm | 5.5 cm. | 400 € |
| Zenmuse X3 (BGNIR) | 12.4 Mpx. | 3.6 mm. | 450 nm, 500 nm, 810 nm | 5 cm. | 500 € |
| Zenmuse X3 (RGB) | 12.4 Mpx. | 3.6 mm. | 470 nm, 510 nm, 600 nm | 5 cm. | 500 € |
| SENSORS VARIETY | RGNIR | RGB | RGNIR | BGNIR | ||
|---|---|---|---|---|---|---|
| NDVI | VARI | GNDVI | GVI | GNDVI | GVI | |
| INIAP (1081 samples) | 0.74 ± 0.01 | 0.18 ± 0.01 | 0.48 ± 0.01 | 2.90 ± 0.02 | 0.67 ± 0.01 | 5.21± 0.02 |
| CIRAD (541 samples) | 0.77 ± 0.01 | 0.17 ± 0.01 | - | - | - | - |
| ASD (468 samples) | 0.77 ± 0.01 | 0.17 ± 0.01 | - | - | - | - |
| TAISHA (238 samples) | 0.72 ± 0.01 | 0.18 ± 0.01 | 0.61 ± 0.01 | 4.13 ± 0.02 | - | - |
| UNIPALMA (421 samples) | 0.69 ± 0.01 | 0.18 ± 0.01 | 0.59 ± 0.01 | 3.88 ± 0.02 | - | - |
| AMAZON (256 samples) | 0.68 ± 0.01 | 0.16 ± 0.01 | 0.60 ± 0.01 | 4.02 ± 0.02 | 0.38 ± 0.01 | 2.35 ± 0.06 |
| CIRAD (Cond.1) | - | - | 0.63 ± 0.01 | 4.44 ± 0.02 | 0.54 ± 0.01 | 3.62 ± 0.07 |
| CIRAD (Cond.2) | - | - | 0.51 ± 0.01 | 3.13 ± 0.02 | 0.68 ± 0.01 | 5.40 ± 0.04 |
| ASD (Cond.1) | - | - | 0.62 ± 0.01 | 4.30 ± 0.02 | 0.44 ± 0.01 | 2.74 ± 0.04 |
| ASD Cond.2) | - | - | 0.48 ± 0.01 | 2.96 ± 0.06 | 0.68 ± 0.01 | 5.45 ± 0.04 |
| TAISHA (Cond.1) | - | - | - | - | 0.39 ± 0.01 | 2.33 ± 0.05 |
| TAISHA (Cond.2) | - | - | - | - | 0.65 ± 0.01 | 4.86 ± 0.04 |
| UNIPALMA (Cond.1) | - | - | - | - | 0.33 ± 0.01 | 2.07 ± 0.04 |
| UNIPALMA (Cond.2) | - | - | - | - | 0.63 ± 0.01 | 4.53 ± 0.09 |
| POINT | CASE | POINT | CASE |
|---|---|---|---|
| 1 | RRD | 12 | BR |
| 2 | BR GRADE 3 | 13 | BR |
| 3 | BR GRADE 2 | 14 | ANOMALY |
| 4 | RRD INITIAL | 15 | PROBLEM BORO |
| 5 | POSIBLE BR | 16 | BR |
| 6 | DEAD (BR) | 17 | RRD |
| 7 | BR GRADE 1 | 18 | BR |
| 8 | BR DEAD | 19 | RRD |
| 9 | BR | 20 | BR GRADE 3 |
| 10 | BR | 21 | BR |
| 11 | BR DEAD |
| VARI1 | VARI2 | VARI3 | GNDVI1 | GNDVI2 | GNDVI3 | GVI1 | GVI2 | GVI3 | |
|---|---|---|---|---|---|---|---|---|---|
| Mean | 0.069 | 0.060 | 0.097 | 0.425 | 0.578 | 0.462 | 2.558 | 3.878 | 2.556 |
| Standard Dev. | 0.051 | 0.035 | 0.075 | 0.052 | 0.045 | 0.054 | 0.340 | 0.527 | 0.626 |
| Minimum Index | 0.001 | 0.000 | 0.003 | 0.305 | 0.490 | 0.280 | 1.920 | 3.010 | 1.020 |
| 25% | 0.025 | 0.036 | 0.033 | 0.394 | 0.540 | 0.428 | 2.345 | 3.438 | 2.165 |
| 50% | 0.060 | 0.059 | 0.080 | 0.432 | 0.580 | 0.470 | 2.510 | 3.730 | 2.610 |
| 75% | 0.108 | 0.080 | 0.147 | 0.458 | 0.613 | 0.500 | 2.778 | 4.353 | 3.085 |
| Maximum Index | 0.221 | 0.157 | 0.299 | 0.545 | 0.660 | 0.550 | 3.350 | 5.030 | 3.600 |
| AFFECTATION | VARI | GNDVI | GVI |
|---|---|---|---|
| BASELINE | 0.183 | 0.667 | 5.214 |
| AFFECTATION BORO | 0.094 | 0.432 | 2.938 |
| RRD | 0.067 | 0.490 | 2.831 |
| BR GRADE 1 y 2 | 0.091 | 0.499 | 3.090 |
| BR GRADE 3 | 0.087 | 0.487 | 2.997 |
| BR CRÁTER | 0.041 | 0.479 | 3.014 |
| DEAD BY BR | 0.053 | 0.488 | 2.980 |
© 2020 by the authors. Licensee MDPI, Basel, Switzerland. This article is an open access article distributed under the terms and conditions of the Creative Commons Attribution (CC BY) license (http://creativecommons.org/licenses/by/4.0/).
Share and Cite
Viera-Torres, M.; Sinde-González, I.; Gil-Docampo, M.; Bravo-Yandún, V.; Toulkeridis, T. Generating the Baseline in the Early Detection of Bud Rot and Red Ring Disease in Oil Palms by Geospatial Technologies. Remote Sens. 2020, 12, 3229. https://doi.org/10.3390/rs12193229
Viera-Torres M, Sinde-González I, Gil-Docampo M, Bravo-Yandún V, Toulkeridis T. Generating the Baseline in the Early Detection of Bud Rot and Red Ring Disease in Oil Palms by Geospatial Technologies. Remote Sensing. 2020; 12(19):3229. https://doi.org/10.3390/rs12193229
Chicago/Turabian StyleViera-Torres, Mauricio, Izar Sinde-González, Mariluz Gil-Docampo, Vladimir Bravo-Yandún, and Theofilos Toulkeridis. 2020. "Generating the Baseline in the Early Detection of Bud Rot and Red Ring Disease in Oil Palms by Geospatial Technologies" Remote Sensing 12, no. 19: 3229. https://doi.org/10.3390/rs12193229
APA StyleViera-Torres, M., Sinde-González, I., Gil-Docampo, M., Bravo-Yandún, V., & Toulkeridis, T. (2020). Generating the Baseline in the Early Detection of Bud Rot and Red Ring Disease in Oil Palms by Geospatial Technologies. Remote Sensing, 12(19), 3229. https://doi.org/10.3390/rs12193229