Article

Development of a Land Surface Temperature Retrieval Algorithm from GK2A/AMI

Department of Atmospheric Science, Kongju National University, 56, Gongjudaehak-ro, Gongju-si, Chungcheongnam-do 32588, Korea
*
Author to whom correspondence should be addressed.
Remote Sens. 2020, 12(18), 3050; https://doi.org/10.3390/rs12183050
Submission received: 13 August 2020 / Revised: 16 September 2020 / Accepted: 16 September 2020 / Published: 18 September 2020
(This article belongs to the Special Issue Remote Sensing Monitoring of Land Surface Temperature (LST))

Abstract

:
Land surface temperature (LST) is an important geophysical element for understanding Earth systems and land–atmosphere interactions. In this study, we developed a nonlinear split-window LST retrieval algorithm for the observation area of GEO-KOMPSAT-2A (GK2A), the next-generation geostationary satellite in Korea. To develop the GK2A LST retrieval algorithm, radiative transfer model simulation data, considering various impacting factors, were constructed. The LST retrieval algorithm was developed with a total of six equations as per day/night and atmospheric conditions (dry/normal/wet), considering the effects of diurnal variation of LST and atmospheric conditions on LST retrieval. The emissivity of each channel required for LST retrieval was calculated in real-time with the vegetation cover method using the consecutive 8-day cycle vegetation index provided by GK2A. The indirect validation of the results of GK2A LST with Moderate Resolution Imaging Spectroradiometer (MODIS) LST Collection 6 showed a high correlation coefficient (0.969), slightly warm bias (+1.227 K), and root mean square error (RMSE) (2.281 K). Compared to the MODIS LST, the GK2A LST showed a warm bias greater than +1.8 K during the day, but a relatively small bias (<+0.7 K) at night. Based on the results of the validation with in situ measurements from the Tateno station of the Baseline Surface Radiation Network, the correlation coefficient was 0.95, bias was +0.523 K, and RMSE was 2.021 K.

1. Introduction

Land surface temperature (LST) can be interpreted as the skin temperature of Earth’s land and is derived using the upward longwave radiation measured by a satellite sensor [1]. The LST retrieved from satellites represents the surface temperature of ground pixels that are not contaminated by clouds and is affected by many factors, such as land use/cover, vegetation, soil moisture, snow, etc. [2,3]. Land information is used as input and verification data for numerical/climate models. These are important factors to understand the Earth’s system and land–atmosphere interactions [4,5,6]. LST has various research applications, such as studying land use/cover changes [7,8,9], drought monitoring [10,11,12], energy balance estimation [13,14,15], analyzing urban heat islands [16,17,18], studying evapotranspiration [19] and so on [20,21,22]. As various applied studies using LST have been conducted, the demand for long-term LST data with high spatial and temporal resolutions as well as good accuracy is increasing [23,24].
LST is one of the climate elements with very different spatial and temporal variability depending on the ground condition (land cover, vegetation condition, soil moisture, etc.) of the observation point. Due to these characteristics, more detailed spatial and temporal field observations are necessary, but this is not practical in economic and technical terms. So, at present, special observation is only performed in some areas where the ground condition is relatively homogeneous. The LST observed in a field is a value that can represent only a few tens of meters of the radius of the observation point, therefore, there is a limitation of spatial representation. To overcome this limitation, studies on retrieving LST from satellites with spatial resolutions from hundreds of meters to several kilometers have been conducted for more than half a century [25,26,27]. LSTs retrieved from polar orbit satellites have a relatively high spatial resolution but long revisit cycles; they help to understand a momentary phenomenon in detail for a relatively narrow space, such as urban heat islands [28,29,30,31,32]. Moreover, LSTs retrieved from geostationary satellites have a relatively coarse spatial resolution compared to polar orbit satellites, but they can continuously retrieve the same observation area in a short observation period. Owing to these advantages, LSTs retrieved from geostationary satellites can be used to analyze phenomena occurring in large areas over a long period of time and can also fill in the blank areas of field observation [33,34,35,36,37].
Many studies have been conducted and different methodologies have been developed to retrieve high-quality LST data from satellites. For LST retrieval from the radiation observed by thermal infrared sensors, cloud detection is essential, and it is necessary to know the surface condition and atmospheric effects [38,39,40]. LST retrieval methods, assuming that the land surface emissivity (LSE) is known a priori, can be roughly divided into three groups: single-channel methods [31,41], multi-channel methods [26,27,33], and multi-angle methods [42,43]. There are also several methods for retrieving LST and LSE at the same time when the LSE is unknown: classification-based emissivity methods [44,45], normalized difference vegetation index (NDVI)-based emissivity methods [46,47], day/night temperature-independent spectral indices-based methods [38,48], two-temperature methods [49,50], and temperature emissivity separation methods [28,51,52]. Among these various LST retrieval methods, a commonly used one for retrieving LST from a geostationary satellite is the split-window (SW) method using two adjacent thermal infrared channels with different absorption capabilities for water vapor and other substances [53,54,55]. The split-window method is relatively simple, efficient, and convenient to apply to most sensors, but it is assumed that the LSE is accurately known in such cases. In addition, the split-window method has various types of algorithms and thus has different performance characteristics according to the type of algorithm. Another characteristic of the split-window method is that the accuracy is degraded in a specific region where the total column water vapor is high or where the satellite viewing zenith angle (VZA) is large [23].
With improvements in sensor performance on satellites, next-generation geostationary meteorological satellites (Himawari-8, Geostationary Operational Environmental Satellite (GOES)-16/17, GEO-KOMPSAT-2A (GK2A)) have started to conduct their observations with high performances in time and space resolution [56,57,58]. In addition, the Meteosat Third Generation (MTG) series will be launched in 2021 as the next system after the Meteosat Second Generation (MSG) series of geostationary satellites [59]. With improved sensor performance, the space-time resolution of level 2 products has also been improved. The LST product was designated as the official level 2 product in GOES-16 and GK2A as in previous satellites (GOES-13/15, Communication, Ocean and Meteorological Satellite (COMS)). In addition, the European Space Agency (ESA) has adopted LST as an official product on MTG satellites following MSG satellites, and LST retrieval research is being conducted to prepare for it. In the case of Himawari-8, a study was conducted to retrieve (LST) for research purposes [55,60]. In the Asia-Oceania region, the COMS was retired on March 31, 2020. The COMS’ follow-up satellite, GK2A, has been officially operating since 25 July 2019, and replaced COMS’ services [61]. Therefore, it is necessary to develop an LST retrieval algorithm using GK2A/AMI (Advanced Meteorological Imager) data.
In this study, we developed an operational LST retrieval algorithm for the GK2A observation area using GK2A/AMI data from next-generation geostationary satellites in Korea. The contents of this paper are as follows. The properties of the data are described in Section 2.1, and the process of developing the simulation dataset using the radiative transfer model (RTM) and LST retrieval process and methodology are described in Section 2.2. The RTM simulation results and the GK2A LST retrieval results are presented in Section 3. In addition, the accuracy, problems, and future improvements of the GK2A LST retrieval algorithm are presented in Section 4.

2. Data and Methods

2.1. Data

2.1.1. GK2A Data

In this study, we used GK2A/AMI data provided by the Korea Meteorological Administration (KMA)/National Meteorological Satellite Center (NMSC). GK2A is located at 128.2°E and started operational services for 16 channels of AMI on 25 July 2019 [58]. To retrieve LST, level-1B of GK2A/AMI, level-2 of GK2A/AMI, auxiliary data of solar zenith angle (SZA), and satellite VZA data were used. The characteristics of the GK2A data used in this study are shown in Table 1. The brightness temperatures of channel 13 (10.35 μm) and channel 15 (12.36 μm) were used for adapting the split-window method. These infrared channels have a spatial resolution of 2 km at the nadir point and a temporal resolution of 10 min. Because LST is retrieved only for clear sky and land pixels, cloud mask and land/sea mask data are necessary. In this algorithm, we used GK2A cloud mask data as developed by NMSC/KMA [62]. In addition, we used the LSE of the two split-window channels derived by the vegetation cover method (VCM) using the land cover map, GK2A VI, and the look-up table of spectral emissivity [63]. The LSE data were produced from the GK2A LSE algorithm, and these data have a spectral resolution of 2 km and a temporal resolution of 1 day. In this study, GK2A LSTs were retrieved for 4 months from July to October 2019.

2.1.2. Validation data

To validate the retrieved LST, the ground measured upward longwave radiation data were used. The Tateno station of the Baseline Surface Radiation Network (BSRN) at 140.126°E and 36.058°N is a ground station in Japan and has been measuring upward longwave radiation every 1 min using the Kipp and Zonen CGR4 pyrgeometer [64,65,66,67]. Another type of validation data is high-quality LST data derived from another satellite. The MODIS LST (MOD11_L2, MYD11_L2 swath Collection 6) datasets were used for comparison with GK2A LSTs [32]. The spatial resolution of the MODIS LST was 1 km at nadir. The MODIS LST data are provided every 5 min for the swath region according to the orbit of Terra/Aqua satellites. In this study, GK2A LSTs were validated using the BSRN and MODIS LST data for 4 months, from July to October 2019.

2.2. Methodology

The GK2A LST retrieval algorithm is mainly composed of three parts, as shown in Figure 1. The first part is the development of the LST retrieval algorithm using a simulated pseudo match-up database with the RTM (shown in Figure 1 on the right side). First, we constructed the pseudo match-up database through the RTM simulation called MODTRAN4 under various atmospheric and land surface conditions. In this simulation, to improve the accuracy of the LST retrieval algorithm, we considered various impacting factors, such as the diurnal variations of air temperature and LST, spatial-temporal variations of spectral emissivity, and the non-linear effect of water vapor. To develop LST retrieval algorithms, we used the reference LST and calculated the brightness temperatures of the two SW channels with the inverse Planck function from the simulated radiances. The LST retrieval algorithms were separately developed using a statistical regression method according to the lapse rate (two types: day/night) and atmospheric conditions (three types: wet/normal/dry).
The split-window LST retrieval algorithm assumes that the LSE is prior known. In general, LSE is affected not only by the surface type and status, but also depends on the wavelength. Because the spatial resolution of the GK2A/AMI infrared channel is 2 km, most pixels are composed of a mixture of various vegetation and soil. Moreover, most vegetation not only undergoes seasonal variations, but also, soil conditions are affected by the presence or absence of precipitation (soil moisture and snow cover). The process of retrieving the GK2A LSE is briefly shown on the left side of Figure 1. The GK2A LSE algorithm was developed based on the VCM method and calculates the emissivity of a given pixel as a weighted average according to the fractional coverage of vegetation (FVC) and soil [46,68]. The FVC of a given pixel was derived by the method of Carlson and Ripley (1997) [69] using the 8-days cycle vegetation index data derived from GK2A/AMI. The snow cover fraction was calculated for the pixels covered with snow [70], and this was considered in retrieving the daily GK2A LSE.
The central column of Figure 1 shows the process of calculating LST every 10 min using GK2A/AMI data and pre-calculated emissivity. The GK2A LST was retrieved for clear and land pixels according to day/night and atmospheric conditions. In the process of calculating the GK2A LST, the SZA of each pixel was used for the division of daytime, nighttime, and dawn/twilight, as shown in the center of Figure 1. At this time, the threshold SZA values from the previous study were used [60]. Similarly, the atmospheric conditions were divided into dry/normal/wet according to the brightness temperature difference (BTD) threshold to calculate the GK2A LST.
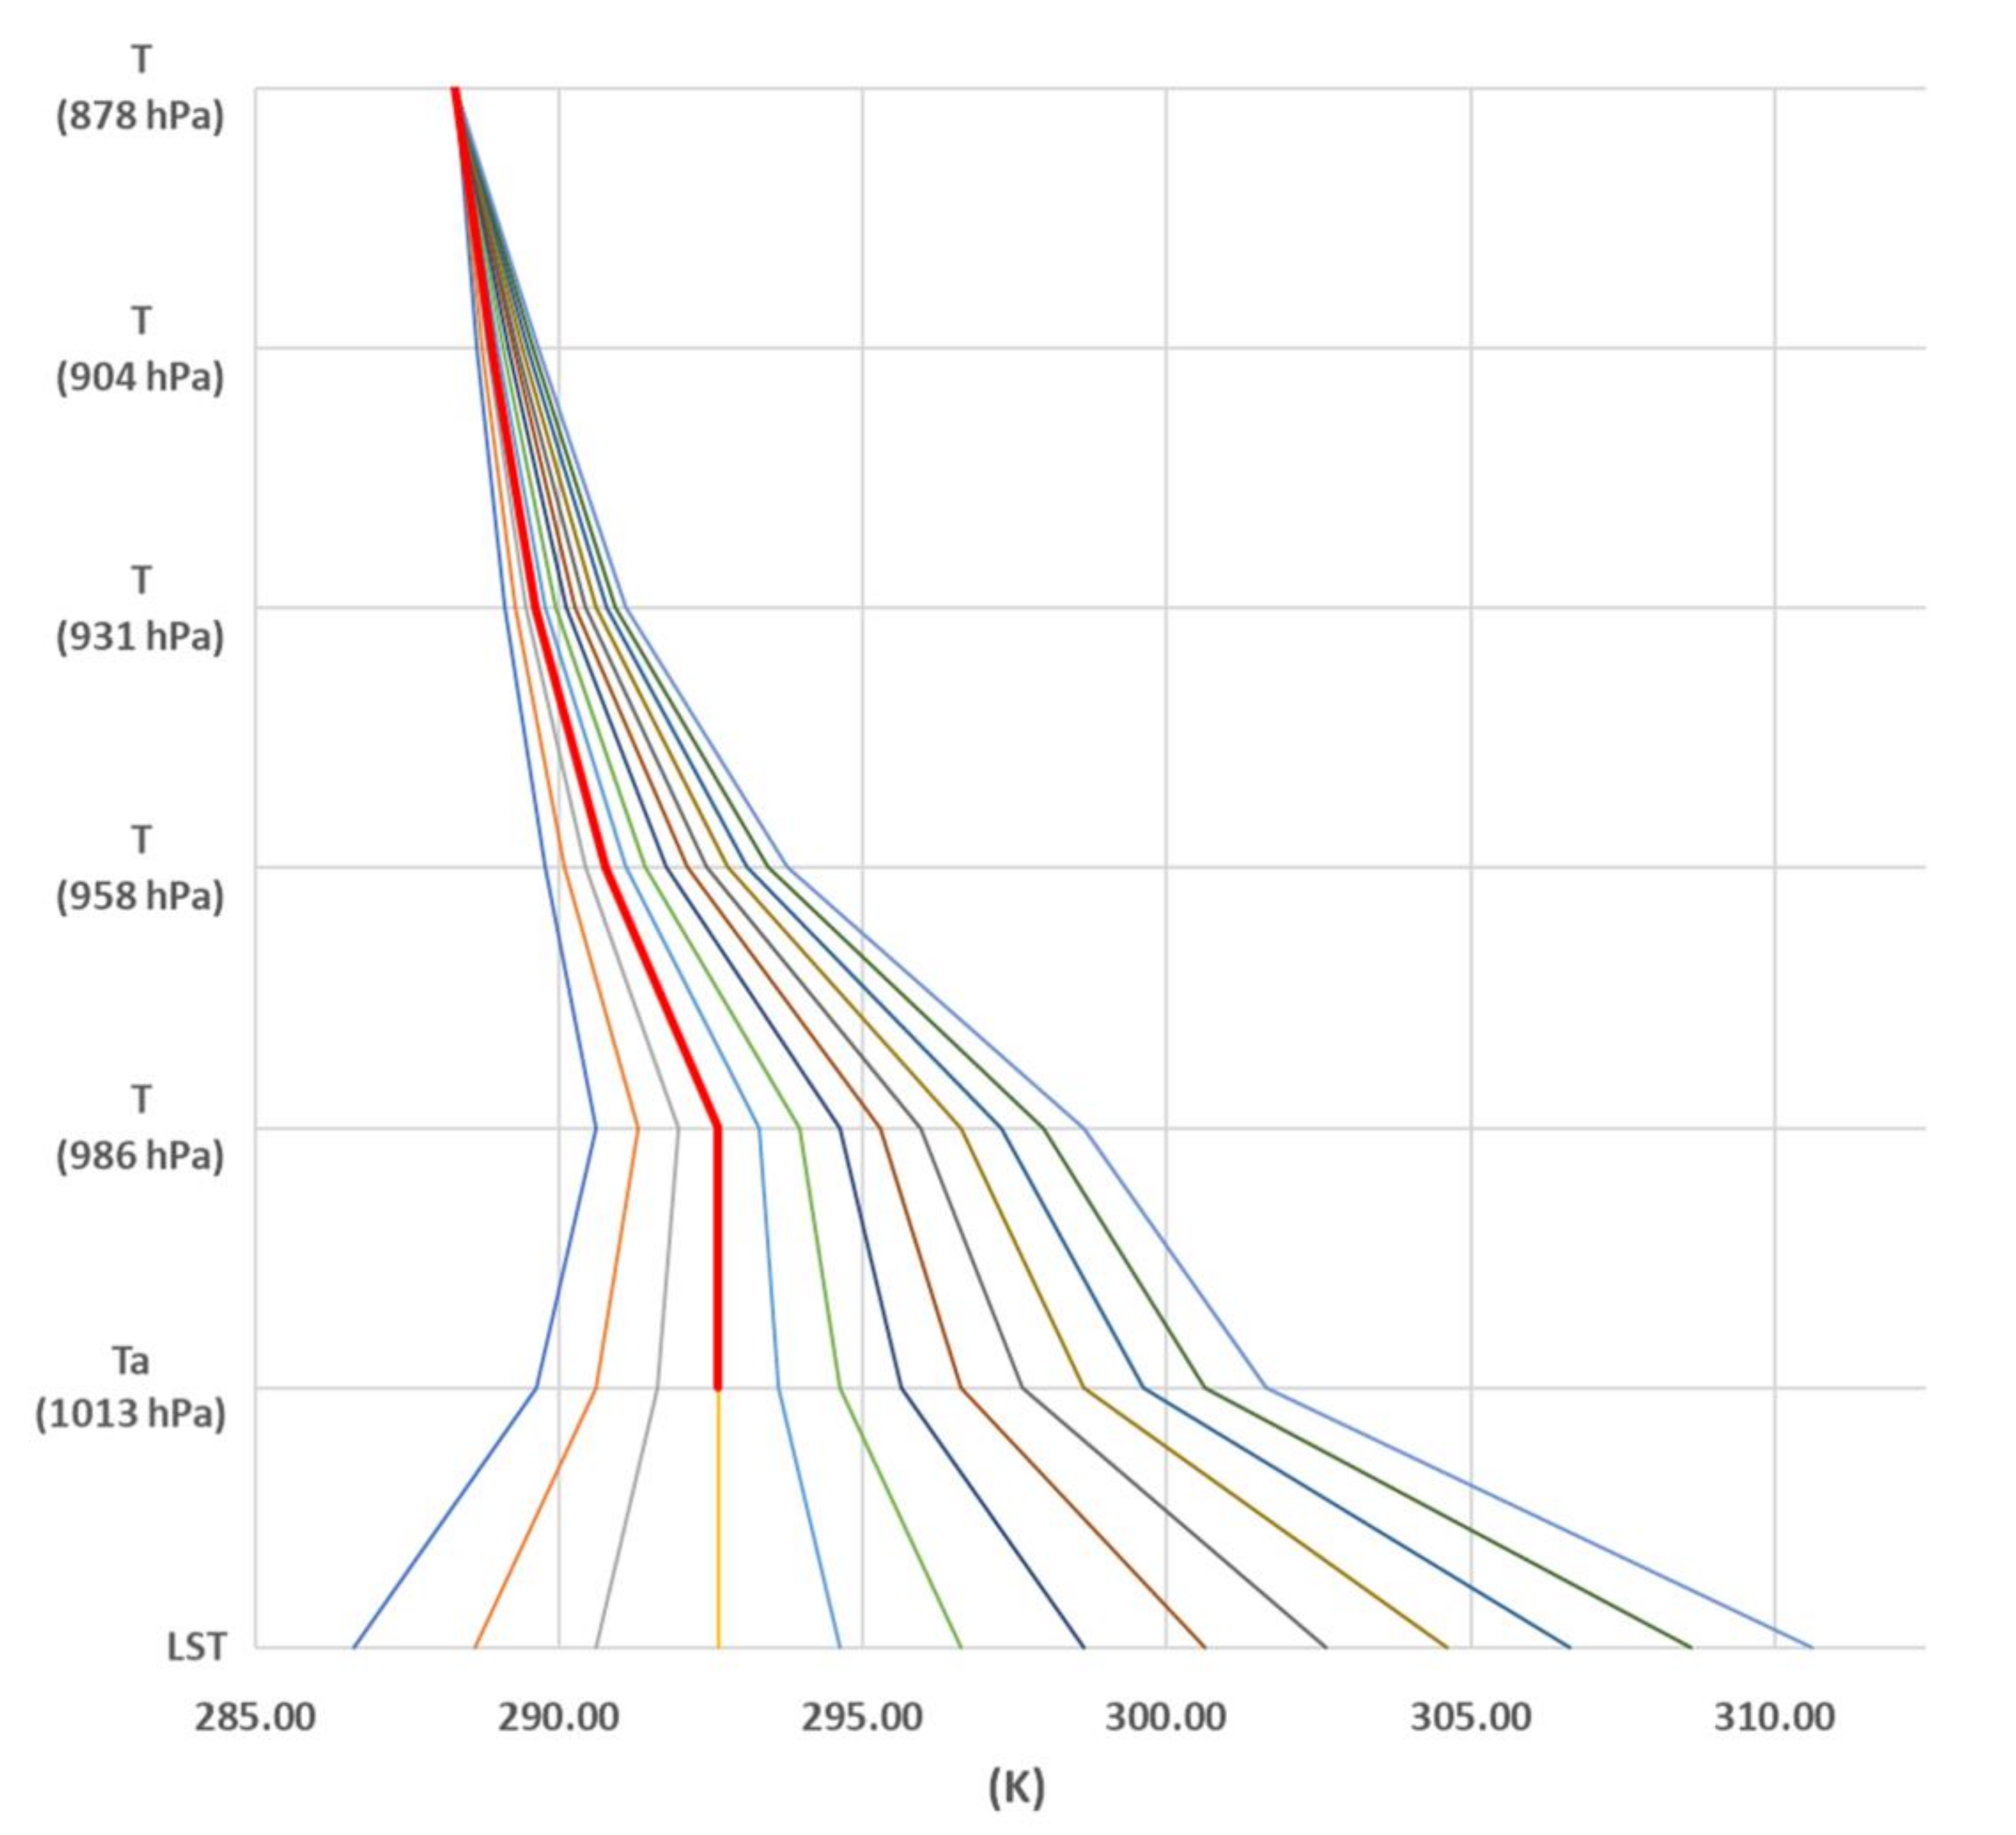
Unlike the sea surface temperature, the available match-up data (ground-level observational data) for LST over the GK2A/AMI observation region are severely limited [71,72,73]. Therefore, to develop the GK2A LST algorithm from satellite data, we needed to prepare a similar on-site match-up database. For this purpose, the output from the RTM simulation could be used. As in many previous studies, the pseudo match-up database was generated through simulations using the RTM under various atmospheric and surface conditions. We developed an LST retrieval algorithm using the pseudo match-up database. SeeBor version 5 data have been used as an input profile for RTM simulations in many studies for the generation of a pseudo match-up database. This dataset contains 101 pressure levels of temperature, mixing ratio, and trace gases. For each profile in the dataset, a physically-based characterization of the surface skin temperature and surface emissivity is assigned [74]. The diurnal variation of LST is not provided in atmospheric profiles, so many studies have considered the diverse diurnal variation of LST in the RTM simulations according to the land cover, season, and weather conditions. In the research of [26,34], a large range of temperatures between the near-surface temperature and ground surface, which consists of five surface temperatures, Ta − 5 K, Ta, Ta + 5 K, Ta + 10 K, and Ta + 20 K, was considered for each atmospheric profile. In the research of [27,75], daily variations of LST from Ta − 16 K to Ta + 16 K were considered for each profile. In other studies [29,76], LST was prescribed for each profile in a range as Ta − 15 K < LST < Ta + 15 K with different increments of 1.5 K and 1 K, respectively. In [35], LST was considered asymmetrically from Ta − 6 K to Ta + 14 K in increments of 2 K. In [55], they used six values from Ta − 5 K to Ta + 20 K at 5 K intervals. In this study, the diurnal variation of LST was asymmetric according to the day ( LST day = Ta 2   K ~ Ta + 18   K ) and night ( LST ngt = Ta 6   K ~ Ta + 2   K ) at 2 K intervals. In addition, we included the diurnal variations of air temperature profiles under the planetary boundary layer using SeeBor data and reference LST, as shown in Figure 2.
To generate the pseudo match-up database of the LST and measured spectral radiance, radiative transfer model simulations under various atmospheric and surface conditions were performed (Table 2). A total of 2694 sets of SeeBor data used were located at a satellite with a VZA of less than 50°. To consider the value of LSE in the RTM simulation, the range of LSE of channels 13 and 15 in the GK2A region was used, as shown in Table 2. Therefore, the total number of simulations for daytime and nighttime were 3,585,714 (2694 (atm) × 13 (LST) × 11 ( ε c h 13 ) × 11 ( Δ ε )) and 1,629,870 (2694 (atm) × 5 (LST) × 11 ( ε c h 13 ) × 11 ( Δ ε )), respectively.
Several LST retrieval algorithms from satellites have been proposed to suit the characteristics of various sensors mounted on each satellite and retrieve LSTs through different approximations and assumptions. Among the various LST retrieval methods, the SW method was used to retrieve LST using different atmospheric absorptions of two adjacent infrared window channels in this study. The SW method assumes that the spectral emissivity of the land surface is a priori known, and the atmospheric effects can be corrected using thermal infrared channels. The LST was estimated through a regression analysis on the relationship between the brightness temperature of two infrared channels and the factors affecting the LST calculation [33,34,36,60,77]. The equation for retrieving LST from GK2A data is given in Equation (1) as follows:
L S T = c 0 + c 1 B T c h 13 + c 2 B T c h 13 B T c h 15 + c 3 B T c h 13 B T c h 15 2 + c 4 s e c θ 1 + c 5 1 ε ¯ + c 6 Δ ε
where B T c h 13 and B T c h 15 are the brightness temperatures of GK2A channels 13 and 15, respectively, θ is the satellite VZA, ε ¯ is the average LSE of GK2A channels 13 and 15, and Δ ε is the LSE difference of GK2A channels 13 and 15. The coefficients of the regression equations ( c 0 ~ c 6 ) were derived by simple regression.
As described in Section 2.1.2, MODIS Collection 6 LST data and BSRN Tateno station data were used for the validation of GK2A/AMI LST. The spatial resolution of the MODIS LST was 1 km. The MODIS LST data were provided at 5 min intervals as Terra/Aqua satellites moved along their orbits. Due to the characteristics of LST with large spatial-temporal variability, strict spatial-temporal collocations are needed. For temporal collocation, the MODIS LST data within ± 5 min were used based on the observation time of GK2A, as in previous studies [60]. For the spatial collocation, a simple mean of the nearest 9 MODIS pixels (an average of 3 × 3) surrounding the closest MODIS pixel to the GK2A pixel was used. Validation with MODIS LST data was performed when the pixels had more than five pixels of clear sky and land.
In addition, the in situ measurement data, which were observed every minute from the upward longwave radiation at the Tateno station of the BSRN, were used as the validation data. In the GK2A observation area, there were few upward longwave radiation data or field-observed LST data, so Tateno station data were used as validation data. Validation was performed only when the observation times at GK2A and Tateno station were the same. Spatial collocation was performed by averaging the four GK2A pixels closest to the Tateno station. The measured upward longwave radiation was converted to LST using the Stefan–Boltzmann law. The surface type of Tateno station is grass, so we assumed the average value of the emissivity ( ε ¯ = 0.986 ) value corresponding to the grassland from the Advanced Spaceborne Thermal Emission and Reflection Radiometer (ASTER) spectral library. The process of converting the observed upward longwave radiation to LST using the Stefan–Boltzmann law is shown in Equation (2):
L s e n s o r = ε ¯ σ T 4 T = L s e n s o r ε ¯ σ 1 4
where L s e n s o r is the value of the measured upward longwave radiation by the CGR4 pyrgeometer from the Tateno station of the BSRN; ε ¯ is the average value of the emissivity corresponding to the grassland; σ is the Stefan-Boltzmann constant ( σ = 5.670374 × 10 8   Wm 2 K 4 ); T is the value of ground temperature converted from the upward longwave radiation at Tateno station.

3. Results

3.1. Results of the Radiative Transfer Model Simulation

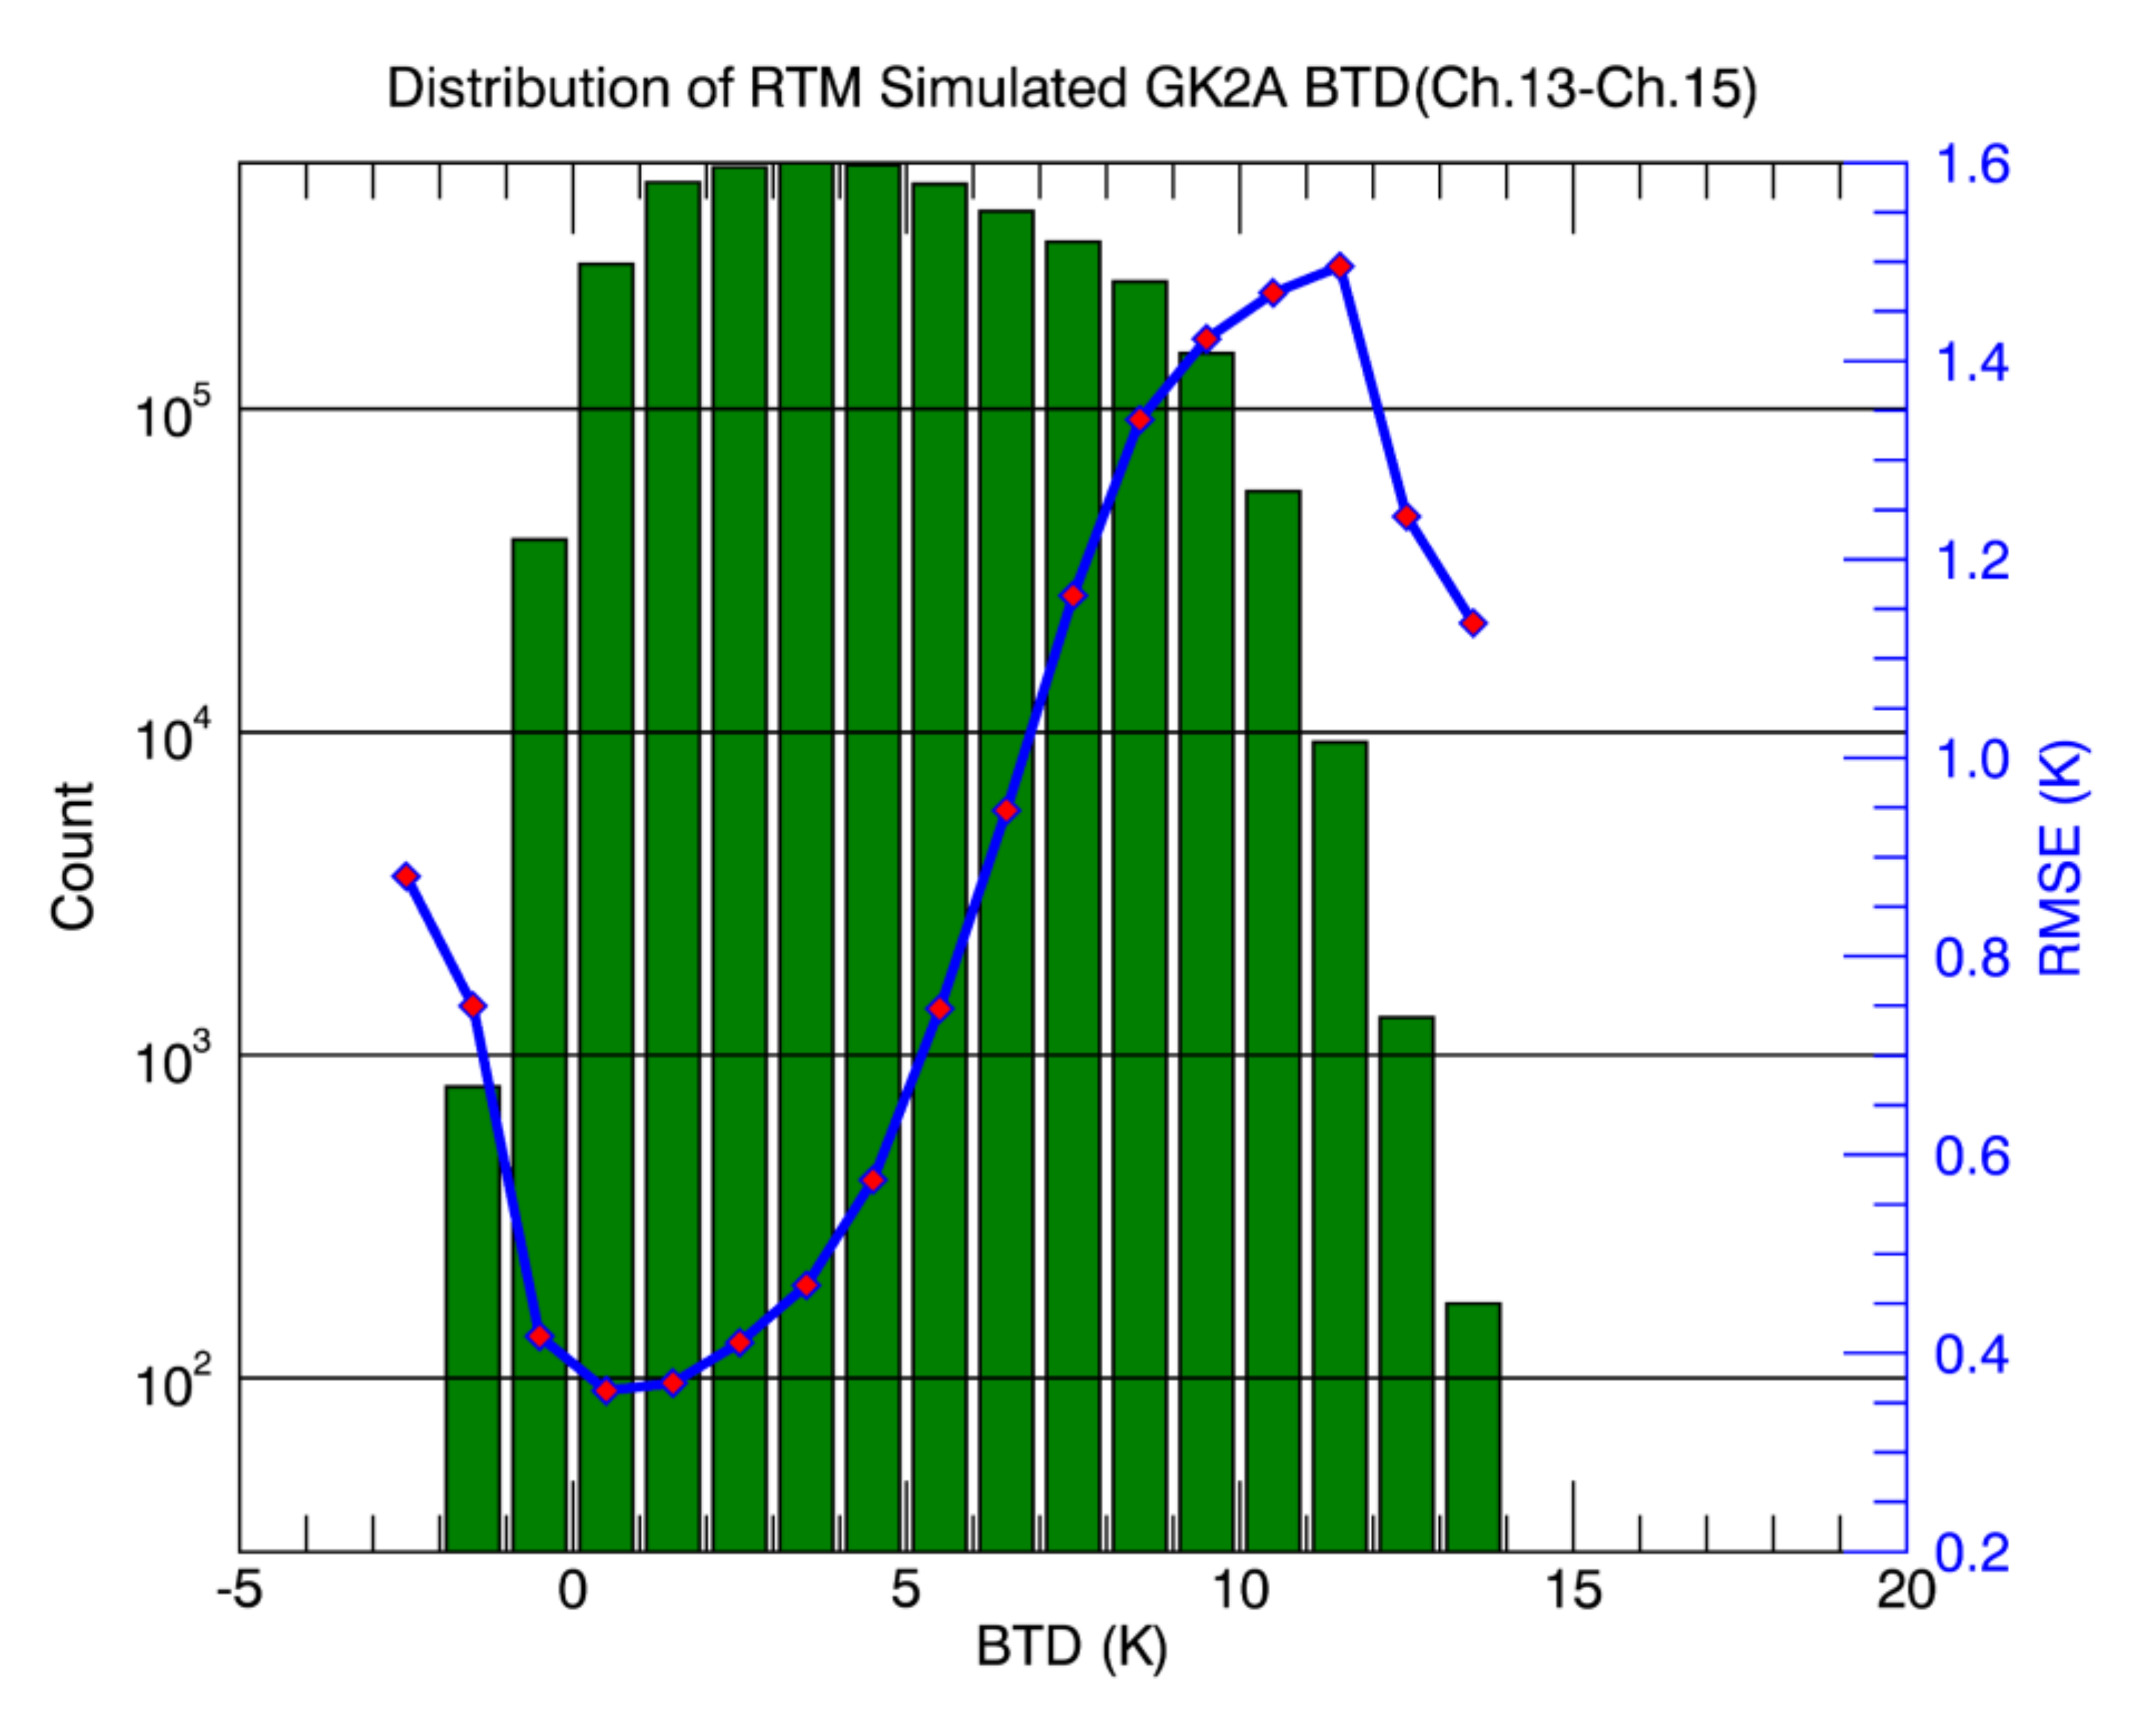
To set the threshold value of the LST algorithm, the distribution of brightness temperature differences (BTD) between channel 13 and channel 15 of GK2A was analyzed. This time, only the land pixels without clouds were analyzed. The analysis dates were selected as the same day each month from July 2019 to October 2019, and the count of BTDs accumulated was observed every 10 min. Figure 3 shows the frequency of BTDs between channel 13 and channel 15 of GK2A. BTD values were distributed from −3 K to 15 K. Most of the BTDs were counted at over 10 million from 1 K to 7 K. The results showed a similar distribution to that of the RTM simulated results, which are shown in Figure 4. Figure 4 shows the BTD distribution between channel 13 and channel 15 of GK2A from the simulated pseudo match-up database with the RTM. The coefficients of the LST equation (Equation (1)) were obtained from the simulated pseudo match-up database by regression analysis. Using these coefficients, the root mean square error (RMSE) values between the reference LST and the estimated LST were calculated. Overall, the distribution of simulated BTDs was similar to that of the actual GK2A BTDs, except for the −3 K to 0 K range. The RMSE value was relatively large when the simulated BTD value was less than −1 K or greater than 6 K. The difference between the actual GK2A BTD and the RTM simulation BTD was less than 0 K. This difference could have been caused by the small amount of aerosols given the atmospheric profile (SeeBor_v5), which was used for the RTM simulation [74]. Using these results, the threshold values of BTD for dry/normal/wet conditions were determined to be 0 K and 6 K, respectively.
The coefficients of the GK2A/AMI LST equation (Equation (1)) for day/night and dry/normal/wet conditions were obtained from the RTM simulation results through regression analysis, as shown in Table 3.
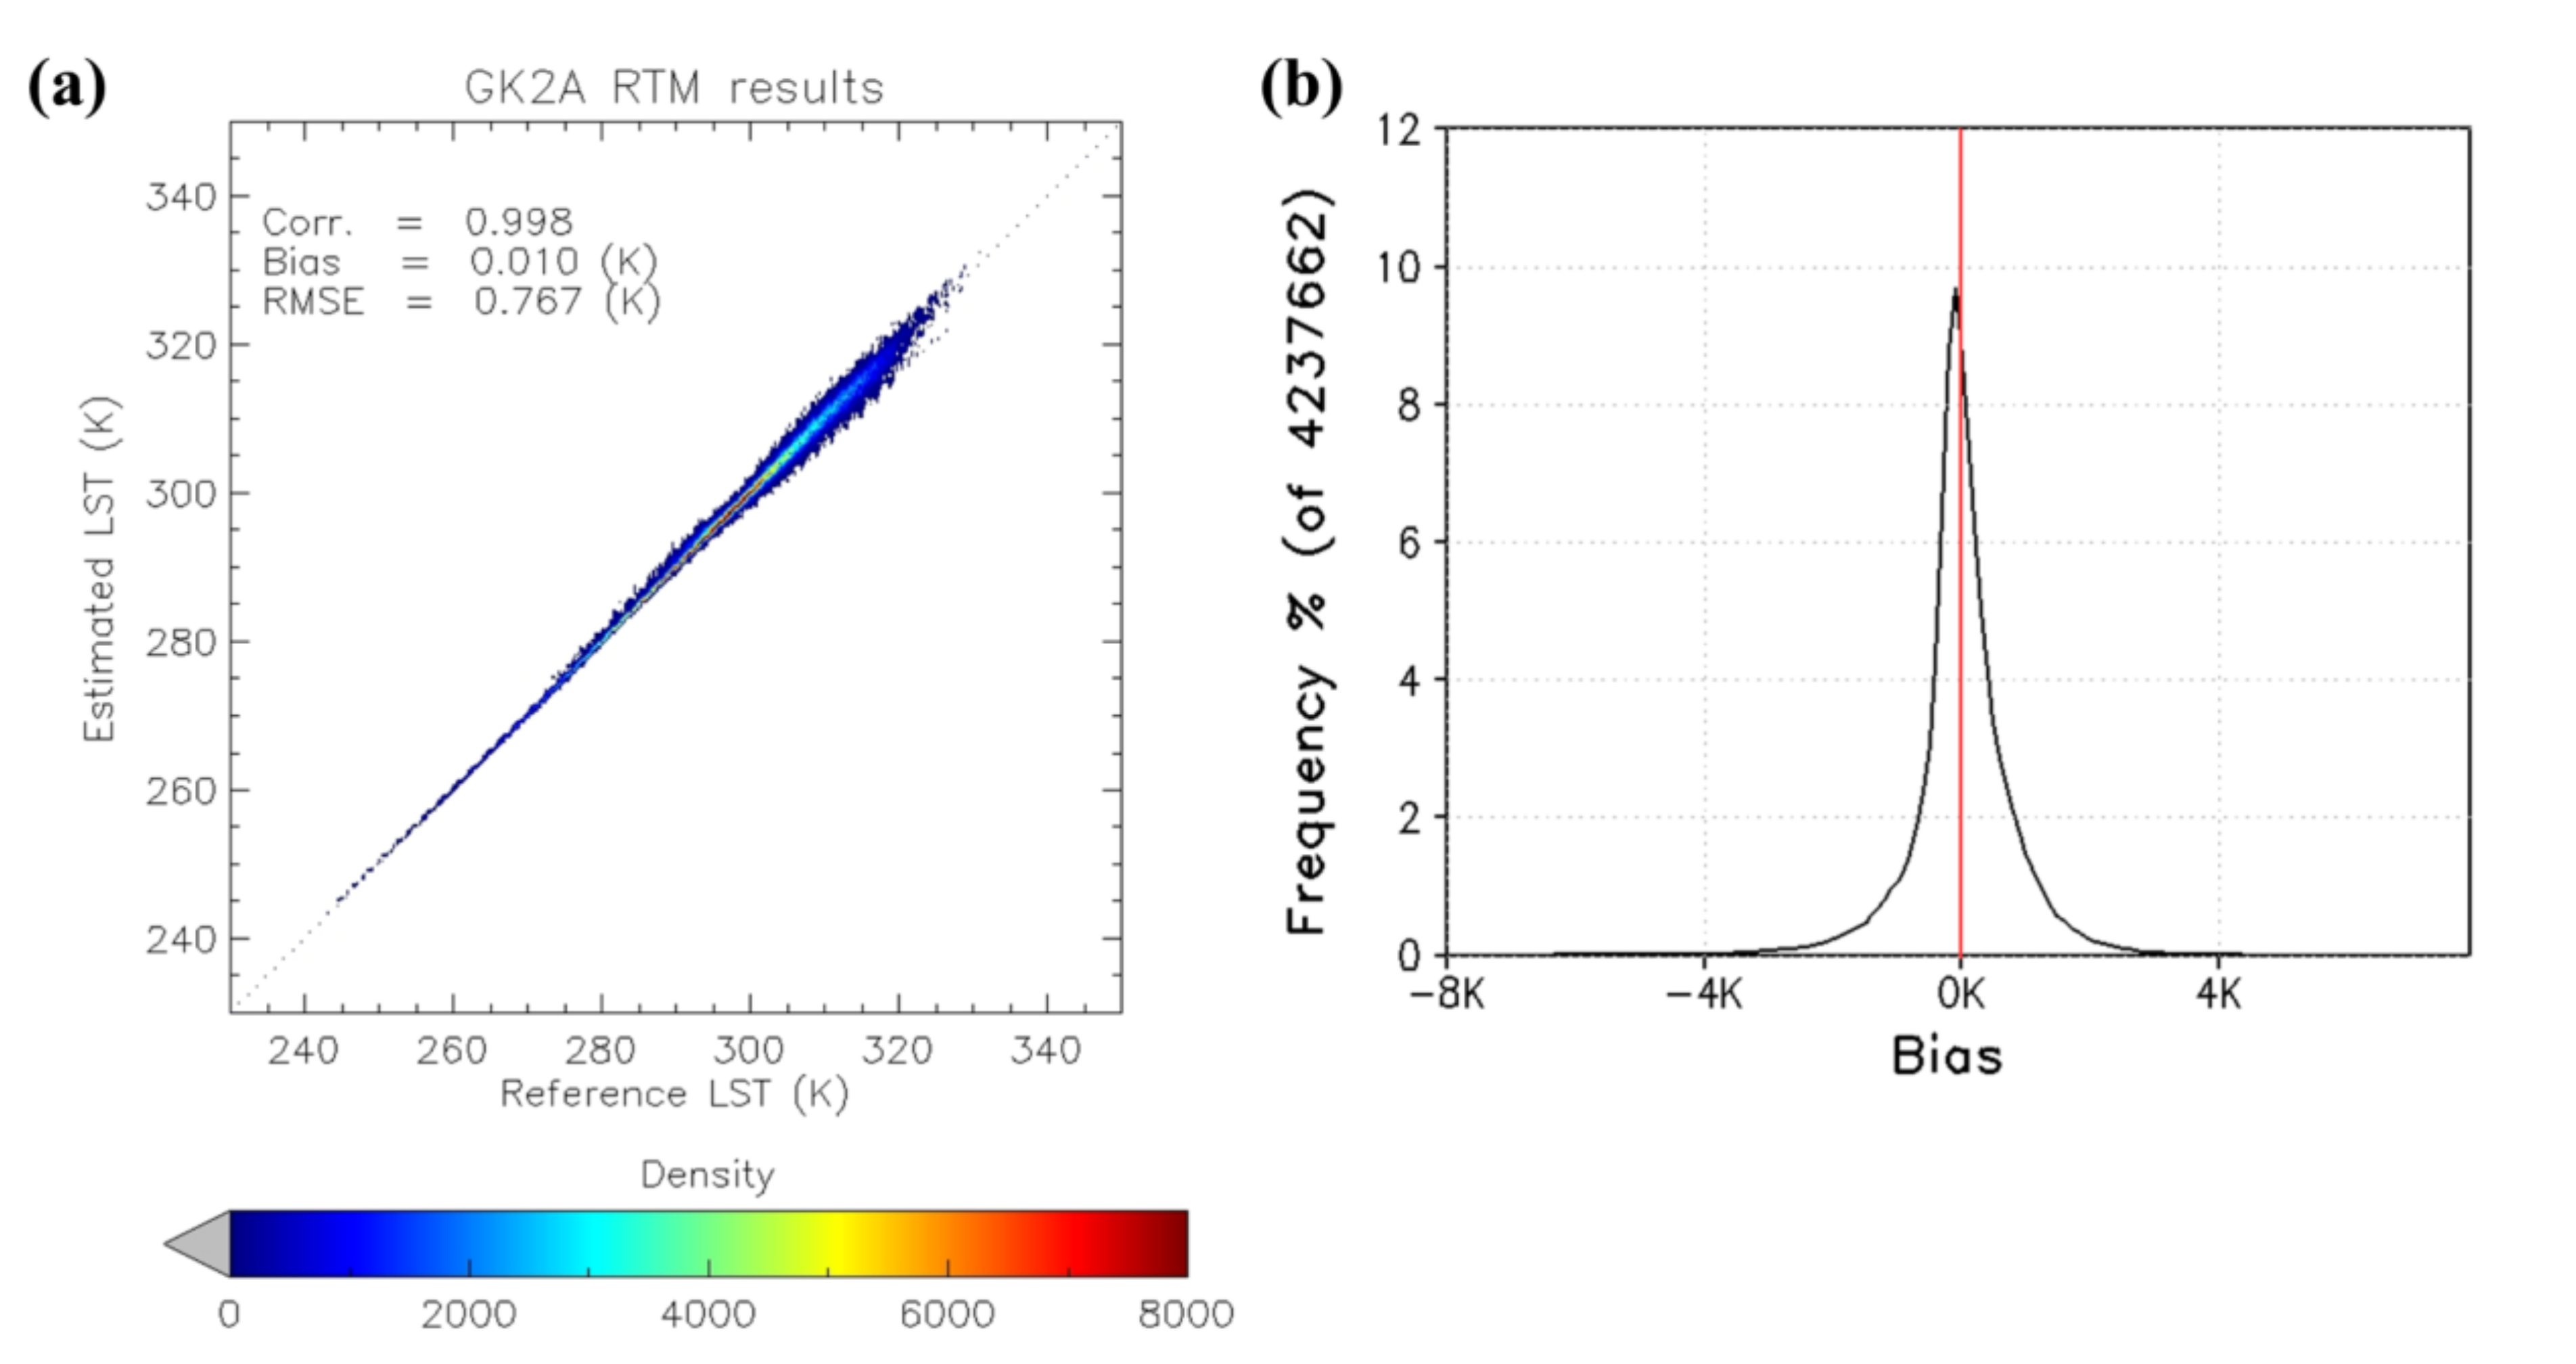
To evaluate the RTM simulation results and the GK2A LST retrieval algorithm, we analyzed the relationship between the reference LST value and estimated LST values, as shown in Figure 5.
The estimated LST generally matched well with the reference LST over a wide range from 245 K to 330 K. The comparison of the retrieved LST with the reference LST showed that the LST retrieval algorithm had a high retrieval accuracy in terms of correlation (0.998), bias (0.010 K), and RMSE (0.767 K). The LST retrieval algorithm, most of the reference LSTs, and the estimated LSTs were distributed based on a 1:1 line. In addition, most of the bias was less than ± 3 K, with a peak value at 0 K. However, when the LST was greater than 300 K, the LST retrieval algorithm slightly over/underestimated the LSTs compared to the reference LST.
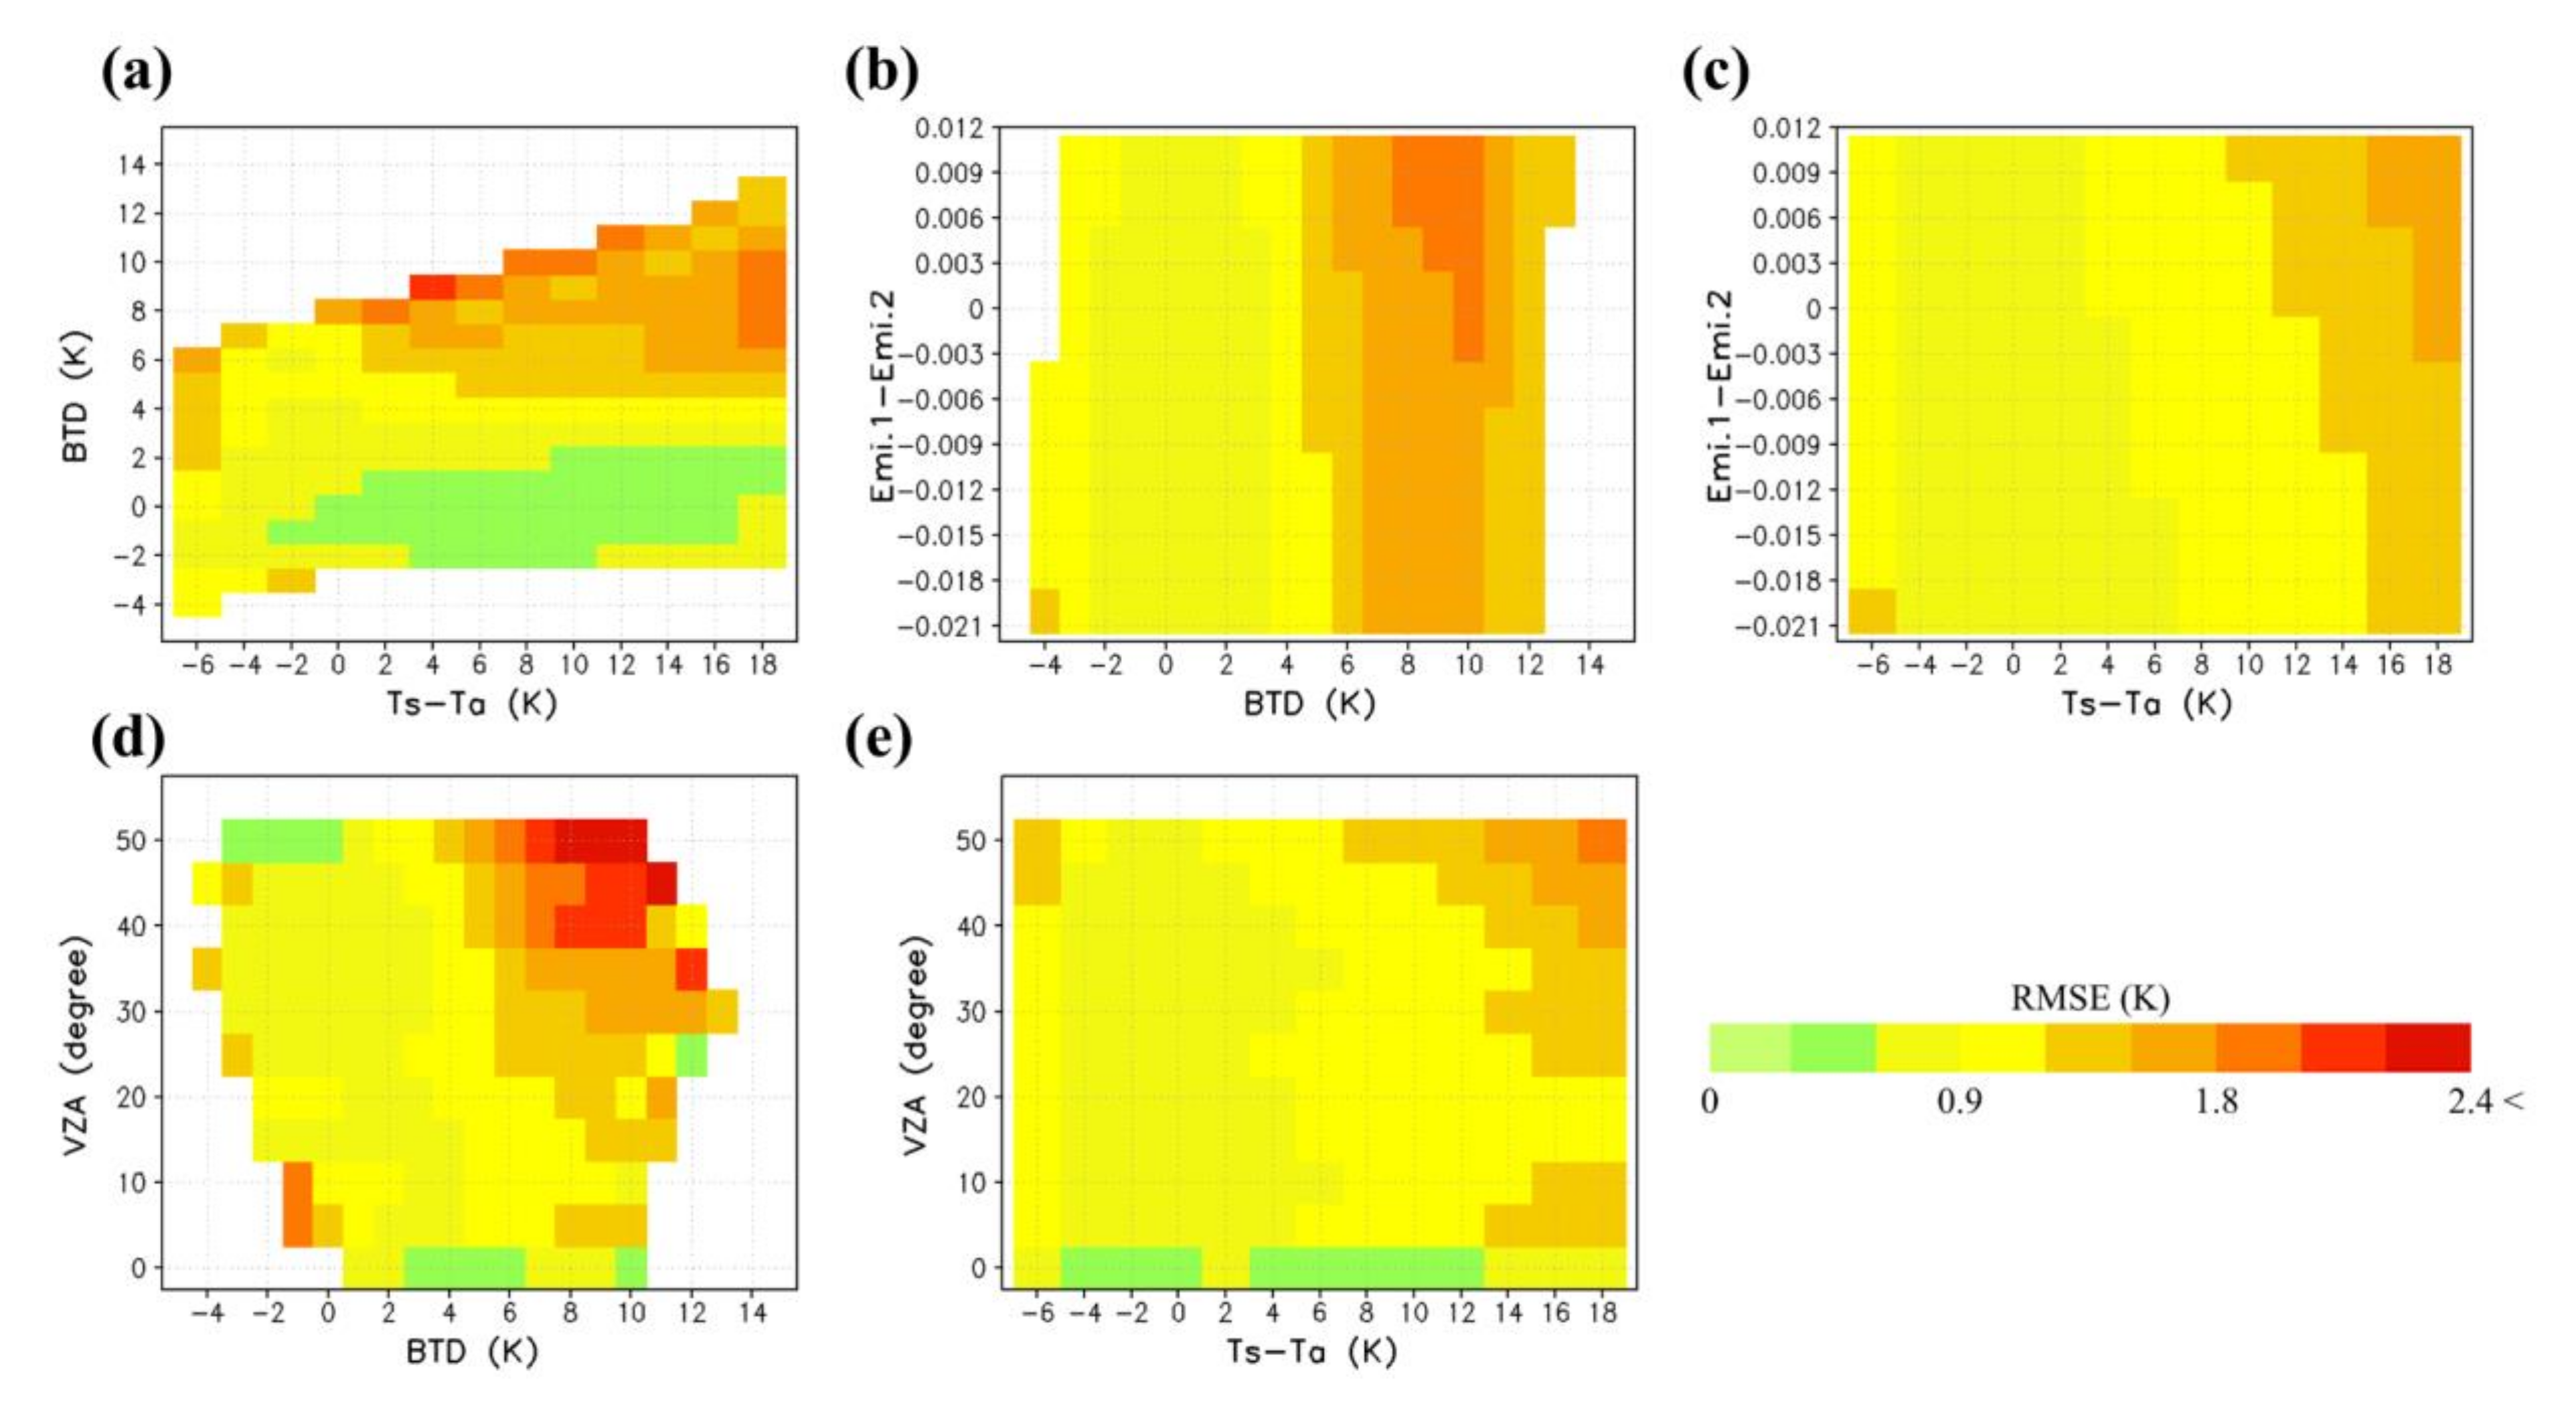
Figure 6 shows the distribution of RMSEs between the estimated LSTs and reference LSTs based on the impact factors (lapse rate, BTD, surface emissivity differences, and satellite VZAs that affect the retrieval accuracy of the LST). Most of the RMSEs are less than 2.1 K, excluding some ranges where the VZA is larger than 40° and the BTD value is larger than 7 K. The reason that the RMSE was large when the VZA was large appears to be due to the fact that the effect of the emissivity becomes significant when the VZA is large, as suggested in many studies [78,79]. One of the most distinctive features of all the cases is that the RMSE was slightly larger when the BTD values were larger than 6 K. The magnitude of BTDs is mainly caused by the different sensitivities of the two window channels to aerosol (channel 13) and water vapor (channel 15). In addition, the GK2A/AMI LST retrieval algorithm is significantly influenced by the VZA and the surface lapse rate among several impacting factors. Compared to previous studies that retrieved LST from Himawari-8, RMSE decreased in all ranges [60]. In particular, when BTD was a positive large value in the previous study, most of the RMSEs were significantly reduced. These results seem to be related to the consideration of the diurnal variation of the boundary layer temperature in the RTM simulations and the consideration of the effect of nonlinearity of water vapor in the LST calculation formula.

3.2. Comparison of Retrieved GK2A LST and MODIS LST Products

To evaluate the GK2A/AMI LST retrieval algorithm, GK2A LSTs were retrieved for 4 months, from July 2019 to October 2019, when GK2A started operational observation. Unlike the RTM simulations, when retrieving LSTs from GK2A/AMI data, the criterion for dividing day and night was the SZA of each pixel, which is the same as that in previous studies [36,60]. Only clear sky and land pixels that satisfied the strict spatial-temporal matching conditions were compared and validated, as mentioned in Section 2.1.2. Figure 7, Figure 8, Figure 9 and Figure 10 show the spatial distribution of the LSTs retrieved from GK2A/AMI data and the MODIS LSTs, along with the spatial distribution of their differences between two datasets for the selected days.
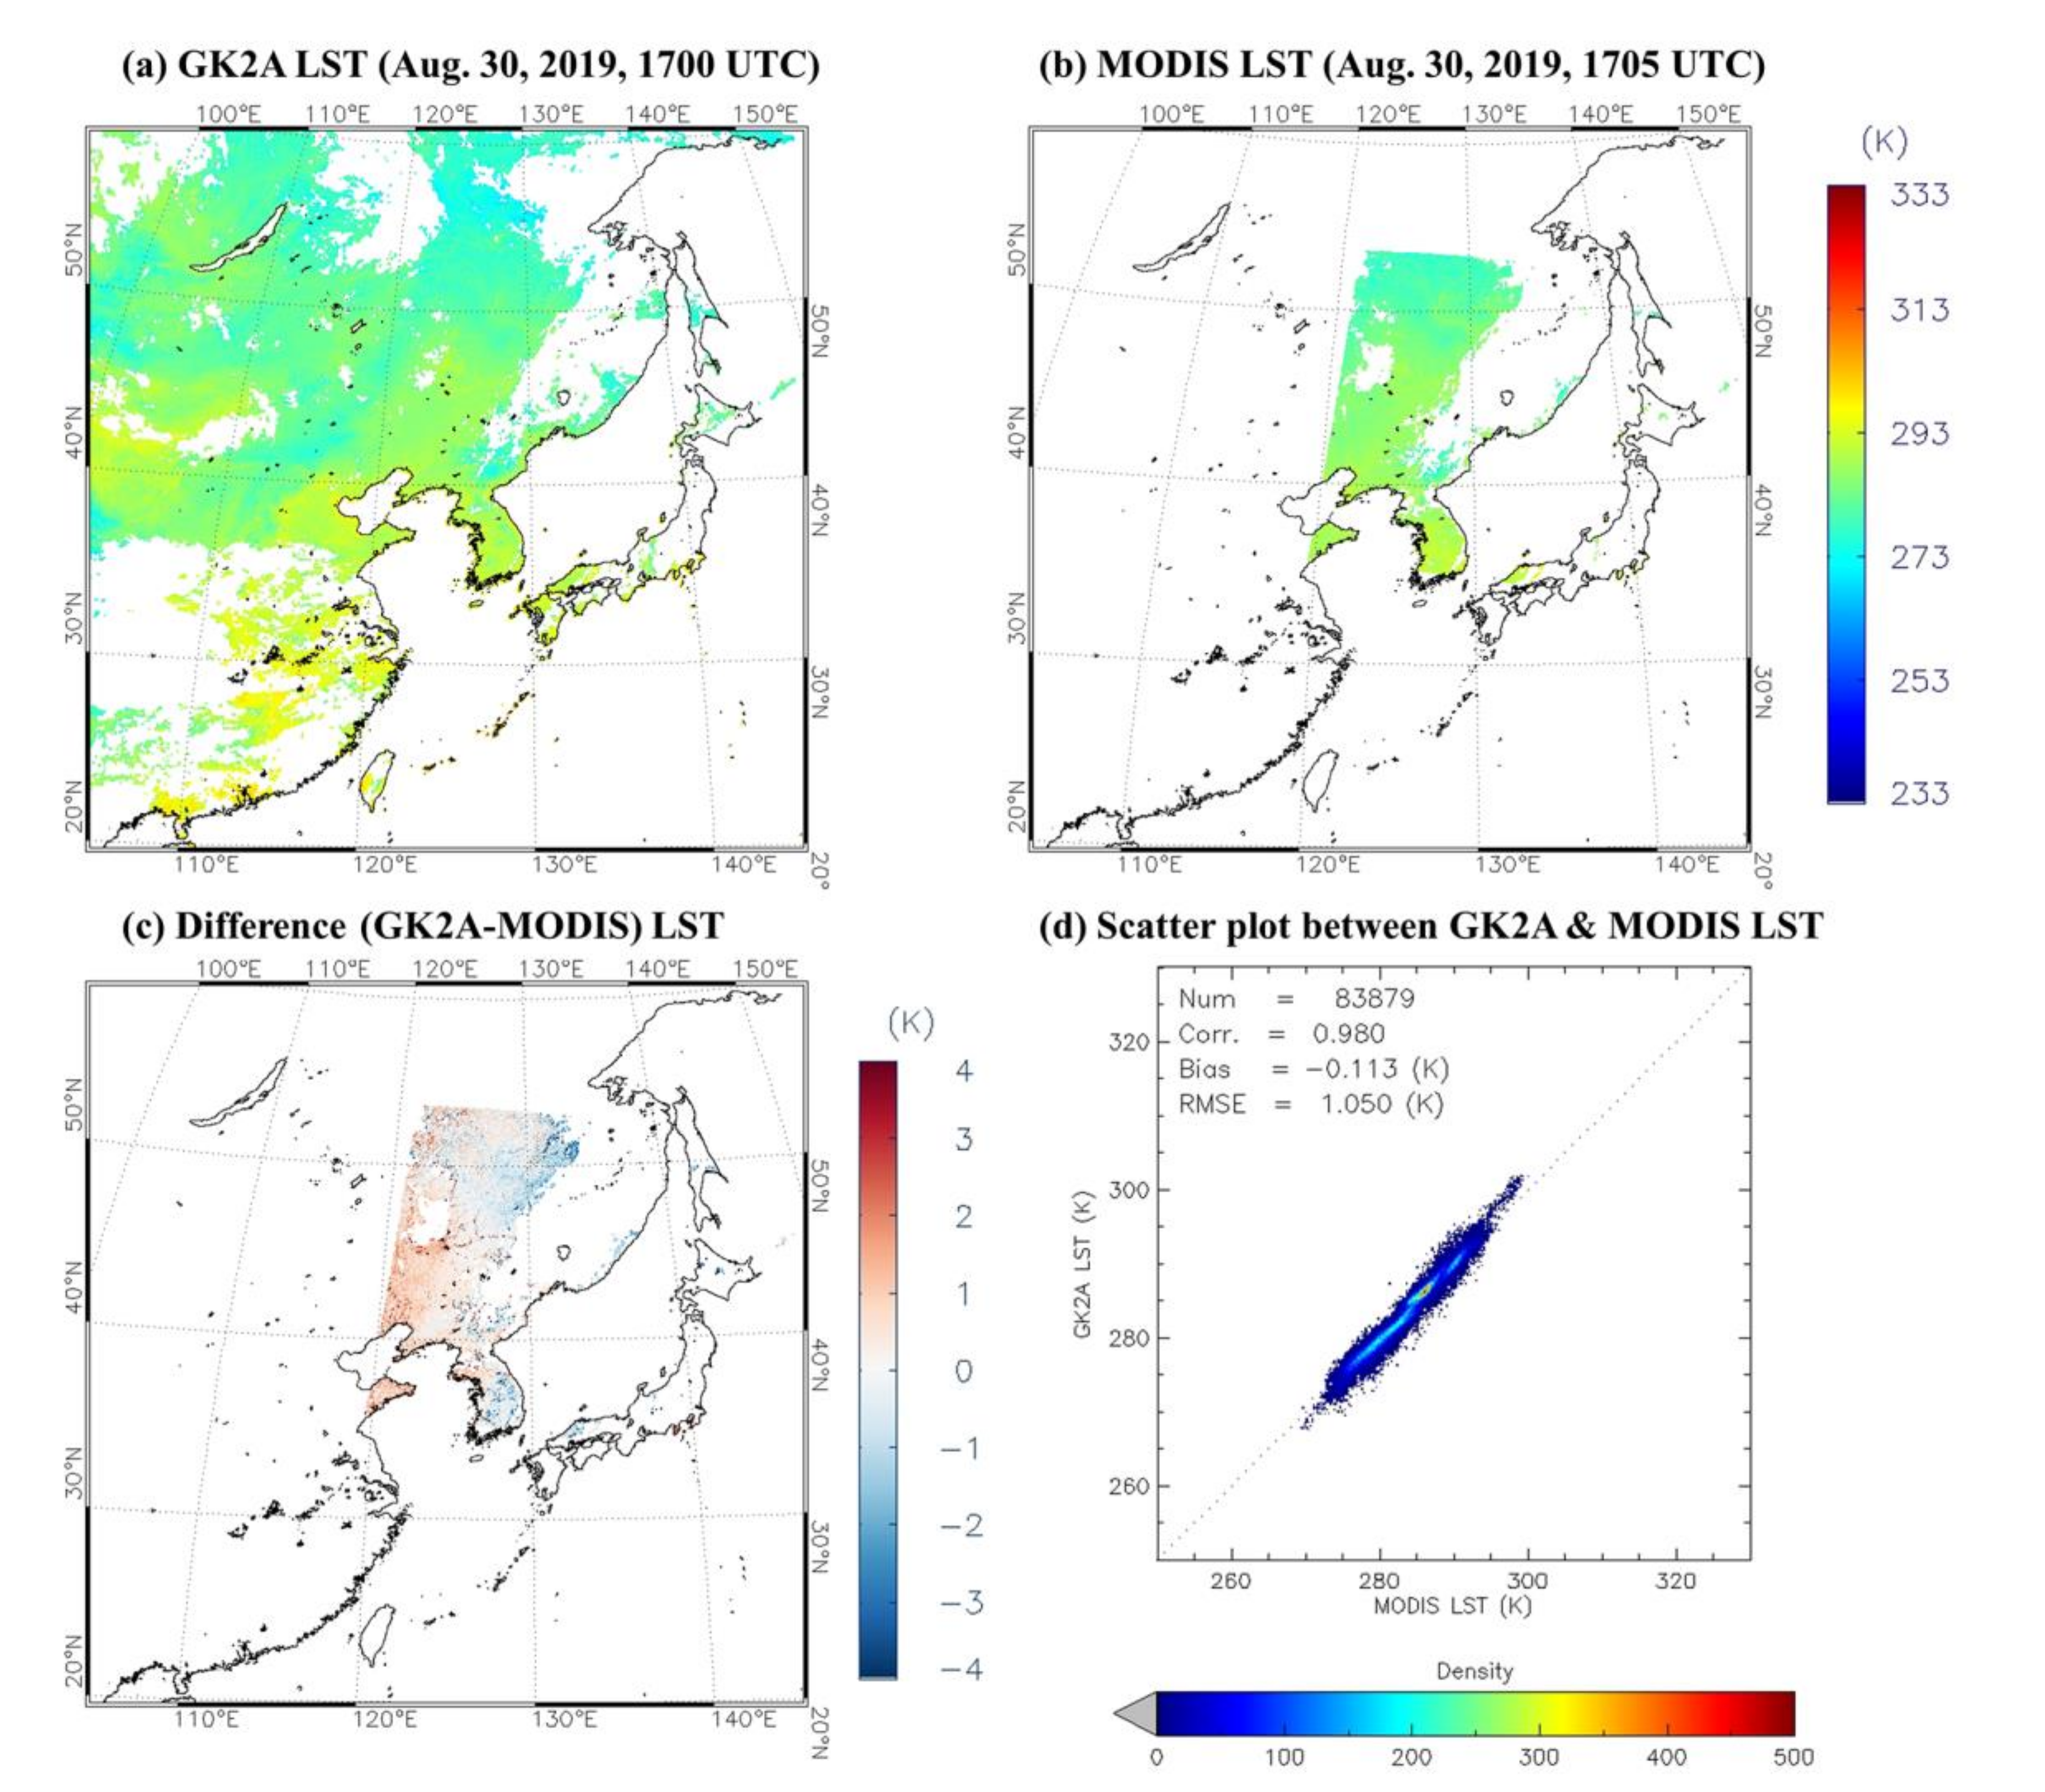
Figure 7 shows the spatial distribution of the GK2A LST and MODIS LST and their differences at 1700 and 1705 UTC on 30 August 2019. The two LSTs show similar spatial distributions in large areas of the Korean Peninsula and northeast China. The difference between the two LSTs was within ± 2 K. In the scatter plot of the two LSTs, the distribution spread slightly to both sides around the 1:1 line from 270 K to 305 K. The bias and RMSE of this scene are −0.113 K and 1.05 K, respectively.
Figure 8 shows the spatial distribution of the two LSTs at 0030 UTC on 30 August 2019. The area in which the LST was retrieved is a region between central and southern Australia consisting of desert, bare soil, and grassland. The difference between the two LSTs in the spatial distribution showed, where the GK2A LST was greater than the MODIS LST. In particular, the warm bias of the GK2A LST was more significant in the desert regions of south Australia than in other regions. For this region, even in the scatter plot, the GK2A LST was higher than the MODIS LST over a wide range (275–310 K). In this case, the bias and RMSE are 0.81 K and 1.264 K, respectively.
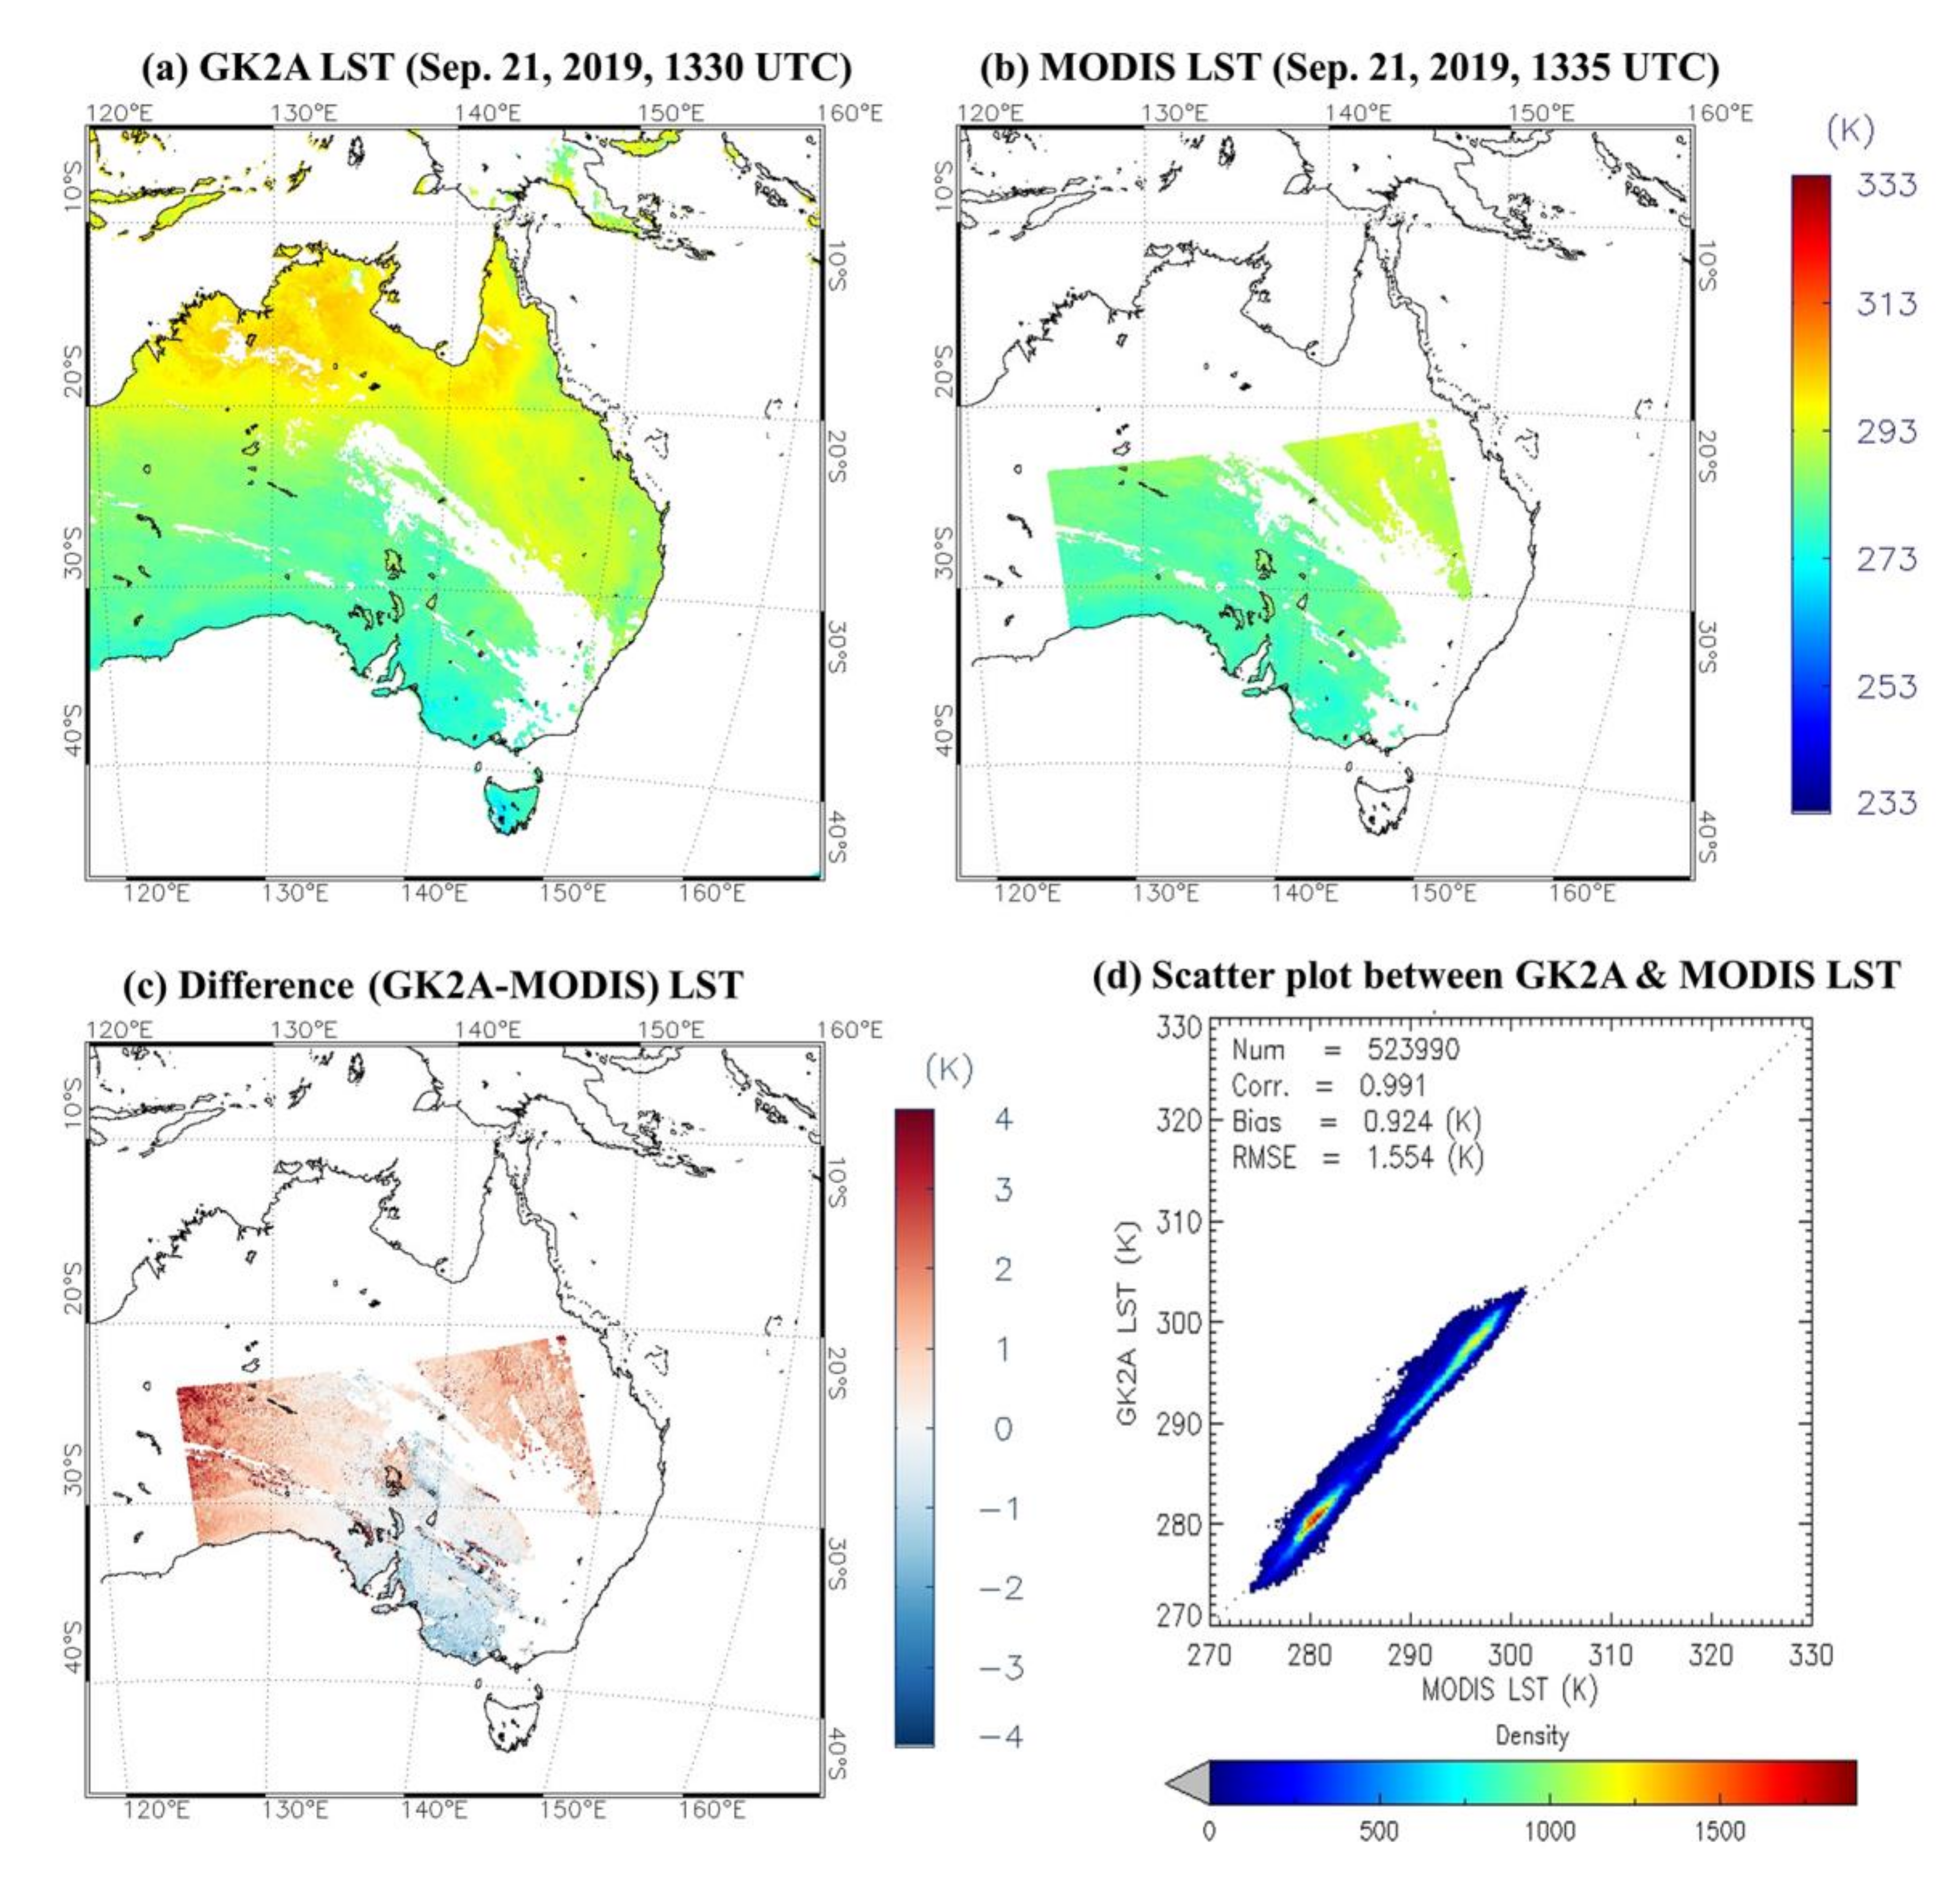
The spatial distribution of the two LSTs and their differences, along with the scatter plot on 21 September 2019, are shown in Figure 9. The observation time of the two LSTs differs by 5 min. The spatial distribution of the two LSTs is generally similar, but the spatial distribution of the difference between the two LSTs showed a warm bias in the desert region of Australia’s inland but a cold bias in south Australia. As shown in the scatter plot, the overall GK2A LST was higher than the MODIS LST in all ranges (270–305 K). As a result, the GK2A LST shows a warm bias of 0.924 K and an RMSE of 1.554 K.
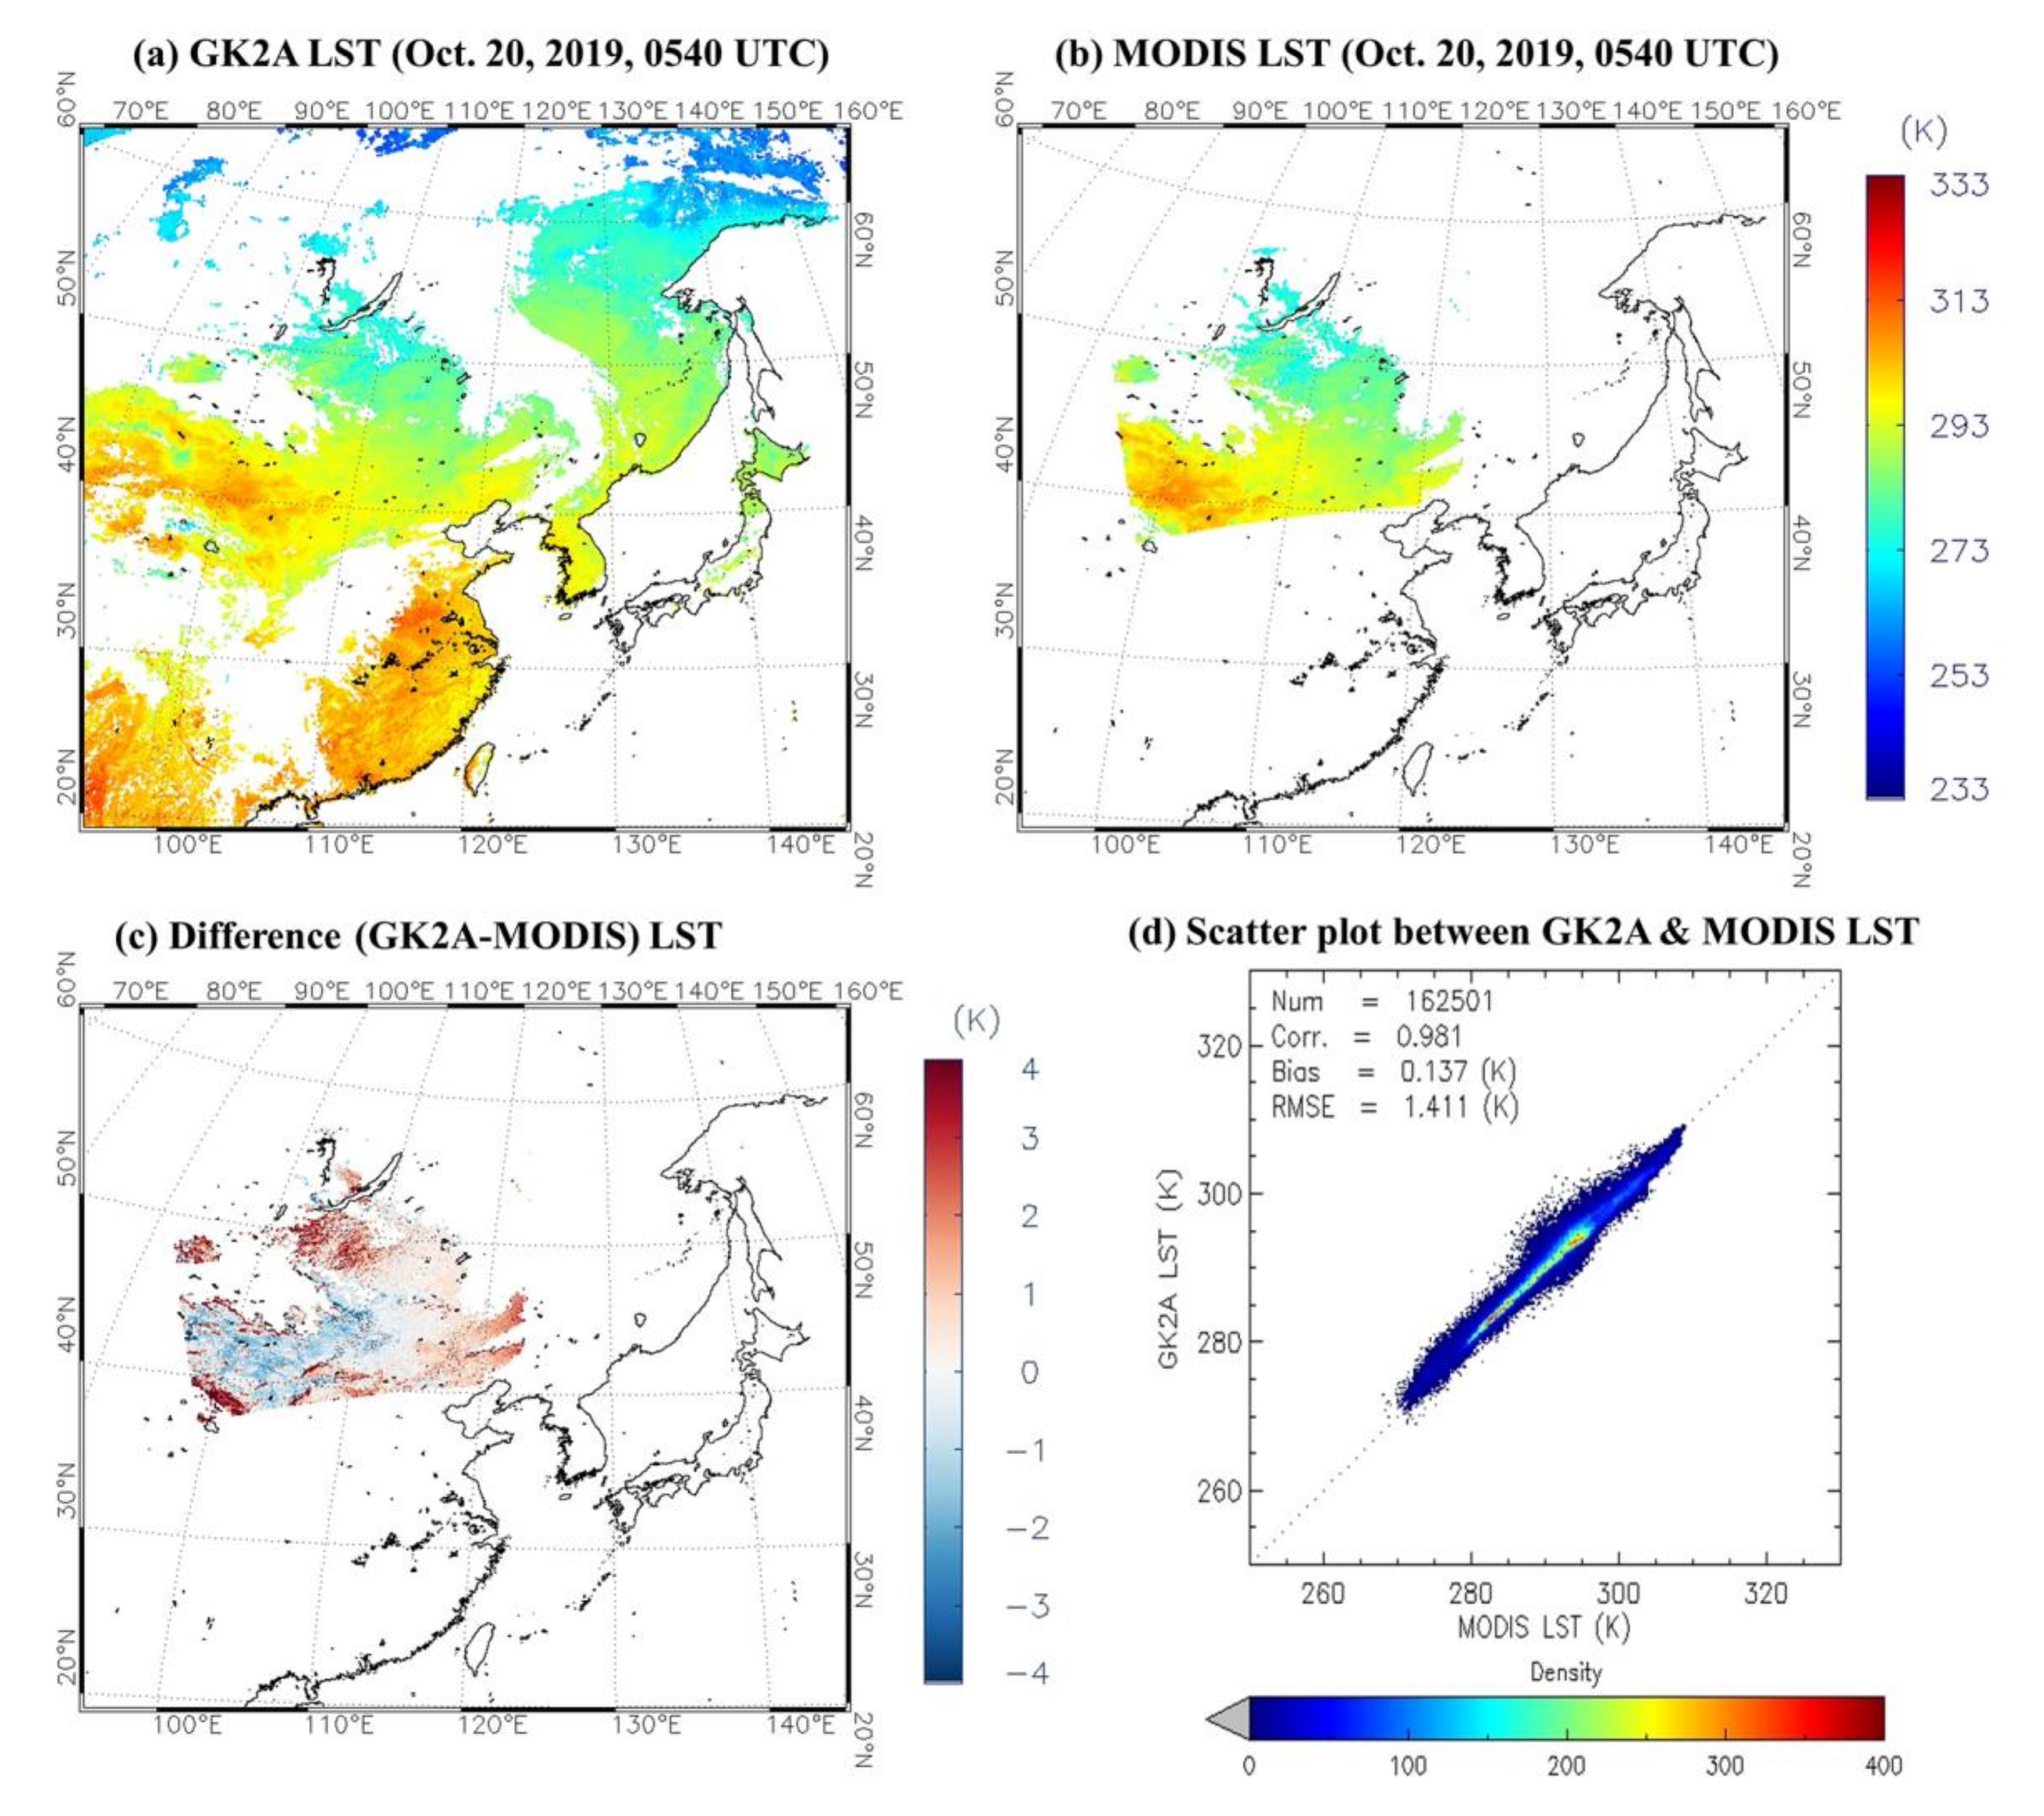
The spatial distribution of the GK2A LST, the MODIS LST, and their differences at 0540 UTC on 20 October 2019, are shown in Figure 10. The two LSTs have similar spatial distributions in large areas of Mongolia and China. The differences between the two LSTs were within ± 3 K. In the scatter plot of the two LSTs, the distribution showed a 1:1 line from 270 K to 295 K, but some pixels were spread around the 1:1 line. The bias and RMSE of this scene are 0.137 K and 1.411 K, respectively.
The indirect validation results of the GK2A LST with the MODIS LST for 4 months (July, August, September, and October 2019) are shown in Table 4. The correlation coefficient between GK2A LST and MODIS LST was greater than 0.96 regardless of the satellite (Terra/Aqua) and months. In addition, the bias showed a warm bias of less than 1.6 K every month. The combined results of the two validation satellites show a high correlation coefficient (0.969), slightly warm bias (1.227 K), and RMSE (2.281 K).
Because the diurnal variation pattern of LST and the retrieval algorithm are very different according to day and night, the performance of the GK2A LST algorithm was evaluated accordingly. Table 5 shows the comparison results between the GK2A and MODIS LSTs according to the daytime and nighttime. The performance of the GK2A LST algorithm is dependent on the validation time, day, and night. In general, the skill of the GK2A LST retrieval algorithm for daytime was about two times worse than that of nighttime, in terms of bias and RMSE, irrespective of the months. The relatively strong warm biases of the GK2A LST during daytime can be attributed to the current status of the MODIS LST [80,81]. The biggest feature is that the GK2A LST overestimated more than the MODIS LST during the daytime, showing a large warm bias (above 1.8 K) and RMSE (above 2.8 K). Moreover, for nighttime, the RMSE was small due to a relatively high correlation and a small bias compared to the daytime.

3.3. Validation Using In-Situ Observation Data

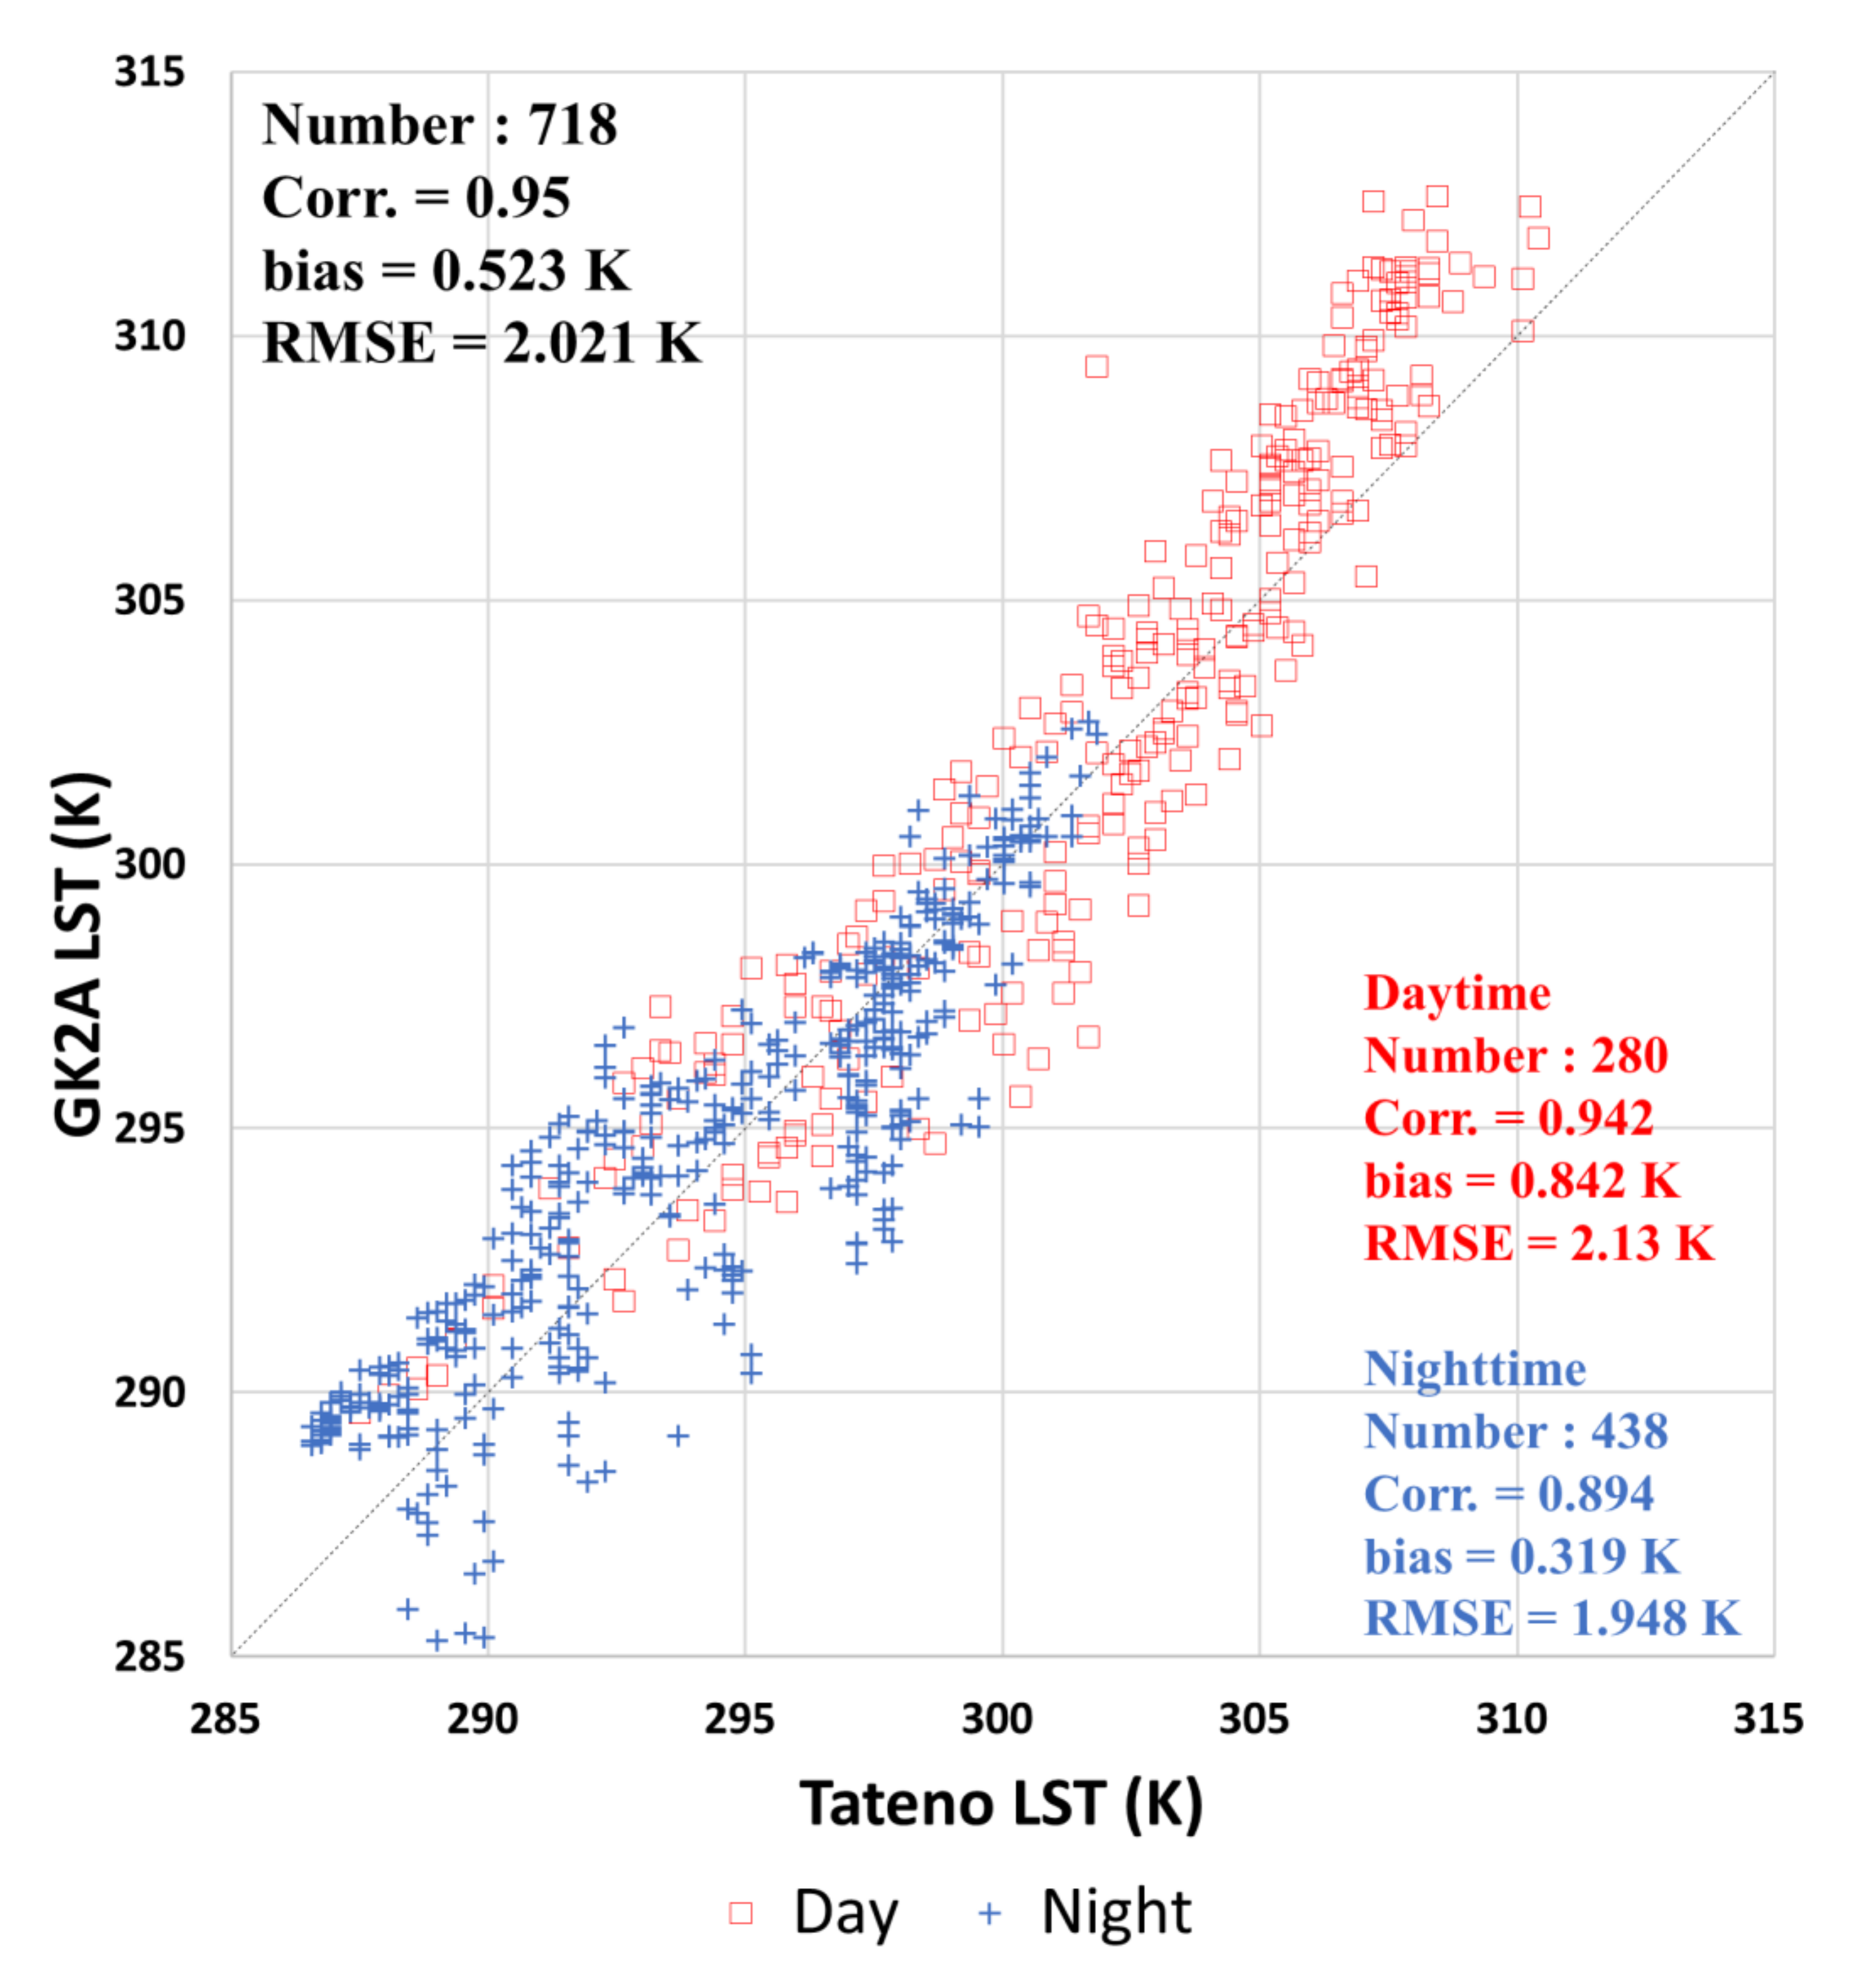
To evaluate the the GK2A LST algorithm, we conducted a quantitative validation of the GK2A LST using in situ observation data. As mentioned in Section 2.1.2, the upward longwave radiation data observed at the Tateno station of the BSRN were used as validation data. Approximately 718 sets from July 2019 to October 2019 satisfying the spatial-temporal matching conditions with the GK2A LST were used for the validation of the GK2A LST. In addition, the performance of the GK2A LST algorithm was evaluated according to daytime and nighttime. The validation results of the GK2A LST with the data from Tateno station are shown in Figure 11. The GK2A LST is similar to or slightly warmer than the ground observed LST at Tateno station, regardless of the temperature and time (day and night). The total correlation coefficient, bias, and RMSE between the GK2A LST and the Tateno LST were 0.95, 0.523 K, and 2.021 K, respectively. However, the GK2A LST was warmer than the ground observed LST; in particular, the LST was greater than 305 K during the daytime. As shown in Figure 11, the GK2A LST shows a greater warm bias (0.84 K) and RMSE (2.13 K) during the day than at night (bias: 0.32 K, RMSE: 1.948 K).

4. Discussion

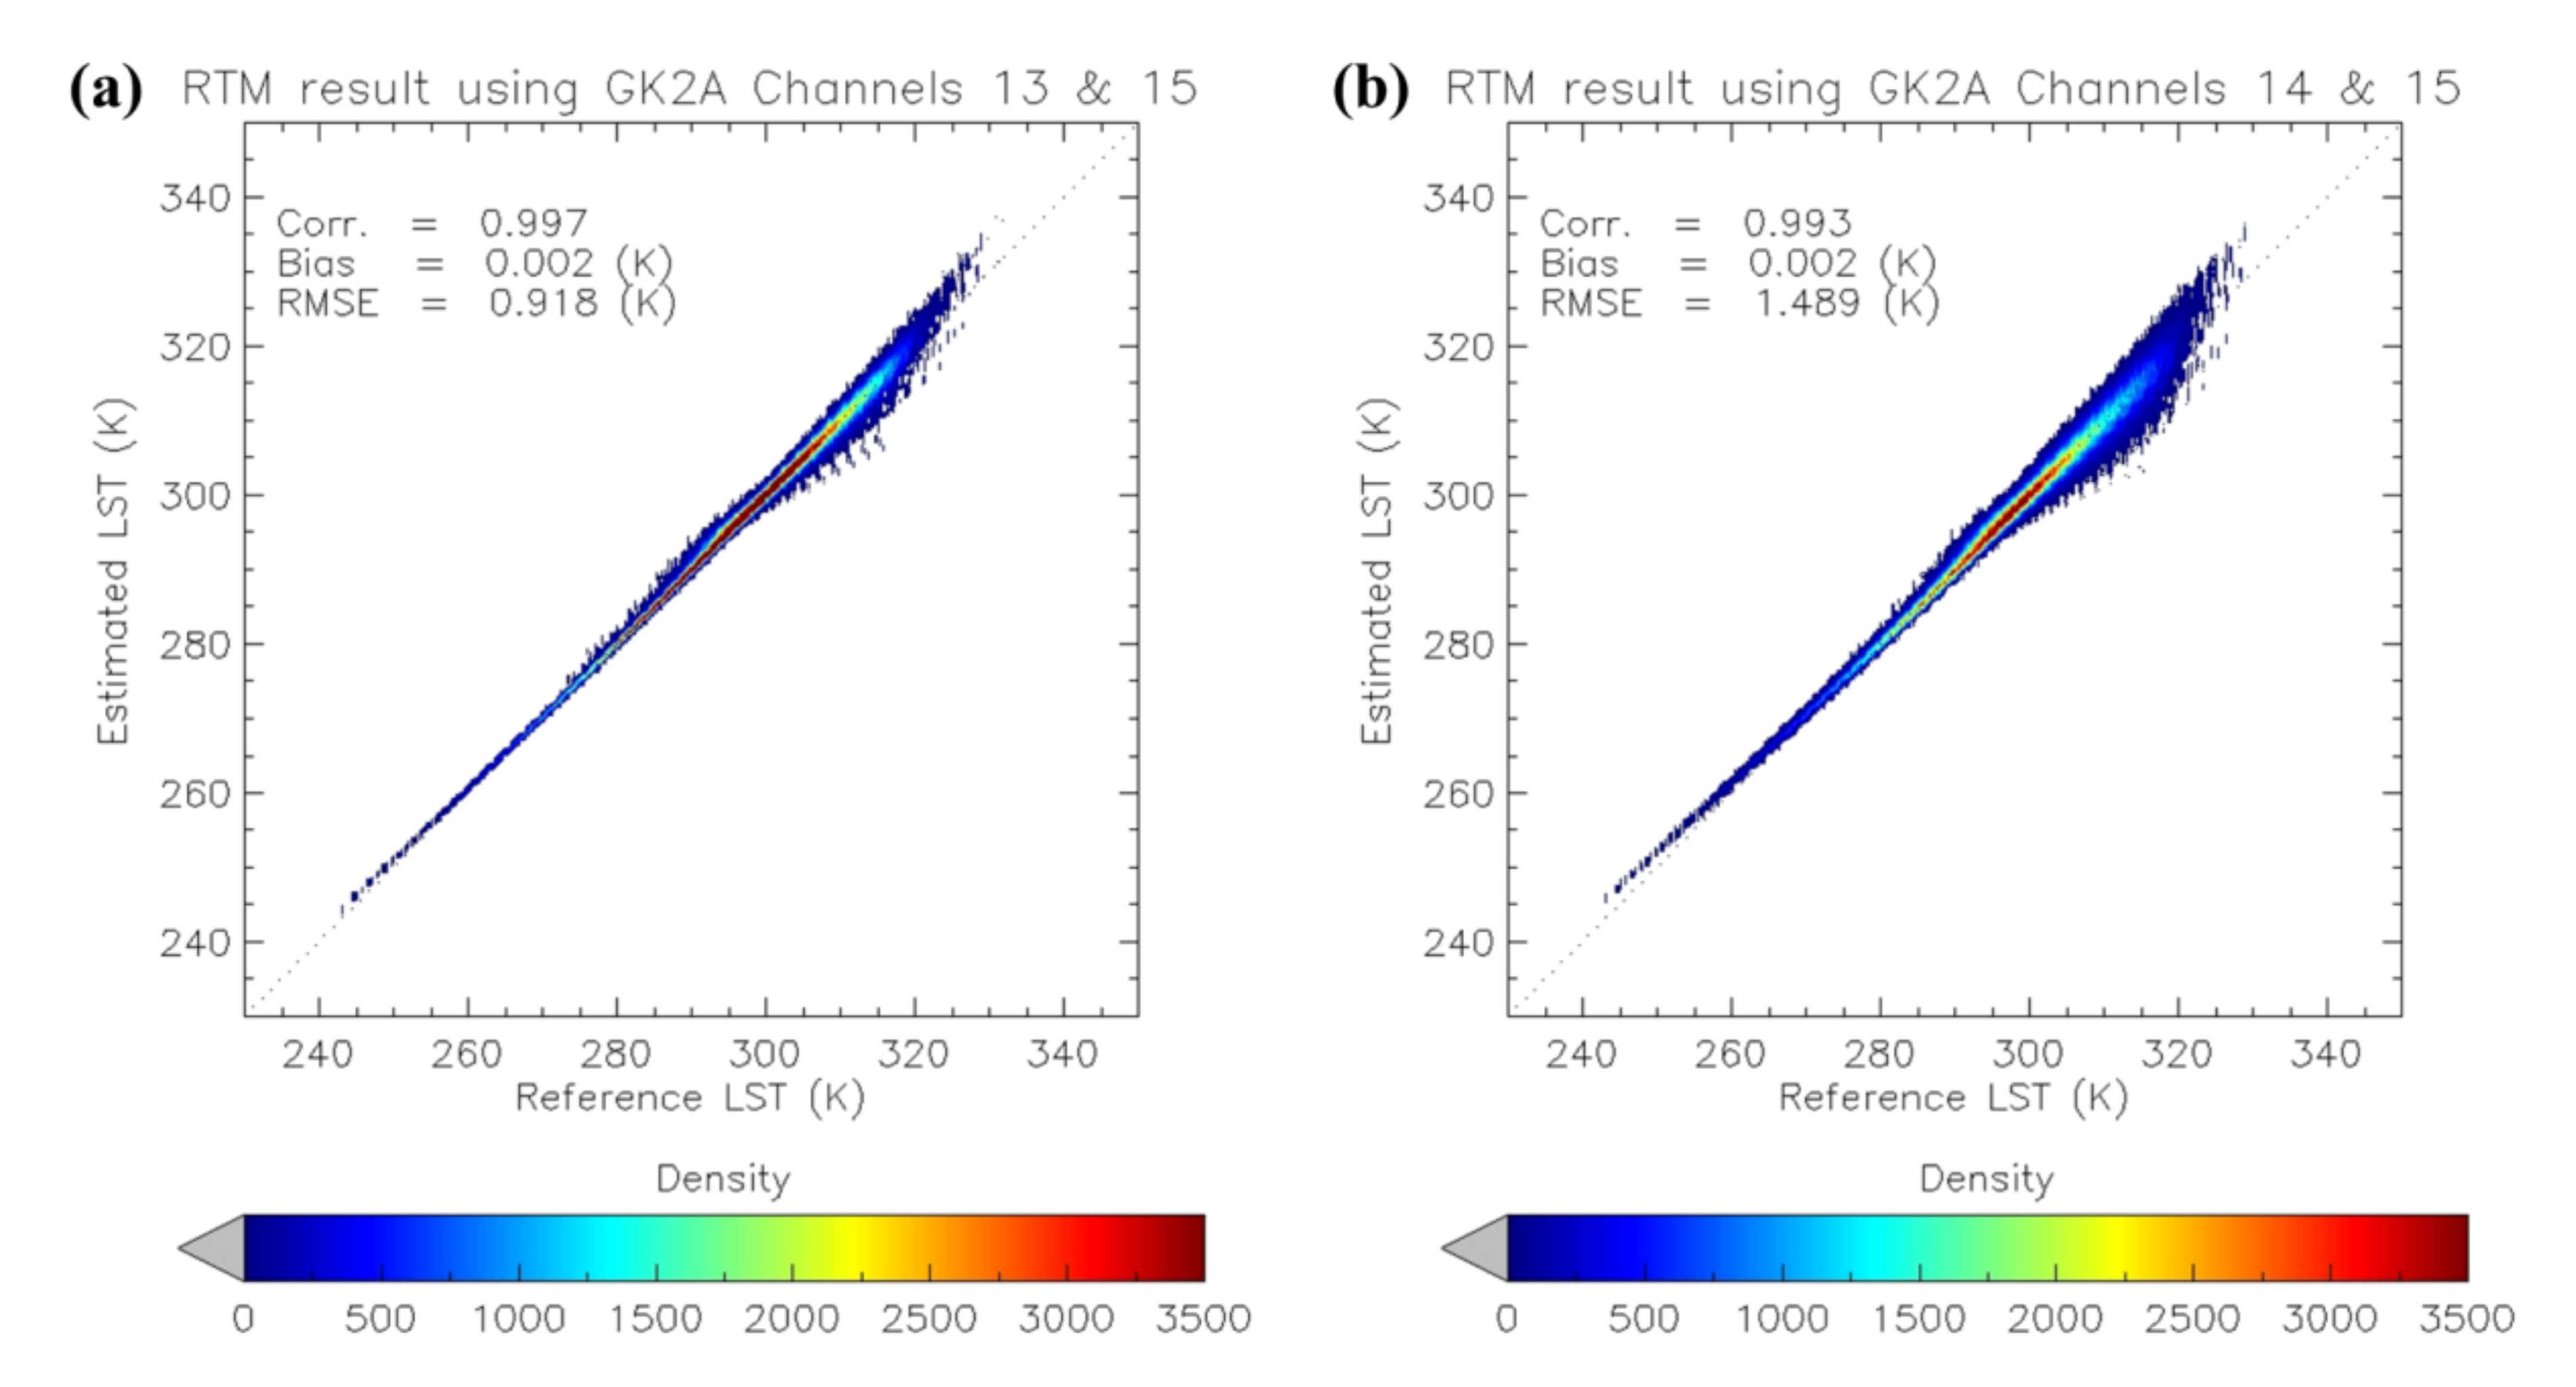
In this study, we developed a GK2A SW LST retrieval algorithm using two adjacent infrared channels in the atmospheric window. GK2A/AMI has three infrared channels (channels 13, 14, and 15) corresponding to the atmospheric window [58]. Channel 15 is more sensitive to water vapor than the other two channels. By comparison, channels 13 and 14 are relatively less sensitive to water vapor, but the sensitivities of the two channels to aerosol and water vapor are slightly different. To select two of the three channels that can be used to retrieve the GK2A LST, RTM simulation results under the same RTM input conditions using channels 13 and 15, as well as channels 14 and 15, were analyzed. The regression coefficients ( c 0 ~ c 6 ) for the LST retrieval Equation (1) using channels 13 and 15 and channels 14 and 15, respectively, were derived from the simulated dataset. The scatter plot results of the estimated LSTs from each dataset are shown in Figure 12.
The two sets of GK2A LST algorithms estimated LSTs in the range of 240 K to 330 K, but the correlation coefficient and RMSE using channels 13 and 15 showed better results than those using channels 14 and 15. In the scatter plots, the distribution used channels 14 and 15 showed a wider spread than that by channels 13 and 15 at over 300 K. This result is similar to that of a previous study using Himawari-8 [60]. Therefore, channels 13 and 15 were selected for this study.
In addition, several forms of linear and non-linear equations can be selected in the LST retrieval formula of the SW method [26,27]. When retrieving LST, the linear equation of SW LST algorithms showed a large error in wet and hot atmospheric conditions, therefore, non-linear equations of SW LST algorithms have been developed [26,47,77,82,83]. In this study, linear and non-linear equations of the SW LST algorithms were developed and applied to real GK2A data to compare the accuracy of the algorithm. The simulation conditions for the RTM are shown in Table 2, and the coefficient of c 3 in the LST retrieval equation (Equation (1)) is set to zero to represent a linear algorithm. In addition, the coefficients of LST retrieval algorithms were derived by dividing into day/night and dry/normal/wet conditions using the same thresholds of SZA and BTD, as described in Section 3. Table 6 shows the results of quantitatively comparing the GK2A LST and MODIS LST for one month from the linear algorithm and non-linear SW LST algorithm. As a result of verifying the GK2A LST calculated with linear and non-linear algorithms for the September 2019 case with the MODIS LST, the correlation coefficient between the GK2A LST and MODIS LST was very similar in linear and nonlinear algorithms, but the bias and RMSE showed better results in nonlinear algorithms.
Even though the non-linear SW LST algorithm was used, the GK2A LST algorithm showed significant errors during the daytime compared to the MODIS LST. The MODIS Collection 6 LST product, used as validation data, is an improved version of the MODIS Collection 5 LST product by Wan (2014) [32]. One of the improvements in the MODIS Collection 6 LST over the Collection 5 LST is that the MODTRAN simulation is performed by dividing into day and night for the bare soil area and adjusting the emissivity difference in MODIS bands 31 and 32 over bare soil surfaces [32]. In addition, a term including the quadratic difference between the brightness temperatures of bands 31 and 32 was added to the MODIS’ generalized SW algorithm. Even though the MODIS Collection 6 LST product had many improvements compared to Collection 5, a cold bias still appeared from −1.4 to −3.7 K during the daytime when compared with in situ measurements [81]. According to the validation study, MODIS Collection 6 LST showed the RMSE of daytime LSTs as 2.59 K, 2.86 K, and 3.05 K for the Gobi area, desert steppe region, and sand desert area, respectively [80]. Considering that the cold bias of the MODIS Collection 6 LST is strong during daytime over bare soil and desert regions, the warm bias of the GK2A LST algorithm can be regarded as normal rather than a serious problem. However, a detailed analysis of bare soil and desert areas using more validation data is needed. In the four-month verification results, the errors in September and October were systematically larger than those in July and August. So, we tried to find the cause but, unfortunately, we could not. In addition, a relatively strong warm bias appeared during the day at Tateno station. This seems to be related to the fact that the land cover at the Tateno point is grass, but most of the area around this point is urban.
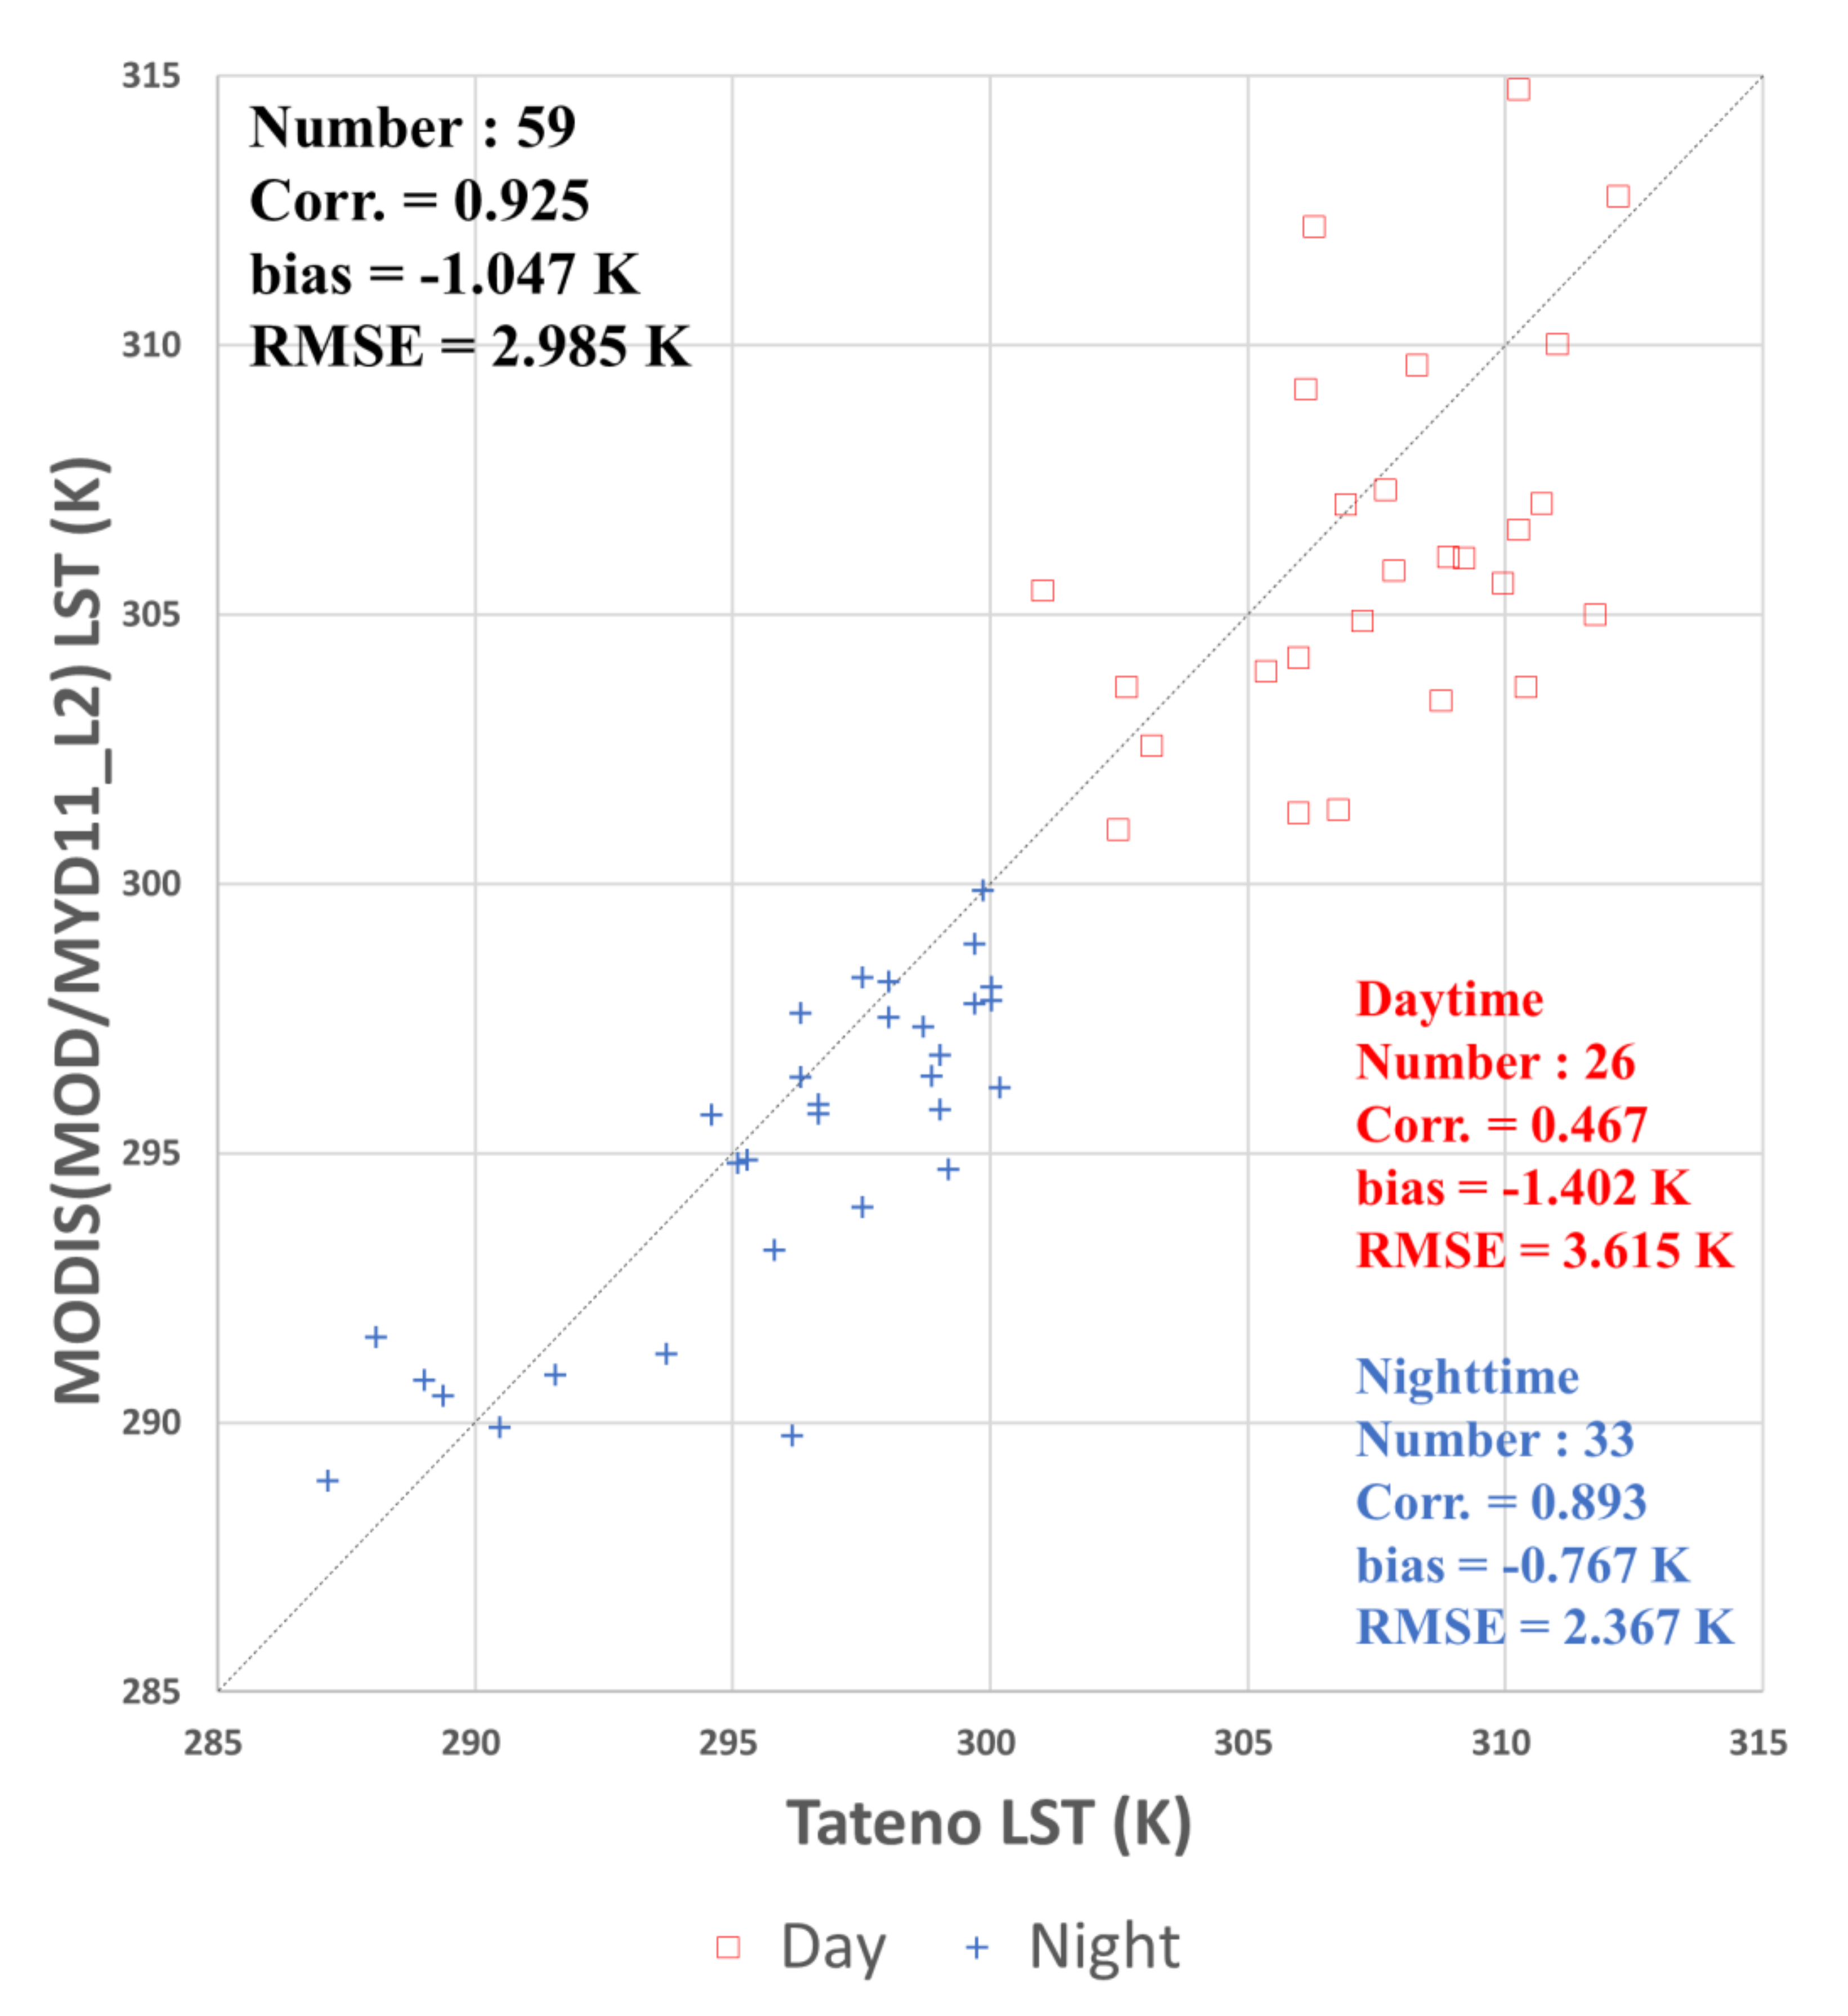
To compare the accuracy of the MODIS LST, it was validated using the LST at Tateno station for the same period as the GK2A LST. The validation results of the MODIS (MOD11/MYD11_L2) LST with those from Tateno station are shown in Figure 13. The MODIS LST was slightly colder than Tateno LST, regardless of the daytime and nighttime. The total correlation coefficient, bias, and RMSE between MODIS LST and Tateno LST were 0.925, −1.047 K, and 2.985 K, respectively. Although the number of samples was small, the MODIS LST showed a cold bias compared to the in situ LST in both daytime and nighttime. In particular, the daytime bias (−1.402 K) of the MODIS LST was nearly twice that of the nighttime (−0.767 K). In the comparative validation results of the GK2A LST and the MODIS LST, the reason why the warm bias of GK2A is large during the daytime is also considered to be related to the cold bias of MODIS LST during the daytime.
The number of on-site observation points in the GK2A observation area is not only limited but also the number of data accessible over the internet is small, so we used observation data from the Tateno station. The in situ measured radiation represents a narrow area, whereas the retrieved LST from the satellite is the average temperature corresponding to satellite resolution (2 km × 2 km), so there is a limitation in the spatial representativeness of in situ observation for the satellite. Since the period for retrieving and validating the GK2A LST is as short as four months, there is a limit to evaluating the integrated level of the LST retrieval algorithm.
When retrieving LST from a satellite, the split-window method assumes that the LSE of both channels is known. In this study, the GK2A LSE data derived in real-time using the modified VCM method were used [68]. The fractional vegetation cover of a given pixel was calculated using the GK2A vegetation index (VI) data generated by the maximum value composite with a consecutive 8-day VI [63]. Based on the calculated fractional vegetation cover, the LSEs were retrieved using the look-up table according to the land cover and daily snow cover of each pixel. The VI, land cover classification database, spectral emissivity look-up table, and daily snow cover were calculated from each algorithm, so they contain errors which also affect the accuracy of the retrieved LST. Therefore, to improve the accuracy of the GK2A LST, it is necessary to improve the accuracy of these algorithms.

5. Conclusions

We have developed an operational LST retrieval algorithm for the GK2A viewing area using GK2A/AMI data from Korea’s next-generation geostationary satellite. To develop the GK2A LST algorithm, the split-window method was used, and the nonlinearity of water vapor was considered in the algorithm. The RTM simulation data were constructed taking into account various factors affecting the LST calculation in MODTRAN 4 (atmospheric profiles, diurnal variation of LST and air temperature of the boundary layer, and the LSE variations of the two channels). From the RTM simulation data set, regression coefficients were derived according to the actual water vapor (GK2A BTD: dry/normal/wet) during the day and night. The GK2A LST was retrieved using the developed GK2A LST algorithm, and their accuracies were evaluated using MODIS LST and field observations as validation datasets.
As a result of evaluating the output level of the LST calculated by the RTM simulation using the prescribed LST, there was a correlation coefficient of 0.998, a bias of 0.01 K, and an RMSE of 0.767 K. When the BTD value is larger than 6 K and the satellite’s VZA is large, the RMSE is large, but the error is relatively smaller than the result of using the linear algorithm of the previous study [61].
Using the GK2A LST algorithm developed in this study, LST was calculated from GK2A data for four months from July 2019 to October 2019. As a result of comparing the GK2A LST with the MODIS LST, the spatial correlation coefficient of the two LSTs was 0.969, the bias was 1.227 K, and the RMSE was 2.281 K. Compared to MODIS LST, GK2A LST shows a warm bias greater than 1.8 K during the day, but a relatively small bias of less than 0. 7 K at night. In particular, the warm bias of the GK2A LST was higher than that of MODIS LST in desert and barren areas during daytime. MODIS LST Collection 6, used as validation data, seems to be influenced by characteristics of cold bias in the desert and on bare soil [80,81]. The results of validation with data from the Tateno station of the BSRN, which were the field observation data, showed that the correlation coefficient is 0.95, the bias is 0.523 K, and the RMSE is 2.021 K. Compared to the Tateno LST, the day bias is +0.5 K greater than the night bias. The reason that the GK2A LST tends to be warmer than the Tateno LST during the day is that the temperature at Tateno station is the temperature of the grass, while the GK2A LST is the temperature of the surrounding urban area.
The GK2A LST algorithm developed in this study uses various outputs of GK2A (cloud detection, VI, snow cover, and LSE) and ancillary data to calculate LST. Therefore, it is possible to improve the accuracy of the GK2A LST by improving the algorithm that produces the basic input data for LST calculation. In addition, it is necessary to evaluate the output level of the GK2A LST algorithm using verification data for a longer time because the surface temperature and atmospheric characteristics differ depending on the season. As other satellite data (Visible Infrared Imaging Radiometer Suite LST, Sentinel-3 Sea and Land Surface Temperature Radiometer LST) and additional field observation data (HiWATER) are starting to be released, it is considered that a cross-comparison study with these data is necessary for globally continuous LST calculation. In addition, if the accuracy of the GK2A LST is improved, it will be able to contribute to the establishment of long-term climatological LST data retrieved from satellites, such as the CCI (Climate Change Initiative) LST project underway by the ESA (European Space Agency) [84].

Author Contributions

Conceptualization, M.-S.S.; Methodology, M.-S.S.; Software, Y.-Y.C.; Validation, Y.-Y.C.; Formal analysis, Y.-Y.C. and M.-S.S.; Investigation, Y.-Y.C.; Data curation, Y.-Y.C.; Writing—original draft preparation, Y.-Y.C.; Writing—review and editing, M.-S.S. and Y.-Y.C.; Visualization, Y.-Y.C.; Supervision, M.-S.S.; Project administration, M.-S.S.; Funding acquisition, M.-S.S.; All authors contributed extensively to the work presented in this paper. All authors have read and agreed to the published version of the manuscript.

Funding

This work was supported by “Development of Scene Analysis and Surface Algorithms” project, funded by ETRI, which is a subproject of the “Development of Geostationary Meteorological Satellite Ground Segment (NMSC-2019-01)” program funded by the NMSC (National Meteorological Satellite Center) of the KMA (Korea Meteorological Administration). This work was also funded by the Korea Meteorological Administration Research and Development Program under Grant KMI2018-06510.

Acknowledgments

We thank the Korean Meteorological Administration’s National Meteorological Satellite Center for providing the GK2A/AMI dataset and cloud mask.

Conflicts of Interest

The authors declare no conflict of interest.

References

  1. Dash, P.; Göttsche, F.; Olesen, F.-S.; Fischer, H. Land surface temperature and emissivity estimation from passive sensor data: Theory and practice-current trends. Int. J. Remote Sens. 2002, 23, 2563–2594. [Google Scholar] [CrossRef]
  2. Becker, F.; Li, Z.-L. Surface temperature and emissivity at various scales: Definition, measurement and related problems. Remote Sens. Rev. 1995, 12, 225–253. [Google Scholar] [CrossRef]
  3. Song, Z.; Li, R.; Qiu, R.; Liu, S.; Tan, C.; Li, Q.; Ge, W.; Han, X.; Tang, X.; Shi, W.-Y.; et al. Global Land Surface Temperature Influenced by Vegetation Cover and PM2.5 from 2001 to 2016. Remote Sens. 2018, 10, 2034. [Google Scholar] [CrossRef] [Green Version]
  4. Wang, K.; Wan, Z.; Sparrow, M.; Liu, J.; Zhou, X.; Haginoya, S. Estimation of surface long wave radiation and broadband emissivity using Moderate Resolution Imaging Spectroradiometer (MODIS) land surface temperature/emissivity products. J. Geophys. Res. Space Phys. 2005, 110, D11. [Google Scholar] [CrossRef]
  5. Chen, Y.; Yang, K.; He, J.; Qin, J.; Shi, J.; Du, J.; He, Q. Improving land surface temperature modeling for dry land of China. J. Geophys. Res. Space Phys. 2011, 116, D20. [Google Scholar] [CrossRef]
  6. Dousset, B.; Gourmelon, F.; Laaidi, K.; Zeghnoun, A.; Giraudet, E.; Bretin, P.; Mauri, E.; Vandentorren, S. Satellite monitoring of summer heat waves in the Paris metropolitan area. Int. J. Clim. 2010, 31, 313–323. [Google Scholar] [CrossRef]
  7. Julien, Y.; Sobrino, J.A.; Verhoef, W. Changes in land surface temperatures and NDVI values over Europe between 1982 and 1999. Remote Sens. Environ. 2006, 103, 43–55. [Google Scholar] [CrossRef]
  8. Ibrahim, G.R.F. Urban Land Use Land Cover Changes and Their Effect on Land Surface Temperature: Case Study Using Dohuk City in the Kurdistan Region of Iraq. Climate 2017, 5, 13. [Google Scholar] [CrossRef] [Green Version]
  9. Hereher, M. Effect of land use/cover change on land surface temperatures—The Nile Delta, Egypt. J. Afr. Earth Sci. 2017, 126, 75–83. [Google Scholar] [CrossRef]
  10. Zhao, L.; Yang, Z.-L.; Hoar, T.J. Global Soil Moisture Estimation by Assimilating AMSR-E Brightness Temperatures in a Coupled CLM4–RTM–DART System. J. Hydrometeorol. 2016, 17, 2431–2454. [Google Scholar] [CrossRef]
  11. Marcos, E.; Fernández-García, V.; Fernández-Manso, A.; Quintano, C.; Valbuena, L.; Tárrega, R.; Luis-Calabuig, E.; Calvo, L. Evaluation of Composite Burn Index and Land Surface Temperature for Assessing Soil Burn Severity in Mediterranean Fire-Prone Pine Ecosystems. Forest 2018, 9, 494. [Google Scholar] [CrossRef] [Green Version]
  12. Maffei, C.; Alfieri, S.; Menenti, M. Relating Spatiotemporal Patterns of Forest Fires Burned Area and Duration to Diurnal Land Surface Temperature Anomalies. Remote Sens. 2018, 10, 1777. [Google Scholar] [CrossRef] [Green Version]
  13. Elvira, B.G.; Taylor, C.M.; Harris, P.P.; Ghent, D.; Veal, K.L.; Folwell, S.S. Global observational diagnosis of soil moisture control on the land surface energy balance. Geophys. Res. Lett. 2016, 43, 2623–2631. [Google Scholar] [CrossRef] [Green Version]
  14. Hain, C.; Anderson, M.C. Estimating morning change in land surface temperature from MODIS day/night observations: Applications for surface energy balance modeling. Geophys. Res. Lett. 2017, 44, 9723–9733. [Google Scholar] [CrossRef]
  15. Jung, H.-S.; Lee, K.-T.; Zo, I.-S. Calculation Algorithm of Upward Longwave Radiation Based on Surface Types. Asia Pac. J. Atmos. Sci. 2020, 56, 291–306. [Google Scholar] [CrossRef]
  16. Peng, J.; Ma, J.; Liu, Q.; Yanxu, L.; Hu, Y.; Li, Y.; Yue, Y. Spatial-temporal change of land surface temperature across 285 cities in China: An urban-rural contrast perspective. Sci. Total Environ. 2018, 635, 487–497. [Google Scholar] [CrossRef] [PubMed]
  17. Anastasios, P.; Theleia, M.; Constantinos, C. Quantifying the trends in land surface temperature and surface urban heat island intensity in mediterranean cities in view of smart urbanization. Urban Sci. 2018, 2, 16. [Google Scholar] [CrossRef] [Green Version]
  18. Zhou, D.; Xiao, J.; Bonafoni, S.; Thau, C.; Deilami, K.; Zhou, Y.; Frolking, S.; Yao, R.; Qiao, Z.; Sobrino, J.A. Satellite Remote Sensing of Surface Urban Heat Islands: Progress, Challenges, and Perspectives. Remote Sens. 2018, 11, 48. [Google Scholar] [CrossRef] [Green Version]
  19. Song, L.; Liu, S.; Kustas, W.P.; Nieto, H.; Sun, L.; Xu, Z.; Skaggs, T.H.; Yang, Y.; Ma, M.; Xu, T.; et al. Monitoring and validating spatially and temporally continuous daily evaporation and transpiration at river basin scale. Remote Sens. Environ. 2018, 219, 72–88. [Google Scholar] [CrossRef]
  20. Tomlinson, C.J.; Chapman, L.; Thornes, J.E.; Baker, C. Remote sensing land surface temperature for meteorology and climatology: A review. Meteorol. Appl. 2011, 18, 296–306. [Google Scholar] [CrossRef] [Green Version]
  21. Zhan, W.; Chen, Y.; Zhou, J.; Wang, J.; Liu, W.; Voogt, J.; Zhu, X.; Quan, J.; Li, J. Disaggregation of remotely sensed land surface temperature: Literature survey, taxonomy, issues, and caveats. Remote Sens. Environ. 2013, 131, 119–139. [Google Scholar] [CrossRef]
  22. Weng, Q.; Fu, P.; Gao, F. Generating daily land surface temperature at Landsat resolution by fusing Landsat and MODIS data. Remote Sens. Environ. 2014, 145, 55–67. [Google Scholar] [CrossRef]
  23. Li, Z.-L.; Tang, B.-H.; Wu, H.; Ren, H.; Yan, G.; Wan, Z.; Trigo, I.F.; Sobrino, J.A. Satellite-derived land surface temperature: Current status and perspectives. Remote Sens. Environ. 2013, 131, 14–37. [Google Scholar] [CrossRef] [Green Version]
  24. Sattari, F.; Hashim, M. A brief review of land surface temperature retrieval methods from thermal satellite sensors. Middle East J. Sci. Res. 2014, 22, 757–768. [Google Scholar]
  25. Becker, F.; Li, Z.-L. Temperature-independent spectral indices in thermal infrared bands. Remote Sens. Environ. 1990, 32, 17–33. [Google Scholar] [CrossRef]
  26. Sobrino, J.A.; Li, Z.-L.; Stoll, M.; Becker, F. Improvements in the split-window technique for land surface temperature determination. IEEE Trans. Geosci. Remote Sens. 1994, 32, 243–253. [Google Scholar] [CrossRef]
  27. Wan, Z.; Dozier, J. A Generalized Split-Window Algorithm for Retrieving Land-Surface Temperature Measurement from Space. IEEE Trans. Geosci Remote Sens. 1996, 34, 892–905. [Google Scholar]
  28. Gillespie, A.; Rokugawa, S.; Matsunaga, T.; Cothern, J.; Hook, S.; Kahle, A. A temperature and emissivity separation algorithm for Advanced Spaceborne Thermal Emission and Reflection Radiometer (ASTER) images. IEEE Trans. Geosci. Remote Sens. 1998, 36, 1113–1126. [Google Scholar] [CrossRef]
  29. Yu, Y.; Privette, J.L.; Pinheiro, A. Analysis of the NPOESS VIIRS land surface temperature algorithm using MODIS data. IEEE Trans. Geosci. Remote Sens. 2005, 43, 2340–2350. [Google Scholar] [CrossRef]
  30. Justice, C.O.; Román, M.O.; Csiszar, I.; Vermote, E.F.; Wolfe, R.E.; Hook, S.J.; Friedl, M.; Wang, Z.; Schaaf, C.; Miura, T.; et al. Land and cryosphere products from Suomi NPP VIIRS: Overview and status. J. Geophys. Res. Atmos. 2013, 118, 9753–9765. [Google Scholar] [CrossRef] [Green Version]
  31. Yu, X.; Guo, X.; Wu, Z. Land Surface Temperature Retrieval from Landsat 8 TIRS—Comparison between Radiative Transfer Equation-Based Method, Split Window Algorithm and Single Channel Method. Remote Sens. 2014, 6, 9829–9852. [Google Scholar] [CrossRef] [Green Version]
  32. Wan, Z. New refinements and validation of the collection-6 MODIS land-surface temperature/emissivity product. Remote Sens. Environ. 2014, 140, 36–45. [Google Scholar] [CrossRef]
  33. Sun, D. Estimation of land surface temperature from a Geostationary Operational Environmental Satellite (GOES-8). J. Geophys. Res. Space Phys. 2003, 108, 4326. [Google Scholar] [CrossRef]
  34. Sobrino, J.A.; Romaguera, M. Land surface temperature retrieval from MSG1-SEVIRI data. Remote Sens. Environ. 2004, 92, 247–254. [Google Scholar] [CrossRef]
  35. Hong, K.-O.; Suh, M.-S.; Kang, J.-H. Development of a land surface temperature-retrieval algorithm from MTSAT-1R data. Asia Pac. J. Atmos. Sci. 2009, 45, 411–421. [Google Scholar]
  36. Cho, A.-R.; Suh, M.-S. Evaluation of Land Surface Temperature Operationally Retrieved from Korean Geostationary Satellite (COMS) Data. Remote Sens. 2013, 5, 3951–3970. [Google Scholar] [CrossRef] [Green Version]
  37. Göttsche, F.; Olesen, F.-S.; Trigo, I.F.; Bork-Unkelbach, A.; Martin, M. Long Term Validation of Land Surface Temperature Retrieved from MSG/SEVIRI with Continuous in-Situ Measurements in Africa. Remote Sens. 2016, 8, 410. [Google Scholar] [CrossRef] [Green Version]
  38. Li, Z.-L.; Becker, F. Feasibility of land surface temperature and emissivity determination from AVHRR data. Remote Sens. Environ. 1993, 43, 67–85. [Google Scholar] [CrossRef]
  39. Ottlé, C.; Stoll, M. Effect of atmospheric absorption and surface emissivity on the determination of land surface temperature from infrared satellite data. Int. J. Remote Sens. 1993, 14, 2025–2037. [Google Scholar] [CrossRef]
  40. Prata, A.J.; Caselles, V.; Coll, C.; Sobrino, J.A.; Ottlé, C. Thermal remote sensing of land surface temperature from satellites: Current status and future prospects. Remote Sens. Rev. 1995, 12, 175–224. [Google Scholar] [CrossRef]
  41. Jiménez-Muñoz, J.C.; Sobrino, J.A. A generalized single-channel method for retrieving land surface temperature from remote sensing data. J. Geophys. Res. Space Phys. 2003, 108, D22. [Google Scholar] [CrossRef] [Green Version]
  42. Prata, A.J. Land surface temperatures derived from the advanced very high resolution radiometer and the along-track scanning radiometer: 1. Theory. J. Geophys. Res. Space Phys. 1993, 98, 16689–16702. [Google Scholar] [CrossRef]
  43. Sobrino, J.A.; Li, Z.-L.; Stoll, M.P.; Becker, F. Multi-channel and multi-angle algorithms for estimating sea and land surface temperature with ATSR data. Int. J. Remote Sens. 1996, 17, 2089–2114. [Google Scholar] [CrossRef]
  44. Snyder, W.C.; Wan, Z.; Zhang, Y.; Feng, Y.-Z. Classification-based emissivity for land surface temperature measurement from space. Int. J. Remote Sens. 1998, 19, 2753–2774. [Google Scholar] [CrossRef]
  45. Peres, L.F.; Dacamara, C.C. Emissivity maps to retrieve land-surface temperature from MSG/SEVIRI. IEEE Trans. Geosci. Remote Sens. 2005, 43, 1834–1844. [Google Scholar] [CrossRef]
  46. Valor, E. Mapping land surface emissivity from NDVI: Application to European, African, and South American areas. Remote Sens. Environ. 1996, 57, 167–184. [Google Scholar] [CrossRef]
  47. Sobrino, J.A.; Raissouni, N. Toward remote sensing methods for land cover dynamic monitoring: Application to Morocco. Int. J. Remote Sens. 2000, 21, 353–366. [Google Scholar] [CrossRef]
  48. Jiang, G.-M.; Li, Z.-L.; Nerry, F. Land surface emissivity retrieval from combined mid-infrared and thermal infrared data of MSG-SEVIRI. Remote Sens. Environ. 2006, 105, 326–340. [Google Scholar] [CrossRef]
  49. Watson, K. Two-temperature method for measuring emissivity. Remote Sens. Environ. 1992, 42, 117–121. [Google Scholar] [CrossRef]
  50. Peres, L.F.; Dacamara, C.C.; Trigo, I.F.; Freitas, S.C. Synergistic use of the two-temperature and split-window methods for land-surface temperature retrieval. Int. J. Remote Sens. 2010, 31, 4387–4409. [Google Scholar] [CrossRef]
  51. Gillespie, A.R.; Abbott, E.A.; Gilson, L.; Hulley, G.; Jiménez-Muñoz, J.C.; Sobrino, J.A. Residual errors in ASTER temperature and emissivity standard products AST08 and AST05. Remote Sens. Environ. 2011, 115, 3681–3694. [Google Scholar] [CrossRef]
  52. Zhou, S.; Cheng, J. An Improved Temperature and Emissivity Separation Algorithm for the Advanced Himawari Imager. IEEE Trans. Geosci. Remote Sens. 2020, 1–20. [Google Scholar] [CrossRef]
  53. Xu, H.; Yu, Y.; Tarpley, D.; Göttsche, F.; Olesen, F.-S. Evaluation of GOES-R Land Surface Temperature Algorithm Using SEVIRI Satellite Retrievals With In Situ Measurements. IEEE Trans. Geosci. Remote Sens. 2013, 52, 3812–3822. [Google Scholar] [CrossRef]
  54. Yu, Y.; Liu, Y.; Yu, P.; Wang, H. Enterprise Algorithm Theoretical Basis Document for Viirs Land Surface Temperature Production; Version 1.2; NOAA: College Park, MD, USA, 2019. Available online: https://www.star.nesdis.noaa.gov/jpss/documents/ATBD/ATBD_EPS_Land_LST_v1.2.pdf (accessed on 29 June 2020).
  55. Yamamoto, Y.; Ishikawa, H.; Oku, Y.; Hu, Z. An Algorithm for Land Surface Temperature Retrieval Using Three Thermal Infrared Bands of Himawari-8. J. Meteorol. Soc. Jpn. 2018, 96, 59–76. [Google Scholar] [CrossRef] [Green Version]
  56. Bessho, K.; Date, K.; Hayashi, M.; Ikeda, A.; Imai, T.; Inoue, H.; Kumagai, Y.; Miyakawa, T.; Murata, H.; Ohno, T.; et al. An Introduction to Himawari-8/9—Japan’s new-generation geostationary meteorological satellites. J. Meteorol. Soc. Jpn. 2016, 94, 151–183. [Google Scholar] [CrossRef] [Green Version]
  57. Schmit, T.J.; Griffith, P.; Gunshor, M.M.; Daniels, J.; Goodman, S.J.; Lebair, W.J. A Closer Look at the ABI on the GOES-R Series. Bull. Am. Meteorol. Soc. 2017, 98, 681–698. [Google Scholar] [CrossRef]
  58. Chung, S.-R.; Ahn, M.-H.; Han, K.-S.; Lee, K.-T.; Shin, D.-B. Meteorological Products of Geo-KOMPSAT 2A (GK2A) Satellite. Asia Pac. J. Atmos. Sci. 2020, 56, 185. [Google Scholar] [CrossRef] [Green Version]
  59. Stuhlmann, R.; Rodriguez, A.; Tjemkes, S.; Grandell, J.; Arriaga, A.; Bezy, J.-L.; Aminou, D.; Bensi, P. Plans for EUMETSAT’s Third Generation Meteosat geostationary satellite programme. Adv. Space Res. 2005, 36, 975–981. [Google Scholar] [CrossRef]
  60. Choi, Y.-Y.; Suh, M.-S. Development of Himawari-8/Advanced Himawari Imager (AHI) land surface temperature retrieval algorithm. Remote Sens. 2018, 10, 2013. [Google Scholar] [CrossRef] [Green Version]
  61. NMSC. Available online: http://nmsc.kma.go.kr/enhome/html/bbs/selectNews.do?bbsCd=00237&bbsUsq=200676 (accessed on 29 June 2020).
  62. Lee, B.-I.; Chung, S.-R.; Baek, S. Development of cloud detection algorithm for GK-2A/AMI. In Proceedings of the 7th Asia-Oceania/2nd AMS-Asia/2nd KMA Meteorological Satellite User’s Conference, Songdo City, Korea, 24–27 October 2016; Available online: https://nmsc.kma.go.kr/enhome/html/conference/selectCfrItem.do?cfrUsq=142&cpnUsq=121&cpnDivCd=03 (accessed on 29 June 2020).
  63. Seong, N.-H.; Jung, D.; Kim, J.; Han, K.-S. Evaluation of NDVI Estimation Considering Atmospheric and BRDF Correction through Himawari-8/AHI. Asia Pac. J. Atmos. Sci. 2020, 56, 265–274. [Google Scholar] [CrossRef] [Green Version]
  64. Ijima, O. Basic and Other Measurements of Radiation at Station Tateno (2019-07); Aerological Observatory, Japan Meteorological Agency, PANGAEA: Tokyo, Japan, 2019; Available online: https://doi.pangaea.de/10.1594/PANGAEA.906163 (accessed on 29 June 2020).
  65. Ijima, O. Basic and Other Measurements of Radiation at Station Tateno (2019-08); Aerological Observatory, Japan Meteorological Agency, PANGAEA: Tokyo, Japan, 2019; Available online: https://doi.pangaea.de/10.1594/PANGAEA.908094 (accessed on 29 June 2020).
  66. Ijima, O. Basic and Other Measurements of Radiation at Station Tateno (2019-09); Aerological Observatory, Japan Meteorological Agency, PANGAEA: Tokyo, Japan, 2019; Available online: https://doi.pangaea.de/10.1594/PANGAEA.909250 (accessed on 29 June 2020).
  67. Ijima, O. Basic and Other Measurements of Radiation at Station Tateno (2019-10); Aerological Observatory, Japan Meteorological Agency, PANGAEA: Tokyo, Japan, 2019; Available online: https://doi.pangaea.de/10.1594/PANGAEA.910611 (accessed on 29 June 2020).
  68. Caselles, E.; Valor, E.; Abad, F.; Caselles, V. Automatic classification-based generation of thermal infrared land surface emissivity maps using AATSR data over Europe. Remote Sens. Environ. 2012, 124, 321–333. [Google Scholar] [CrossRef] [Green Version]
  69. Carlson, T.N.; Ripley, D.A. On the relation between NDVI, fractional vegetation cover, and leaf area index. Remote Sens. Environ. 1997, 62, 241–252. [Google Scholar] [CrossRef]
  70. Lin, J.; Feng, X.; Xiao, P.; Li, H.; Wang, J.; Li, Y. Comparison of Snow Indexes in Estimating Snow Cover Fraction in a Mountainous Area in Northwestern China. IEEE Geosci. Remote Sens. Lett. 2012, 9, 725–729. [Google Scholar] [CrossRef]
  71. Park, K.-A.; Woo, H.-J.; Chung, S.-R.; Cheong, S.-H. Development of Sea Surface Temperature Retrieval Algorithms for Geostationary Satellite Data (Himawari-8/AHI). Asia Pac. J. Atmos. Sci. 2020, 56, 1–20. [Google Scholar] [CrossRef]
  72. Korea Meteorological Administration Web Site. Available online: https://data.kma.go.kr/cmmn/main.do (accessed on 10 September 2020).
  73. Korea Hydrographic and Oceanographic Agency Web Site. Available online: http://www.khoa.go.kr/oceangrid/khoa/koofs.do (accessed on 10 September 2020).
  74. Borbas, E.; Seemann, S.W.; Huang, H.-L.; Li, J.; Menzel, W.P. Global profile training database for satellite regression retrievals with estimates of skin temperature and emissivity. In Proceedings of the 14th International ATOVS Study Conference, Beijing, China, 25–31 May 2005; pp. 763–770. [Google Scholar]
  75. Wan, Z. MODIS Land-Surface Temperature Algorithm Theoretical Basis Document (LST ATBD). Available online: https://modis.gsfc.nasa.gov/data/atbd/atbd_mod11.pdf (accessed on 29 June 2020).
  76. Yu, Y.; Tarpley, D.; Privette, J.L.; Goldberg, M.; Raja, M.R.V.; Vinnikov, K.; Xu, H. Developing Algorithm for Operational GOES-R Land Surface Temperature Product. IEEE Trans. Geosci. Remote Sens. 2008, 47, 936–951. [Google Scholar] [CrossRef] [Green Version]
  77. Coll, C.; Caselles, V. A split-window algorithm for land surface temperature from advanced very high resolution radiometer data: Validation and algorithm comparison. J. Geophys. Res. Space Phys. 1997, 102, 16697–16713. [Google Scholar] [CrossRef]
  78. Ren, H.; Yan, G.; Chen, L.; Li, Z. Angular effect of MODIS emissivity products and its application to the split-window algorithm. ISPRS J. Photogramm. Remote Sens. 2011, 66, 498–507. [Google Scholar] [CrossRef]
  79. García-Santos, V.; Coll, C.; Valor, E.; Niclòs, R.; Caselles, V. Analyzing the anisotropy of thermal infrared emissivity over arid regions using a new MODIS land surface temperature and emissivity product (MOD21). Remote Sens. Environ. 2015, 169, 212–221. [Google Scholar] [CrossRef] [Green Version]
  80. Lu, L.; Zhang, T.; Wang, T.; Zhou, X. Evaluation of Collection-6 MODIS Land Surface Temperature Product Using Multi-Year Ground Measurements in an Arid Area of Northwest China. Remote Sens. 2018, 10, 1852. [Google Scholar] [CrossRef] [Green Version]
  81. Duan, S.-B.; Li, Z.-L.; Li, H.; Göttsche, F.; Wu, H.; Zhao, W.; Leng, P.; Zhang, X.; Coll, C. Validation of Collection 6 MODIS land surface temperature product using in situ measurements. Remote Sens. Environ. 2019, 225, 16–29. [Google Scholar] [CrossRef] [Green Version]
  82. François, C.; Ottlé, C. Atmospheric corrections in the thermal infrared: Global and water vapor dependent split-window algorithms-applications to ATSR and AVHRR data. IEEE Trans. Geosci. Remote Sens. 1996, 34, 457–470. [Google Scholar] [CrossRef]
  83. Atitar, M.; Sobrino, J.A. A split-window algorithm for estimating LST from Meteosat 9 data: Test and comparison with data and MODIS LSTs. IEEE Geosci. Remote Sens. Lett. 2008, 6, 122–126. [Google Scholar] [CrossRef]
  84. Martin, M.; Ghent, D.; Pires, A.; Göttsche, F.; Cermak, J.; Remedios, J.J. Comprehensive in situ validation of five satellite land surface temperature data sets over multiple stations and years. Remote Sens. 2019, 11, 479. [Google Scholar] [CrossRef] [Green Version]
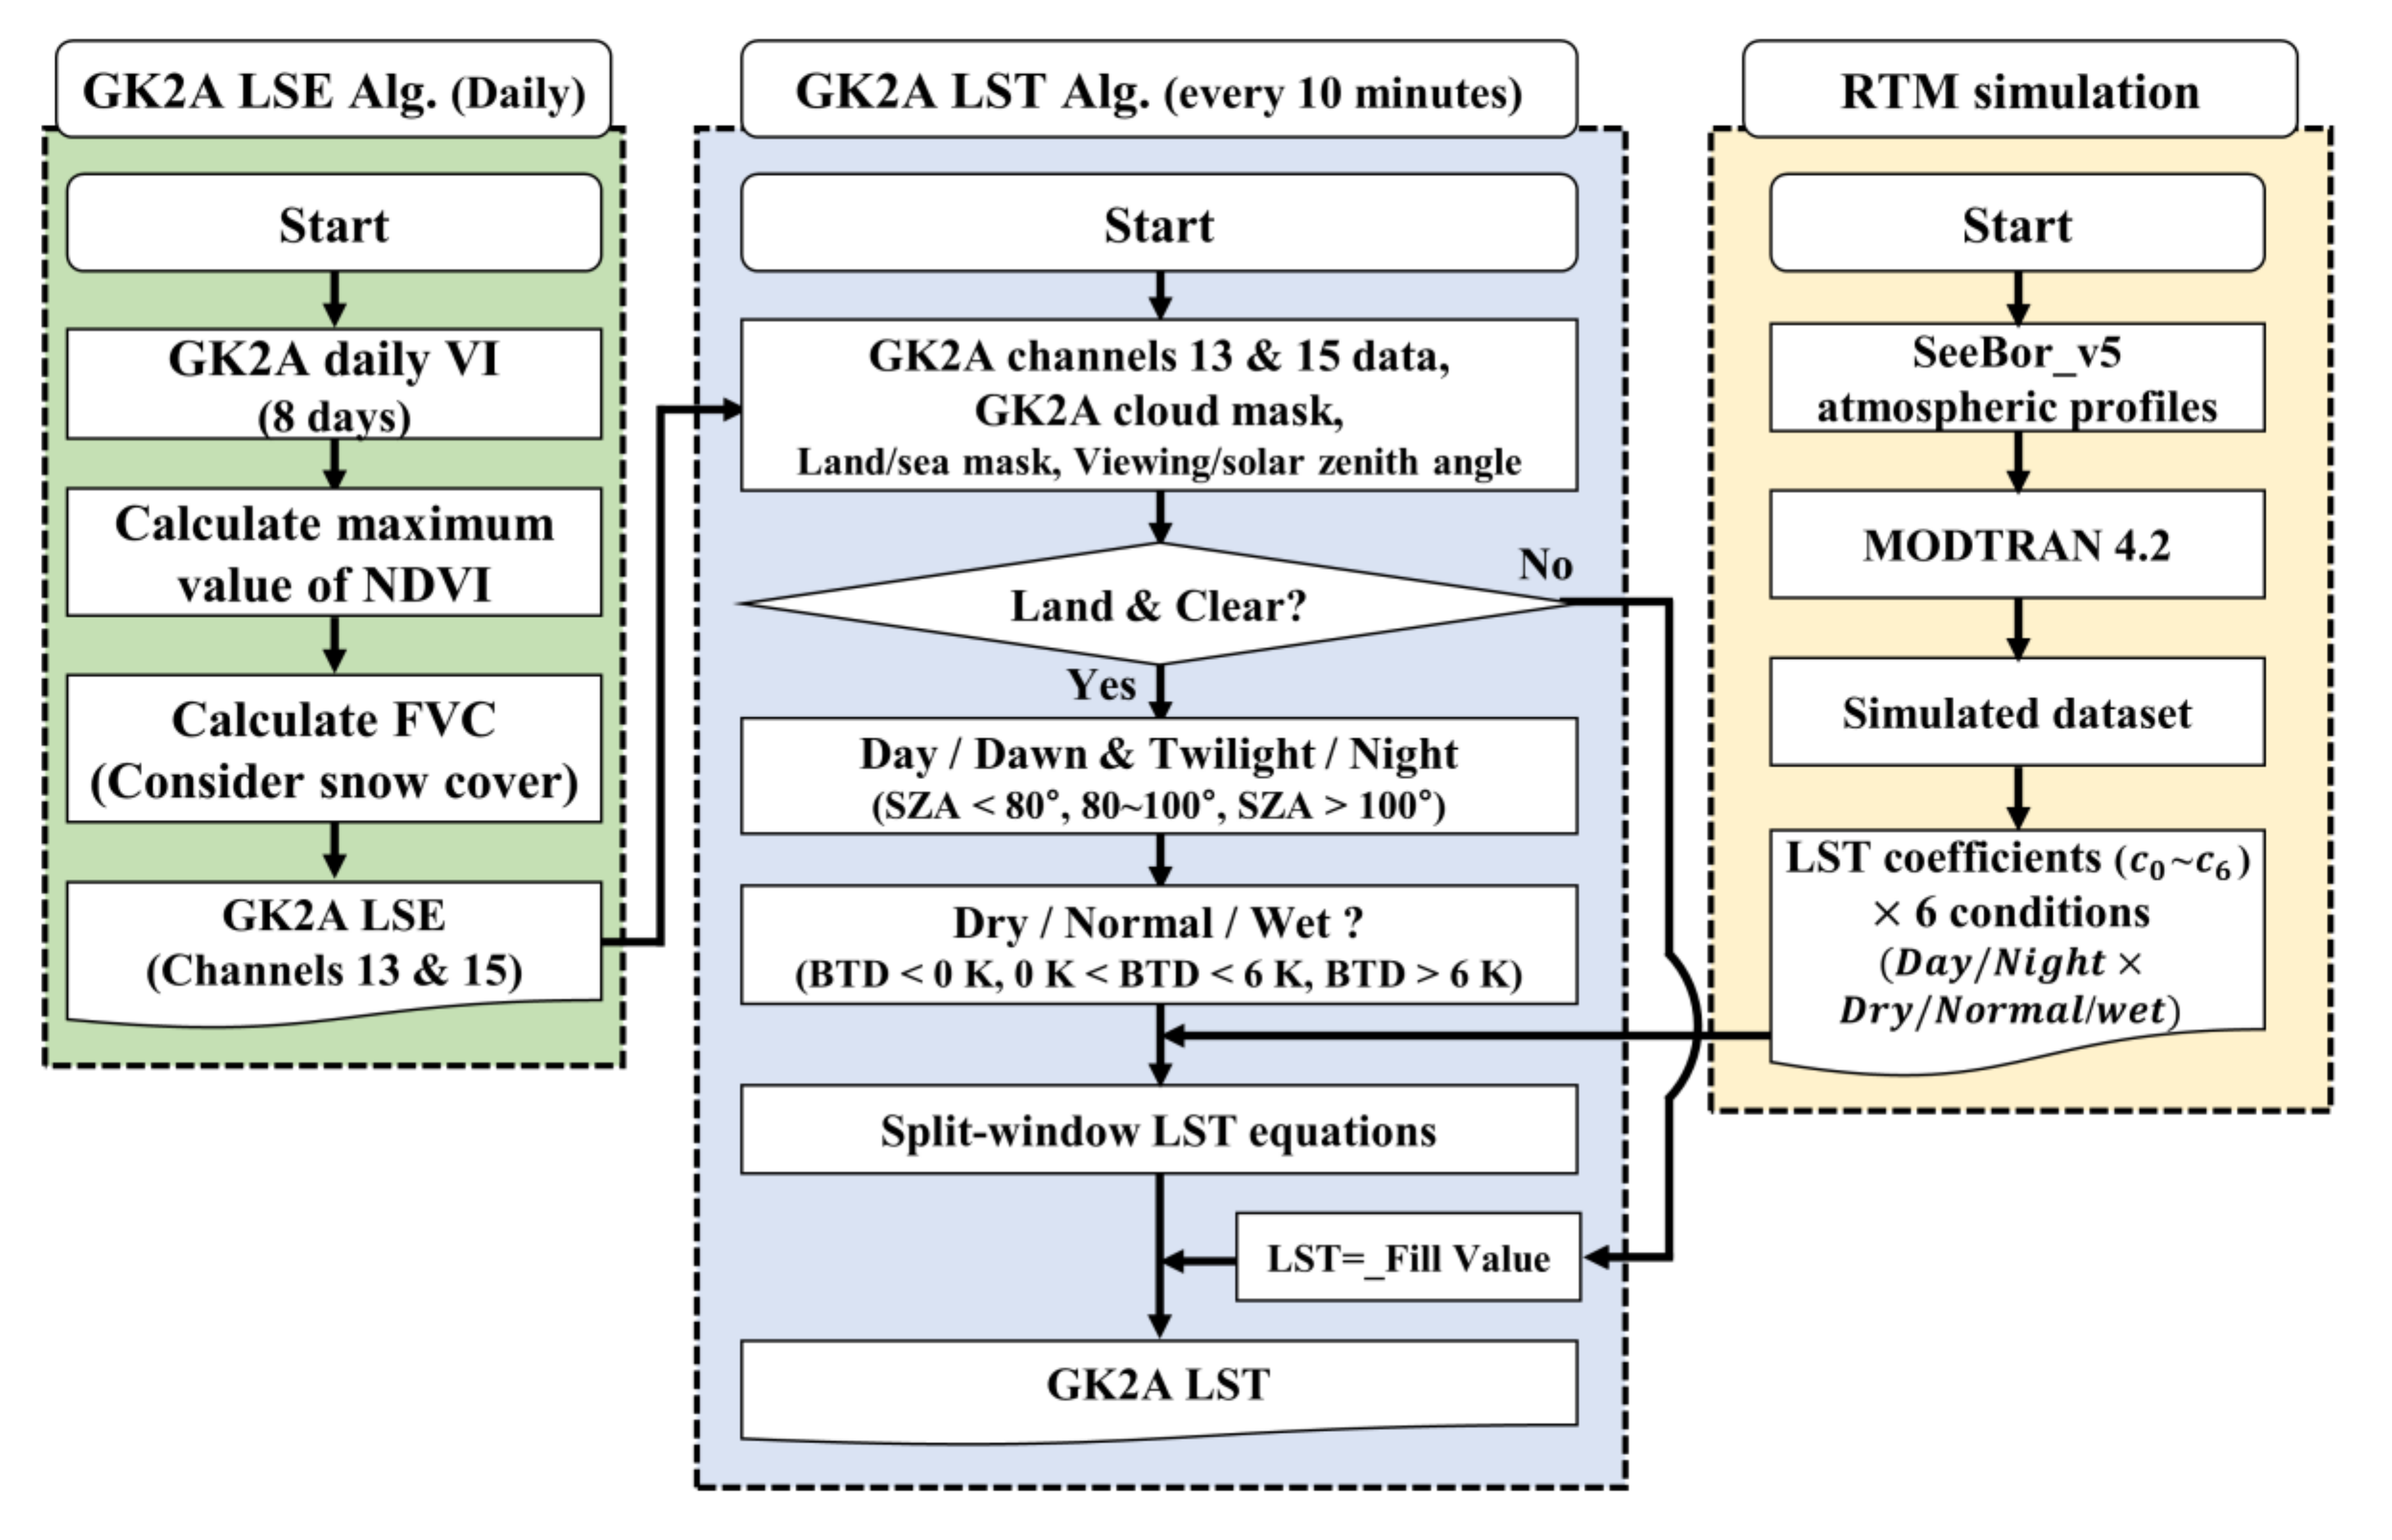
Figure 1. Flow chart of GK2A’s land surface temperature retrieval process.
Remotesensing 12 03050 g001
Figure 2. Conceptual atmospheric vertical profiles according to diurnal variation of land surface temperature (LST) and air temperature (bold red line: SeeBor profile; other lines: diurnal variation of air temperature profiles).
Remotesensing 12 03050 g002
Figure 3. Distribution of brightness temperature difference between channel 13 and channel 15 of GK2A for selected days (25 July 2019; 25 August 2019; 22 September 2019; and 4 October 2019).
Remotesensing 12 03050 g003
Figure 4. Distribution of radiative transfer model simulated brightness temperature differences between channel 13 and channel 15 of GK2A (green histogram) and their root mean square error (RMSE) values (blue line).
Remotesensing 12 03050 g004
Figure 5. (a) Scatter plot (left) and (b) bias distribution (right) between the reference LST and estimated LST values using the GK2A/AMI LST retrieval algorithm (gray dotted line in (a) represents the 1:1 line).
Remotesensing 12 03050 g005
Figure 6. Distribution of RMSEs for the LST retrieval algorithms based on the different impacting factors: (a) brightness temperature difference (BTD) and surface lapse rate; (b) emissivity difference (∆ε) and BTD; (c) ∆ε and surface lapse rate; (d) satellite viewing zenith angle (VZA) and BTD; (e) VZA and surface lapse rate.
Remotesensing 12 03050 g006
Figure 7. Spatial distribution of (a) GK2A LST, (b) MODIS (MYD11_L2) LST, (c) differences between GK2A and MODIS LSTs, and (d) scatter plot between GK2A and MODIS (MYD11_L2) LSTs for 30 August 2019, 1700 and 1705 UTC (gray dotted line in (d) represents the 1:1 line).
Remotesensing 12 03050 g007
Figure 8. Spatial distribution of (a) GK2A LST, (b) MODIS (MOD11_L2) LST, (c) differences between the GK2A and MODIS LSTs, and (d) scatter plot between the GK2A and MODIS (MOD11_L2) LSTs for 30 August 2019, 0030 UTC (gray dotted line in (d) represents the 1:1 line).
Remotesensing 12 03050 g008
Figure 9. Spatial distribution of (a) GK2A LST, (b) MODIS (MOD11_L2) LST, (c) differences between GK2A and MODIS LSTs, and (d) scatter plot between GK2A and MODIS (MOD11_L2) LSTs for 21 September 2019, 1330 and 1335 UTC (gray dotted line in (d) represents the 1:1 line).
Remotesensing 12 03050 g009
Figure 10. Spatial distribution of (a) GK2A LST, (b) MODIS (MYD11_L2) LST, (c) differences between the GK2A and MODIS LSTs, and (d) scatter plot between the GK2A and MODIS (MYD11_L2) LSTs for 20 October 2019, 0540 UTC (gray dotted line in (d) represents the 1:1 line).
Remotesensing 12 03050 g010
Figure 11. Scatter plot between the GK2A LST and the LST at Tateno station from upward longwave radiation (red square symbol: daytime, blue cross symbol: nighttime, gray dotted line represents the 1:1 line).
Remotesensing 12 03050 g011
Figure 12. Scatter plots between reference LST and estimated LST from RTM simulation using two channels: (a) channels 13 and 15, and (b) channels 14 and 15.
Remotesensing 12 03050 g012
Figure 13. Scatter plot between the MODIS (MOD11_L2/MYD11_L2) LST and the LST at Tateno station from upward longwave radiation (red square symbol: daytime; blue cross symbol: nighttime; gray dotted line represents the 1:1 line).
Remotesensing 12 03050 g013
Table 1. The characteristics of GK2A/AMI data used in this study.
NameSpatial Resolution (km)Temporal
Resolution
Description
Channel 13210 minCenter wavelength: 10.3539 μm
Channel 15210 minCenter wavelength: 12.3651 μm
GK2A Cloud mask data210 minDistinguish clear and cloud pixel
GK2A Land surface emissivity of Ch. 1321 dayInput data of GK2A LST
GK2A Land surface emissivity of Ch. 1521 dayInput data of GK2A LST
Table 2. The input conditions of the radiative transfer model simulation according to the various atmospheric and surface conditions.
Impacting FactorsDetailed Conditions
Atmospheric profiles2694 SeeBor version 5 database
(Viewing zenith angle is lesser than 50°)
Land surface temperatureDay: Ta − 2 K~Ta + 18 K (a step of 2 K)
Night: Ta − 6 K~Ta + 2 K (a step of 2 K)
Diurnal variation of air temperature
1013 hPa (= Ta)
986 hPa
958 hPa
931 hPa
904 hPa
ΔT = LST – Ta
T(1013)’ = T(1013) + 1/2 ΔT
T(986)’ = T(986) + 1/3 ΔT
T(958)’ = T(958) + 1/6 ΔT
T(931)’ = T(931) + 1/12 ΔT
T(904)’ = T(904) + 1/24 ΔT
Land surface emissivity ε c h 13 : 0.9400~0.9900 (a step of 0.005, 11 steps)
−0.02 Δ ε 0.01 (a step of 0.003, 11 steps)
if ( ε c h 15 ) > 1, ε c h 15 = 0.9999
Table 3. The coefficients of the GK2A/AMI equation (Equation (1)) according to the day/night and dry/normal/wet conditions.
Conditions c 0 c 1 c 2 c 3 c 4 c 5 c 6
DayDry−3.75351.01460.4355−0.75140.527046.4021−76.7542
Normal−2.57941.00940.54820.11481.089057.0411−71.3507
Wet44.80580.81363.3273−0.06642.727162.8262−74.7224
NightDry2.44180.99200.7575−0.33110.010645.8389−75.3720
Normal−4.80961.01810.29860.15731.066850.1998−49.2833
Wet21.15560.89733.5049−0.12191.796551.9677−52.6384
Table 4. Comparison results of the GK2A LST data and the MODIS LST product (Collection 6) for the selected four months (July, August, September, and October 2019).
MonthMOD11_L2MYD11_L2
# of Pixel ( × 1000 ) Corr.Bias (K)RMSE (K)# of Pixel ( × 1000 ) Corr.Bias (K)RMSE (K)
2019.0722,4120.9611.0512.13920,4850.9651.1822.236
2019.0870220.9601.0492.04572790.9741.1172.129
2019.0921,2620.9581.4062.48418,1200.9771.1632.257
2019.1010,5770.9801.5982.60193970.9881.2602.237
Total and Ave.61,2750.9631.2692.32855,2820.9741.1802.229
# of pixel: 116,557,577, Corr. = 0.969, bias = 1.227 K, RMSE = 2.281 K.
Table 5. Comparison results of the GK2A LST data and the MODIS LST data (Collection 6) for the selected four months, according to the daytime and nighttime (July, August, September, and October 2019).
MonthDaytimeNighttime
# of Pixel ( × 1000 ) Corr.Bias (K)RMSE (K)# of Pixel ( × 1000 ) Corr.Bias (K)RMSE (K)
2019.0718,9050.9481.8902.98123,9920.9760.5021.559
2019.086,9690.9531.8892.8397,3320.9810.3181.375
2019.0918,0760.9462.3403.48621,3060.9850.4071.441
2019.109,5950.9782.2693.41910,3780.9900.6711.515
Total and Ave.53,5470.9532.1103.21163,0100.9820.4761.490
# of pixel: 116,557,577, Corr. = 0.969, bias = 1.227 K, RMSE = 2.281 K.
Table 6. Comparison results of the GK2A LST data and the MODIS LST product (Collection 6) using a linear algorithm and non-linear algorithm according to the daytime and nighttime in September 2019.
AlgorithmDaytimeNighttime
# of Pixel ( × 1000 ) Corr.bias (K)RMSE (K)# of Pixel ( × 1000 ) Corr.bias (K)RMSE (K)
Linear18,0760.9442.5043.69121,3060.9850.4131.670
Non-linear18,0760.9462.3403.48621,3060.9850.4071.441