Article

Coral Reef Monitoring by Scuba Divers Using Underwater Photogrammetry and Geodetic Surveying

1
LIS UMR 7020, Aix-Marseille Université, CNRS, ENSAM, Université De Toulon, Domaine Universitaire de Saint-Jérôme, Bâtiment Polytech, Avenue Escadrille Normandie-Niemen, 13397 Marseille, France
2
3DOM—3D Optical Metrology Unit, FBK—Bruno Kessler foundation, 38123 Trento, Italy
3
Institute of Theoretical Physics, ETH Zurich, 8093 Zurich, Switzerland
4
Microsoft Corporation, Redmond, WA 98052, USA
5
DIEF Department, University of Modena and Reggio Emilia, 41125 Modena, Italy
6
Coastal Research Center, Marine Science Institute, University of California, Santa Barbara, CA 93106, USA
7
Coastal Research Center, Department of Ecology, Evolution and Marine Biology, University of California, Santa Barbara, CA 93106, USA
*
Author to whom correspondence should be addressed.
Remote Sens. 2020, 12(18), 3036; https://doi.org/10.3390/rs12183036
Submission received: 31 July 2020 / Revised: 28 August 2020 / Accepted: 11 September 2020 / Published: 17 September 2020
(This article belongs to the Special Issue Underwater 3D Recording & Modelling)

Abstract

:
Underwater photogrammetry is increasingly being used by marine ecologists because of its ability to produce accurate, spatially detailed, non-destructive measurements of benthic communities, coupled with affordability and ease of use. However, independent quality control, rigorous imaging system set-up, optimal geometry design and a strict modeling of the imaging process are essential to achieving a high degree of measurable accuracy and resolution. If a proper photogrammetric approach that enables the formal description of the propagation of measurement error and modeling uncertainties is not undertaken, statements regarding the statistical significance of the results are limited. In this paper, we tackle these critical topics, based on the experience gained in the Moorea Island Digital Ecosystem Avatar (IDEA) project, where we have developed a rigorous underwater photogrammetric pipeline for coral reef monitoring and change detection. Here, we discuss the need for a permanent, underwater geodetic network, which serves to define a temporally stable reference datum and a check for the time series of photogrammetrically derived three-dimensional (3D) models of the reef structure. We present a methodology to evaluate the suitability of several underwater camera systems for photogrammetric and multi-temporal monitoring purposes and stress the importance of camera network geometry to minimize the deformations of photogrammetrically derived 3D reef models. Finally, we incorporate the measurement and modeling uncertainties of the full photogrammetric process into a simple and flexible framework for detecting statistically significant changes among a time series of models.

Graphical Abstract

1. Introduction

Underwater photogrammetry has increasingly become a popular technique for three-dimensional (3D) mapping of subaquatic environments at different spatial scales and resolution. In underwater scenarios, several application domains can be identified, such as deep-sea exploration [1]), archeology [2], marine ecology [3,4,5] and sub-sea metrology [6], each of them with specific requirements and constraints. In marine ecology, photogrammetry acts as a game changer, allowing ecologists to obtain non-invasive, objective measurements of the underwater habitat structure and complexity, crucial in understanding the health and temporal changes of benthic communities. Numerous examples in the literature describe research and experiments that have utilized photogrammetry carried out by scuba divers [7,8,9], as well as by remotely operated or autonomous underwater vehicles [1]. Metric characterizations and monitoring of coral reefs have greatly benefitted from the growing availability of affordable and easy-to-use hardware and software tools [10]. This has permitted researchers to expand the range of studies and opened new research opportunities in marine ecology. However, because many systems are used in a black-box mode, there is the risk that the results obtained with photogrammetry may provide unreliable evidence if the technique itself is not properly implemented and quality control procedures are not properly executed.
Several studies have examined factors that influence photogrammetry in underwater environments. First, water turbidity may significantly affect the image quality and light absorption in water, thus influencing the colors present in images and leading to un-sharpness [11]. Reflections of the sunlight on the water surface may influence the image quality by producing a moving light pattern on the bottom, which varies from image to image. Other factors which may degrade image quality include motion blur caused by the scuba diver moving too quickly over the target substrate and the presence of floating vegetation on the water’s surface that blocks the sunlight and can cause color shifts. The presence of an underwater optical port (spherical, hemispherical or flat) in front of the lens alters the image formation geometry, introducing optical aberrations [12] and, in the case of flat ports, also introduces refractions/distortions, which translates into a departure from the classic photogrammetric mathematical model [13]. The establishment of highly accurate geodetic networks underwater to serve as known references is crucial for monitoring and change detection tasks, and still represents a demanding challenge underwater [14,15,16,17]. Recognizing the importance of assessing the precision and accuracy potential of photogrammetrically derived models, empirical approaches have been employed to characterize measurement errors [18], reliability over time [19] and accuracy [3] of natural and artificial coral reef models of different sizes and structural complexity.
This paper collects the experience gained in coral monitoring within the Moorea Island Digital Ecosystem Avatar (IDEA) project [20]. Based on preliminary studies [9,14] and expanding the results presented in [21], here, we critically revise and expand all the steps of the developed photogrammetric approach for coral reef temporal monitoring. In the authors’ knowledge, it is the first time that rigorous surveying methods are adopted in this domain. The critical need for accurate and stable reference points for assessing changes in the range of a few centimeters per year for environmental monitoring purposes is stressed, and a thorough analysis of several photographic systems for underwater photogrammetric monitoring of coral reefs is presented. Moreover, moving from previous studies by [22,23,24], we propose a simple and flexible framework to characterize the quality of the derived reef models and to assess the confidence or significance level of the changes detected through time. The method is founded on formal principles of surveying and error propagation theory and is implemented adopting state-of-the-art algorithmic solutions.
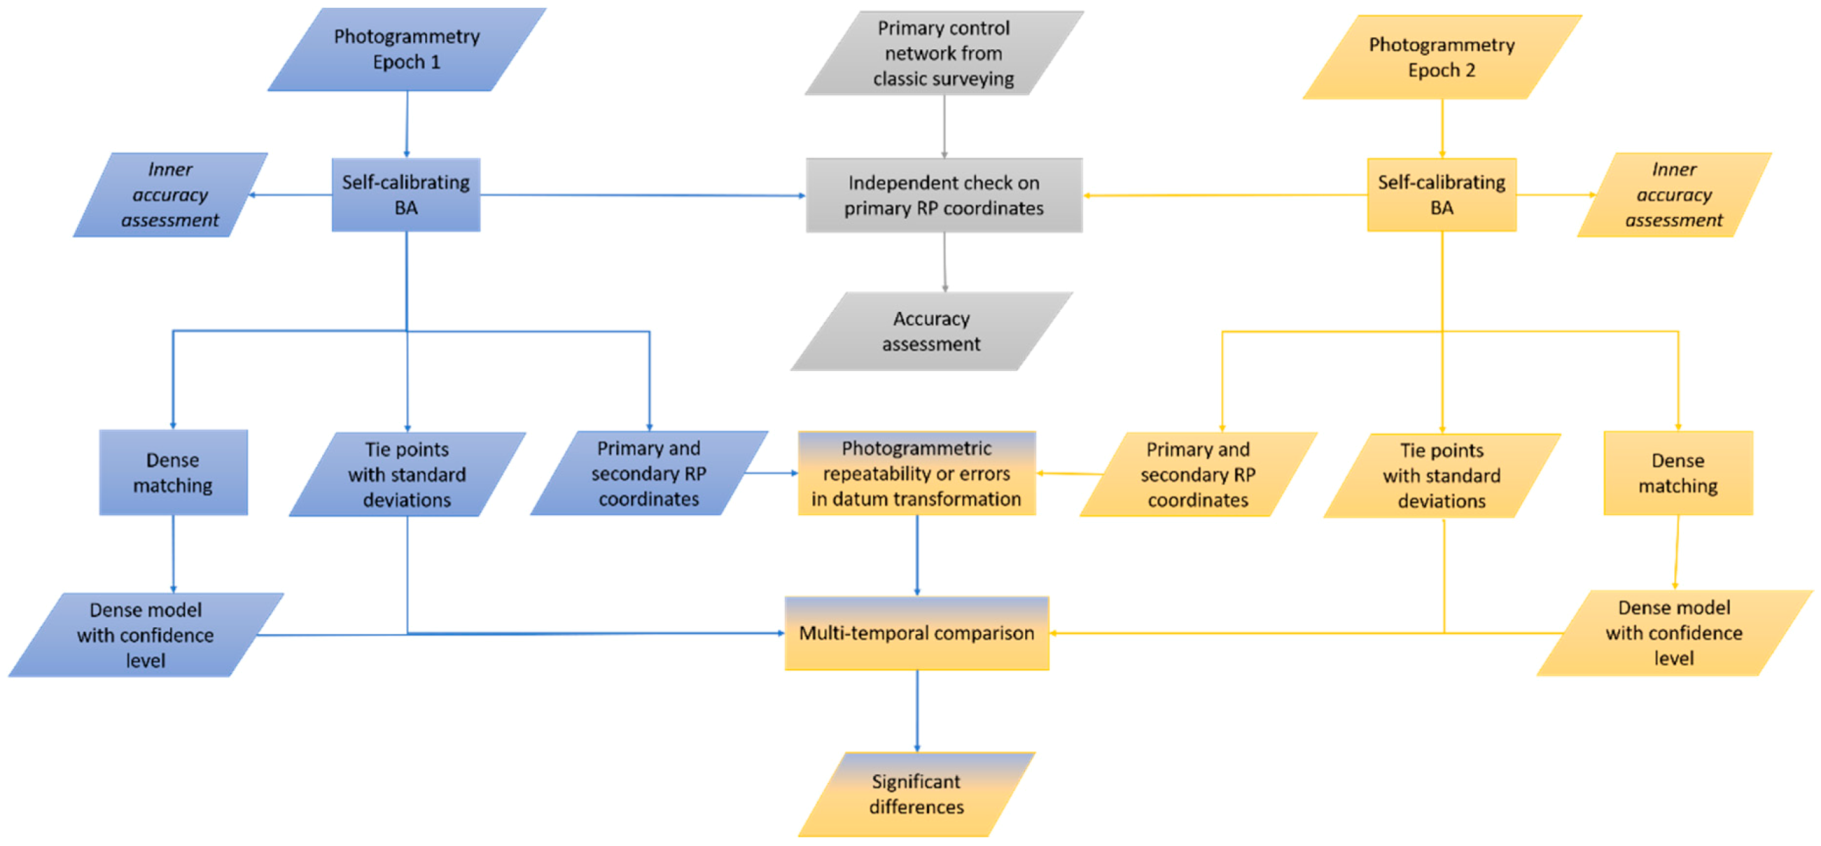
The paper is divided into four main sections, which cover the main steps of the implemented photogrammetric procedure described in Figure 1. Section 2 describes the Moorea IDEA project, its motivation and requirements, with an overview of the procedure developed for an accurate four-dimensional (4D) monitoring and change detection of Moorea coral reefs. Section 3 focuses on a comparative quantitative analysis of different underwater camera systems, with the aim of investigating the accuracy potential of high-quality off-the-shelf (i.e., digital single-lens reflex—DSLR and mirrorless interchangeable lens cameras—MIL cameras) as well as low-cost systems (action cameras). It also includes tests on color reproduction and the analysis of image quality underwater. The results from the photogrammetric bundle adjustment are also discussed. Section 4 delves into the critical topic of camera network to control the photogrammetric model deformation. Finally, the issue of surface model generation and comparison of 3D models for four-dimensional (4D) monitoring or change detection are addressed in Section 5. Although the last block, surface texturing and orthophoto generation, is still an integral part of our procedure, it is not of interest for the current investigation and therefore not further investigated here.

2. Four-Dimensional (4D) Monitoring and Change Detection of Moorea Coral Reefs

The current study is a component of the larger Moorea IDEA project, undertaken by an inter-disciplinary and international team of researchers, aiming at digitizing an entire island ecosystem at different scales, from island topography to microbes [25,26]. Within this broad context, underwater photogrammetry is carried out at different epochs to provide not only a digital representation of the underwater ecosystem, but also to add time as the fourth dimension to the classic 3D representation. The multi-temporal modeling approach constitutes the base to study how physical, chemical, biological, economic and social processes interact.
The IDEA project is linked to the Moorea Coral Reef Long-Term Ecological Research (MCR LTER) program, established by the US National Science Foundation in 2004 as a model system to better understand factors that mediate coral community structure and function. In particular, an essential objective of the MCR LTER program is to investigate the impacts of eternal drivers such as the influence of global environmental change on the viability of coral reefs. This objective is accomplished through long-term observations, process-based experimentation and bio-physical modeling efforts.
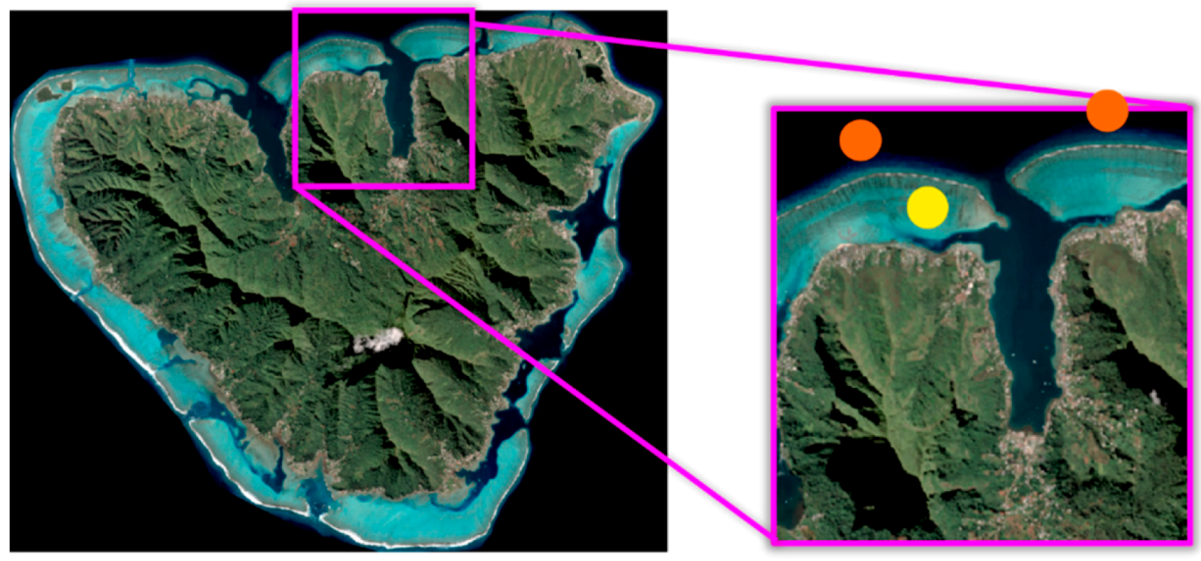
The MCR LTER project has established several permanent sampling locations around the island of Moorea in the three primary coral reef habitats, i.e., fringing reef, back reef and fore reef. The underwater photogrammetry monitoring project focuses on sites in the fore reef and fringing reef habitats only. Here, we report studies on plots of varying dimensions (ranging from 5 × 5 m to 16 × 8 m and 50 × 10 m) in the fringing reef and on the fore reef (Figure 2), at different depths, ranging from 3 m on the fringing reef up to 15 m on the fore reef.

Primary and Secondary Control Networks for Coral Reef Monitoring

Accurate reference networks are required for environmental change detection and monitoring. They are crucial when the variations to be measured are in the range of a few centimeters per year, typical of highly dynamic environments such as oceanic coral reefs, where 3D landscape elements are continuously changing over time. Corals may grow or shrink, sand can be deposited or dispersed and nonliving hard substrates can be eroded. Scuba divers (experts or tourists) and underwater vehicles may themselves cause changes to the reef architecture, for example dislodgement of coral or other substrates, while operating.
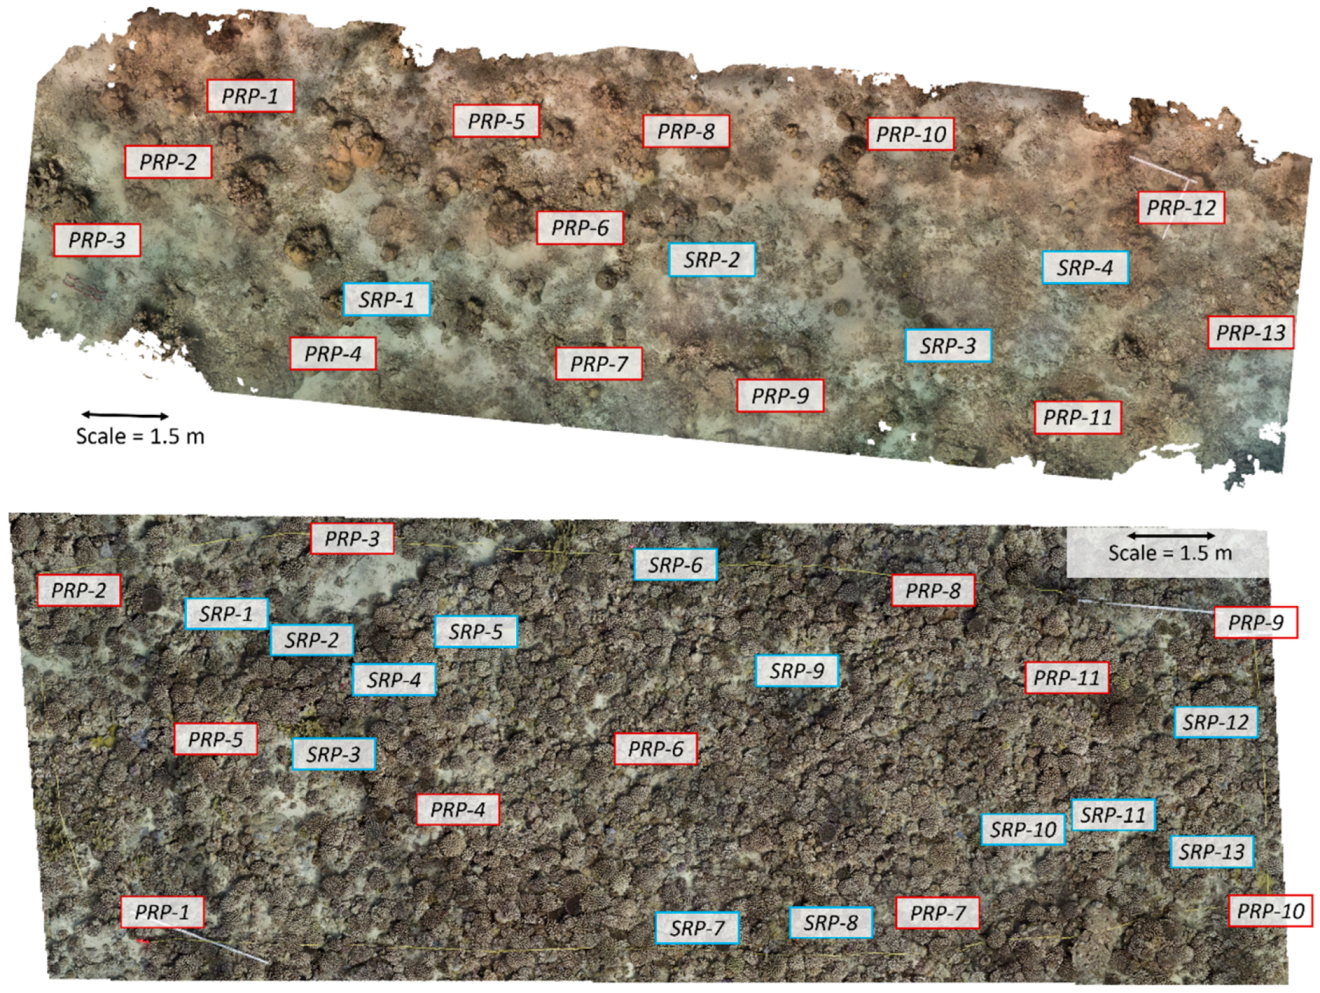
For the Moorea IDEA coral reef monitoring project, each plot is equipped with a permanent network of reference points, which serves the purpose of providing a datum or reference frame to the photogrammetric models measured over time. This permanent network consists of a primary and a secondary network. The points forming the primary control network (primary reference points, PRPs) are measured through classic geodetic techniques (trilateration and leveling). Their coordinates define the datum for the first photogrammetric epoch (or baseline epoch) and, also, provide an independent accuracy check. Conceptually, they should not be subject to change over time. The coordinates of the points belonging to the secondary network (secondary reference points, SRPs) are estimated in the baseline photogrammetric processing (first epoch) and, together with the photogrammetrically estimated primary reference points, are used to transform the successive photogrammetric models in a common reference system. Typically, in a plot of 25 m2, five primary and four secondary reference points are installed. The number and distributions of primary reference points are often not optimal from a surveying point of view but are dictated by measurement equipment and environmental constraints. Figure 3 shows two larger plots with more reference points. The required accuracy of the permanent reference network is quite high. To enable the measurement of temporal changes on the order of cm-range, the point accuracy (especially in height) should be a few mm.
The reference points, for both the primary and secondary control networks, consist of stainless-steel, threaded, expansion anchors inserted and cemented into the coral reef matrix to a vertical depth of approximately 40 mm to assure stability over time. Plastic bolts are normally placed into the anchors to prevent the growth of marine organisms from covering the reference points between photogrammetric measurement epochs. When measurements are performed, 9.5 mm diameter, 30 cm high stainless-steel poles are screwed into the anchors. The height of the poles is such that the visibility between the points is guaranteed, notwithstanding the reef topography. Special headers are mounted on top of the poles to perform point-to-point direct and reverse distances measurements using a metal tape with millimeter graduation. The headers are replaced with planar photogrammetric coded targets during the image acquisition step. The geometric levelling process requires a millimeter-scale graduated rod (also known as level staff) that is held vertically on the point anchors using a specifically designed adapter. An underwater green laser pointer is mounted onto a surveyor’s tripod equipped with a standard tribrach bubble level and an ad-hoc mounting head which allows the laser to be rotated around both the vertical and laser optical axes. The tripod is positioned halfway between two primary points, and for each point, on the same staff, two elevation readings are recorded with the laser rotated 180° around its axis between the two readings. The mean value is retained, thus removing any systematic angular offset between the laser optical axis and the mounting head. Further details on the design and fabrication of the specialized equipment can be found in [24].
Geodetic network adjustment can be performed following a minimal constraint [24] or free network solution approach. Here, we opt for the free network solution approach, which provides optimal results in terms of inner coordinate accuracy, minimizing the mean variance of point coordinates. The computational procedure follows three steps: (i) a first approximate solution is computed with minimal constraints [14], (ii) the free network solution is computed and (iii) a rigid 3D Helmert transformation is estimated between solutions (ii) and (i) to define a consistent datum. The raw observations, i.e., point-to-point direct and reverse distances and mean height readings, are first checked to detect outliers and then are input in the adjustment process. We used two software solutions, which provided statistically comparable results, Trinet+ [27] and GAMA V. 1.12 [28]. Some problems involved in underwater geodetic network establishment and their relation to photogrammetry are addressed in more detail in [14].
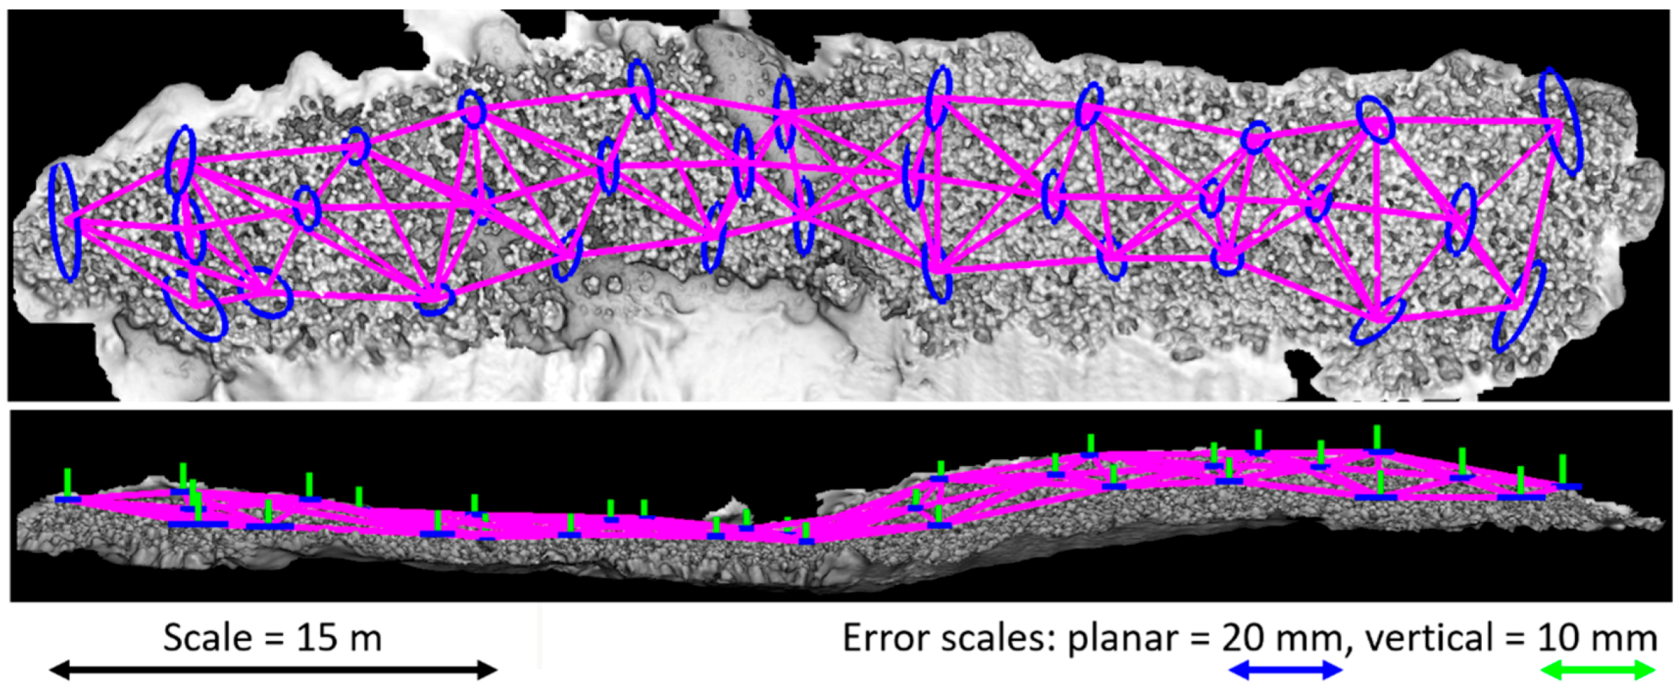
Table 1 reports the obtained average standard errors in planimetry and height for plots of different dimensions, e.g., five 5 × 5 m, one 20 × 5 m and one 50 × 10 m in the fore reef, and one 16 × 8 m in the fringing reef. Figure 4 shows the graph of the most challenging primary control network, i.e., for the 50 × 10 m fore reef plot.

3. Comparison of Diver-Operated Underwater Photogrammetric Systems

One of the core activities in the Moorea IDEA coral reef monitoring project has been the evaluation and comparative analysis of the accuracy and metric performances of different underwater photographic systems, with the aim of identifying the best solution for use in coral reef documentation and monitoring purposes. In this context, we were aiming at two different systems: (a) a high-end solution that will yield the best possible attainable accuracy, and (b) a low-cost components-based system that can be handled easily and is affordable for everyone.
In underwater photogrammetry, the imaging system is composed of four main components: (i) the camera with its sensor, (ii) the optical lens, (iii) a waterproof housing and (iv) an underwater port installed on the housing. Each of these components plays an important role in the achieved quality of the acquired images and, as a whole, contributes to the overall system stability, something which is vitally important photogrammetrically.
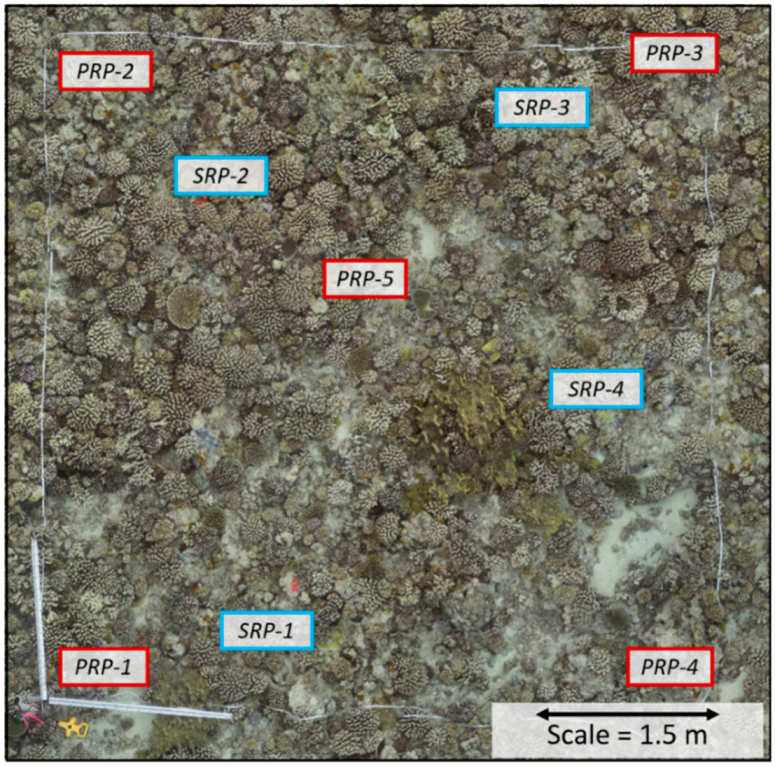
With this in mind, we tested both high-quality commercial off-the-shelf (COTS) and low-cost (action cam) underwater camera systems on one of our 5 × 5 m fore reef plots (Figure 5). We used both digital single-lens reflex (DSLR) and mirrorless interchangeable lens (MIL) cameras in our tests of the high-quality COTS digital camera systems. Ultimately, we chose to include MIL cameras in this study as these types of cameras have gained a lot of attention in the underwater photographic world for their ability to fill the gap between the heavier and more expensive DSLRs and the lighter, lower quality, compact digital cameras. As a low-cost alternative, we experimented with GoPro®, which have become very popular among marine ecologists for their affordable price, ease of use and portability. Lastly, we investigated both single and multi-camera systems.
Images were collected by scuba divers, operating the following camera systems (Figure 6, Table 2):
  • PL41: Panasonic Lumix GH4 (MIL)
  • PL51-PL52: stereo system with two Panasonic Lumix GH5 (MIL)
  • N750: Nikon D750 (DSLR)
  • N300: Nikon D300 (DSLR)
  • 5-GoPro: 5-head camera system with GoPro cameras named GoPro41 to GoPro45, where GoPro45 is the nadir looking camera.
All the camera systems were tested at two different heights, or working distances, above the reef at 2 and 5 m (except for the D300, which was used at a working distance of 2 m only) with the additional goal of investigating distance-dependent-induced errors and assessing the accuracy of the photogrammetrically derived products. Table 3 summarizes some camera network parameters for the different camera systems and the two working distances. Although slight variations in camera networks (ground sample distance - GSD as well as exterior orientation parameters) were present, we observed a high degree of consistency in our metrics of camera performances among the different photogrammetric systems used. Figure 7 shows a camera network typically implemented over the plot with cross-strips and oblique views at 2 m working distance.

3.1. Camera Systems’ Set-Up

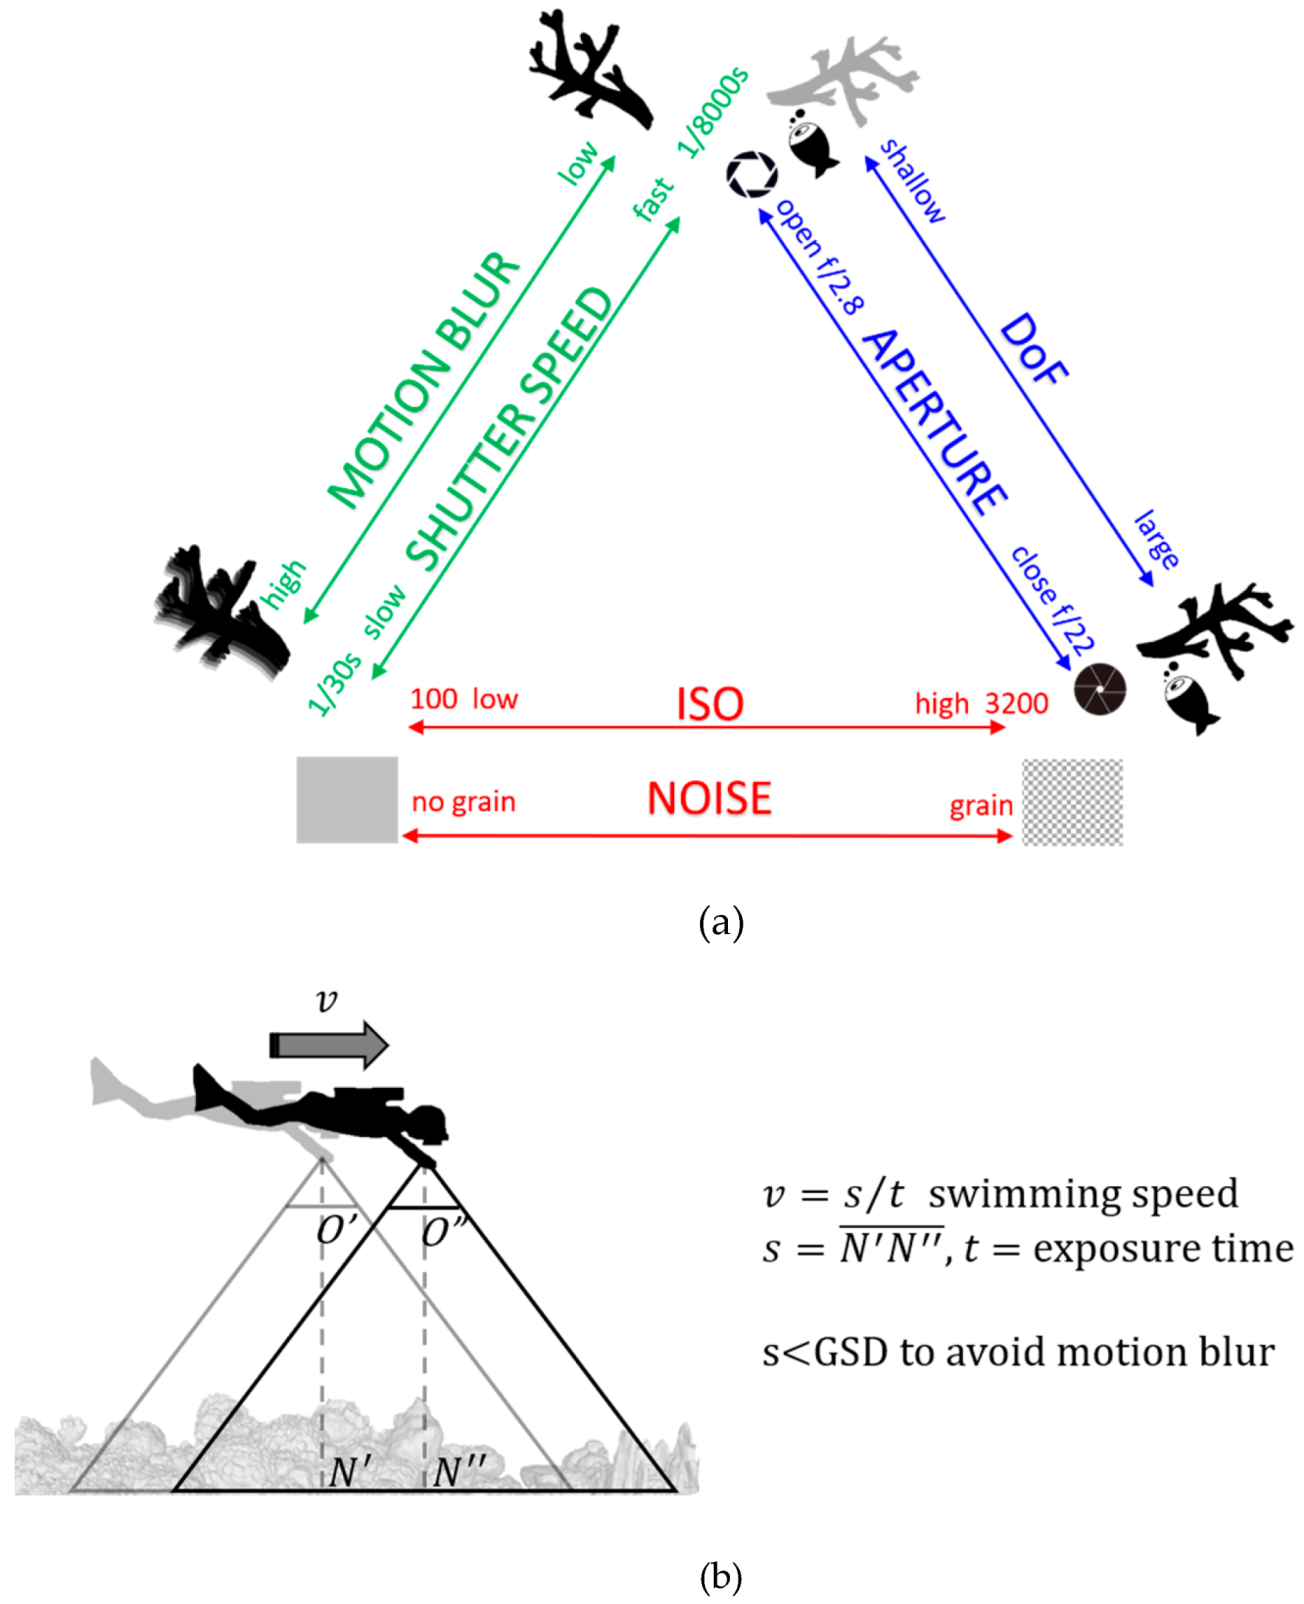
The camera settings were selected to maximize the image quality for the different cameras, while taking into consideration that the images had to be taken by scuba divers. Tests were carried out underwater using resolution and standard, commercially available photographic color reference cards for a quantitative evaluation of image quality [29]. Our goal was to verify that the image quality was homogenous across the different sensor format or, failing that, to provide the information necessary to allow the formulation of a proper stochastic model that would weigh the image observations according to their quality. The standard photography parameters to set are the three components of the so-called exposure triangle (Figure 8a), i.e., aperture, shutter speed and sensor sensitivity - ISO. In air, when dealing with close-range photogrammetry, the aperture setting can be extremely critical to properly adjust the depth of field (DoF) to the subject of interest so that all parts of the subject image are reproduced with an acceptable degree of sharpness. In water, especially when using dome ports, the DoF is significantly increased [12], making this aspect less critical. However, image quality is still heavily influenced by the chosen aperture (f number) and, consequently, the proper value must be selected based on the chosen combination of lens and housing port to minimize the introduced optical aberrations (diffraction, field curvature, spherical aberrations, etc., [29]). When acquiring the images from a moving platform, such as a swimming diver, shutter speed controls the motion blur: according to the expected motion (swimming) speed, v, the shutter speed, t, needs to be set so that the displacement, s, during the exposure time is less than the ground sample distance (GSD, Figure 8b). The ISO value controls the sensor’s sensitivity to light: the higher the number, the less light is needed to achieve a correctly exposed image for a given aperture and shutter speed. In other words, increasing the ISO will amplify the light signal allowing faster shutter speeds under lower light conditions, but at the cost of increasing the image noise or grain.
In practice, setting an adequate shutter speed is often problematic, because divers often operate underwater in low-light conditions, a red filter may be used to lower the portion of the bluish wavelengths which further reduces the amount of light available and the platform (diver) may make uncontrolled, fast movements with the camera.
With these premises, we chose to use the values summarized in Table 4 for our tests after considering the specific characteristics of each camera system and the predominant environmental conditions.
Lastly, there is the consideration of how best to set the camera’s focus. To ensure the stability of the interior camera parameters throughout the image acquisition, and, whenever possible, we selected the focusing distance as follows: first, the automatic focus option is used to focus the camera system at the proper acquisition distance; then, the focus is switched to manual to avoid changing the focus throughout the entire shooting session.
The three single camera systems (PL41, N750 and N300) were configured in single shot mode. To collect synchronized data, the PL51-PL52 stereo and 5-GoPro systems were used in time lapse photo and video mode, respectively.
The stereo system synchronization for the PL51-PL52 camera system was achieved by manually and simultaneously initializing the image acquisition for the two cameras.
For the 5-GoPro systems, the video mode was selected for the flexibility provided in recording the plots and because a waterproof multi-camera hardware-based synchronization approach would have required the modification of the factory pressure housing and the development of a special in-house system. Video synchronization was achieved via cross-correlation of external audio signals. The nadir looking camera (GoPro45) was selected as the master and the delays of the other four cameras were estimated. Frames were extracted from each video stream at a fixed time rate (1 fps) in the lossless PNG format. The PNG frames were then converted to JPG at the highest possible quality. Relevant exchangeable image file format (EXIF) tags were also embedded, allowing photogrammetric software applications to automatically recognize images coming from different cameras and estimate the initial values for camera calibration [30].
The analysis of the multi-camera systems did not show significant differences from the single camera systems and are consequently omitted in the following discussion. Interested readers should refer to [21].

3.2. White Balance, Color Correction and Image Quality

Color-corrected images are important for a proper interpretation of the recorded scene. Underwater, it is crucial to understand the state of health of the marine environment.
Analyzing the quality of the acquired images provides insights on the used imaging system, e.g., introduced optical distortions and aberrations, critical factors that may negatively influence the attainable accuracy.
Water acts as a selective filter. This means that not only a great amount of light entering water is absorbed, but that the different wavelengths composing the visible spectrum are absorbed differently, according to their spectral power distribution (SPD). Underwater, after only a few meters’ depth, and depending on water clarity (e.g., due to local characteristics such as dispersed particles, presence of soil, algae, plankton, etc.), the SPD of light reaching the subject of interest mostly lacks the longer wavelengths corresponding to red and orange colors. They are absorbed quickly, causing the greenish or bluish appearance of images acquired underwater, even at shallow depths.
Restoring the proper color balance from a picture that has been acquired underwater while not taking into account this phenomenon is equivalent to trying to color balance a picture taken above the water under a very different source of illumination than natural light (e.g., a picture taken under domestic, tungsten-filament lighting using a color camera setting for sunlight). In this situation, if the image has not been taken in raw format, a proper reproduction of colors is very difficult to achieve in post-processing, as the color content recorded by the RGB sensor lacks the signal in the corresponding wavelengths or might saturate in another channel. Attempts to recover the color corresponding to that specific missing wavelength would result only in the amplification of the sensor noise.
Many algorithmic solutions have been proposed [11,31], using extended physical models to recover the color information from bluish color-shifted images also considering distance-dependent effects.
We adopt a different approach, which relies on the acquisition of images in raw format. Raw files contain uncompressed and minimally processed data captured by the image sensor, making it possible to perform white balance adjustment before converting the images to the JPG format. When possible, we introduce standard color reference cards directly into the plots to verify that color reproduction is consistent over the entire acquired scene.
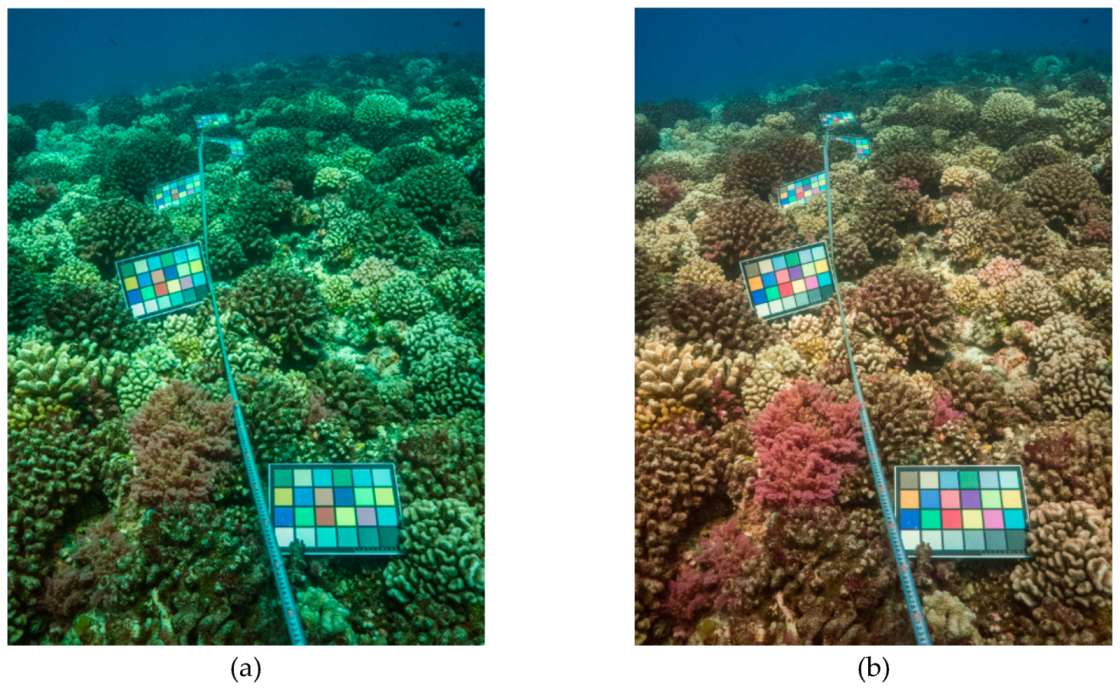
An example of the tests carried out during the 2019 Moorea campaign using color reference cards distributed along a straight path at about 1 m distance from each other, up to a maximum distance from the camera of about 5 m, is shown in Figure 9. Figure 9a shows the bluish color cast caused by the automatic in-camera white balancing, while Figure 9b displays the image after using a white balance performed on site at the operative depth of 12 m with a white card before starting the image acquisition. Despite an overall brightness reduction as function of the camera-to-color reference card distance and local color casts reflected off the reddish algae on the dead corals, the overall colors are reproduced consistently, even for distances from the camera of up to 3–4 m. Such large differences are not encountered during a nadir-like camera network where the camera-to-object distances remain almost the same, but can occur when acquiring oblique images. Oblique images also are more affected by color shifts in the observed scenery, although, as shown in Figure 9b, color variations are not critical in Moorea. We performed color processing and analyses of oblique images by automatically masking out the areas of the images that are more distant than 3 m using a depth map approach.
To improve the color appearance and contrast of the frames acquired with the GoPro camera system, a red filter was used during the image acquisition (Figure 10). The red filter modifies the SPD by lowering the amount of dominant blue light available under the water, resulting in a more balanced SPD that GoPro cameras can automatically white balance at the cost of a slightly higher noise due to the reduced overall light.
In Figure 11, we show some details of sample images (center and bottom right corner) acquired with the different camera systems used in this study. Generally, image quality degradation can be observed moving from the center to the corner, as expected due to the presence of water and underwater optical ports. The full-frame N750 shows pronounced spherical aberrations towards the corners due to the dome port. The N300 displays a halo close to the center of the image, likely due to local defects of the optical elements (lens, port or diopter, or some combination of these elements). The GoPro reveals a chromatic aberration, increasing towards the image borders due to the flat port. Image pre-processing steps can be applied to improve the GoPro image quality and reduce the chromatic aberration effects. However, the improvements achieved with these methods, e.g., collocation model or a separate calibration approach for three color channels, while able to be observed visually, are difficult to quantify computationally [32].

3.3. Photogrammetric Processing

The collected image datasets were processed following a free network self-calibrating bundle adjustment approach, using both Agisoft Metashape (V 1.6, [33]) and DBAT (V. 0.8.5., [34,35]). The two software tools produced results that were not significantly different from each other. Eight different cases for two working distances, 2 and 5 m, were considered, i.e., the five high-quality off-the-shelf cameras, nadir looking GoPro, stereo and 5-GoPro systems.

3.3.1. Residual Systematic Patterns

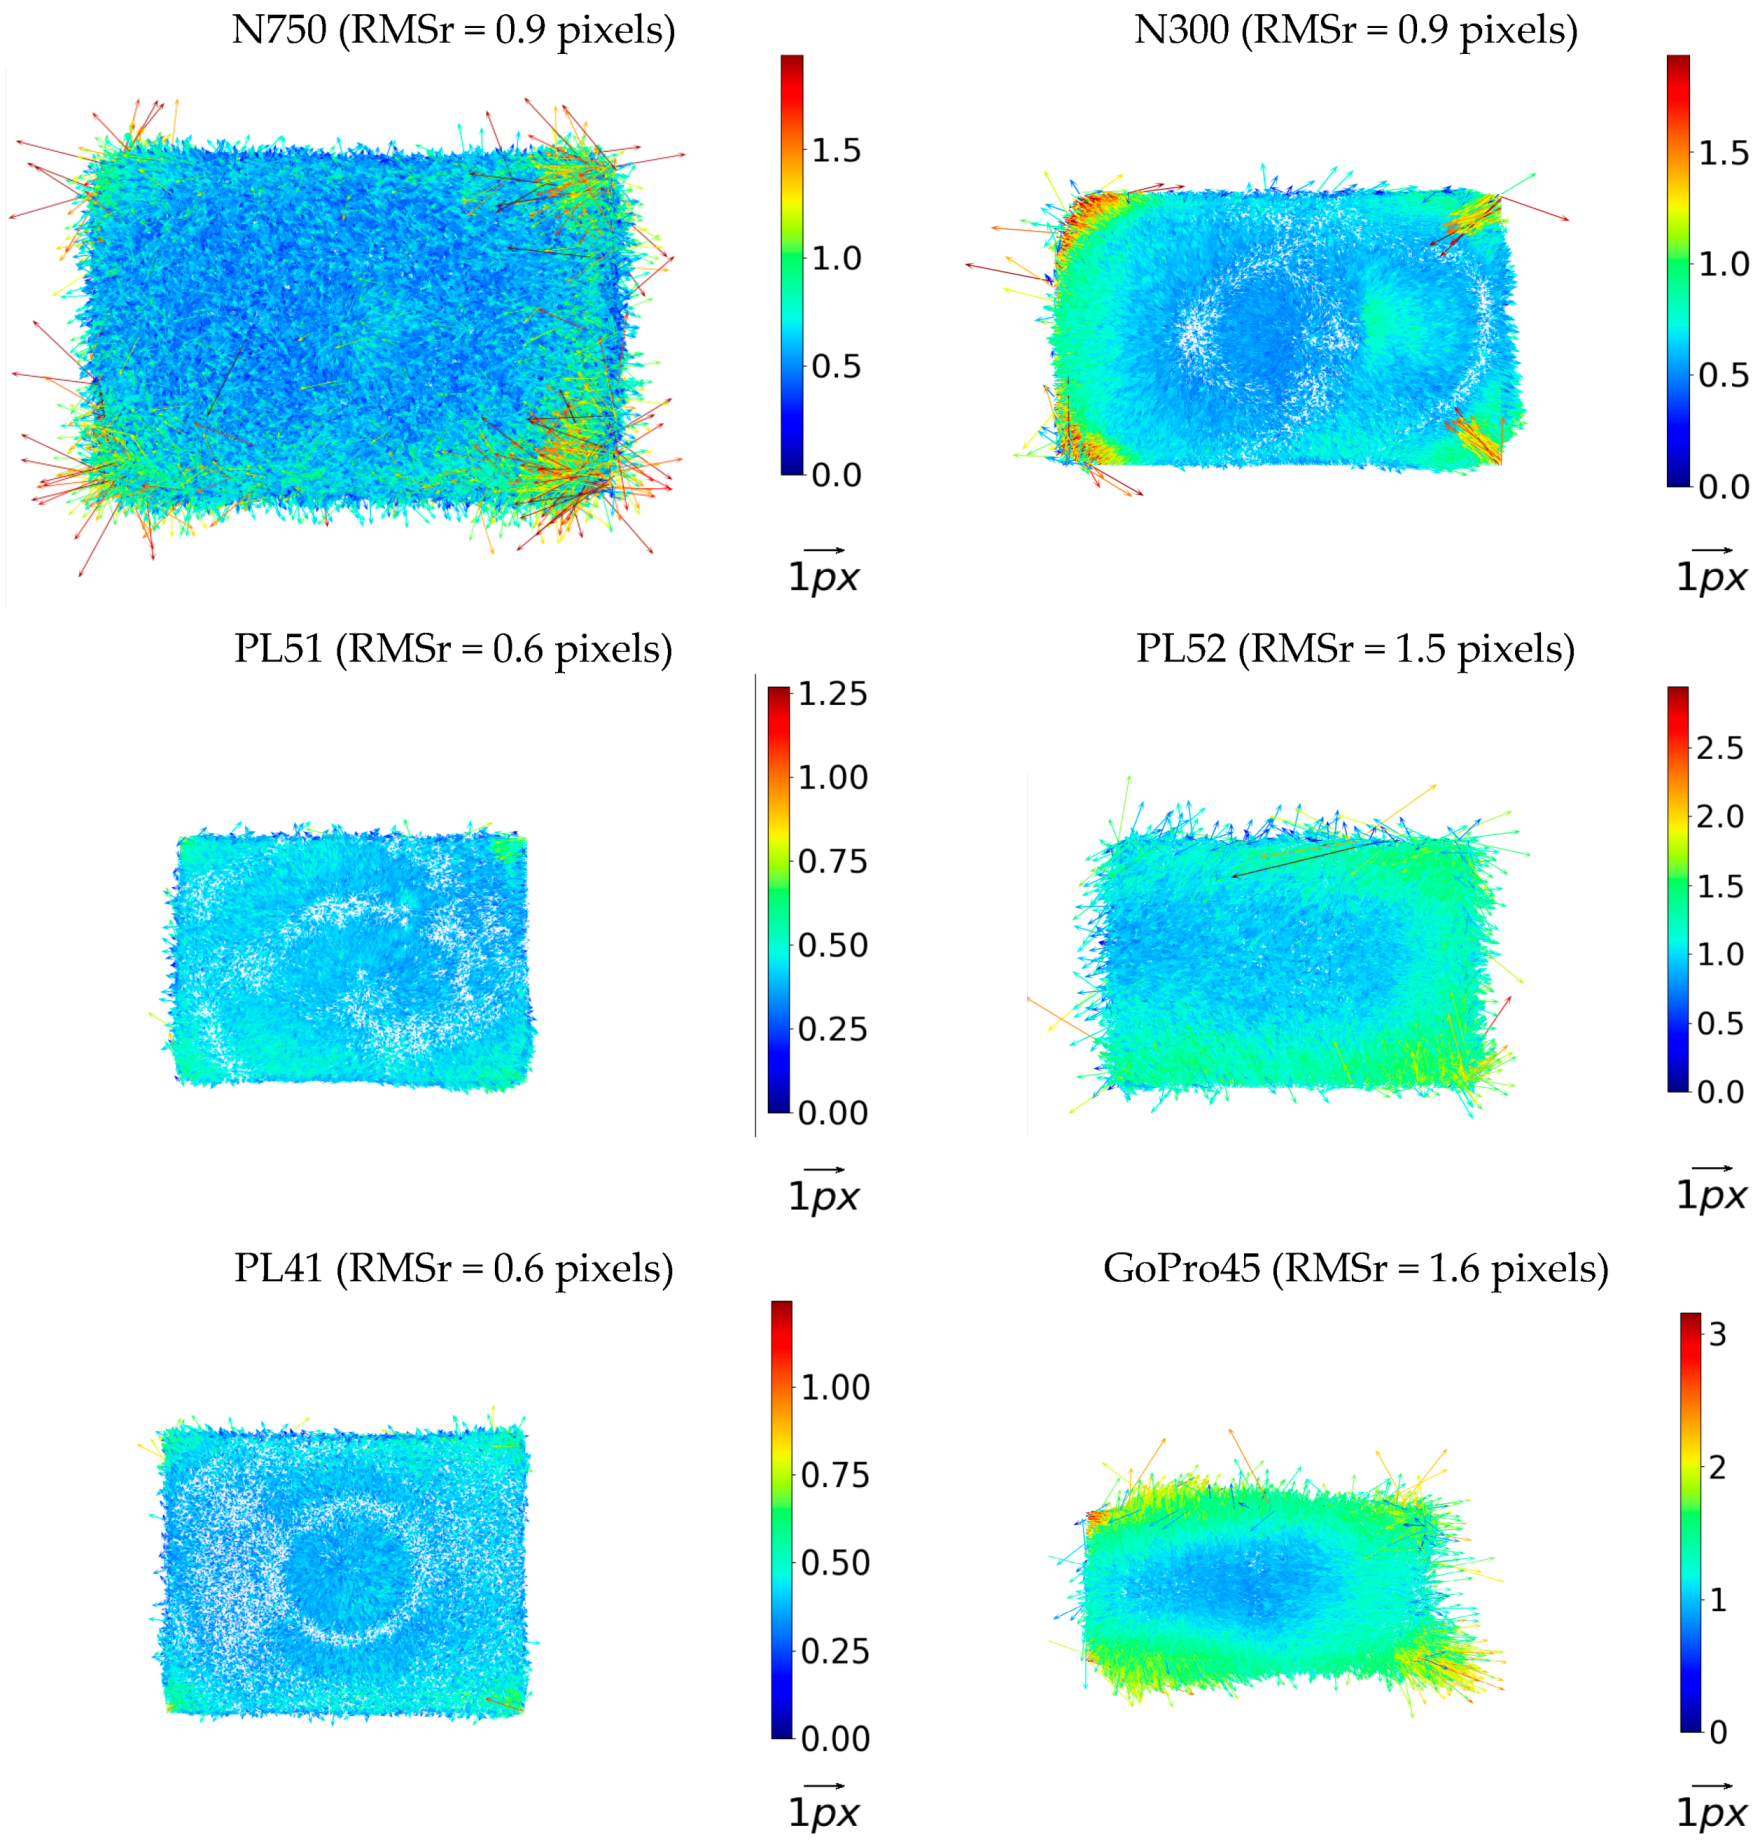
An interesting analysis concerns the average image residual patterns for the different camera systems (Figure 12).
Image observations’ residuals (or reprojection errors), r, are computed as:
r x i = x i     x ¯ i
r y i = y i   y ¯ i
r i =   r x i 2 + r y i 2
where ( x i   y i ) represent the image observation coordinates in the image plane and ( x ¯ i , y ¯ i ) are the re-projections of the 3D coordinates estimated within the bundle adjustment procedure (image coordinate residuals).
A similar systematic pattern is observed for N750 and PL41, with higher residuals arranged in a circular shape around the image center and towards the corners. The residual systematic effect for the N750 was already reported in [36] and is also confirmed by the visual analysis of the images (Figure 11). The behavior is assumed to be related to optical effects introduced by the dome port. These effects are not modeled by the standard functions of self-calibration and can therefore not be compensated.
Although PL51 and PL52 are nominally the same camera system, they show very different residuals maps, with higher values for the PL52. This performance is also consistently observed in the values reported in Table 5, Table 6 and Table 7. The worst performances are to be ascribed to the use of the silent mode in the PL52 camera system which enables the electronic shutter instead of the mechanical shutter. This introduces effects that are not properly modelled in the classic photogrammetric camera model (including self-calibration).
The distinctive systematic effect visible for N300 confirms the visual analysis in Figure 11; there, a halo is visible to the right of the central part of the image where the target is located.
The image residuals are quite high in magnitude for the GoPro. This is not surprising due to poorer image quality caused by a combination of the cheaper sensor and lens and the presence of a flat port [36]. Comparing the reprojection errors, the GoPros produced values that were greater than the higher quality systems by a factor of 2. This agrees with the results in [8].

3.3.2. Object Space Analysis

The coordinates of the primary reference points PRPs (five) are used a-posteriori to define the datum and serve as an independent check to empirically compute the errors in object space (root mean square error, RMSE), as seen from Formulas (4) to (9):
R M S E X   =   1 n · i = 1 n ( X P h o t o i     X P R P i ) 2
R M S E Y   =   1 n · i = 1 n ( Y P h o t o i     Y P R P i ) 2
R M S E Z   =   1 n · i = 1 n ( Z P h o t o i     Z P R P i ) 2
R M S E X Y   =   ( R M S E X 2   +   R M S E Y 2 ) / 2
3 D _ R M S E X Y Z   =   R M S E X 2   +   R M S E Y 2   +   R M S E Z 2
R M S E X Y Z   =   3 D _ R M S E X Y Z / 3
where the subscripts Photo and PRP indicate the photogrammetrically derived and primary control network point coordinates, respectively. X and Y define the horizontal plane, while Z is along the vertical direction.
Table 5 summarizes the results of the independent check, i.e., the comparison between the free network self-calibrating bundle adjustment for the different camera systems and the primary control network at the two working distances. The horizontal errors are larger than the vertical component at both working distances, except for the PL52 and N300. This is not in accordance with theory (see the standard deviations in Table 3) and can be attributed to the fact that there are still, even after self-calibration, small systematic errors (see Figure 12). The maximum error is consistently, except in two cases, on the same reference point. Standard deviations of the object space points (σX, σY, σZ) are also reported in Table 5. As expected, σZ is generally larger than σX and σY and the highest values are observed for the GoPro nadir camera. Interestingly, the values are roughly the same for the two working distances across all of the camera systems. This is against expectations and is still under investigation.
In Table 6, the intra-comparison between each camera system for the working distances of 2 and 5 m is reported, while in Table 7, the inter-comparison is summarized. In this case, the analysis is performed on the photogrammetrically derived coordinates of all the reference points, primary plus secondary (PRPs + SRPs, Figure 5). The RMSEs are then computed according to Equations (4)–(9), where the point coordinates from the same camera systems at the two working distances (Table 6) or two different camera systems (Table 7) are introduced.
As expected, greater differences are observed in the vertical direction and the differences are smaller at the shorter working distance. However, a high degree of consistency is observed among the photogrammetric systems, especially for the higher quality camera systems (N750, PL41 and PL51). Surprisingly, the GoPro system performs well in comparison with the other higher quality cameras. The different systems all perform within the accuracy required for quantifying the growth of several species of corals commonly found on coral reefs in the South Pacific, under favorable imaging configurations, i.e., highly redundant networks of images acquired with nadir and oblique optical axes, and on a relatively small area, which mitigate the effects of systematic errors caused by water refraction and flat ports, still visible in the residual patterns described in Section 3.3.1.
In summary, while these tests demonstrate the potential for very high photogrammetric accuracy, even underwater, it should be noted that our empirical error measurements are based on the use of only five reference points.

4. Camera Network Analysis

As highlighted in the previous section, under very special conditions, i.e., those with robust and reliable camera networks and when the surveyed area is not very large, the accuracy performances of different camera systems, both high and low quality, can be comparable. Here, we want to stress the importance of the camera network or imaging configuration, particularly in critical situations, such as, for example, the survey of a very elongated plot, which is very common when AUVs (autonomous underwater vehicles), ROVs (remotely operated vehicles) or underwater scooters are used.
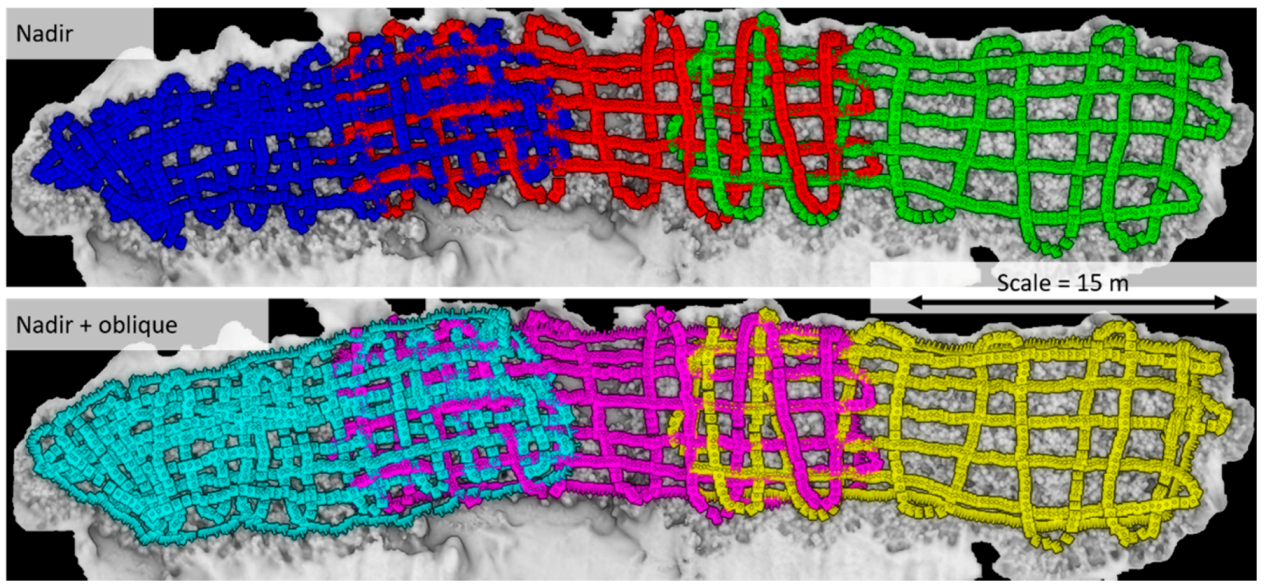
The analysis is performed on the 50 × 10 m fore reef plot, whose geodetic graph and topography are shown in Figure 4. The site was surveyed photogrammetrically in three different dives with the same camera system, PL51, which was disassembled after each dive to download the acquired data and recharge the batteries. For this reason, even if all the images are processed together, three different sets of camera calibration parameters are considered. The final network comprises 2600 nadir images, arranged in cross-strips, and 700 oblique images.
Two self-calibrating free-network BA solutions are computed (Figure 13): pure nadir imaging configuration (Figure 13, upper image) and the full image block, i.e., nadir plus oblique images (Figure 13, lower image). The coordinates of 32 primary reference points (PRPs) are considered a-posteriori to provide the empirical independent check for the photogrammetric solutions.
From Table 8, the RMSE of the complete network shows that the accuracy is worsening for the pure nadir camera network by about 400%. This finding is in accordance with empirical evidence underwater [7] as well as in other operative conditions (unmanned aerial vehicle—UAV, and terrestrial photogrammetry, [37,38] and results from simulations [39].

5. Level of Detection or Significance of Changes in Coral Reef Monitoring

In classic geodetic monitoring, a displacement field between different measurement epochs is computed on well-recognizable, often signalized homologous points. Another approach very commonly employed in geosciences to monitor the evolution of natural surfaces (e.g., landslides, rockfalls, coastal cliff, riverbanks, etc.) entails the comparison of two 3D models in the form of gridded digital elevation models (DEMs), point clouds or meshes. In this case, three methods are adopted to compute the distance between the two models: DEM of difference (DoD), cloud-to-cloud and cloud-to-mesh distance, and each of these methods present specific advantages and drawbacks, as discussed in [40]. Regardless of the method used, propagating measurement and modeling uncertainties throughout the process up to the final comparison and analyses is crucial to determine whether the computed differences highlight significant temporal changes or are mainly due to measurement and modeling errors. The concept of level of detection at a required confidence interval x% (LoDx%) [22,40] is adopted in monitoring activities: measured changes smaller than the specified LoDx% should be considered as effects of random errors and disregarded. The estimated LoDx% depends on the uncertainties of the compared models, relative registration error (or the residuals of the Helmert transformation between the two epochs) and the required confidence level [40].
Comparison between point clouds have been long preferred over comparison between meshes, on the grounds that the meshing operation introduces additional uncertainties and approximations in the modeling process, also often accompanied by a loss of high-frequency details (smoothness). Here, we take advantage of multi-view stereo (MVS) algorithms which incorporate the meshing step in the photogrammetric workflow and produce a mesh as final output [41]. This has two benefits. First, the photo-consistency check incorporated in the meshing process allows recovery of more high-frequency details visible in the images [42]. Second, the error budget propagation is theoretically achievable throughout the full photogrammetric workflow, from the BA downstream to the mesh generation. Our implemented approach is depicted in Figure 14.
The procedure starts with the photogrammetric processing of two epochs to evaluate the coral growth over the investigated time span. This step follows the procedure described in Section 3, where each survey is processed through a self-calibrating BA. The coordinates of the primary control points, which are assumed to be stable over time (Section 2), are introduced a-posteriori to check the accuracy of the two photogrammetric solutions and highlight any residual systemic errors. If the independent check for the two epochs does not show any significant residuals or differences, the photogrammetrically derived coordinates of the primary and secondary points from the first epoch (the older one) are used to define the reference datum and perform the relative registration of the second epoch to the first. The final transformation error, as well as the tie points’ standard deviations, are retained for the LoDx% estimation, as better detailed hereinafter. Tie points’ standard deviations can be estimated from the covariance matrix in a rigorous approach, such as the one we follow, or via Monte Carlo simulation, as shown in [22]. The mesh models for the two epochs are generated at a similar resolution. While the dense matching uncertainty should be theoretically available for each mesh vertex [23,43], it is computationally demanding and would require massive amounts of memory usage, particularly in the case of the high-resolution models required for coral reef monitoring. A strict solution is offered by the multi-image geometrically constrained least squares matching technique, where not only the matching parameters of all images involved are computed but also simultaneously the object space coordinates, including their standard deviations [44]. Unfortunately, this solution is not available to us in the form of implemented software. As a less intensive alternative, we consider the total number of stereo pairs per vertex as the confidence parameter, with zero corresponding to interpolated vertices, one to vertices reconstructed from a single stereo pair, two reconstructed from two stereo pairs and so on. The tie points’ standard deviations are also transferred to the mesh vertices of the same epoch through nearest neighbor linear interpolation; analogously, the registration error is associated with the vertices of the mesh from the second epoch. The distance between the two mesh models is finally computed only for those vertices with a number of stereo-pairs greater than one and compared against the estimated LoDx%. Considering a confidence interval of 95% and based on established error analysis [22,40,45], Equation 10 is adopted:
L o D 95 %   =   ±   t · ( σ 1 2 n 1   +   σ 2 2 n 2   +   E r e g )
where
  • t is computed for each vertex according to the t-statistics, which replaces the standard normal distribution when n 1 and n 2 < 30 , with a confidence level of 95% and a degree of freedom (DoF) computed as (Borradile, 2003; Langue et al., 2013):
    D o F   =   (   σ 1 2 n 1   +   σ 2 2 n 2 ) 2 / ( σ 1 4 n 1 2 / ( n 1     1 )   +   σ 2 4 n 2 2 / ( n 2     1 ) )
  • σ 1 and σ 2 are the tie points’ standard deviations from the covariance matrix and are transferred to the mesh vertices for epoch 1 and epoch 2,
  • n 1 and n 2 are the number of stereo pairs for each vertex in the mesh for epoch 1 and epoch 2, respectively. The distances are disregarded if n 1 or n 2 < 2,
  • E r e g is the registration error from epoch 2 to epoch 1.
The adopted approach is showcased for the 5 × 5 m fore reef plot presented in Section 3. The results of the photogrammetric processing for the two epochs is summarized in Table 9. We used the mesh model generation from depth maps implemented in MetaShape v.1.6 [33], a method based on the work by [46].
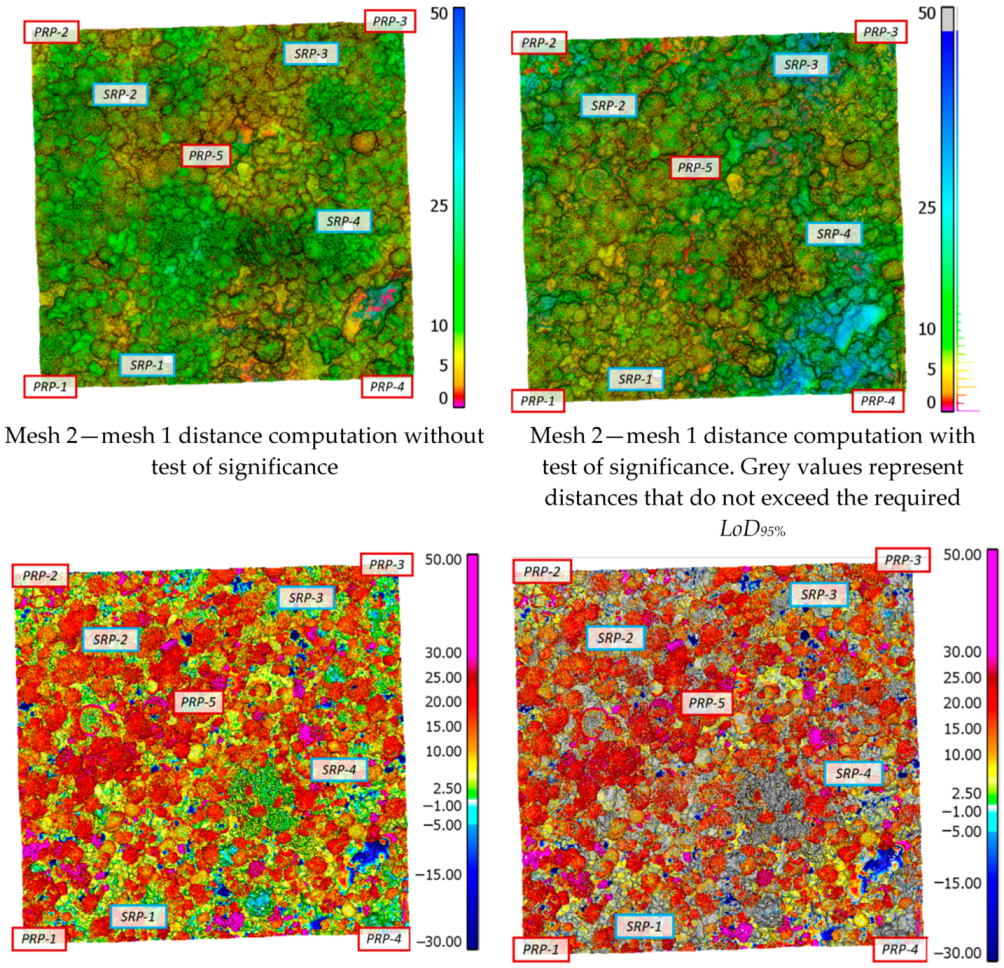
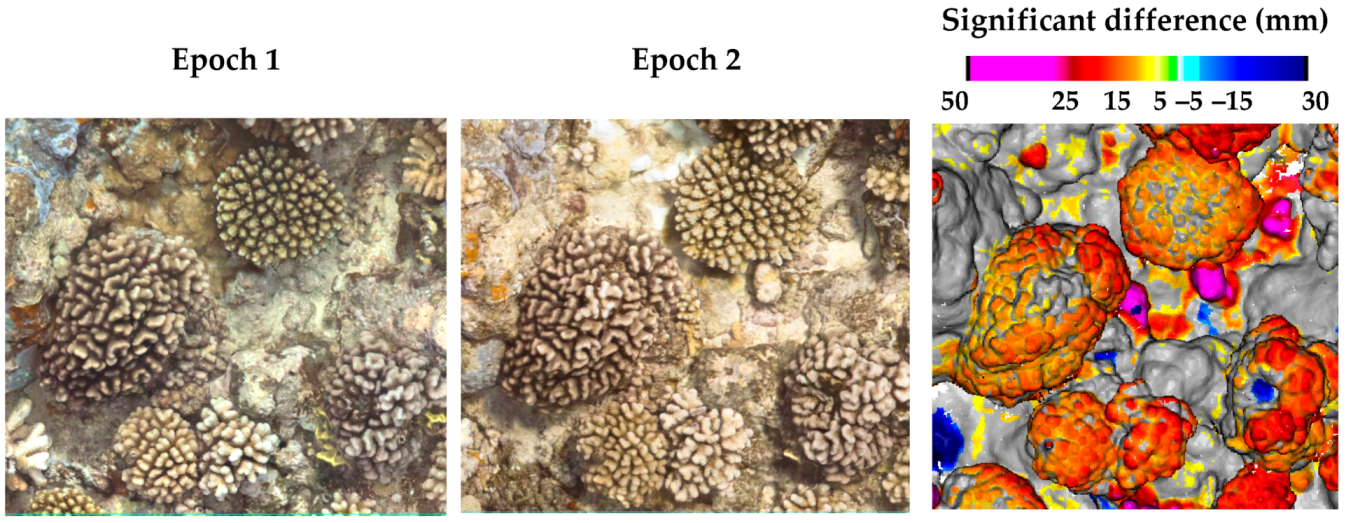
The sequential steps of the outlined procedure (Figure 14) for the detection of significant changes between the two epochs are illustrated in Figure 15. In particular, the last row reports the distance computation without and with test of significance. Oriented distances between the two 3D models were calculated using the Cloud to Mesh (C2M) algorithm implemented in the CloudCompare software suite [47]. According to the common color scale, the warm colors represent positive distances and suggest a growth of investigated colonies, and cold colors represent negative distances. Values exceeding 50 mm and –30 mm are shown in magenta and full blue, respectively. Grey is used to represent computed distances that do not exceed the computed LoD95%; thus, the areas in grey display differences that are not significant. Significant positive distances are mainly associated with the outer surface of coral colonies where the coral growth is greatest. Negative distances are sparser than positive ones and appear to be restricted to area of little coral cover and valleys between coral colonies. Figure 16 visually shows the temporal changes between the two epochs on a small area, changes that are quantified as significant differences using a color-coded representation.

6. Conclusions and Future Developments

We presented a thorough study to demonstrate the ability of underwater photogrammetry for coral reef monitoring applications. The study was conceived within a wider project aiming at modeling the complex ecosystem of a remote tropical island. The innovative aspects of our research lie in the approach implemented to assure that the strict requirements demanded by the application are fully met.
The first crucial step is the establishment of reference points, stable over time in the reef structure, measured using underwater geodetic methods. These reference points are not only necessary to establish a common reference system for successive surveys, but they are also needed as an independent check to verify the accuracy of the photogrammetric models. The method implemented and equipment specifically designed have been described in detail. This step still represents a big challenge, especially if the monitoring activity is extended over a large area. To overcome this demanding activity, we are currently investigating an alternative solution based on a prototype device developed by the authors (Figure 17) which will allow the recording of inertial as well as pressure measurements that are then included as observations into the bundle adjustment to reduce 3D model deformations over long transects. Preliminary tests anticipate a reduction of the error in the Z coordinate of more than 50% on a 50 m long transect with only nadir looking images.
The second aspect concerns the investigation of different camera systems for underwater photogrammetry and coral monitoring. We have presented a systematic study intended to identify best practices for image acquisition strategies and protocols. We have shown that, when the surveying area is small, lower-cost cameras, such as GoPro, can produce results similar to those produced by higher-cost custom camera systems, provided that the proper camera settings are selected. When surveying large areas, image quality and, even more, camera network become crucial to reduce deformations in the photogrammetric model, due to uncompensated systematic errors. Some of the authors are currently investigating computational methods for mitigating the unmodeled systematic errors in a self-calibrating bundle adjustment approach. One method [48] uses radial weighting of image observations which proportionally penalizes those observations with larger radial distances and is designed mainly to work with flat ports. The second approach [39] estimates lookup table corrections from systematic residual patterns iteratively and is targeted at camera systems using dome ports. After the first self-calibrating bundle adjustment solution, the image plane is subdivided into a grid, where for each cell, the median image residual is computed for x and y image coordinates. The correction, equal to the computed median residual error, is applied to the x and y image observations and a new self-calibrating bundle adjustment step is run. The procedure is iteratively repeated until the convergence criterion is reached (difference in the solution vector). This method is well-known in photogrammetry as the Masson d’Autume technique for systematic error removal [49]. While the radial re-weighting of image observations for flat ports considerably improves the accuracy in object space, especially in the presence of weak camera network geometry, the lookup table correction method for dome ports does not seem to further improve the accuracy in object space due to the low absolute values of the corrections.
We also stressed how an imaging geometry comprising both nadir and oblique views can reduce model deformations up to four times compared to a camera network with only nadir images.
The investigation concluded with a discussion of a framework we have developed to characterize the quality of the photogrammetrically derived reef models and assess the confidence or significance level of the changes detected through time. Measurement and modeling uncertainties are propagated downstream to the photogrammetric workflow and exploited to identify changes over time which can be considered statistically significant. The images in the last row in Figure 15 and Figure 16 stress the importance of conducting a test of significance which is critical for providing marine ecologists with more reliable results for analysis of temporal changes, thus avoiding misinterpretation that might occur when ignoring the uncertainty propagation through such a complex process.
We are currently working on incorporating automatic semantic segmentation approaches [50] into our photogrammetric pipeline to identify coral and non-coral components within the reef and restrict the change detection analysis only to the elements of interest.

Author Contributions

Conceptualization, E.N., F.M., A.G., M.T., A.C., A.J.B., R.J.S., and S.J.H.; methodology, E.N., F.M., A.G., A.C., C.C., P.R., A.J.B., R.J.S., and S.J.H.; data acquisition: E.N., F.M., A.C., and A.J.B.; software, E.N. and F.M.; formal analysis, E.N.; investigation, E.N., F.M., and A.G.; resources, A.G., M.T., A.C., A.J.B., R.J.S., and S.J.H.; data curation, E.N., F.M., C.C., and P.R.; writing—original draft preparation, E.N.; writing—review and editing, E.N., F.M., A.G., M.T., A.C., A.J.B., R.J.S., and S.J.H.; visualization, E.N.; supervision, A.G., R.J.S., and S.J.H.; project administration, A.J.B., A.C., and A.G.; funding acquisition, A.G., M.T., A.C., R.J.S., and S.J.H. All authors have read and agreed to the published version of the manuscript.

Funding

This material is based upon work supported by the U.S. National Science Foundation under Grant No. OCE 16-37396 (and earlier awards) as well as a generous gift from the Gordon and Betty Moore Foundation. We especially would like to thank Matthias Troyer for his financial and scientific support provided through the Institute of Theoretical Physics, ETH Zurich.

Acknowledgments

The research was executed under permits issued by the French Polynesian Government (Délégation à la Recherche) and the Haut-Commissariat de la République en Polynésie Francaise (DTRT) (Protocole d’Accueil 2005-2018). This work represents a contribution of the Moorea Coral Reef (MCR) LTER Site. The authors are grateful to Serkan Ural (ETH Zurich), Jordan Gallagher and the University of California Gump Research Station team for their fundamental support in the field mission and useful discussions. We also would like to thank F. Neyer, ETH Zurich, for thoughtful discussions and help with and advice on data processing. A sincere thank you is also expressed to the 3DOM-FBK group (Trento) for allowing the testing of the N750 camera system.

Conflicts of Interest

The authors declare no conflict of interest.

References

  1. Drap, P.; Seinturier, J.; Hijazi, B.; Merad, D.; Boi, J.M.; Chemisky, B.; Seguin, E.; Long, L. The ROV 3D Project: Deep-sea underwater survey using photogrammetry: Applications for underwater archaeology. J. Comput. Cult. Herit. (JOCCH) 2015, 8, 1–24. [Google Scholar] [CrossRef]
  2. Menna, F.; Agrafiotis, P.; Georgopoulos, A. State of the art and applications in archaeological underwater 3D recording and mapping. J. Cult. Herit. 2018, 33, 231–248. [Google Scholar] [CrossRef]
  3. Figueira, W.; Ferrari, R.; Weatherby, E.; Porter, A.; Hawes, S.; Byrne, M. Accuracy and precision of habitat structural complexity metrics derived from underwater photogrammetry. Remote Sens. 2015, 7, 16883–16900. [Google Scholar] [CrossRef] [Green Version]
  4. Leon, J.X.; Roelfsema, C.M.; Saunders, M.I.; Phinn, S.R. Measuring coral reef terrain roughness using ‘Structure-from-Motion’ close-range photogrammetry. Geomorphology 2015, 242, 21–28. [Google Scholar] [CrossRef]
  5. Storlazzi, C.D.; Dartnell, P.; Hatcher, G.A.; Gibbs, A.E. End of the chain? Rugosity and fine-scale bathymetry from existing underwater digital imagery using structure-from-motion (SfM) technology. Coral Reefs 2016, 35, 889–894. [Google Scholar] [CrossRef]
  6. Menna, F.; Nocerino, E.; Nawaf, M.M.; Seinturier, J.; Torresani, A.; Drap, P.; Remondino, F.; Chemisky, B. Towards real-time underwater photogrammetry for subsea metrology applications. In Proceedings of the IEEE OCEANS 2019-Marseille, Marseille, France, 17–19 June 2019; pp. 1–10. [Google Scholar]
  7. Piazza, P.; Cummings, V.J.; Lohrer, D.M.; Marini, S.; Marriott, P.; Menna, F.; Nocerino, E.; Peirano, A.; Schiaparelli, S. Divers-operated underwater photogrammetry: Applications in the study of antarctic benthos. Int. Arch. Photogramm. Remote Sens. Spat. Inf. Sci. 2018, 42, 885–892. [Google Scholar] [CrossRef] [Green Version]
  8. Capra, A.; Dubbini, M.; Bertacchini, E.; Castagnetti, C.; Mancini, F. 3D reconstruction of an underwater archaelogical site: Comparison between low cost cameras. Int. Arch. Photogramm. Remote Sens. Spat. Inf. Sci. 2015, 40, 67–72. [Google Scholar] [CrossRef] [Green Version]
  9. Guo, T.; Capra, A.; Troyer, M.; Grün, A.; Brooks, A.J.; Hench, J.L.; Schmitt, R.J.; Holbrook, S.J.; Dubbini, M. Accuracy assessment of underwater photogrammetric three dimensional modelling for coral reefs. Int. Arch. Photogramm. Remote Sens. Spat. Inf. Sci. 2016, 41, 821–828. [Google Scholar] [CrossRef]
  10. Burns, J.H.R.; Delparte, D.; Gates, R.D.; Takabayashi, M. Integrating structure-from-motion photogrammetry with geospatial software as a novel technique for quantifying 3D ecological characteristics of coral reefs. PeerJ 2015, 3, e1077. [Google Scholar] [CrossRef]
  11. Mangeruga, M.; Bruno, F.; Cozza, M.; Agrafiotis, P.; Skarlatos, D. Guidelines for underwater image enhancement based on benchmarking of different methods. Remote Sens. 2018, 10, 1652. [Google Scholar] [CrossRef] [Green Version]
  12. Menna, F.; Nocerino, E.; Fassi, F.; Remondino, F. Geometric and optic characterization of a hemispherical dome port for underwater photogrammetry. Sensors 2016, 16, 48. [Google Scholar] [CrossRef] [PubMed] [Green Version]
  13. Maas, H.G. On the accuracy potential in underwater/multimedia photogrammetry. Sensors 2015, 15, 18140–18152. [Google Scholar] [CrossRef] [PubMed]
  14. Neyer, F.; Nocerino, E.; Grün, A. Monitoring coral growth–the dichotomy between underwater photogrammetry and geodetic control network. ISPRS-Int. Arch. Photogramm. Remote Sens. Spat. Inf. Sci. 2018, XLII-2, 759–766. [Google Scholar] [CrossRef] [Green Version]
  15. Capra, A.; Castagnetti, C.; Dubbini, M.; Gruen, A.; Guo, T.; Mancini, F.T.; Neyer, F.; Rossi, P.; Troyer, M. High Accuracy Underwater Photogrammetric Surveying. In Proceedings of the 3rd IMEKO International Conference on Metrology for Archeology and Cultural Heritage, Castello Carlo, Italy, 23–25 October 2017. [Google Scholar]
  16. Skarlatos, D.; Agrafiotis, P.; Menna, F.; Nocerino, E.; Remondino, F. Ground control networks for underwater photogrammetry in archaeological excavations. In Proceedings of the 3rd IMEKO International Conference on Metrology for Archaeology and Cultural Heritage, Lecce, Italy, 23–25 October 2017; pp. 23–25. [Google Scholar]
  17. Skarlatos, D.; Menna, F.; Nocerino, E.; Agrafiotis, P. Precision potential of underwater networks for archaeological excavation through trilateration and photogrammetry. Int. Arch. Photogramm. Remote Sens. Spat. Inf. Sci. 2019, 42, 175–180. [Google Scholar] [CrossRef] [Green Version]
  18. Bryson, M.; Ferrari, R.; Figueira, W.; Pizarro, O.; Madin, J.; Williams, S.; Byrne, M. Characterization of measurement errors using structure-from-motion and photogrammetry to measure marine habitat structural complexity. Ecol. Evol. 2017, 7, 5669–5681. [Google Scholar] [CrossRef]
  19. Raoult, V.; Reid-Anderson, S.; Ferri, A.; Williamson, J.E. How reliable is Structure from Motion (SfM) over time and between observers? A case study using coral reef bommies. Remote Sens. 2017, 9, 740. [Google Scholar] [CrossRef] [Green Version]
  20. Moorea Island Digital Ecosystem Avatar Project. Available online: https://mooreaidea.ethz.ch/ (accessed on 27 July 2020).
  21. Nocerino, E.; Neyer, F.; Grün, A.; Troyer, M.; Menna, F.; Brooks, A.J.; Capra, A.; Castagnetti, C.; Rossi, P. Comparison of diver-operated underwater photogrammetric systems for coral reef monitoring. Int. Arch. Photogramm. Remote Sens. Spat. Inf. Sci. 2019, 42, 143–150. [Google Scholar] [CrossRef] [Green Version]
  22. James, M.R.; Robson, S.; Smith, M.W. 3-D uncertainty-based topographic change detection with structure-from-motion photogrammetry: Precision maps for ground control and directly georeferenced surveys. Earth Surf. Process. Landf. 2017, 42, 1769–1788. [Google Scholar] [CrossRef]
  23. Rodarmel, C.A.; Lee, M.P.; Brodie, K.L.; Spore, N.J.; Bruder, B. Rigorous Error Modeling for sUAS Acquired Image-Derived Point Clouds. IEEE Trans. Geosci. Remote Sens. 2019, 57, 6240–6253. [Google Scholar] [CrossRef]
  24. Rossi, P.; Castagnetti, C.; Capra, A.; Brooks, A.J.; Mancini, F. Detecting change in coral reef 3D structure using underwater photogrammetry: Critical issues and performance metrics. Appl. Geomat. 2019, 12, 3–17. [Google Scholar] [CrossRef]
  25. Cressey, D. Tropical paradise inspires virtual ecology lab. Nature 2015, 517, 255–256. Available online: https://www.nature.com/news/tropical-paradise-inspires-virtual-ecology-lab-1.16710 (accessed on 27 July 2020). [CrossRef] [PubMed] [Green Version]
  26. Gruen, A.; Troyer, M.; Guo, T. Spatiotemporal physical modeling of tropical islands within the Digital Ecosystem Avatar (IDEA) Project. In Proceedings of the 19 Internationale Geodätische Woche Obergurgl 2017, Obergurgl, Austria, 12–18 February 2017; pp. 174–179. [Google Scholar]
  27. Guillaume, S.; Muller, C.; Cattin, P.-H. Trinet+, Logiciel de Compensation 3D Version 6.1, Mode d’Emploi, HEIG-VD; Yverdon, Switzerland, 2008. [Google Scholar]
  28. GAMA. Available online: http://www.gnu.org/software/gama/ (accessed on 27 July 2020).
  29. Menna, F.; Nocerino, E.; Remondino, F. Optical aberrations in underwater photogrammetry with flat and hemispherical dome ports. In Proceedings of the Videometrics, Range Imaging, and Applications XIV, Munich, Germany, 26–27 June 2017; International Society for Optics and Photonics: Bellingham, WA, USA; Volume 10332, p. 1033205. [Google Scholar]
  30. Nocerino, E.; Nawaf, M.M.; Saccone, M.; Ellefi, M.B.; Pasquet, J.; Royer, J.P.; Drap, P. Multi-camera system calibration of a low-cost remotely operated vehicle for underwater cave exploration. Int. Arch. Photogramm. Remote Sens. Spat. Inf. Sci. 2018, 42, 329–337. [Google Scholar] [CrossRef] [Green Version]
  31. Akkaynak, D.; Treibitz, T. Sea-thru: A method for removing water from underwater images. In Proceedings of the IEEE Conference on Computer Vision and Pattern Recognition, Long Beach, CA, USA, 16–20 June 2019; pp. 1682–1691. [Google Scholar]
  32. Neyer, F.; Nocerino, E.; Grün, A. Image Quality Improvements in Low-Cost Underwater Photogrammetry. Int. Arch. Photogramm. Remote Sens. Spat. Inf. Sci. 2019, 42, 135–142. [Google Scholar] [CrossRef] [Green Version]
  33. Agisoft Metashape, Version 1.6 Professional Edition. Available online: http://www.agisoft.com/ (accessed on 27 July 2020).
  34. DBAT. Available online: https://github.com/niclasborlin/dbat/ (accessed on 27 July 2020).
  35. Börlin, N.; Grussenmeyer, P. Bundle adjustment with and without damping. Photogramm. Rec. 2013, 28, 396–415. [Google Scholar] [CrossRef] [Green Version]
  36. Menna, F.; Nocerino, E.; Remondino, F. Flat versus hemispherical dome ports in underwater photogrammetry. Int. Arch. Photogramm. Remote Sens. Spat. Inf. Sci. 2017, 42, 481–487. [Google Scholar]
  37. James, M.R.; Robson, S. Mitigating systematic error in topographic models derived from UAV and ground-based image networks. Earth Surf. Process. Landf. 2014, 39, 1413–1420. [Google Scholar] [CrossRef] [Green Version]
  38. Nocerino, E.; Menna, F.; Remondino, F. Accuracy of typical photogrammetric networks in cultural heritage 3D modeling projects. Int. Arch. Photogramm. Remote Sens. Spat. Inf. Sci. 2014, XL-5, 465–472. [Google Scholar] [CrossRef] [Green Version]
  39. Menna, F.; Nocerino, E.; Ural, S.; Gruen, A. Mitigating image residuals systematic patterns in underwater photogrammetry. Int. Arch. Photogramm. Remote Sens. Spat. Inf. Sci. 2020, 43, 977–984. [Google Scholar] [CrossRef]
  40. Lague, D.; Brodu, N.; Leroux, J. Accurate 3D comparison of complex topography with terrestrial laser scanner: Application to the Rangitikei canyon (NZ). ISPRS J. Photogramm. Remote Sens. 2013, 82, 10–26. [Google Scholar]
  41. Furukawa, Y.; Hernández, C. Multi-view stereo: A tutorial. Found. Trends Comput. Graph. Vis. 2015, 9, 1–48. [Google Scholar] [CrossRef] [Green Version]
  42. Vu, H.H.; Labatut, P.; Pons, J.P.; Keriven, R. High accuracy and visibility-consistent dense multiview stereo. IEEE Trans. Pattern Anal. Mach. Intell. 2011, 34, 889–901. [Google Scholar] [CrossRef] [PubMed]
  43. Kuhn, A.; Mayer, H.; Hirschmüller, H.; Scharstein, D. A TV prior for high-quality local multi-view stereo reconstruction. In Proceedings of the IEEE 2014 2nd International Conference on 3D Vision, Tokyo, Japan, 8–11 December 2014; Volume 1, pp. 65–72. [Google Scholar]
  44. Gruen, A.; Baltsavias, E.P. Adaptive least squares correlation with geometrical constraints. In Computer Vision for Robots; International Society for Optics and Photonics: Bellingham, WA, USA, 1986; Volume 595, pp. 72–82. [Google Scholar]
  45. Borradaile, G.J. Statistics of Earth Science Data: Their Distribution in Time, Space and Orientation; Springer Science & Business Media: Berlin/Heidelberg, Germany, 2003. [Google Scholar]
  46. Zach, C.; Pock, T.; Bischof, H. A globally optimal algorithm for robust tv-l 1 range image integration. In Proceedings of the 2007 IEEE 11th International Conference on Computer Vision, Rio de Janeiro, Brazil, 14–21 October 2007; pp. 1–8. [Google Scholar]
  47. Cloud-to-Mesh Distance, CloudCompare. Available online: https://www.cloudcompare.org/doc/wiki/index.php?title=Cloud-to-Mesh_Distance (accessed on 27 July 2020).
  48. Menna, F.; Nocerino, E.; Drap, P.; Remondino, F.; Murtiyoso, A.; Grussenmeyer, P.; Börlin, N. Improving underwater accuracy by empirical weighting of image observations. Int. Arch. Photogramm. Remote Sens. Spat. Inf. Sci. 2018, 42, 699–705. [Google Scholar] [CrossRef] [Green Version]
  49. d’Autume, M.G. Le traitement des erreurs systematique dans l’aerotriangulation. In Proceedings of the XIIth Congress of the ISP, Commission 3, Ottawa, ON, Canada, 24 July–4 August 1972. [Google Scholar]
  50. Pavoni, G.; Corsini, M.; Callieri, M.; Palma, M.; Scopigno, R. Semantic segmentation of benthic communities rom ortho-mosaic maps. Int. Arch. Photogramm. Remote Sens. Spat. Inf. Sci. 2019, XLII-2, 151–158. [Google Scholar] [CrossRef] [Green Version]
Figure 1. Steps of the implemented photogrammetric approach for coral reef temporal monitoring.
Remotesensing 12 03036 g001
Figure 2. Pleiades satellite image of Moorea, French Polynesia, with the fore (orange circles) and fringing reef (yellow circles) sites investigated within the underwater photogrammetry monitoring project.
Remotesensing 12 03036 g002
Figure 3. Primary (PRP-x in red) and secondary (SRP-x in blue) reference point distributions within the approximately 16 × 8 m fringing reef (upper panel) and 20 × 5 m fore reef (lower panel) plots.
Remotesensing 12 03036 g003
Figure 4. Graph of the primary control network for the 50 × 10 m fore reef plot: the point-to-point linking measurements (magenta), the horizontal error ellipses (blue) and the vertical error component (green).
Remotesensing 12 03036 g004
Figure 5. Orthographic view of one of our 5 × 5 m fore reef plots with primary (red) and secondary (blue) reference points, testing site for the five different camera systems.
Remotesensing 12 03036 g005
Figure 6. The tested underwater photogrammetric systems.
Remotesensing 12 03036 g006
Figure 7. Top and birds-eye views of a typically implemented camera network with cross-strips and oblique images at 2 m working distance.
Remotesensing 12 03036 g007
Figure 8. (a) The photographic exposure triangle and (b) relation between motion speed, v, and shutter or exposure time, t: given the swimming speed, v, the shutter speed, t, needs to be set so that the displacement, s, during the exposure time, t, is less than the GSD.
Remotesensing 12 03036 g008
Figure 9. Tests for underwater color reproduction. (a) Original image, (b) color-corrected image.
Remotesensing 12 03036 g009
Figure 10. Frames extracted from video taken with a GoPro Hero 4 Black camera recorded without (a) and with (b) the red filter.
Remotesensing 12 03036 g010
Figure 11. Image details at 100% zoom level.
Remotesensing 12 03036 g011
Figure 12. Average image residual patterns at 2 m working distance with the root mean square (RMS) reprojection error (r).
Remotesensing 12 03036 g012
Figure 13. The two different imaging configurations over the 50 × 10 m fore reef plot. The oblique images are visible all around the plot. The different colors indicate the three different dives required to complete the photogrammetric acquisition.
Remotesensing 12 03036 g013
Figure 14. Developed approach for detection of significant changes in coral monitoring.
Remotesensing 12 03036 g014
Figure 15. Uncertainty propagation throughout the photogrammetric process and registration of two epochs for significant distance computation. Values are in mm.
Remotesensing 12 03036 g015aRemotesensing 12 03036 g015b
Figure 16. Details of the orthophotos for the two epochs (2018 and 2019) over the test site together with a map of the significant differences (right).
Remotesensing 12 03036 g016
Figure 17. A prototype underwater device developed by some of the authors allowing the recording of inertial and pressure measurements synchronized with image shots.
Remotesensing 12 03036 g017
Table 1. Moorea Island Digital Ecosystem Avatar (IDEA) coral reef monitoring. Shown are average standard errors in planimetry (σXY) and height (σZ) for the primary control network in free network solutions. The number of measured primary reference points (#PRP), degree of freedom (DOF), average depth and depth range values are also reported.
16 × 8 m Plot—Fringing Reef5 × 5 m Plots—Fore Reef 1 20 × 5 m Plot—Fore Reef50 × 10 m Plot—Fore Reef
#PRP1351132
DOF781651175
σXY3.2 mm2.3 mm4.4 mm5.4 mm
σZ2.6 mm2.0 mm3.0 mm4.2 mm
Average Depth5 m10 m10 m12 m
Depth Range3 m2 m1 m4 m
1 The average values for five 5 × 5 m plots are shown. #PRP means the number of PRP.
Table 2. Characteristics of underwater photogrammetric systems tested.
System AcronymN750N300PL51-PL52PL415-GoPro (GoPro41 to GoPro45)
Camera TypeDSLRDSLRMILMILAction cam
Camera BodyNikon D750Nikon D300Panasonic Lumix GH5SPanasonic Lumix GH4GoPro Hero 4 Black edition
Sensor Type (Dimensions (mm))Full frame
(35.9 × 24)
APS-C
(23.6 × 15.8)
Four thirds
(17.3 × 13)
Four thirds
(17.3 × 13)
1/2.3 inch
(6.17 × 4.55)
Pixel Size
(um)
6.05.64.63.81.5
Image Size (pixel)6016 × 40164288 × 28483680 × 27604608 × 34563840 × 2160
Lens
(For zoom lenses, focused at focal length)
Nikkor 24 mm f/2.8 DNikkor 18–105 mm f/3.5–5.6 (at 18 mm) with +4 diopter 1Lumix G 14 mm f/2.5Olympus M. 12–50 mm f/3.25–6.3 (at 22 mm)3 mm
Underwater Pressure Housing (material)NiMAR NI3D750ZM (polycarbonate)Ikelite 6812.3 iTTL (polycarbonate)Nauticam NA-GH5 (aluminum)Nauticam NA-GH4 (aluminum)GoPro housing (polycarbonate)
Port lens (material)NiMAR NI320 dome-port (acrylic)Ikelite 5503.55 dome-port (acrylic)Nauticam N85 3.5” wide-angle dome-port (acrylic)Nauticam N85 Macro Port (glass) with Wet Wide-Lens 1 (WWL-1) dome-port (glass)Flat with red filters (glass)
1 The +4 diopter allowed the camera to properly focus underwater at the shortest focal length (i.e., at 18 mm).
Table 3. Characteristics of underwater photogrammetric systems tested.
N750N300PL41PL51PL52GoPro45
Working distance: 2 m
GSD (mm)0.50.60.60.80.71.2
Number of images304581451523523431
Working distance: 5 m
GSD (mm)1.2-1.41.41.42.2
Number of images101-139166166430
Mean intersection angle (degrees)27.9-30.424.925.527.8
Table 4. Characteristics of underwater photogrammetric systems tested.
N750N300PL51 | PL52PL415-GoPro
Acquisition ModeSingle shotSingle shotTime lapse @ 2 s shooting intervalSingle shotVideo @ 30 frame per seconds (Field of view = wide)
Original Images/Video FormatrawrawrawrawMP4
Exported Images/Extracted Frames FormatJPG @ highest qualityJPG @ highest qualityJPG @ highest qualityJPG @ highest qualityPNG (then converted to JPG @ highest quality)
Shooting ModeAperture priorityAperture priorityAperture priorityShutter priority-
Aperture Valuef/8f/5.6f/5.6-f/2.8
Shutter Speed---1/2501/120
Minimum Shutter Speed1/2501/1251/250--
Shutter ModemechanicalmechanicalMechanical | electronicMechanicalElectronic
Iso ModeAUTOAUTOAUTOAUTOMAX 1
Iso lower | Upper auto Limit100 | 3200200 | 1600100 | 1600200 | 1600400 | 1600
FocusFirst Shot Auto focusAuto focusAuto focusAuto focus continuous-
Entire AcquisitionManualManualManual-
1 The camera automatically adjusts the ISO up to the maximum specified.
Table 5. Independent check: comparison between the photogrammetric solutions and primary control network.
N750N300PL41PL51PL52GoPro45
Working distance: 2m
RMSr (pixel)0.90.80.60.61.51.6
RMSEXY on PRPs (mm)3.83.93.82.93.54.0
RMSEZ on PRPs (mm)2.65.02.32.13.62.6
RMSEXYZ on PRPs (mm)3.54.33.43.23.53.6
3D_RMSEXYZ on PRPs (mm)6.07.45.85.56.16.3
MAX ERROR [on PRP] (mm)9.4 [2]10.3 [2]9.3 [2]8.4 [2]7.7 [2]9.6 [2]
σX | σY | σZ (mm)0.9|0.9|1.30.6|0.6|1.11.5|1.5|1.80.8|0.8|1.11.6|1.6|3.72.2|2.1|3.8
Working distance: 5m
RMSr (pixel)0.8-0.40.41.21.7
RMSEXY on PRPs (mm)3.8-3.93.54.13.5
RMSEZ on PRPs (mm)3.1-2.92.66.23.1
RMSEXYZ on PRPs (mm)3.6-3.63.24.93.4
3D_RMSEXYZ on PRPs (mm)6.2-6.25.68.45.8
MAX ERROR [on PRP] (mm)10.1 [2]-9.1 [2]7.4 [2]11.5 [5]8.6 [1]
σX | σY | σZ (mm)0.8|0.8|1.8-0.5|0.5|1.20.6|0.5|1.21.7|1.7|3.73.2|3.4|5.8
Table 6. Comparison of photogrammetric bundle adjustment (BA) solutions for different camera systems at the two working distances: RMSEXY|RMSEZ|3D_RMSEXYZ, of differences computed on the nine PRPs + SRPs 3D coordinates (values are in mm).
5 vs. 2m
N750N300PL41PL51PL52GoPro45
0.4|1.0|1.2-0.8|2.5|2.70.6|1.7|1.92.1|4.3|5.21.2|3.3|3.8
Table 7. Comparison of photogrammetric bundle adjustment (BA) solutions between the different camera systems: RMSEXY|RMSEZ|3D_RMSEXYZ, of differences computed on the nine PRPs + SRPs 3D coordinates (values are in mm).
N750N300PL41PL51PL52GoPro45
Working distance: 2 m
N750-
N3001.1|3.4|3.7-
PL410.4|0.6|0.81.0|3.8|4.1-
PL511.0|1.4|2.00.8|2.9|3.10.8|1.8|2.2-
PL521.6|1.4|2.71.5|3.4|4.01.6|1.4|2.61.0|2.5|2.9-
GoPro450.9|1.3|1.80.7|2.5|2.70.8|1.9|2.10.8|1.0|1.51.3|2.2|3.0-
Working distance: 5 m
N750--
N300--
PL410.6|3.6|3.8--
PL510.6|1.9|2.1-1.0|5.0|5.2-
PL521.1|4.2|4.5-1.4|7.5|7.81.2|3.3|3.7-
GoPro451.1|3.1|3.5-1.1|4.2|4.51.1|3.8|4.11.0|6.0|6.2-
Table 8. Self-calibrating free-network BA solutions for the 50 × 10 m fore reef plot.
Nadir Nadir + Oblique
# images26003300
Average GSD (mm)0.690.74
RMS reprojection error (pixel)0.740.71
RMSEXY | RMSEZ | 3D_RMSEXYZ (mm)16.5 | 107.3 | 109.813.4 | 12.8 | 22.9
Table 9. Statistics from the photogrammetric processing for epoch 1 (2018) and epoch 2 (2019) on the same plot. The same camera system was used (PL51).
Epoch 1 (2018)Epoch 2 (2019)
Working distance (m)2.02.0
GSD (mm)0.80.9
Number of Images523318
RMS Reprojection Error (pixel)0.60.6
RMSEXY | RMSEZ | RMSEXYZ
on PRP (mm) from Geodetic Network
2.9 | 2.3 | 3.22.3|1.8|3.8
RMSEXY | RMSEZ | RMSEXYZ
on PRP + SRPs (mm) from Epoch 1
-1.3|0.9|1.6
σX | σY | σZ | σXYZ (mm)0.8|0.8|1.1|1.60.8|0.7|1.5|1.9
Mesh Resolution (mm)0.10.2