Abstract
With several bands covering iron-bearing mineral spectral features, Sentinel-2 has advantages for iron mapping. However, due to the inconsistent spatial resolution, the sensitivity of Sentinel-2 data to detect iron-bearing minerals may be decreased by excluding the 60 m bands and neglecting the 20 m vegetation red-edge bands. Hence, the capability of Sentinel-2 for iron-bearing minerals mapping were assessed by applying a multivariate (MV) method to pansharpen Sentinel-2 data. Firstly, the Sentinel-2 bands with spatial resolution 20 m and 60 m (except band 10) were pansharpened to 10 m. Then, extraction of iron-bearing minerals from the MV-fused image was explored in the Cuprite area, Nevada, USA. With the complete set of 12 bands with a fine spatial resolution, three band ratios (6/1, 6/8A and (6 + 7)/8A) of the fused image were proposed for the extraction of hematite + goethite, hematite + jarosite and the mixture of iron-bearing minerals, respectively. Additionally, band ratios of Sentinel-2 data for iron-bearing minerals in previous studies were modified with substitution of narrow near infrared band 8A for band 8. Results demonstrated that the capability for detection of iron-bearing minerals using Sentinel-2 data was improved by consideration of two extra bands and the unified fine spatial resolution.
1. Introduction
As an important data support for European Union’s Earth observation program, named the Copernicus Programme or Global Monitoring for Environment and Security (GMES), the Sentinel-2 mission was primarily designed for data enhancement of SPOT and Landsat missions. The Sentinel-2 mission contains two identical satellites, Sentinel-2A and Sentinel-2B, launched on 23 June 2015 and 7 March 2017, respectively. The twin satellites are in the same orbit, but at a 180° opposite direction, and operate routinely now, providing data coverage from latitudes −56° to 86°. With a wide swath (290 km), fine spatial resolution and temporal resolution (5 days), Sentinel-2 imagery are being widely used for global monitoring since the launches, including vegetation indices extraction [1,2,3,4,5], wildfire detection [6,7,8], land cover mapping [9,10] and geological applications [11,12,13].
Sentinel-2 multispectral imagery (MSI) contains 13 spectral bands in the visible and near-infrared (VNIR), and short-wave infrared (SWIR) regions, with four bands at 10 m, six bands at 20 m and three atmospheric correction bands at 60 m spatial resolution [14]. Generally, the four 10 m and six 20 m bands of Sentinel-2 imagery are used for environment monitoring [2,6,15], whereas the other three 60 m bands were primarily designed for atmospheric correction and cloud detection (i.e., band 1 is designed for aerosol scattering and cloud detection, band 9 is mainly for aerosol retrieval and band 10 is for cloud detection) [14], which were eliminated in most studies. However, due to the electronic transitions in the iron-bearing constituent minerals, iron minerals such as goethite, hematite and jarosite exhibit diagnostic spectral features near 0.43 µm, 0.65 µm, 0.85 µm and 0.93 µm, which are close to Sentinel-2 band 1, band 4, band 8/8A and band 9 [16,17]. Therefore, the elimination of 60 m Sentinel-2 bands may decrease the sensitivity of Sentinel-2 data to iron-bearing minerals in geological investigations.
Being free multispectral data, Sentinel-2 data has higher spectral resolution, spatial resolution and temporal resolution from a VNIR to SWIR range than common geological multispectral imagery, such as the Landsat series and the Advanced Spaceborne Thermal Emission and Reflection Radiometer (ASTER). In addition, the potential of Sentinel-2 imagery for geological investigations has been comprehensively discussed in previous studies [11,12,18,19]. For example, based on the band ratios for alteration extraction from multispectral ASTER data, van der Meer et al. [12] discussed the potential of Sentinel-2 data for geological applications. The spectral bands of Sentinel-2 imagery applied for hydrothermal alteration extraction were bands with a 10 m pixel size and SWIR bands [12]. Nevertheless, since the Sentinel-2 bands with 20 m spatial resolution in VNIR were originally designed for leaf area index, chlorophyll, water vapor absorption and atmospheric corrections [12], there were few studies on the potential of these bands for geological information extraction. Additionally, with the failure of the ASTER SWIR detector in 2008, as well as retiral of Hyperion in 2017, it is important to explore the capability of Sentinel-2 bands for geological mapping to ensure data continuity.
Image fusion methods can produce spatially enhanced multispectral (MS) images by fusing MS and panchromatic (PAN) images [20,21,22]. With the same coverage, the 60 m and 20 m bands of Sentinel-2 can be merged with the 10 m bands, offering fused bands with a cell size of 10 m and more spatial details [22,23,24]. For example, Wang et al. [22] employed three types of image fusion approaches (eight component substitution (CS), multiresolution analysis (MRA)-based approaches and area-to-point regression kriging) to pansharpen 20 m Sentinel-2 bands to 10 m cell size, yielding promising products for global monitoring. Moreover, Park et al. (2017) [25] proposed a two-step pansharpening method to enhance 20 m and 60 m Sentinel-2 bands, and improved fusion accuracy by modifying the band combinations used in multivariate linear regression analysis. Fused Sentinel-2 imagery with 10 m cell size is widely applied in land-cover/land-use mapping and change detection [26,27]. However, it is rarely employed in geological surveys. Moreover, 60 m Sentinel-2 bands are normally ignored in image fusion due to their lower spatial resolution and the fact that their primary objective is for atmospheric correction.
In conclusion, there are still some challenges in mineral extraction based on Sentinel-2 data. For example, how to obtain bands with unified fine spatial resolution with minimized spectral distortion? What kinds of iron minerals could be identified with addition of atmospheric correction bands and 20 m VNIR bands? To address these questions, the Cuprite area in Nevada, a typical remote sensing geological experiment area, was chosen as the experimental region. A multivariate (MV) method [28] that was originally proposed for thermal infrared (TIR) image fusion was applied for the fusion of Sentinel-2 image to minimize spectral distortion. Moreover, the capability of fused Sentinel-2 image for iron-bearing minerals were explored by proposing new band ratios and modified original band ratios for iron minerals.
2. Materials and Methods
2.1. Sentinel-2 Data
In this study, one 5.7 km × 5.7 km L1C-level Sentinel-2A subset, acquired on August 17, 2018 and covering the Cuprite area, Nevada, USA, was chosen as the study data. The image contains 10 VNIR bands and three SWIR bands, as displayed in Table 1. The top-of-atmosphere (TOA) subset is cloud free and has been automatically atmospherically corrected to a surface reflectance product by the ATCOR model in the Sen2Cor processor algorithm provided by European Space Agency (ESA) [22].

Table 1.
Some specifications of Sentinel-2 imagery [29].
As illustrated by EAS [30], Sentinel-2 band 10 is an uncalibrated band, that shows noise patterns on bright images caused by detector saturation [25]. Hence, this band was neglected in the following experiments. Although designed for atmospheric correction, bands 1 and 9 were explored in the following experiments of image fusion and iron-bearing minerals detection, since they are close to the spectral features of iron-bearing minerals [17]. For the sake of brevity, several Sentinel-2 band combinations were defined as follows:
- (1)
- MS10 = [MS102, MS103, MS104, MS108] represents all the original 10 m MS bands;
- (2)
- MS20 = [MS205, MS206, MS207, MS208A, MS2011, MS2012] represents all the original 20 m MS bands; and
- (3)
- MS60 = [MS601, MS609] represents all the original 60 m MS bands.
2.2. Image Fusion Algorithms
In this study, two pansharpening methods, namely Gram-Schmidt (GS) and MV, were chosen as the fusion algorithms of the Sentinel-2 subset.
2.2.1. Multivariate Method
Based on multivariate regression analysis, a TIR image fusion method named MV was proposed by Jing et al. [28]. Different from typical image fusion, the fusion of the Sentinel-2 image in this study employs multiple high-resolution bands as the PAN in image fusion, which is similar to the TIR fusion in Jing et al. [28]. Hence, the MV method was applied for the fusion of Sentinel-2 image in this study despite of its original intention for TIR image fusion.
In the MV fusion method, the ith 10 m Sentinel-2 band (MS10i, i = 1, …, 4) is degraded to an approximation (MS10i,L) with a pixel size of 20 m or 60 m, which was obtained by an averaging approach with a spatial resolution of 10 m. The spatial details (MS10i,H) of the 10 m band MS10i can be defined as follows:
A linear multivariate regression of a low-resolution (20 m/60 m) band and the four 10 m bands of the Sentinel-2 image can be expressed as follows:
where ai and b are coefficients of the multivariate regression, e is the residual and MSlow is the low-resolution (20 m/60 m) band of the Sentinel-2 image, which was previously cubically up-sampled to 10 m pixel size.
A fused MS band is equal to the corresponding low-resolution MS band plus weighted spatial details of the high-resolution PAN image [28]. Hence, a fused band MSlow,F can be obtained using coefficients ai obtained from Equation (2), as follows:
where MSlow,L was the approximation with a pixel size of 20 × 2 m or 60 × 2 m, which has a spatial resolution of 20 m or 60 m and was obtained by an averaging approach, similar to MS10i,L.
According to the description above, the flowchart of the MV method for Sentinel-2 image fusion is presented in Figure 1. In essence, the MV fusion method is a method based on linear multivariate analysis, in which the spatial details of the four Sentinel-2 MS10 bands are calculated and then injected into each low-resolution band (MS20/MS60) to synthesize a fused band.
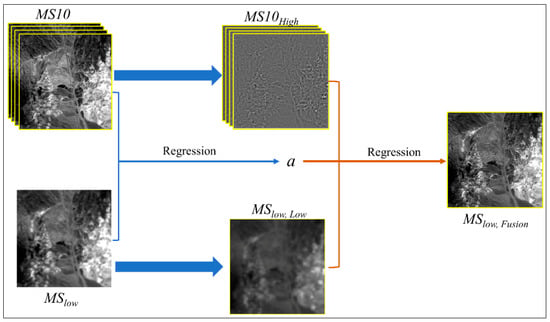
Figure 1.
Flowchart of the multivariate (MV) method for Sentinel-2 image fusion. MS10 are the four original 10 m MS bands; MS10High are the spatial details of 10 m band MS10; MSlow is the original 20 m/60 m MS band; MSlow,L is the approximation with a pixel size of 20 × 2 m (60 × 2 m), which has a spatial resolution of 20 m (60 m); and MSlow,F is the fused MS20/MS60 bands with a pixel size of 10 m.
2.2.2. Gram-Schmidt Method
As a representative component substitution-based image fusion method, the Gram-Schmidt (GS) method was proposed by Laben and Brower [31]. The following four steps are involved in this method [31,32,33,34]:
- (1)
- Simulating a PAN image from the low spatial resolution spectral bands;
- (2)
- Performing a Gram-Schmidt transform on the low spatial resolution MS bands so that the first resultant component is the closest to the simulated PAN image;
- (3)
- Replacing the first component by the high spatial resolution PAN image; and
- (4)
- Performing the inverse GS transform on the new set of components to yield pansharpened MS bands.
The popular GS transform fusion method has two main advantages. Firstly, unlike Brovey and Intensity-Hue-Saturation (IHS) image fusion methods, there is no limit to the number of MS bands during fusion processing. Secondly, the spectral features in the original MS image are better preserved in the fused result [34].
Like typical image fusion methods, there is only one PAN image input in the GS image fusion. Therefore, there are two schemes to choose a high spatial resolution image from Sentinel-2 data in the fusion: (1) selecting a band according to the correlation coefficients between MS10 and other bands [24,25]; and (2) synthesizing a band through weighted combination of MS10 bands [25]. As demonstrated in Park et al. [25], the selected band scheme is better in the GS method. Therefore, in this study, one of the four MS10 bands is chosen as the PAN image for the GS fusion of the Sentinel-2 image, with reference to the correlation coefficients between MS10 and other bands.
2.3. Quality Indices
To assess the quality of the fused images, many indicators have been proposed for evaluating the spatial and spectral distortions of the pansharpened image [35,36,37]. In this study, in order to use the original MS image as a reference image to evaluate the quality of pansharpened images, the fusion experiment was performed on downsampled original images. Five indices were employed to evaluate the quality of the fused Sentinel-2 image, including correlation coefficient (R), spatial correlation coefficient (sCC), spectral angle mapper (SAM) [38], relative dimensionless global error (ERGAS) [39] and universal image quality index (UIQI) [40]. The correlation coefficient (R) numerically measures the degree of correlation of different variables as follows:
where A is the reference image, F is the fused image and MN is the size of the image. When R is close to 1, the lowest spectral distortion is observed and the best fusion quality is obtained.
The spectral angle mapper (SAM) measures the spectral distortion between the fused image and reference image, as defined below:
where ν and stand for the spectral pixel vectors of the reference image and the sharpened image, respectively. The optimal value of SAM is 0.
The root mean square error (RMSE) is a measure of the differences between variables, expressed as follows:
where A is the reference image, F is the fused image and M and N are the line and column of the image, respectively. When RMSE is close to 0, the best fusion quality is obtained.
As an improved version of the assessment index relative average spectral error (RASE), the global index of relative dimensionless global error (ERGAS) [39] is defined as below:
where h and l are the spatial resolutions of the PAN and MS images, respectively, K is the number of bands of the fused image and MEAN(i) is the mean surface reflectance of MS band i. The optimal value of ERGAS is 0.
The universal image quality index (UIQI) was proposed by Wang et al. [40] to assess the quality of a fused image, which is defined as follows:
where and represent the sample mean values of images x and y, respectively; and are the sample variances of images x and y, respectively; stands for the covariance of images x and y. The UIQI measures the similarity between two single-band images [41]. Therefore, for the Sentinal-2 image, the overall UIQI index is the average of the UIQI, obtained band by band in this study. The optimal value of UIQI is 1.
The spatial Correlation Coefficient (sCC) was proposed to assess the spatial distortion of the fused image, by comparing the spatial details between the fused and reference images [25,42]. Firstly, a Laplacian filter is applied to both images to extract the spatial details. Then, the correlation between the two filtered images is calculated as the sCC value [25,42]. The higher the sCC is, the lower the spatial distortion in the fused image is.
2.4. Mineral Mapping
Iron-bearing minerals, such as hematite, jarosite and goethite, display significant absorption features from 0.4 to 1.3 μm [43], as illustrated in Figure 2. Due to their similar compositions (goethite [α-Fe3+O(OH)], hematite [α-Fe3+2O3] and jarosite [KFe3+3(SO4)2(OH)6]), iron-bearing minerals show analogous diagnostic spectral features in the VNIR range. As magnified in Figure 2b,c, jarosite and hematite show reflectance features near 0.72 μm and 0.74 μm, respectively, both of which are close to Sentinel-2 band 6. In addition, hematite exhibits a diagnostic absorption feature near 0.88 μm corresponding to Sentinel-2A band 8A. Moreover, as explained in Swayze [43], goethite and hematite in the Cuprite area exhibit intense absorption in the 0.3–0.45 μm range, and jarosite and other similar Fe-sulfates, when forming thick coatings, show an apparent narrow diagnostic absorption near 0.43 μm. Therefore, with reference to these spectral features of iron-bearing minerals, two band ratios band6/band8A and band6/band1 were proposed to extract jarosite + hematite and hematite + goethite, respectively, and a band ratio (band6+band7)/band8A was proposed to extract the mixture of iron-bearing minerals including jarosite, hematite and goethite.
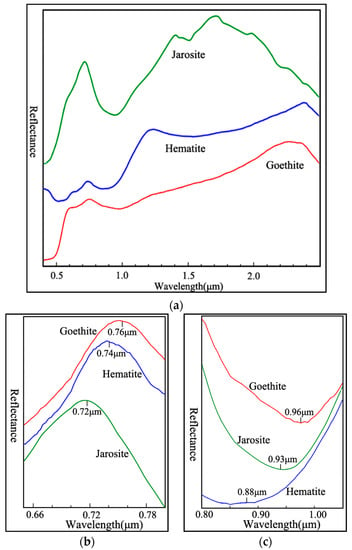
Figure 2.
Spectral features of iron minerals including goethite, hematite and jarosite obtained from the United States Geological Survey (USGS) spectral library [43,44]. (a) reflectance spectra of goethite, hematite and jarosite; (b) reflectance features of iron minerals near 0.7 μm; (c) absorption features of iron minerals near 0.9 μm.
2.5. Study Area
The Cuprite mining district located in Nevada, USA was selected as the study area to evaluate the ability of the fused Sentinel-2 MS images for iron-bearing minerals detection. The Cuprite mining district is an arid and semi-arid region with little vegetation cover, located about 200 km northwest of Las Vegas, Nevada, the U.S. With plenty of well-exposed hydrothermal alteration minerals, the Cuprite area has been serving as an excellent test site for remote sensing geology for decades [43,45,46,47,48,49].
As illustrated in Figure 3, the well-exposed hydrothermal alteration minerals of the Cuprite area are distributed around two centers on opposite sides of the Highway 95 [43,50], and can be mainly divided into three main alteration zones: a silicic alteration zone, an argillic alteration zone and an opal alteration zone. The main hydrothermal alteration minerals include hydrated silica, alunite, kaolinite, chlorite, montmorillonite and buddingtonite. Moreover, the ground truth of the iron-bearing minerals obtained from AVIRIS hyperspectral data were displayed in Figure 3c. Hematite, especially fine-grained to medium-grained hematite, is mainly distributed in the west of Highway 95. Other iron-bearing minerals, including goethite, jarosite, lepidocrocite and other Fe2+-bearing (ferrous iron) or Fe3+-bearing iron (ferric iron) minerals, are well-exposed in the east of the highway. Moreover, Fe2+-bearing minerals are mainly muscovites and chlorites.
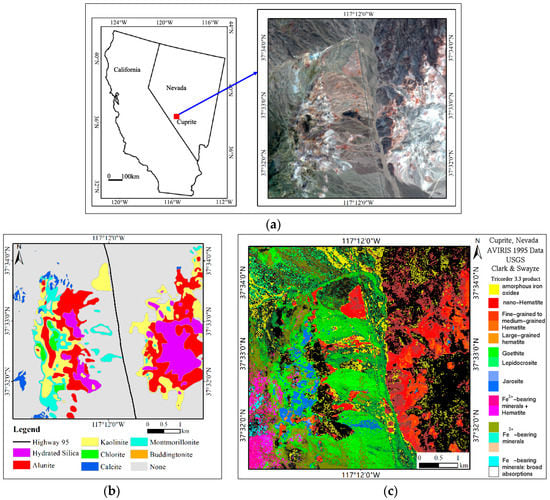
Figure 3.
Location map (a), hydrothermal alteration minerals map (b) and iron-bearing minerals map (c) of the Cuprite area, modified after Mars et al. and Swayze et al. [43,48] (Map projection: WGS_1984_UTM_zone_11N).
3. Results
3.1. Sentinel-2 Image Fusion
The fused results of Sentinel-2 data using MV and GS algorithms are illustrated in Figure 4. Each fused MS image contains significantly more spatial details than the original MS images (Figure 4a,d,g). In the two fused images, small geological bodies become legible, and their boundaries are much clearer than those in the original images. For instance, the boundaries of highway 95 in Figure 4a,d,g are barely legible, whereas they can be evidently identified in the fused images. Moreover, compared with the MV fused bands (Figure 4h), the GS fused bands (Figure 4i) show more spectral distortion.
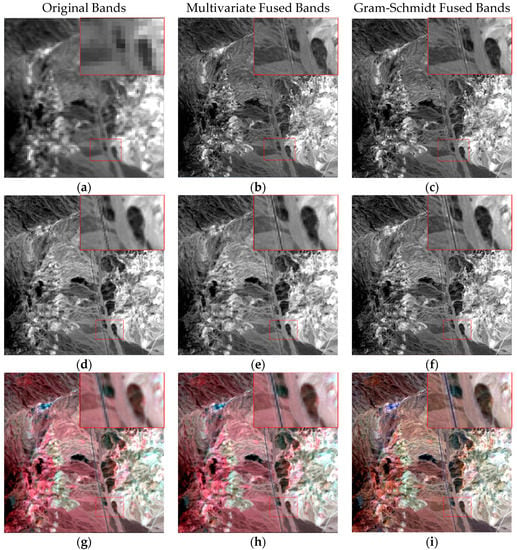
Figure 4.
The original and fused Sentinel-2 bands. (a) Original 60 m MS601 band; (b) multivariate fused MS601 band; (c) Gram-Schmidt fused MS601 band; (d) original 20 m MS206 band; (e) multivariate fused MS206 band; (f) Gram-Schmidt fused MS206 band; (g) original 20 m bands (RGB: MS2011-MS208A-MS205); (h) multivariate fused 20 m bands (RGB: MS2011-MS208A-MS205); (i) Gram-Schmidt fused 20 m bands (RGB: MS2011-MS208A-MS205).
Table 2 lists the quality indices of the fused Sentinel-2 bands generated by the MV and GS pansharpening methods. Due to different spatial resolutions, the fused MS60 and MS20 bands were evaluated by quality indices separately. As shown in Table 2, the MV fused bands show a higher fused quality than those generated by the GS method except the sCC index. Conclusively, the MV method outperforms the GS algorithm on preserving the spectral quality in the fusion of Sentinel-2 bands over the Cuprite area. Therefore, the MV fused images were utilized for geological information extraction in the following subsection.

Table 2.
Quality indices of fused Sentinel-2 bands generated by the two fusion algorithms for the Cuprite area.
3.2. Hydrothermal Alteration Extraction
In this subsection, the potentials of fused Sentinel-2 data for iron-bearing minerals extraction in the Cuprite area were explored. The distribution of the iron-bearing minerals obtained from the MV-fused Sentinel-2 image using band ratios were displayed in Figure 5. Compared with Figure 3c, the band ratio of band 6/band 8A illustrated in Figure 5a effectively discriminates hematite and jarosite in the Cuprite area (blue pixels). In addition, due to their similar diagnostic spectral features near Sentinel-2 bands 1 and 6, the band ratio of band 6/band 1 simultaneously enhances the fine-grained to medium-grained hematite and goethite as bright pixels, which are highly consistent with the ground truth obtained from AVIRIS data, as displayed in Figure 5a (red pixels). Moreover, a portion of Fe2+-bearing minerals was also identified by the band ratio of band 6/band 8A due to spectral features similar to jarosite and hematite. The mixture of iron-bearing minerals was extracted by a band ratio of (band 6 + band 7)/band 8A, as red to yellow pixels (Figure 5b). Yellow to red in Figure 5b represents the concentration of mixed iron-bearing minerals from low to high. The mixture of iron-bearing minerals obtained from the fused Sentinel-2 image is highly consistent with iron minerals in Figure 3c, especially for jarosite and goethite, whereas the identification of hematite on the left side of the study area was less consistent.
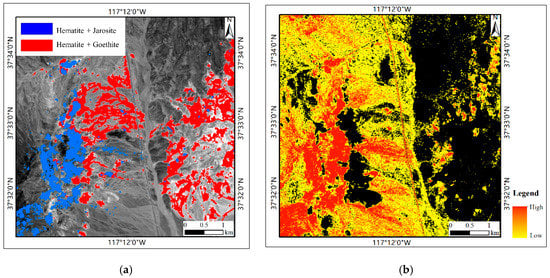
Figure 5.
Distribution of iron minerals in the Cuprite area. (a) Shows the iron minerals distribution obtained from the fused Sentinel-2 data; (b) shows the mixture of iron-bearing minerals extracted from the fused Sentinel-2 data.
3.3. Modified Band Ratios for Mapping Iron-Bearing Minerals
In previous studies [12,19,51], the absorption feature of iron-bearing minerals near 0.85 µm was detected by band 8 instead of the narrow NIR band 8A. Nevertheless, as explained by ESA [29], the narrow NIR band 8A located at 865 nm was designed for vegetation extraction without contamination from water vapor, which is also sensitive to the iron oxide content of soil. In addition, the narrow NIR band 8A was also demonstrated by Zhang et al. [52] to be more comparable to the Landsat-8 Operational Land Imager (OLI) NIR band 5 than band 8, as displayed in Figure 6. Moreover, Fe2O3 shows a higher correlation with the ferric oxide obtained from band 8A than that of band 8 [53]. Therefore, with the complete set of 12 bands with a fine spatial resolution of 10 m in this study, the band ratios of Sentinel-2 data for iron-bearing minerals extraction proposed by van der Meer et al. [12] were modified as in Table 3.
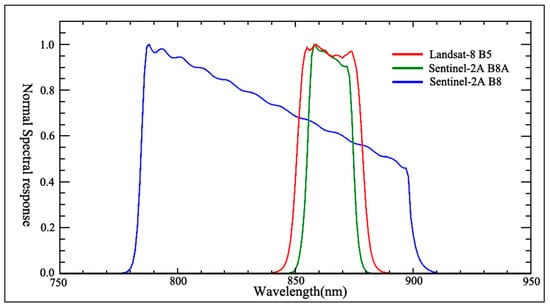
Figure 6.
The comparison of spectral response functions of Landsat-8 NIR band (B5) and Sentinel-2 bands 8 and 8A [52].

Table 3.
Sentinel-2 data band ratios as an analogue of ASTER, Landsat 5 TM and Landsat 8 Operational Land Imager (OLI)band ratios for mapping iron-bearing minerals, modified after [12,51,54,55].
The scatter plots of iron-bearing minerals extracted from Landsat-8 OLI and fused Sentinel-2 images in the Cuprite area were shown in Figure 7. The correlation between the ferric oxides of Landsat-8 OLI (band ratio 6/5) and fused Sentinel-2 images is 0.852 for band ratio 11/8, whereas it is 0.903 for band ratio 11/8A. In addition, the correlation between the ferrous iron of Landsat-8 OLI (band ratio 7/5+3/4) and fused Sentinel-2 images is 0.905 for band ratio 12/8+3/4, whereas it is 0.937 for band ratio 12/8A+3/4. Results illustrated that compared with the original band ratios proposed by van der Meer et al. [12], the modified band ratios of Sentinel-2 data for iron-bearing minerals has higher consistency with those of Landsat-8 imagery. Therefore, the narrow NIR band8A of the Sentinel-2 image exhibits a better ability to extract iron-bearing minerals than band 8.
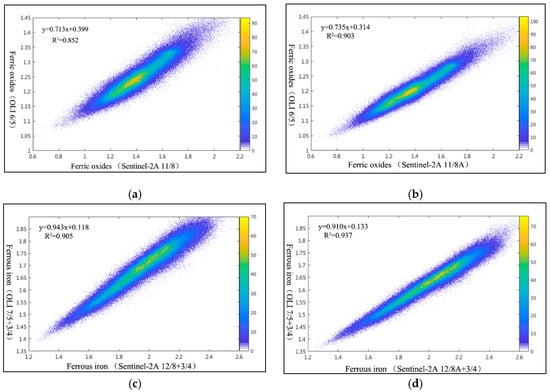
Figure 7.
The scatterplots of ferric oxides and ferrous iron obtained from Landsat-8 OLI and fused Sentinel-2 images. (a) ferric oxides obtained from band ratios OLI 6/5 and fused Sentinel-2 11/8; (b) ferric oxides obtained from band ratios OLI 6/5 and fused Sentinel-2 11/8A; (c) ferrous iron obtained from band ratios OLI 7/5+3/4 and fused Sentinel-2 12/8+3/4; (d) ferrous iron obtained from band ratios OLI 7/5+3/4 and fused Sentinel-2 12/8A+3/4.
4. Discussion
Being the continuity of Landsat and SPOT, Sentinel-2 data has been widely used in earth observation, such as vegetation monitoring, land cover classification and forest fire detection [2,3,9,15,26]. However, due to the inconsistent spatial resolution, the ability of Sentinel-2 vegetation edge bands and atmospheric correction bands to geological mapping still lacks exploration. Hence, in this paper, to explore more deeply the capability of Sentinel-2 bands for iron-bearing mineral mapping, a multivariate regression-based image fusion method named MV was selected, and low spatial-resolution Sentinel-2 MS20 and MS60 bands were fused to 10 m spatial resolution. With image fusion, the spatial details were enriched in the Sentinel-2A images, sharpening object boundaries in the imagery. Furthermore, with the uniform spatial resolution of fused Sentinel-2 images, the VNIR MS20 bands could be employed for geological information extraction by combining with MS10 and SWIR bands. Moreover, with the improvement of spatial resolution, the atmospheric correlation bands MS601 were added for iron-bearing minerals identification in this study.
The MV-fused Sentinel-2A MS images exhibits less spectral distortion than the fused version generated using current GS pansharpening image method, as illustrated in Table 2 and Figure 4. The correlation coefficients between Sentinel-2A data MS10 bands with other bands (except band 10) were listed in Table 4, which show significant linear dependence between MS10 bands and other bands (except band 12). In addition, the multiple correlation coefficients (MCC) are higher than other correlation coefficients, as displayed in Table 4. Therefore, the MV method based on multivariate analysis shows a better capability for Sentinel-2A data fusion than the GS method. In addition, according to Jing and Cheng [28], although the Sentinel-2A band 12 has relatively lower correlation coefficients with MS10 bands, the fused image obtained from MV method still show high consistency with reference data.

Table 4.
The linear correlation coefficients of Sentinel-2A MS10 bands with other bands.
The MV synthetic product obtained from the Sentinel-2 image has higher spatial resolution and spectral resolution than the original Sentinel-2 data, improving its capability for the recognition of iron-bearing minerals. As illustrated in previous studies [13,43] and Figure 2, iron-bearing minerals such as goethite, hematite and jarosite have absorption features within the 0.8–0.9 µm wavelength range, which are close to Sentinel-2 bands 8A and 9. The iron minerals also show a weak reflectance feature within the 0.7–0.8 µm wavelength range, which is near Sentinel-2 bands 6 and 7. Moreover, iron-bearing minerals’ apparent diagnostic absorption is near 0.43 μm, which is close to Sentinel-2 band 1. Hence, with the improvement of spatial and spectral resolutions by image pansharpening, it becomes possible for fused Sentinel-2 data to extract iron-bearing mineral distributions in the Cuprite area using band ratios band 6/band 8A, band 6/band 1 and (band 6 + band 7)/band 8A. Furthermore, the sensitivity of Sentinel-2 data for iron-bearing minerals was increased with substitution of NIR band 8A for band 8 based on the enhancement in spatial resolution of band 8A using MV-fused method.
As displayed in Figure 5, the distribution of iron-bearing minerals obtained from fused Sentinel-2 data is highly consistent with the ground truth provided by the United States Geological Survey (USGS). Since the diagnostic absorption of goethite (0.96 μm) is far away from the central wavelength of NIR band 8A (0.865 μm), band ratio 6/8A could detect hematite + jarosite from goethite well. However, due to their similar spectral features near 0.7 µm, the band ratio 6/8A of the fused Sentinel-2 image extracts the mixture of jarosite and hematite, and the band ratio 6/1 of the fused Sentinel-2 data extracts the mixture of hematite and goethite. Additionally, the fused Sentinel-2 data exhibits a weaker ability for iron-bearing minerals discrimination than the hyperspectral imagery of AVIRIS because of its limited spectral resolution in the VNIR and SWIR range. Moreover, the capability of Sentinel-2 for argillic alteration minerals, such as clays, micas, sulfates and carbonates, is limited because of the only two SWIR band in its band setting [12].
5. Conclusions
With the failure of the ASTER SWIR detectors in 2008 and inexistence of a space-borne hyperspectral system, it becomes essential to ensure data continuity for geological mapping. Thereby, in this paper, the MV method was applied to fuse the Sentinel-2 data for exploring the capability of Sentinel-2 image on iron-bearing minerals extraction in the Cuprite, Nevada. Based on the linear relationship between MS10 bands and other bands in the mulch-free area, the MV method exhibits better capability for Sentinel-2A multispectral data fusion than the common GS image pansharpening method.
With the unified spatial resolution of Sentinel-2 MS20 and MS60 bands with MS10 bands, the iron-bearing minerals including goethite + hematite and hematite + jarosite in the Cuprite area were extracted by band ratios 6/1 and 6/8A, respectively, showing high consistency with the reference map. Moreover, the mixture of iron-bearing minerals including jarosite, hematite and goethite was extracted by a band ratio (band 6 + band 7)/band 8A. Furthermore, according to the spectral features of iron-bearing minerals, the band ratios for ferric oxides and ferrous irons proposed by van der Meer et al. [8] were modified with substitution of narrow NIR band 8A for band 8, which also display higher correlation with those obtained from Landsat-8 OLI data. Results demonstrated that fused Sentinel-2 could be used for more accurate extraction of iron-bearing minerals because of its higher spatial and spectral resolutions.
Author Contributions
Conceptualization, W.G., Q.C. and L.J.; methodology, W.G., Q.C. and L.J.; validation, W.G., F.W. and M.Z.; formal analysis, W.G. and L.J.; investigation, W.G., M.Z. and H.D.; resources, Q.C. and L.J.; data curation, W.G. and M.Z.; writing—original draft preparation, W.G.; writing—review and editing, Q.C. and L.J.; visualization, W.G. and F.W.; supervision, Q.C. and L.J.; funding acquisition, W.G. and L.J. All authors have read and agreed to the published version of the manuscript.
Funding
This research was funded by the Doctoral Research Start-up fund of Northwest Agriculture and Forest University (No. Z1090219094), the Science and Technology Major Project of Xinjiang Uygur Autonomous Region (No. 2018A03004) and the National Natural Science Foundation of China (No. 41972308).
Acknowledgments
The authors are grateful to the United States Geological Survey (USGS) (https://glovis.usgs.gov/) and the European Space Agency (ESA) for providing research data, including OLI, Sentinel-2A data, and the reference map of the Cuprite, Nevada.
Conflicts of Interest
The authors declare no conflict of interest.
References
- Clevers, J.G.; Gitelson, A.A. Remote estimation of crop and grass chlorophyll and nitrogen content using red-edge bands on Sentinel-2 and-3. Int. J. Appl. Earth Obs. Geoinf. 2013, 23, 344–351. [Google Scholar]
- Delegido, J.; Verrelst, J.; Alonso, L.; Moreno, J. Evaluation of sentinel-2 red-edge bands for empirical estimation of green LAI and chlorophyll content. Sensors 2011, 11, 7063–7081. [Google Scholar] [CrossRef] [PubMed]
- Frampton, W.J.; Dash, J.; Watmough, G.; Milton, E.J. Evaluating the capabilities of Sentinel-2 for quantitative estimation of biophysical variables in vegetation. ISPRS J. Photogramm. Remote Sens. 2013, 82, 83–92. [Google Scholar]
- Verrelst, J.; Muñoz, J.; Alonso, L.; Delegido, J.; Rivera, J.P.; Camps-Valls, G.; Moreno, J. Machine learning regression algorithms for biophysical parameter retrieval: Opportunities for Sentinel-2 and-3. Remote Sens. Environ. 2012, 118, 127–139. [Google Scholar]
- Vrieling, A.; Meroni, M.; Darvishzadeh, R.; Skidmore, A.K.; Wang, T.; Zurita-Milla, R.; Oosterbeek, K.; O’Connor, B.; Paganini, M. Vegetation phenology from Sentinel-2 and field cameras for a Dutch barrier island. Remote Sens. Environ. 2018, 215, 517–529. [Google Scholar]
- Fernández-Manso, A.; Fernández-Manso, O.; Quintano, C. Sentinel-2A red-edge spectral indices suitability for discriminating burn severity. Int. J. Appl. Earth Obs. Geoinf. 2016, 50, 170–175. [Google Scholar]
- Huang, H.; Roy, D.P.; Boschetti, L.; Zhang, H.K.; Yan, L.; Kumar, S.S.; Gomez-Dans, J.; Li, J. Separability analysis of Sentinel-2A Multi-Spectral Instrument (MSI) data for burned area discrimination. Remote Sens. 2016, 8, 873. [Google Scholar]
- Quintano, C.; Fernández-Manso, A.; Fernández-Manso, O. Combination of Landsat and Sentinel-2 MSI data for initial assessing of burn severity. Int. J. Appl. Earth Obs. Geoinf. 2018, 64, 221–225. [Google Scholar]
- Thanh Noi, P.; Kappas, M. Comparison of random forest, k-nearest neighbor, and support vector machine classifiers for land cover classification using Sentinel-2 imagery. Sensors 2018, 18, 18. [Google Scholar] [CrossRef]
- Griffiths, P.; Nendel, C.; Hostert, P. Intra-annual reflectance composites from Sentinel-2 and Landsat for national-scale crop and land cover mapping. Remote Sens. Environ. 2019, 220, 135–151. [Google Scholar]
- Ge, W.; Cheng, Q.; Tang, Y.; Jing, L.; Gao, C. Lithological classification using sentinel-2A data in the Shibanjing ophiolite complex in inner Mongolia, China. Remote Sens. 2018, 10, 638. [Google Scholar] [CrossRef]
- Van der Meer, F.; van der Werff, H.; van Ruitenbeek, F. Potential of ESA’s Sentinel-2 for geological applications. Remote Sens. Environ. 2014, 148, 124–133. [Google Scholar] [CrossRef]
- Van der Werff, H.; van der Meer, F. Sentinel-2 for mapping iron absorption feature parameters. Remote Sens. 2015, 7, 12635–12653. [Google Scholar] [CrossRef]
- Drusch, M.; Del Bello, U.; Carlier, S.; Colin, O.; Fernandez, V.; Gascon, F.; Hoersch, B.; Isola, C.; Laberinti, P.; Martimort, P. Sentinel-2: ESA’s optical high-resolution mission for GMES operational services. Remote Sens. Environ. 2012, 120, 25–36. [Google Scholar] [CrossRef]
- Navarro, G.; Caballero, I.; Silva, G.; Parra, P.-C.; Vázquez, Á.; Caldeira, R. Evaluation of forest fire on Madeira Island using Sentinel-2A MSI imagery. Int. J. Appl. Earth Obs. Geoinf. 2017, 58, 97–106. [Google Scholar] [CrossRef]
- Bishop, J.L.; Murad, E. The visible and infrared spectral properties of jarosite and alunite. Am. Mineral. 2005, 90, 1100–1107. [Google Scholar] [CrossRef]
- Hunt, G.R.; Ashley, R.P. Spectra of altered rocks in the visible and near infrared. Econ. Geol. 1979, 74, 1613–1629. [Google Scholar] [CrossRef]
- Mielke, C.; Boesche, N.K.; Rogass, C.; Kaufmann, H.; Gauert, C.; De Wit, M. Spaceborne mine waste mineralogy monitoring in South Africa, applications for modern push-broom missions: Hyperion/OLI and EnMAP/Sentinel-2. Remote Sens. 2014, 6, 6790–6816. [Google Scholar] [CrossRef]
- Hu, B.; Xu, Y.; Wan, B.; Wu, X.; Yi, G. Hydrothermally altered mineral mapping using synthetic application of Sentinel-2A MSI, ASTER and Hyperion data in the Duolong area, Tibetan Plateau, China. Ore Geol. Rev. 2018, 101, 384–397. [Google Scholar] [CrossRef]
- Li, H.; Jing, L.; Tang, Y. Assessment of pansharpening methods applied to WorldView-2 imagery fusion. Sensors 2017, 17, 89. [Google Scholar] [CrossRef]
- Vivone, G.; Alparone, L.; Chanussot, J.; Dalla Mura, M.; Garzelli, A.; Licciardi, G.A.; Restaino, R.; Wald, L. A critical comparison among pansharpening algorithms. IEEE Trans. Geosci. Remote Sens. 2014, 53, 2565–2586. [Google Scholar] [CrossRef]
- Wang, Q.; Shi, W.; Li, Z.; Atkinson, P.M. Fusion of Sentinel-2 images. Remote Sens. Environ. 2016, 187, 241–252. [Google Scholar] [CrossRef]
- Du, Y.; Zhang, Y.; Ling, F.; Wang, Q.; Li, W.; Li, X. Water bodies’ mapping from Sentinel-2 imagery with modified normalized difference water index at 10-m spatial resolution produced by sharpening the SWIR band. Remote Sens. 2016, 8, 354. [Google Scholar] [CrossRef]
- Vaiopoulos, A.; Karantzalos, K. Pansharpening on the narrow VNIR and SWIR spectral bands of Sentinel-2. Int. Arch. Photogramm. Remote Sens. Spat. Inf. Sci. 2016, 41, 723–730. [Google Scholar] [CrossRef]
- Park, H.; Choi, J.; Park, N.; Choi, S. Sharpening the VNIR and SWIR bands of Sentinel-2A imagery through modified selected and synthesized band schemes. Remote Sens. 2017, 9, 1080. [Google Scholar] [CrossRef]
- Gašparović, M.; Jogun, T. The effect of fusing Sentinel-2 bands on land-cover classification. Int. J. Remote Sens. 2018, 39, 822–841. [Google Scholar] [CrossRef]
- Zheng, H.; Du, P.; Chen, J.; Xia, J.; Li, E.; Xu, Z.; Li, X.; Yokoya, N. Performance evaluation of downscaling Sentinel-2 imagery for land use and land cover classification by spectral-spatial features. Remote Sens. 2017, 9, 1274. [Google Scholar] [CrossRef]
- Jing, L.; Cheng, Q. A technique based on non-linear transform and multivariate analysis to merge thermal infrared data and higher-resolution multispectral data. Int. J. Remote Sens. 2010, 31, 6459–6471. [Google Scholar] [CrossRef]
- ESA. Sentinel-2 User Handbook; ESA: Paris, France, 2015. Available online: https://sentinel.esa.int/documents/247904/685211/Sentinel-2_User_Handbook (accessed on 11 September 2020).
- Clerc, S.; MPC Team. Sentinel-2 Data Quality Report; Report Issue 55; ESA-CS, France. Available online: https://sentinel.esa.int/documents/247904/685211/Sentinel-2_L1C_Data_Quality_Report (accessed on 11 September 2020).
- Laben, C.A.; Brower, B.V. Process for Enhancing the Spatial Resolution of Multispectral Imagery Using Pan-Sharpening. U.S. Patent 6,011,875, 4 January 2000. [Google Scholar]
- Aiazzi, B.; Baronti, S.; Selva, M.; Alparone, L. Enhanced Gram-Schmidt spectral sharpening based on multivariate regression of MS and Pan data. In Proceedings of the 2006 IEEE International Symposium on Geoscience and Remote Sensing Symposium, Denver, CO, USA, 31 July–4 August 2006; pp. 3806–3809. [Google Scholar]
- Klonus, S.; Ehlers, M. Performance of evaluation methods in image fusion. In Proceedings of the 12th International Conference on Information Fusion, Seattle, WA, USA, 6–9 July 2009; IEEE: Piscataway, NJ, USA, 2009; pp. 1409–1416. [Google Scholar]
- Li, C.; Liu, L.; Wang, J.; Zhao, C.; Wang, R. Comparison of two methods of the fusion of remote sensing images with fidelity of spectral information. In Proceedings of the IEEE International Geoscience and Remote Sensing Symposium, Anchorage, AK, USA, 20–24 September 2004; pp. 2561–2564. [Google Scholar]
- Alparone, L.; Baronti, S.; Garzelli, A.; Nencini, F. A global quality measurement of pan-sharpened multispectral imagery. IEEE Geosci. Remote Sens. Lett. 2004, 1, 313–317. [Google Scholar] [CrossRef]
- Chavez, P.; Sides, S.C.; Anderson, J.A. Comparison of three different methods to merge multiresolution and multispectral data- Landsat TM and SPOT panchromatic. Photogramm. Eng. Remote Sens. 1991, 57, 295–303. [Google Scholar]
- Shi, W.; Zhu, C.; Zhu, C.; Yang, X. Multi-band wavelet for fusing SPOT panchromatic and multispectral images. Photogramm. Eng. Remote Sens. 2003, 69, 513–520. [Google Scholar]
- Yuhas, R.H.; Goetz, A.F.; Boardman, J.W. Discrimination Among Semi-Arid Landscape Endmembers Using the Spectral Angle Mapper (SAM) Algorithm. In Summaries of the 4th JPL Airborne Earth Science Workshop; JPL Publication, Summaries of the Third Annual JPL Airborne Geoscience Workshop; NASA: Washington, DC, USA, 1992; pp. 147–149. [Google Scholar]
- Wald, L. Data Fusion: Definitions and Architectures–Fusion of Images of Different Spatial Resolutions; Presses des Mines: Paris, France, 2002. [Google Scholar]
- Wang, Z.; Bovik, A.C. A universal image quality index. IEEE Signal Process. Lett. 2002, 9, 81–84. [Google Scholar] [CrossRef]
- Wei, Q.; Bioucas-Dias, J.; Dobigeon, N.; Tourneret, J.-Y. Hyperspectral and multispectral image fusion based on a sparse representation. IEEE Trans. Geosci. Remote Sens. 2015, 53, 3658–3668. [Google Scholar] [CrossRef]
- Mahyari, A.G.; Yazdi, M. Panchromatic and multispectral image fusion based on maximization of both spectral and spatial similarities. IEEE Trans. Geosci. Remote Sens. 2011, 49, 1976–1985. [Google Scholar] [CrossRef]
- Swayze, G.A.; Clark, R.N.; Goetz, A.F.; Livo, K.E.; Breit, G.N.; Kruse, F.A.; Sutley, S.J.; Snee, L.W.; Lowers, H.A.; Post, J.L. Mapping advanced argillic alteration at Cuprite, Nevada, using imaging spectroscopy. Econ. Geol. 2014, 109, 1179–1221. [Google Scholar] [CrossRef]
- Crowley, J.; Williams, D.; Hammarstrom, J.; Piatak, N.; Chou, I.-M.; Mars, J. Spectral reflectance properties (0.4–2.5 μm) of secondary Fe-oxide, Fe-hydroxide, and Fe-sulphate-hydrate minerals associated with sulphide-bearing mine wastes. Geochem. Explor. Environ. Anal. 2003, 3, 219–228. [Google Scholar] [CrossRef]
- Rowan, L.C.; Wetlaufer, P.H.; Goetz, A.F.; Stewart, J. Discrimination of rock types and detection of hydrothermally altered areas in south-central Nevada by the use of computer-enhanced ERTS images. Geol. Surv. Prof. Pap. 1976, 883, 35. [Google Scholar]
- Kruse, F.; Kierein-Young, K.; Boardman, J. Mineral mapping at Cuprite, Nevada with a 63-channel imaging spectrometer. Photogramm. Eng. Remote Sens. 1990, 56, 83–92. [Google Scholar]
- Kruse, F.A. Mineral mapping with AVIRIS and EO-1 Hyperion. In Proceedings of the 12th JPL Airborne Geoscience Workshop, Pasadena, CA, USA, 24–28 January 2003; Jet Propulsion Laboratory: Pasadena, CA, USA, 2003; Volume 41, pp. 149–156. [Google Scholar]
- Mars, J.C.; Rowan, L.C. Spectral assessment of new ASTER SWIR surface reflectance data products for spectroscopic mapping of rocks and minerals. Remote Sens. Environ. 2010, 114, 2011–2025. [Google Scholar] [CrossRef]
- Kruse, F.A.; Perry, S.L. Mineral mapping using simulated Worldview-3 short-wave-infrared imagery. Remote Sens. 2013, 5, 2688–2703. [Google Scholar] [CrossRef]
- Ashley, R.P. Alteration mapping Using Multispectral Images-Cuprite Mining Districts, Esmeralda County, Nevada. US Geol. Surv. Open File Rep. 1980, 80–367. [Google Scholar]
- Van der Werff, H.; van der Meer, F. Sentinel-2A MSI and Landsat 8 OLI provide data continuity for geological remote sensing. Remote Sens. 2016, 8, 883. [Google Scholar] [CrossRef]
- Zhang, H.K.; Roy, D.P.; Yan, L.; Li, Z.; Huang, H.; Vermote, E.; Skakun, S.; Roger, J.-C. Characterization of Sentinel-2A and Landsat-8 top of atmosphere, surface, and nadir BRDF adjusted reflectance and NDVI differences. Remote Sens. Environ. 2018, 215, 482–494. [Google Scholar] [CrossRef]
- Ibrahim, E.; Barnabé, P.; Ramanaidou, E.; Pirard, E. Mapping mineral chemistry of a lateritic outcrop in new Caledonia through generalized regression using Sentinel-2 and field reflectance spectra. Int. J. Appl. Earth Obs. Geoinf. 2018, 73, 653–665. [Google Scholar] [CrossRef]
- Sabins, F.F. Remote sensing for mineral exploration. Ore Geol. Rev. 1999, 14, 157–183. [Google Scholar] [CrossRef]
- Kalinowski, A.; Oliver, S. ASTER mineral index processing manual. Remote Sens. Appl. Geosci. Aust. 2004, 37, 36. [Google Scholar]
© 2020 by the authors. Licensee MDPI, Basel, Switzerland. This article is an open access article distributed under the terms and conditions of the Creative Commons Attribution (CC BY) license (http://creativecommons.org/licenses/by/4.0/).