4.1. Examination of Rainfall Daily Estimates
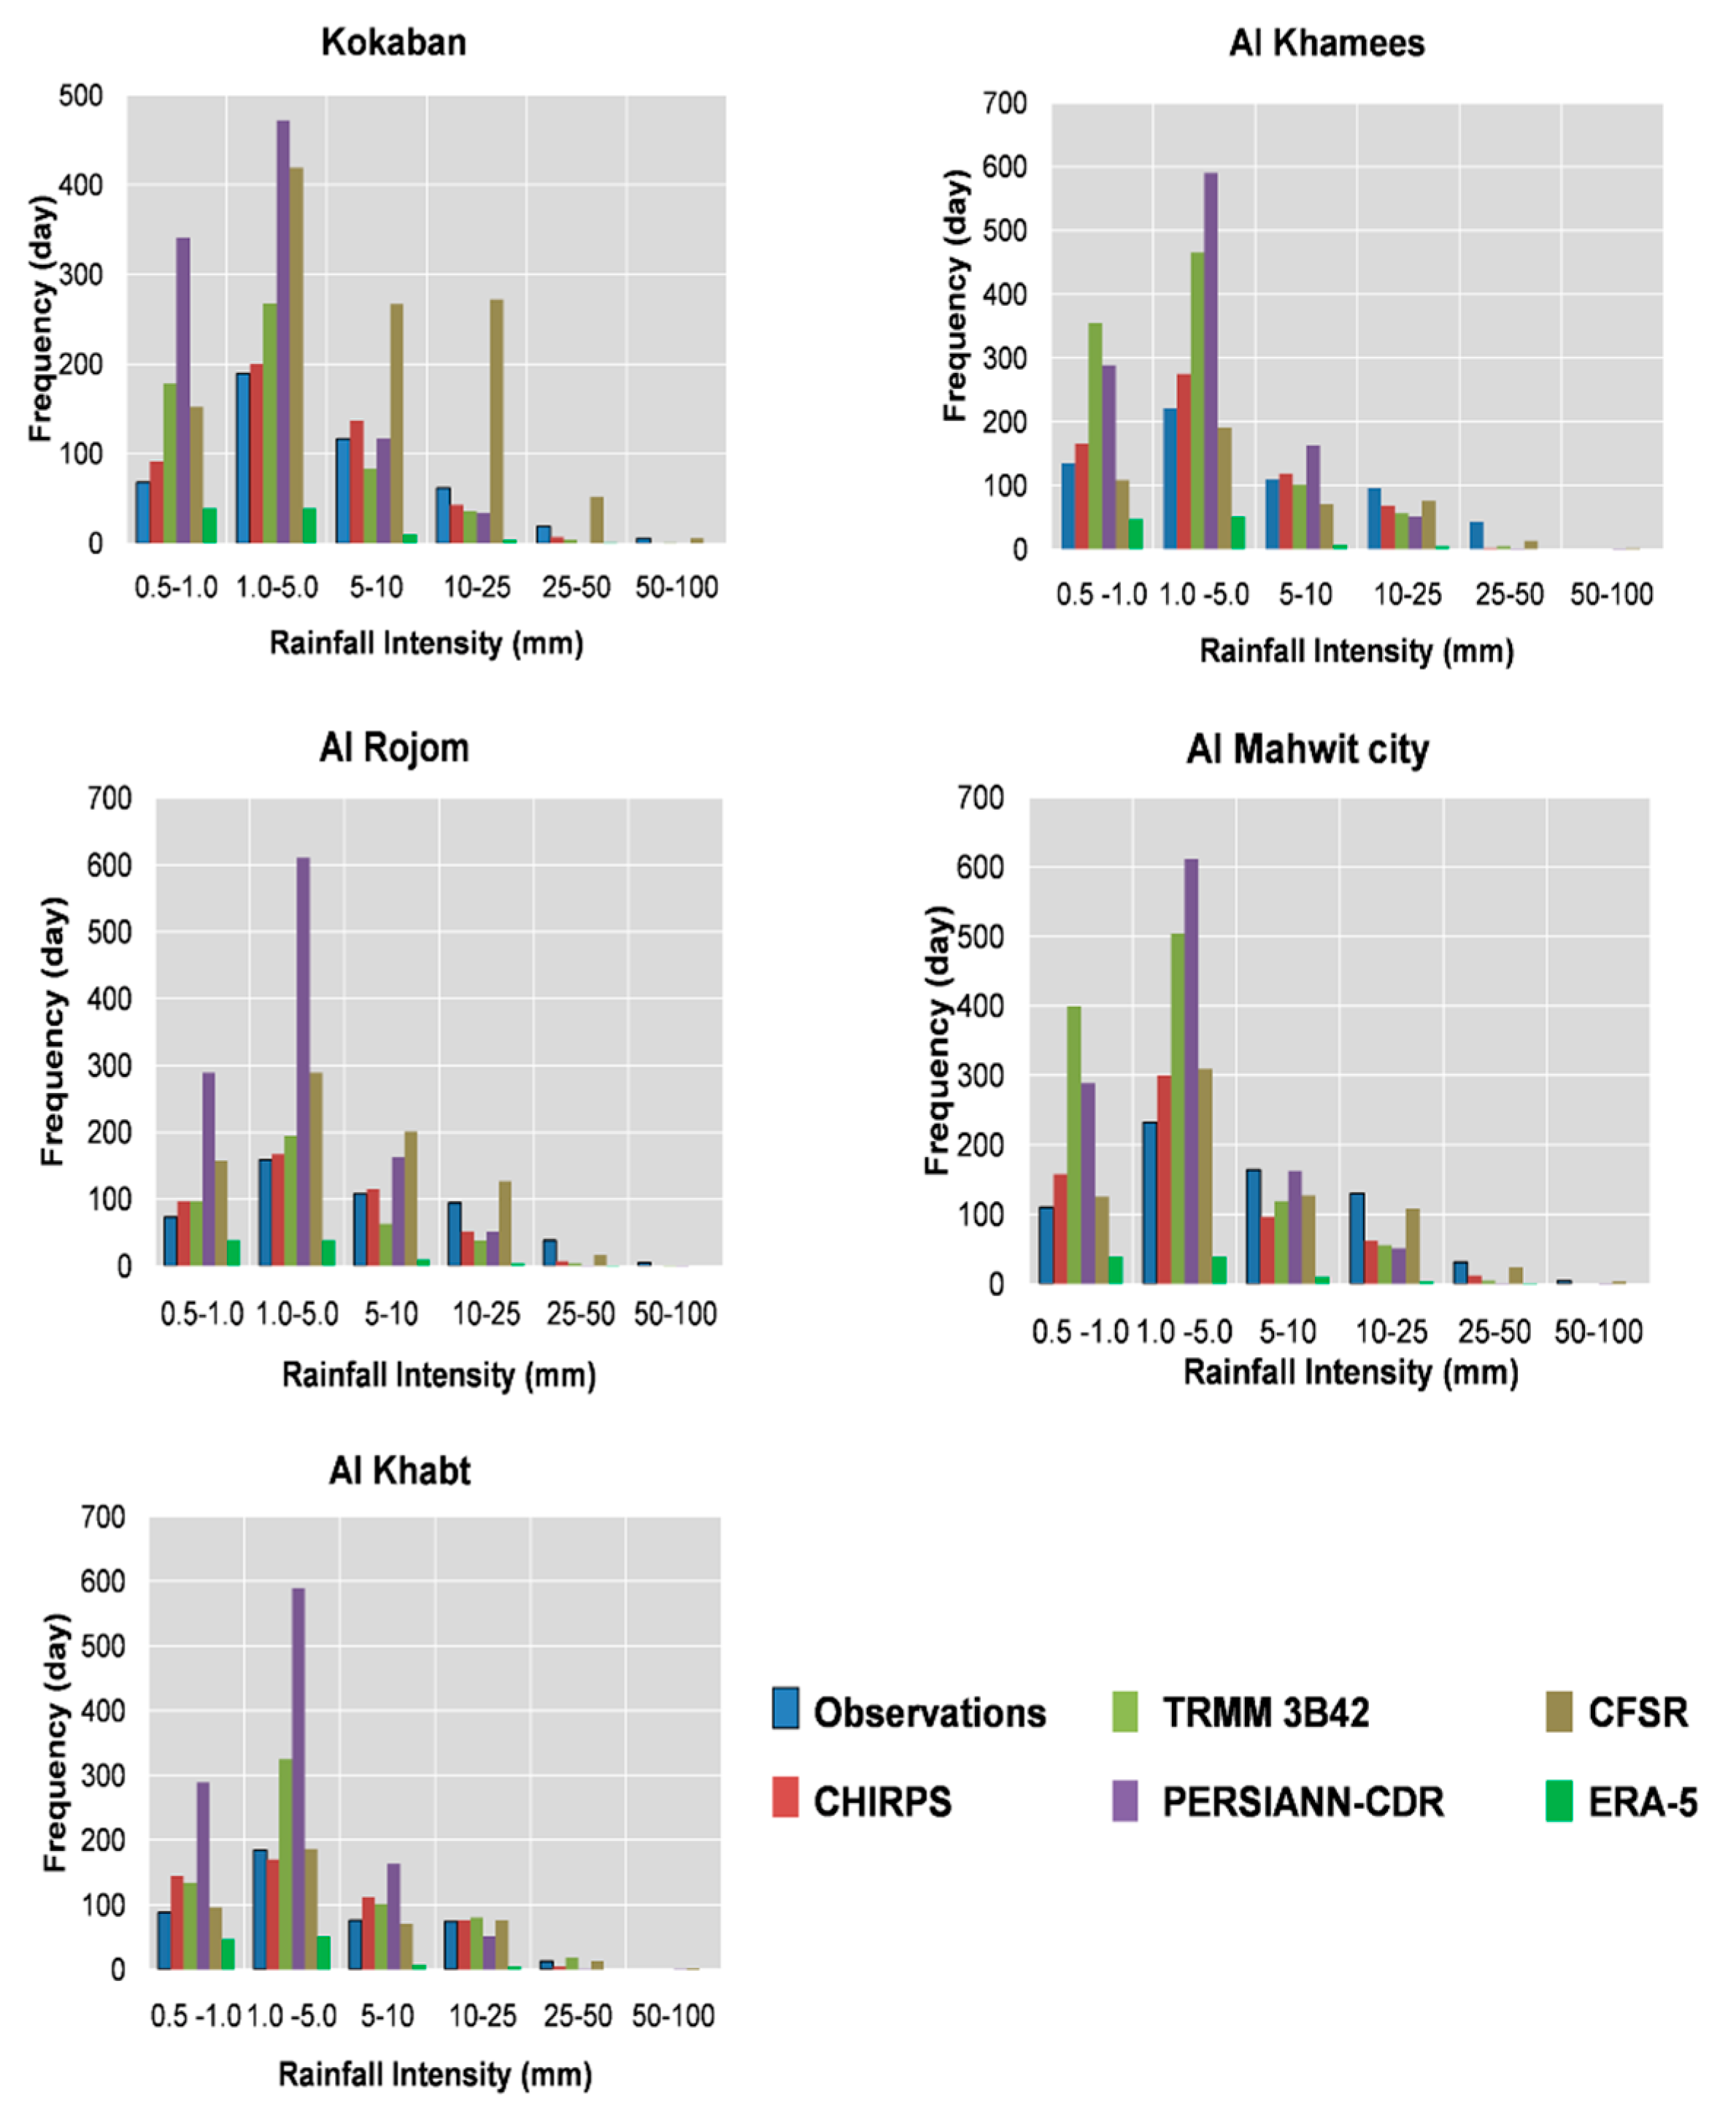
Several histograms are constructed to exhibit the number of wet days and the intensity of rainfall by the different precipitation products over the period 1998–2007. Based on ground stations, the highest rainfall rate at a daily scale is 100 mm, and the lowest is 0.5 mm day−1. Therefore, the histograms plots are built within this limit to compare between gridded products and ground observations with a threshold of 0.5 mm day−1. Days lower than 0.5 mm were excluded from this comparison. Starting with 0.5 mm threshold, the precipitation products are examined from an equal basis point and discrepancy and variance between precipitation products is reduced, especially with the existence and repetition of small rainfall events between 0–0.5 mm, in all precipitation products.
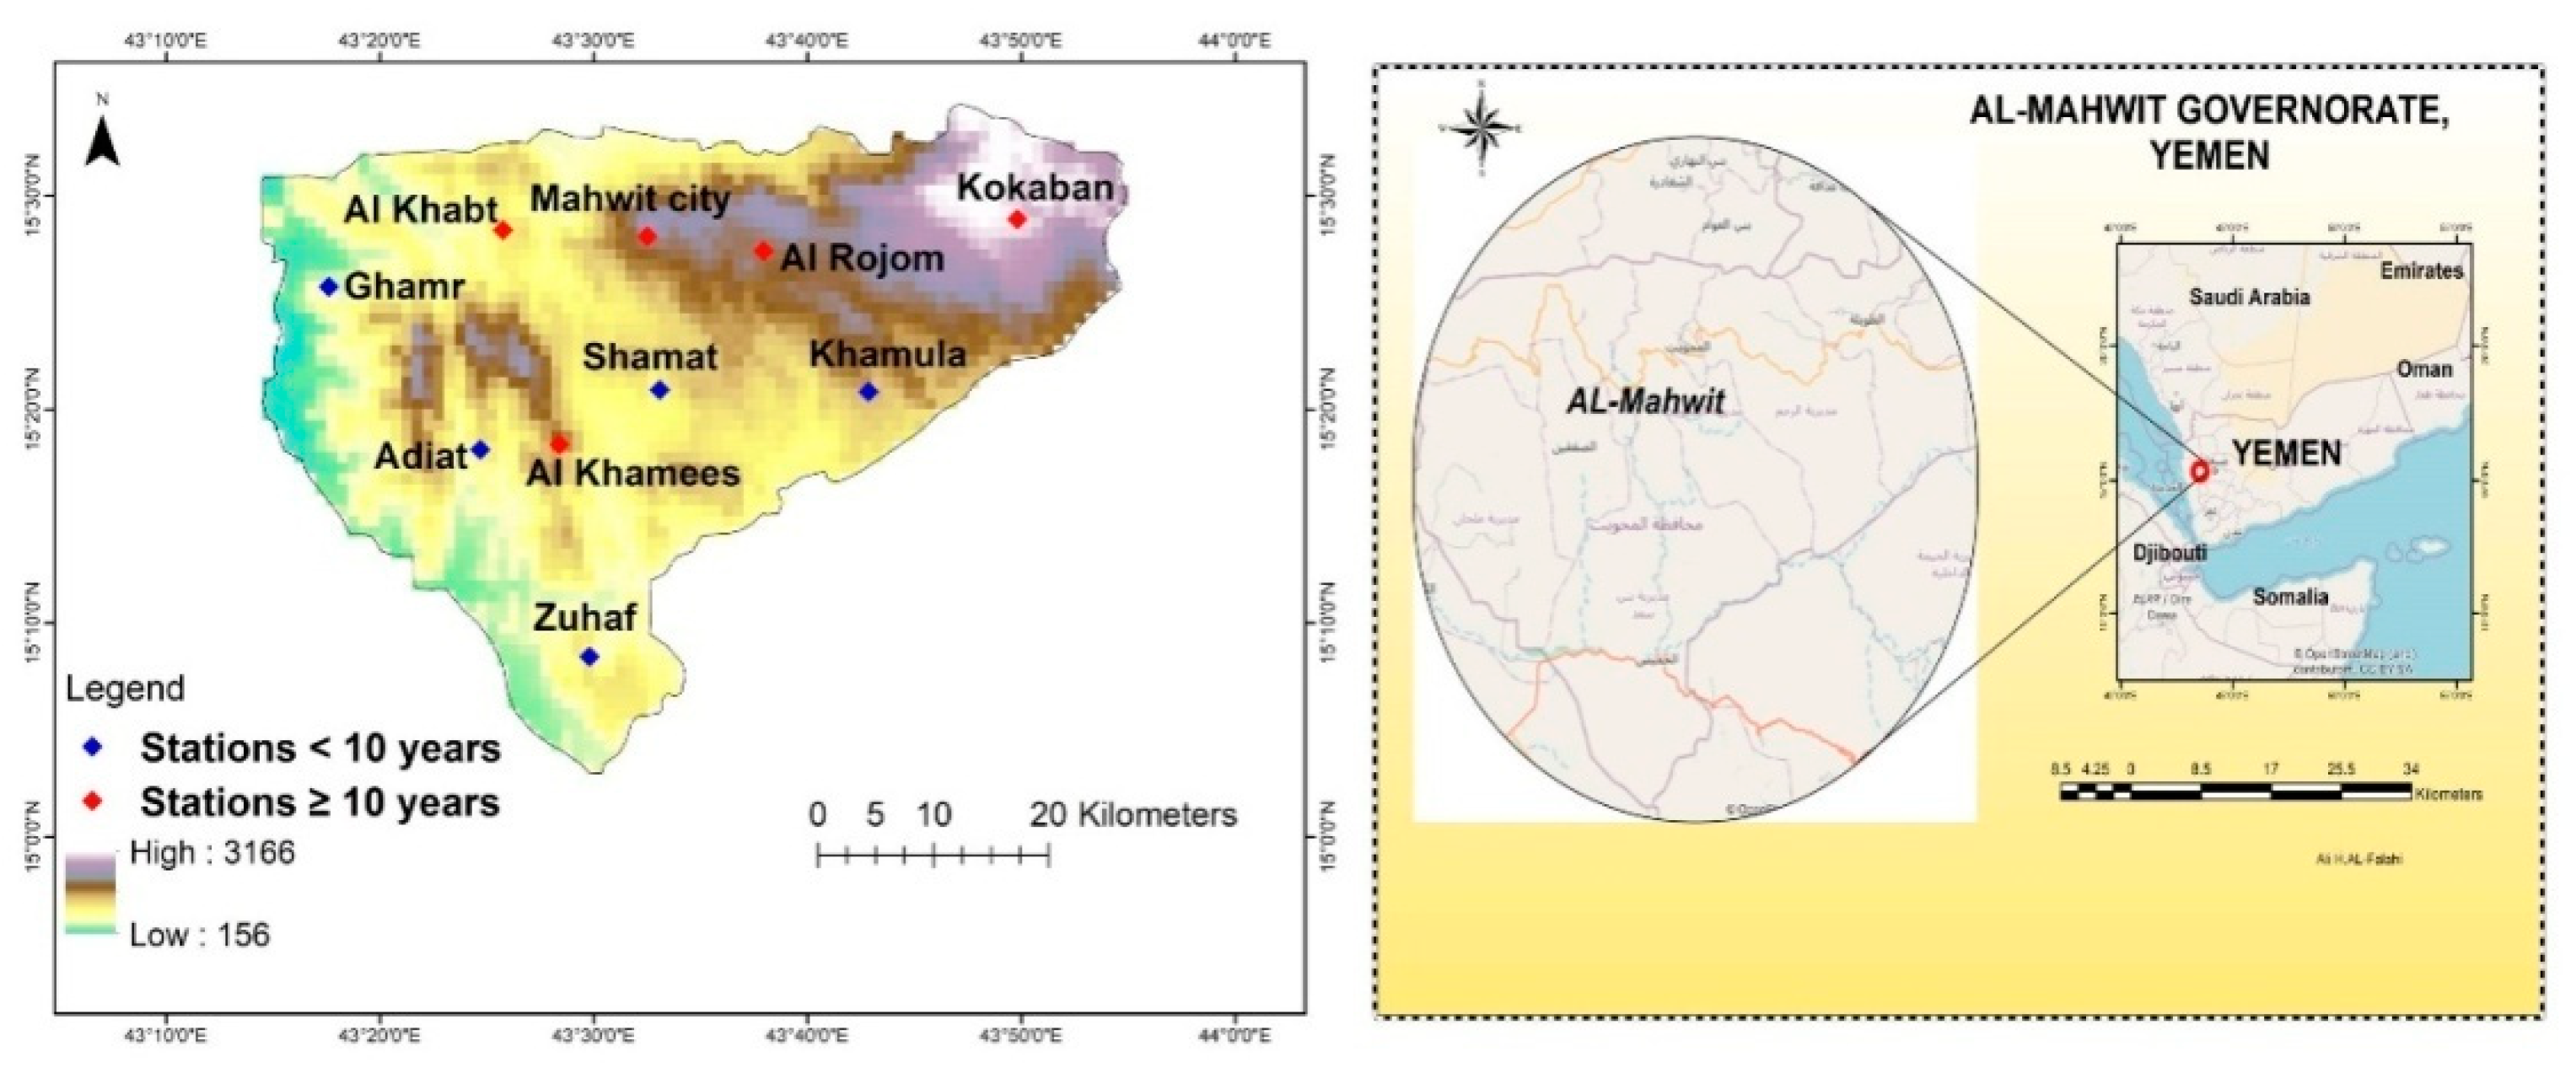
For the Kokaban station, which is located in the high altitude area within Al Mahwit (2650 m above sea level), CFSR and PERSIANN-CDR produce a higher number of wet days compared to observations. According to CFSR and PERSIANN-CDR, the total number of wet days are 1168 and 964, respectively, while observations only showed 471 days in the study area. Therefore, both products (PERSIANN-CDR and CFSR) overestimate wet events, particularly the light rainfall (<5 mm), which occurred more frequently. In addition, high estimation of wet events are also found for the Al Rojom, and Al Mahwit city stations, which are located in the high complex mountainous territories within Al Mahwit. In low areas of Al Mahwit (Al Khamees and Al Khabt stations), performance of CFSR is better in reproducing wet days than in the high complex areas. The deviation of wet days between CFSR and ground stations in Al Khamees and Al Khabt is −18.4 and −4.7%, respectively. This may reveal the good performance of CFSR reanalysis in low areas rather than in high and complex mountainous areas. On the other hand, the average deviation between TRMM 3B42 and observations is around 14% in the high areas (Kokaban, Al Mahwit city, Al Rojom) compared to 45% in the low areas (Al Khamees, and Al Khabt). TRMM 3B42 might be better to produce good estimates of wet durations in high complex mountainous areas rather than in low areas. ERA-5 reanalysis product demonstrates a lower number of wet days in all stations with average deviation from observation around −81.13%. The closest product to reproduce the exact and close wet durations is CHIRPS. In the complex high areas (Kokaban, Al Rojom, Mahwit city), CHIRPS’ average difference of wet days from ground stations is around 6.7%, while in Al Khamees and Al Khabt the deviation is 9.2 and 11.5%.
Figure 2 shows the occurrence of wet days by the different precipitation products.
In addition to counting wet days, quantitative statistical analysis such as skewness, standard deviation, mean, and variance between the precipitation products and ground observations are performed. Higher mean and standard deviation are observed on the ground observations, almost in all stations, while examined products skewed towards low precipitation and lower standard deviation (
Table 4). However, CFSR shows higher standard deviation. The average of maximum daily rainfall produced by the ground observations is around 61 mm day
−1. This rate of rainfall is underestimated by the precipitation products, except CFSR which, in fact, overestimated precipitation rates in all stations.
Categorical statistics of the daily precipitation data are shown in
Table 5. The value of Probability of Detection (POD), which is close to 1, proves high accuracy, while False Alarm Ratio (FAR) values are better if they are close to 0. As seen in
Table 5, CHIRPS has higher average of POD with value around 0.77, while the FAR is 0.36. The average value of POD and FAR by PERSIANN-CDR is 0.71 and 0.68. POD average value by TRMM 3B42 is 0.52, while its average value of FAR is 0.71. Average values of POD and FAR by CFSR and ERA-5 are 0.48, 0.77 and 0.09, 0.76, respectively. However, we found that the ability of the different products to reflect POD is not influenced by elevation. This result is consistent with findings on different topographic conditions in Mexico [
69], but does not agree with the same study in terms of FAR, which shows no tendency to decrease in low elevation areas.
Overall, none of the investigated products (satellite, reanalysis, gauge-based) fully reflects variability of rainfall rates in the study area. Heavy rainfall events are underestimated or totally missed, and rainfall events >25 mm day−1 are rarely captured by the precipitation products. Furthermore, the number of low rainfall events is repeated and frequently reported by the products. Therefore, no attempts were made to investigate extreme events, especially under the short period of observation that constrains visibility of extremes in the study area.
4.2. Monthly Evaluation
The agreement between the different rainfall products and observations is examined using a set of commonly used statistical estimators, including correlation coefficient (r), bias (BIAS) and root-mean-square error (RMSE) (method details are discussed in
Section 3.2). Monthly total rainfall by each product is compared to observations in each individual ground station over the period 1998–2007. The result shows that CHIRPS is the most accurate rainfall product with high correlation and low bias and error. TRMM 3B42 is the second-best product. CFSR, ERA-5 reanalysis, PERSIANN-CDR, and CPC show lower correlation with higher error and bias. The highest correlation of CHIRPS with station data is found in Al Khamees district (r = 0.98) followed by Rojom (r = 0.87). In Kokaban, Mahwit city, and Khabt stations, CHIRPS shows correlation 0.75, 0.74, and 0.65, respectively.
In the high altitude areas, TRMM 3B42 shows an average correlation of around 0.58, while in the low land areas (Al Khamees, and Al Khabt), the average correlation between TRMM 3B42 and ground data is 0.54. In high mountainous areas, CFSR, PERSIANN-CDR, ERA-5, and CPC show an average correlation of 0.46, 0.55, 0.23, and 0.28, respectively, while in the low areas, the correlation of CFSR with observation increased to around 0.61. However, CPC and ERA-5 show a low correlation with observed data.
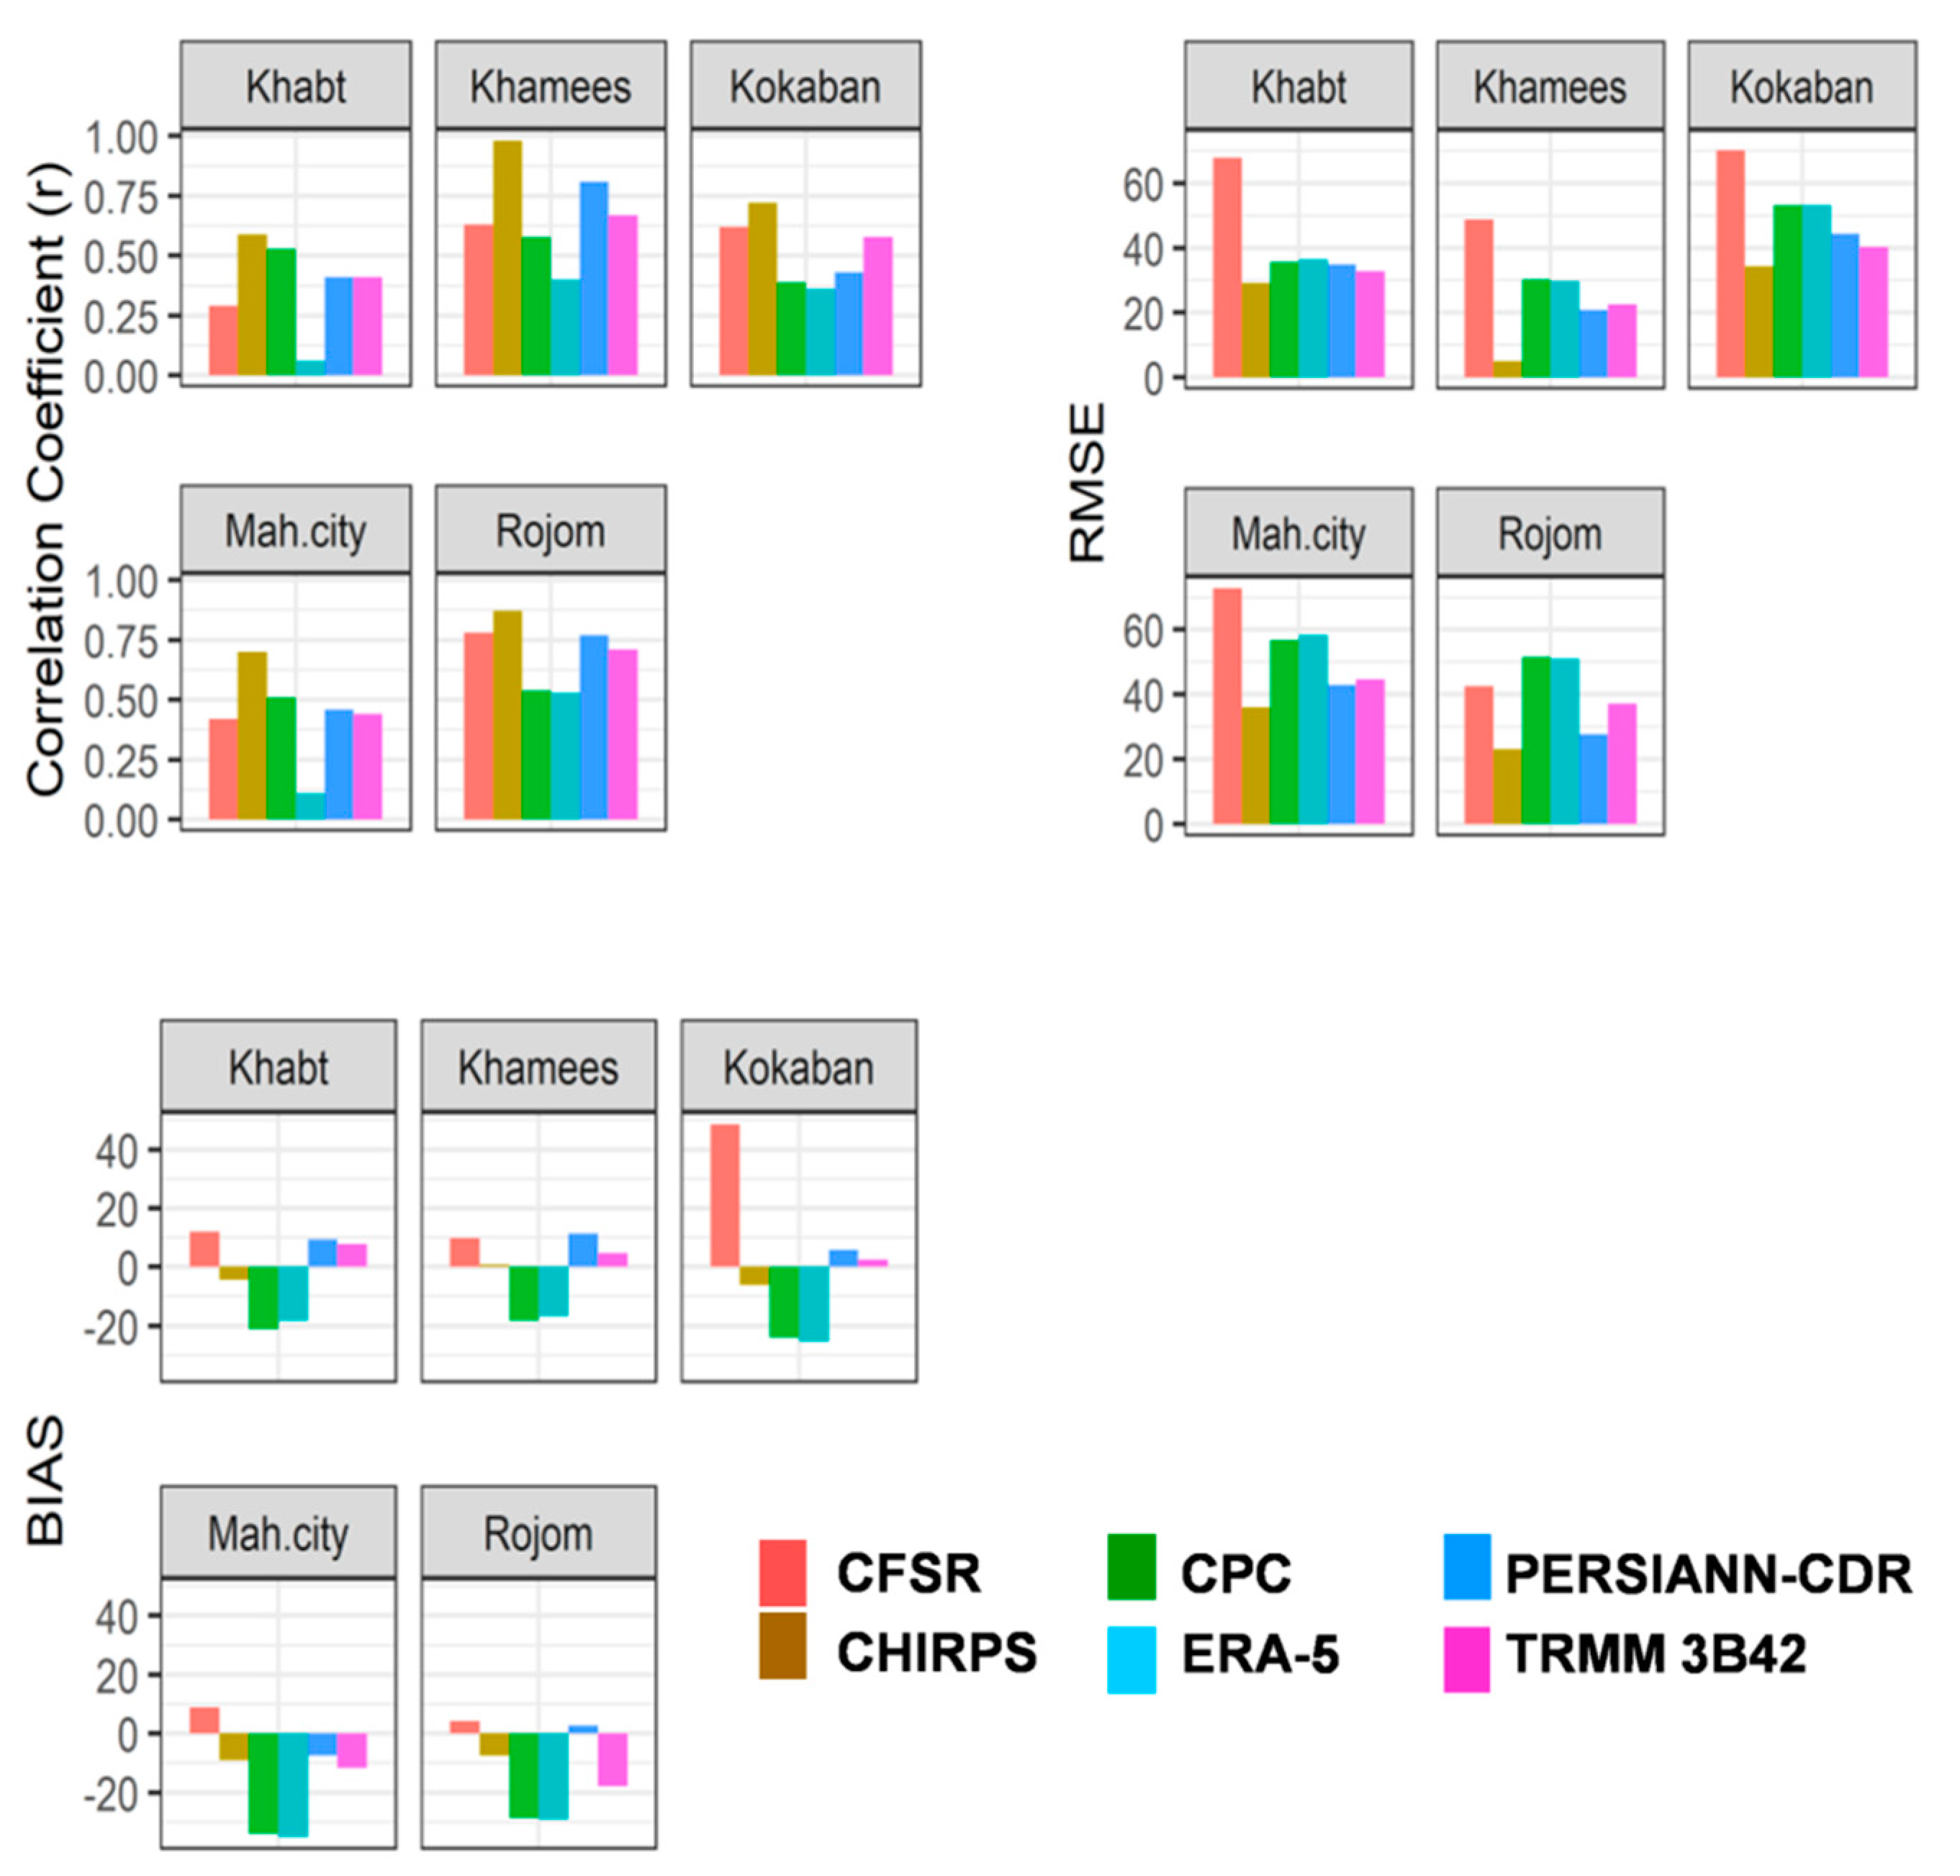
Among examined datasets, CFSR shows the highest root-mean-square error (RMSE), especially in Kokaban with value around 70.0 mm, and Mahwit city at 73.0 mm. PERSIANN-CDR, ERA-5, and CPC are the second products showing high RMSE, with values around 44.0, 53.0 and 52.0 mm, respectively. In the mountainous areas, specifically in Kokaban, CFSR and PERSIANN-CDR tend to produce more estimates of rain than real observations, while ERA-5 and CPC underestimate real precipitation events. The highest bias between precipitation products and observations is found with CFSR, followed by CPC and ERA-5 (
Figure 3). CFSR shows the highest bias in Kokaban, with value around 49.0 mm. However, the average bias of CFSR over the study area is 16.68 mm, while ERA-5 and CPC showed a monthly average bias of −24.96 and −25.29 mm, respectively. Moreover, the average bias of PERSIANN-CDR, TRMM 3B42, and CHIRPS is around 7.35, −2.9, and −5.24 mm, respectively.
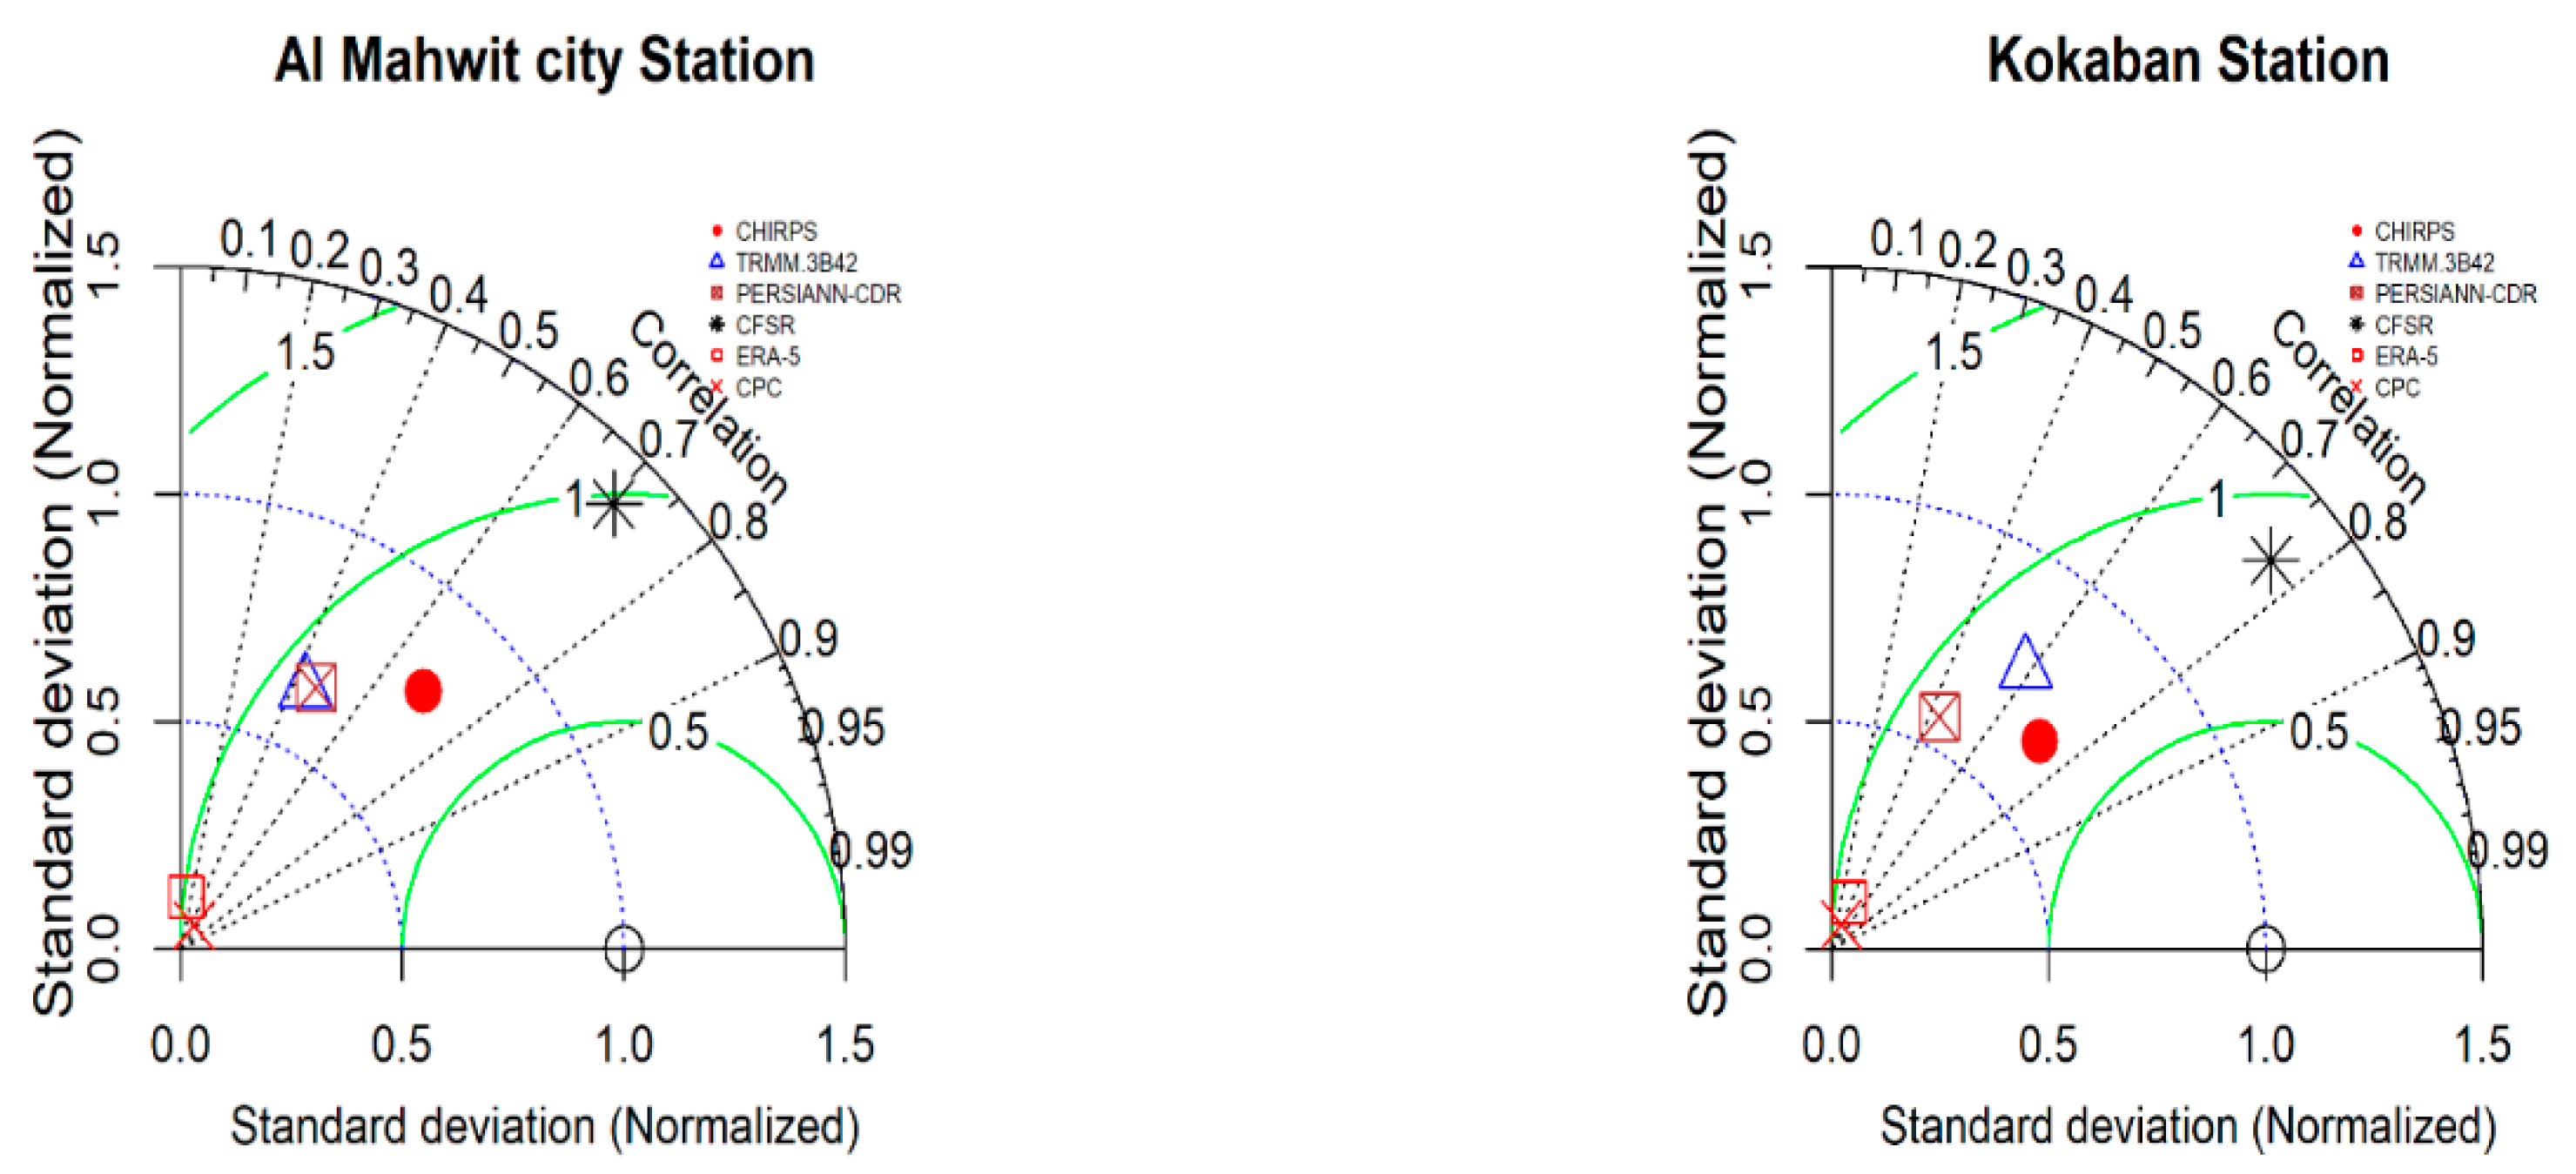
Moreover, the monthly values are plotted in a Taylor diagram (
Figure 4). In general, CHIRPS correlates well in all stations with lower standard deviation in high mountainous areas and a slightly higher standard deviation in the low areas (Al Khamees and Al Khabt). For the Kokaban station, CHIRPS correlation is around 0.75 with a standard deviation of about 0.25, which is lower than the normalized standard deviation. In Al Rojom and Mahwit city, CHIRPS shows a high correlation of 0.87 and 0.72, respectively. The standard deviation of CHIRPS in Al Rojom and Al Mahwit city is lower than the observed. This may due to misrepresentation of heavy rain events by CHIRPS, which affects the standard deviation. In the low areas (Al Khamees and Al Khabt stations), the standard deviation of CHIRPS is higher than the normalized standard deviation by around 0.15. Overall, the average correlation of CHIRPS over the study area is around 0.78.
TRMM 3B42 shows good correlation with observations and seen to be the second-best product after CHIRPS. The correlation coefficient of TRMM 3B42 is around 0.57 in the highland areas and around 0.54 in the low areas, while its standard deviation tends to decrease in the high areas compared to low areas. Again, this is due to underestimation and its capability for capturing high rainfall events compared to ground observations. PERSIANN-CDR shows rather good correlation with the ground dataset of Al Rojom and Al Khamees stations with 0.75 and 0.81, respectively.
However, in the other three stations (Kokaban, Mahwit city, and Al Khabt); PERSIANN-CDR demonstrates low correlation owing to the higher estimation of total monthly precipitation rates by this product in the study area. CFSR shows high standard deviation. CFSR, on the other hand, overestimates monthly rainfall rates in all stations, with many more estimates for the Kokaban station. Over the study area, the monthly correlation average of CFSR is about 0.51. CPC and ERA-5 show a weak correlation and very low standard deviation when compared to the observed data (
Figure 4). This is due to the low estimates of precipitation rates in this area by both products.
The average correlation of TRMM 3B42 in the five stations is around 0.56. PERSIANN-CDR, CFSR, ERA-5, and CPC show an average correlation 0.53, 0.51, 0.20, 0.15, respectively. The root-mean-square error average (RMSE) is found to be higher by CFSR especially for the Kokaban station, with values around 69.6 mm and bias of 50.2 mm. In Kokaban, CFSR is producing high estimates of rainfall compared to real observations. In general, the average RMSE in all stations by CHIRPS, TRMM 3B42, PERSIANN-CDR, CFSR, ERA-5, and CPC is found to be 25.5, 35.5, 34.2, 60.4, 45.7, and 45.5 mm, respectively. (
Table 6)
The average of monthly total rainfall rates of the precipitation products over the study area is used to calculate the percentage difference between each product and the observations. The results show that the percentage difference between PERSIANN-CDR and CFSR from observations is 46.5 and 81.25%, respectively. Similarly, ERA-5 and CPC show a difference of around −158.2 and −148.2% from observation, whereas the difference between CHIRPS and TRMM 3B42 with observed data is −24.07 and 32.32%, respectively (
Figure 5).
Further, to make the study as comprehensive as possible, additional monthly rainfall data from 14 stations around the study area are used. The additional data are particularly used to verify the performance of the highest correlated products (i.e., CHIRPS). As this additional dataset is temporally limited, compared to daily stations used in this study, the comparison was only done with CHIRPS. Similar to the daily comparison, the result shows a high correlation and low bias of CHIRPS (
Table 7) for all 14 stations. On average, the correlation coefficient (CC), Bias, and RMSE are 0.88, 2.905 mm, and 40.1 mm, respectively. Overall, the findings are similar to the daily evaluation, which shows a high correlation to CHIRPS.
4.3. Annual Timescale Evaluation
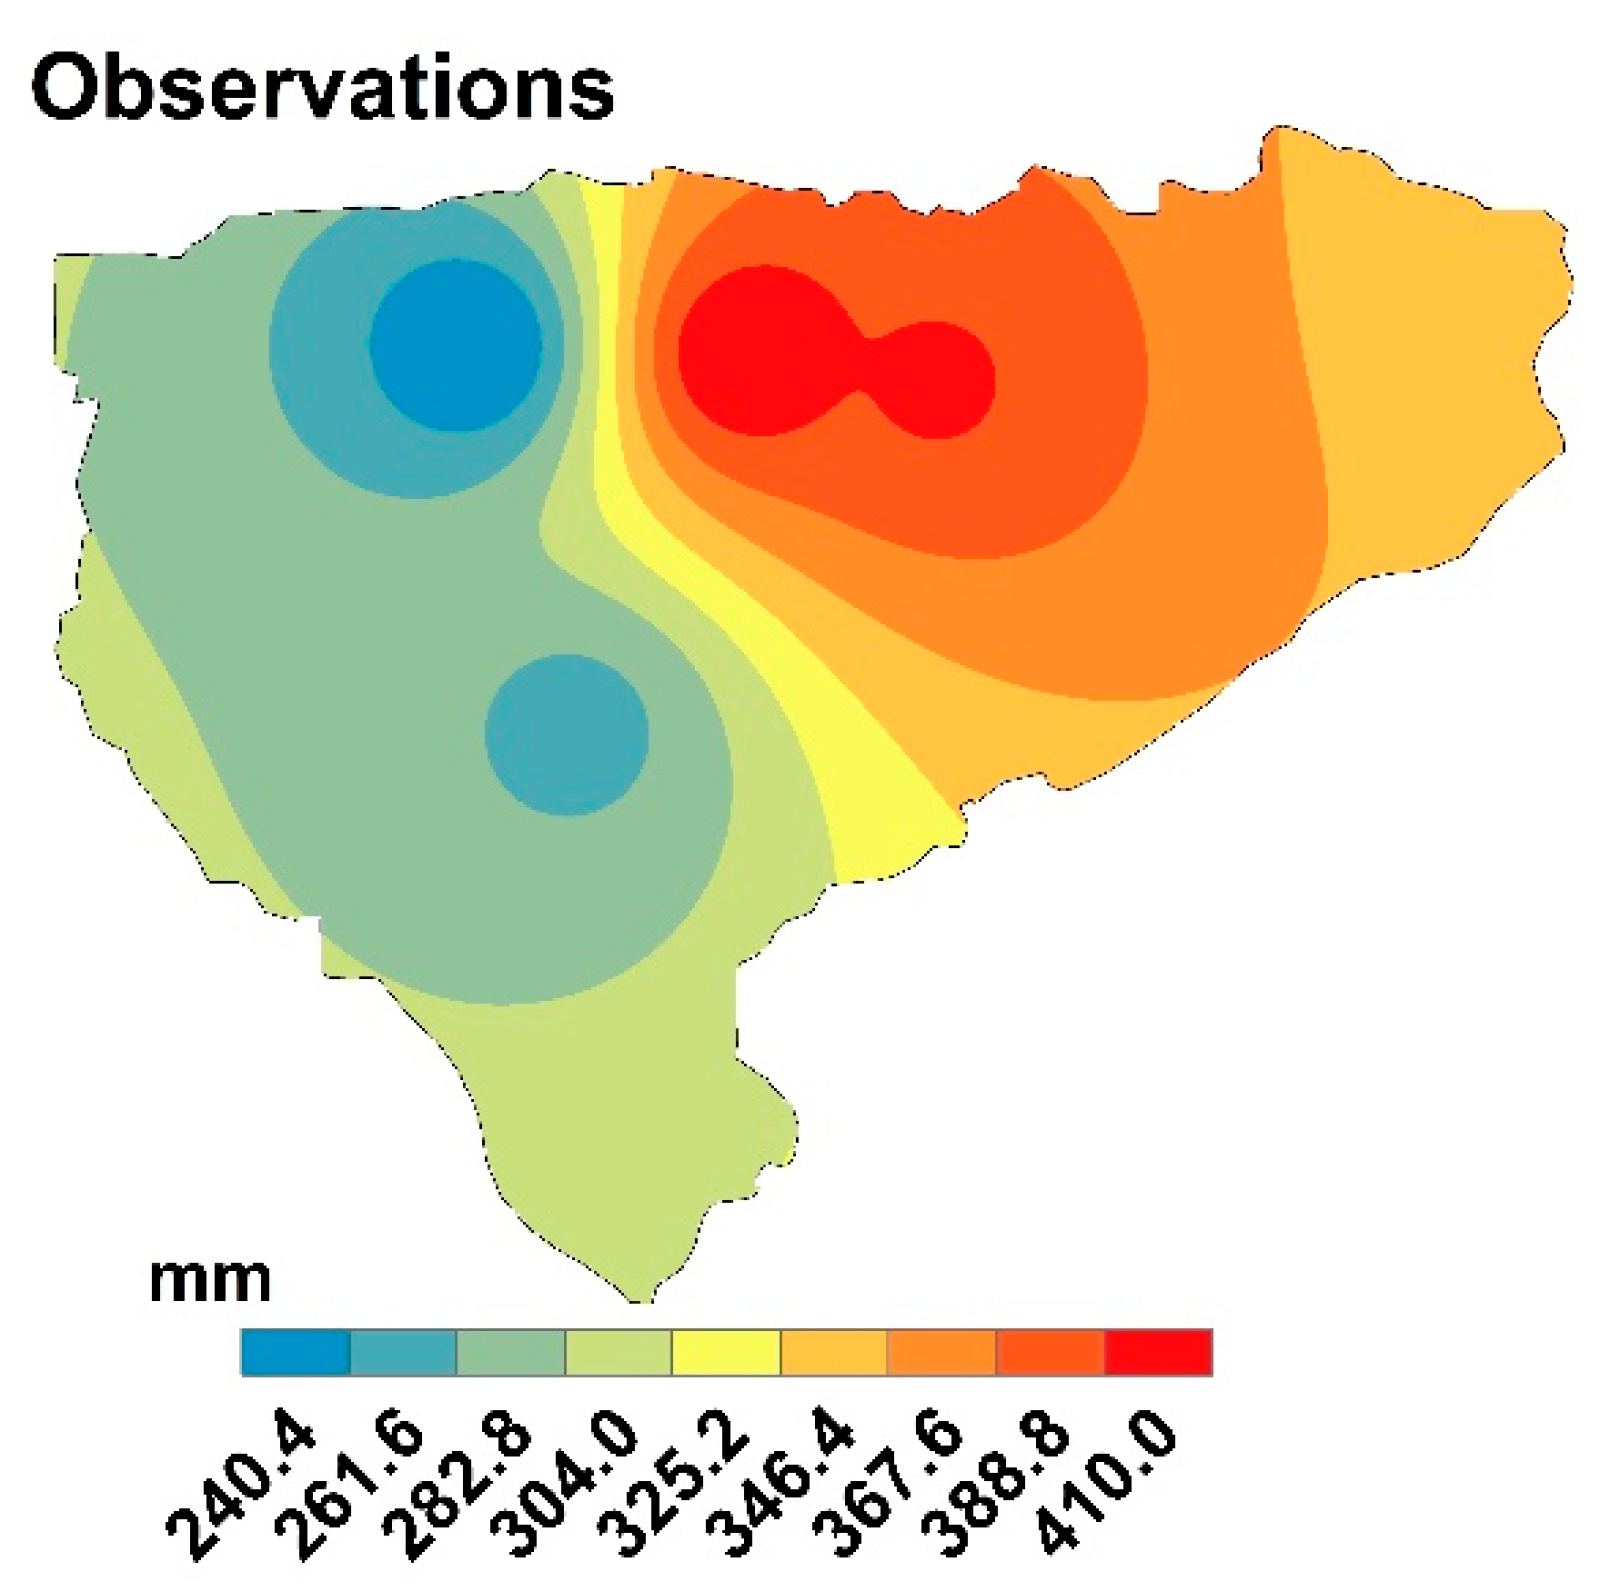
Rainfall maps are constructed to display the variability of annual total precipitation presented by the different products. Maps cover the entire study area with the annual total rainfall rates during the period 1998–2007. Based on ground observations (
Figure 6), the highest rainfall rates are found in Al Mahwit city and Al Rojom stations with annual total precipitation around 410 mm year
−1 at both stations. Northeast of Al Mahwit (Kokaban station), the rainfall annual rates are 346.4 mm year
−1. Kokaban station represents the rainfall rates in the highest part of the region (altitude around 2600 m above sea level). The lowest rainfall rates are observed in the low areas within Al Mahwit in the Al Khamees and Al Khabt districts, with an altitude around 400 m above sea level. Around 263.6 mm year
−1 is the average annual precipitation at the Al Khamees and Al Khabt stations.
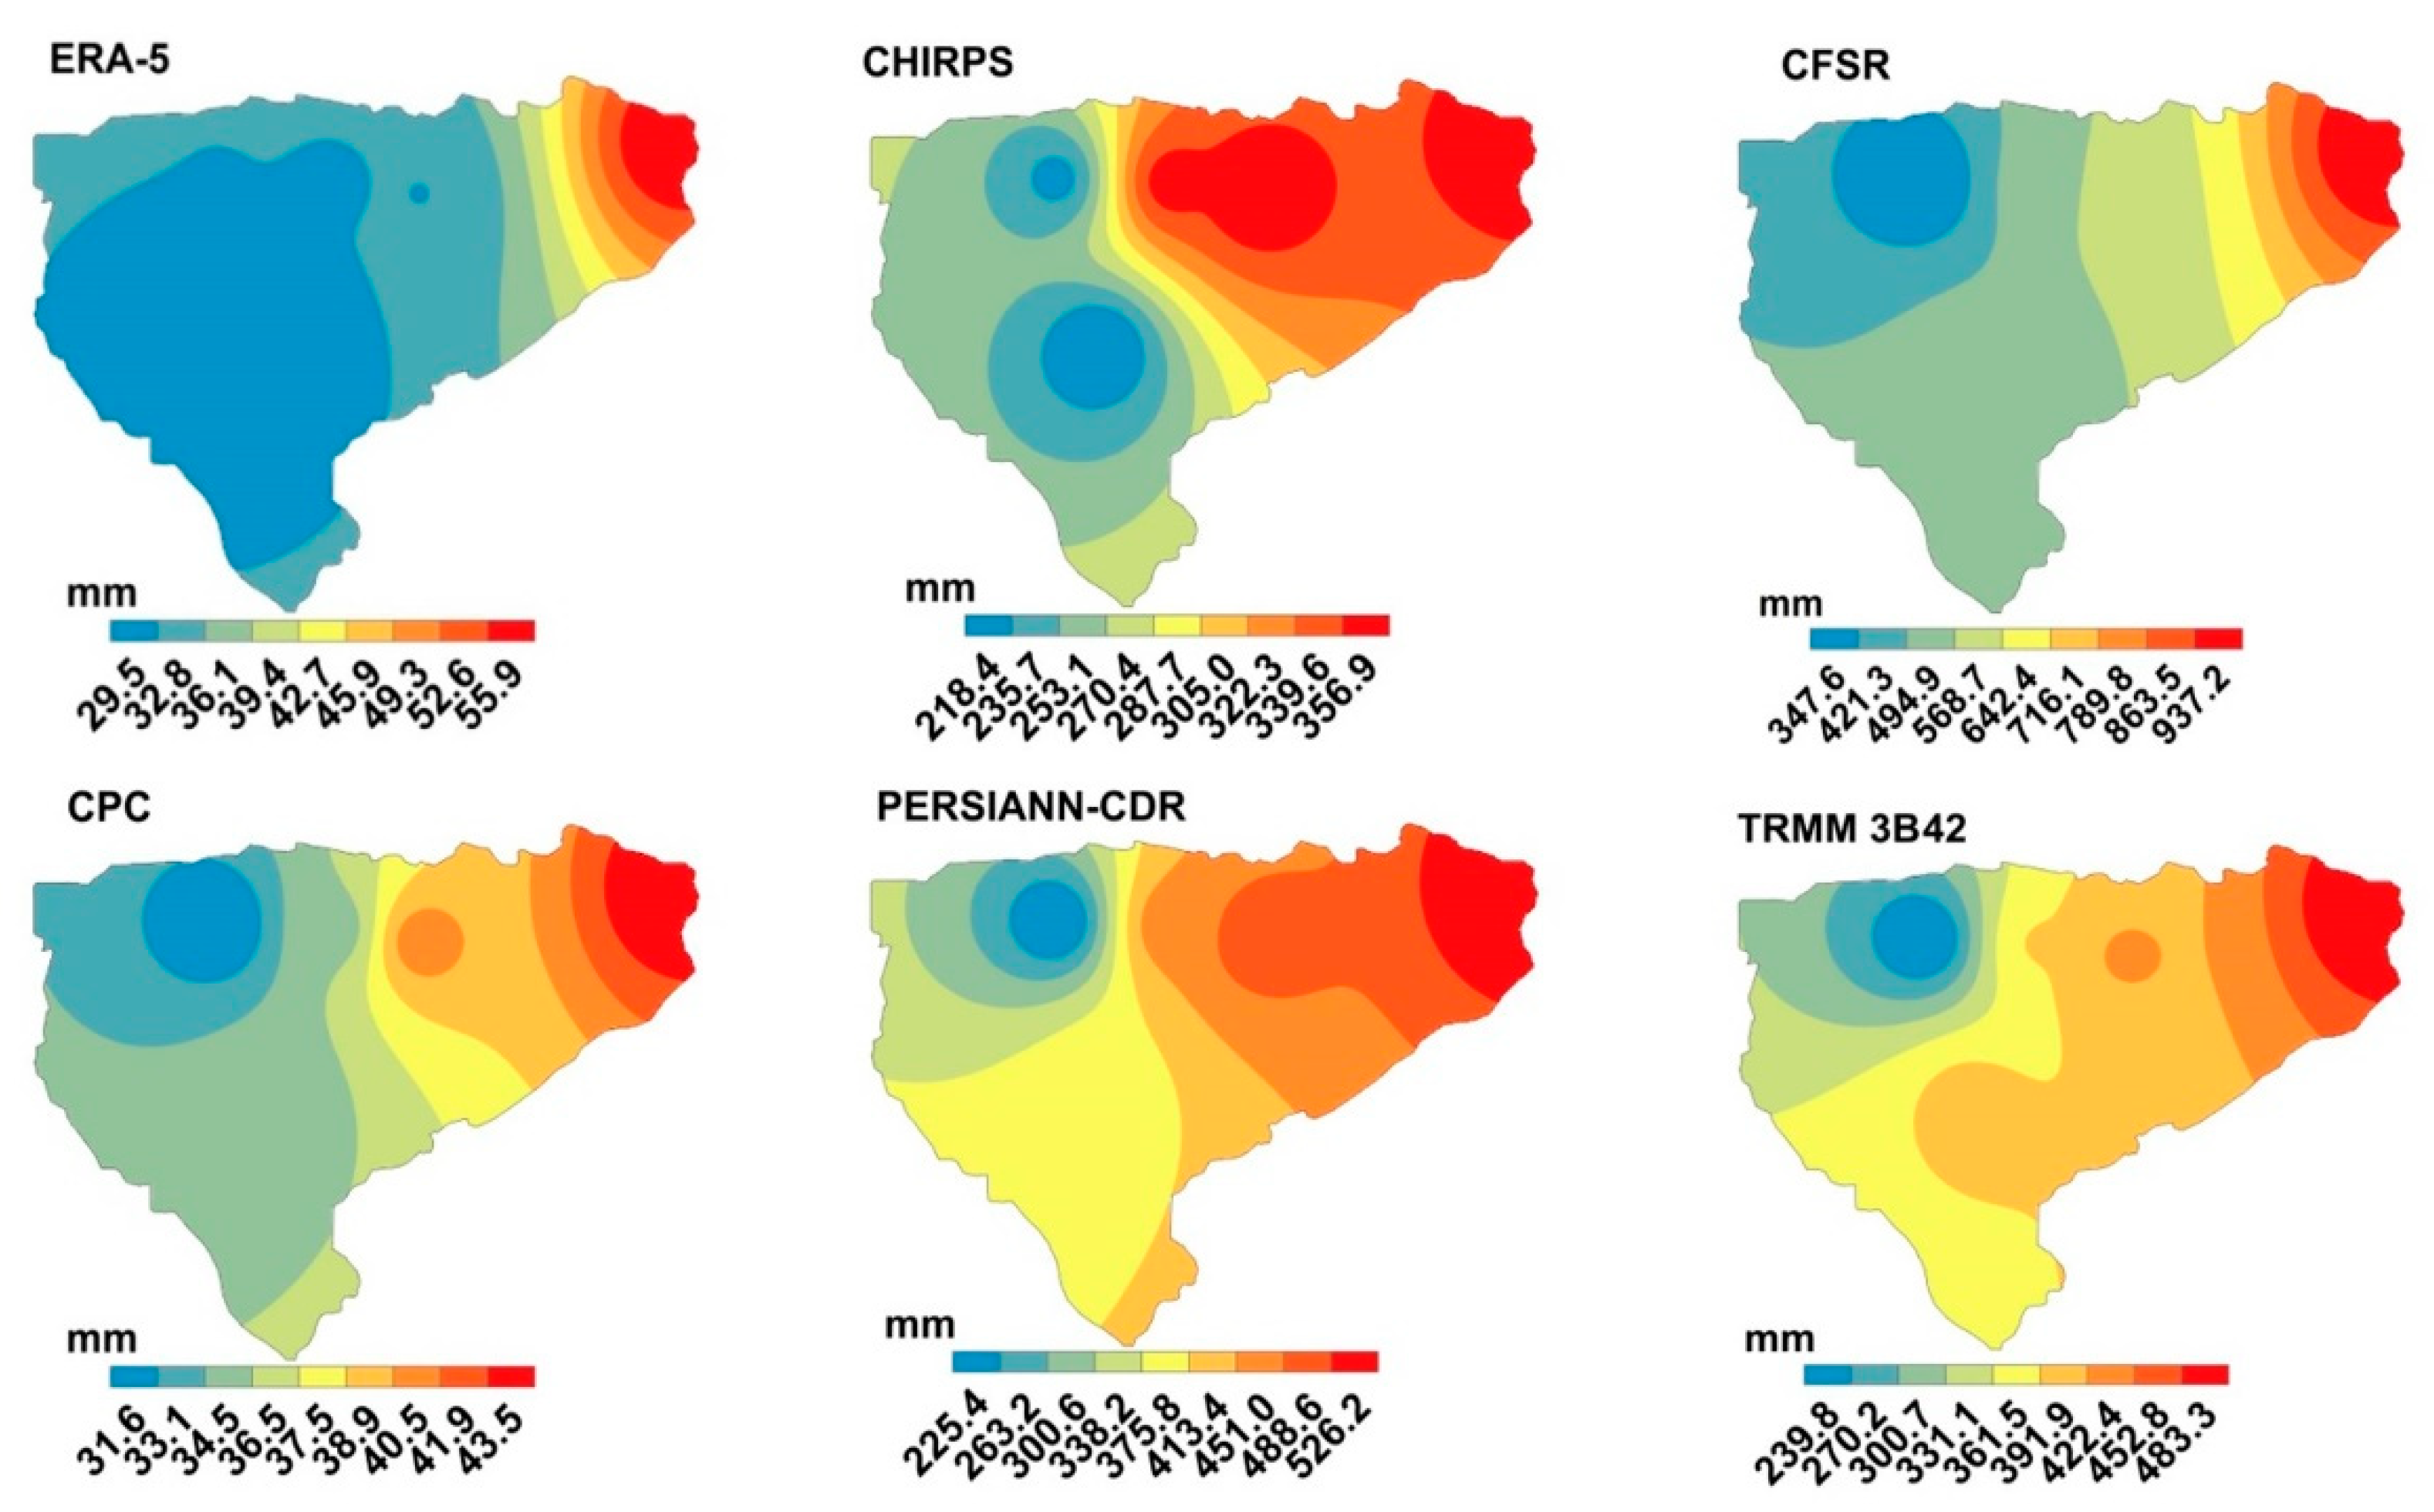
Annual precipitation estimates on the study area differ from one product to other. However, the tested products (
Figure 7) show similar tendency to produce high rainfall estimates northeast of Al Mahwit (high areas) and lower rates in the west and the southwest of the area (low areas). This pattern of rainfall is apparently influenced by the topography of the region. The total estimates of the annual rainfall rates are captured well by CHIRPS, followed by TRMM 3B42. CHIRPS is more accurate and shows the exact pattern of rainfall in the entire area. Parallel to the observations (
Figure 6), CHIRPS produces high precipitation rates in Al Mahwit city and Al Rojom, but provides the best estimate for Kokaban station. TRMM 3B42 shows good relative estimates for several stations (Al Rojom and Al Khamees) but fails to produce the rainfall patterns of the study area. The average annual rainfall estimates by CHIRPS in the high complex mountainous territories (Kokaban, Al Rojom, Al Mahwit city) is 351.7 mm year
−1. In the low area stations (Al Khamees and Al Khabt), the CHIRPS rainfall estimate is around 207.1 mm year
−1. However, CHIRPS appears to slightly underestimate rainfall rates of the study area. Taking the average annual rainfall, the Pbias of CHIRPS in all stations is −8.68%. TRMM 3B42, on the other hand, overestimates the annual rainfall rates in Kokaban, Al Khabt, and Al Rojom, and underestimates for Al Mahwit city and Al Khamees. CFSR and PERSIANN-CDR show the highest estimate of rainfall rates for all stations. In Kokaban, CFSR shows the highest rainfall estimate, with average rates around 937.2 mm year
−1, while for Al Rojom, Mahwit city, Al Khamees, and Al Khabt stations, the rainfall average estimation by CFSR is 431.2 mm year
−1. The percent bias (Pbias) between CFSR and observation is 66.21%. PERSIANN-CDR is the second product showing a high estimate of rainfall rates. In the high mountainous areas (Kokaban, Al Rojom, and Mahwit city), the average of annual rainfall estimates by PERSIANN-CDR is around 481.5 mm year
−1 and around 275.0 mm year
−1 in the low areas (Al Khamees and Al Khabt); the Pbias is 22.9%.
CPC and ERA-5 underestimate the annual precipitation rates of the study area. Around 39 and 38.2 mm year
−1 is the average of annual rainfall estimate in the high areas by CPC and ERA-5, respectively, while in the low land areas (Al Khamees and Al Khabt) this value drops to 31.8 and 27.9 mm year
−1. The Pbias of average annual precipitation of CPC and ERA-5 and ground stations is −88.35 and −88.97%, respectively. However, due to the large variation of rainfall estimates between the products, it was not practical to show the maps at the same rainfall scale, as some rainfall estimates will only produce one color scale map (
Figure 7). The observed average annual rainfall from ground stations and precipitation products are shown in
Table 8.
