Abstract
The daytime plasma density disturbances in the low-latitude ionosphere, referred to as plasma irregularities, mainly occur during the nighttime and are an unusual phenomenon. Based on the observations from multiple low Earth orbiting (LEO) satellites, e.g., the Defense Meteorological Satellite Program (DMSP) F13 and F15, the first Satellite of the Republic of China (ROCSAT-1), the Gravity Recovery and the Climate Experiment (GRACE), and Challenging Mini-satellite Payload (CHAMP) satellites, as well as the ground-based Global Positioning System (GPS) receivers, we report a special event of low-latitude plasma irregularities that were observed after sunrise in the Pacific longitudes on 18 August, 2003, following a moderate geomagnetic storm. Observations from three ground-based GPS stations in both hemispheres showed remarkable total electron content (TEC) disturbances during 20:00 to 21:00 UT (around local sunrise), agreeing well with the in situ plasma density irregularities recorded by the nearby flying LEO satellites. The plasma irregularities observed by these LEO satellites showed quite different depletion intensities at different altitudes. We suggest that the plasma irregularities were freshly generated near sunrise hours due to the disturbance of the dynamo electric field (DDEF), evolving into the post-sunrise and morning sector, but were not the remnant of the plasma irregularities generated during the previous nighttime.
1. Introduction
After sunset, the vertical density gradient becomes steep at the bottom-side of the equatorial F-layer due to the rapid uplift of the F-layer, and the Rayleigh-Taylor (R-T) instability is triggered to generate plasma density irregularities, which are usually referred as Equatorial Spread F (ESF) or plasma bubbles, manifesting as plasma density depletions [1]. There are other plasma density irregularities in the low-latitude ionosphere, which are referred to as plasma blobs, manifesting as plasma density enhancements. Plasma bubbles and plasma blobs, which mainly occur at nighttime and sometimes last into the morning sector in the topside ionosphere [2], have significant effects on radio communications and navigational systems, causing the random fluctuations of the amplitude and phase of trans-ionospheric radio waves. Thus, the occurrence of ionospheric irregularities is always one of the important topics of space weather.
To date, many observations have indicated that plasma bubbles may also occur during the daytime, under both geomagnetically disturbed and quiet conditions. Based on the statistical investigations, Oya et al. [3] and Watanabe and Oya [4] reported that the occurrence rate of plasma bubbles that became zero after 10:00 local time (LT) in the morning sector. Chau and Woodman [5] reported the existence of post noon (14:00–16:00 LT) plasma bubbles in the topside ionosphere from the Jicamarca radar during a storm recovery phase, which lasted about 1–2 h. Fukao et al. [6], which presented a post-sunrise backscatter plume from the Equatorial Atmosphere Radar in Indonesia during the recovery phase of a storm. Li et al. [7] reported ionospheric irregularities in the late morning at low to mid-latitudes during magnetically disturbed conditions, which can be attributed to the disturbance dynamo. Huang et al. [8] displayed dayside plasma bubbles recorded by Communication/Navigation Outage Forecasting System (C/NOFS) satellite after 09:00 LT under moderate magnetic condition. The occurrence of the topside daytime bubbles was also attributed to the eastward electric field due to the disturbance dynamo or the overshielding electric field. Zakharenkova et al. [9] presented observations of topside plasma bubbles around sunrise (05:00–08:00 LT) during a storm recovery phase in the Pacific sector, based on measurements from the global positioning system (GPS) receiver onboard the low-Earth-orbit satellites. By means of model simulation, they further suggested that the formation of plasma bubbles was attributed to the enhanced vertical plasma drift due to the neutral wind disturbance dynamo, but not the prompt penetration of electric fields. Tulasi Ram et al. [10] also displayed the occurrence of fresh field-aligned irregularities (FAIs) near the sunrise terminator during a minor geomagnetic storm, and the FAIs persisted into the post sunrise periods for more than 90 min, which was attributed to the prompt penetration of overshielding electric fields. Jiang et al. [11] reported a case of a daytime F-region irregularity after sunrise (08:30–10:45 LT) in a low-latitude region during a geomagnetic storm and suggested that the daytime irregularity might be related with the traveling atmosphere disturbances/atmospheric gravity waves. Sripathi et al. [12] reported the presunrise occurrences of plasma bubbles in the Indian sector during a moderate geomagnetic storm, and they indicated the penetration electric field and disturbance dynamo electric field can trigger the development of the bubbles locally.
Moreover, there are also some case studies about the dayside plasma bubbles under quiet geomagnetic conditions. Woodman et al. [13] reported post noon (14:00–16:00 LT) spread-F-like irregularities detected by Jicamarca radar during geomagnetically quiet periods, which may be related with the fossil bubbles. Shume et al. [14] presented daytime (around 13:00 LT) F-region irregularities from radar and density depletion, which may be the fresh irregularities, from ground-based GPS and ionosonde observations near the equator under quiet conditions in eastern Brazil. Park et al. [15] reported a dayside plasma depletion at midlatitude region (magnetic latitudes: 25°~30°) by the Swarm and Gravity Recovery and Climate Experiment (GRACE) satellites, during quiet geomagnetic condition, which later has been confirmed to be caused by the rocket exhaust [16]. Li et al. [17] also reported the occurrence of daytime (around 1057 LT) F-region irregularities over Hainan under quiet conditions, and suggested that the irregularities could be triggered by rocket exhaust. Chen et al. [18] reported that two FAIs that were detected at noon by coherent scatter phased array radar in Hainan during the geomagnetically quiet conditions.
In comparison to plasma bubbles, the occurrence of daytime plasma blobs has been rarely reported in the literature. Only the statistical studies of [4], displayed that the plasma blob may exist at some time before sunset and near sunrise, without discussing the possible source of dayside plasma blobs.
In addition, the daytime plasma bubbles presented in previous studies were observed either in the northern hemisphere or southern hemisphere, and the occurrences of daytime plasma bubbles/blobs that were simultaneously observed in both hemispheres have not been reported. In this paper, we present a case study of daytime plasma irregularities in both hemispheres after sunrise, around the 160°E region, recorded by Defense Meteorological Satellite Program (DMSP) F13 and F15 satellites during the recovery phase of a storm. The findings of the first satellite of the Republic of China (ROCSAT-1), GRACE and Challenging Mini-satellite Payload (CHAMP), and Total Electron Content (TEC) derived from International GNSS Service (IGS) map and three ground GPS stations at Lae (Papua New Guinea) in the southern hemisphere, Saipan (USA), and Dededo (Guam) in the northern hemisphere are also presented, respectively, to investigate the performances of the plasma irregularities and possible mechanism leading to the occurrence of the daytime plasma irregularities.
2. Data Description
The DMSP is a series of satellites and flies in a near-circular orbit at an altitude of about 840 km, with an inclination of 98.7°. The special sensor-ions, electrons, and scintillation (SSIES) are on board the satellites to measure the ion and electron densities, temperatures, and drifts. All DMSP satellites fly in Sun-synchronous orbits near either the 06:00–18:00 LT or the 09:30–21:30 LT meridians [19]. The data used in this study are from the DMSP F13 and F15 satellite, whose orbit is on the 06:00 LT and 09:00 LT meridian, respectively.
The ROCSAT-1 was launched to a circular orbit with a 35° inclination orbital plane at 600 km in March 1999. The onboard Ionospheric and Plasma Electrodynamics Instrument (IPEI) operates to measure in-situ ion density and ion composition in the low- and middle-latitude ionosphere [20].
The CHAMP satellite was launched into an almost circular, near-polar orbit (inclination: 87.3°) on 15 July, 2000. The initial altitude is about 454 km, and the orbit had decayed to about 400 km in 2003 [21]. The Planar Langmuir Probe (PLP) onboard the satellite measures the in-situ electron density and temperature per 15 s, the electron density from PLP has been validated by comparison with ground-digisonde measurements at Jicamarca, with a good agreement with the results from the ground observations [22].
The GRACE mission, including two spacecraft GRACE-A and GRACE-B, was launched into a polar-orbit on 17 March, 2002, with the inclination of 89° at an initial altitude of about 490 km [23]. The electron density can be derived from the K-band ranging (KBR) system between the GRACE two spacecraft [24], which has been validated by comparisons with ground-based observations from European Incoherent Scatter radar (EISCAT), Millstone hill and Arecibo radars [25], and more detailed descriptions of the electron density retrieval can be found in [24].
3. Geophysical Conditions during 16–20 August 2003
On 17 August, 2003, the storm sudden commencement (SSC) of a geomagnetic storm was at 14:21 UT. Figure 1 displays the geophysical conditions during the 16–20 August, 2003, including the variations of Dst index, Kp index, solar wind speed (VSW), the south-northern component of Interplanetary Magnetic Field (IMF) BZ, and the Interplanetary Electric Field (IEF) Ey ().
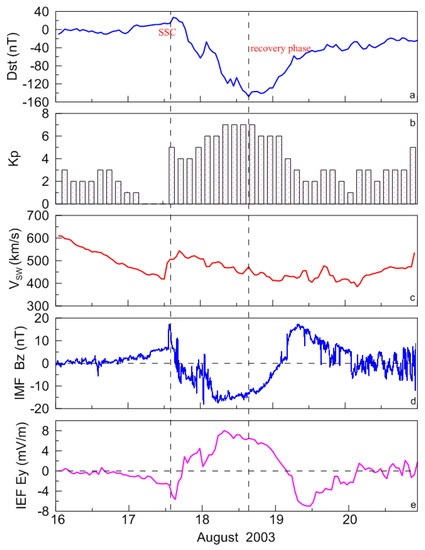
Figure 1.
Variations of the Dst index (a), Kp index (b), solar wind speed VSW (c), interplanetary magnetic field (IMF) BZ component (d), and interplanetary electric field Ey (e) during 16–20 August, 2003.
As shown in Figure 1, before the SSC, Kp indices on 17 August were small. On 18 August, the Dst index dropped to a minimum (−148 nT) around 16:00 UT, and Kp indices were no less than 6. The BZ component was mainly southward from the main phase to about 02:00 UT of 19 August. BZ had sudden variations at 16:36 UT of 17 August and 01:30 UT of 18 August. After the storm started, Ey was westward and turned eastward at about 18:00 UT on 17 August.
4. Results
4.1. Observations from DMSP
Figure 2 shows the variations of ion density along the trajectory of DMSP F13 satellite during 18:50–19:04 UT (a), 20:31–20:45 UT (b) at 160°E longitude region on 18 August, 2003, respectively. At the bottom of Figure 2a,b, magnetic latitude (MLAT), geographic longitude (GLON), UT, LT are also marked.
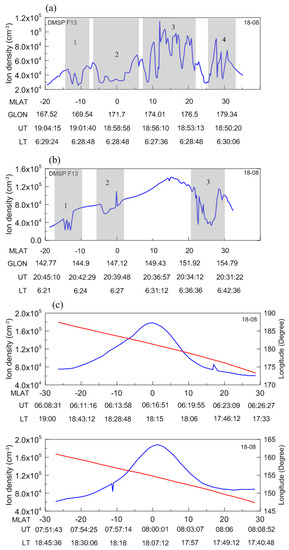
Figure 2.
On 18 August, 2003, variations of the ion density along the DMSP F13 trajectories during 18:50–19:04 UT (a), 20:31–20:45 UT (b), 06:08–06:26 UT and 07:51–08:08 UT (c) at 160°E longitude region, respectively.
From Figure 2, we can notice that the plasma depletions were recorded by DMSP F13 at 170°E and 150°E regions during 18:50–19:04 UT (a) and 20:31–20:45 UT (b), near local sunrise (around 06:30 LT), respectively.
At 170°E sector, in Region 1, the ion density around 10.82°S was about 2.57 × 104 cm−3 and the background density was about 4.8 × 104 cm−3 at 9.3°S. The depletion was about 46.5%. In Region 2, the ion density at 4.07°S was about 2.9 × 104 cm−3 and the background density was about 4.2 × 104 cm−3 at 5.3°S, the depletion was about 31%. In Region 3, the ion density at 8.48°N was about 3.0 × 104 cm−3 and the background density was about 1.04 × 105 cm−3 at 13.3°N. The density at 25.45°N was about 2.92 × 104 cm−3, the background density was about 5.59 × 104 cm−3 at 13.3°N, which means that the depletion reached about 47.8%.
At 150°E sector, in Region 1, the ion density around 12.9°S was about 2.27 × 104 cm−3 and the background density was about 5.24 × 104 cm−3 at 12.4°S. The depletion was about 56.7%. In Region 3, the ion density at 26.24°N was about 3.37 × 104 cm−3, the background density was about 1.0 × 105 cm−3, which means that the depletion reached about 66.3%.
For comparison, Figure 2c shows two close orbits of DMSP F13 in 160°E and 140°E, but at an earlier time during 06:08–06:26 UT (top) and 07:51–08:08 UT (bottom) at the same day, respectively. The red lines in Figure 2c represent the longitude variations along the satellite trajectories. No density fluctuations were recorded by DMSP F13 in the dusk sector.
Similar to Figure 2, Figure 3a shows the variations of ion density along the trajectory of DMSP F15 satellite from 22:59 to 23:07 UT in 160°E longitude region on 18 August, 2003.
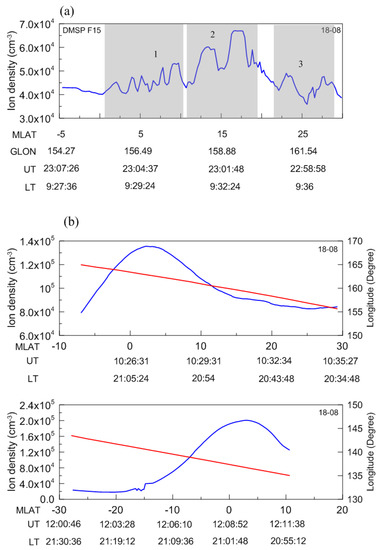
Figure 3.
On 18 August, 2003, variations of the ion density along the DMSP F15 trajectories during 22:59–23:07 UT (a), 10:25–10:35 UT and 12:01–12:11 UT (b) at 160°E longitude region, respectively. The satellite altitude was about 839 km.
In Figure 3a, the ion density showed remarkable fluctuations in low-latitude regions. In Region 1, the ion density around 0°N was about 4.01 × 104 cm−3 and 4.53 × 104 cm−3 at 2.04°N, the density reached about 4.8 × 104 cm−3 at 5.16°N, and 5.33 × 104 cm−3 at 9.72°N, respectively. The ion density was about 4.04 × 104 cm−3 at 3.24°N, and 4.12 × 104 cm−3 at 6.12°N. Compared to the density at 5.16°N, the density depletion was about 15.8% at 3.24°N.
In Region 2, the background ion densities were about 6.02 × 104 cm−3 at 13.25°N and 6.7 × 104 cm−3 at 16.75°N, respectively. The density decreased to about 5.02 × 104 cm−3 at 14.65°N. Compared to the background density at 13.25°N and at 16.75°N, the density depletions were about 16.6% and 25.1%, respectively.
In Region 3, The ion densities were about 4.17 × 104 cm−3 at 22.12°N, and about 4.9 × 104 cm−3 at 23.05°N, respectively. The ion densities were about 3.59 × 104 cm−3 at 25.62°N, and 4.76 × 104 cm−3 at 27.72°N. Compared to the density at 23.05°N, the density depletion at 22.12°N was about 14.9%. For comparision, Figure 3b also displays two close orbits of DMSP F15 in 160°E and 140°E, but at an earlier time around 10:25–10:35 UT (top) and 12:01–12:11 UT (bottom) at the same day. The red lines in Figure 3b represent the longtitude variations along the satellite trajectories. At 10:30 UT, no clear density fluctuation was observed, but a density depletion was detected near 15°S around 12:04 UT (after local sunset). The background density at 14.83°S was 3.97 × 104 cm−3, and the density at 15.08°S decreased about 36.4%.
4.2. Observations from ROCSAT-1
The variations of ion density along the ROCSAT-1 trajectories in 160°E longitude region during 23:26–23:38 UT (a), 09:42–09:50 UT, 11:17–11:38 UT, and 12:47–13:18 UT (b), 21:45–21:54 UT (c) on 18 August, 2003 are presented in Figure 4, respectively. MLAT, GLON, UT, and LT are also given at the bottom of Figure 4a, the red lines represent the longtiude variations along the satellite trajectories in Figure 4b,c.
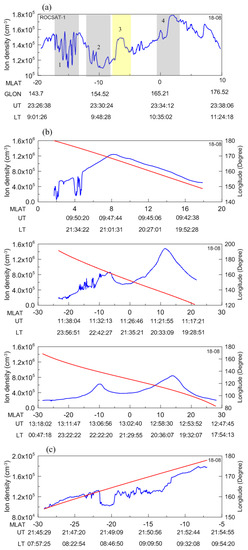
Figure 4.
At 160°E longitude region, variations of the ion density along the ROCSAT-1 trajectories during 23:26–23:38 UT (a), 09:42-09:50 UT, 11:17–11:38 UT, and 12:47–13:18 UT (b), 21:45–21:54 UT (c) on 18 August, 2003, respectively. Satellite altitude was about 578 km.
As shown in Figure 4a, the ion density also displayed remarkable fluctuations in low-latitude regions. In Region 1, the density at 14.42°S was about 1.14 × 105 cm−3, 1.1 × 105 cm−3 at 15.04°S, and 1.2 × 105 cm−3 at 15.93°S. The background density was about 1.5 × 105 cm−3 at 17.78°S and 1.55 × 105 cm−3 at 13.76°S. Compared to the density at 17.78°S, the density depletions was about 24% at 14.42°S.
In Region 2, the density at 11.24°S was about 1.15 × 105 cm−3, and 1.1 × 105 cm−3 at 9.42°S. The background density was about 1.39 × 105 cm−3 at 11.76°S. The density depletions were about 17.3%.
In Region 3, the density disturbances exhibited mainly as enhancements, i.e., plasma blobs, but not the plasma depletions. The density at 6.29°S was about 1.49 × 105 cm−3, the background density around 7.3°S was about 1.27 × 105 cm−3, the enhancement was about 17.3%. We are not sure if the enhancements were plasma blob, thus we call these density disturbances as plasma blob-like structures.
In Region 4, at 0°N, the density reached a maximum, with a value of about 1.59 × 105 cm−3. Around the equator (at 0.3°S and 0.4°N), the density was about 1.48 × 105 cm−3. At 1.8°N, the density was about 1.79 × 105 cm−3. The density depletion at 0.4°N was about 17.3%, with respect to the density at 1.8°N.
From Figure 4b, we can also notice that the density disturbances were detected at earlier times, including density depletion and density enhancement. Density depletions were recorded at 09:48 UT (21:33 LT) around 4°N, and density enhancements were recorded at 11:36 UT (23:00 LT) around 15°S. The enhancement reached about 45.5%. At 21:48 UT (08:46 LT), shown in Figure 4c, the density depletions in low-latitude regions were detected at 160°E sector, with a magnitude of about 22.2%.
Figure 5 displays the variations of electron density with geomagnetic latitudes at 160°E longitude sector from ROCSAT-1 during 16–20 August 2003 at around 11:30 UT. It can be noted that the background density on 18 August was enhanced significantly with respect to that on other days. The EIA was still well developed, and it could exist until 13:06 UT, as shown in Figure 4b.
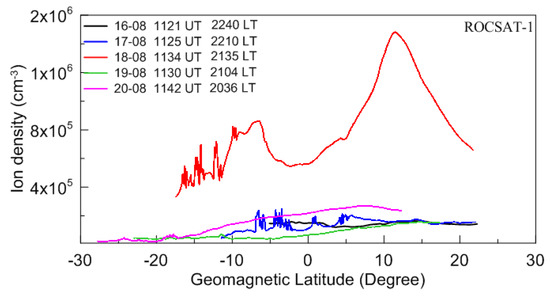
Figure 5.
Electron densities from ROCSAT-1 at 160°E longitude sector at around 11:30 UT, during 16–20 August, 2003, respectively.
4.3. Observations from CHAMP and GRACE
Figure 6 presents the variations of electron density in the 160°E longitude sector at different UT times along the CHAMP (a, c) and GRACE (b, d) trajectories on 16–20 August, 2003, respectively.
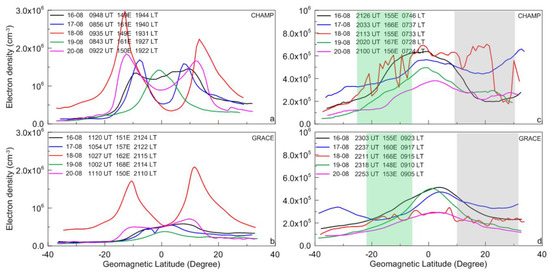
Figure 6.
Electron densities from CHAMP (a,c) and GRACE (b,d) at the 160°E longitude sector at different times during 16–20 August, 2003, respectively.
From Figure 6, it can be seen that EIA on 18 August, 2003 was remarkably stronger than that on other days at around 09:30 UT at CHAMP altitude and around 10:30 UT at GRACE altitude, respectively. At later UT times of 18 August (local morning on 19 August), the electron densities at both CHAMP altitude and GRACE altitude displayed significant disturbances, while no density disturbances were detected during other days.
For instance, on 18 August, at GRACE altitude, the density around the equator was about 2.88 × 105 cm−3. In the southern hemisphere, the electron density was about 2.59 × 105 cm−3 at 16.45°S, and the density decreased to 2.35 × 105 cm−3 at 14.07°S (local time: 09:16 LT) and 2.24 × 105 cm−3 at 8.35°S (local time: 09:15 LT), respectively. The density reached a maximum with a value of about 3.11 × 105 cm−3 at 4.37°S. In the northern hemisphere, the maximum density in the northern hemisphere was 3.36 × 105 cm−3 at 7.23°N, the density was about 2.12 × 105 cm−3 at 10.06°N (local time: 09:14 LT), and it reached a minimum at 20.57°N (local time: 09:13 LT), with the value of 1.75 × 105 cm−3. Compared to the density at 4.37°S, the density depletions in the southern hemisphere were about 28% at 8.35°S and 24.4% at 14.07°S, respectively. Compared to the density at 7.23°N, in the northern hemisphere, the depletions were about 36.9% at 10.06°N and 40.8% at 20.57°N, respectively.
At CHAMP altitude, on 18 August, the density around the equator was about 6.0 × 105 cm−3. The electron density was about 6.07 × 105 cm−3 at 12.29°S. The density decreased to 2.47 × 105 cm−3 at 19.98°S (local time: 07:31 LT), and 3.24 × 105 cm−3 at 10.37°S (local time: 07:33 LT). In the northern hemisphere, the electron density was about 6.32 × 105 cm−3 at 8.86°N, and the density was about 6.83 × 105 cm−3 at 15.6°N. The density decreased to 4.79 × 105 cm−3 at 11.75°N (local time: 07:37 LT), 1.92 × 105 cm−3 at 26.19°N (local time: 07:41 LT) and 1.77 × 105 cm−3 at 28.12°N (local time: 07:41 LT), respectively. Compared to the density at the equator, the density depletions in the southern hemisphere were about 58.8% at 19.98°S, 46% at 10.37°S and 32.8% at 7.49°S, respectively. In the northern hemisphere, the depletions were 20.2% at 11.75°N, 68% at 26.19°N and 70.5% at 28.12°N, respectively.
4.4. TEC Observations from IGS
Figure 7 presents the IGS TEC map with UT times in the 160°E sector during 16–20 August 2003. The geomagnetic equator is noted as the dashed magenta line in the figure. The SSC, recovery phase, and sunrise terminator are also marked in the figure.
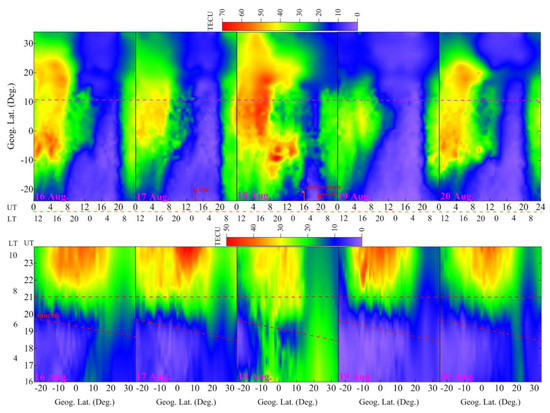
Figure 7.
At the 160°E sector, 16–20 August, 2003, low-latitude ionospheric TEC map from IGS for the full day (top panel) and during 16:00–24:00 UT (bottom panel). The dashed magenta line (top panel) represents the magnetic equator in the top panel. The dashed red lines (bottom panel) represent the sunrise terminator and 21:00 UT, respectively.
As shown in Figure 7, on 18 August, TEC in low-latitude regions was enhanced significantly during 04:00–21:00 UT (from local daytime to local sunrise on the next day) with respect to that on other days. Especially during 16:00–21:00 UT (recovery phase), shown in the bottom panel of Figure 7, EIA was well developed and lasted into the local sunrise terminator, while the EIA disappeared on other days. After 22:00 UT, TEC in low-latitude regions decreased more than that on other days. At 05:07 UT, the maximum of TEC was about 66.8 TECU around 6.0°N, while TEC values were about 45.9 TECU on 16 August and 46.4 TECU on 17 August, respectively. At 18:02 UT, the maximum of TEC reached about 24.3 TECU around 3.0°S, while TEC values were about 1.9 TECU on 16 August and 2.9 TECU on 17 August, respectively. The enhancement of EIA means that the significant effects of strong zonal electric field and equatorward neutral wind [26].
On 19 August, TEC values in low-latitude regions decreased significantly. Daytime TEC maximum decreased to about 42.4 TECU at 05:57 UT.
4.5. Ground GPS Observations
Ground-based GPS observations from three low-latitude IGS stations, which are located in the same longitude sector (145°E) in the northern and southern hemispheres, respectively, are selected to study the variations in the ionosphere. The coordinates of three stations are given in Table 1.

Table 1.
Coordinates of three IGS GPS stations.
Figure 8 shows the variations of vertical TEC and rate of variations of TEC index (ROTI) with UT for different satellites at Saipan (USA, CNMR, Figure 8a), Dededo (Guam, GUAM, Figure 8b), and Lae (Papua New Guinea, LAEL, Figure 8c) on 18 August, 2003, respectively. The satellite elevation and azimuth, geographic longitude and latitude of the ionospheric pierce point (IPP), assuming a thin ionospheric shell at 350 km height, are also given in the figure. The sunrise terminator is represented by the symbol  in the figure. The definition and method for ROTI calculation can be seen in Pi et al. [26]. Many studies have indicated that ROTI can represent the characteristics of TEC disturbances and ionospheric scintillation, and it can be used for ionospheric disturbance and scintillation monitoring e.g., [9,27,28,29,30].
in the figure. The definition and method for ROTI calculation can be seen in Pi et al. [26]. Many studies have indicated that ROTI can represent the characteristics of TEC disturbances and ionospheric scintillation, and it can be used for ionospheric disturbance and scintillation monitoring e.g., [9,27,28,29,30].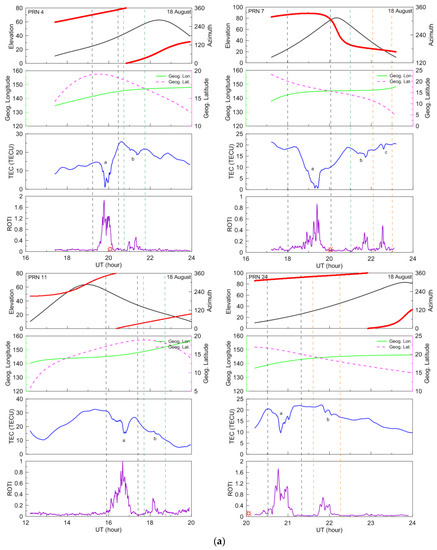
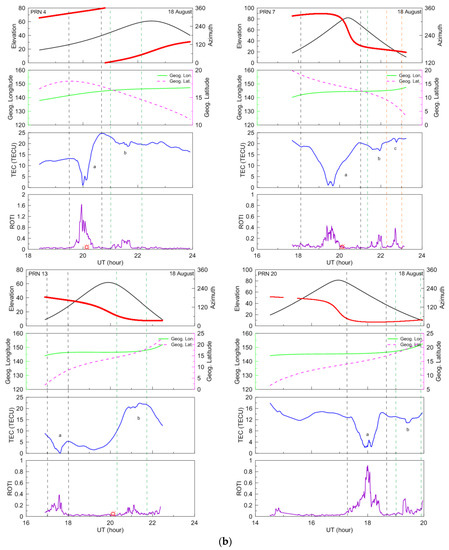
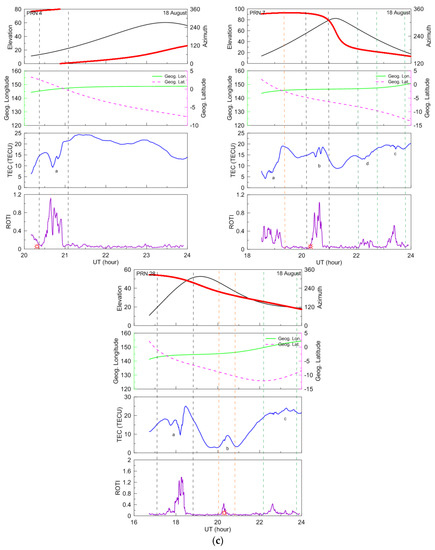
Figure 8.
(a) At the CNMR station, variations of the satellite elevation and azimuth (top), geographic longitude and latitude of the IPP (second panel), vertical TEC (third panel), and ROTI (bottom) for satellites PRN 4 (left top panel), PRN 7 (right top panel), PRN 11 (left bottom panel), and PRN 24 (right bottom panel) during 16:00–24:00 UT on 18 August, 2003, respectively. The symbol represents the sunrise terminator. (b) Similarly (a), at the GUAM station, for satellites PRN 4 (left top panel), PRN 7 (right top panel), PRN 13 (left bottom panel), and PRN 20 (right bottom panel) during 16:00–24:00 UT on 18 August, 2003, respectively. (c) Similarly (a), at the LAEL station, for satellites PRN 4 (left top panel), PRN 7 (right top panel), and PRN 28 (bottom panel) during 16:00–24:00 UT on 18 August, 2003, respectively.
represents the sunrise terminator. (b) Similarly (a), at the GUAM station, for satellites PRN 4 (left top panel), PRN 7 (right top panel), PRN 13 (left bottom panel), and PRN 20 (right bottom panel) during 16:00–24:00 UT on 18 August, 2003, respectively. (c) Similarly (a), at the LAEL station, for satellites PRN 4 (left top panel), PRN 7 (right top panel), and PRN 28 (bottom panel) during 16:00–24:00 UT on 18 August, 2003, respectively.
Figure 8a is for satellites pseudo-random noise (PRN) 4 (left top panel), PRN 7 (right top panel), PRN 11 (left bottom panel), and PRN 24 (right bottom panel) at the CNMR station during 16:00–24:00 UT on 18 August, 2003, respectively. Figure 8b is for PRN 4 (left top panel), PRN 7 (right top panel), PRN 13 (left bottom panel), and PRN 20 (right bottom panel) at GUAM station, and Figure 8c is for PRN 4 (left top panel), PRN 7 (right top panel), and PRN 28 (bottom panel) at LAEL station.
In Figure 8, it can be seen that significant TEC depletions were recorded simultaneously at three stations in both northern and southern hemispheres during two time-intervals, 16:00–18:00 UT (01:48–03:48 LT) and 20:00–22:00 UT (05:48-07:48 LT), respectively. TEC depletions could exceed 10 TECU, and ROTI achieved more than 1.5.
For instance, in the northern hemisphere, at the CNMR station, PRN 4 detected the TEC depletion of about 12 TECU around 20:00 UT (05:42 LT), the maximum of ROTI reached about 1.8. PRN 11 detected the TEC depletion of about 14 TECU around 16:40 UT, and ROTI reached about 0.8. TEC fluctuations were also detected around 22:00 UT (07:42 LT) by PRN 7 and PRN 24, respectively. At GUAM station, PRN 4 also detected the TEC depletion of about 12.1 TECU around 20:00 UT (05:39 LT), ROTI reached about 1.6. PRN 20 detected the TEC depletion of about 10 TECU around 18:00 UT, the maximum of ROTI reached about 0.9.
In the southern hemisphere, at the LAEL station, PRN 4 detected the TEC depletion of about 7.8 TECU around 20:40 UT (06:28 LT), the ROTI maximum was about 1. Around 21:00 UT (06:48 LT), PRN 7 also detected the TEC depletions, ROTI exceeded 1. PRN 28 detected the TEC depletion of about 8.7 TECU around 18:00 UT (03:48 LT), the ROTI maximum was about 1.3.
5. Discussions
The occurrences of daytime plasma irregularities in equatorial and low-latitude ionosphere are mainly categorized into two types. One is thought of as the remnant of the F-region irregularities triggered by the Rayleigh-Taylor instability and developed in the nighttime, with a long duration due to the disturbance dynamo or slow loss reaction e.g., [2,6,7,8,18]. The other type of daytime irregularity is the fresh irregularity, occurring near the sunrise under the development of R-T instability and persisting into the morning sector due to the polarization eastward electric field, which is related with the prompt penetration electric field or the disturbed neutral wind dynamo [10], or wind-driven gradient drift instability [14]. There is also another rare type, which generates due to the artificial ionospheric variations, such as rocket exhaust [16,17]. Due to the limited observations of daytime F-region irregularities, the understanding of these irregularities still remains unresolved.
To illustrate the distributions of plasma irregularities recorded by multiple satellites and ground-based GPS stations, Figure 9 presents a low-latitude regional map at 120–180°E longitude sector, including the trajectories of DMSP, ROCSAT-1, GRACE, CHAMP satellites during different periods, the locations of three ground-based GPS stations at Lae (LAEL), Saipan (CNMR), and Dededo (GUAM), and also the IPP tracks of the GPS satellites, on 18 August, respectively. The red short lines and green short lines over the satellite tracks represent the density enhancements and density depletions encountered by the satellites, respectively. The grey solid line represents the magnetic equator. The LT times of the event recorded by the satellites are also marked in the figure.
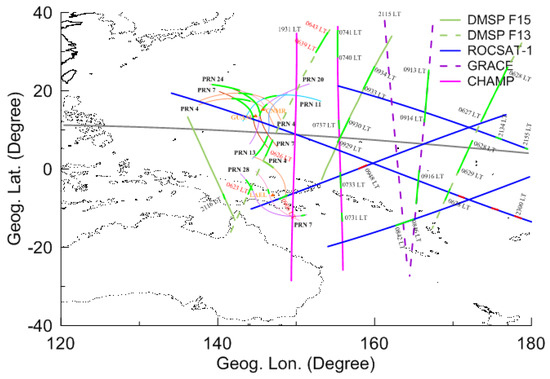
Figure 9.
On 18 August, 2003, the regional map at 120–180°E longitude sector including the trajectories of DMSP, ROCSAT-1, GRACE, CHAMP satellites, the locations of ground-based GPS stations at Lae (LAEL), Saipan (CNMR), and Dededo (GUAM), and also the IPP tracks of GPS satellites. The red short lines represent the density enhancements encountered by the satellites, the green short lines represent the density depletions recorded by the satellites.
As shown in Figure 8, in both hemispheres, the TEC disturbances were recorded on 18 August during two time-intervals, 16:00–18:00 UT (01:48-03:48 LT) and 20:00–22:00 UT (05:48–07:48 LT), respectively. For instance, from 16:00–18:00 UT, in the southern hemisphere, at the LAEL station, TEC disturbance recorded by PRN 28 occurred around 18:00 UT (03:48 LT), and the maximum of ROTI reached 1.4. In the northern hemisphere, PRN 11 detected TEC disturbances around 16:00 UT (01:48 LT) at the CNMR station, PRN 13 and PRN 20 detected TEC disturbances around 17:00 UT (02:48 LT) and 18:00 UT (03:48 LT) at GUAM station, respectively.
During 20:00–22:00 UT (around local sunrise), TEC disturbances were also detected at CNMR, GUAM, and LAEL stations, respectively, which were very consistent with the observations from DMSP F13 shown in Figure 2. No similar TEC disturbances were detected by the GPS satellites on other days, the TEC variations during 16–19 August at CNMR and LAEL stations can be seen in the “Supplementary Materials”. At CNMR, PRN 4 detected TEC depletions around 20:00 UT (05:48 LT), and small TEC disturbances around 21:00 UT (06:48 LT). Small disturbances also were detected by PRN 7 around 22:00 UT (07:48 LT), ROTI reached about 0.4. PRN 24 detected large TEC depletions during 20:30–21:00 UT (06:18–06:48 LT), and smaller TEC depletions around 22:00 UT (07:48 LT). At GUAM, PRN 4 also detected TEC large depletions around 20:00 UT (05:48 LT) and small TEC disturbances around 21:00 UT (06:48 LT). PRN 7 recorded TEC disturbances around 22:00 UT (07:48 LT). In the southern hemisphere, at LAEL, during 20:30–21:00 UT (06:18–06:48 LT), TEC disturbances were detected by PRN 4, and ROTI exceeded 1. PRN 7 also detected TEC disturbances during 20:00–21:00 UT (05:48–06:48 LT) and around 23:00 UT (08:48 LT), respectively. Moreover, the disturbances were recorded by PRN 28 around 22:30 UT (08:18 LT), which was also detected by DMSP F13 around 20:43 UT (06:23 LT), and by ROCSAT-1 around 23:27 UT (09:06 LT) in the same region, respectively, as shown in Figure 9.
The disturbances of TEC and ROTI means that the existence of F-region irregularities at 140–160°E regions during 16:00–18:00 UT (local post-midnight) and 20:00–-22:00 UT (local morning near sunrise), which were consistent with the observations from DMSP F13, CHAMP and GRACE satellites. And the plasma disturbances were detected from DMSP F15 around 23:06 UT (09:29 LT), and from ROCSAT-1 observations, the plasma depletions still existed in the low-latitude ionosphere until 23:27 UT (09:06 LT), which means that the daytime plasma irregularities could last into the morning sector for more than 3 h.
Moreover, it should be noted that the irregularities that occurred at 140°E region may not be the same as the irregularities detected by the satellites around 160°E, which means that the daytime irregularities occurred in a wide longitude region.
In general, the F-region irregularities occur after sunset due to the R-T instability and disappear before midnight, but sometimes they can persist into the post-midnight, even till the morning [2]. F-region irregularities can also be freshly generated during the post-midnight before sunrise [31] due to the relatively weak westward electric field in the presence of equatorward meridional wind [32] or eastward disturbance dynamo electric field [33], under quiet and disturbed conditions [33].
There is a question about the occurrence of TEC disturbances recorded by ground-GPS observations and in-situ measurements from CHAMP, GRACE, ROCSAT-1, and DMSP, whether the F-region plasma irregularities around 140–160°E were the remnant of the irregularities initiated during the post-midnight or the fresh irregularities generated near sunrise? Park et al. [15] summarized some favorable conditions for the occurrence of daytime plasma bubbles, including: (1) at early local morning, (2) at a lower latitude than nighttime bubbles were located, (3) at a high height, and (4) during geomagnetically disturbed periods. The daytime bubbles in the topside ionosphere mostly might be the fossil bubbles or the remnant of the bubbles formed on the previous night. e.g., in [6,7,18]. There are some differences between the irregularities detected by satellites and ground-GPS observations in this study, which is summarized by [15]. From observations by CHAMP, density depletions occurred over magnetic latitude ±20°N, and the TEC disturbances also occurred near the EIA crests, where the nightside bubbles usually occurred.
The depletion of electron density from CHAMP could reach about 70%, while the depletions detected by GRACE were around 40% in both hemispheres. As pointed out by Huang et al. [8] from the statistical studies, the depletions of daytime bubbles, as the remnant of the nightside bubbles, were usually not more than 30%. In addition, the remnant of the irregularities would like to stay at a high height for a long duration, where the photo-ionization process is slower [8]. In previous reports, the remnant of irregularities were found in the topside ionosphere above 500 km, e.g., in [8,18]. The freshly generated irregularity near sunrise was found firstly around 250 km and evolved above 400 km [9]. The density disturbances from GRACE occurred later than that by CHAMP, and the altitude GRACE flies was higher. It means that density depletions reached the maximum at CHAMP altitude and began to diffuse with the upward movement. When the irregularities moved upward to ROCSAT-1 and DMSP altitudes, the magnitude of depletions decreased to about 24% and 15%, respectively. Thus, the density depletions from the CHAMP and GRACE observations may be more likely to be related to the fresh irregularities.
Moreover, it can be noted that the TEC disturbances were more significant during 20:00–22:00 UT than that during 16:00–18:00 UT, while TEC did not show the disturbances before 16:00 UT. In both hemispheres, the values of ROTI during 16:00–18:00 UT, which were less than 1 generally, were smaller than that during 20:00–22:00 UT, and the largest ROTI occurred around 20:00 UT (05:48 LT), which exceeded 1.5. It means that the irregularities that occurred near local sunrise may not be the remnant of the irregularities occurred at the previous night, but the fresh and evolutionary-type irregularities similar with the irregularities reported by Tulasi Ram et al. [10], which were generated near sunrise (around 20:00 UT). Based on the observations from the Equatorial Atmosphere Radar (EAR), Tulasi Ram et al. [10] reported the occurrence of fresh FAIs during the recovery phase of a minor storm. The FAIs persisted into the morning sector for more than 90 min after occurring near sunrise, and the occurrence of FAIs was attributed to the prompt penetration of overshielding electric fields.
Prompt penetration of magnetospheric electric field (PPEF) and disturbance dynamo electric field (DDEF) would affect the electrodynamical process in the equatorial and low-latitude ionosphere significantly during the storm periods, such as the vertical plasma drifts driven by the zonal electric field, in addition to the disturbed thermospheric winds.
As shown in Figure 4b, the density at 600 km was enhanced significantly, and the EIA structure was still detected around 11:30 UT (21:35 LT) and 13:06 UT (22:22 LT). On 18 August, the density in low-latitude regions was remarkably larger than that during other days, as shown in Figure 5. From Figure 6, we can also see the EIA around 09:00 UT (19:40 LT) and 10:30 UT (21:10 LT) enhanced more significantly at CHAMP altitude and GRACE altitude than that on other days, respectively. Moreover, it should be noted that TEC values increased significantly in low-latitude regions during 04:00–21:00 UT (14:40–07:40 LT) on 18 August, as shown in Figure 7. Especially during 16:00–21:00 UT (02:40–07:40 LT), it can be seen that EIA was well developed, while EIA structures were not seen in other days.
Generally, EIA would become stronger under the combined effects of both eastward PPEF and storm-time equatorward neutral winds [26]. Assuming the existence of equatorward neutral wind, the EIA would become stronger, and EIA crests move toward the equator. As shown in Figure 4b, EIA crests moved poleward from 11:30 UT (21:35 LT) to 13:06 UT (22:22 LT) at 600 km. In addition, from the observations by CHAMP and GRACE, shown in Figure 6, EIA crests were located farther away from the equator on 18 August relative to that on other days. The TEC map shown in Figure 7 also showed the EIA was obviously enhanced as EIA crests moved poleward to higher latitudes and became more inter-hemispheric asymmetric. Thus, it can be speculated that the zonal electric field in F-region was enhanced during 16:00–21:00 UT, and there was no strong equatorward neutral wind. The enhanced zonal electric field in F-region ionosphere, which may be related to PPEF and DDEF, was beneficial for the initiation of R-T instability, leading to the occurrence of plasma irregularities.
From Figure 1, it can be noted that the plasma irregularities recorded by DMSP, ROCSAT-1, CHAMP and GRACE occurred during the recovery phase of the storm. On 18 August, the IEF Ey was always eastward and reached a maximum at 08:00 UT, with a value of about 7.8 mV/m. The IEF would partially penetrate into the ionosphere as PPEF with an efficiency of ~5 to 10% [34], with the sudden variations of BZ. The IMF BZ was southward and did not show evident sudden variations during the recovery phase of the storm. The PPEFs are mostly eastward during the local daytime and westward at night at all seasons, while the DDEFs are westward near local sunset and become eastward during the nighttime, and DDEFs have the largest values near sunrise [35]. It means that the enhanced zonal electric field in 140–160°E sector may not be related to the PPEF, but the DDEF. As Sripathi et al. [12] pointed out, the presunrise plasma bubbles can be developed under anomalous conditions of the penetration electric field. Under the effect of DDEF, a minor geomagnetic storm can trigger the fresh generation of plasma bubbles locally.
Unfortunately, we cannot find the observations about the equatorial vertical drifts during the August 2003 storm in the 160°E sector. In Figure 10, we present the variations of F layer minimum virtual height (h’F) derived from two low-latitude ionosonde observations at 140°E sector in the southern hemisphere, Vanimo (2.70°S, 141.30°E; Geom. Lat.: 11.19°S; sunrise: 20:37 UT) and Townsville (19.63°S, 146.85°E; Geom. Lat.: 28.95°S; sunrise: 20:32 UT), respectively. The red lines in the figure represent the median values of h’F during August 2003.
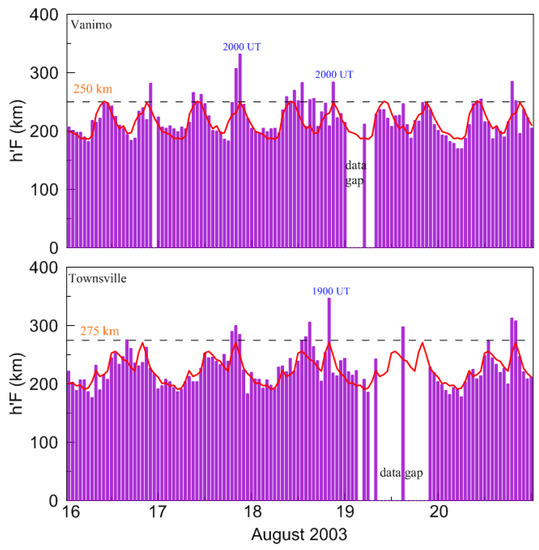
Figure 10.
During 16–20 August, 2003, variations of minimum virtual height (h’F) at Vanimo (top panel) and Townsville (bottom panel), respectively. The red lines represent the median h’F during August 2003.
From Figure 10, we can notice that h’F on 18 August at two low-latitude stations showed a clear increase near local sunrise, which means the elevation of the F-layer and enhancement of the zonal electric field. The h’F on 17 August also showed a remarkable increase around 20:00–21:00 UT (05:40–06:40 LT), which may be related to PPEF.
Furthermore, in Figure 11, we present the variations of Penetration Electric Field and quiet zonal electric field plus penetration electric field derived from the real-time model of the ionospheric electric fields [36] at 160°E sector during 16–20 August, 2003. The Scherliess and Fejer [37] vertical drift model is used as the quiet zonal electric field, which has positive as eastward. The blue line represents the penetration electric field calculated from the IEF Ey and transfer function [36], the magenta line represents the quiet background zonal electric field plus the penetration electric field. In the Indian and South American sectors, the predicted zonal electric fields were in good agreement with observations from the digisonde-derived vertical plasma drifts [9,36].
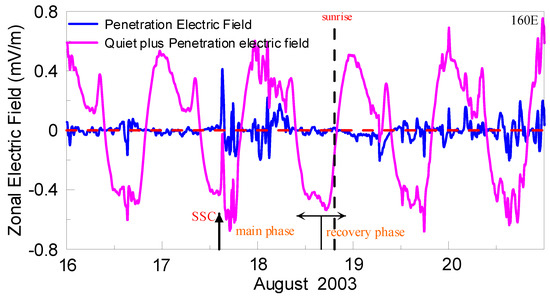
Figure 11.
During 16–20 August, 2003, at 160°E sector, the variations of Penetration Electric Field and quiet plus penetration electric field derived from the real-time model of the ionospheric electric fields.
It can be seen from Figure 11 that the penetration electric field was eastward during 03:00–08:00 UT, with the maximum of about 0.18 mV/m at 05:30 UT, and it was very small during 16:00–24:00 UT, with the magnitude of about 0.01 mV/m, which can be ignored, on 18 August. It means that the PPEF would affect the background electric field during 03:00–08:00 UT (local daytime), and the enhanced zonal electric field during 16:00–21:00 UT (01:40–06:40 LT) may not have mainly resulted from the PPEF.
Previous numerical studies have indicated that the enhanced vertical drifts can occur at low and equatorial latitudes in the sunrise sector, driven by the thermospheric wind disturbance dynamo action [9].
Moreover, the daytime irregularities were detected during the recovery phase of the storm, while no density fluctuations after sunrise before the storm and during other phases of the storm. The observations from DMSP F13 and F15, ROCSAT-1 satellites in the morning sector before and after the storm started can be found in the “Supplementary Materials”. Thus, it can be concluded that the occurrence of daytime irregularities was related to the storm; the DDEF during the recovery phase of the storm would play an important role in the occurrence of daytime irregularities.
In conclusion, it can be speculated that the zonal electric field was enhanced in the F-region during 16:00–21:00 UT (01:40–06:40 LT), mainly due to the DDEF. Furthermore, the enhanced zonal electric field at the bottom of the F-region ionosphere initiated the R-T instability, resulting in the development and occurrence of the irregularities, and also the enhancement of EIA.
In a word, the occurrences of the daytime irregularities, in this case, can be concluded as: (1) at first, the R-T instability was triggered near sunrise at the bottom of the F-layer due to the DDEF, and plasma irregularities generated; (2) plasma irregularities evolved into two hemispheres, with the poleward motions; (3) the density depletions became larger under the effects of the polarization eastward electric field, and moved upward, lasting for more than 3 h into local morning sector, which were detected by ground-based GPS observations and CHAMP, GRACE, ROCSAT-1, DMSP F15 satellites in both hemispheres successively, and the depletion magnitude reached the maximum at CHAMP altitude, with a magnitude of about 70%.
In addition, Shume et al. [13] proposed that wind-driven gradient drift instability may also be a candidate for the occurrence of daytime plasma irregularities. It means that the mechanism or parameters leading to the generation of daytime irregularities need to be studied in the future.
Furthermore, as displayed in Figure 4, daytime blob-like structures in low-latitude regions were also detected by ROCSAT-1 in the southern hemisphere. The occurrences of the blob-like structures may be related to the polarization eastward electric field due to the development of plasma bubbles [38]. Accompanying the occurrence of plasma bubbles near sunrise, the blob-like structures also occurred and persisted into the morning sector.
6. Conclusions
In this study, we have presented the observations of local daytime plasma irregularities around 140–160°E region in both northern and southern hemispheres, recorded by CHAMP, GRACE, ROCSAT-1, DMSP F13, and F15 satellites, as well as three ground-based GPS stations during the recovery phase of the 17–20 August, 2003 storm. The plasma irregularities had larger depletion magnitudes at lower altitude, such as at CHAMP and GRACE altitudes, than that at higher altitude such as ROCSAT-1 and DMSP orbits. The irregularities after sunrise during the recovery phase of the storm detected by multiple satellites were thought of as the fresh irregularities generated near sunrise mainly due to the DDEF, which triggered the development and the evolution of R-T instability, not the remnant of the irregularities generated during the previous nighttime. DDEF plays an important role in the occurrence of daytime irregularities during the recovery phase of a storm. Moreover, daytime plasma blob-like structures in low-latitude regions were also detected by ROCSAT-1 in the southern hemisphere, which needs further study in the future.
Our work indicates that the plasma irregularities can also generate near sunrise and last for several hours, which would affect the propagation of radio waves during the local morning time. When developing the nonlinear model of plasma irregularities in the low-latitude ionosphere, the daytime irregularities should be considered.
Supplementary Materials
The following are available online at https://www.mdpi.com/2072-4292/12/18/2897/s1, Figure S1: During 16–20 August 2003, the variations of ion density from DMSP F13 along the satellite trajectories at 160°E longitude region, Figure S2: During 16–20 August 2003, the variations of ion density from DMSP F15 along the satellite trajectories at 160°E longitude region, Figure S3: During 16–20 August 2003, the variations of ion density from ROCSAT-1 along the satellite trajectories in local daytime sector at 160°E longitude region, Figure S4: During 16–20 August 2003, the ROCSAT-1 tracks in morning sectors. The symbol  represents the sunrise. The short red and green lines on the satellite trajectories represent the plasma blob and bubble encountered by the satellite, respectively, Figure S5: During 16–19 August 2003, at CNMR station, variations of vertical TEC for satellite PRN4 (top panel) and PRN24 (bottom panel), Figure S6: During 16–19 August 2003, at LAEL station, variations of vertical TEC for satellite PRN4 (top panel) and PRN7 (bottom panel).
represents the sunrise. The short red and green lines on the satellite trajectories represent the plasma blob and bubble encountered by the satellite, respectively, Figure S5: During 16–19 August 2003, at CNMR station, variations of vertical TEC for satellite PRN4 (top panel) and PRN24 (bottom panel), Figure S6: During 16–19 August 2003, at LAEL station, variations of vertical TEC for satellite PRN4 (top panel) and PRN7 (bottom panel).Author Contributions
W.L. analyzed the data and prepared the manuscript, C.X. discussed the results and modified the manuscript, J.X., Z.Z. and S.C., help to analyze the data and discussed the results. All authors have read and agreed to the published version of the manuscript.
Funding
The work is supported by the National Natural Science Foundation of China (41474134, 41474135, 41704161).
Acknowledgments
The Dst and Kp data were downloaded from the World Data Center at Kyoto (http://swdcdb.kugi.kyoto-u.ac.jp/dstdir/index.html). We acknowledge UCAR, NCU, UT at Dallas, and ACE science centre for providing the satellite data, respectively. The ROCSAT-1 data can be downloaded from NCU (http://sdbweb.ss.ncu.edu.tw/ipei_download.html). The DMSP data can be downloaded from the Center for Space Science at the University of Texas at Dallas (http://cindispace.utdallas.edu/DMSP/dmsp_data_at_utdallas.html). The CHAMP and GRACE data can be downloaded from CDAAC (http://cdaac-www.cosmic.ucar.edu/cdaac/products.html). The Interplanetary Magnetic Field and Solar wind speed were downloaded from the ACE center (http://www.srl.caltech.edu/ACE/ASC/). The IGS TEC data were downloaded from the Madrigal Database at Haystack Observatory (http://madrigal.haystack.mit.edu/madrigal/index.html). The GPS RINEX data were downloaded from the IGS FTP site (ftp://igs.gnsswhu.cn/pub/). The ionosonde data can be downloaded from the Australian Space Weather Service FTP (ftp://ftp-out.sws.bom.gov.au/wdc/iondata/). The real-time model of the ionospheric electric field can be accessed from CIRES (http://geomag.org/models/PPEFM/RealtimeEF.html). The authors are grateful to the reviewers for their constructive comments on the manuscript.
Conflicts of Interest
The authors declare no conflict of interest.
References
- Kelley, M.C. The Earth’s Ionosphere: Plasma Physics & Electrodynamics, 2nd ed.; International Geophysics Series; Academic Press: San Diego, CA, USA, 2009; ISBN 978-0-12-088425-4. [Google Scholar]
- Sidorova, L.N.; Filippov, S. Plasma bubbles in the topside ionosphere: Estimations of the survival possibility. J. Atmos. Terr. Phys. 2014, 119, 35–41. [Google Scholar] [CrossRef]
- Oya, H.; Takahashi, T.; Watanabe, S. Observation of low latitude ionosphere by the impedance probe on board the Hinotori satellite. J. Geomagn. Geoelectr. 1986, 38, 111–123. [Google Scholar] [CrossRef]
- Watanabe, S.; Oya, H. Occurrence characteristics of low latitude ionosphere irregularities observed by impendence probe on board the Hinotori satellite. J. Geomagn. Geoelectr. 1986, 38, 125–149. [Google Scholar] [CrossRef]
- Chau, J.L.; Woodman, R.F. Interferometric and dual beam observations of daytime spread-F-like irregularities over Jicamarca. Geophys. Res. Lett. 2001, 28, 3581–3584. [Google Scholar] [CrossRef]
- Fukao, S.; Ozawa, Y.; Yamamoto, M.; Tsunoda, R.T. Altitude-extended equatorial spread F observed near sunrise terminator over Indonesia. Geophys. Res. Lett. 2003, 30, 2137. [Google Scholar]
- Li, J.; Ma, G.; Maruyama, T.; Li, Z. Mid-latitude ionospheric irregularities persisting into late morning during the magnetic storm on 19 March 2001. J. Geophy. Res. Space Phys. 2012, 117, A08304. [Google Scholar] [CrossRef]
- Huang, C.S.; de La Beaujardiere, O.; Roddy, P.A.; Hunton, D.E.; Ballenthin, J.O.; Hairston, M.R. Long-lasting daytime equatorial plasma bubbles observed by the C/NOFS satellite. J. Geophy. Res. Space Phys. 2013, 118, 2398–2408. [Google Scholar] [CrossRef]
- Zakharenkova, I.; Astafyeva, E.; Cherniak, I. Early morning irregularities detected with spaceborne GPS measurements in the topside ionosphere: A multisatellite case study. J. Geophy. Res. Space Phys. 2015, 120, 8817–8834. [Google Scholar] [CrossRef]
- Tulasi Ram, S.; Ajith, K.K.; Yamamoto, M.; Otsuka, Y.; Yokoyama, T.; Niranjan, K.; Gurubaran, S. Fresh and evolutionary-type field-aligned irregularities generated near sunrise terminator due to overshielding electric fields. J. Geophy. Res. Space Phys. 2015, 120, 5922–5930. [Google Scholar] [CrossRef]
- Jiang, C.; Yang, G.; Liu, J.; Yokoyama, T.; Komolmis, T.; Song, H.; Lan, T.; Zhou, C.; Zhang, Y.; Zhao, Z. Ionosonde observations of daytime spread F at low latitudes. J. Geophy. Res. Space Phys. 2016, 121, 12093–12103. [Google Scholar] [CrossRef]
- Sripathi, S.; Abdu, M.A.; Patra, A.K.; Ghodpage, R.N. Unusual generation of localizred EPB in the dawn sector triggered by a moderate geomagnetic storm. J. Geophy. Res. Space Phys. 2018, 123, 9697–9710. [Google Scholar] [CrossRef]
- Woodman, R.F.; Pingree, J.E.; Swartz, W.E. Spread-F like irregularities observed by the Jicamarca during the day-time. J. Atmos. Terr. Phys. 1985, 47, 867–874. [Google Scholar] [CrossRef]
- Shume, E.B.; Rodrigues, F.S.; de Paula, E.R.; Batista, I.S.; Butala, M.D.; Galvan, D.A. Day-time F region echoes observed by the Sao Luis radar. J. Atmos. Sol. Terr. Phys. 2013, 103, 48–55. [Google Scholar] [CrossRef]
- Park, J.; Stolle, C.; Xiong, C.; Lühr, H.; Pfaff, R.F.; Buchert, S.; Martinis, C.R. A dayside plasma depletion observed at midlatitudes during quiet geomagnetic conditions. Geophys. Res. Lett. 2015, 42, 967–974. [Google Scholar] [CrossRef]
- Park, J.; Kil, H.; Stolle, C.; Lühr, H.; Coley, W.R.; Coster, A.; Kwak, Y.S. Daytime midlatitude plasma depletions observed by Swarm: Topside signatures of the rocket exhaust. Geophys. Res. Lett. 2016, 43, 1802–1809. [Google Scholar] [CrossRef]
- Li, G.; Ning, B.; Abdu, M.A.; Wang, C.; Otsuka, Y.; Wan, W.; Lei, J.; Nishioka, M.; Tsugawa, T.; Hu, L.; et al. Daytime F-region irregularity triggered by rocket-induced ionospheric hole over low latitude. Prog. Earth Plan. Sci. 2018, 5. [Google Scholar] [CrossRef]
- Chen, G.; Jin, H.; Yan, J.; Zhang, S.; Li, G.; Yokoyama, T.; Yang, G.; Yan, C.; Wu, C.; Wang, J.; et al. Low-latitude daytime F region irregularities observed in two geomagnetically quiet days by the Hainan coherent scatter phased array radar (HCOPAR). J. Geophy. Res. Space Phys. 2017, 122, 2645–2654. [Google Scholar] [CrossRef]
- Rich, F.J.; Hariston, M. Large-scale convection patterns observed by DMSP. J. Geophy. Res. Space Phys. 1994, 99, 3827–3844. [Google Scholar] [CrossRef]
- Yeh, H.C.; Su, S.Y.; Yeh, Y.C.; Wu, J.M.; Heelis, R.A.; Holt, B.J. Scientific mission of the IPEI payload onboard ROCSAT-1. Terr. Atmos. Ocean. Sci. 1999, 10, 19–42. [Google Scholar] [CrossRef]
- Reigber, C.; Luhr, H.; Schwintzer, P. CHAMP mission status. Adv. Space Res. 2002, 30, 129–134. [Google Scholar] [CrossRef]
- McNamara, L.; Cooke, D.L.; Valladares, C.E.; Reinisch, B.W. Comparison of CHAMP and Digisonde plasma frequencies at Jicamarca, Peru. Radio Sci. 2007, 42, RS2005. [Google Scholar] [CrossRef]
- Tapley, B.D.; Bettadpur, S.; Watkins, M.; Reigber, C. The gravity recovery and climate experiment: Mission overview and early results. Geophys. Res. Lett. 2004, 31, L09607. [Google Scholar] [CrossRef]
- Xiong, C.; Park, J.; Lühr, H.; Stolle, C.; Ma, S.Y. Comparing plasma bubble occurrence rates at CHAMP and GRACE altitudes during high and low solar activity. Ann. Geophys. 2010, 28, 1647–1658. [Google Scholar] [CrossRef]
- Xiong, C.; Lühr, H.; Fejer, B.G. Validation of GRACE electron densities by incoherent scatter radar data and estimation of plasma scale height in the topside ionosphere. Adv. Space Res. 2015, 55, 2048–2057. [Google Scholar] [CrossRef]
- Balan, N.; Liu, L.; Le, H. A brief review of equatorial ionization anomaly and ionospheric irregularities. Earth Plan. Phys. 2018, 2, 257–275. [Google Scholar] [CrossRef]
- Pi, X.; Mannucci, A.J.; Lindqwister, U.J.; Ho, C.M. Monitoring of global ionospheric irregularities using the worldwide GPS network. Geophys. Res. Lett. 1997, 24, 2283–2286. [Google Scholar] [CrossRef]
- Xu, J.S.; Zhu, J.; Chen, G. GPS observations of ionospheric effects of the major storm of Nov. 7–10, 2004. Chinese J. Geophys. 2006, 49, 950–956. [Google Scholar] [CrossRef]
- Yang, Z.; Liu, Z. Correlation between ROTI and ionospheric scintillation indices using Hong Kong low-latitude GPS data. GPS Solut. 2016, 20, 815–824. [Google Scholar] [CrossRef]
- Cherniak, I.; Krankowshi, A.; Zakharenkova, I. ROTI maps: A new IGS ionospheric product characterizing the ionospheric irregularities occurrence. GPS Solut. 2018, 22, 69. [Google Scholar] [CrossRef]
- Otsuka, Y. Review of the generation mechanisms of post-midnight irregularities in the equatorial and low-latitude ionosphere. Prog. Earth Plan. Sci. 2018, 5, 57. [Google Scholar] [CrossRef]
- Ajith, K.K.; Tulasi Ram, S.; Yamamoto, M.; Otsuka, Y.; Niranjan, K. On the fresh development of equatorial plasma bubbles around the midnight hours of June solstice. J. Geophy. Res. Space Phys. 2016, 121, 9051–9062. [Google Scholar] [CrossRef]
- Gurram, P.; Kakad, B.; Bhattacharyya, A.; Pant, T.K. Evolution of freshly generated Equatorial Spread F (F-ESF) irregularities on quiet and disturbed days. J. Geophy. Res. Space Phys. 2018, 123, 7710–7725. [Google Scholar] [CrossRef]
- Verkhoglyadova, O.P.; Tsurutani, B.T.; Mannucci, A.J.; Saito, A.; Araki, T.; Anderson, D.; Abdu, M.; Sobral, J.H.A. Simulation of PPEF Effects in Dayside Low-Latitude Ionosphere for the October 30, 2003, Superstorm; Geophysical Monograph 181, Midlatitude Ionospheric Dynamics and Disturbances; Wiley-Blackwell Publishing Ltd.: Hoboken, NJ, USA, 2008; pp. 169–178. [Google Scholar]
- Fejer, B.G.; Jensen, J.W.; Su, S.Y. Seasonal and longitudinal dependence of equatorial disturbance vertical plasma drifts. Geophys. Res. Lett. 2008, 35, L20106. [Google Scholar] [CrossRef]
- Manoj, C.; Maus, S. A real-time forecast service for the ionospheric equatorial zonal electric field. Space Weather 2012, 10, S09002. [Google Scholar] [CrossRef]
- Scherliess, L.; Fejer, B.G. Radar and satellite global equatorial F region drift model. J. Geophy. Res. Space Phys. 1999, 104, 6829–6842. [Google Scholar] [CrossRef]
- Huang, C.S.; Le, G.; de La Beaujardiere, O.; Roddy, P.A.; Hunton, D.E.; Pfaff, R.F.; Hairston, M.R. Relationship between plasma bubbles and density enhancements: Observations and interpretation. J. Geophy. Res. Space Phys. 2014, 119, 1325–1336. [Google Scholar] [CrossRef]
© 2020 by the authors. Licensee MDPI, Basel, Switzerland. This article is an open access article distributed under the terms and conditions of the Creative Commons Attribution (CC BY) license (http://creativecommons.org/licenses/by/4.0/).