Technical Note

Preliminary Results of Ship Detection Technique by Wake Pattern Recognition in SAR Images

by
Maria Daniela Graziano
Department of Industrial Engineering, University of Naples “Federico II”, Piazzale Tecchio, 80, 80125 Naples, Italy
Remote Sens. 2020, 12(18), 2869; https://doi.org/10.3390/rs12182869
Submission received: 7 August 2020 / Revised: 1 September 2020 / Accepted: 2 September 2020 / Published: 4 September 2020

Abstract

:
Recently, international agencies for border security ask for an improvement of the actual Maritime Situational Awareness. This manuscript presents preliminary results of a detection technique of go-fast boats, whose utilization in illegal affairs is strongly increasing. Their detection is very challenging since: (i) their echo is not visible in SAR images, and (ii) the illegal activities are carried out in the nighttime making useless the optical sensors. However, their wakes are very persistent and extent in SAR images for some kilometers. Hence, the manuscript shows an innovative deterministic methodology for the ship detection based on the wake signature. It firstly identifies pixels crossed by the wakes, whose presence is, then, validated in two steps. The first level of validation estimated how prominent the wake components are with respect to their background. The second level of validation exploits the presence of the wakes among neighbor pixels. The approach has been applied on ships imaged by TerraSAR-X mission showing the same peculiarities of go-fast boats. Results highlight the potentialities of the proposed approach, which can be also conceived as a subsequent step in a hybrid system, whose preliminary wake detection screening is carried out by different techniques.

Graphical Abstract

1. Introduction

The security of the maritime domain is not a given and only an improvement of Maritime Situational Awareness (MSA) can guarantee a larger Maritime Security [1]. This NATO’s statement well pinpoints the principal aim of the MSA, i.e., to reach an effective understanding of any activity associated to the maritime domain, from legal activities, such as fishing, drilling, exploration, or cargo transport, to illegal matters, such as piracy and goods traffic. The strong interest of the international community towards the improving of MSA is also proved by still open H2020 calls [2,3].
Currently, many systems are available for maritime surveillance purposes [4,5,6,7,8]. First of all, the Automatic Identification System (AIS), a collaborative system in which medium and large ships (>300 tons) are equipped by a transponder transmitting vessels identification data and information about their route [9], enabling ship-to-ship and ship-to-shore data exchange. Since the AIS system is conceived on a collaborative perspective, AIS transponder can be deliberately turned off by the crew. The non-cooperative systems for maritime surveillance are based on optical/infrared cameras and radar sensors [4]. However, thanks to its capability of data acquisition under all weather and day-and-night conditions, the satellite-based radar images, usually gathered by Synthetic Aperture Radar (SAR), are widely exploited.
In the ambit of SAR-based maritime surveillance, the manuscript brings forward a new concept to improve Maritime Situational Awareness, overcoming the idea of ship detection based on ship echoes in radar images. Indeed, recent studies [10,11,12] have shown that a class of vessels, called go fast boats, are adopted by smugglers for transportation of drugs and other goods. As they have to face high-speed operations, such vessels are planing hull forms. They usually have a length between 10 to 15 m, and they can reach speeds greater than 80 knots in calm water, and up to 50 knots in rough sea depending on their operational limits, being equipped with powerful engines delivering up to 1000 hp [10,11]. Their hulls are usually made of fiberglass with a sharp, vertically rounded bow, hard chine and a transom stern in order to reduce resistance (hard chines and transom stern facilitate flow separation around the hull), and high values of the deadrise angle (“deep-V hull”) to improve seakeeping and maneuverability performances. In addition, due to materials, size, and velocity, the ship echo could not be distinguishable. In fact, the faster the ship, the stronger the smearing and the defocusing in the SAR image are and residual ship signatures can become so weak that they are masked by sea clutter or image noise [13,14]. Moreover, in order to complicate their detection, the European border and coast guard agency, Frontex [10], has confirmed that the illegal activities are typically carried out during the nighttime, making impossible the utilization of the optical sensors. However, the characteristics, making the go-fast boats so attractive, also have an interesting drawback. Thanks to their high velocity and narrow beam, the go-fast boats are likely to produce long visible wakes. Such wakes are very persistent, lasting for distances of several kilometers [8,15,16,17], and they can be observed in Synthetic Aperture Radar (SAR) imagery.
Hence, the core concept of the manuscript is that the go-fast boats can be detected in SAR images by using their wake as a signature of their presence.
Ship wake in SAR images appears as a fan of bright linear components around a central dark line, representing the turbulent wake [17]. It is generated by the ship’s propeller that dampens the surface waves, reflecting less energy back to the radar, and propagates along the ship longitudinal axis till 20 to 30 ship lengths aft [18]. Two bright linear components are typically imaged next to the turbulent wake on both opposite sides. It is widely assumed that such bright components appear within 4° from the turbulent wake and they are classified as narrow-V wakes. The most external pair of wakes is representative of the divergent component of the Kelvin pattern, which is composed also of transverse waves. The latter ones travel mostly along the motion direction, which is aligned to the ship’s main axis, whereas the divergent wakes appear as diagonal crests moving outwardly from the ship’s location. Both transverse waves and divergent waves mostly develop in a cone which, if the ship is approximated by a point disturbance [19], has an aperture of 38°56′, defined by the cusp waves generated along the crest of the Kelvin arms. A diagram of the wake structure is shown in [16,20].
The wake observability in SAR image is strongly related to ship-, SAR- and sea-related conditions. In fact, it is more distinguishable when: (a) the ship is larger, (b) the ship is faster, (c) the radar incidence angle is smaller, and (d) the ship is moving along the looking direction of the radar [21]. In addition, the wake features are more detectable when wind speed is in the range of 3–7 m/s, even if the visibility of the Kelvin arms is improved for lower wind speeds, since the contrast between cusp waves and background sea surface roughness is higher.
Since wakes appear as dark or bright lines, the existing wake detection algorithms identify linear features in a noisy background. In [22], the authors review the existing algorithms for line detection in SAR images, considering the most used approaches and confirm the large utilization of the Radon transform for wake detection algorithms. The Radon transform [16] integrates image brightness along straight lines. Therefore, one bright (dark) linear feature in the input image leads to one peak (trough) in the Radon domain. Radon transform was first proposed for ship wake detection in SAR images by Murphy [23] in 1986 and since then, plenty of experimental results have analyzed its limitations and confirmed its effectiveness for wake detection purposes. In this ambit, an original wake detection algorithm for ship velocity estimation is presented in [24]. The technique takes advantages from the Radon-based previous techniques [16,25], but it has been conceived to overcome their intrinsic limitations by exploiting the relative angular distance of wake components during the detection process. The results [24,26,27] showed that the vast majority of wake components are correctly detected and also validated in critical situations.
The technique in [24] has been recently improved in [28,29] adding a pre-processing step enhancing the wake components in the Radon domain. Results confirm the high accuracy (larger than 80%) of detection performance of the Radon-based technique.
However, the above-mentioned approaches start from an a-priori knowledge of the ship location (detected thanks to ship echoes in the image) and, hence, are not applicable to go-fast boats.
Recent studies have detected ships using deep learning techniques such as Convolutional Neural Networks (CNNs) for image-based feature extraction [30,31,32,33]. Interesting results of CNN-based wake detection are shown in [34]. Nonetheless the limited number of available SAR images, the authors [34] state that the CNN is a useful tool for detecting the presence of wake. However, the purpose of the paper is the estimation of ship velocity, and the technique has been applied over a small tile including ship echo.
Hence, neither deterministic nor machine learning based techniques are currently available for the detection of the go-fast boats. Then, the manuscript presents preliminary results of a technique for wake detection in SAR images, without any a priori knowledge of ship position and enabling the detection of go-fast boats.
The paper is organized as follows: the proposed method is detailed in Section 2 and results are shown in Section 3 and discussed in Section 4. Finally, conclusions summarize the potentialities of the approach and future developments.

2. Method Description

2.1. Rationale and Originalities

The wake appearance depends on length, beam and velocity of the ship [16]. When the velocity is very large, as in the case of the vessels object of this study, the ship wake can be significantly narrow. The angle of the wedge generated can be significantly smaller than the Kelvin angle of 38°56′ due to the interference between the wave systems created by the bow and stern of the ship. Increasing the speed, the transverse waves tend to vanish while the divergent waves tend to increase their amplitude.
Very few results [11] are available on the wake characterization of go-fast boats. Recent investigations [11,35] confirm that in both optical and radar images (a) the angular aperture between the wake components is significantly narrower and (b) the classical Kelvin wake explanation of the pattern is insufficient. The authors agree that the go-fast boats’ wake shows the turbulent component and the narrow-V wakes, which are produced even when the source at the bow are not cancelled by sinks at the stern.
The proposed approach takes full advantages from the technique shown in [24], but a different solution is proposed and tested in order to detect the wake produced by go-fast boats. The main innovation is that it separates the wake detection process from the ship trace in the radar image. In fact, each pixel of the image is analyzed to identify if there are wakes crossing the pixel. The detection of the wake is carried out on the basis of merit indexes, which are an additional original aspect of the proposed technique. In fact, two different levels of wake validation are proposed (as detailed in Section 2.2), the first one is relative to the wake presence in a single pixel and the second one is relative to the wake presence in neighbor pixels. This strongly increases the level of confidence that the wake is really imaged.
For sake of clarity, the main originalities can be summarized as follows:
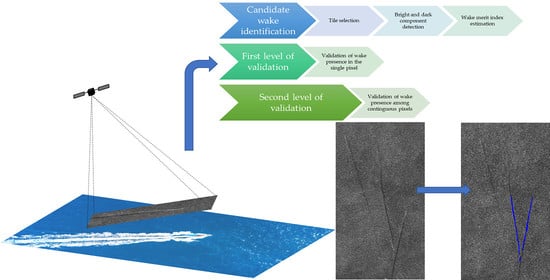
  • The proposed approach separates the wake detection process from the ship trace in the radar image. In fact, each pixel of the image is analyzed to identify if there are wakes crossing the pixel.
  • Only the turbulent and narrow-V components of the wake is searched as a marker of the ship presence
  • After the wake candidate reconstruction, two levels of wake presence validation are proposed (as detailed in Section 2.2), the first one is relative to the wake presence in a single pixel and the second one is relative to the wake presence in neighbor pixels. This strongly increases the level of confidence that the wake is really imaged.
  • A new index of merit of the wake presence is introduced and refereed to the whole wake and not to each wake component

2.2. Method Details

The flow-chart of the proposed wake-based detection process is shown in Figure 1.
The SAR image is scanned pixel-by-pixel or defining a proper pixel grid, in order to detect which pixels are crossed by wakes. An image tile is identified around each pixel under analysis, whose size is set on the basis of turbulent wake extent, i.e., few kilometers, and, then, the identification of the turbulent and narrow-V components of the wake is carried out.
For the convenience of the reader, the main steps of the detection can be summarized as follows: (1) a tile is selected around its center, (2) the Radon Transform is applied to the tile properly masked to account for land and ship echoes, (3) the wake components are selected in the Radon domain as peaks/toughs satisfying particular criteria derived from wake geometry, and (4) the presence of each wake feature is validated by merit indexes, based on the estimation of how much their appearance is different from the background. The merit index of the bright component is calculated along the detected half-line, discarding the 5% brighter pixels of the half line to filter out the effect of localized brighter spots along dimmer lines. It is estimated by Equation (1) [24].
F v = C D F 1 ( 0.95 ) 0.95   n   I ¯ 1
where CDF(xi) is the cumulative distribution function of the image intensity (xi) along the identified half-line. In addition, n is the number of pixels of the half-line, and I ¯ is the intensity mean value over the whole tile.
The merit index of the turbulent wake is estimated by Equation (2) [24], in which I ¯ t is the intensity mean value over the turbulent half-line.
F t = I ¯ t   I ¯ 1
How such indexes are used to validate the ship/wake presence is an original contribution of this manuscript. In [24], they are exploited to confirm that the related wake component is really imaged on the basis of the single index value, i.e., each index validates the presence of each wake component. Instead, since the proposed approach implies that the wake is considered as really imaged when both turbulent and narrow-V wake is shown, a new merit index of the wake is introduced and defined by Equation (3).
F w = F v · | F t |
High values of F w imply that the wake components both appear as very dark and very bright linear features, validating the ship/wake presence. On the contrary, low values of F w imply a low confidence level that the wake is really imaged. If F w is negative, the wake is not present.
Then, a global threshold detector is implemented as a segmentation algorithm. The threshold value is set based on the statistical distribution of the wake index F w . Even if no theoretical proofs are provided herein, the assumption of a bell-shaped Gaussian can be empirically verified (see Section 3). This implies that a list of candidate wakes can be identified as the pixels whose wake merit index satisfies Equation (4), in which μ and σ are the mean value and the standard deviation of the F w distribution, respectively.
F w > μ + k σ
Finally, the wake presence in neighbor pixels is investigated in the second level of validation. In details, around each candidate pixel, the half-line representative of the turbulent component is reconstructed by means of (θ,s) pair estimated in the previous phase. Then, a null matrix with the same size of the tile is built (Figure 2): when the image pixel is crossed by the reconstructed wake, the value of the matrix cell in the same location is increased by 1. Since the turbulent component extends for kilometers, the same wake component is detected in tiles centered in neighbor pixels. Hence, the cells corresponding to pixels affected by the wake show a score larger than 1 and its score is a measure of the confidence level of the wake presence.

3. Results

The proposed approach has been applied on a StripMap image (Figure 3) gathered by TerraSAR-X over the Gulf of Naples, whose parameters are listed in Table 1. The VV polarization monostatic product only is used, whose geometric resolutions (1.2 m-slantrange, 6.6 m-azimuth) coincide with those of the standard TerraSAR-X dual-polarization, Stripmap product. The image is characterized by calm sea conditions with low wind speed (i.e., 4–6 m/s) and with a local incidence angle of about 28°. As detailed in [36], wind speed has been estimated by using XMOD [37] with the local incidence angle. The image has been selected since it shows wakes very similar to the one generated by go-fast boats, i.e., (a) no bright returns from the ship, (b) at least one dark and one bright component, and (c) no classical Kelvin pattern appearance.
It is worth noting that a portion of sea without wakes is included in the image allowing the test of the false detection performance of the technique, i.e., detected wakes when they are not imaged.
The candidate wake identification is hereinafter detailed for the pixel shown as a yellow dot in Figure 3. It has been chosen as an interesting test case since the tile (see Figure 5a), on which the wake detection analysis is carried out, includes portions of all the three wakes.
The main steps of the wake reconstruction around the pixel are summarized in Figure 4. Only the detection of the turbulent and one narrow-V components are included in the procedure, whose details can be found in [24].
The tile of 2000 × 2000 pixels is set (Figure 5a). It includes portions of three wakes: only wake a crosses the pixel under analysis corresponding to the tile center, whereas wake b is very prominent and wake c is weaker. This implies a stronger couple peak/trough relative to wake b in the Radon domain than the couple of wake c (Figure 5b). The peaks/troughs are only searched where they are expected to be, opportunely limiting the search area in terms of (θ,s). In details, the trough/peak pair corresponding to the turbulent wake and one narrow-V wake must be within a 4° of angular distance. To this end, the Radon domain is restricted to search only the wake crossing the tile center [24], and the trough/peak pair is selected as the one which maximizes their intensity difference. The results of the previous detection phase are two points in the Radon domain, each one identified by the coordinates (θ,s) and representing a candidate component of the typical wake appearance. The estimation of merit indexes is performed in the input domain (intensity image), thus the inverse Radon Transform is applied. However, the 180°-ambiguity in the ship heading must be solved, i.e., the inverse Radon Transform returns lines and not-half-lines. To this end, the lines of the wake components are intersected with the constant-range line passing through the tile center. Then, the turbulent wake is identified as the half line with lower mean intensity. The narrow-V half-line is identified as the ones within 90° from the unambiguous turbulent wake half line.
Results (Figure 5c) show that the wake a is correctly detected, whereas the wakes b and c are discarded, since they do not cross the tile center. Finally, the merit indexes Fv and Ft can be estimated for the pixel identified by the yellow dot.
The first level of validation of the wake presence requires the evaluation of the distribution of the merit index Fw, estimated over the SAR image. Figure 6 shows the statistical distribution of the Fw along with the bell-shaped distribution fitting the data (shown as red line) and the merit index value corresponding to corresponding to μ + 2 σ (shown as vertical black line). Results confirm that (i) the pixels belonging to the sea lead to a bell-shaped distribution, and (ii) the pixels belonging to the wake satisfy Equation (4). Indeed, it is interesting to note that pixels showing merit index values larger than the vertical black line are the ones belonging to the wakes. Such pixels are shown as full yellow circles in Figure 7, whereas all the pixels in which the wake identification phase is applied are shown as empty yellow circle.
The second level of validation aims to limit the false detection rate, discarding the wakes, whose presence is not validated in neighbor pixels. This is the case of the false detection in Figure 7. To this end, the score-based approach is implemented, and the results are shown in Figure 8a. White, blue, and red identify pixels crossed by 1, 2, and 3 wakes, respectively. Since each candidate pixel implies one reconstructed wake, the component due to the false detection is also shown in Figure 8a as a white line. Then, since it is due to a false detection, no wake presence is identified in neighbor pixels and, hence, it can be discarded by the score logic approach.
The effectiveness of the proposed technique is confirmed by the results shown in Figure 8b, which shows pixels crossed by at least one wake.

4. Discussion

Further investigations are needed on the missed wake (Figure 8a). In Figure 9, which shows that direction of the turbulent wake in each grid point, two grid points are located on the missed wake and, in such pixels, the reconstructed wake direction is aligned with the turbulent wake. This allows us to affirm that the candidate wake identification is properly performed. However, the wake does not satisfy Equation (4) due to the very low values of merit indexes relative to narrow-V wake. Indeed, in wake a, which is the most prominent of the image, the values of the turbulent and narrow-V wake are 0.57 and 0.15; instead, their values in wake c decrease until 0.39 and −0.04. This is due to the appearance of the wake c, which shows bright narrow-V wakes only close to the ship location, whereas they appear very weak elsewhere and, in particular, where the grid points lie on the turbulent component.
As mentioned in the Introduction, wakes observability increases if [21,38]: (i) the ship is large, (ii) the ship is fast, and (iii) the wind speed is low. Such parameters are also related each other. Indeed, it has been stated [21] that the wake is clearly distinguishable for high ship velocity along with low wind speed. In addition, such improvement increases with the ship length. Additionally, the looking direction of the radar beam can darken some components [38,39].
From an operational user’s perspective, the high speed reachable by the go-fast boats (up to 50 knots) can be considered as an important enhancing factor of the wake observability in SAR images. In fact, the ship velocity has a monotonic influence on the detectability: when the speed increases, the detectability increases. Furthermore, the ship speed is the parameter with the most influence. In [38], it has been shown that, when the ship velocity is about 23 knots (12 m/s), the probability of wake detection is: (a) larger than 80% no matter the course-over-ground and with ship length of 20 m, and (b) larger than about 70%, even with wind condition corresponding to 5 btf—fresh breeze (i.e., 17–21 knots on the Beaufort scale).
Focusing on sea conditions only, assuming that flat or low waves in the sea are ideal both for completing illegal activities in the smallest time and for the wake detection, the auxiliary exploitation of meteorological data, to decide if/when the wake detection can be carried out, can strongly help both processing resources and successful rate.
To investigate the operative utilization of the proposed detection technique, data availability and latency have to be discussed. Different issues shall be considered: (a) time of satellite passage, (b) revisit time of constellation, and (c) data latency.
The nighttime observation capabilities of the SAR are indisputable, but the most exploited SAR satellites operate in dusk/dawn orbit and, practically, share the same line-of-nodes. The former one poses a serious obstacle to the monitoring of illegal activities during nighttime, and the latter one strongly limits the achievable revisit time, also considering the synergic exploitation of several constellations. A revisit time analysis of the COSMO/SkyMed constellation has been carried out in [40], showing that the Mediterranean area is recovered in about 12 h, which slightly reduces if the entire globe is considered thanks to the lower revisit time of the high latitude. However, an important trend in satellite remote sensing technology is towards system miniaturization, e.g., spaceborne SAR missions have been successfully deployed relying on very compact platforms, i.e., the Israeli TecSAR (300 kg launch mass) [41], the Indian RISAT-2 (300 kg launch mass) [42], and the Finnish ICEYE-X1 (70 kg launch mass) [43]. This is strongly fostering the realization of SAR satellite constellations based on inclined orbits with different right ascension of the ascending node, enabling nighttime observations and very short revisit time, e.g., 1 h by the complete ICEYE constellation [43].
With reference to the time span between SAR data collection and positive wake detection, the proposed technique is assumed to be applied when the SAR mission is operating in the Near-Real Time mode. This enables a time span between product acquisition and processing of 30 min.

5. Conclusions

The manuscript presents preliminary results of a technique that could be used for the detection of go-fast boats when their wakes are observable in SAR imagery in favorable weather conditions. The proposed algorithm implies the detection of pixels crossed by wake. To this end, a tile is selected around each pixel and the wake components are identified by using the Radon Transform. The wake structure is assumed to be composed of at least one dark and one bright linear component, which are detected in the Radon domain exploiting the relative angular distance set by hydrodynamic analysis. Then, the wake presence is validated by means of the wake merit index, which measures how bright and dark the detected components are with respect to the background of the tile. The above-mentioned steps allow the identification of a list of pixels crossed by the wake. In order to limit the false detection rate, an additional level of validation is introduced. In detail, since the wake extends for kilometers, neighbor pixels should be affected by its trace. Hence, the wakes validated by the merit index are plotted on the SAR image and the wakes not detected by neighbor pixels are classified as false detections.
The proposed algorithm has been applied over an X-band image gathered by TerraSAR-X over the Gulf of Naples. Results show the potentialities of the proposed approach, in terms of wake pattern recognition in SAR images and rejection of false detections. In fact, two imaged wakes are correctly reconstructed, whereas the second level of validation discards the false detected wake. Additional investigations will be carried out to properly manage the missed detection, which is here due to very low value of merit index of narrow-V wake.
The parameters influencing the wake detectability have been discussed from an operational user’s perspective. Limitations due to adverse sea conditions exist, even if, thanks to the enhancing action of high-speed values, the probability of wake detection is larger than 70% for ship length of 20 m under moderate wind conditions (wind speed < 10 m/s).
The proposed technique is presented as a stand-alone approach for ship detection in SAR images, but it can be conceived as integrated in a future hybrid system for MSA, that exploits together the potentialities of deep-learning and deterministic approaches, to optimize the computation time and the resources necessary to detect wakes. In a first step, the CNN could be used to automatically detect and delimit areas affected by the ship wakes in SAR images; these areas could be then analyzed in a subsequent step with deterministic approaches to confirm and exactly locate the wakes generated by go-fast boats.
Future investigations will be devoted to assess the detection performance as a function of: (a) sea-wind conditions and ship velocity, and (b) evaluate the integration of the proposed approach in a hybrid system, in which the capabilities of the deterministic approach are exploited in delimited areas affected by the ship wakes in SAR images, previously identified by machine learning techniques.

Funding

This research received no external funding.

Acknowledgments

In this section you can acknowledge any support given which is not covered by the author contribution or funding sections. This may include administrative and technical support, or donations in kind (e.g., materials used for experiments).

Conflicts of Interest

The author declares no conflict of interest.

References

  1. NATO-MSA. Available online: https://www.coecsw.org/our-work/projects/maritime-situational-awareness/ (accessed on 27 June 2020).
  2. Call H2020 1. Available online: https://ec.europa.eu/info/funding-tenders/opportunities/portal/screen/opportunities/topic-details/edidp-msc-is-2020 (accessed on 29 June 2020).
  3. Call H2020 2. Available online: https://ec.europa.eu/info/funding-tenders/opportunities/portal/screen/opportunities/topic-details/su-bes03-2018-2019-2020 (accessed on 29 June 2020).
  4. Kanjir, U.; Greidanus, H.; Oštir, K. Vessel detection and classification from spaceborne optical images: A literature survey. Remote Sens. Environ. 2018, 207, 1–26. [Google Scholar] [CrossRef] [PubMed]
  5. Greidanus, H.; Alvarez, M.; Santamaria, C.; Thoorens, F.-X.; Kourti, N.; Argentieri, P. The SUMO Ship Detector Algorithm for Satellite Radar Images. Remote Sens. 2017, 9, 246. [Google Scholar] [CrossRef] [Green Version]
  6. Greidanus, H. Satellite imaging for maritime surveillance of the European seas. In Remote Sensing of the European Seas; Springer: Dordrecht, The Netherlands, 2008; ISBN 9781402067716. [Google Scholar]
  7. Vachon, P.W.; Kabatoff, C.; Quinn, R. Operational ship detection in Canada using RADARSAT. In Proceedings of the 2014 IEEE Geoscience and Remote Sensing Symposium, Quebec City, QC, Canada, 13–18 July 2014; pp. 998–1001. [Google Scholar]
  8. Crisp, D.J. The State-of-the-Art in Ship Detection in Synthetic Aperture Radar Imagery; DSTO-RR–0272; DSTO Information Sciences Laboratory: Edinburgh, Australia, 2004. [Google Scholar]
  9. International Maritime Organization AIS Transponders. Available online: http://www.imo.org/es/OurWork/Safety/Navigation/Paginas/AIS.aspx (accessed on 16 December 2019).
  10. Frontex Technical Support for Testing and Evaluation of a New Copernicus Service. Available online: https://etendering.ted.europa.eu/cft/cft-document.html?locale=it&docId=32385 (accessed on 22 August 2020).
  11. Tunaley, J.K.E. Wakes from Go-Fast and Small Planing Boats; Ottawa, ON, Canada, 2014. Available online: http://www.london-research-and-development.com/Go-Fast-Wakes.pdf (accessed on 3 August 2020).
  12. Shahbazian, E.; Rogova, G. Meeting Security Challenges Through Data Analytics and Decision Support; NATO Science for Peace and Security Series—D: Information and Communication Security; IOS Press: Amsterdam, The Netherlands, 2016; Volume 47, ISBN 978-1-61499-715-3. [Google Scholar]
  13. Graziano, D.M.; Renga, A.; Moccia, A. Integration of Automatic Identification System (AIS) Data and Single-Channel Synthetic Aperture Radar (SAR) Images by SAR-Based Ship Velocity Estimation for Maritime Situational Awareness. Remote Sens. 2019, 11, 2196. [Google Scholar] [CrossRef] [Green Version]
  14. Graziano, M.D.; D’Errico, M.; Razzano, E. Maritime surveillance by integrating remote sensing and AIS: A preliminary analysis. In Proceedings of the OCEANS 2011 IEEE-Spain, Santander, Spain, 6–9 June 2011. [Google Scholar]
  15. Tunaley, J.K.E. Ship Wakes. Available online: http://www.london-research-and-development.com/Ship-Wake.html (accessed on 27 June 2020).
  16. Zilman, G.; Zapolski, A.; Marom, M. The speed and beam of a ship from its wake’s SAR images. IEEE Trans. Geosci. Remote Sens. 2004, 42, 2335–2343. [Google Scholar] [CrossRef]
  17. Pichel, W.G.; Clemente-colón, P.; Wackerman, C.C.; Friedman, K.S. Ship and Wake Detection. In SAR Marine Users Manual; National Oceanic and Atmospheric Administration (NOAA), US Department of Commerce: Washington, DC, USA, 2004. Available online: https://www.sarusersmanual.com/ (accessed on 27 July 2020).
  18. Ermakov, S.; Kapustin, I.; Lazareva, T. Ship Wake Signatures in Radar/Optical Images of the Sea Surface: Observations and Physical Mechanisms. In Proceedings of the SPIE—The International Society for Optical Engineering, Amsterdam, The Netherlands, 14 October 2014; Volume 9240. [Google Scholar]
  19. Hennings, I.; Romeiser, R.; Alpers, W.; Viola, A. Radar imaging of Kelvin arms of ship wakes. Int. J. Remote Sens. 1999, 20, 2519–2543. [Google Scholar] [CrossRef]
  20. Graziano, M.D.; Rufino, G.; D’Errico, M. Wake-based ship route estimation in high-resolution SAR images. In Proceedings of the SPIE—The International Society for Optical Engineering, Amsterdam, The Netherlands, 22–25 September 2014; p. 12. [Google Scholar]
  21. Tings, B.; Velotto, D. Comparison of ship wake detectability on C-band and X-band SAR. Int. J. Remote Sens. 2018, 39, 4451–4468. [Google Scholar] [CrossRef] [Green Version]
  22. Arnold-bos, A.; Khenchaf, A.; Martin, A. An Evaluation of Current Ship Wake Detection Algorithms in SAR Images. Caractérisation du Milieu Marin. 2006, p. 8. Available online: http://people.irisa.fr/Arnaud.Martin/publi/ARNOLD_06b.pdf (accessed on 27 July 2020).
  23. Murphy, L.M. Linear feature detection and enhancement in noisy images via the Radon transform. Pattern Recognit. Lett. 1986, 4, 279–284. [Google Scholar] [CrossRef]
  24. Graziano, M.D.; D’Errico, M.; Rufino, G. Wake component detection in X-band SAR images for ship heading and velocity estimation. Remote Sens. 2016, 8, 498. [Google Scholar] [CrossRef] [Green Version]
  25. Rey, M.T.; Tunaley, J.K.; Folinsbee, J.T.; Jahans, P.A.; Dixon, J.A.; Vant, M.R. Application of Radon Transform Techniques to Wake Detection in Seasat-A SAR Images. IEEE Trans. Geosci. Remote Sens. 1990, 28, 553–560. [Google Scholar] [CrossRef]
  26. Graziano, M.D.; Grasso, M.; D’Errico, M. Performance analysis of ship wake detection on Sentinel-1 SAR images. Remote Sens. 2017, 9, 1107. [Google Scholar] [CrossRef] [Green Version]
  27. Graziano, M.D. SAR-based ship route estimation by wake components detection and classification. In Proceedings of the International Geoscience and Remote Sensing Symposium (IGARSS), Milan, Italy, 26–31 July 2015; pp. 3255–3258. [Google Scholar]
  28. Karakuş, O.; Rizaev, I.; Achim, A. Ship Wake Detection in SAR Images via Sparse Regularization. IEEE Trans. Geosci. Remote Sens. 2020, 58, 1665–1677. [Google Scholar] [CrossRef] [Green Version]
  29. Karakuş, O.; Achim, A. Ship Wake Detection in X-band SAR Images Using Sparse GMC Regularization. In Proceedings of the ICASSP 2019-2019 IEEE International Conference on Acoustics, Speech and Signal Processing (ICASSP), Hoff, UK, 12–17 May 2019; pp. 2182–2186. [Google Scholar]
  30. Schwegmann, C.P.; Kleynhans, W.; Salmon, B.P.; Mdakane, L.W.; Meyer, R.G.V. Very deep learning for ship discrimination in Synthetic Aperture Radar imagery. In Proceedings of the 2016 IEEE International Geoscience and Remote Sensing Symposium (IGARSS), Beijing, China, 10–15 July 2016; pp. 104–107. [Google Scholar]
  31. Liu, Y.; Zhang, M.; Xu, P.; Guo, Z. SAR ship detection using sea-land segmentation-based convolutional neural network. In Proceedings of the 2017 International Workshop on Remote Sensing with Intelligent Processing (RSIP), Shanghai, China, 19–21 May 2017; pp. 1–4. [Google Scholar]
  32. Kang, M.; Ji, K.; Leng, X.; Lin, Z. Contextual region-based convolutional neural network with multilayer fusion for SAR ship detection. Remote Sens. 2017, 9, 860. [Google Scholar] [CrossRef] [Green Version]
  33. Zhang, L.; Zhang, L.; Du, B. Deep Learning for Remote Sensing Data: A Technical Tutorial on the State of the Art. IEEE Geosci. Remote Sens. Mag. 2016, 4, 22–40. [Google Scholar] [CrossRef]
  34. Kang, K.; Kim, D. Ship Velocity Estimation From Ship Wakes Detected Using Convolutional Neural Networks. IEEE J. Sel. Top. Appl. Earth Obs. Remote Sens. 2019, 12, 4379–4388. [Google Scholar] [CrossRef]
  35. Roy, D.M.; Tunaley, J.K.E. Visibility of Turbulent Ship Wakes in Dual-Polarized RADARSAT-2 Imagery; Defence R&D: Ottawa, ON, Canada, 2010. [Google Scholar]
  36. Graziano, M.D.; D’Errico, M.; Rufino, G. Ship heading and velocity analysis by wake detection in SAR images. Acta Astronaut. 2016, 128, 72–82. [Google Scholar] [CrossRef]
  37. Ren, Y.; Lehner, S.; Brusch, S.; Li, X.; He, M. An algorithm for the retrieval of sea surface wind fields using X-band TerraSAR-X data. Int. J. Remote Sens. 2012, 33, 7310–7336. [Google Scholar] [CrossRef] [Green Version]
  38. Tings, B.; Pleskachevsky, A.; Velotto, D.; Jacobsen, S. Extension of Ship Wake Detectability Model for Non-Linear Influences of Parameters Using Satellite Based X-Band Synthetic Aperture Radar. Remote Sens. 2019, 11, 563. [Google Scholar] [CrossRef] [Green Version]
  39. Panico, A.; Graziano, M.D.; Renga, A. SAR-Based Vessel Velocity Estimation from Partially Imaged Kelvin Pattern. IEEE Geosci. Remote Sens. Lett. 2017, 14, 2067–2071. [Google Scholar] [CrossRef]
  40. Graziano, M.D.; D’Errico, M.; Razzano, E. Constellation analysis of an integrated AIS/remote sensing spaceborne system for ship detection. Adv. Space Res. 2012, 50, 351–362. [Google Scholar] [CrossRef]
  41. TecSAR. Available online: https://directory.eoportal.org/web/eoportal/satellite-missions/t/tecsar (accessed on 21 August 2020).
  42. Risat. Available online: https://directory.eoportal.org/web/eoportal/satellite-missions/r/risat-2 (accessed on 21 August 2020).
  43. Iceye. Available online: www.iceye.com (accessed on 21 August 2020).
Figure 1. Flow-chart of the proposed methodology.
Remotesensing 12 02869 g001
Figure 2. Score logic approach. The lines are representative of the turbulent components built on the pixels satisfying Equation (4).
Remotesensing 12 02869 g002
Figure 3. SLC image gathered by TerraSAR-X over the Gulf of Naples on 9th June 2011. The yellow dot is the center of the tile shown in Figure 5. Tile size: 10.7 × 5.5 km.
Remotesensing 12 02869 g003
Figure 4. Steps of the candidate wake identification.
Remotesensing 12 02869 g004
Figure 5. Candidate wake identification results. (a) Tile identified around the pixel under analysis, i.e., yellow dot in Figure 2, (b) Radon domain applied to the tile and identification of the tough/pair related to wake a, b, and c, (c) reconstructed wake.
Remotesensing 12 02869 g005
Figure 6. Wake index statistical distribution. Red line is the bell-shaped distribution fitting the data. The vertical black line is the merit index value corresponding to μ + 3 σ .
Remotesensing 12 02869 g006
Figure 7. Results of first validation phase. Pixels satisfying Equation (4) are shown as full yellow dots.
Remotesensing 12 02869 g007
Figure 8. (a) Score logic approach applied over the full yellow circle in Figure 6. (b) Results of the second level of validation.
Remotesensing 12 02869 g008
Figure 9. Zoom around missed wake c. Yellow arrow define the direction of the reconstructed turbulent wake in each grid point. Red circles identify pixels whose turbulent wake is aligned with wake c.
Remotesensing 12 02869 g009
Table 1. Main SAR image Parameters.
Acquisition EpochJune 9th, 2011-16:49 UTC
ModeStripMap–Dual polarization
LevelL1B
PolarizationVV and VH (only VV used)
Range Resolution2.5 m
Azimuth Resolution6.5 m

