Standoff Chemical Detection Using Laser Absorption Spectroscopy: A Review


Abstract

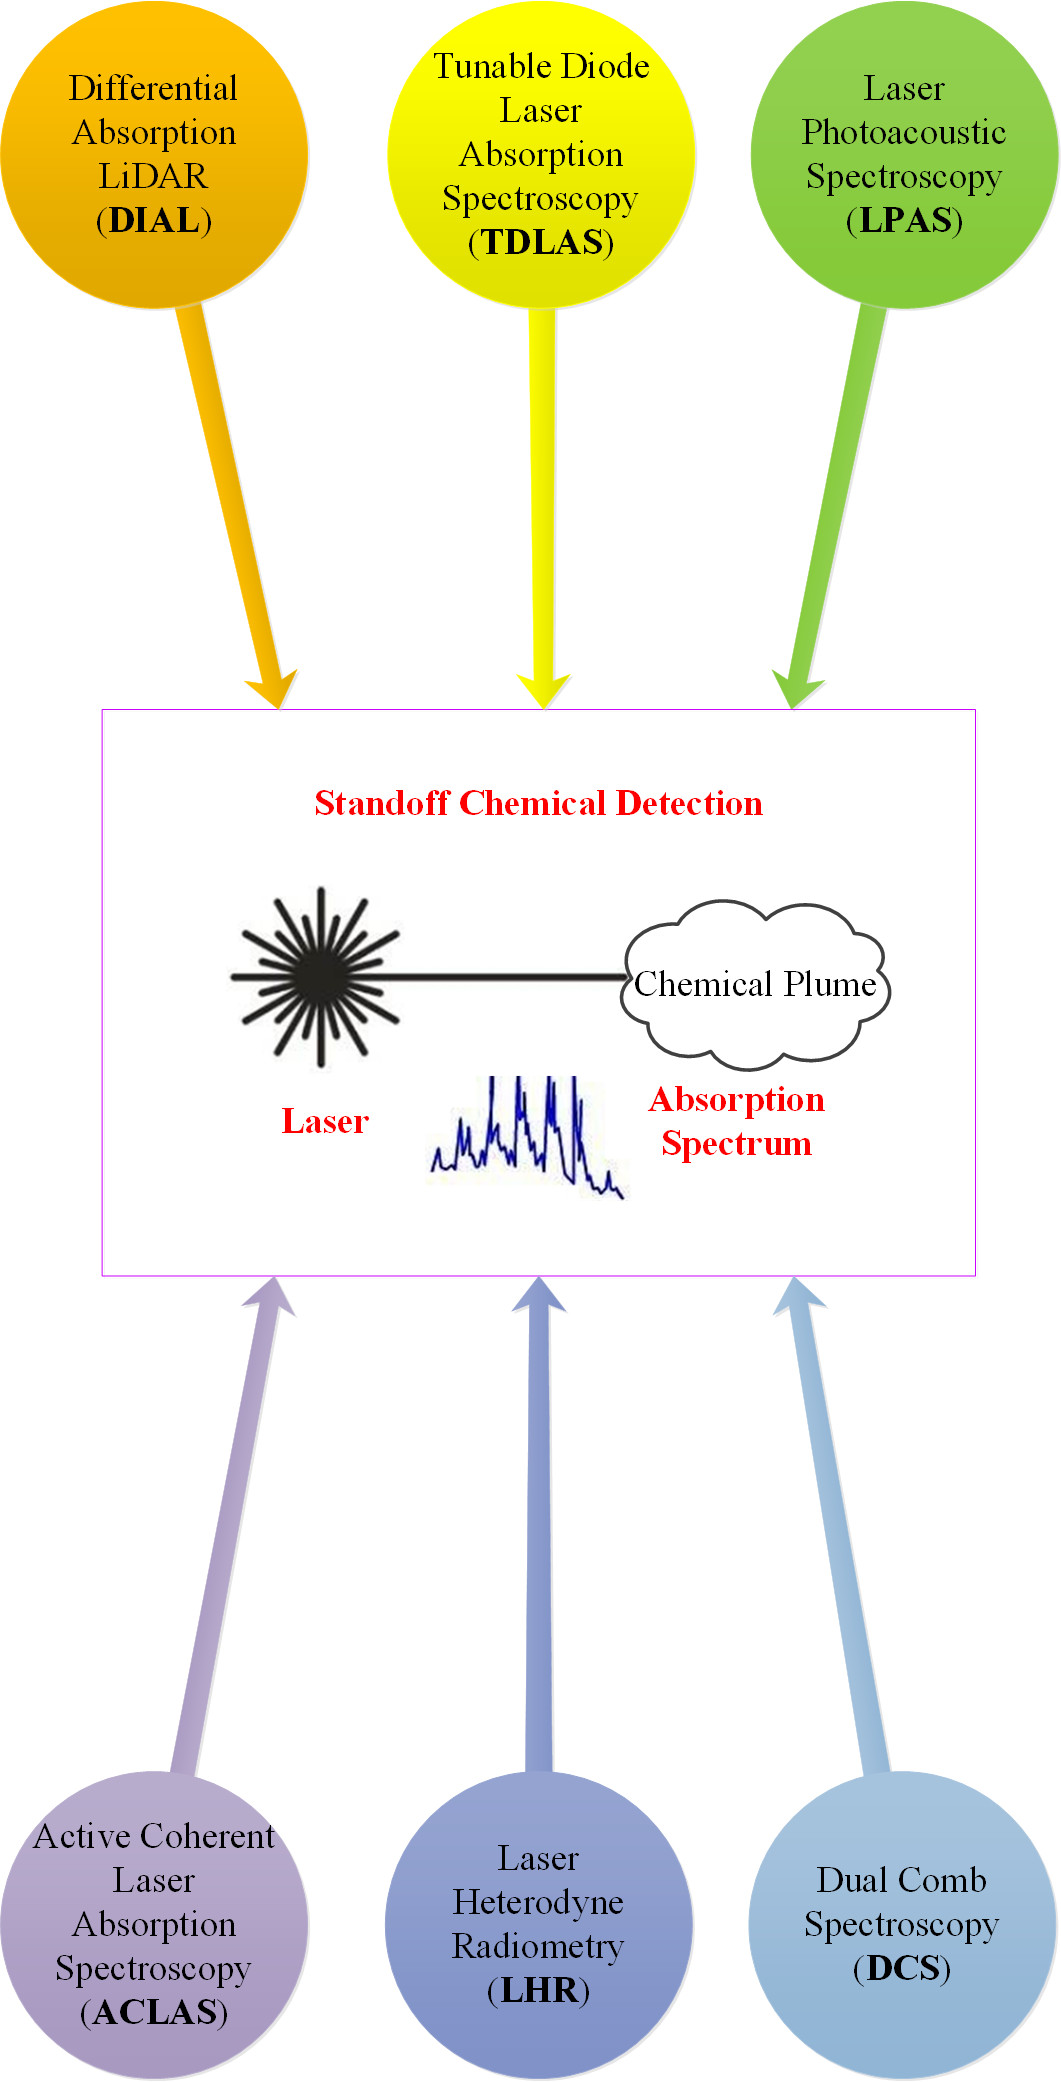
1. Introduction
2. Basic Principle
3. Differential Absorption LiDAR (DIAL)
4. Tunable Diode Laser Absorption Spectroscopy (TDLAS)
4.1. TDLAS with Retroreflectors
4.2. TDLAS with Non-Cooperative Target
5. Laser Photoacoustic Spectroscopy (LPAS)
5.1. Standoff LPAS with Microphones
5.2. Standoff Laser Interferometer-Based LPAS
5.3. Standoff Quartz-Enhanced Photoacoustic Spectroscopy
6. Dual-Comb Spectroscopy (DCS)
7. Laser Heterodyne Radiometry (LHR)
8. Active Coherent Laser Absorption Spectrometry (ACLaS)
9. Benchmarking, Challenges and Opportunities
9.1. Benchmarking
9.2. Challenges
9.3. Opportunities
10. Conclusions and Future Outlook
Author Contributions
Funding
Conflicts of Interest
Abbreviations
| LAS | Laser Absorption Spectroscopy |
| CWAs | Chemical Warfare Agents |
| DOAS | Differential Optical Absorption Spectroscopy |
| FTIR | Fourier Transform Infrared |
| LIF | Laser-Induced fluorescence |
| LIBS | Laser-Induced Breakdown Spectroscopy |
| CARS | Coherent Anti-Stokes Raman Spectroscopy |
| SNR | Signal-To-Noise Ratio |
| DIAL | Differential Absorption LiDAR |
| TDLAS | Tunable Diode Laser Absorption Spectroscopy |
| LPAS | Laser Photoacoustic Spectroscopy |
| DCS | Dual-Comb Spectroscopy |
| LHR | Laser Heterodyne Radiometer |
| ACLaS | Active Coherent Laser Absorption Spectroscopy |
| NIR | Near-Infrared |
| MIR | Mid-Infrared |
| IR | Infrared |
| HITRAN | High-Resolution Transmission Molecular Absorption |
| GEISA | Gestion Et Etude Des Informations Spectroscopiques AtmosphÉRiques |
| PNNL | Pacific Northwest National Laboratory |
| DOAS | Absorption Spectroscopy |
| NEA | Noise-Equivalent Absorbance |
| TICs | Toxic Industrial Chemicals |
| IPDA | Integrated Path Differential Absorption |
| RR-DIAL | Range Resolved Differential Absorption LiDAR |
| UV | Ultraviolet |
| Nd-YAG | Neodymium-Doped Yttrium Aluminum Garnet |
| HCs | Hydrocarbons |
| UCD | Upconversion Detector |
| CW | Continuous Wave |
| GreenLITE | Greenhouse gas Laser Imaging Tomography Experiment |
| 2D | Two-Dimensional |
| CT | Computer Tomography |
| MERLIN | MEthane Remote sensing LiDAR missioN |
| ECDL | External-Cavity Diode Lasers |
| OPO | Optical Parametric Oscillator |
| BTAS | Backwards Transient Absorption Spectroscopy |
| TDL | Tunable Diode Laser |
| QCLs | Quantum Cascade Lasers |
| ICLs | Interband Cascade Lasers |
| DAS | Absorption Spectroscopy |
| WMS | Wavelength Modulation Spectroscopy |
| FMS | Frequency Modulation Spectroscopy |
| OAPM | Off-Axis Parabolic Mirror |
| RF | Radio Frequency |
| LIA | Lock-in Amplifier |
| ECQCL | External Cavity-Quantum Cascade Laser |
| CLaDS | Chirped Laser Dispersion Spectroscopy |
| NECL | Noise Equivalent Concentration Length |
| DFB | Distributed Feedback |
| RMLD | Remote Methane Leak Detector |
| EDFA | Erbium-Doped Fiber Amplifier |
| UAV | Uncrewed Aerial Vehicle |
| SE-LAS | Single-Ended Laser-Absorption-Spectroscopy |
| PA | Photoacoustic |
| QEPAS | Quartz-Enhanced Photoacoustic Spectroscopy |
| IPA | Isopropanol |
| DNT | 2,4-dinitrotoluene |
| TNT | Trinitrotoluene |
| RDX | Cyclonite |
| PETN | Pentaerythritol Tetranitrate |
| DPA | Dipicolinic Acid |
| AN | Ammonium Nitrate |
| ARL | Army Research Laboratory |
| LDV | Laser Doppler Vibrometer |
| QCW | Quasi-Continuous Wave |
| FTIR | Fourier-Transform Infrared |
| QCTF | Quartz-Crystal Tuning Fork |
| TBP | Tributyl Phosphate |
| VOCs | Volatile Organic Compounds |
| MLR | Multiple Linear Regression |
| MCT | Mercury-Cadmium-Telluride |
| sUAS | Small Uncrewed Aircraft System |
| FOV | Field-Of-View |
| BS | Beam Splitter |
| LO | Local Oscillator |
| PM | Photo Mixer |
| OEM | Optimal Estimation Method |
| WM-LHR | Wavelength Modulation Laser Heterodyne Radiometry |
| DCE | Dichloroethane |
| EDGN | Ethylene Glycol Dinitrate |
| OFCs | Optical Frequency Combs |
| HPSDS | Heterodyne Phase-Sensitive Dispersion Spectroscopy |
References
- Bogue, R. Remote chemical sensing: A review of techniques and recent developments. Sens. Rev. 2018, 38, 453–457. [Google Scholar] [CrossRef]
- Wallin, S.; Pettersson, A.; Ostmark, H.; Hobro, A. Laser-based standoff detection of explosives: A critical review. Anal. Bioanal. Chem. 2009, 395, 259–274. [Google Scholar] [CrossRef] [PubMed]
- Nabiev, S.S.; Palkina, L.A. Current trends in the development of remote methods of detecting radioactive and highly toxic substances. In The Atmosphere and Ionosphere; Bychkov, V., Golubkov, G., Nikitin, A., Eds.; Springer: Cham, Switzerland, 2014; pp. 113–200. [Google Scholar]
- Gaudio, P. Laser Based Standoff Techniques: A Review on Old and New Perspective for Chemical Detection and Identification. In Cyber and Chemical, Biological, Radiological, Nuclear, Explosives Challenges; Martellini, M., Malizia, A., Eds.; Springer: Cham, Switzerland, 2017; pp. 155–177. [Google Scholar]
- Crowley, M.; Shang, L.J.; Dando, M. Preventing chemical weapons as sciences converge. Science 2018, 362, 753–755. [Google Scholar] [CrossRef]
- Jaworski, P.; Stachowiak, D.; Nikodem, M. Standoff detection of gases using infrared laser spectroscopy. In Proceedings of the Optical Sensing and Detection IV, Brussels, Belgium, 3–7 April 2016; p. 98990Q. [Google Scholar]
- MacLeod, N.A.; Weidmann, D. High sensitivity stand-off detection and quantification of chemical mixtures using an active coherent laser spectrometer (ACLaS). In Proceedings of the Chemical, Biological, Radiological, Nuclear, and Explosives (CBRNE) Sensing XVII, Baltimore, MD, USA, 18–20 April 2016; p. 98240B. [Google Scholar]
- Du, Z.H.; Zhang, S.; Li, J.Y.; Gao, N.; Tong, K.B. Mid-Infrared Tunable Laser-Based Broadband Fingerprint Absorption Spectroscopy for Trace Gas Sensing: A Review. Appl. Sci. 2019, 9, 338. [Google Scholar] [CrossRef]
- Hodgkinson, J.; Tatam, R.P. Optical gas sensing: A review. Meas. Sci. Technol. 2012, 24, 012004. [Google Scholar] [CrossRef]
- Platt, U.; Perner, D. Measurements of atmospheric trace gases by long path differential UV/visible absorption spectroscopy. In Optical and Laser Remote Sensing; Springer: Berlin/Heidelberg, Germany, 1983; pp. 97–105. [Google Scholar] [CrossRef]
- Platt, U.; Stutz, J. Differential absorption spectroscopy. In Differential Optical Absorption Spectroscopy; Platt, U., Stutz, J., Eds.; Springer: Cham, Switzerland, 2008; pp. 135–174. [Google Scholar]
- Childs, D.T.D.; Hogg, R.A.; Revin, D.G.; Rehman, I.U.; Cockburn, J.W.; Matcher, S.J. Sensitivity Advantage of QCL Tunable-Laser Mid-Infrared Spectroscopy Over FTIR Spectroscopy. Appl. Spectrosc. Rev. 2015, 50, 822–839. [Google Scholar] [CrossRef]
- Taslakov, M.; Simeonov, V.; van den Bergh, H. Open path atmospheric spectroscopy using room temperature operated pulsed quantum cascade laser. Spectroc. Acta Part A Mol. Biomol. Spectrosc. 2006, 63, 1002–1008. [Google Scholar] [CrossRef]
- Tittel, F.; Lewicki, R. Tunable mid-infrared laser absorption spectroscopy. In Semiconductor Lasers; Baranov, A., Tournié, E., Eds.; Elsevier: London, UK, 2013; pp. 579–629. [Google Scholar]
- Deguchi, Y. Industrial Applications of Laser Diagnostics; CRC Press: New York, NY, USA, 2011. [Google Scholar]
- Farsund, O.; Rustad, G.; Kasen, I.; Haavardsholm, T.V. Required Spectral Resolution for Bioaerosol Detection Algorithms Using Standoff Laser-Induced Fluorescence Measurements. IEEE Sens. J. 2010, 10, 655–661. [Google Scholar] [CrossRef]
- Gottfried, J.L.; De Lucia, F.C., Jr.; Munson, C.A.; Miziolek, A.W. Laser-induced breakdown spectroscopy for detection of explosives residues: A review of recent advances, challenges, and future prospects. Anal. Bioanal. Chem. 2009, 395, 283–300. [Google Scholar] [CrossRef]
- Gares, K.L.; Hufziger, K.T.; Bykov, S.V.; Asher, S.A. Review of explosive detection methodologies and the emergence of standoff deep UV resonance Raman. J. Raman Spectrosc. 2016, 47, 124–141. [Google Scholar] [CrossRef]
- MacLeod, N.A.; Weidmann, D. Active coherent laser spectrometer for remote detection and identification of chemicals. In Proceedings of the Optics and Photonics for Counterterrorism, Crime Fighting, and Defence VIII, Edinburgh, Scotland, 24–26 September 2012; p. 85460H. [Google Scholar]
- Almaviva, S.; Angelini, F.; Chirico, R.; Palucci, A.; Nuvoli, M.; Schnuerer, F.; Schweikert, W.; Romolo, F. Eye-safe UV Raman spectroscopy for proximal detection of explosives and their precursors in fingerprints concentration. In Proceedings of the Optics and Photonics for Counterterrorism, Crime Fighting, and Defence X; and Optical Materials and Biomaterials in Security and Defence Systems Technology XI, Amsterdam, The Netherlands, 7 October 2014; p. 925303. [Google Scholar]
- Angelini, F.; di Frischia, S.; Chiuri, A.; Colao, F. Maximization of Raman signal in standoff detection under eye-safe conditions. In Proceedings of the Counterterrorism, Crime Fighting, Forensics, and Surveillance Technologies III, Strasbourg, France, 9–11 September 2019; p. 1116609. [Google Scholar]
- Goldenstein, C.S.; Spearrin, R.M.; Jeffries, J.B.; Hanson, R.K. Infrared laser-absorption sensing for combustion gases. Prog. Energy Combust. Sci. 2017, 60, 132–176. [Google Scholar] [CrossRef]
- Liu, C.; Xu, L.J. Laser absorption spectroscopy for combustion diagnosis in reactive flows: A review. Appl. Spectrosc. Rev. 2019, 54, 1–44. [Google Scholar] [CrossRef]
- Henderson, B.; Khodabakhsh, A.; Metsala, M.; Ventrillard, I.; Schmidt, F.M.; Romanini, D.; Ritchie, G.A.D.; Hekkert, S.t.L.; Briot, R.; Risby, T.; et al. Laser spectroscopy for breath analysis: Towards clinical implementation. Appl. Phys. B Lasers Opt. 2018, 124. [Google Scholar] [CrossRef] [PubMed]
- Demtröder, W. Laser Spectroscopy: Basic Concepts and Instrumentation, 3rd ed.; Mack, R., Ed.; Springer Science & Business Media: Berlin, Germany, 2013. [Google Scholar]
- Hanson, R.K.; Spearrin, R.M.; Goldenstein, C.S. Spectroscopy and Optical Diagnostics for Gases; Springer: Cham, Switzerland, 2016. [Google Scholar]
- Jacquinet-Husson, N.; Armante, R.; Scott, N.A.; Chedin, A.; Crepeau, L.; Boutammine, C.; Bouhdaoui, A.; Crevoisier, C.; Capelle, V.; Boonne, C.; et al. The HITRAN2016 molecular spectroscopic database. J. Quant. Spectrosc. Radiat. Transf. 2017, 203, 3–69. [Google Scholar] [CrossRef]
- Jacquinet-Husson, N.; Armante, R.; Scott, N.A.; Chedin, A.; Crepeau, L.; Boutammine, C.; Bouhdaoui, A.; Crevoisier, C.; Capelle, V.; Boonne, C.; et al. The 2015 edition of the GEISA spectroscopic database. J. Mol. Spectrosc. 2016, 327, 31–72. [Google Scholar] [CrossRef]
- Sharpe, S.W.; Johnson, T.J.; Sams, R.L.; Chu, P.M.; Rhoderick, G.C.; Johnson, P.A. Gas-phase databases for quantitative infrared spectroscopy. Appl. Spectrosc. 2004, 58, 1452–1461. [Google Scholar] [CrossRef]
- Wang, Z.H.; Fu, P.F.; Chao, X. Laser Absorption Sensing Systems: Challenges, Modeling, and Design Optimization. Appl. Sci. 2019, 9, 2723. [Google Scholar] [CrossRef]
- Zhu, X.M.; Kahn, J.M. Free-space optical communication through atmospheric turbulence channels. IEEE Trans. Commun. 2002, 50, 1293–1300. [Google Scholar] [CrossRef]
- Rieker, G.B.; Giorgetta, F.R.; Swann, W.C.; Kofler, J.; Zolot, A.M.; Sinclair, L.C.; Baumann, E.; Cromer, C.; Petron, G.; Sweeney, C.; et al. Frequency-comb-based remote sensing of greenhouse gases over kilometer air paths. Optica 2014, 1, 290–298. [Google Scholar] [CrossRef]
- Cao, X.H.; Li, J.Y.; Gao, H.; Du, Z.H.; Ma, Y.W. Simultaneous Determination of Carbon Disulfide, Carbon Monoxide, and Dinitrogen Oxide by Differential Absorption Spectroscopy Using a Distributed Feedback Quantum Cascade Laser. Anal. Lett. 2017, 50, 2342–2350. [Google Scholar] [CrossRef]
- Schotland, R.M. Errors in the lidar measurement of atmospheric gases by differential absorption. J. Appl. Meteorol. 1974, 71–77. [Google Scholar] [CrossRef]
- Browell, E.; Ismail, S.; Grant, W. DIAL. Encycl. Atmos. Sci. 2003, 3, 1183–1193. [Google Scholar]
- Molebny, V.; McManamon, P.F.; Steinvall, O.; Kobayashi, T.; Chen, W. Laser radar: Historical prospective—From the East to the West. Opt. Eng. 2016, 56, 031220. [Google Scholar] [CrossRef]
- Alvarez, R.J.; Senff, C.J.; Langford, A.O.; Weickmann, A.M.; Law, D.C.; Machol, J.L.; Merritt, D.A.; Marchbanks, R.D.; Sandberg, S.P.; Brewer, W.A.; et al. Development and Application of a Compact, Tunable, Solid-State Airborne Ozone Lidar System for Boundary Layer Profiling. J. Atmos. Ocean. Tech. 2011, 28, 1258–1272. [Google Scholar] [CrossRef]
- Coutts, D.W.; McGonigle, A.J.S. Cerium-doped fluoride lasers. IEEE J. Quantum Electron. 2004, 40, 1430–1440. [Google Scholar] [CrossRef]
- Demirbas, U.; Uecker, R.; Klimm, D.; Wang, J. Low-cost, broadly tunable (375–433 nm & 746–887 nm) Cr: LiCAF laser pumped by one single-spatial-mode diode. Appl. Opt. 2012, 51, 8440–8448. [Google Scholar] [CrossRef]
- Wagner, G.A.; Plusquellic, D.F. Multi-frequency differential absorption LIDAR system for remote sensing of CO2 and H2O near 1.6 µm. Opt. Express 2018, 26, 19420–19434. [Google Scholar] [CrossRef]
- Kara, O.; Sweeney, F.; Rutkauskas, M.; Farrell, C.; Leburn, C.G.; Reid, D.T. Open-path multi-species remote sensing with a broadband optical parametric oscillator. Opt. Express 2019, 27, 21358–21366. [Google Scholar] [CrossRef]
- Robinson, R.; Gardiner, T.; Innocenti, F.; Woods, P.; Coleman, M. Infrared differential absorption Lidar (DIAL) measurements of hydrocarbon emissions. J. Environ. Monit. 2011, 13, 2213–2220. [Google Scholar] [CrossRef]
- Innocenti, F.; Robinson, R.; Gardiner, T.; Finlayson, A.; Connor, A.J.R.S. Differential absorption lidar (DIAL) measurements of landfill methane emissions. Remote Sens. 2017, 9, 953. [Google Scholar] [CrossRef]
- Emission Monitoring Using Differential Absorption Lidar (DIAL). Available online: https://www.npl.co.uk/products-services/environmental/absorption-lidar-dial (accessed on 10 May 2020).
- Ambrico, P.F.; Amodeo, A.; Di Girolamo, P.; Spinelli, N. Sensitivity analysis of differential absorption lidar measurements in the mid-infrared region. Appl. Opt. 2000, 39, 6847–6865. [Google Scholar] [CrossRef]
- Ehret, G.; Kiemle, C.; Wirth, M.; Amediek, A.; Fix, A.; Houweling, S. Space-borne remote sensing of CO2, CH4, and N2O by integrated path differential absorption lidar: A sensitivity analysis. Appl. Phys. B Lasers Opt. 2008, 90, 593–608. [Google Scholar] [CrossRef]
- Høgstedt, L.; Fix, A.; Wirth, M.; Pedersen, C.; Tidemand-Lichtenberg, P. Upconversion-based lidar measurements of atmospheric CO 2. Opt. Express 2016, 24, 5152–5161. [Google Scholar] [CrossRef] [PubMed]
- Meng, L.; Fix, A.; Wirth, M.; Høgstedt, L.; Tidemand-Lichtenberg, P.; Pedersen, C.; Rodrigo, P.J. Upconversion detector for range-resolved DIAL measurement of atmospheric CH4. Opt. Express 2018, 26, 3850–3860. [Google Scholar] [CrossRef] [PubMed]
- Gelfusa, M.; Gaudio, P.; Malizia, A.; Murari, A.; Vega, J.; Richetta, M.; Gonzalez, S. UMEL: A new regression tool to identify measurement peaks in LIDAR/DIAL systems for environmental physics applications. Rev. Sci. Instrum. 2014, 85, 063112. [Google Scholar] [CrossRef] [PubMed]
- Zhou, Z.R.; Hua, D.X.; Wang, Y.F.; Yan, Q.; Li, S.C.; Li, Y.; Wang, H.W. Improvement of the signal to noise ratio of Lidar echo signal based on wavelet de-noising technique. Opt. Laser Eng. 2013, 51, 961–966. [Google Scholar] [CrossRef]
- Xiang, C.Z.; Han, G.; Zheng, Y.X.; Ma, X.; Gong, W. Improvement of CO2-DIAL Signal-to-Noise Ratio Using Lifting Wavelet Transform. Sensors 2018, 18, 2362. [Google Scholar] [CrossRef]
- Matvienko, G.G.; Sukhanov, A.Y. Application of Neural Networks for Retrieval of the CO2 Concentration at Aerospace Sensing by IPDA-DIAL lidar. Remote Sens. 2019, 11, 659. [Google Scholar] [CrossRef]
- Matvienko, G.; Sukhanov, A.Y.; Babchenko, S. The Analysis of Capabilities of Neural Networks in CO2 Sounding with Spaceborne IPDA-Lidar with the Use of Different A Priori Data. Atmos. Ocean. Opt. 2019, 32, 165–170. [Google Scholar] [CrossRef]
- Kaldvee, B.; Brackmann, C.; Aldén, M.; Bood, J.J.O.E. Highly range-resolved ammonia detection using near-field picosecond differential absorption lidar. Opt. Express 2012, 20, 20688. [Google Scholar] [CrossRef]
- Mei, L.; Guan, P.; Kong, Z. Remote sensing of atmospheric NO2 by employing the continuous-wave differential absorption lidar technique. Opt. Express 2017, 25, A953–A962. [Google Scholar] [CrossRef] [PubMed]
- Wagner, G.A.; Plusquellic, D.F. Ground-based, integrated path differential absorption LIDAR measurement of CO2, CH4, and H2O near 1.6 mum. Appl. Opt. 2016, 55, 6292–6310. [Google Scholar] [CrossRef]
- Refaat, T.F.; Ismail, S.; Koch, G.J.; Rubio, M.; Mack, T.L.; Notari, A.; Collins, J.E.; Lewis, J.; De Young, R.; Choi, Y.; et al. Backscatter 2-μm Lidar Validation for Atmospheric CO2 Differential Absorption Lidar Applications. IEEE Trans. Geosci. Remote Sens. 2011, 49, 572–580. [Google Scholar] [CrossRef]
- Yakovlev, S.; Sadovnikov, S.; Kharchenko, O.; Kravtsova, N. Remote Sensing of Atmospheric Methane with IR OPO Lidar System. Atmosphere 2020, 11, 70. [Google Scholar] [CrossRef]
- Takida, Y.; Ikeo, T.; Nawata, K.; Wada, Y.; Higashi, Y.; Minamide, H. Terahertz differential absorption spectroscopy using multifurcated subnanosecond microchip laser. Appl. Phys. Lett. 2019, 115. [Google Scholar] [CrossRef]
- Dobler, J.T.; Zaccheo, T.S.; Pernini, T.G.; Blume, N.; Broquet, G.; Vogel, F.; Ramonet, M.; Braun, M.; Staufer, J.; Ciais, P.; et al. Demonstration of spatial greenhouse gas mapping using laser absorption spectrometers on local scales. J. Appl. Remote Sens. 2017, 11, 26. [Google Scholar] [CrossRef]
- Lian, J.H.; Breon, F.M.; Broquet, G.; Zaccheo, T.S.; Dobler, J.; Ramonet, M.; Staufer, J.; Santaren, D.; Xueref-Remy, I.; Ciais, P. Analysis of temporal and spatial variability of atmospheric CO2 concentration within Paris from the GreenLITE (TM) laser imaging experiment. Atmos. Chem. Phys. 2019, 19, 13809–13825. [Google Scholar] [CrossRef]
- Dobler, J.T.; Pernini, T.G.; Blume, N.; Zaccheo, T.S.; Braun, M. GreenLITE (TM): A new laser-based tool for near-real-time monitoring and mapping of CO2 and CH4 concentrations on scales from 0.04-25 km2. In Proceedings of the Lidar Remote Sensing for Environmental Monitoring 2017, San Diego, CA, USA, 8–9 August 2017. [Google Scholar]
- Dobler, J.; Zaccheo, T.S.; Pernini, T.; Blume, N.; Braun, M. Greenlite™: A year of carbon dioxide monitoring over paris, france, and recent progress in monitoring methane. In EPJ Web of Conferences; EDP Sciences: Les Ulis, France, 2018; p. 05013. [Google Scholar]
- LIU, W.; CHEN, Z.; LIU, J.; XIE, P.J.C.S.B. Stereoscopic monitoring technology and applications for the atmospheric environment in China. Chin. Sci. Bull. 2016, 61, 3196–3207. [Google Scholar] [CrossRef][Green Version]
- Shi, T.; Han, G.; Ma, X.; Zhang, M.; Pei, Z.; Xu, H.; Qiu, R.; Zhang, H.; Gong, W.J.J.o.C.P. An inversion method for estimating strong point carbon dioxide emissions using a differential absorption Lidar. J. Clean. Prod. 2020, 271, 122434. [Google Scholar] [CrossRef]
- Liu, P.; Zhang, T.S.; Sun, X.H.; Fan, G.Q.; Xiang, Y.; Fu, Y.B.; Dong, Y.S. Compact and movable ozone differential absorption lidar system based on an all-solid-state, tuning-free laser source. Opt. Express 2020, 28, 13786–13800. [Google Scholar] [CrossRef]
- Browell, E.V.; Ismail, S.; Grant, W.B. Differential absorption lidar (DIAL) measurements from air and space. Appl. Phys. B Lasers Opt. 1998, 67, 399–410. [Google Scholar] [CrossRef]
- Dobler, J.T.; Harrison, F.W.; Browell, E.V.; Lin, B.; McGregor, D.; Kooi, S.; Choi, Y.; Ismail, S. Atmospheric CO2 column measurements with an airborne intensity-modulated continuous wave 1.57 mu m fiber laser lidar. Appl. Opt. 2013, 52, 2874–2892. [Google Scholar] [CrossRef]
- Lin, B.; Ismail, S.; Harrison, F.W.; Browell, E.V.; Nehrir, A.R.; Dobler, J.; Moore, B.; Refaat, T.; Kooi, S.A. Modeling of intensity-modulated continuous-wave laser absorption spectrometer systems for atmospheric CO2 column measurements. Appl. Opt. 2013, 52, 7062–7077. [Google Scholar] [CrossRef] [PubMed]
- Abshire, J.B.; Ramanathan, A.; Riris, H.; Mao, J.P.; Allan, G.R.; Hasselbrack, W.E.; Weaver, C.J.; Browell, E.V. Airborne Measurements of CO2 Column Concentration and Range Using a Pulsed Direct- Detection IPDA Lidar. Remote Sens. 2014, 6, 443–469. [Google Scholar] [CrossRef]
- Refaat, T.F.; Singh, U.N.; Yu, J.R.; Petros, M.; Remus, R.; Ismail, S. Double-pulse 2-mu m integrated path differential absorption lidar airborne validation for atmospheric carbon dioxide measurement. Appl. Opt. 2016, 55, 4232–4246. [Google Scholar] [CrossRef] [PubMed]
- Singh, U.N.; Refaat, T.F.; Petros, M.; Ismail, S. Evaluation of 2-mu m Pulsed Integrated Path Differential Absorption Lidar for Carbon Dioxide Measurement-Technology Developments, Measurements, and Path to Space. IEEE J. Sel. Top. Appl. Earth Observ. Remote Sens. 2018, 11, 2059–2067. [Google Scholar] [CrossRef]
- Refaat, T.F.; Singh, U.N.; Yu, J.R.; Petros, M.; Ismail, S.; Kavaya, M.J.; Davis, K.J. Evaluation of an airborne triple-pulsed 2 mu m IPDA lidar for simultaneous and independent atmospheric water vapor and carbon dioxide measurements. Appl. Opt. 2015, 54, 1387–1398. [Google Scholar] [CrossRef]
- Singh, U.N.; Petros, M.; Refaat, T.F.; Antill, C.W.; Remus, R.; Yu, J.R. Airborne lidar for simultaneous measurement of column CO2 and water vapor in the atmosphere. In Lidar Technologies, Techniques, and Measurements for Atmospheric Remote Sensing XII; Singh, U.N., Nicolae, D.N., Eds.; Spie-Int Soc Optical Engineering: Bellingham, WA, USA, 2016; Volume 10006. [Google Scholar]
- Fix, A.; Steinebach, F.; Wirth, M.; Schafler, A.; Ehret, G. Development and application of an airborne differential absorption lidar for the simultaneous measurement of ozone and water vapor profiles in the tropopause region. Appl. Opt. 2019, 58, 5892–5900. [Google Scholar] [CrossRef]
- Refaat, T.F.; Ismail, S.; Nehrir, A.R.; Hair, J.W.; Crawford, J.H.; Leifer, I.; Shuman, T. Performance evaluation of a 1.6-mu m methane DIAL system from ground, aircraft and UAV platforms. Opt. Express 2013, 21, 30415–30432. [Google Scholar] [CrossRef]
- Amediek, A.; Ehret, G.; Fix, A.; Wirth, M.; Budenbender, C.; Quatrevalet, M.; Kiemle, C.; Gerbig, C. CHARM-F-a new airborne integrated-path differential-absorption lidar for carbon dioxide and methane observations: Measurement performance and quantification of strong point source emissions. Appl. Opt. 2017, 56, 5182–5197. [Google Scholar] [CrossRef]
- Yerasi, A.; Tandy, W.D.; Emery, W.J.; Barton-Grimley, R.A. Comparing the theoretical performances of 1.65-and 3.3-mu m differential absorption lidar systems used for airborne remote sensing of natural gas leaks. J. Appl. Remote Sens. 2018, 12, 16. [Google Scholar] [CrossRef]
- Hahn, F. A deployable spaceborne lidar telescope: Concept and technology advances. In Proceedings of the Opto-Canada: SPIE Regional Meeting on Optoelectronics, Photonics, and Imaging, Ottawa, ON, Canada, 9–10 May 2002; p. 103130P. [Google Scholar]
- Schilt, S.; Matthey, R.; Tow, K.H.; Thévenaz, L.; Südmeyer, T.J.C.S.J. All-fiber versatile laser frequency reference at 2 μm for CO2 space-borne lidar applications. CEAS Space J. 2017, 9, 493–505. [Google Scholar] [CrossRef]
- Ehret, G.; Bousquet, P.; Pierangelo, C.; Alpers, M.; Millet, B.; Abshire, J.B.; Bovensmann, H.; Burrows, J.P.; Chevallier, F.; Ciais, P.; et al. MERLIN: A French-German Space Lidar Mission Dedicated to Atmospheric Methane. Remote Sens. 2017, 9, 29. [Google Scholar] [CrossRef]
- Bode, M.; Alpers, M.; Millet, B.; Ehret, G.; Flamant, P. Merlin: An Integrated Path Differential Absorption (IPDA) Lidar for Global Methane Remote Sensing. In International Conference on Space Optics-ICSO 2014; Sodnik, Z., Cugny, B., Karafolas, N., Eds.; Spie-Int Soc Optical Engineering: Bellingham, WA, USA, 2014; Volume 10563. [Google Scholar]
- Rudakov, F.; Geiser, J.D.; Weber, P.M. Spatially resolved standoff trace chemical sensing using backwards transient absorption spectroscopy. Opt. Lett. 2018, 43, 1279–1282. [Google Scholar] [CrossRef]
- Leffler, T.; Brackmann, C.; Ehn, A.; Kaldvee, B.; Alden, M.; Berg, M.; Bood, J. Range-resolved detection of potassium chloride using picosecond differential absorption light detection and ranging. Appl. Opt. 2015, 54, 1058–1064. [Google Scholar] [CrossRef] [PubMed]
- Malmqvist, E.; Brydegaard, M.; Alden, M.; Bood, J. Scheimpflug Lidar for combustion diagnostics. Opt. Express 2018, 26, 14842–14858. [Google Scholar] [CrossRef]
- Saleh, A.; Aalto, A.; Ryczkowski, P.; Genty, G.; Toivonen, J. Short-range supercontinuum-based lidar for temperature profiling. Opt. Lett. 2019, 44, 4223–4226. [Google Scholar] [CrossRef]
- Cui, X.; Dong, F.; Zhang, Z.; Xia, H.; Pang, T.; Sun, P.; Wu, B.; Liu, S.; Han, L.; Li, Z. Environmental Application of High Sensitive Gas Sensors with Tunable Diode Laser Absorption Spectroscopy. In Green Electronics; Ravariu, C., Mihaiescu, D., Eds.; IntechOpen: London, UK, 2017. [Google Scholar]
- Chen, J.; Du, Z.H.; Sun, T.; Li, J.Y.; Ma, Y.W. Self-corrected frequency modulation spectroscopy immune to phase random and light intensity fluctuation. Opt. Express 2019, 27, 30700–30709. [Google Scholar] [CrossRef]
- Wang, F.; Jia, S.; Wang, Y.; Tang, Z.J.A.S. Recent developments in modulation spectroscopy for methane detection based on tunable diode laser. Appl. Sci. 2019, 9, 2816. [Google Scholar] [CrossRef]
- Goyal, A.K.; Kotidis, P.; Deutsch, E.R.; Zhu, N.; Norman, M.; Ye, J.; Zafiriou, K.; Mazurenko, A. Detection of chemical clouds using widely tunable quantum cascade lasers. In Proceedings of the Chemical, Biological, Radiological, Nuclear, and Explosives (CBRNE) Sensing XVI, Baltimore, MD, USA, 21–23 April 2015; p. 94550L. [Google Scholar]
- Ro, K.S.; Johnson, M.H.; Varma, R.M.; Hashmonay, R.A.; Hunt, P. Measurement of greenhouse gas emissions from agricultural sites using open-path optical remote sensing method. J. Environ. Sci. Health A 2009, 44, 1011–1018. [Google Scholar] [CrossRef]
- Xia, H.; Liu, W.Q.; Zhang, Y.J.; Kan, R.F.; Wang, M.; He, Y.; Cui, Y.B.; Ruan, J.; Geng, H. An approach of open-path gas sensor based on tunable diode laser absorption spectroscopy. Chin. Opt. Lett. 2008, 6, 437–440. [Google Scholar] [CrossRef]
- Pranovich, A.; Divoky, M.; Prochazka, I.; Mocek, T. Tunable diode laser absorption spectroscopy at 2.05 um for the CO2 concentration measurement. In Proceedings of the Optical Sensors 2015, Prague, Czech Republic, 13–16 April 2015; p. 95061S. [Google Scholar]
- Li, J.; Du, Z.; Ma, Y.; Liu, J. Indoor carbon dioxide monitoring with diode laser absorption at 2 μm. In Proceedings of the Third International Symposium on Laser Interaction with Matter, Nanjing, China, 2–5 November 2014; p. 954313. [Google Scholar]
- Yang, C.; Hu, M.; Chen, X.; Xu, Z.; Fan, X.; Liu, J.; Kan, R. Multi-QCLs based Open-path Sensor for Atmospheric NO, NO2 and NH3 Detections. In Proceedings of the Optics and Photonics for Energy and the Environment, Leipzig, Germany, 14–17 November 2016; p. JW4A-26. [Google Scholar]
- Mlynczak, J.; Kubicki, J.; Kopczynski, K. Stand-Off Detection of Alcohol Vapors Exhaled by Humans. Sensors 2018, 18, 1310. [Google Scholar] [CrossRef] [PubMed]
- Dong, D.M.; Jiao, L.Z.; Li, C.X.; Zhao, C.J. Rapid and real-time analysis of volatile compounds released from food using infrared and laser spectroscopy. TrAC Trends Anal. Chem. 2019, 110, 410–416. [Google Scholar] [CrossRef]
- Deutsch, E.R.; Kotidis, P.; Zhu, N.; Goyal, A.K.; Ye, J.; Mazurenko, A.; Norman, M.; Zafiriou, K.; Baier, M.; Connors, R. Active and passive infrared spectroscopy for the detection of environmental threats. In Proceedings of the Advanced Environmental, Chemical, and Biological Sensing Technologies XI, Baltimore, MD, USA, 5–6 May 2014; p. 91060A. [Google Scholar]
- Wysocki, G.; Weidmann, D. Molecular dispersion spectroscopy for chemical sensing using chirped mid-infrared quantum cascade laser. Opt. Express 2010, 18, 26123–26140. [Google Scholar] [CrossRef] [PubMed]
- Nikodem, M.; Wysocki, G. Chirped laser dispersion spectroscopy for remote open-path trace-gas sensing. Sensors 2012, 12, 16466–16481. [Google Scholar] [CrossRef]
- Nikodem, M.; Plant, G.; Sonnenfroh, D.; Wysocki, G. Open-path sensor for atmospheric methane based on chirped laser dispersion spectroscopy. Appl. Phys. B Lasers Opt. 2015, 119, 3–9. [Google Scholar] [CrossRef]
- Plant, G.; Nikodem, M.; Mulhall, P.; Varner, R.K.; Sonnenfroh, D.; Wysocki, G. Field Test of a Remote Multi-Path CLaDS Methane Sensor. Sensors 2015, 15, 21315–21326. [Google Scholar] [CrossRef]
- Nikodem, M. Chirped laser dispersion spectroscopy for laser-based hydrogen sulfide detection in open-path conditions. Opt. Express 2016, 24, A878–A884. [Google Scholar] [CrossRef]
- Golubkov, G.V.; Grigoriev, G.Y.; Nabiev, S.S.; Palkina, L.A.; Golubkov, M.G. Use of IR Absorption Laser Spectroscopy at Nuclear Fuel Cycle Plants: Problems and Prospects (Review). Russ. J. Phys. Chem. B 2018, 12, 804–829. [Google Scholar] [CrossRef]
- Xia, J.; Zhu, F.; Zhang, S.; Kolomenskii, A.; Dong, J.; Okada, K.; Strohaber, J.; Schuessler, H.A. Probing greenhouse gases in turbulent atmosphere by long-range open-path wavelength modulation spectroscopy. Opt. Lasers Eng. 2019, 117, 21–28. [Google Scholar] [CrossRef]
- Taslakov, M.; Simeonov, V.; Froidevaux, M.; van den Bergh, H. Open-path ozone detection by quantum-cascade laser. Appl. Phys. B Lasers Opt. 2006, 82, 501–506. [Google Scholar] [CrossRef]
- Michel, A.P.M.; Liu, P.Q.; Yeung, J.K.; Corrigan, P.; Baeck, M.L.; Wang, Z.F.; Day, T.; Moshary, F.; Gmachl, C.F.; Smith, J.A. Quantum cascade laser open-path system for remote sensing of trace gases in Beijing, China. Opt. Eng. 2010, 49, 111125. [Google Scholar] [CrossRef]
- Frish, M.B. Laser-based sensors for addressing climate change. In Proceedings of the CLEO: Applications and Technology, San Jose, CA, USA, 14–19 May 2017; p. AM3B-1. [Google Scholar]
- Frish, M.; Wainner, R.; Green, B.; Laderer, M.; Allen, M. Standoff gas leak detectors based on tunable diode laser absorption spectroscopy. In Proceedings of the Infrared to Terahertz Technologies for Health and the Environment, Boston, MA, USA, 23–26 October 2005; p. 60100D. [Google Scholar]
- Wainner, R.T.; Green, B.D.; Allen, M.G.; White, M.A.; Stafford-Evans, J.; Naper, R. Handheld, battery-powered near-IR TDL sensor for stand-off detection of gas and vapor plumes. Appl. Phys. B Lasers Opt. 2002, 75, 249–254. [Google Scholar] [CrossRef]
- van Well, B.; Murray, S.; Hodgkinson, J.; Pride, R.; Strzoda, R.; Gibson, G.; Padgett, M. An open-path, hand-held laser system for the detection of methane gas. J. Opt. Soc. Am. A 2005, 7, S420. [Google Scholar] [CrossRef]
- Gao, X.; Fan, H.; Huang, T.; Wang, X.; Bao, J.; Li, X.; Huang, W.; Zhang, W. Natural gas pipeline leak detector based on NIR diode laser absorption spectroscopy. Spectrochim. Acta A Mol. Biomol. Spectrosc. 2006, 65, 133–138. [Google Scholar] [CrossRef]
- Wang, T.; Zhou, T.; Jia, X. Remote sensing with laser spectrum radar. In Proceedings of the Hyperspectral Remote Sensing Applications and Environmental Monitoring and Safety Testing Technology, Beijing, China, 9–11 May 2016; p. 101560C. [Google Scholar]
- Lwin, M.; Corrigan, P.; Gross, B.; Moshary, F.; Ahmed, S. Mid-infrared backscattering measurements of building materials using a quantum cascade laser. In Proceedings of the Infrared Technology and Applications XXXVI, Orlando, FL, USA, 5–9 April 2010; p. 766043. [Google Scholar]
- Basistyy, R.; Genoud, A.; Diaz, A.; Moshary, F.; Thomas, B. Active standoff mixing-ratio measurements of N2O from topographic targets using an open-path quantum cascade laser system. In Proceedings of the Lidar Remote Sensing for Environmental Monitoring XVI, Honolulu, HI, USA, 24–25 September 2018; p. 107790G. [Google Scholar]
- Basistyy, R.; Genoud, A.; Thomas, B. Backscattering properties of topographic targets in the visible, shortwave infrared, and mid-infrared spectral ranges for hard-target lidars. Appl. Opt. 2018, 57, 6990–6997. [Google Scholar] [CrossRef]
- Frish, M.B.; Wainner, R.T.; Laderer, M.C.; Green, B.D.; Allen, M.G. Standoff and Miniature Chemical Vapor Detectors Based on Tunable Diode Laser Absorption Spectroscopy. IEEE Sens. J. 2010, 10, 639–646. [Google Scholar] [CrossRef]
- Frish, M.B.; Wainner, R.T.; Laderer, M.C.; Allen, M.G.; Rutherford, J.; Wehnert, P.; Dey, S.; Gilchrist, J.; Corbi, R.; Picciaia, D. Low-cost lightweight airborne laser-based sensors for pipeline leak detection and reporting. In Proceedings of the Next-Generation Spectroscopic Technologies VI, Baltimore, MD, USA, 29–30 April 2013; p. 87260C. [Google Scholar]
- Yang, S.T.; Talbot, R.W.; Frish, M.B.; Golston, L.M.; Aubut, N.F.; Zondlo, M.A.; Gretencord, C.; McSpiritt, J. Natural Gas Fugitive Leak Detection Using an Unmanned Aerial Vehicle: Measurement System Description and Mass Balance Approach. Atmosphere 2018, 9, 383. [Google Scholar] [CrossRef]
- Golston, L.M.; Aubut, N.F.; Frish, M.B.; Yang, S.T.; Talbot, R.W.; Gretencord, C.; McSpiritt, J.; Zondlo, M.A. Natural Gas Fugitive Leak Detection Using an Unmanned Aerial Vehicle: Localization and Quantification of Emission Rate. Atmosphere 2018, 9, 333. [Google Scholar] [CrossRef]
- Phillips, M.C.; Brumfield, B.E. Standoff detection of turbulent chemical mixture plumes using a swept external cavity quantum cascade laser. Opt. Eng. 2017, 57, 011003. [Google Scholar] [CrossRef]
- Phillips, M.C.; Brumfield, B.E.; Harilal, S.S. Real-time standoff detection of nitrogen isotopes in ammonia plumes using a swept external cavity quantum cascade laser. Opt. Lett. 2018, 43, 4065–4068. [Google Scholar] [CrossRef] [PubMed]
- Diaz, A.; Thomas, B.; Castillo, P.; Gross, B.; Moshary, F. Active standoff detection of CH4 and N2O leaks using hard-target backscattered light using an open-path quantum cascade laser sensor. Appl. Phys. B Lasers Opt. 2016, 122, 121. [Google Scholar] [CrossRef]
- Takeuchi, E.B.; Rayner, T.; Weida, M.; Crivello, S.; Day, T. Standoff detection of explosives and chemical agents using broadly tuned external-cavity quantum cascade lasers (EC-QCLs). In Proceedings of the Optics and Photonics for Counterterrorism and Crime Fighting III, Florence, Italy, 18–20 September 2007. [Google Scholar]
- Bauer, C.; Sharma, A.K.; Willer, U.; Burgmeier, J.; Braunschweig, B.; Schade, W.; Blaser, S.; Hvozdara, L.; Muller, A.; Holl, G. Potentials and limits of mid-infrared laser spectroscopy for the detection of explosives. Appl. Phys. B Lasers Opt. 2008, 92, 327–333. [Google Scholar] [CrossRef]
- Bauer, C.; Willer, U.; Schade, W. Use of quantum cascade lasers for detection of explosives: Progress and challenges. Opt. Eng. 2010, 49, 7. [Google Scholar] [CrossRef]
- Schade, W.; Orghici, R.; Mordmüller, M.; Willer, U.J.H.o.B. Detection of Explosives. In Handbook of Biophotonics; Wiley: Hoboken, NJ, USA, 2013; pp. 195–218. [Google Scholar] [CrossRef]
- Breshike, C.J.; Kendziora, C.A.; Furstenberg, R.; Yoon, Y. Rapid detection of infrared backscatter for standoff detection of trace explosives. In Proceedings of the Chemical, Biological, Radiological, Nuclear, and Explosives (CBRNE) Sensing XXI, Online, 27 April–8 May 2020; p. 114160W. [Google Scholar]
- Pacheco-Londono, L.C.; Warren, E.; Galan-Freyle, N.J.; Villarreal-Gonzalez, R.; Aparicio-Bolano, J.A.; Ospina-Castro, M.L.; Shih, W.C.; Hernandez-Rivera, S.P. Mid-Infrared Laser Spectroscopy Detection and Quantification of Explosives in Soils Using Multivariate Analysis and Artificial Intelligence. Appl. Sci. 2020, 10, 19. [Google Scholar] [CrossRef]
- Wang, Z.; Sanders, S.T. Toward single-ended absorption spectroscopy probes based on backscattering from rough surfaces: H2O vapor measurements near 1350 nm. Appl. Phys. B Lasers Opt. 2015, 121, 187–192. [Google Scholar] [CrossRef]
- Wang, Z.; Sanders, S.T.; Robinson, M.A. Spatially resolved concentration measurements based on backscatter absorption spectroscopy. Appl. Phys. B Lasers Opt. 2016, 122, 176. [Google Scholar] [CrossRef]
- Peng, W.Y.; Goldenstein, C.S.; Mitchell Spearrin, R.; Jeffries, J.B.; Hanson, R.K. Single-ended mid-infrared laser-absorption sensor for simultaneous in situ measurements of H2O, CO2, CO, and temperature in combustion flows. Appl. Opt. 2016, 55, 9347–9359. [Google Scholar] [CrossRef]
- Zhou, Y.; Mathews, G.C.; Goldenstein, C.S. Compact, fiber-coupled, single-ended laser-absorption-spectroscopy sensors for high-temperature environments. Appl. Opt. 2018, 57, 7117–7126. [Google Scholar] [CrossRef]
- Ding, W.; Sun, L. Calibration-free Handheld sensor based on Tunable Diode Laser Absorption Spectroscopy for Remote Detection of Methane. In Proceedings of the Optics and Photonics for Energy and the Environment 2015, Suzhou, China, 2–5 November 2015; p. ETu4A-2. [Google Scholar]
- Ding, W.; Sun, L.; Yi, L.; Zhang, E. ‘Baseline-offset’scheme for a methane remote sensor based on wavelength modulation spectroscopy. Meas. Sci. Technol. 2016, 27, 085202. [Google Scholar] [CrossRef]
- Frish, M.B.; Scherer, D.R.; Wainner, R.T.; Allen, M.G.; Shankar, R.; Loncar, M. Monolithic integrated-optic TDLAS sensors. In Proceedings of the Next-Generation Spectroscopic Technologies V, Baltimore, MD, USA, 23–24 April 2012; p. 83740I. [Google Scholar]
- Hernández Bennetts, V.M. Mobile Robots with In-Situ and Remote Sensors for Real World Gas Distribution Modelling. Ph.D. Thesis, Örebro University, Örebro, Sweden, 2015. [Google Scholar]
- Neumann, P.P.; Kohlhoff, H.; Hüllmann, D.; Lilienthal, A.J.; Kluge, M. Bringing Mobile Robot Olfaction to the next dimension—UAV-based remote sensing of gas clouds and source localization. In Proceedings of the 2017 IEEE International Conference on Robotics and Automation (ICRA), Singapore, 29 May–3 June 2017; pp. 3910–3916. [Google Scholar]
- Harris, M.; Pearson, G.N.; Willetts, D.V.; Ridley, K.; Tapster, P.R.; Perrett, B. Pulsed indirect photoacoustic spectroscopy: Application to remote detection of condensed phases. Appl. Opt. 2000, 39, 1032–1041. [Google Scholar] [CrossRef] [PubMed]
- Perrett, B.; Harris, M.; Pearson, G.N.; Willetts, D.V.; Pitter, M.C. Remote photoacoustic detection of liquid contamination of a surface. Appl. Opt. 2003, 42, 4901–4908. [Google Scholar] [CrossRef] [PubMed]
- Li, J.S.; Yu, B.; Fischer, H.; Chen, W.; Yalin, A.P. Contributed review: Quantum cascade laser based photoacoustic detection of explosives. Rev. Sci. Instrum. 2015, 86, 031501. [Google Scholar] [CrossRef] [PubMed]
- Chen, X.; Cheng, L.; Guo, D.; Kostov, Y.; Choa, F.S. Quantum cascade laser based standoff photoacoustic chemical detection. Opt. Express 2011, 19, 20251–20257. [Google Scholar] [CrossRef] [PubMed]
- Chen, X.; Guo, D.K.; Choa, F.S.; Wang, C.C.; Trivedi, S.; Snyder, A.P.; Ru, G.Y.; Fan, J.Y. Standoff photoacoustic detection of explosives using quantum cascade laser and an ultrasensitive microphone. Appl. Opt. 2013, 52, 2626–2632. [Google Scholar] [CrossRef]
- Choa, F.-S.; Wang, C.-C.; Khurgin, J.; Samuels, A.; Trivedi, S.; Gupta, D. Standoff photoacoustic detections with high-sensitivity microphones and acoustic arrays. In Proceedings of the Chemical, Biological, Radiological, Nuclear, and Explosives (CBRNE) Sensing XVII, Baltimore, MD, USA, 18–20 April 2016; p. 98240M. [Google Scholar]
- Gupta, D.; Wang, C.-C.; Khurgin, J.; Samuels, A.; Trivedi, S.; Choa, F.-S. Acoustic array beam-forming for standoff chemical detection. SPIE News Room 2016. [Google Scholar] [CrossRef]
- Gupta, D.; Chen, X.; Wang, C.-C.; Trivedi, S.; Choa, F.-S. Stand-off chemical detection using photoacoustic sensing techniques—From single element to phase array. Chemosensors 2018, 6, 6. [Google Scholar] [CrossRef]
- Sharma, R.C.; Kumar, S.; Kumar, S.; Mann, M.; Sharma, M. Photoacoustic remote sensing of suspicious objects for defence and forensic applications. Spectrochim. Acta A Mol. Biomol. Spectrosc. 2020, 224, 117445. [Google Scholar] [CrossRef]
- Cooper, J.K.; Grant, C.D.; Zhang, J.Z. Experimental and TD-DFT study of optical absorption of six explosive molecules: RDX, HMX, PETN, TNT, TATP, and HMTD. J. Phys. Chem. A 2013, 117, 6043–6051. [Google Scholar] [CrossRef]
- Zrimsek, A.B.; Bykov, S.V.; Asher, S.A. Deep Ultraviolet Standoff Photoacoustic Spectroscopy of Trace Explosives. Appl. Spectrosc. 2019, 73, 601–609. [Google Scholar] [CrossRef]
- Holthoff, E.L.; Pellegrino, P.M. Development of photoacoustic sensing platforms at the Army Research Laboratory. Appl. Opt. 2017, 56, B74–B84. [Google Scholar] [CrossRef] [PubMed]
- Marcus, L.S.; Holthoff, E.L.; Pellegrino, P.M. Standoff Photoacoustic Spectroscopy of Explosives. Appl. Spectrosc. 2017, 71, 833–838. [Google Scholar] [CrossRef] [PubMed]
- Marcus, L.S.; Holthoff, E.L.; Pellegrino, P.M. Standoff photoacoustic spectroscopy for hazard detection. J. Acoust. Soc. Am. 2015, 138, 1940. [Google Scholar] [CrossRef]
- Holthoff, E.L.; Marcus, L.S.; Pellegrino, P.M. Photoacoustic spectroscopy for trace vapor detection and standoff detection of explosives. In Proceedings of the Chemical, Biological, Radiological, Nuclear, and Explosives (CBRNE) Sensing XVII, Baltimore, MD, USA, 18–20 April 2016; p. 98240R. [Google Scholar]
- El-Sharkawy, Y.H.; Elbasuney, S. Novel laser induced photoacoustic spectroscopy for instantaneous trace detection of explosive materials. Forensic Sci. Int. 2017, 277, 215–222. [Google Scholar] [CrossRef]
- Hu, Q.; Lim, J.S.K.; Liu, H.; Fu, Y. Photo-vibrational spectroscopy of solid and liquid chemicals using laser Doppler vibrometer. Opt. Express 2016, 24, 19148–19156. [Google Scholar] [CrossRef]
- Fu, Y.; Liu, H.; Hu, Q.; Xie, J. Photo-vibrational sensing of trace chemicals and explosives by long-distance differential laser Doppler vibrometer. In Proceedings of the Chemical, Biological, Radiological, Nuclear, and Explosives (CBRNE) Sensing XVIII, Anaheim, CA, USA, 11 April 2017; p. 101830B. [Google Scholar]
- Fu, Y.; Hu, Q.; Liu, H. Standoff photoacoustic sensing of trace chemicals by laser Doppler vibrometer. In Proceedings of the Chemical, Biological, Radiological, Nuclear, and Explosives (CBRNE) Sensing XVII, Baltimore, MD, USA, 18–20 April 2016; p. 98240O. [Google Scholar]
- Fu, Y.; Liu, H.; Xie, J.C. 100-m standoff detection of a QCL-induced photo-vibrational signal on explosives using a laser vibrometer. Opt. Laser Eng. 2018, 107, 241–246. [Google Scholar] [CrossRef]
- Kosterev, A.A.; Bakhirkin, Y.A.; Curl, R.F.; Tittel, F.K. Quartz-enhanced photoacoustic spectroscopy. Opt. Lett. 2002, 27, 1902–1904. [Google Scholar] [CrossRef]
- Ma, Y. Review of recent advances in QEPAS-based trace gas sensing. Appl. Sci. 2018, 8, 1822. [Google Scholar] [CrossRef]
- Van Neste, C.W.; Senesac, L.R.; Thundat, T. Standoff photoacoustic spectroscopy. Appl. Phys. Lett. 2008, 92, 234102. [Google Scholar] [CrossRef]
- Van Neste, C.W.; Senesac, L.R.; Thundat, T. Standoff spectroscopy of surface adsorbed chemicals. Anal. Chem. 2009, 81, 1952–1956. [Google Scholar] [CrossRef]
- Liu, N.W.; Zhou, S.; Zhang, L.; Yu, B.L.; Fischer, H.; Ren, W.; Li, J.S. Standoff detection of VOCs using external cavity quantum cascade laser spectroscopy. Laser Phys. Lett. 2018, 15, 085701. [Google Scholar] [CrossRef]
- Sun, J.; Ding, J.; Liu, N.; Yang, G.; Li, J. Detection of multiple chemicals based on external cavity quantum cascade laser spectroscopy. Spectrochim. Acta A Mol. Biomol. Spectrosc. 2018, 191, 532–538. [Google Scholar] [CrossRef] [PubMed]
- Kumar, D.; Gupta, S.; Kumar, S.; Sharma, R.C.; Soni, R.K. Open-path measurement of ozone and methane gases using quartz-enhanced photoacoustic spectroscopy. Spectrosc. Lett. 2016, 49, 469–476. [Google Scholar] [CrossRef]
- Li, J.S.; Liu, N.W.; Ding, J.Y.; Zhou, S.; He, T.B.; Zhang, L. Piezoelectric effect-based detector for spectroscopic application. Opt. Laser Eng. 2019, 115, 141–148. [Google Scholar] [CrossRef]
- Sharma, R.C.; Kumar, D.; Bhardwaj, N.; Gupta, S.; Chandra, H.; Maini, A.K. Portable detection system for standoff sensing of explosives and hazardous materials. Opt. Commun. 2013, 309, 44–49. [Google Scholar] [CrossRef]
- Zhang, Z.Q.; Jia, S.H.; Ma, B.S.; Chen, H.L.; Wei, Y. Dynamics of quartz tuning fork force sensors used in standoff photoacoustic detection. J. Mech. Sci. Technol. 2015, 29, 3091–3096. [Google Scholar] [CrossRef]
- Udem, T.; Holzwarth, R.; Hansch, T.W. Optical frequency metrology. Nature 2002, 416, 233–237. [Google Scholar] [CrossRef]
- Vodopyanov, K.L. Broadband mid-IR frequency comb source for standoff chemical detection. In Proceedings of the Micro-and Nanotechnology Sensors, Systems, and Applications VII, Baltimore, MD, USA, 20–24 April 2015; p. 94672N. [Google Scholar]
- Boudreau, S.; Levasseur, S.; Perilla, C.; Roy, S.; Genest, J. Chemical detection with hyperspectral lidar using dual frequency combs. Opt. Express 2013, 21, 7411–7418. [Google Scholar] [CrossRef]
- Truong, G.W.; Waxman, E.M.; Cossel, K.C.; Baumann, E.; Klose, A.; Giorgetta, F.R.; Swann, W.C.; Newbury, N.R.; Coddington, I. Accurate frequency referencing for fieldable dual-comb spectroscopy. Opt. Express 2016, 24, 30495–30504. [Google Scholar] [CrossRef]
- Villares, G.; Hugi, A.; Blaser, S.; Faist, J. Dual-comb spectroscopy based on quantum-cascade-laser frequency combs. Nat. Commun. 2014, 5, 5192. [Google Scholar] [CrossRef]
- Coddington, I.; Newbury, N.; Swann, W. Dual-comb spectroscopy. Optica 2016, 3, 414–426. [Google Scholar] [CrossRef]
- Millot, G.; Pitois, S.; Yan, M.; Hovhannisyan, T.; Bendahmane, A.; Hänsch, T.W.; Picqué, N. Frequency-agile dual-comb spectroscopy. Nat. Photon. 2016, 10, 27. [Google Scholar] [CrossRef]
- Schliesser, A.; Brehm, M.; Keilmann, F.; van der Weide, D. Frequency-comb infrared spectrometer for rapid, remote chemical sensing. Opt. Express 2005, 13, 9029–9038. [Google Scholar] [CrossRef] [PubMed]
- Ideguchi, T.; Poisson, A.; Guelachvili, G.; Picque, N.; Hansch, T.W. Adaptive real-time dual-comb spectroscopy. Nat. Commun. 2014, 5, 3375. [Google Scholar] [CrossRef]
- Coburn, S.; Alden, C.B.; Wright, R.; Cossel, K.; Baumann, E.; Truong, G.W.; Giorgetta, F.; Sweeney, C.; Newbury, N.R.; Prasad, K.; et al. Regional trace-gas source attribution using a field-deployed dual frequency comb spectrometer. Optica 2018, 5, 320–327. [Google Scholar] [CrossRef]
- Waxman, E.M.; Cossel, K.C.; Truong, G.W.; Giorgetta, F.R.; Swann, W.C.; Coburn, S.; Wright, R.J.; Rieker, G.B.; Coddington, I.; Newbury, N.R. Intercomparison of Open-Path Trace Gas Measurements with Two Dual Frequency Comb Spectrometers. Atmos. Meas. Tech. 2017, 10, 3295–3311. [Google Scholar] [CrossRef]
- Truong, G.-W.; Waxman, E.; Cossel, K.C.; Giorgetta, F.; Swann, W.C.; Coddington, I.; Newbury, N.R. Dual-comb spectroscopy for city-scale open path greenhouse gas monitoring. In Proceedings of the CLEO: Science and Innovations, San Jose, CA, USA, 5–10 June 2016; p. SW4H-2. [Google Scholar]
- Cossel, K.C.; Waxman, E.M.; Giorgetta, F.R.; Cermak, M.; Coddington, I.R.; Hesselius, D.; Ruben, S.; Swann, W.C.; Truong, G.W.; Rieker, G.B.; et al. Open-path dual comb spectroscopy to an airborne retroreflector. Optica 2017, 4, 724–728. [Google Scholar] [CrossRef]
- Ycas, G.; Giorgetta, F.R.; Cossel, K.C.; Waxman, E.M.; Baumann, E.; Newbury, N.R.; Coddington, I. Mid-infrared dual-comb spectroscopy of volatile organic compounds across long open-air paths. Optica 2019, 6, 165–168. [Google Scholar] [CrossRef]
- Schroeder, P.J.; Wright, R.J.; Coburn, S.; Sodergren, B.; Cossel, K.C.; Droste, S.; Truong, G.W.; Baumann, E.; Giorgetta, F.R.; Coddington, I.; et al. Dual frequency comb laser absorption spectroscopy in a 16 MW gas turbine exhaust. Proc. Combust. Inst. 2017, 36, 4565–4573. [Google Scholar] [CrossRef]
- Hensley, J.M.; Brown, J.M.; Allen, M.G.; Geiser, M.; Allmendinger, P.; Mangold, M.; Hugi, A.; Juoy, P.; Faist, J. Standoff detection from diffusely scattering surfaces using dual quantum cascade laser comb spectroscopy. In Proceedings of the Ultrafast Bandgap Photonics III, Orlando, FL, USA, 16–19 April 2018; p. 1063820. [Google Scholar]
- Hayden, T.R.S.; Malarich, N.; Petrykowski, D.; Nigam, S.P.; Christopher, J.D.; Lapointe, C.; Wimer, N.T.; Hamlington, P.E.; Rieker, G.B. OH radical measurements in combustion environments using wavelength modulation spectroscopy and dual-frequency comb spectroscopy near 1491 nm. Appl. Phys. B Lasers Opt. 2019, 125, 226. [Google Scholar] [CrossRef]
- Westberg, J.; Teng, C.C.; Chen, Y.; Liu, J.; Patrick, L.; Soskind, M.; Shen, L.; Wysocki, G. Field deployment of a mid-IR dual-comb spectrometer based on quantum cascade lasers. In Proceedings of the OSA Optical Sensors and Sensing Congress, Vancouver, BC, Canada, 22–26 June 2020. [Google Scholar]
- Giorgetta, F.; Rieker, G.; Sinclair, L.; Baumann, E.; Coddington, I.; Swann, W.; Newbury, N. Phase Spectroscopy of Atmospheric Gases across a 2-km Open-Air Path by Dual-Comb Spectroscopy. In Proceedings of the Applications of Lasers for Sensing and Free Space Communications, Arlington, VA, USA, 7–11 June 2015; p. LT2F-3. [Google Scholar]
- Okubo, S.; Iwakuni, K.; Inaba, H.; Hosaka, K.; Onae, A.; Sasada, H.; Hong, F.-L. Ultra-broadband dual-comb spectroscopy across 1.0–1.9 µm. Appl. Phys. Express 2015, 8, 082402. [Google Scholar] [CrossRef]
- Suh, M.G.; Yang, Q.F.; Yang, K.Y.; Yi, X.; Vahala, K.J. Microresonator soliton dual-comb spectroscopy. Science 2016, 354, 600–603. [Google Scholar] [CrossRef] [PubMed]
- Fdil, K.; Michaud-Belleau, V.; Hebert, N.B.; Guay, P.; Fleisher, A.J.; Deschenes, J.D.; Genest, J. Dual electro-optic frequency comb spectroscopy using pseudo-random modulation. Opt. Lett. 2019, 44, 4415–4418. [Google Scholar] [CrossRef] [PubMed]
- Ycas, G.; Giorgetta, F.R.; Baumann, E.; Coddington, I.; Herman, D.; Diddams, S.A.; Newbury, N.R. High-coherence mid-infrared dual-comb spectroscopy spanning 2.6 to 5.2 μm. Nat. Photonics 2018, 12, 202. [Google Scholar] [CrossRef]
- Shen, X.L.; Yan, M.; Hao, Q.; Yang, K.W.; Zeng, H.P. Adaptive Dual-Comb Spectroscopy With 1200-h Continuous Operation Stability. IEEE Photon. J. 2018, 10, 1–9. [Google Scholar] [CrossRef]
- Link, S.M.; Maas, D.; Waldburger, D.; Keller, U. Dual-comb spectroscopy of water vapor with a free-running semiconductor disk laser. Science 2017, 356, 1164–1168. [Google Scholar] [CrossRef] [PubMed]
- Westberg, J.; Sterczewski, L.A.; Kapsalidis, F.; Bidaux, Y.; Wolf, J.M.; Beck, M.; Faist, J.; Wysocki, G. Dual-comb spectroscopy using plasmon-enhanced-waveguide dispersion-compensated quantum cascade lasers. Opt. Lett. 2018, 43, 4522–4525. [Google Scholar] [CrossRef]
- Martin-mateos, P.; Genner, A.; Moser, H.; Lendl, B. Implementation and characterization of a thermal infrared laser heterodyne radiometer based on a wavelength modulated local oscillator laser. Opt. Express 2019, 27, 15575–15584. [Google Scholar] [CrossRef]
- Menzies, R.T.; Shumate, M.S. Air-Pollution—Remote Detection of Several Pollutant Gases with a Laser Heterodyne Radiometer. Science 1974, 184, 570–572. [Google Scholar] [CrossRef]
- Weidmann, D.; Reburn, W.J.; Smith, K.M. Retrieval of atmospheric ozone profiles from an infrared quantum cascade laser heterodyne radiometer: Results and analysis. Appl. Opt. 2007, 46, 7162–7171. [Google Scholar] [CrossRef]
- Weidmann, D.; Tsai, T.; Macleod, N.A.; Wysocki, G. Atmospheric observations of multiple molecular species using ultra-high-resolution external cavity quantum cascade laser heterodyne radiometry. Opt. Lett. 2011, 36, 1951–1953. [Google Scholar] [CrossRef]
- Weidmann, D.; Hoffmann, A.; Macleod, N.; Middleton, K.; Kurtz, J.; Barraclough, S.; Griffin, D. The Methane Isotopologues by Solar Occultation (MISO) Nanosatellite Mission: Spectral Channel Optimization and Early Performance Analysis. Remote Sens. 2017, 9, 1073. [Google Scholar] [CrossRef]
- Tsai, T.R.; Rose, R.A.; Weidmann, D.; Wysocki, G. Atmospheric vertical profiles of O3, N2O, CH4, CCl2F2, and H2O retrieved from external-cavity quantum-cascade laser heterodyne radiometer measurements. Appl. Opt. 2012, 51, 8779–8792. [Google Scholar] [CrossRef] [PubMed]
- Smith, F.; Havemann, S.; Hoffmann, A.; Bell, W.; Weidmann, D.; Newman, S. Evaluation of laser heterodyne radiometry for numerical weather prediction applications. Q. J. R. Meteorol. Soc. 2018, 144, 1831–1850. [Google Scholar] [CrossRef]
- Hoffmann, A.; Macleod, N.A.; Huebner, M.; Weidmann, D. Thermal infrared laser heterodyne spectroradiometry for solar occultation atmospheric CO2 measurements. Atmos. Meas. Tech. 2016, 9, 5975. [Google Scholar] [CrossRef]
- Shang-lu, Z.; Yin-bo, H.; Xing-ji, L.; Zhen-song, C.; Cong-ming, D.; Qiang, L.; Xiao-ming, G.; Rui-zhong, R.; Ying-jian, W. Retrieval of Atmospheric H2O Column Concentration Based on Mid-Infrared Inter-Band Cascade Laser Heterodyne Radiometer. Spectrosc. Spect. Anal. 2019, 39, 1317–1322. [Google Scholar] [CrossRef]
- Wilson, E.; McLinden, M.; Miller, J.; Allan, G.; Ott, L.; Melroy, H.; Clarke, G. Miniaturized laser heterodyne radiometer for measurements of CO2 in the atmospheric column. Appl. Phys. B Lasers Opt. 2014, 114, 385–393. [Google Scholar] [CrossRef]
- Wilson, E.L.; McLinden, M.L.; Georgieva, E.M.; Miller, J.H. Low-cost miniaturized laser heterodyne radiometer for highly sensitive detection of CO2, CH4, and CO in the atmospheric column. In Proceedings of the 2011 NASA Carbon Cycle and Ecosystems Joint Science Workshop, Alexandria, VA, USA, 3–7 October 2011. [Google Scholar]
- Melroy, H.; Wilson, E.; Clarke, G.; Ott, L.; Mao, J.; Ramanathan, A.; McLinden, M. Autonomous field measurements of CO2 in the atmospheric column with the miniaturized laser heterodyne radiometer (Mini-LHR). Appl. Phys. B Lasers Opt. 2015, 120, 609–615. [Google Scholar] [CrossRef]
- Wilson, E.; DiGregorio, A.; Villanueva, G.; Grunberg, C.; Souders, Z.; Miletti, K.; Menendez, A.; Grunberg, M.; Floyd, M.; Bleacher, J. A portable miniaturized laser heterodyne radiometer (mini-LHR) for remote measurements of column CH4 and CO2. Appl. Phys. B Lasers Opt. 2019, 125, 211. [Google Scholar] [CrossRef]
- Deng, H.; Yang, C.; Wang, W.; Shan, C.; Xu, Z.; Chen, B.; Yao, L.; Hu, M.; Kan, R.; He, Y. Near infrared heterodyne radiometer for continuous measurements of atmospheric CO2 column concentration. Infrared Phys. Technol. 2019. [Google Scholar] [CrossRef]
- Martín-Mateos, P.; Bonilla-Manrique, O.E.; Gutiérrez-Escobero, C. Wavelength modulation laser heterodyne radiometry. Opt. Lett. 2018, 43, 3009–3012. [Google Scholar] [CrossRef] [PubMed]
- Sonnabend, G.; Wirtz, D.; Vetterle, V.; Schieder, R. High-resolution observations of Martian non-thermal CO2 emission near 10 m with a new tuneable heterodyne receiver. Astron. Astrophys. 2005, 435, 1181–1184. [Google Scholar] [CrossRef][Green Version]
- Nakagawa, H.; Aoki, S.; Sagawa, H.; Kasaba, Y.; Murata, I.; Sonnabend, G.; Sornig, M.; Okano, S.; Kuhn, J.R.; Ritter, J.M. IR heterodyne spectrometer MILAHI for continuous monitoring observatory of Martian and Venusian atmospheres at Mt. Haleakalā, Hawaii. Planet. Space Sci. 2016, 126, 34–48. [Google Scholar] [CrossRef]
- Macleod, N.A.; Rose, R.; Weidmann, D. Middle infrared active coherent laser spectrometer for standoff detection of chemicals. Opt. Lett. 2013, 38, 3708–3711. [Google Scholar] [CrossRef] [PubMed]
- Macleod, N.A.; Molero, F.; Weidmann, D. Broadband standoff detection of large molecules by mid-infrared active coherent laser spectrometry. Opt. Express 2015, 23, 912–928. [Google Scholar] [CrossRef]
- Killinger, D.K.; Mooradian, A. Optical and Laser Remote Sensing; Springer: Berlin, Germany, 2013; Volume 39. [Google Scholar]
- Razavipour, S.G.; Gupta, J.A.; Sabiston, G.; Sabourin, N.; Bezinger, A.; Lapointe, J.; Poitras, D. Pressure-dependent sensitivity of a single-pass methane detection system using a continuous-wave distributed feedback laser at 3270 nm. Appl. Opt. 2019, 58, 6906–6911. [Google Scholar] [CrossRef]
- Wei, W.; Chang, J.; Huang, Q.J.; Wang, Q.; Liu, Y.Y.; Qin, Z.G. Water vapor concentration measurements using TDALS with wavelength modulation spectroscopy at varying pressures. Sens. Rev. 2017, 37, 172–179. [Google Scholar] [CrossRef]
- Reimann, P.; Schutze, A. Fire detection in coal mines based on semiconductor gas sensors. Sens. Rev. 2012, 32, 47–58. [Google Scholar] [CrossRef]
- Du, Z.H.; Yan, Y.; Li, J.Y.; Zhang, S.; Yang, X.T.; Xiao, Y.H. In situ, multiparameter optical sensor for monitoring the selective catalytic reduction process of diesel engines. Sens. Actuators B Chem. 2018, 267, 255–264. [Google Scholar] [CrossRef]
- Li, J.Y.; Zhang, C.G.; Wei, Y.Y.; Du, Z.H.; Sun, F.S.; Ji, Y.; Yang, X.T.; Liu, C. In situ, portable and robust laser sensor for simultaneous measurement of ammonia, water vapor and temperature in denitrification processes of coal fired power plants. Sens. Actuators B Chem. 2020, 305, 127533. [Google Scholar] [CrossRef]
- Deguchi, Y.; Kamimoto, T.; Kiyota, Y. Time resolved 2D concentration and temperature measurement using CT tunable laser absorption spectroscopy. Flow Meas. Instrum. 2015, 46, 312–318. [Google Scholar] [CrossRef]
- Wang, Z.; Deguchi, Y.; Kamimoto, T.; Tainaka, K.; Tanno, K. Pulverized coal combustion application of laser-based temperature sensing system using computed tomography—Tunable diode laser absorption spectroscopy (CT-TDLAS). Fuel 2020, 268. [Google Scholar] [CrossRef]
- Wang, Z.; Kamimoto, T.; Deguchi, Y.; Zhou, W.; Yan, J.; Tainaka, K.; Tanno, K.; Watanabe, H.; Kurose, R. Two dimensional temperature measurement characteristics in pulverized coal combustion field by computed tomography-tunable diode laser absorption spectroscopy. Appl. Therm. Eng. 2020, 171. [Google Scholar] [CrossRef]
- Liu, C.; Cao, Z.; Lin, Y.; Xu, L.; McCann, H. Online Cross-Sectional Monitoring of a Swirling Flame Using TDLAS Tomography. IEEE Trans. Instrum. Meas. 2018, 67, 1338–1348. [Google Scholar] [CrossRef]
- Cai, W.W.; Kaminski, C.F. Tomographic absorption spectroscopy for the study of gas dynamics and reactive flows. Prog. Energy Combust. Sci. 2017, 59, 1–31. [Google Scholar] [CrossRef]
- Liu, C.; Tsekenis, S.A.; Polydorides, N.; McCann, H. Toward Customized Spatial Resolution in TDLAS Tomography. IEEE Sens. J. 2019, 19, 1748–1755. [Google Scholar] [CrossRef]
- Liu, C.; Xu, L.; Chen, J.; Cao, Z.; Lin, Y.; Cai, W. Development of a fan-beam TDLAS-based tomographic sensor for rapid imaging of temperature and gas concentration. Opt. Express 2015, 23, 22494–22511. [Google Scholar] [CrossRef]
- Wen, P.; Amin, M.; Herzog, W.D.; Kunz, R.R. Key challenges and prospects for optical standoff trace detection of explosives. TrAC Trends Anal. Chem. 2018, 100, 136–144. [Google Scholar] [CrossRef]
- Sigrist, M.W. Mid-infrared laser-spectroscopic sensing of chemical species. J. Adv. Res. 2015, 6, 529–533. [Google Scholar] [CrossRef]
- Schunemann, P.G.; Zawilski, K.T.; Pomeranz, L.A.; Creeden, D.J.; Budni, P.A. Advances in nonlinear optical crystals for mid-infrared coherent sources. J. Opt. Soc. Am. B 2016, 33, D36–D43. [Google Scholar] [CrossRef]
- Hou, C.C.; Chen, H.M.; Zhang, J.C.; Zhuo, N.; Huang, Y.Q.; Hogg, R.A.; Childs, D.T.; Ning, J.Q.; Wang, Z.G.; Liu, F.Q.; et al. Near-infrared and mid-infrared semiconductor broadband light emitters. Light Sci. Appl. 2018, 7, 17170. [Google Scholar] [CrossRef] [PubMed]
- Jung, D.; Bank, S.; Lee, M.L.; Wasserman, D. Next-generation mid-infrared sources. J. Opt. UK 2017, 19, 123001. [Google Scholar] [CrossRef]
- Razeghi, M.; Zhou, W.; Slivken, S.; Lu, Q.-Y.; Wu, D.; McClintock, R. Recent progress of quantum cascade laser research from 3 to 12 μm at the Center for Quantum Devices. Appl. Opt. 2017, 56, H30–H44. [Google Scholar] [CrossRef] [PubMed]
- Curl, R.F.; Capasso, F.; Gmachl, C.; Kosterev, A.A.; McManus, B.; Lewicki, R.; Pusharsky, M.; Wysocki, G.; Tittel, F.K. Quantum cascade lasers in chemical physics. Chem. Phys. Lett. 2010, 487, 1–18. [Google Scholar] [CrossRef]
- Hugi, A.; Maulini, R.; Faist, J. External cavity quantum cascade laser. Semicond. Sci. Technol. 2010, 25, 083001. [Google Scholar] [CrossRef]
- Lyakh, A.; Barron-Jimenez, R.; Dunayevskiy, I.; Go, R.; Tsvid, E.; Patel, C.K.N. Progress in rapidly-tunable external cavity quantum cascade lasers with a frequency-shifted feedback. Photonics 2016, 3, 19. [Google Scholar] [CrossRef]
- Rauter, P.; Capasso, F. Multi-wavelength quantum cascade laser arrays. Laser Photon. Rev. 2015, 9, 452–477. [Google Scholar] [CrossRef]
- Zhou, W.J.; Wu, D.H.; McClintock, R.; Slivken, S.; Razeghi, M. High performance monolithic, broadly tunable mid-infrared quantum cascade lasers. Optica 2017, 4, 1228–1231. [Google Scholar] [CrossRef]
- Bizet, L.; Vallon, R.; Parvitte, B.; Brun, M.; Maisons, G.; Carras, M.; Zeninari, V. Multi-gas sensing with quantum cascade laser array in the mid-infrared region. Appl. Phys. B Lasers Opt. 2017, 123, 145. [Google Scholar] [CrossRef]
- Giglio, M.; Patimisco, P.; Sampaolo, A.; Zifarelli, A.; Menduni, G.; Elefante, A.; Blanchard, R.; Pfluegl, C.; Witinski, M.; Vakhshoori, D. Quartz-enhanced photoacoustic spectroscopy employing a distributed feedback-quantum cascade laser array for nitrous oxide and methane broadband detection. In Proceedings of the Novel In-Plane Semiconductor Lasers XVIII, San Francisco, CA, USA, 4–7 February 2019; p. 109391Q. [Google Scholar]
- Vurgaftman, I.; Weih, R.; Kamp, M.; Meyer, J.; Canedy, C.; Kim, C.; Kim, M.; Bewley, W.; Merritt, C.; Abell, J. Interband cascade lasers. J. Phys. D Appl. Phys. 2015, 48, 123001. [Google Scholar] [CrossRef]
- Jayaraman, V.; Segal, S.; Lascola, K.; Burgner, C.; Towner, F.; Cazabat, A.; Cole, G.; Follman, D.; Heu, P.; Deutsch, C. Room temperature continuous wave mid-infrared VCSEL operating at 3.35 um. In Proceedings of the Vertical-Cavity Surface-Emitting Lasers XXII, San Francisco, CA, USA, 27 January–1 February 2018; p. 105520B. [Google Scholar]
- Röpcke, J.; Davies, P.B.; Hamann, S.; Hannemann, M.; Lang, N.; Van Helden, J.-P.H. Applying quantum cascade laser spectroscopy in plasma diagnostics. Photonics 2016, 3, 45. [Google Scholar] [CrossRef]
- Hübner, M.; Gortschakow, S.; Guaitella, O.; Marinov, D.; Rousseau, A.; Röpcke, J.; Loffhagen, D. Kinetic studies of NO formation in pulsed air-like low-pressure dc plasmas. Plasma Sources Sci. Technol. 2016, 25, 035005. [Google Scholar] [CrossRef]
- Marinov, D.; Lopatik, D.; Guaitella, O.; Ionikh, Y.; Röpcke, J.; Rousseau, A. Surface deactivation of vibrationally excited N2 studied using infrared titration combined with quantum cascade laser absorption spectroscopy. J. Phys. D Appl. Phys. 2013, 47, 015203. [Google Scholar] [CrossRef]
- Rieker, G.B.; Jeffries, J.B.; Hanson, R.K. Calibration-free wavelength-modulation spectroscopy for measurements of gas temperature and concentration in harsh environments. Appl. Opt. 2009, 48, 5546–5560. [Google Scholar] [CrossRef]
- Li, J.Y.; Yang, S.; Du, Z.H.; Gao, H.; Wei, Y.Y. Resolving multiple combustion parameters from a single transition using degraded deconvolution of Voigt lineshape. Infrared Phys. Technol. 2018, 92, 6–12. [Google Scholar] [CrossRef]
- Qi-Xing, T.; Yu-Jun, Z.; Dong, C.; Kai, Z.; Ying, H.E.; Kun, Y.; Guo-Hua, L.; Yi-Bing, L.U.; Bo-Qiang, F.; Dong-Qi, Y.U. Laser absorption spectroscopy data processing method based on co-frequency and dual-wavelength and its application. Opt. Express 2018, 26, 4459–4469. [Google Scholar] [CrossRef]
- Tang, Q.X.; Zhang, Y.J.; Chen, D.; Zhang, K.; He, Y.; You, K.; Liu, G.H.; Lu, Y.B.; Fan, B.Q.; Yu, D.Q. Research on the spectral phase correction method for the atmospheric detection in open space. Opt. Express 2018, 26, 19328–19340. [Google Scholar] [CrossRef]
- Krzempek, K.; Dudzik, G.; Abramski, K.; Wysocki, G.; Jaworski, P.; Nikodem, M. Heterodyne interferometric signal retrieval in photoacoustic spectroscopy. Opt. Express 2018, 26, 1125–1132. [Google Scholar] [CrossRef]
- Jarvis, J.; Haertelt, M.; Hugger, S.; Butschek, L.; Fuchs, F.; Ostendorf, R.; Wagner, J.; Beyerer, J. Hyperspectral data acquisition and analysis in imaging and real-time active MIR backscattering spectroscopy. Adv. Opt. Technol. 2017, 6, 85–93. [Google Scholar] [CrossRef]
- Breshike, C.J.; Kendziora, C.A.; Furstenberg, R.; Nguyen, V.; Kusterbeck, A.; McGill, R.A. Infrared backscatter imaging spectroscopy of trace analytes at standoff. J. Appl. Phys. 2019, 125, 104901. [Google Scholar] [CrossRef]
- Hashmonay, R.A.; Yost, M.G. Innovative approach for estimating fugitive gaseous fluxes using computed tomography and remote optical sensing techniques. J. Air Waste Manag. 1999, 49, 966–972. [Google Scholar] [CrossRef] [PubMed][Green Version]
- Martin-Mateos, P.; Acedo, P. Heterodyne phase-sensitive detection for calibration-free molecular dispersion spectroscopy. Opt. Express 2014, 22, 15143–15153. [Google Scholar] [CrossRef] [PubMed]
- Giorgetta, F.R.; Rieker, G.B.; Baumann, E.; Swann, W.C.; Sinclair, L.C.; Kofler, J.; Coddington, I.; Newbury, N.R. Broadband Phase Spectroscopy over Turbulent Air Paths. Phys. Rev. Lett. 2015, 115, 103901. [Google Scholar] [CrossRef] [PubMed]


| Species | Strategy | Test Environment * | Detection Limits | Precision | Detection Time | Resolution | Detection Range | Ref. |
|---|---|---|---|---|---|---|---|---|
| NH3 | RR-DIAL, OPG/OPA 211–215 nm | Laboratory | 40 ppm | - | 2.5 min | 16 cm | 2 m | [54] |
| Ozone | RR-DIAL, 283–310 nm | Actual | 2 ppb | - | 10 s | 90 m | 400 m | [37] |
| NO2 | RR-DIAL,1.6 W 450 nm CW LD | Actual | 0.9 ppbv | - | 15 min | 700 m | 0.3–1 km | [55] |
| 1.5 ppbv | 1 km | 1–2 km | ||||||
| 2.4 ppbv | 1 km | 2–3 km | ||||||
| CH4, H2O | IPDA, 1646 nm | Actual | - | 3~11% | 15 min | - | 3–9 km | [48] |
| CH4, CO2 | IPDA, ECDL 1.60–1.65 µm | Actual | - | 3%, 1% | 30 s | - | 2.75 km | [56] |
| H2O, CO2 | RR-DIAL, 1602.2 nm, 7 MJ pulse energy | Actual | - | 11%, 1.5% | 10 min | 250 m | 1 km | [40] |
| CO2 | RR-DIAL, 2.05 µm band | Actual | - | 3% | 40 s | 270 m | 8–11 km | [57] |
| CH4, H2O | IPDA, 3.1–3.5 µm, average power > 300 mW | Laboratory | 595 ppb·m | - | - | - | 70 m | [41] |
| CH4 | RR-DIAL, 3.3–3.4 µm | Actual | 50 ppb | - | 1–2 min | 10–30 m | 1 km | [43] |
| CH4 | RR-DIAL, 3.3–3.5 µm OPO 6 MJ pulsed laser | Laboratory | - | 8–13% | 6.4 s | 100 m | 800 m | [58] |
| NO, NO2, SO2, Benzene, Toluene | RR-DIAL, UV and Visible | Actual | 20, 50, 10, 10, 10 ppb | - | - | 10–30 m | 500, 500, 1000, 600, 600 | [44] |
| CH4, C2H6, C2H4, C2H2, HCs, HCl | RR-DIAL, MIR 3.3–3.4 µm | Actual | 80, 20, 130, 30, 30, 15 ppb | - | - | 10–30 m | 600, 600, 600, 600, 600, 800 m | [44] |
| H2O | IPDA, 1.0–3.5 THz | Laboratory | - | - | - | - | tens of meters | [59] |
| Species | Strategy | Test Environment | Detection Limits | Detection Time | Distance | Ref. |
|---|---|---|---|---|---|---|
| HF | 1284 nm | Laboratory | 1 ppb | 0.1 s | 25 m | [104] |
| CH4 | 1.6 µm WMS | Actual | 2 ppb | 60 s | 2.6 km | [105] |
| 1.65 µm, 200-mm Fresnel lens | Actual | 1.1 ppm·m/Hz1/2 | - | 1–2 km | [92] | |
| 1653.7 | Laboratory | 1 ppm | 2 s | 100 m | [87] | |
| 1.65 µm, ClaDS | Actual | 1.7 ppm·m/Hz1/2 | 1 s | 20 m | [102] | |
| C2H2 | 1531.6 nm | Laboratory | 0.4 ppm | 2 s | 100 m | [87] |
| C2H4 | 1621.4 nm | Laboratory | 0.5 ppm | 2 s | 100 m | [87] |
| H2S | 1.58 µm, 200-mm Fresnel lens | Actual | 15 ppm·m/Hz1/2 | - | 1–2 km | [92] |
| 1.574 µm, ClaDS | Laboratory | 225 ppm·m/Hz1/2 | 1 s | 18 m | [103] | |
| CO2 | 1.6 µm WMS | Actual | 20 ppm | 20 s | 2.6 km | [105] |
| 2004 nm WMS | Actual | - | - | 7.2 m | [94] | |
| 2.05 µm DAS | Laboratory | 36 ppm | - | 15 m | [93] | |
| NH3 | 1103.4 cm−1 | Laboratory | 0.46 ppb | 2 min | 60 m | [95] |
| LaserWarn TM | Calculated | 80 ppb | - | 25 m | [90] | |
| NO | 1900 cm−1 | Laboratory | 0.4 ppb | 2 min | 60 m | [95] |
| NO2 | 1600 cm−1 | Laboratory | 0.4 ppb | 2 min | 60 m | [95] |
| 4.53 µm, ClaDS | Actual | 1.2 ppm·m/Hz1/2 | 10 s | 17 m | [100] | |
| O3 | 1031.2 cm−1 | Actual | 0.3 ppm·m | 18 s | 2.9 km | [106] |
| 9.3 to 9.81 µm | Actual | <10 ppb | 8 min | 38 m | [107] | |
| SO2 | LaserWarn TM | Calculated | 2.4 ppm | - | 25 m | [90] |
| HNO3 | LaserWarn TM | Calculated | 0.15 ppm | - | 25 m | [90] |
| HCLO | LaserWarn TM | Calculated | 0.26 ppm | - | 25 m | [90] |
| Freon-134a | 2 Mini-QCLs, 780–1330 cm−1, 50-mm-diameter receive aperture | Actual | 3 ppb | 5 s | 155 m | [90] |
| Freon-152a | ditto | Actual | - | 2 s | 281 m | [90] |
| Species | Strategy | Test Environment | Detection Limits | Detection Time | Distance | Ref. |
|---|---|---|---|---|---|---|
| H2O | 1392 and 1343 nm DFB LD, 6 mm diameter antireflection-coated lens | Laboratory | Precision 26 K for temperature measurement@25 kHz bandwidth | - | Up to 50 cm | [133] |
| H2S | 1575 nm, a small telescope (primary mirror with a diameter of 75 mm) | Laboratory | 200 ppm·m | >0.05 s | 9 m | [6] |
| CH4 | NIR1.65 µm, 11.5-cm diameter parabolic primary mirror | Actual | 12 ppm·m | 40 s | 30 m | [110] |
| NIR1.65 µm, 150 mm Fresnel lens | Actual | 10 ppm·m | 0.3 s | 5 m | [111] | |
| NIR1.65 µm, 100 mm Fresnel lens | Laboratory | 50 ppm·m | - | 20 m | [112] | |
| 1651 nm, a small telescope (primary mirror with a diameter of 75 mm) | 10 ppm·m | >0.05 s | 10 m | [6] | ||
| NIR1.65 µm, UAV | Actual | 50 ppm·m | - | 10 m | [113] | |
| NIR1.65 µm, 150 mm Fresnel lens | Actual | 5 ppm·m | - | 10 m | [135] | |
| 16 ppm·m | - | 20 m | ||||
| 7.7 µm QCL, 8-in.-diameter primary mirror | Actual | 3.3 ppm·m·Hz−1/2 | 1/15 s | 45 m | [123] | |
| N2O | 7.7 µm QCL, 8-in.-diameter primary mirror | Actual | 30 ppm·m·Hz−1/2 | 1/15 s | 45 m | [123] |
| MeOH EtOH | 9.4 to 10.8 µm ECQCL, 50-mm diameter off axis parabola | Actual | 0.13 ppm·m·Hz−1/2 | 1 s | 10 m | [121] |
| 1.2 ppm·m·Hz−1/2 | ||||||
| 14NH3, 15NH3 | 10 µm ECQCL, 50-mm diameter off axis parabola | Actual | 150 ppb·m | 0.05 s | 10 m | [122] |
| 10 ppb·m | 10 s | |||||
| Silicone | 10 µm QCL | Actual | a few µg/cm2 | - | 15 cm | [98] |
| Chemical Species | Standoff LPAS Modality | Absorption Band | Detection Limits | Detection Time | Distance | Ref. |
|---|---|---|---|---|---|---|
| AN | LPAS with microphones | 213 nm | ~10 µg/cm2 | 1 s | 3 m | [149] |
| TNT | LPAS with microphones | 213 nm | ~10 µg/cm2 | 1 s | 3 m | [149] |
| laser vibrometry-based LPAS | 1324–1451 cm−1 | 10 µg/mm2 | 2 s | 100 m | [158] | |
| PETN | LPAS with microphones | 213 nm | ~10 µg/cm2 | 1 s | 3 m | [149] |
| 1286 cm−1 | ~4.0 µg/cm2 | 10 ms | 0.5 m | [147] | ||
| 1276 cm−1 | ~2.5 µg/cm2 | 10 ms | 0.5 m | [147] | ||
| laser vibrometry-based LPAS | 1176–1307 cm−1 | 10 µg/mm2 | 2 s | 100 m | [158] | |
| QEPAS | 800–1400 cm−1 | ~5.0 µg/cm2 | 2 s | 12 m | [167] | |
| DPA | LPAS with microphones | 1311 cm−1 | - | 10 ms | 0.5 m | [147] |
| Acetic acid | LPAS with microphones | 1294 cm−1 | ~2.0 μL | 10 ms | 0.5 m | [147] |
| Acetone | laser vibrometry-based LPAS | 7.00–8.70 µm | 0.172 ppm | 3 s | 1 m | [153] |
| Nitrobenzene, DNT | QEPAS | 800–1400 cm−1 | 200 nL | 2 s | 25 m | [167] |
| CH4, O3 | QEPAS | 1310–1320 cm−1, 1050–1055 cm−1 | ~10 ppb | 0.1 s | 25 m | [165] |
| Molecule | Absorption Band | Detection Limit | Test Environment | Detection Time | Distance | Ref. |
|---|---|---|---|---|---|---|
| CO2, CH4 | 1568–1660 nm | 0.24 ppm, 2.1 ppb | Actual | 5 min | 1 km | [179] |
| CH4, CO2 | 1.57–1.66 µm | 6.0 ppb, 0.6 ppm | Actual | 100 s | 1 km | [181] |
| CO2, CH4 | 1.57–1.69 µm | 5 ppm, 0.2 ppm | Actual | 3 min | 5.8 km | [180] |
| CO2, CH4 | 1600–1670 nm | <1 ppm, <3 ppb | Actual | 5 min | 1 km | [32] |
| CH4 | 1.62–1.69 µm | 2 ppb | Actual | 100 s | 1 km | [178] |
| CO2 | 1.63–2.14 µm | 2.8 ppm·km/0.1 ppm·km | Laboratory | 1 s/13 min | 1 km | [172] |
| CH3COCH3, C3H8O, C2H6 | 2750–3150 cm−1 | 5.7 ppm·m, 2.4 ppm·m, 0.4 ppb | Actual | 60 s | 1 km | [182] |
| Molecule | LHR Modality | Test Environment | Detection Error | Detection Limit | Detection Time | Ref. |
|---|---|---|---|---|---|---|
| C2H2 | 1542 nm WM-NIR-LD-LHR | - | - | 1.85% | - | [209] |
| CO2 | 1571–1573 nm NIR-LD-LHR | Actual | relative error 0.3% | 1.9 ppm | - | [208] |
| CH4, CO2 | 1.64 µm NIR-LD-LHR | Actual | - | 20 ppb, 1 ppm | - | [207] |
| H2O, CH4 | 3.53 µm ICL-LHR | Actual | 21.69%, 14.41% | - | ~240 s | [203] |
| CH4 | 7.64–8.22 µm WM-EC-QCL-LHR | Laboratory | - | 2.4% | ~15 s | [195] |
| O3, CFC-12, N2O, CH4, H2O | 1120–1238 cm−1 EC-QCL-LHR | Actual | relative error at 1 km: ~92%,~11%,~29%,~2%, ~8% | - | 190 s, 91 s, 91 s, 109 s, 181 s | [200] |
| Molecule | Absorption Band (cm−1) | Test Environment | Detection Limit (ppm·m·Hz−1/2) | Detection Time | Distance | Ref. |
|---|---|---|---|---|---|---|
| N2O | 1278 | Laboratory | 10–15 | - | 30 m | [7] |
| H2O2 | 1277 | Laboratory | 1.1 | 1 s | 7 m | [7] |
| H2O | 1277 | Laboratory | 2605 | 1 s | 2.89 m | [213] |
| CH4 | 1277 | Laboratory | 7.3 | 1 s | 5.5 m | [212] |
| DCE | 1292 | Laboratory | 128 | 1 s | 2.89 m | [213] |
| EGDN | 1280 | Laboratory | 0.69 | 1 s | 2.89 m | [213] |
| HFC-134a | 1300 | Laboratory | 10.5 | 1 s | 2.89 m | [213] |
| 4NA | 1275–1310 | Laboratory | - | 1 s | 3 m | [7] |
| Nitromethane (NM) | - | Calculated | 1.13 | 1 s | 2.89 m | [213] |
| Nitroglycerine (NG) | 1277 | Calculated | 0.25 | 1 s | >1 m | [7] |
| Diacetone diperoxide (DADP) | 1207 | Calculated | 0.345 | 1 s | >1 m | [7] |
| Triacetone triperoxide (TATP) | 1194 | Calculated | 0.23 | 1 s | >1 m | [7] |
| Sarin (GB) | 1020 | Calculated | 0.317 | 1 s | >1 m | [7] |
| Soman (GD) | 1010 | Calculated | 0.29 | 1 s | >1 m | [7] |
| Tabun (GA) | 1020 | Calculated | 0.55 | 1 s | >1 m | [7] |
| Technique | Sensitivity for CH4 (ppm·m·Hz−1/2) | Multi-Species (g) | Selectivity/Precision | Real Time | Standoff Range with Non-Cooperative Target | Complexity/Size/Cost | Eye-Safe Operation |
|---|---|---|---|---|---|---|---|
| DIAL | 106 (a) [42] | 1–3 | Intermediate | Yes | Tens of kilometers | Intermediate to High | No |
| TDLAS | 5.5 (b) [135] | 1–3 | High | Yes | Tens of meters | Low to intermediate | Yes |
| LPAS | 1.6 (c) [165] | 1–3 | High | Yes | Tens of meters | Low to Intermediate | Yes |
| DCS | 80 (d) [179] | Yes | Intermediate to high | Yes | Meters | High | Yes |
| LHR | 1000 (g) [205] | 1–5 | Intermediate | Not yet | Tens of kilometers | Intermediate to high | Yes |
| ACLaS | 87 (f) [212] | 1–4 | High | Yes | Tens of meters | Intermediate to high | Yes |
© 2020 by the authors. Licensee MDPI, Basel, Switzerland. This article is an open access article distributed under the terms and conditions of the Creative Commons Attribution (CC BY) license (http://creativecommons.org/licenses/by/4.0/).
Share and Cite
Li, J.; Yu, Z.; Du, Z.; Ji, Y.; Liu, C. Standoff Chemical Detection Using Laser Absorption Spectroscopy: A Review. Remote Sens. 2020, 12, 2771. https://doi.org/10.3390/rs12172771
Li J, Yu Z, Du Z, Ji Y, Liu C. Standoff Chemical Detection Using Laser Absorption Spectroscopy: A Review. Remote Sensing. 2020; 12(17):2771. https://doi.org/10.3390/rs12172771
Chicago/Turabian StyleLi, Jinyi, Ziwei Yu, Zhenhui Du, Yue Ji, and Chang Liu. 2020. "Standoff Chemical Detection Using Laser Absorption Spectroscopy: A Review" Remote Sensing 12, no. 17: 2771. https://doi.org/10.3390/rs12172771
APA StyleLi, J., Yu, Z., Du, Z., Ji, Y., & Liu, C. (2020). Standoff Chemical Detection Using Laser Absorption Spectroscopy: A Review. Remote Sensing, 12(17), 2771. https://doi.org/10.3390/rs12172771