Article

Impairing Land Registry: Social, Demographic, and Economic Determinants of Forest Classification Errors

by
Maciej Adamiak
1,
Mirosław Biczkowski
2,
Katarzyna Leśniewska-Napierała
3,*,
Marta Nalej
3 and
Tomasz Napierała
3
1
SoftwareMill, 02-791 Warsaw, Poland
2
Faculty of Earth Sciences and Spatial Management, Nicolaus Copernicus University in Toruń, Lwowska 1, 87-100 Toruń, Poland
3
Faculty of Geographical Sciences, University of Lodz, Kopcińskiego31, 90-142 Łódź, Poland
*
Author to whom correspondence should be addressed.
Remote Sens. 2020, 12(16), 2628; https://doi.org/10.3390/rs12162628
Submission received: 30 June 2020 / Revised: 11 August 2020 / Accepted: 12 August 2020 / Published: 14 August 2020
(This article belongs to the Special Issue Multi-Modality Data Classification: Algorithms and Applications)

Abstract

:
This paper investigates the social, demographic, and economic factors determining differences between forest identification based on remote sensing techniques and land registry. The Database of Topographic Objects and Sentinel-2 satellite imagery data from 2018 were used to train a forest detection supervised machine learning model. Results aggregated to communes (NUTS-5 units) were compared to data from land registry delivered in Local Data Bank by Statistics Poland. The differences identified between above mentioned sources were defined as errors of land registry. Then, geographically weighted regression was applied to explain spatially varying impact of investigated errors’ determinants: Urbanization processes, civic society development, education, land ownership, and culture and quality of spatial planning. The research area covers the entirety of Poland. It was confirmed that in less developed areas, local development policy stimulating urbanization processes does not respect land use planning principles, including the accuracy of land registry. A high education level of the society leads to protective measures before the further increase of the investigated forest cover’s overestimation of the land registry in substantially urbanized areas. Finally, higher coverage by valid local spatial development plans stimulate protection against forest classification errors in the land registry.

Graphical Abstract

1. Introduction

The last several years have brought a significant increase of interest in research connected with changes in land use, particularly changes in forest coverage, due to the high dynamics of changes taking place in the geographical environment [1,2,3,4,5,6,7]. These issues, at various spatial and time scales, were discussed in many publications on selected regions of Europe, including Belgium [8], Czech Republic [9,10], Germany [11], Great Britain [12], Italy [13,14], Poland [15,16,17,18,19,20,21,22], Romania [23,24], and Spain [25,26,27]. This intensive development of research results from a large extent of advanced Geographic Information System (GIS) technologies implementations, which make precise quantitative analysis of the land changes possible in any taxonomic units: Administrative, physical-geographical, hydrographic, and others [28,29,30,31,32]. This allows verification of the records in the land registers with the real land functions.
The paper is organized as follows. The section “Literature Review and Hypotheses” briefly presents the review of previous works on the cause of errors in the land registration. The subsequent section, “Methods and Data Collection,” contains a description of the research design, applied methods, data collection process, and research area. The “Results and Discussion” section presents and interprets the findings of our research. The paper is closed by “Conclusions,” summarizing the main findings regarding relations between the scale of the errors in land registry and impact of considered factors: Urbanization processes, civic society development, education, land ownership, and culture and quality of spatial planning.

2. Literature Review and Hypotheses

In the literature related to the assessment of the quality of data contained in land registers and factors affecting errors appearing, there has been much attention paid to formal, legal, organizational, and administrative factors, and to technical issues as well. However, socioeconomic factors have rarely been discussed in this context, especially regarding demography and urbanization, the condition of civic society, education, land ownership, and the quality of spatial planning.

2.1. Urbanization Processes Influencing Classification Errors in Land Registers

Demographics and unplanned, unsystematic, and rapid urbanization also have important implications for changes in transformation of the physical landscape, land cover, and forest loss and fragmentation [33,34,35]. Changing patterns of land use and the impact of socioeconomic factors have brought about major changes in ecosystems and forest land use [36]. Understanding of the dynamics of urbanization-induced land cover change is therefore necessary to acknowledge differences between the land register and the actual land functions.
Forests near large cities are subject to a strong anthropogenic pressure related to suburbanization. Migration and population growth in urban agglomerations stimulate the demand for land, including areas of high natural quality [37]. This contributes to the progressing fragmentation of forests [38] and the successive reduction of forest areas and their transformation into residential areas [39]. The local and regional sequences of natural connections are being cut. Therefore, it seems logical that the degree of forest fragmentation affects the number of errors [40] occurring both on maps [41] and in land registrations. Research conducted on the example of the Warsaw agglomeration confirms that the spontaneous development of buildings often occurs in suburban forests [42], which are bought for single-family housing. This is confirmed by the high dynamics of applications for changes in the use of these lands for construction purposes. In addition, buildings on forest plots often exceed acceptable standards or norms [43]. There are often cases of noncompliance with the provisions of local spatial development plans by owners of newly built residential buildings regarding the minimum share of forested area on a plot. Then, there is the situation in which the area occupied for development significantly exceeds the permissible size, which means that the forested area of such a plot remains fictional [44]. On the other hand, abandoned farmland, particularly in central and northern Europe, is undergoing a process of colonization by trees [45]. All this translates into irregularities between the actual state and records in the land registries.

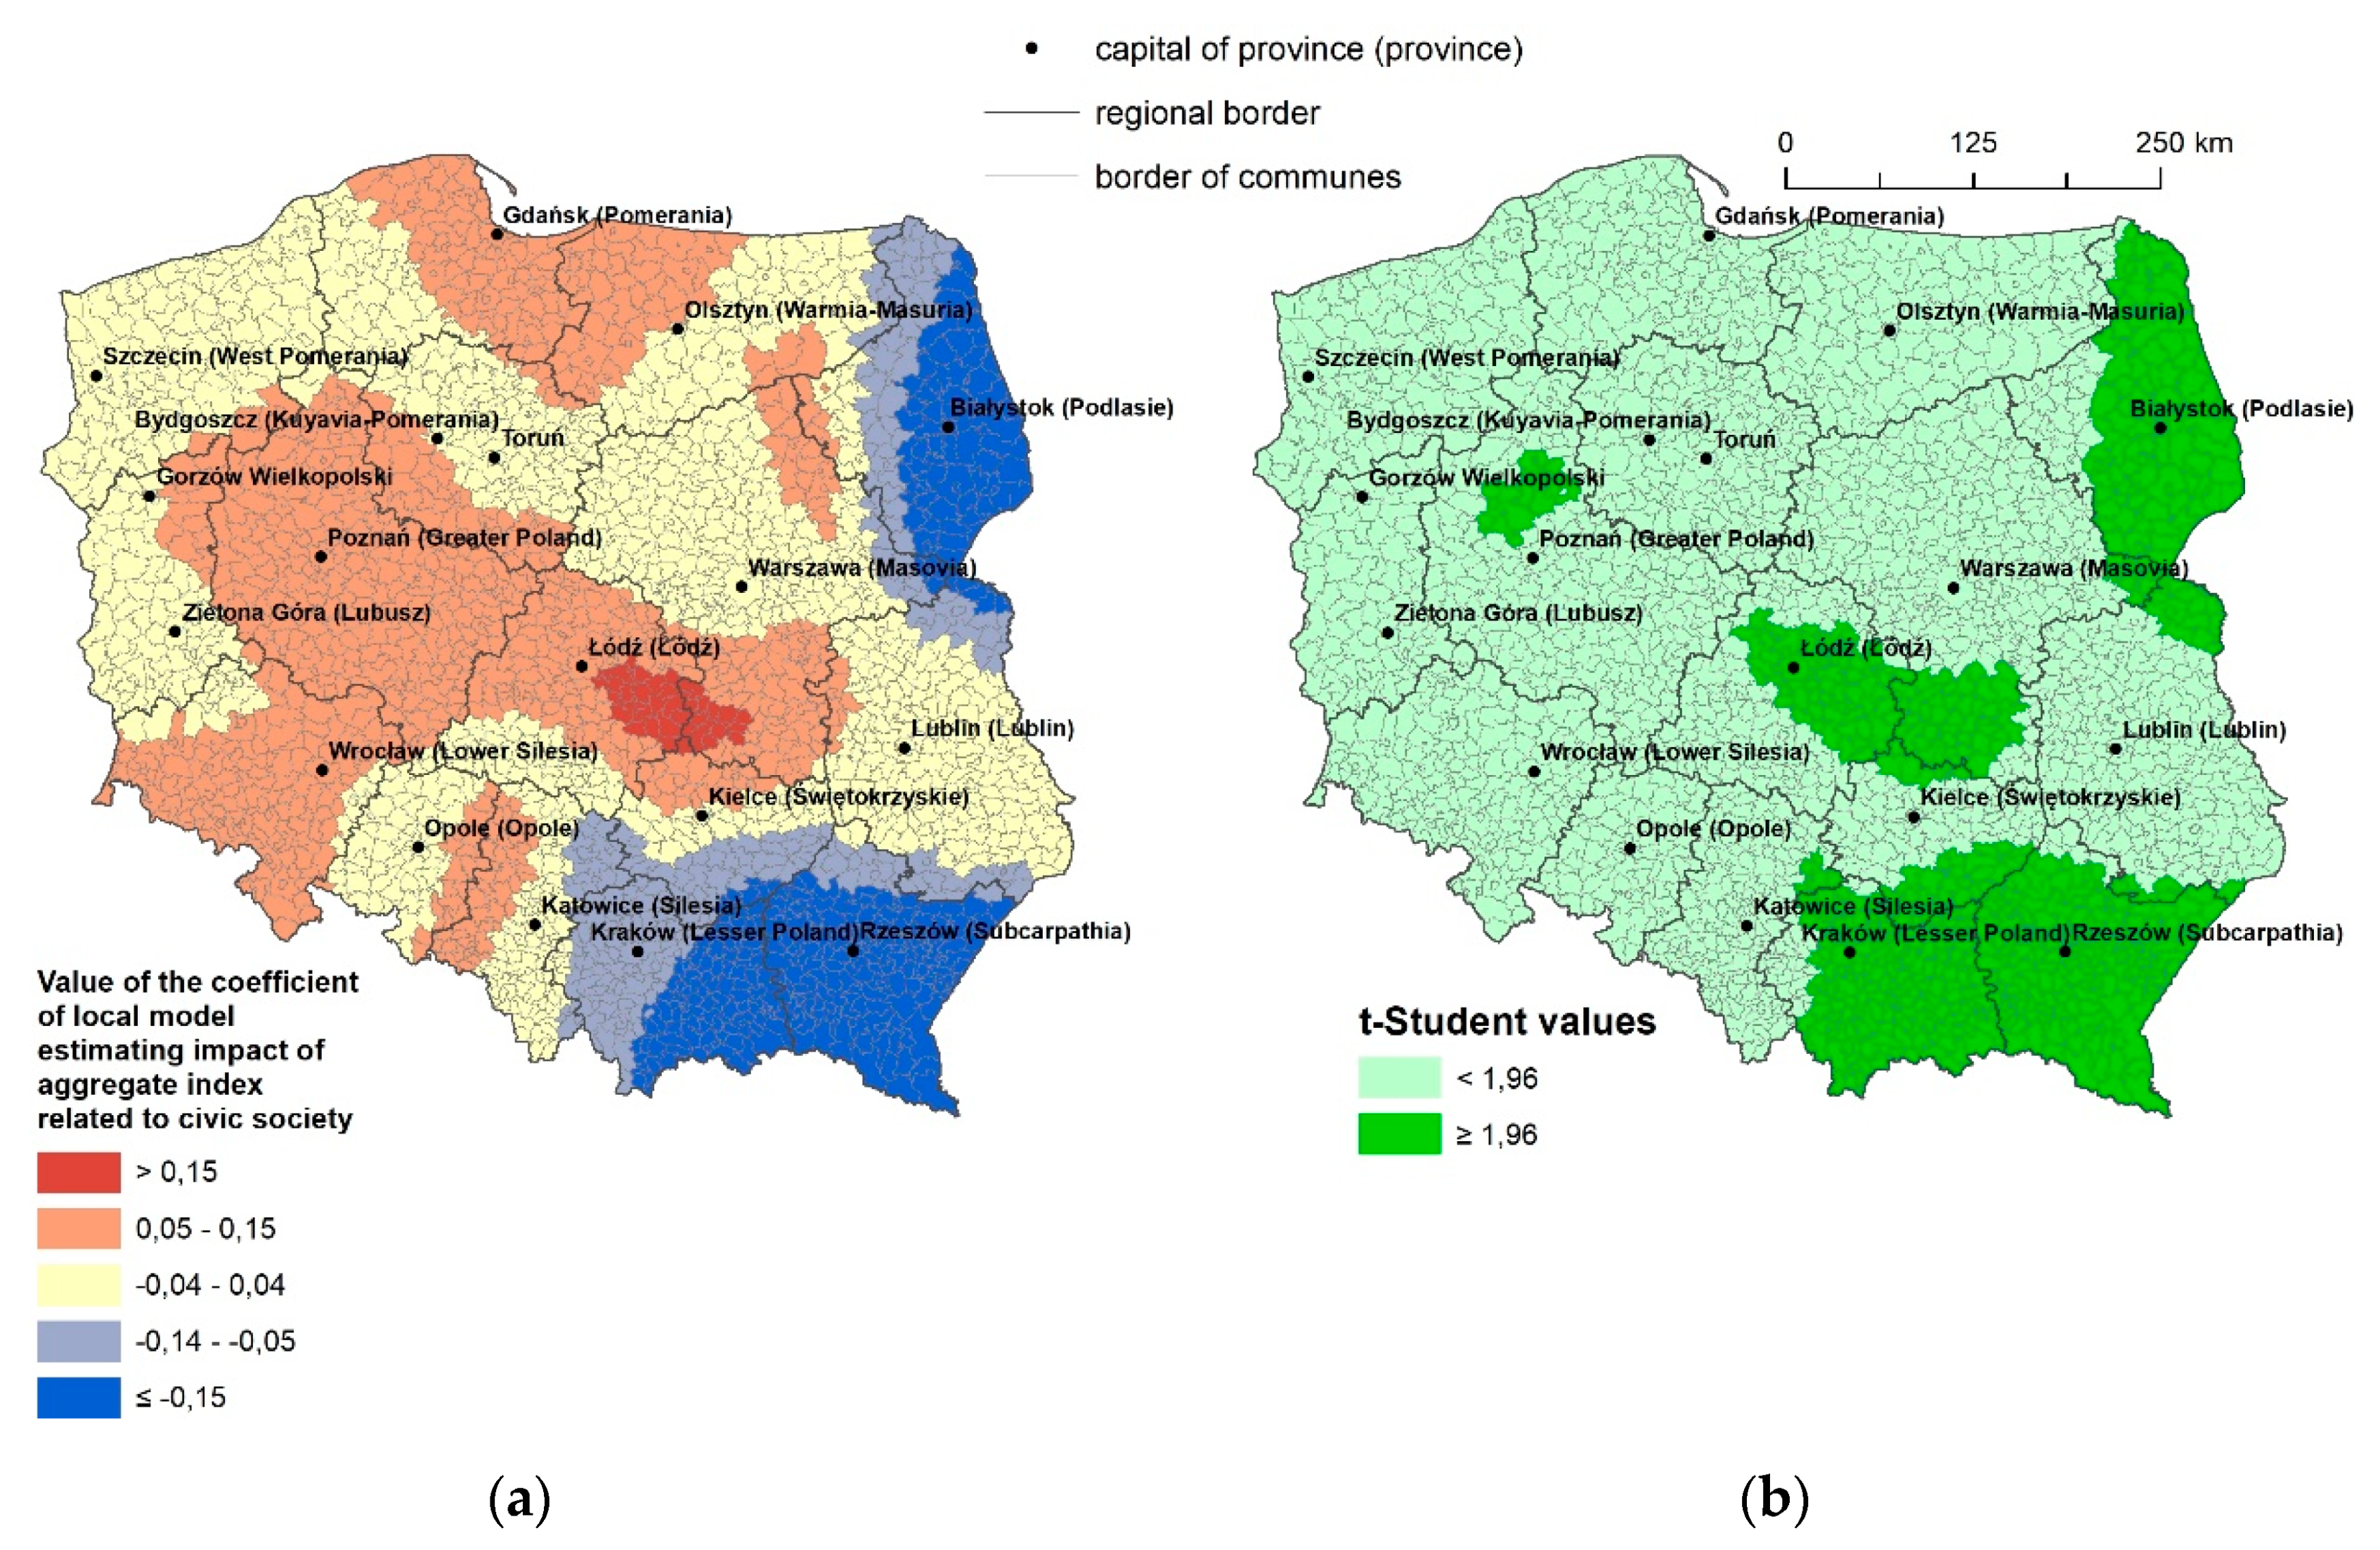
2.2. Impact of the Condition of Civic Society on Data Quality in Land Registers

Knowledge is scarce over how the public sphere, and civic society in particular, engage with building data infrastructure including land registry data. Gray & Lammerhirt [46] partly tried to fill the research gap in this respect, but mainly in the context of urban areas. Meanwhile, in the literature, the social factor (people) has often been indicated as one of the most significant in Spatial Data Infrastructures (SDI) components next to data, legal, access and technology, standards, policy, and institutional arrangement [47,48].
Poland is still in the construction phase and maturation of civic society [49,50,51]. Among Polish citizens, there is a common attitude of unwillingness to cooperate with the authorities, which is also due to experience in the functioning of the previous political and economic system, which is why residents do not trust public authorities and show a low degree of involvement in sociopolitical issues [52,53]. This translates into a high degree of ignorance of formal and legal issues because of, e.g., difficult and unclear language of official documents and legal acts, complexity of procedures, inconsistent judicial and administrative rules, low level of spatial planning awareness, and the lack of interest in controlling of local authorities and institutions [54]. Insufficient legal awareness of the society in relation to the obligations and rights of owners and to the state’s obligations regarding the protection of property rights to land causes a lack of fulfilling the obligations incumbent on residents (e.g., not updating records of land registration dictated by financial and tax issues), as well as proper supervision by public institutions [55,56]. Meanwhile, “good practices” in the quality of land registry data depend very strongly on the local social and cultural context of the particular land administration system [57].
Civic society, created thanks to voluntary organizations, associations, and contacts, is one of the foundations of the democratic system [51,58], shaping proper social and political relations [59,60] and achieving public goals [61]. The active participation of residents in spatial management (e.g., spatial planning, land records updating, etc.) is a characteristic of a developed democracy and an already formed civic society [62,63,64]. In Poland, the development of civic activity and the increase of social expectations are progressing slowly but steadily. A participatory approach in consulting planning arrangements is becoming more and more common [65,66,67,68,69]. Citizens’ initiatives and associations are in the interests of various social groups participating in democracy procedures and common actions. Civic participation can be measured, e.g., by the level of election attendance [70,71,72,73] or participation in various types of nongovernmental organizations (NGOs), associations, or clubs [74,75,76,77]. It can be expected that the more developed the civic society institutions are, the better the control of the land registry should be, and as a consequence, the differences between the land registry and the real land functions should be smaller.

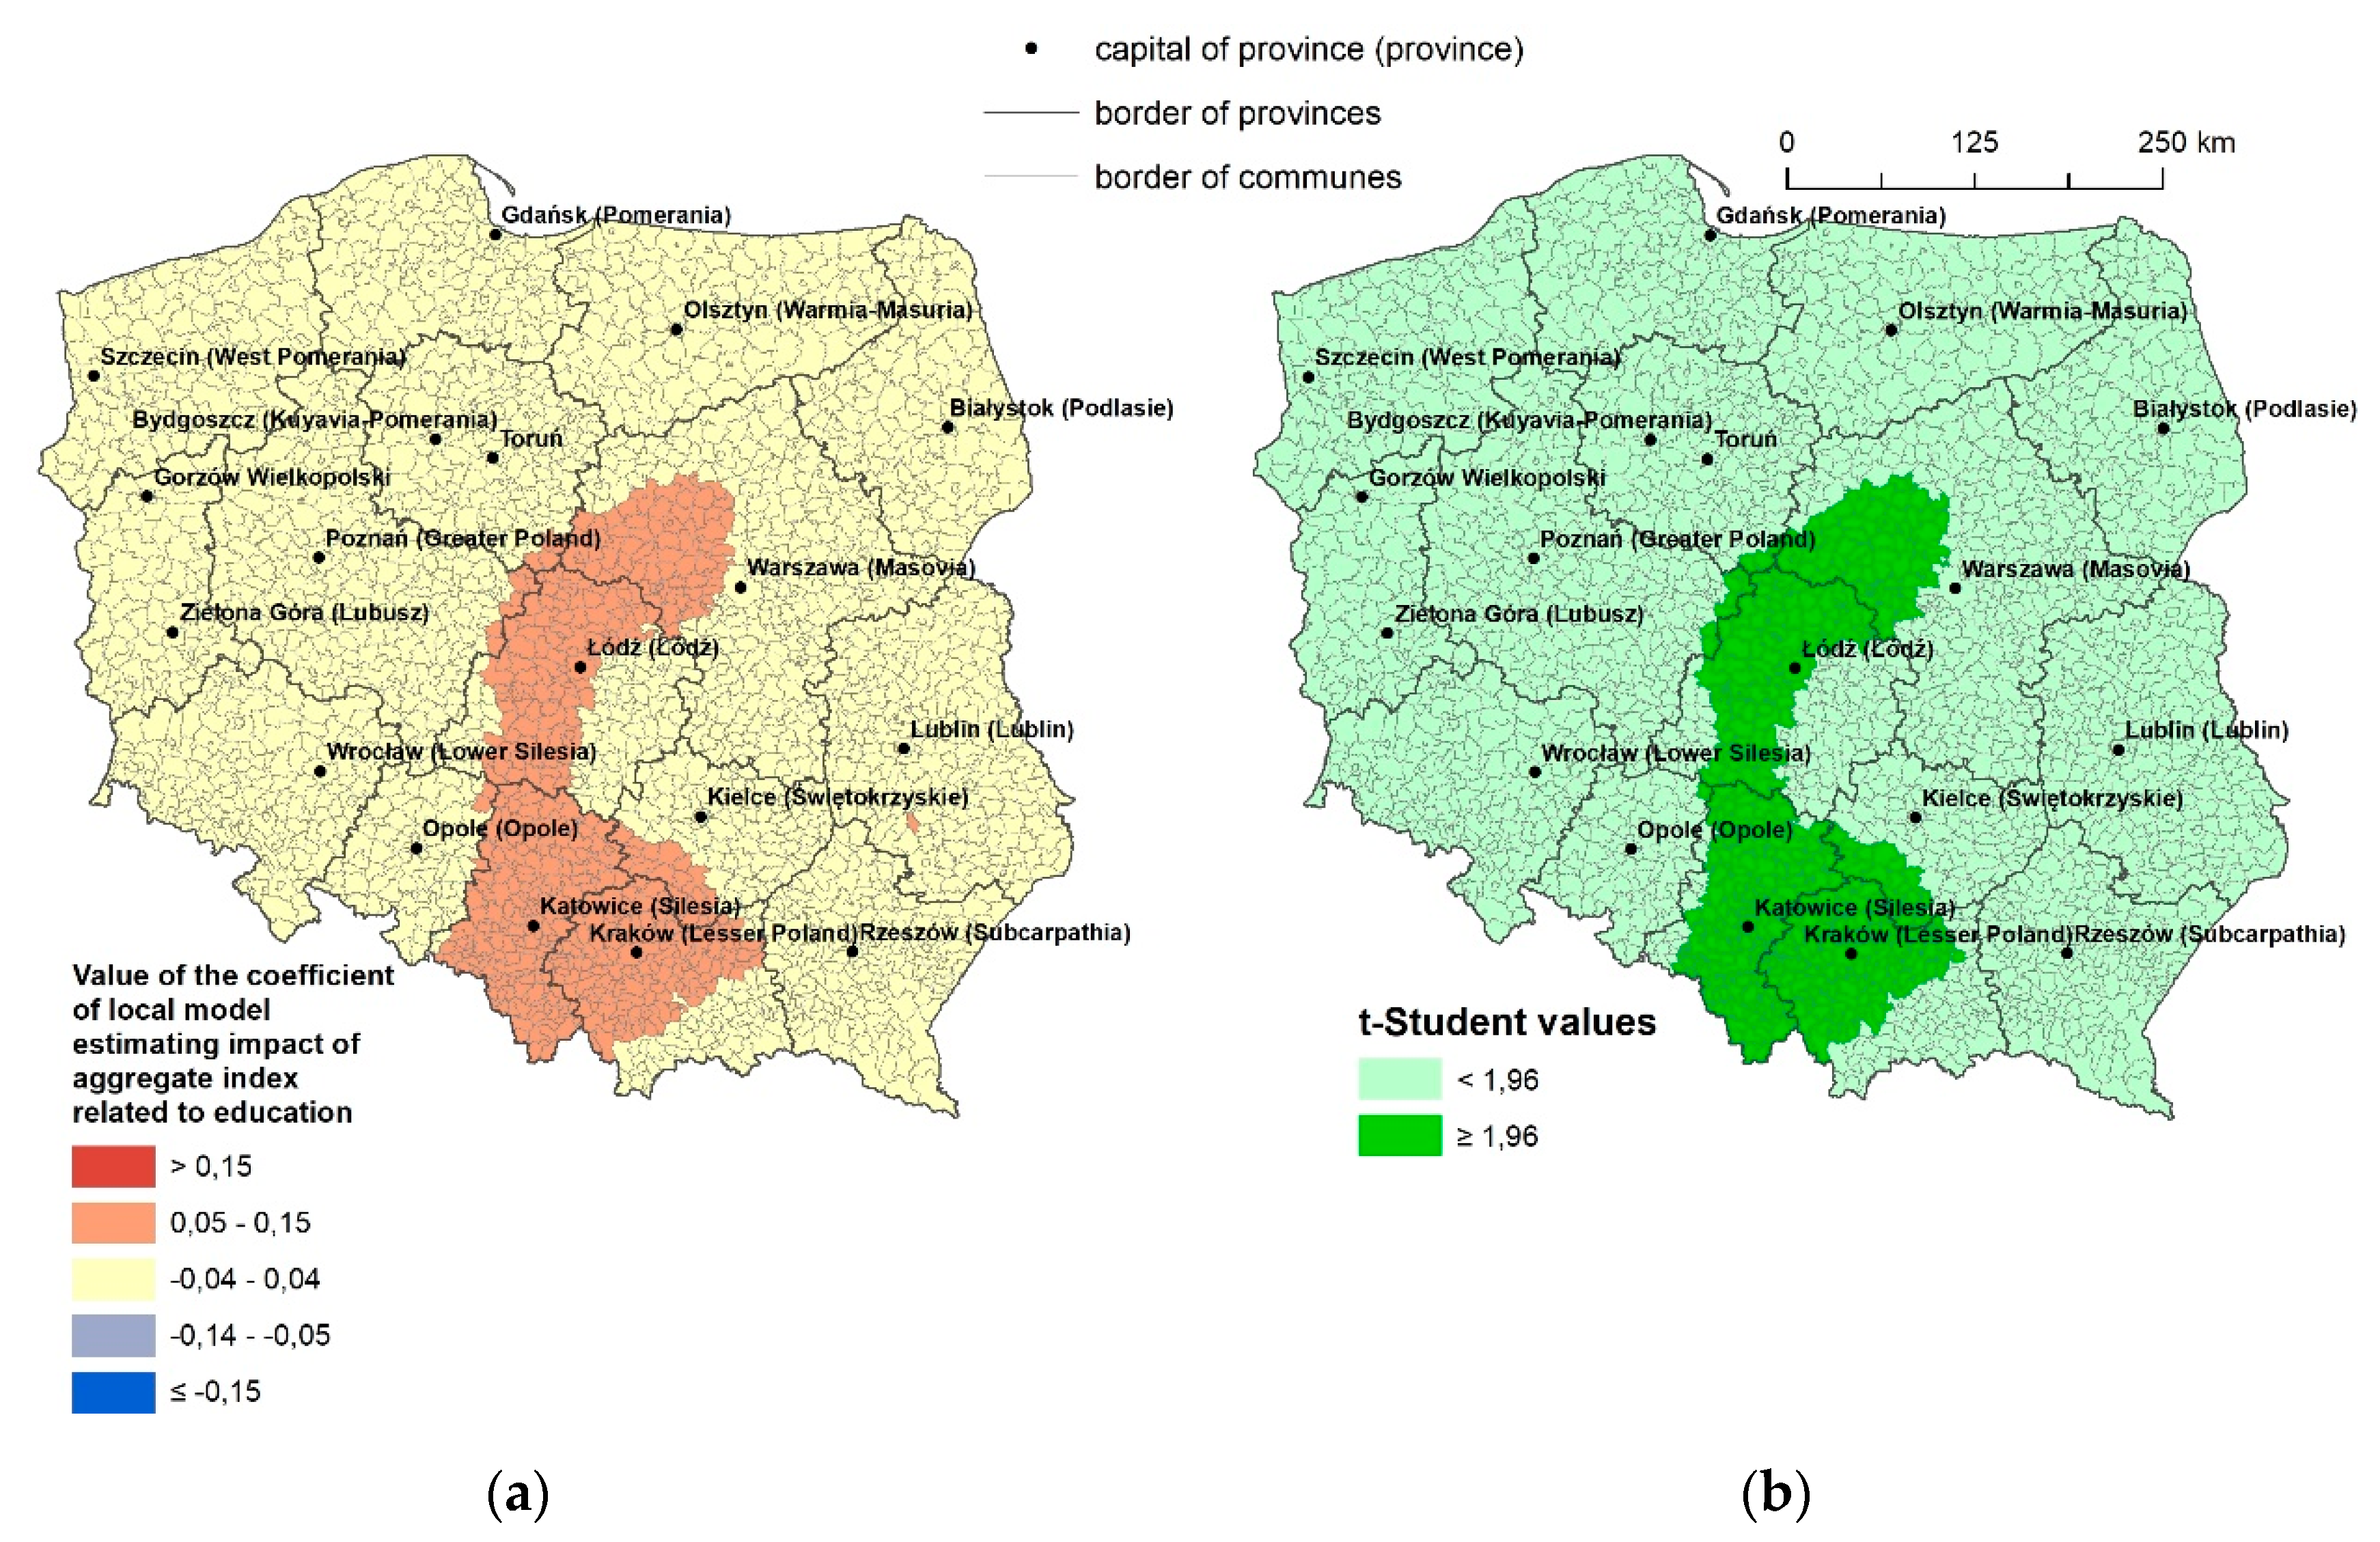
2.3. Education Level and Its Influence on Errors in Land Registers

The level of education is also important, because the higher the share of people with higher education in society is, the higher the expected level of activity and interest in sociopolitical matters. People with higher education, compared to people without, work and sit on the boards of NGOs more often and actively participate in volunteering [78]. It can be assumed that the better educated the society, the better the control over matters related to records of the land registry is. In addition, significant differences in social activity are observed in the urban-rural relationship, which almost entirely comes from twice the percentage of people with secondary and higher education in the urban population [79,80,81]. Hence, in more urbanized areas, residents show greater interest in local matters, and there, greater compliance of the formal status (land registry) with the actual status can be expected.

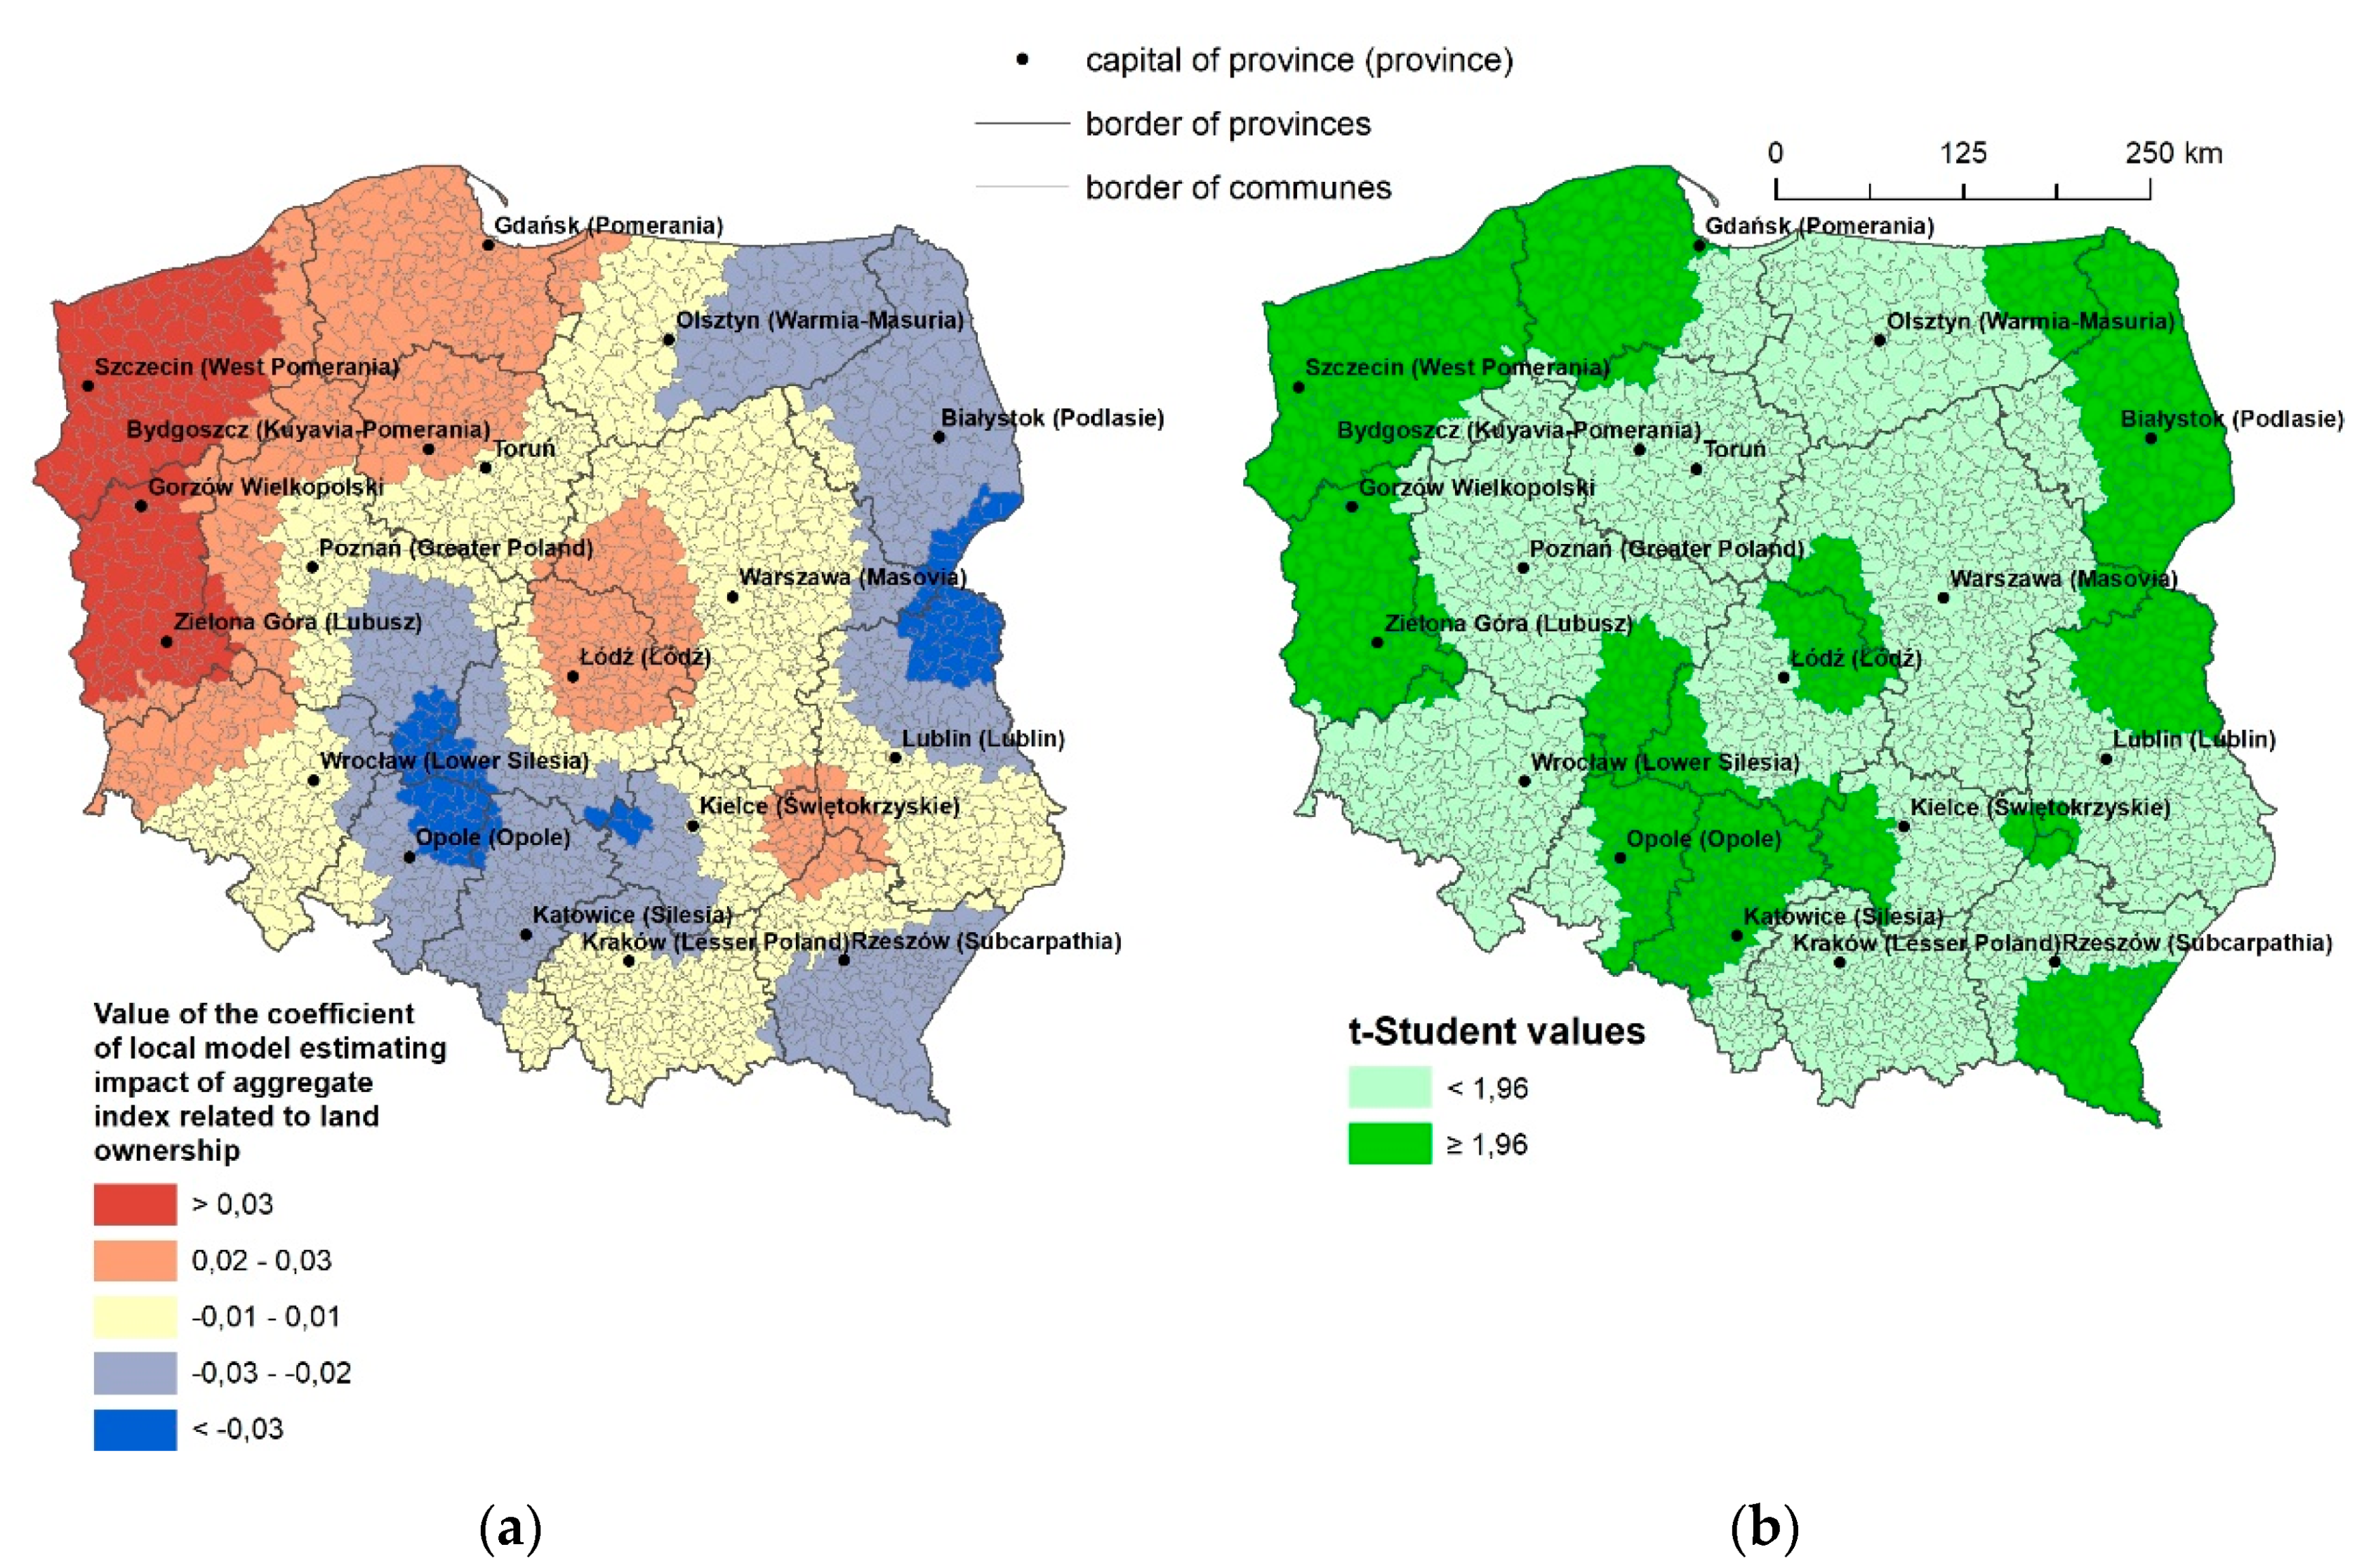
2.4. Land Ownership and Land Registry Classification Errors

The percentage of ownership of the forest by the State Forests underwent major changes over the years, especially in the period immediately after World War II, when there was a significant increase in forest areas managed by the State Forests. In the 1990s, the boundaries of real estate began to be disclosed in land and mortgage registers, when they were established for the State Forests’ land [82]. Currently, they are established for the majority of the State Forests’ land, and care for the state of ownership has become a priority for the State Forests [82,83,84].

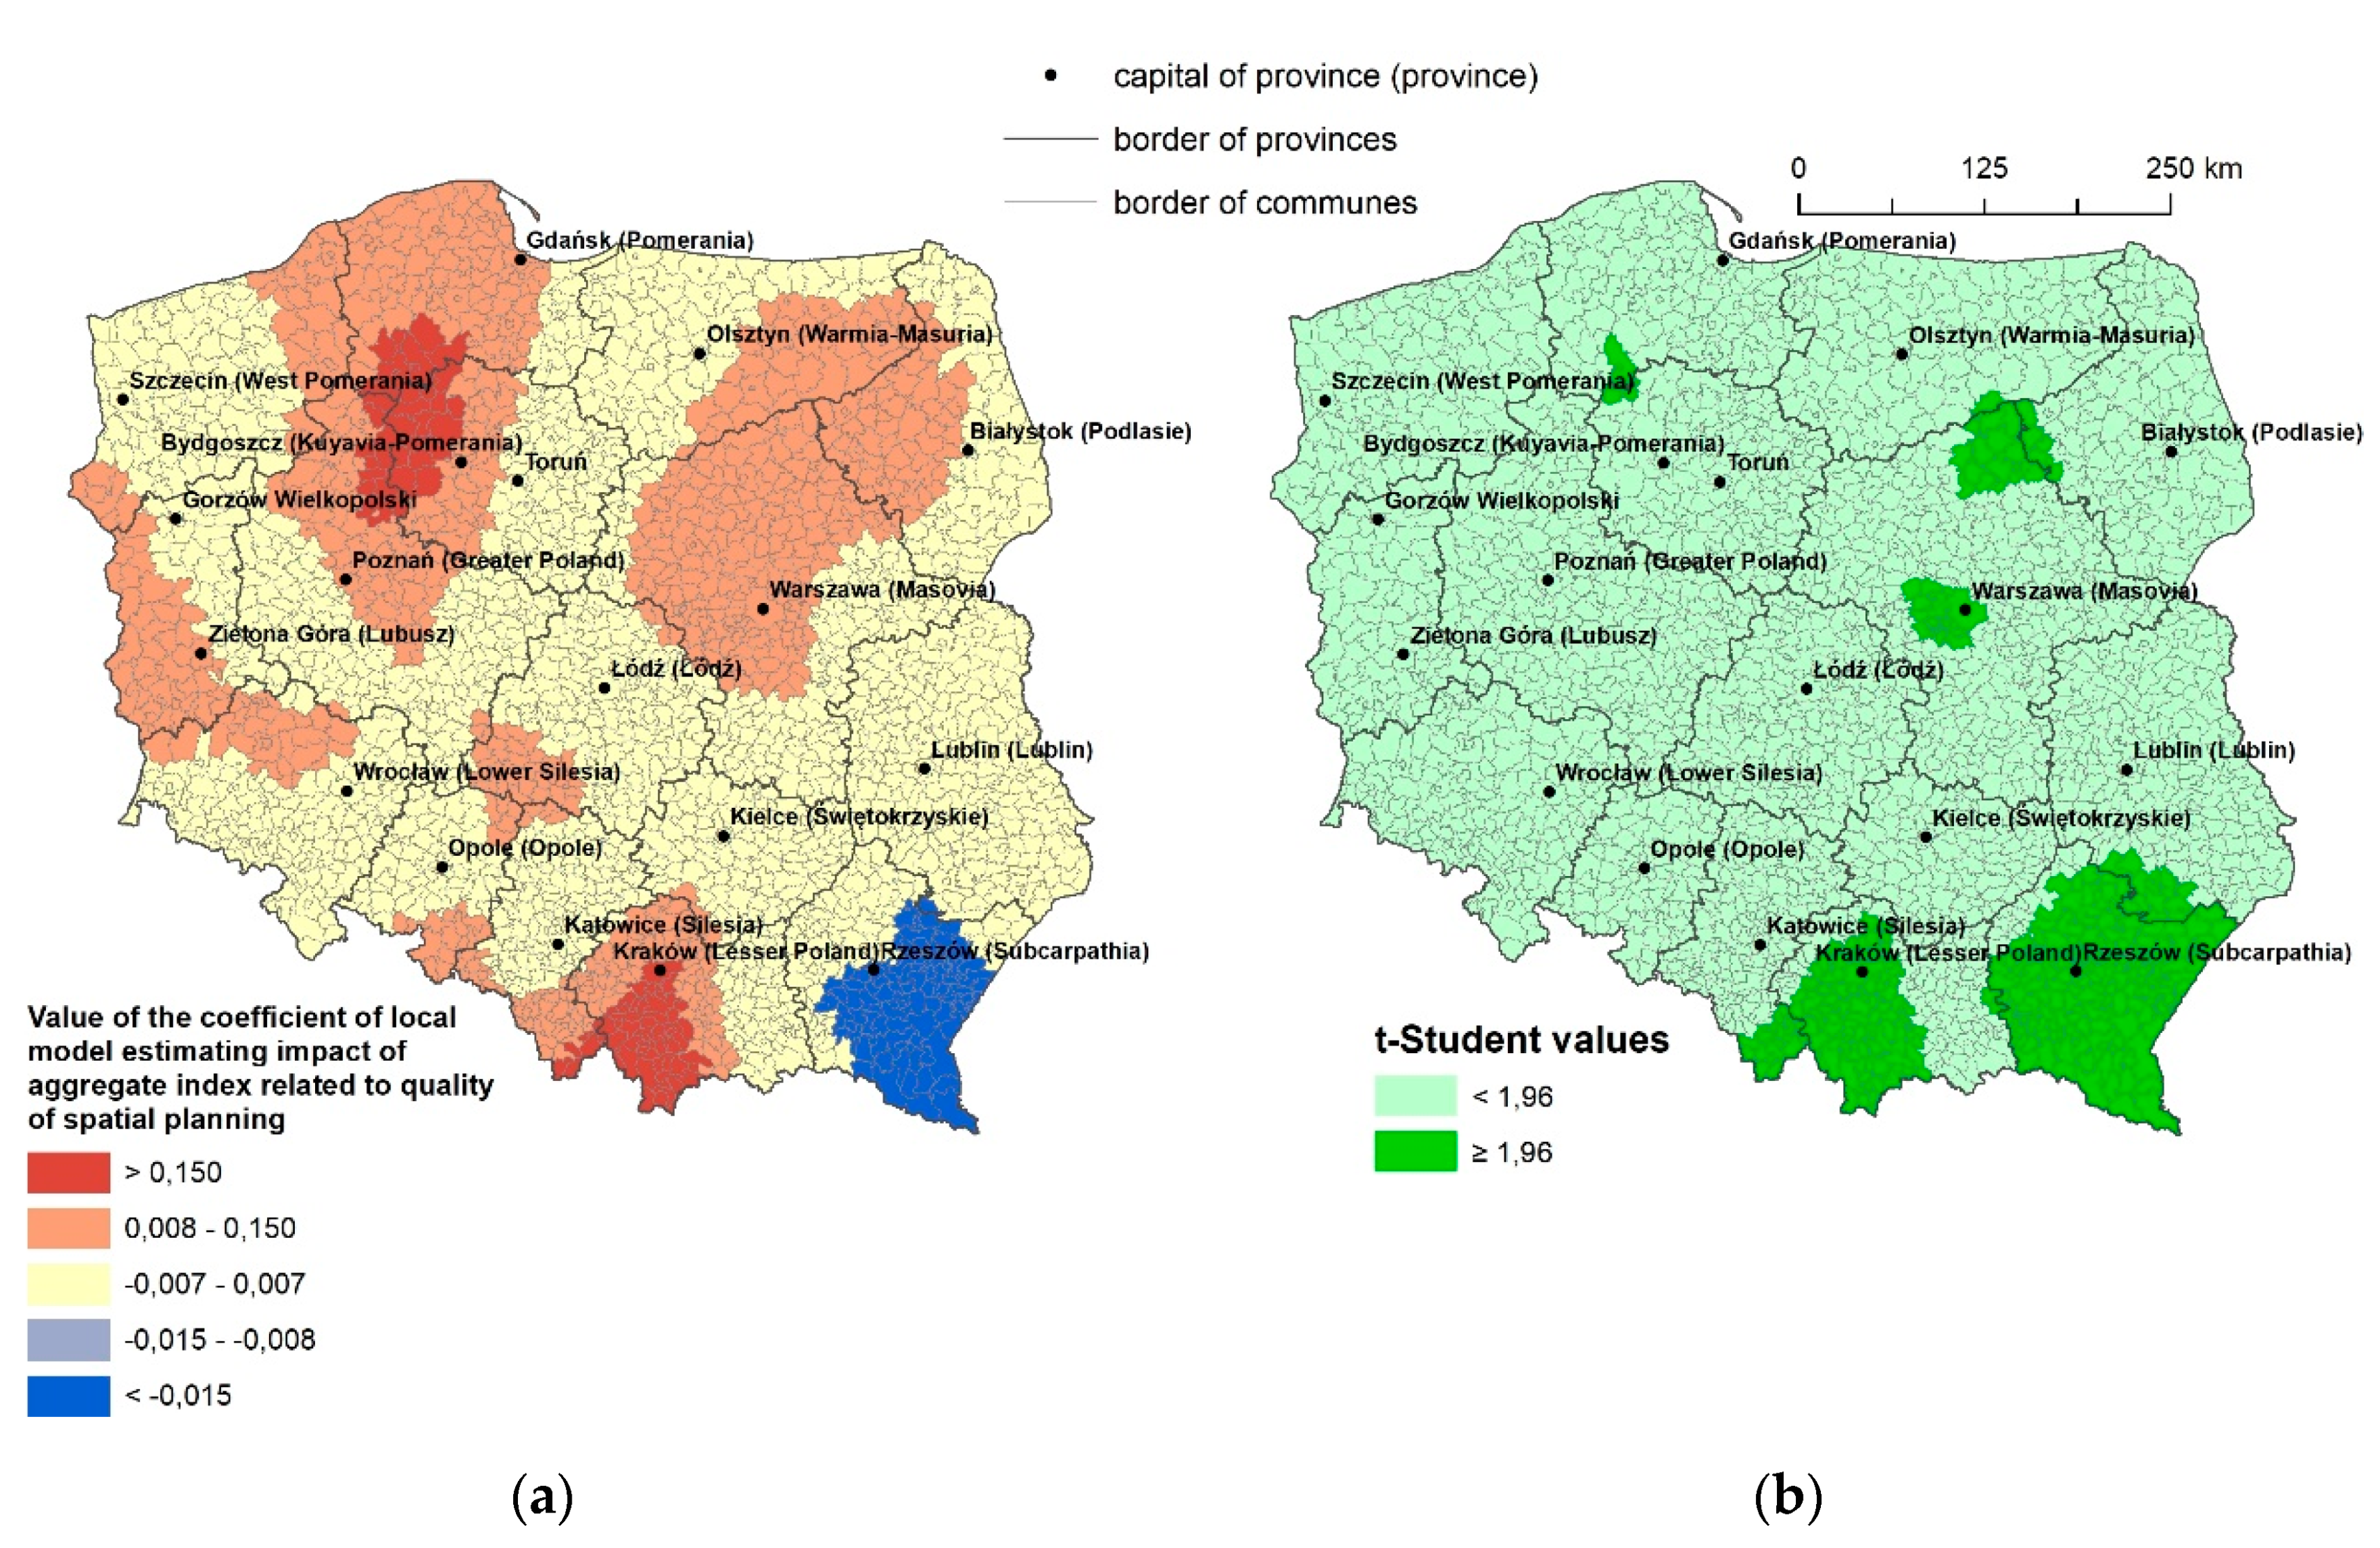
2.5. Relation between Culture of Spatial Planning and Data Quality in Land Registers

Land management and economic development activities stimulate demands for comprehensive information about social-economic and governance conditions in combination with other land-related data [85]. They all contribute to the establishment of multifunctional information systems, incorporating, among others, structure and forms of land use, land tenure and land value, land development, and other useful data. The institutional evolution in the field of cadaster differs from one European country to another due to the influences of culture, history, economic environment, and social level [86].
Social expectations, associated with the institution of the cadaster, do not mean that this register actually fulfills the functions which are attributed to it. The quality of the data collected in the cadaster, resulting both from the adopted formal and legal, and technological solutions, negatively verifies this assumption and, largely in its current shape, does not meet the expectations of society [87]. We often face the situation of inability to unambiguously identify the extent of the rights to cadastral parcels and the actual form of land use, which remains incomprehensible for the public and makes the institution of real estate cadaster lose its significance.
In Poland, there is now no significant political, social, or economic pressure to tidy up entries in the land registry system. The public good nature of a national land administration infrastructure is not fully understood by citizens. Meanwhile, a fully complete and up-to-date infrastructure for land administration would radically improve social inclusion by providing better awareness and service delivery for citizens [88]. The Polish state and quality of the data contained in the records of the land does not fully reflect the actual state, because the records are in most cases carried out in a passive way. This causes irreversible outdating of registration data, leading to a lack of credibility [56]. Recently, attempts have been made to assess the quality of registration data regarding the indication of indicators for assessing the quality of cadastral data at the local [89,90] and regional [91] levels.
The Polish land and building register is identified with a real estate cadaster, which was specified by Geodetic and Cartographic Law [92]. The method of establishing and keeping the land and buildings register is specified in the Regulation of the Minister of Regional Development and Construction [93]. The land and building register for Poland is an information system that provides the collection, updating, and sharing, in a uniform manner of information on land, buildings, and premises, their owners and other entities that own or manage these land, buildings, or premises [94].

2.6. Hypotheses

Summing up the conclusions of previous studies, the following hypotheses about the impact of various factors on differences between actual and evidenced forest cover can be stated:
Hypothesis 1 (H1).
The greater the anthropopression occurs, the greater chance of forest classification errors in the land registry is. In the areas where forest cover evidenced in the land registry is underestimated, susceptibility for recording forest areas as other land use forms in the land registry is stimulated by urbanization processes. Advance changes of the land registry are evidenced. On the other hand, urbanization processes in the areas where forest cover in land registry is overestimated are hypothesized to have negative impact on the difference between the actual and the evidenced forest cover. Adjustments of the land registry cannot keep up with real changes observed.
Hypothesis 2 (H2).
The more developed the civic society institutions are, the better the control over the land registration records is expected. As a consequence, the discrepancies between the land registration records and the actual state should be smaller. Thus, within the areas characterized by the forest cover overestimated in the land registry, the influence of civic society development is expected to be positive. On the other hand, within the regions of underestimated forest cover in the land registry, the impact of civic society development should be negative.
Hypothesis 3 (H3).
The better educated the society is, the better the control over the land registry records. As a consequence, the discrepancies between the land registry records and the actual state identified by remote sensing techniques application should be smaller. Thus, within the areas characterized by the overestimated forest cover in the land registry, the influence of education level of the society is expected to be positive. Consequently, within the areas of underestimated forest area in the land registry, the impact of education should be negative.
Hypothesis 4 (H4).
The higher the percentage of forests managed by the State Forest is, the smaller the differences between the land registration records and the actual state. As a consequence, within the areas characterized by the overestimated forest cover in the land registry, the influence of percentage share of forests managed by the State Forest is expected to be positive. On the other hand, within the regions of underestimated forest cover, the impact of investigated determinant should be negative.
Hypothesis 5 (H5).
The higher culture and quality of spatial planning is, the smaller the differences between the land registration records and the actual state. Hence, within the communes characterized by the overestimated land registry, the influence of culture and quality of spatial planning is hypothesized to be positive. Consequently, within the regions of underestimated forest cover in the land registry, the impact of the considered variable is expected to be negative.

3. Methods and Data Collection

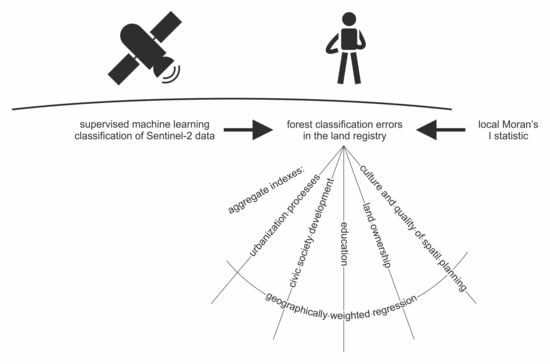
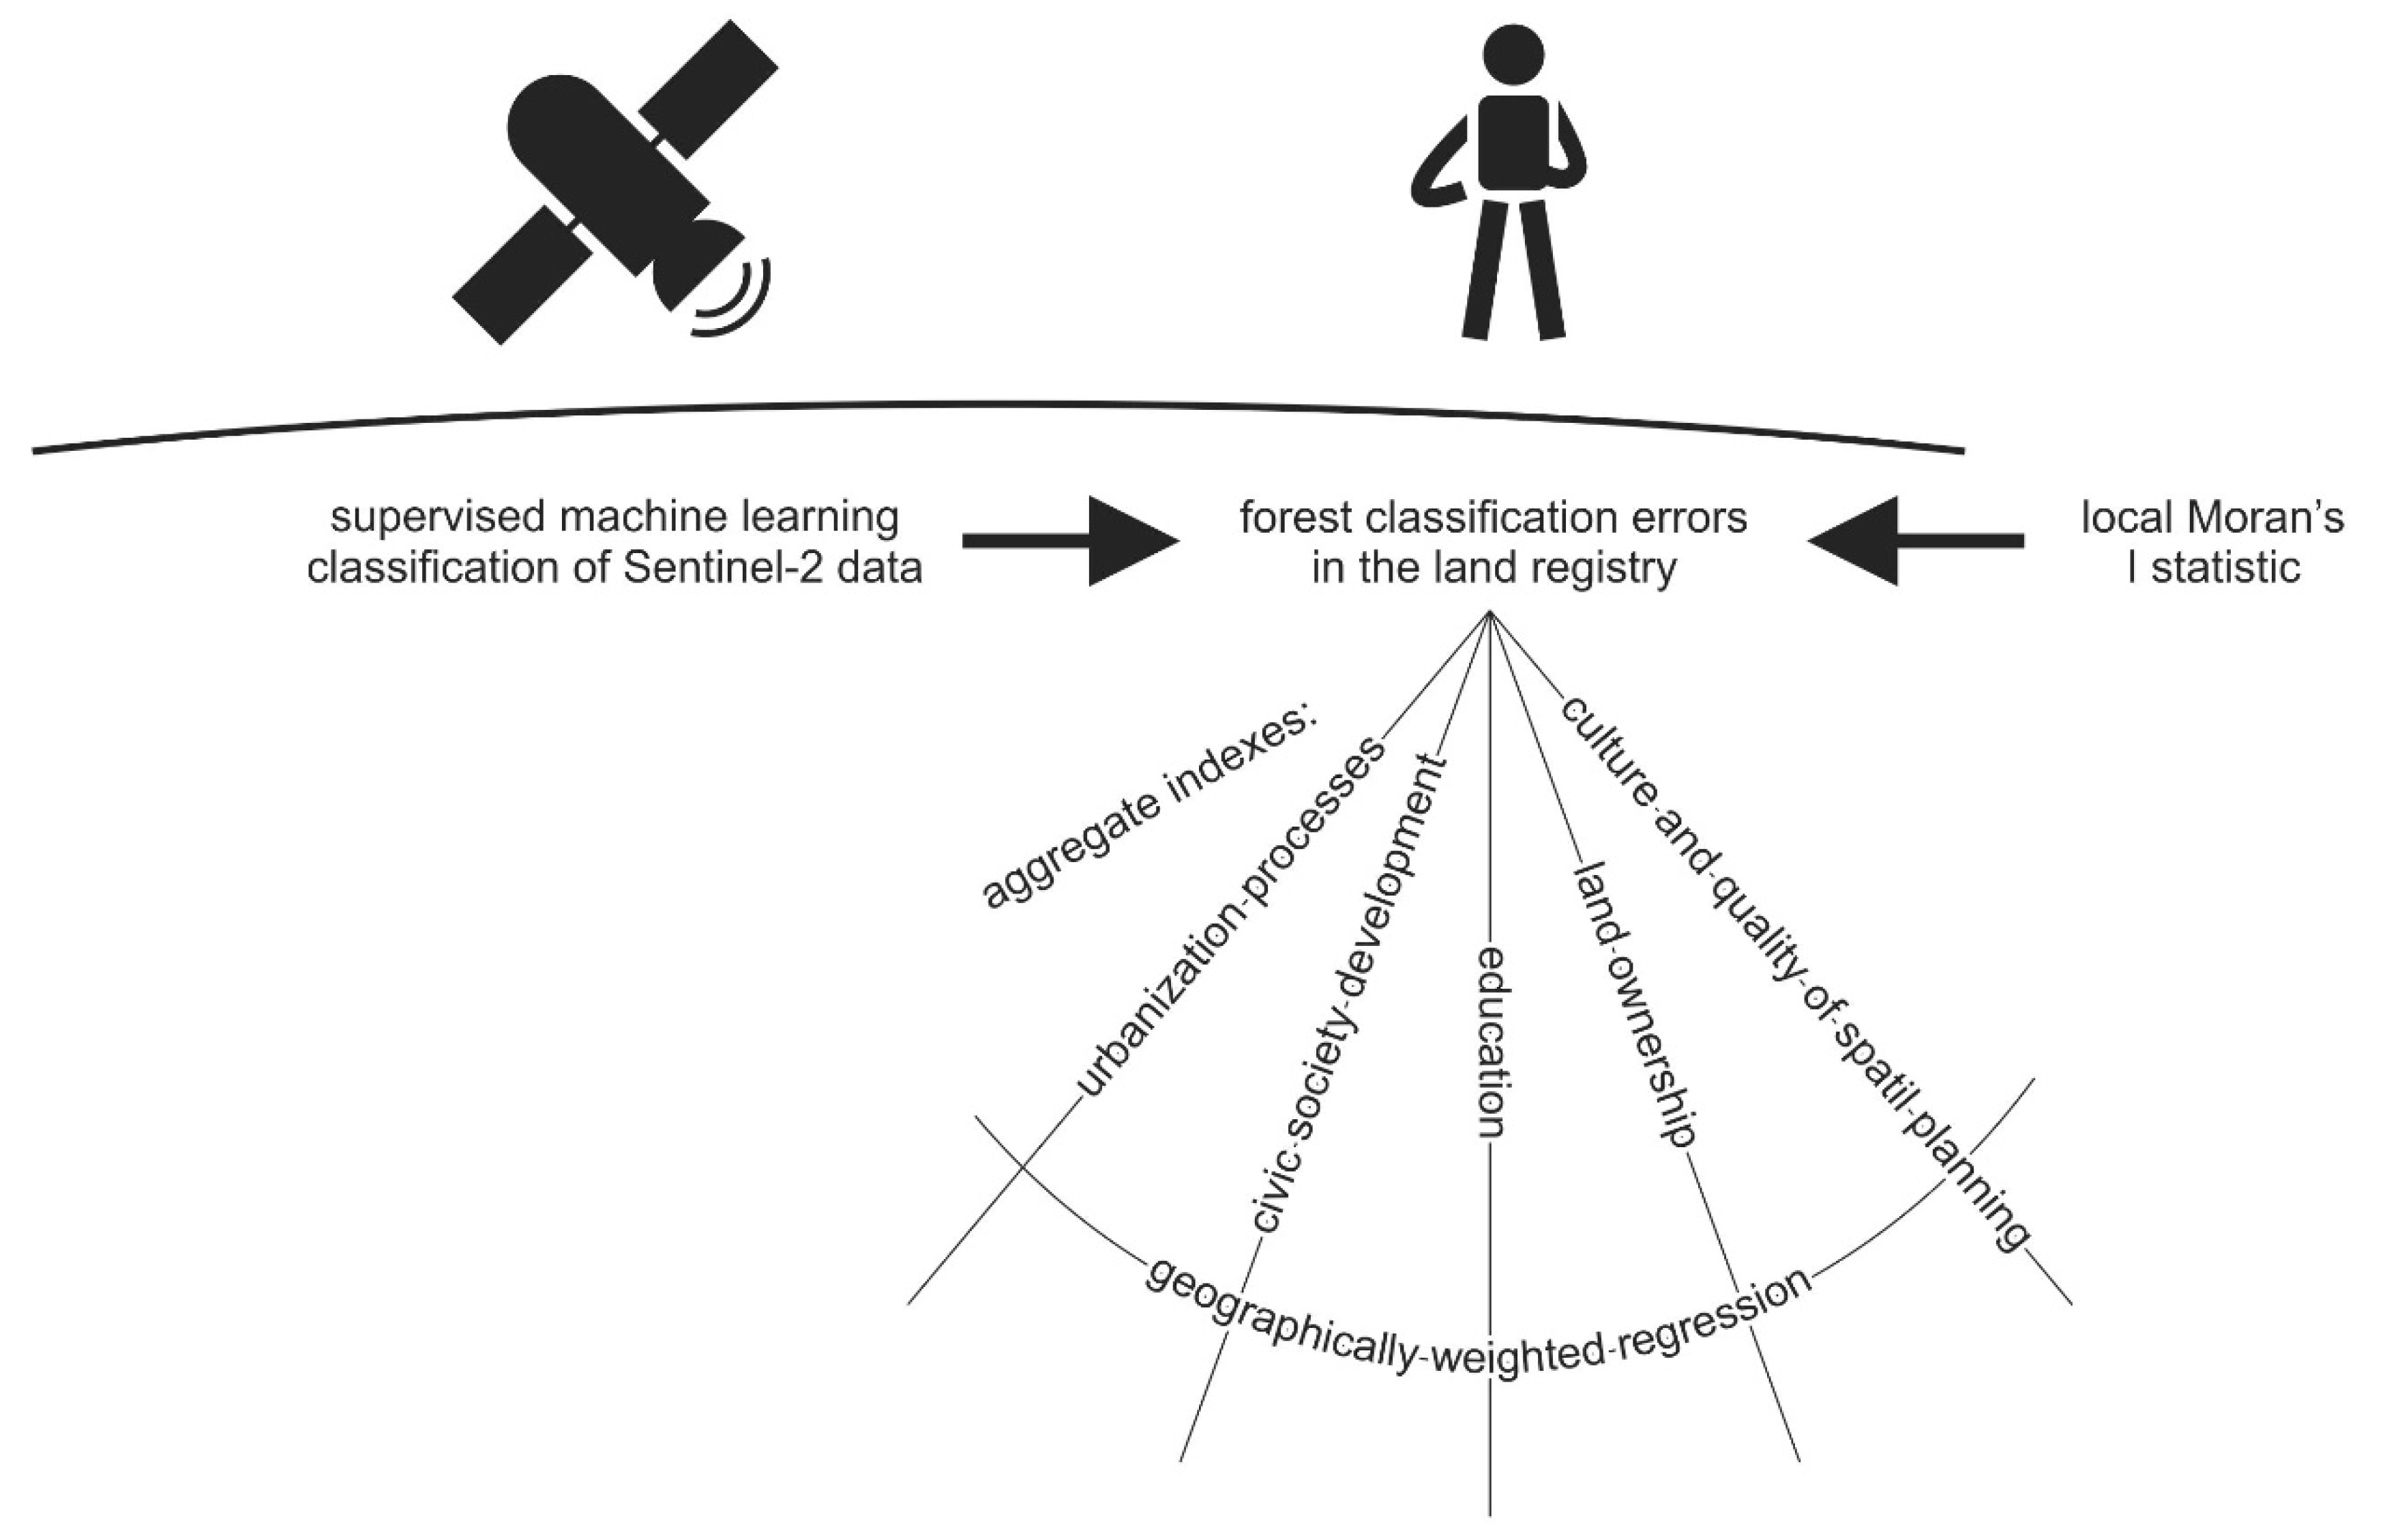
3.1. Research Design

The focus of this research was on identification of spatially varying social, demographic, and economic determinants of differences between forest identification based on remote sensing techniques and land registry (see Figure 1).
The research area covers the entirety of Poland divided into 2478 communes (NUTS-5 units). First, forest cover was detected by utilizing supervised machine learning classification of Sentinel-2 data in the year 2018. Then, the results were compared to forest cover reported in the land registry delivered in Local Data Bank by Statistics Poland. In consequence, forest classification errors in the land registry were identified and analyzed. Spatial analysis of forest classification errors included the local Moran’s I statistic. Application of the mentioned statistic allowed to identify spatial clusters where forest cover in land registry is underestimated or overestimated. Finally, geographically weighted regression (GWR) was applied to estimate spatial patterns of impact of various social, demographic, and economic factors on occurrence of forest classification errors in the land registry. The following factors described by aggregate indexes were considered: Urbanization processes, civic society development, education, land ownership, and culture and quality of spatial planning.

3.2. Data Sources

Three different data sources were used to identify forest detection errors of land registry. On the one hand, data from land registry delivered in Local Data Bank by Statistics Poland and Head Office of Geodesy and Cartography were applied. On the other hand, the Database of Topographic Objects was used to prepare a forest detection machine learning classification model of Sentinel-2 data in the year 2018.
The data concerning forests defined as forest areas and land related to forest management of all ownership forms in 2018 for communes (NUTS-5 units) were obtained from Local Data Bank provided by Statistics Poland. The Sentinel-2 images were downloaded from Copernicus Open Access Hub. Sentinel-2 images used in the study were acquired from 20 April to 5 December 2018. The extended timespan was applied to acquire nonclouded satellite images, although materials with a maximum cloud coverage of 1% of images were also accepted. Sentinel-2 data bands: 4 (red), 3 (green), 2 (blue), and 8 (near infrared), all with a pixel resolution of 10 m, were combined into four-band rasters. The main source of forest spatial data was the Data Base of Topographic Objects valid for 2016, obtained from the Head Office of Geodesy and Cartography of Poland. This data covered the entire area of Poland and its accuracy corresponded to a map on a scale of 1:10,000 with a minimum area of land coverage patch of 0.1 ha. The information scope of the Data Base of Topographic Objects is based on three levels of detail. The database contains 9 object classes divided into 57 object categories, which contain 244 types of topographic objects. Two types of objects were used in the study—Forests and Coppices, belonging to the category of Forest and Wooded Areas, which are included in the Land Cover class of objects.
Separate process of data collection was conducted for variables describing social, demographic, and economic determinants of land registry errors: Urbanization processes, civic society development, education, land ownership, and culture and quality of spatial planning. Three following data sources were considered: Local Data Bank provided by Statistics Poland, the Database of Topographic Objects, and State Electoral Commission in Poland (see Table 1).

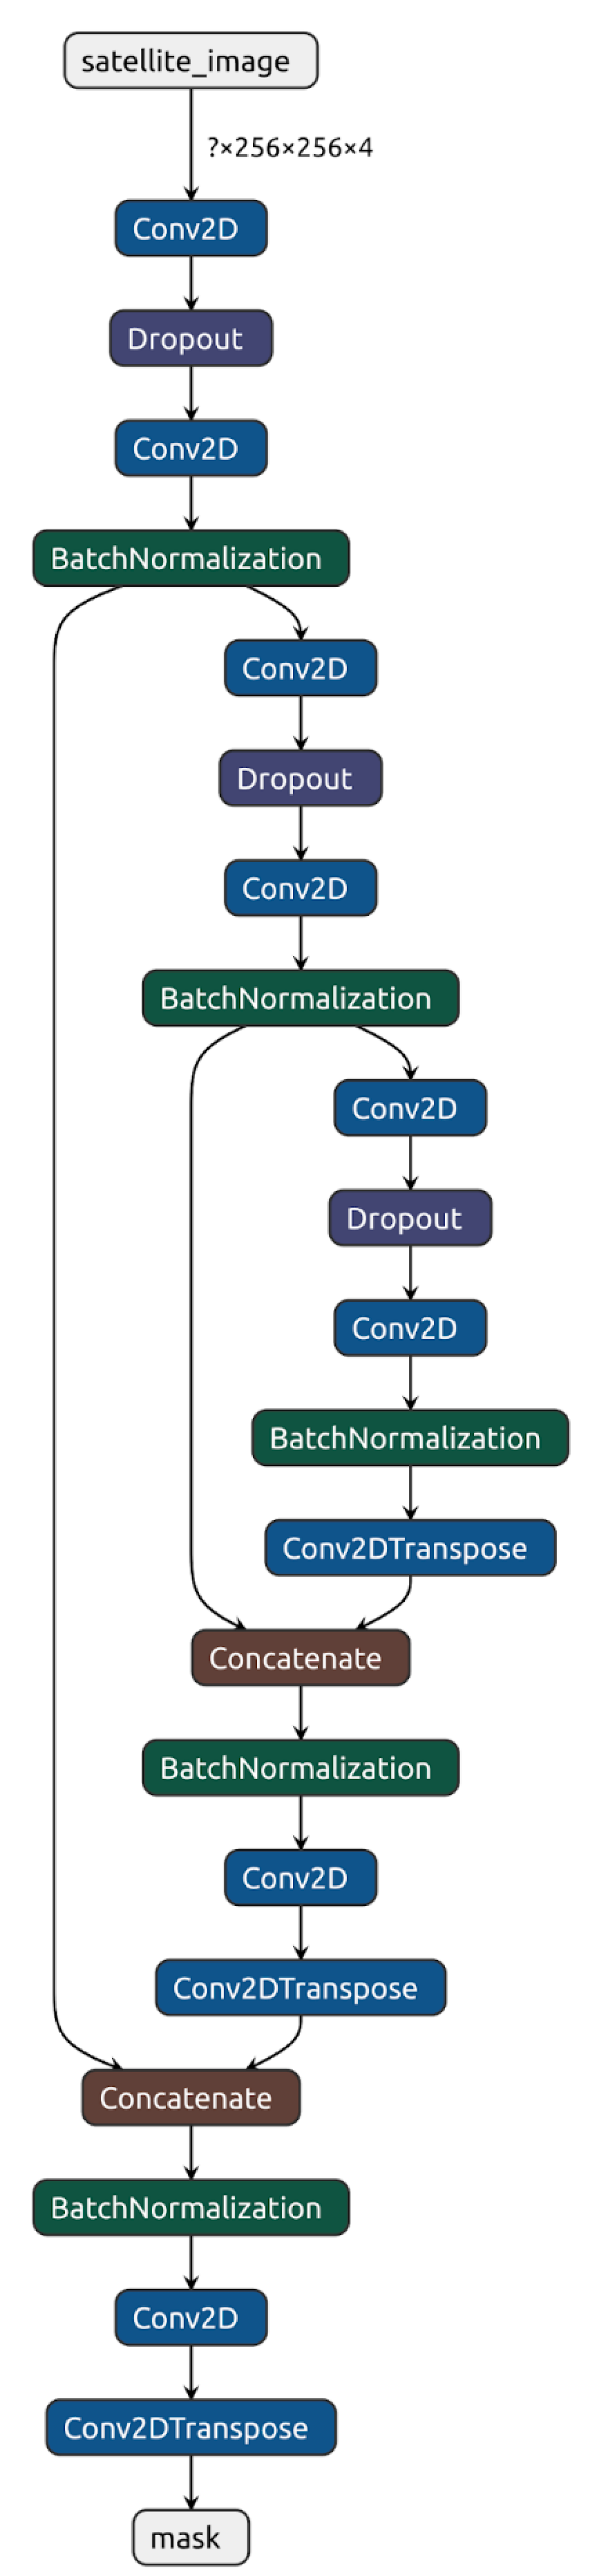
3.3. Methods of Analysis

There is strong evidence that automatic land cover classification is viable in terms of accuracy, cost, and time-efficiency. Several studies have confirmed that remote sensing can greatly benefit from utilizing modern methods offered by machine learning (ML), especially deep learning (DL), to tackle a wide range of problems related to processing satellite imagery. Among numerous examples, we can find successful attempts of crop types classification [95], utilizing DL in agriculture [96], urban land cover classification [97], and identifying land abandonment [98]. Thus, the use of machine learning in the context of forest areas detection in Poland is justified.
Semantic segmentation is a machine learning task of detecting a specific region of an image and assigning it a label to make this region distinguishable from different discovered regions and thus facilitating the process of image content interpretation. Segmentation, in terms of remote sensing and satellite imagery handling, is a process of classifying pixels, originating from satellite images, into categories representing, e.g., different land cover types. Due to high complexity of land cover features, size, and variety of information offered by satellite imagery, the task of training a model capable of determining belonging to a specific category should be considered nontrivial. Traditionally, such classification could be approached using classifiers such as Support Vector Machine (SVM) or Maximum Likelihood Classification (MLC). However, the above-mentioned classifiers lack accuracy and, what is equally important, the time needed to train a model based on them is far from desirable. On the contrary, classifiers based on convolutional neural networks (CNN) exhibit better performance than traditionally used SVM or MLC [99].
There are multiple semantic segmentation models architectures available. In the preliminary study, covering 20% of original data, researchers tested four architectures: U-Net [100], FPN [101], Linknet [102], and PSPNet [103]. Among those U-Net and PSPNet were elected as architectures capable of reaching the highest intersection over union (IoU) scores (above 70%). After hyperparameter tuning, comparing the scores and manual checking visualized inference results PSPNet model was abandoned. This was mainly due to issues related in properly inferring the forest area boundaries. Therefore, the authors built a neural network model based on the U-Net architecture (see Figure 2). U-Net is especially well suited for semantic segmentation. It consists of two paths: Contracting and expansive. The contracting path follows the typical architecture of a convolutional network, that is, a repeated application of two convolutions. Every step in the expansive path consists of an upsampling of the feature map [100]. The basic building block of the U-Net architecture, a two-dimensional convolutional neural network layer, has been frequently used in remote sensing activities. CNN’s main purpose is to extract from processed images common spatial features [104]. Those features can later be used in the inference phase to classify new images, i.e., describing them by relevant label or labels. The basic U-Net architecture has been adjusted to enable the processing of multiband satellite images. The adjustments were related to increasing the input size to treat images in RGB and near infrared channels, changing the kernel size from 3 × 3 to 5 × 5, increasing the depth of the contraction phase and tuning relevant hyperparameters. The model was evaluated using a loss function being a sum of binary cross entropy loss and Jaccard index loss. The accuracy of the model was monitored using the IoU metric. The model has been implemented in Python using Tensorflow and Keras frameworks. Overall, the model reached a 0.765 IoU score, 0.867 f1-score, and 0.922 binary accuracy (pixel-wise) on the test set (5% of the dataset). For all of the mentioned metrics, a range from 0 to 1:0 means that the model is a complete failure, while 1 indicates a perfect model.
U-Net training phase requires a dataset composed of images and their segmentation maps (see Figure 3). Segmentation map holds information about interesting regions in the described image. There are multiple techniques of creating such regions, e.g., bounding boxes or polygons. Authors opted for masks. Mask is a grayscale image composed of pixels that correspond to a single input image. Each mask pixel value represents a different label. In case of this research, “1” was used to indicate that the pixel represents a forest and “0” otherwise.
The results of supervised machine learning classification were aggregated to communes (NUTS-5 units), and then compared to data from land registry delivered in Local Data Bank by Statistics Poland. Forest cover (forest cover indicator), defined as the percentage ratio of the forest area to the total geodesic area of the commune, was calculated, and the forest areas in communes were analyzed for both types of data. The difference identified between forest cover indicators calculated based on application of remote sensing techniques and reported in the land registry was increased by 100% and defined as forest classification error of the land registry (FORESTCE). The dependent variable FORESTCE equals 100% when the results of remote sensing techniques application and land registry data are equal, exceeds 100% when forest cover identified by application of remote sensing techniques is larger than value recorded in land registry, and is lower than 100% when higher forest cover was reported in land registry compared to forest cover identified through remote sensing techniques application.
In the land registry, forest areas were defined as a homogeneous surface of at least 0.10 ha covered with forest vegetation like trees, bushes, and undergrowth (forested area), or temporarily devoid of it (nonforested area), but intended for forest production or being a nature reserve, a part of national park, or registered as nature monuments. The forest areas also included land connected with forest management, occupied by buildings and structures, water drainage facilities, forest spatial division lines, forest roads, areas under power lines, forest nurseries, wood storage facilities, and also forest car parks and tourist facilities [105,106]. The mask in supervised machine learning classification was representing forest defined as areas of at least 0.10 ha with a dense tree cover. These included forests, as well as other wooded areas, e.g., land adjacent to surface waters or recreational areas [107].
The method of land cover errors detection has some limitations. The first refers to the limitations of the remote sensing technique applied. It is the occurrence of cloud cover on satellite images, which disturb or prevent recognition of objects and data generation. It enforced the application of nonclouded satellite images coverage for the whole study area. The second limitation is the inconsistencies in the definition of forest area, which may affect the occurrence of errors of land registry. Small systemic overestimation of forest cover in the land registry might be identified. However, the incompatibility concerns areas associated with forest production and management that are mostly spatially related to forest areas and did not affect the results of the analysis in the adopted scale of the study.
The spatial volatility of land registry errors was analyzed in detail. Spatial clusters of the investigated phenomenon were identified by calculating the local Moran’s I statistic, the popular indicator of local spatial autocorrelation. This technique of exploratory spatial data analysis is based on analysis of the investigated phenomenon differing over space in every considered unit as well as in its surroundings [108]. The calculation of local Moran’s I statistic in every j considered spatial unit should be expressed by the following equation [16,109]:
I j = ( FORESTCE j FORESTCE ¯ ) · i = 1 k w i j · ( FORESTCE i FORESTCE ¯ ) i = 1 k ( FORESTCE i FORESTCE ¯ ) 2 k
where FORESTCEj represents a value of forest classification errors in land registry identified in j commune, FORESTCEi equals the value of the same variable in every i of k considered surrounding units, and wji is the element of weight matrix of neighborhood between communes j and i. Neighborhood is a dummy variable which takes “1” when j and i communes are identified as neighbors, and “0” otherwise [16,109]. When local Moran’s I statistics range between 0 and +1, either high values (or low ones) are spatially clustered around a commune characterized by a similar value. The hot spot is identified when the high value is surrounded by high ones, and the cold spot when the low value is surrounded by low ones. On the other hand, when the considered statistics range between −1 and 0, the neighboring values are dissimilar to the value at the particular spatial unit. The spatial outlier is identified when the high value is surrounded by low ones, or the low value surrounded by high ones [108].
Aggregate indexes related to social, demographic, and economic determinants of land cover errors (urbanization processes, civic society development, education, land ownership, and culture and quality of spatial planning) were considered as independent variables. Each aggregate index equals the average of normalized values of measures describing each investigated determinant of land cover errors. It must be underlined that calculation of normalized values z based on real values x, depended on the contribution of particular measures to determinants, and was different for stimulants:
z = x x m i n x m a x x m i n 100 %
Compared to destimulants:
z = ( 1 x x m i n x m a x x m i n ) 100 %
However, in this research, all considered measures had stimulus contributions to aggregate indexes, further investigated as independent variables. Aggregate index URBAN describing urbanization processes covers the stimulus contributions of both population density and the number of buildings per 1 km2. The aggregate index CIVIC, referring to civic society development, consists of the following stimulus measures: Number of NGOs per 10,000 population, number of club and artistic groups members operating per 10,000 population, and turnout in local government elections in 2018. Then, the education (EDU) aggregate index includes stimulus measures of municipal expenditures on healthcare per capita, and percentage of councilors with higher education in a commune. The index LDOWN refers to land ownership and is equal to the normalized value of the share of public forests managed by the State Forests. Finally, the culture and quality of spatial planning (SPPLAN) is calculated as normalized share of area covered by valid local spatial development plans. The list of all measures contributing to considered independent variables might be found in Table 1. However, limitations of using aggregate indexes should be emphasized. Most of all, selection of measures contributing to indexes could be contested. Moreover, aggregate indexes consider only quantitative information and might invite a simplistic image of investigated phenomena [110].
GWR was applied to explain spatially varying impact of various social, demographic, and economic determinants on investigated forest classification errors. However, GWR application should be preceded by Ordinary Least Square (OLS) modelling to identify global, spatially constant impact of investigated social, demographic, and economic factors on land registry errors [111]. Linear, global impact of considered determinants on investigated forest classification errors should be expressed as follows:
FORESTCE = β 0 + β 1 · URBAN + β 2 · CIVIC + β 3 · EDU + β 4 · LDOWN + β 5 · SPPLAN + ε
where FORESTCE refers to forest classification errors identified in land registry. URBAN, CIVIC, EDU, LDOWN, and SPPLAN describe aggregate indexes characterizing various social, demographic, and economic factors influencing investigated land registry errors. In particular, the URBAN abbreviation refers to urbanization processes, CIVIC—civic society development, EDU—education, LDOWN—land ownership, and SPPLAN—culture and quality of spatial planning. Detailed characteristics of independent variables were presented in Table 1. Finally, β0 refers to intercept, β1 to β5 refer to coefficients, and ε—to statistical bias.
GWR was successfully applied in various researches concerning land cover or land use, as well as its changes, impacts, and results. Brown et al. [111] tested the potential of the method in examining local variations of relationship between land cover, rainfall, and surface water habitat in southeast Australia. Spatial volatility of landscape fragmentation and its many different anthropogenic influences were investigated by enabling GWR for the case of Shenzhen City in China [112]. By GWR application, Leśniewska-Napierała et al. [16] described local spatial patterns of European Union funds impacts on land cover changes in Poland. Identification of driving forces of deforestation in the state of Mexico was enabled by the discussed method as well [2]. Shariff et al. [113] applied GWR to model urban land use changes in Penang Island in Malaysia. The discussed method allowed for the investigation of the spatially varying relation between groundwater quantity changes, and land use and land cover changes in the Khanmirza Plain of southwestern Iran [114]. GWR allowed Huang et al. [115] to identify the role of forest areas in decreasing water pollution in the urban sub-watersheds, which was more significant compared to rural ones.
In this research, GWR was designed to estimate local spatial patterns of various social, demographic, and economic impacts on errors of forest identification in land registry. The main goal of GWR application was to explore spatial variations in relationships between investigated variables [115]. Local models for every j Polish commune described by geographical coordinates Long, and Lat were estimated and analyzed. As a result, it was possible to identify the areas where forest classification errors were significantly influenced by each considered aggregate index referring to investigated social, demographic and economic factors. The mentioned spatially varying impact might be expressed as follows:
FORESTCE j = β 0 ( L o n g j , L a t j ) + β 1 ( L o n g j , L a t j ) · URBAN + β 2 ( L o n g j , L a t j ) · CIVIC   + β 3 ( L o n g j , L a t j ) · EDU + β 4 ( L o n g j , L a t j ) · LDOWN   + β 5 ( L o n g j , L a t j ) · SPPLAN + ε
The selection of neighboring spatial units to be included in estimation of local models in every j commune, weighted distance decay function (or kernel function), w, is applied to find the h bandwidth for every k commune spatially distributed around the j spatial unit [111,116]. Corrected Akaike information criterion was utilized to delimit the adaptive (smaller for dense located spatial units, and larger for sparse ones) bandwidth, offering a more desirable assessment than the fixed one [111,114]. Weight applied for each local model depends on the Euclidean distance d between the polygons’ centroids of considered j, and every k surrounding commune [112]. Weight of units located out of the bandwidth from considered commune is equal to zero [116,117]:
w j k = ( d j k 2 h 2 ) e
The results of GWR implementation were presented on the following maps: (1) Map of local coefficients of determination—to identify goodness of fit of local models to empirical observations, (2) maps of values of estimated local parameters of independent variables—to identify spatial patterns of investigated social, demographic, and economic impacts on forest classification errors in land registry, and (3) maps of values of t-Student tests for mentioned parameters—to detect statistical significance of identified impacts [112,118,119].

4. Results and Discussion
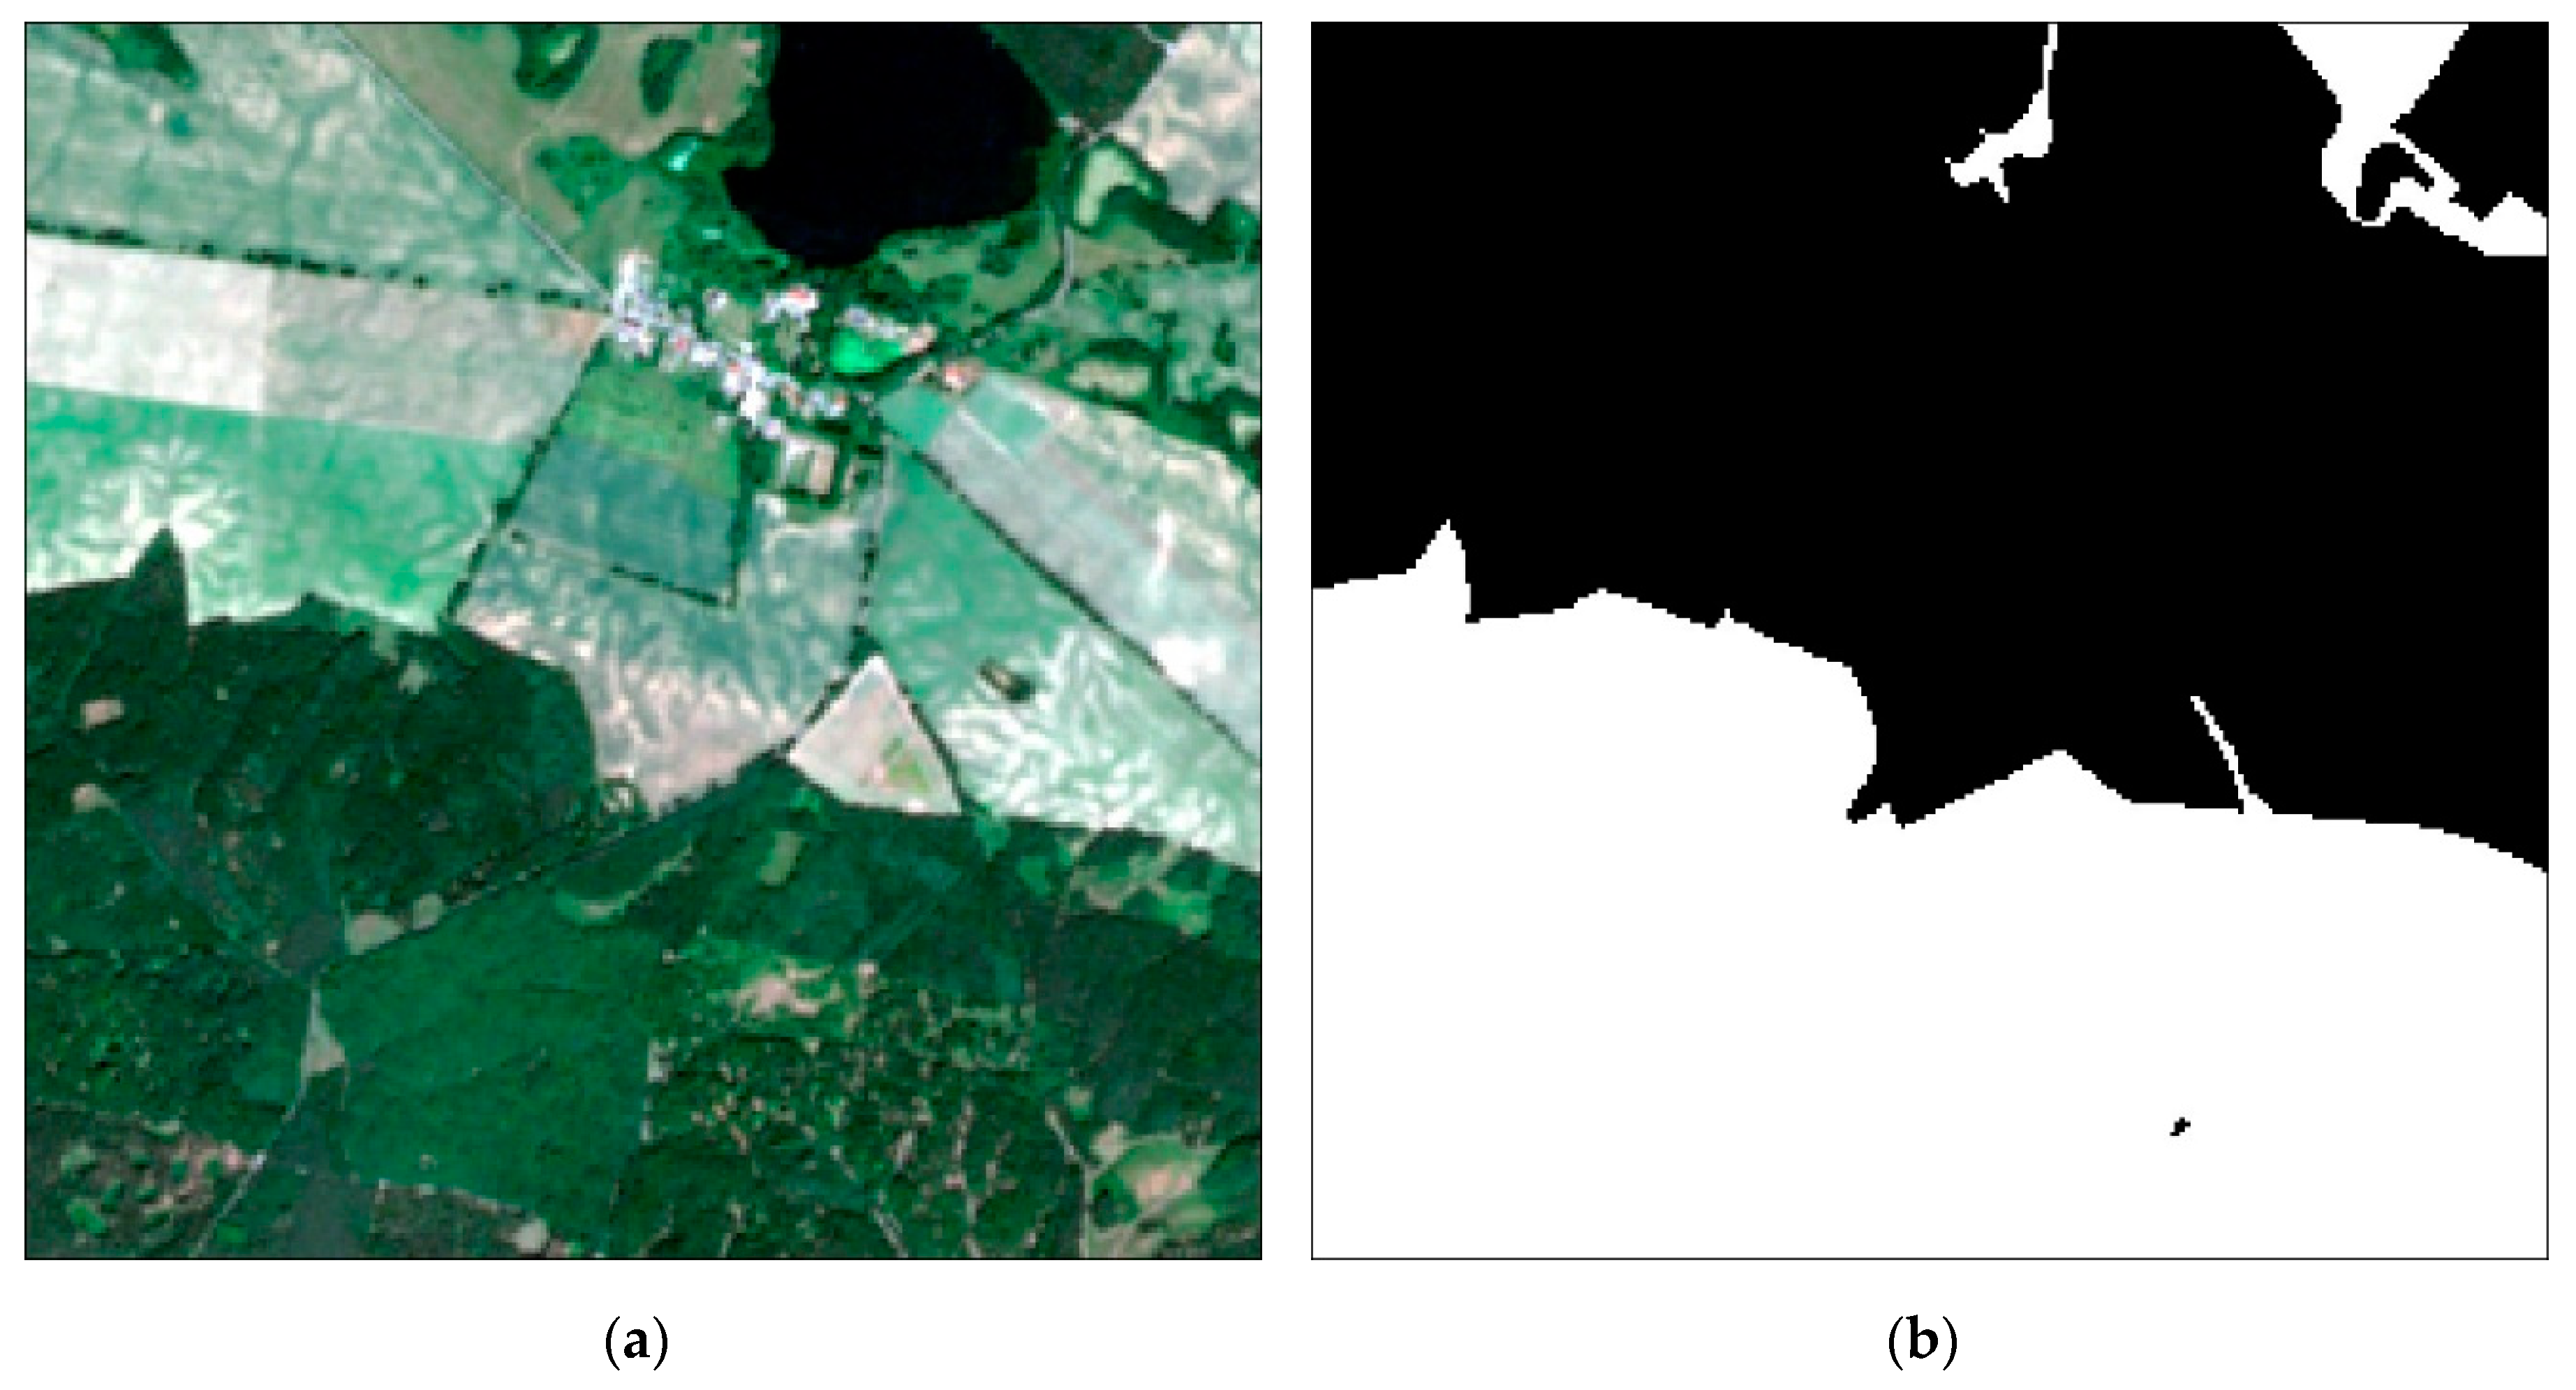
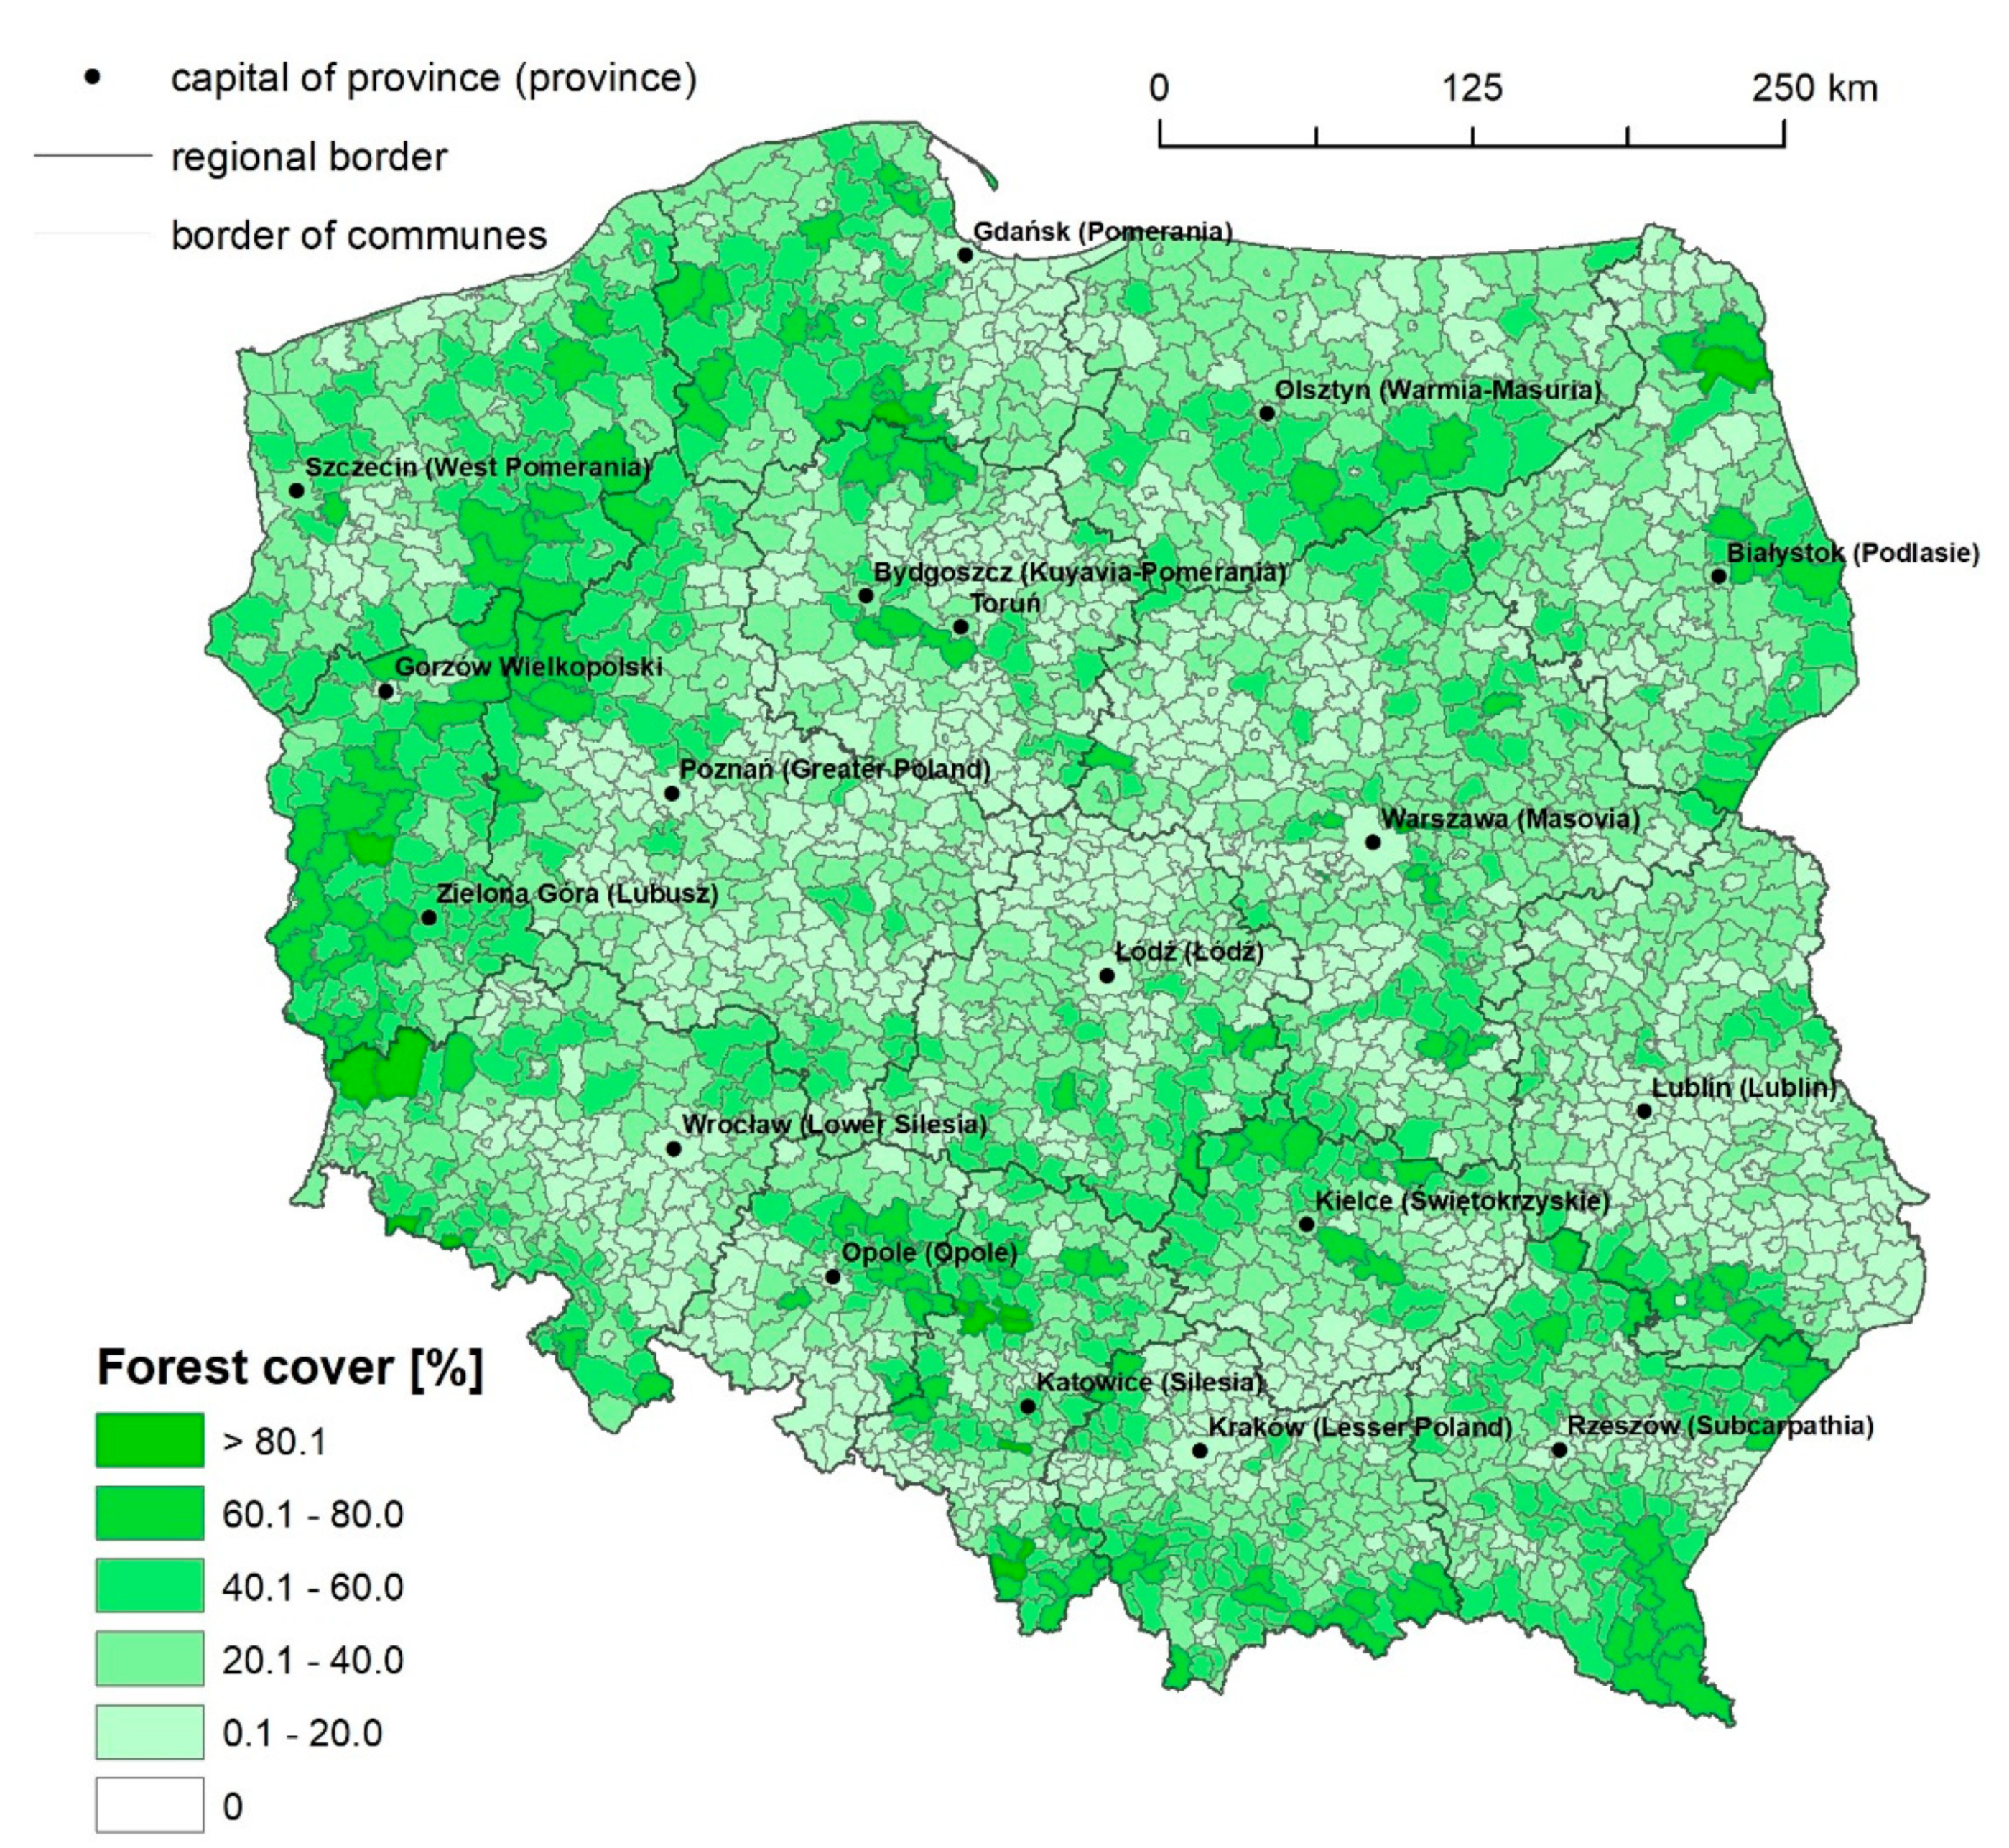
4.1. Forest Cover

Based on data obtained as the result of supervised machine learning classification of Sentinel-2 satellite images, the forest cover of Poland was 32.8% (see Figure 4). The areas located in the center of Poland, including the south part of the Kuyavia-Pomerania province, north part of the Łódź province, Masovia, Greater Poland, and the Lublin province in the east, were characterized by less forest cover. The greater forest cover occurred in the north and west regions of Poland, especially in the Lubusz province, where forest cover was over 50% of its area.
The forest cover analysis carried out for communes (NUTS-5 units) showed that that average forest cover was characterized by high variability reaching 63.7%. A complete lack of forests (0.0% of forest cover), was found only for 4 out of 2478 communes. Communes with forest cover of 0.1–20.0% accounted for 36.0% of all. These communes were located mainly in the central part of Poland, but their clusters are also visible in the south and south-east of the country. A significant number of communes—37.5%—had forest cover in the range of 20.1–40.0%, whereas communes with forest cover of 40.1–60.0% constituted 19.4% of all analyzed units and were situated mainly in western and northern part of Poland. The percentage share of communes with significant forest cover of 60.1–80.0% was 6.3%. They stretched in the form of a strip from the south to west through the Lubusz province to the north through the West Pomerania and Pomerania province. Their cluster was also visible on the southeastern edges of the Subcarpathia province. Only 0.7% of communes had forest cover equal 80.1% or above. The largest forest cover of 95.1% was recorded for the Krupski Młyn commune located in the southern part of Poland (Silesia province).

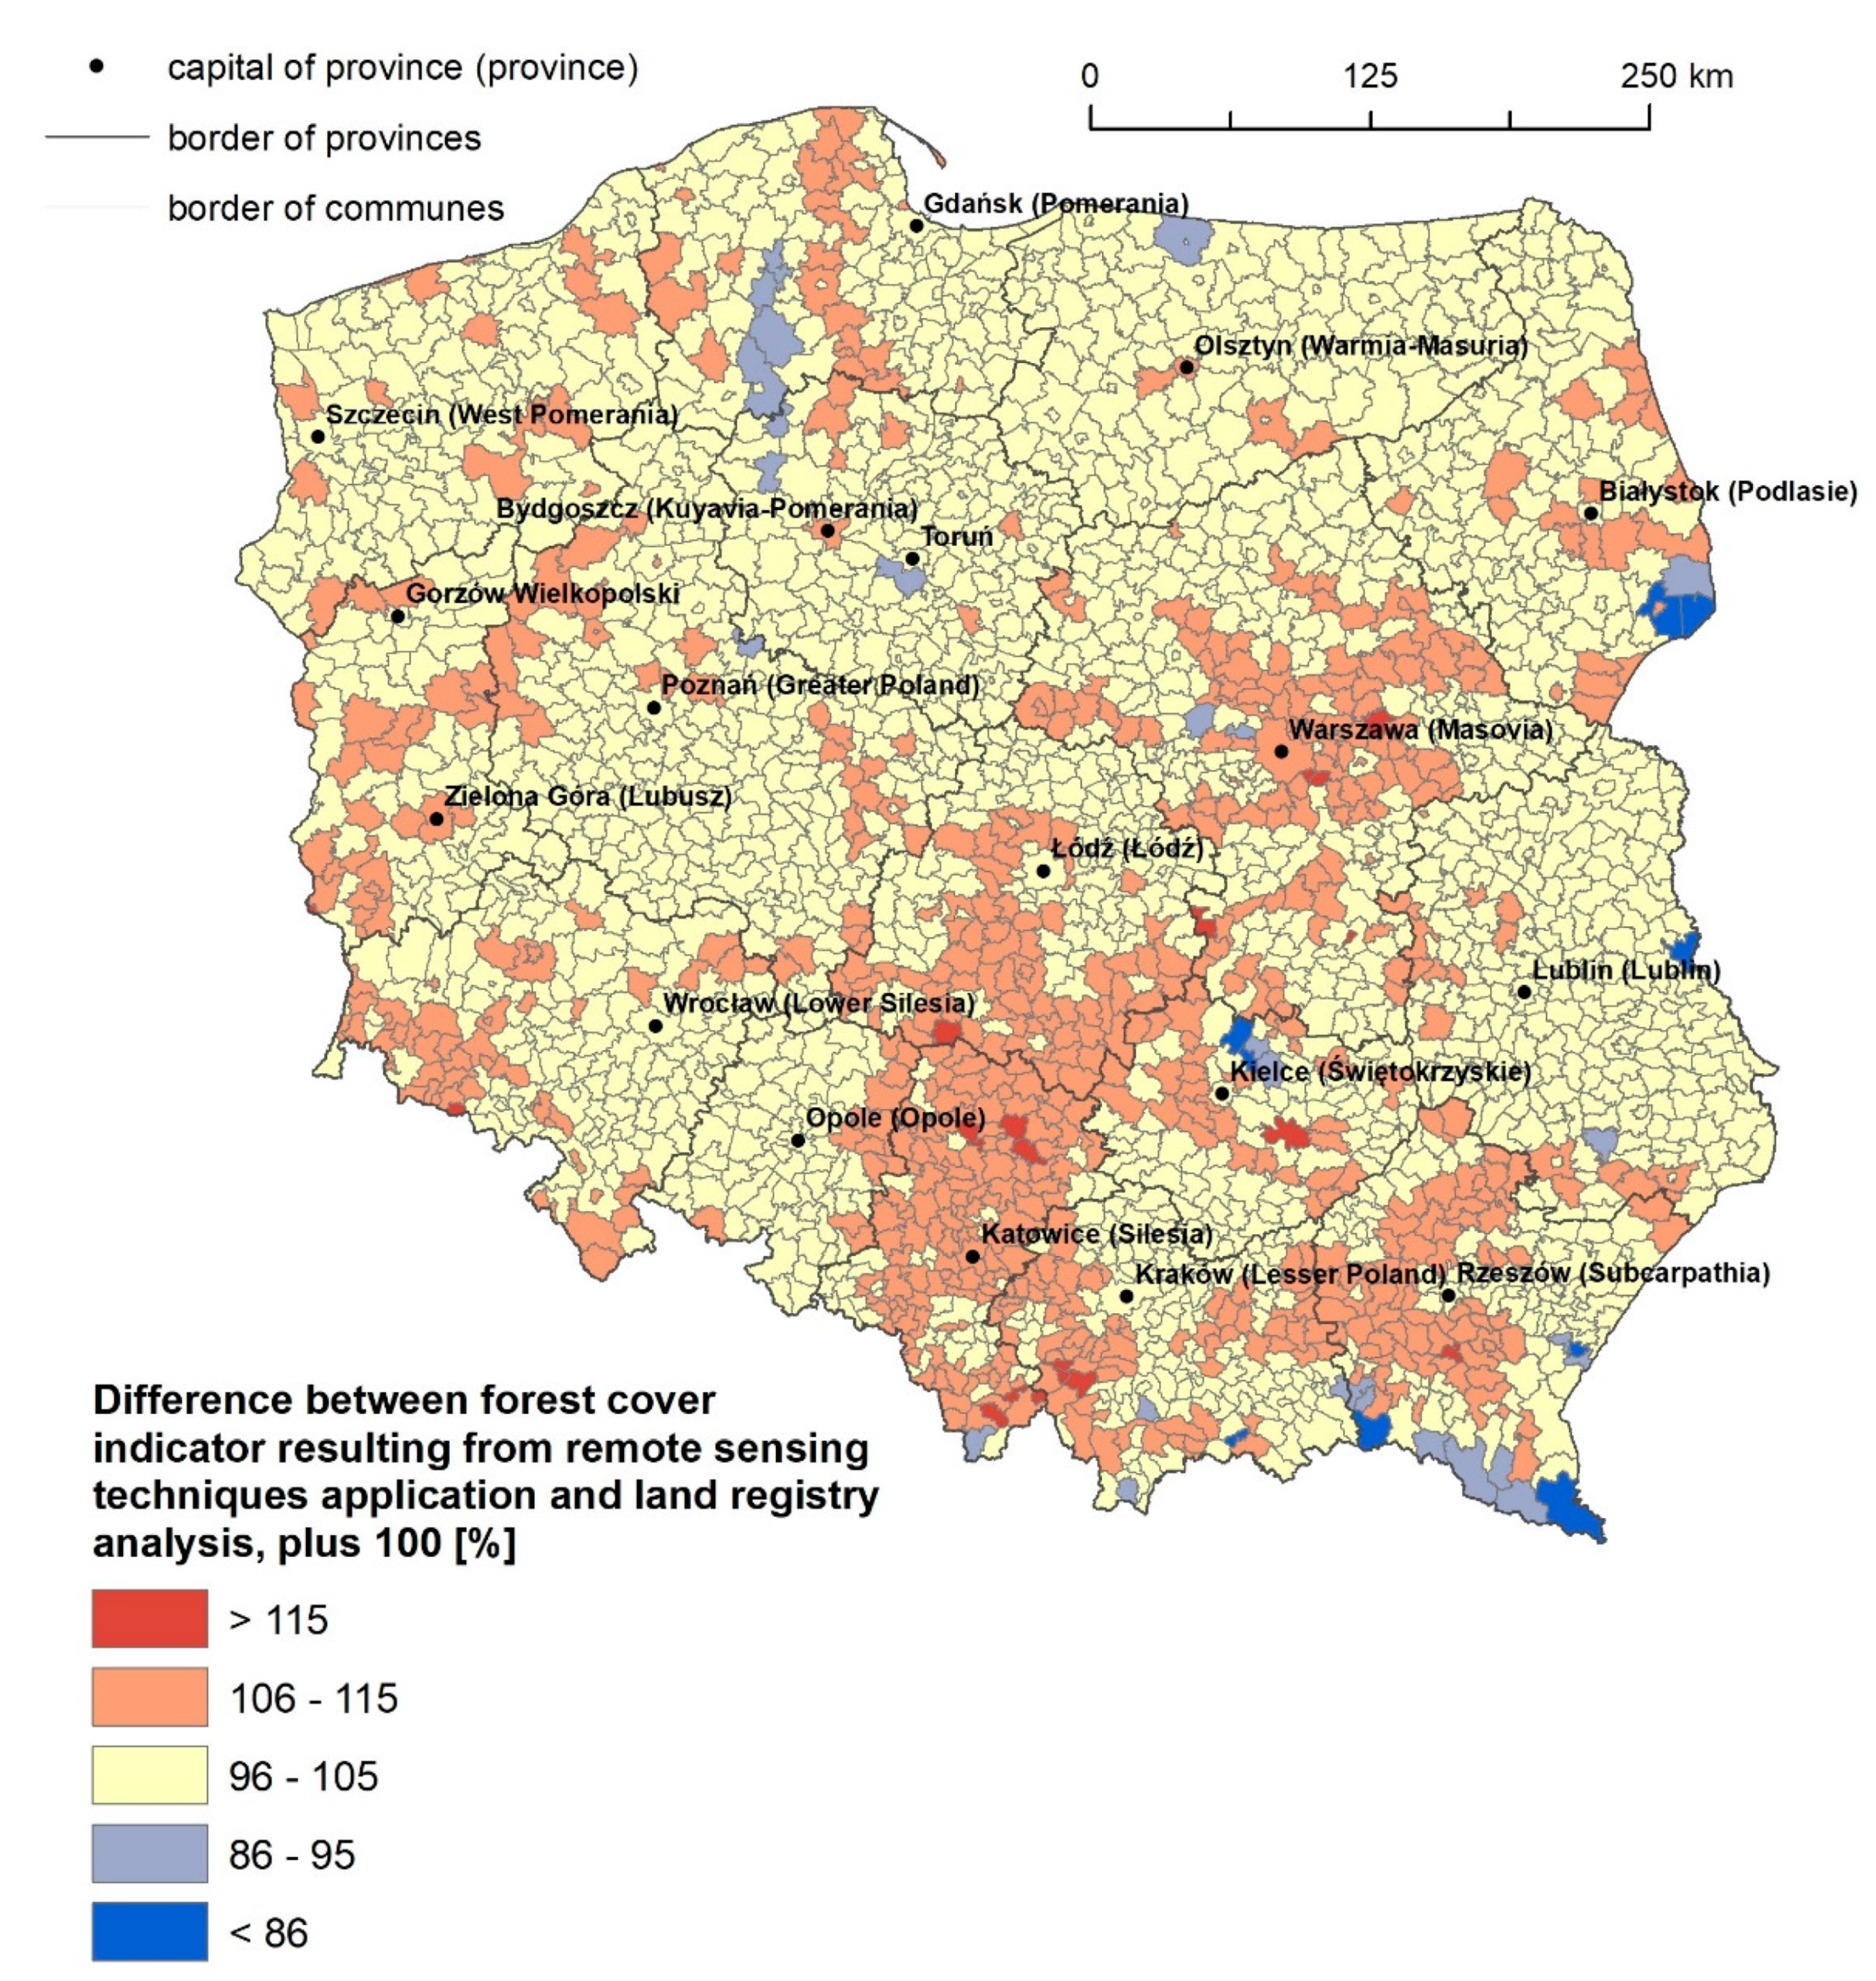
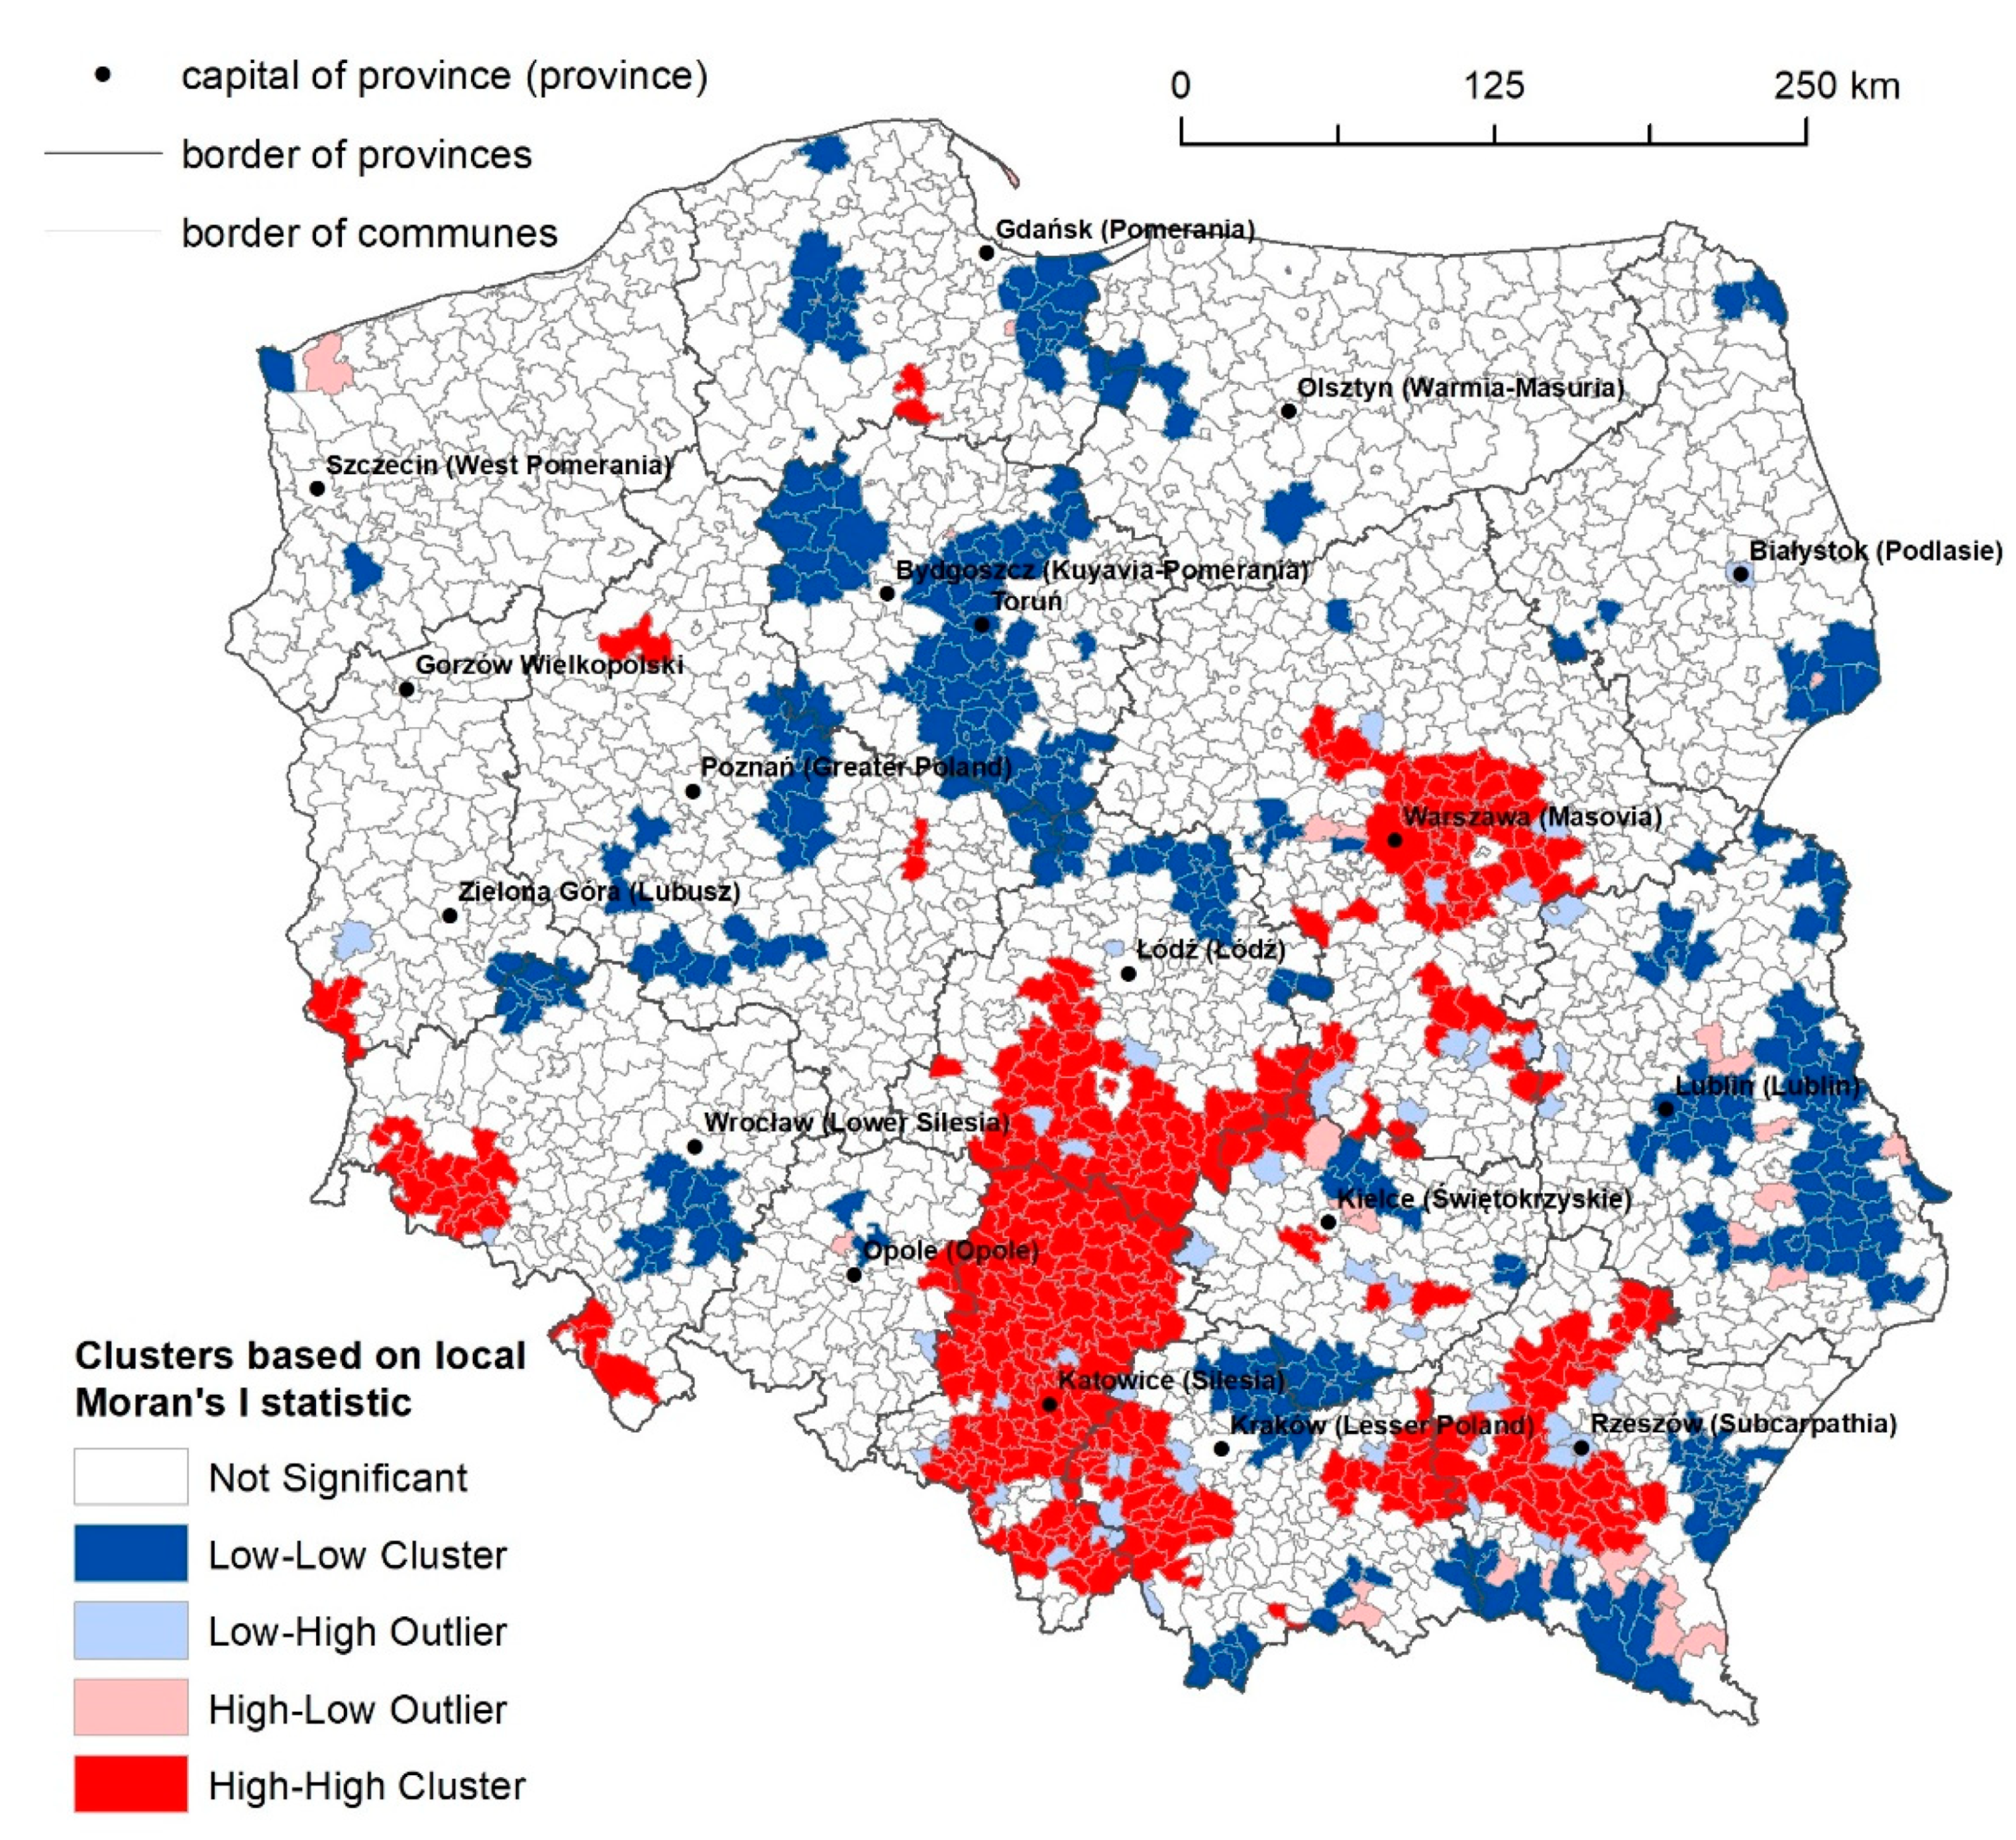
4.2. Errors of Forest Identification in the Land Registry

The variable FORESTCE depicting forest classification errors in land registry was introduced based on relative comparison of both forest identification resulting from remote sensing techniques application and land registry analysis. It should be recalled that FORESTCE index equals 100% when the results of remote sensing techniques application and land registry data are equal, exceeds 100% when forest cover identified by application of remote sensing techniques is larger than value recorded in the land registry, and is lower than 100% when value of forest cover value is overestimated in the land registry.
The values of FORESTCE index for every particular commune in Poland are presented on Figure 5. It must be emphasized that in 70.7% of the investigated communes, the values of forest cover identified by remote sensing techniques application and reported in the land registry were similar, and the difference did not exceed 5%. Interestingly, the lowest value of FORESTCE index (52.5%) was evidenced in the Białowieża rural commune in the Podlasie province. In the mentioned commune, the forest area identified by remote sensing techniques covered only 39.9% of the investigated unit, while the forest cover reported in the land registry was 87.4%. This is the area on the edge of Białowieża Forest (UNESCO World Heritage Site), where controversial cutting of the stand on a large scale was reported in 2017. On the contrary, the largest value of FORESTCE index was diagnosed in the city of Łęknica in the Lubusz province, on the Polish-German border. It must be emphasized that the largest English-style landscape garden in Central Europe called Muskau Park (UNESCO World Heritage Site) is located in the mentioned city. Summarizing. On one hand, updating the land registry cannot keep up with the effects of forestry. On the other hand, the pretend forest is the category of land cover which might somehow affect the results of forest identification based on remote sensing techniques.
Applying local Moran’s I statistics enabled identification of regions of spatial concentration of investigated forest classification errors in land registry. The results of spatial autocorrelation analysis are visualized on Figure 6. HH abbreviation refers to spatial clusters where forest cover in the land registry is underestimated. Four large spatial clusters, where identified forest areas exceed reported ones, should be emphasized: (1) Metropolitan area of Warsaw—the capital city of Poland; (2) a large and wide strip stretching from mountain areas in the southern part of Poland, covering Silesia province, western Lesser Poland, and the south part of the Łódź province; (3) mountain areas located in Lower Silesia province—one of the top tourist destinations in Poland; and (4) large area covering central-west part of Subcarpathia province, and the east edge of Lesser Poland.
On the other hand, LL describes spatial clusters where forest evidenced in land registry is larger than identified by remote sensing techniques application. The areas of spatial concentration of overestimated forest cover in the land registry are as follows: (1) Areas located in the trail of the violent gale that passed in August of 2017 over the provinces Greater Poland, Kuyavia-Pomerania, and Pomerania; (2) a wide strip stretching along the A1 and A2 highways starting from western edge of Warsaw metropolitan area, running latitudinally toward Łódź, and then longitudinally north, covering eastern parts of the provinces Kuyavia-Pomerania and Pomerania; (3) areas located on western edge of Białowieża Forest in the Podlasie province; and (4) the greater part of the Lublin province.

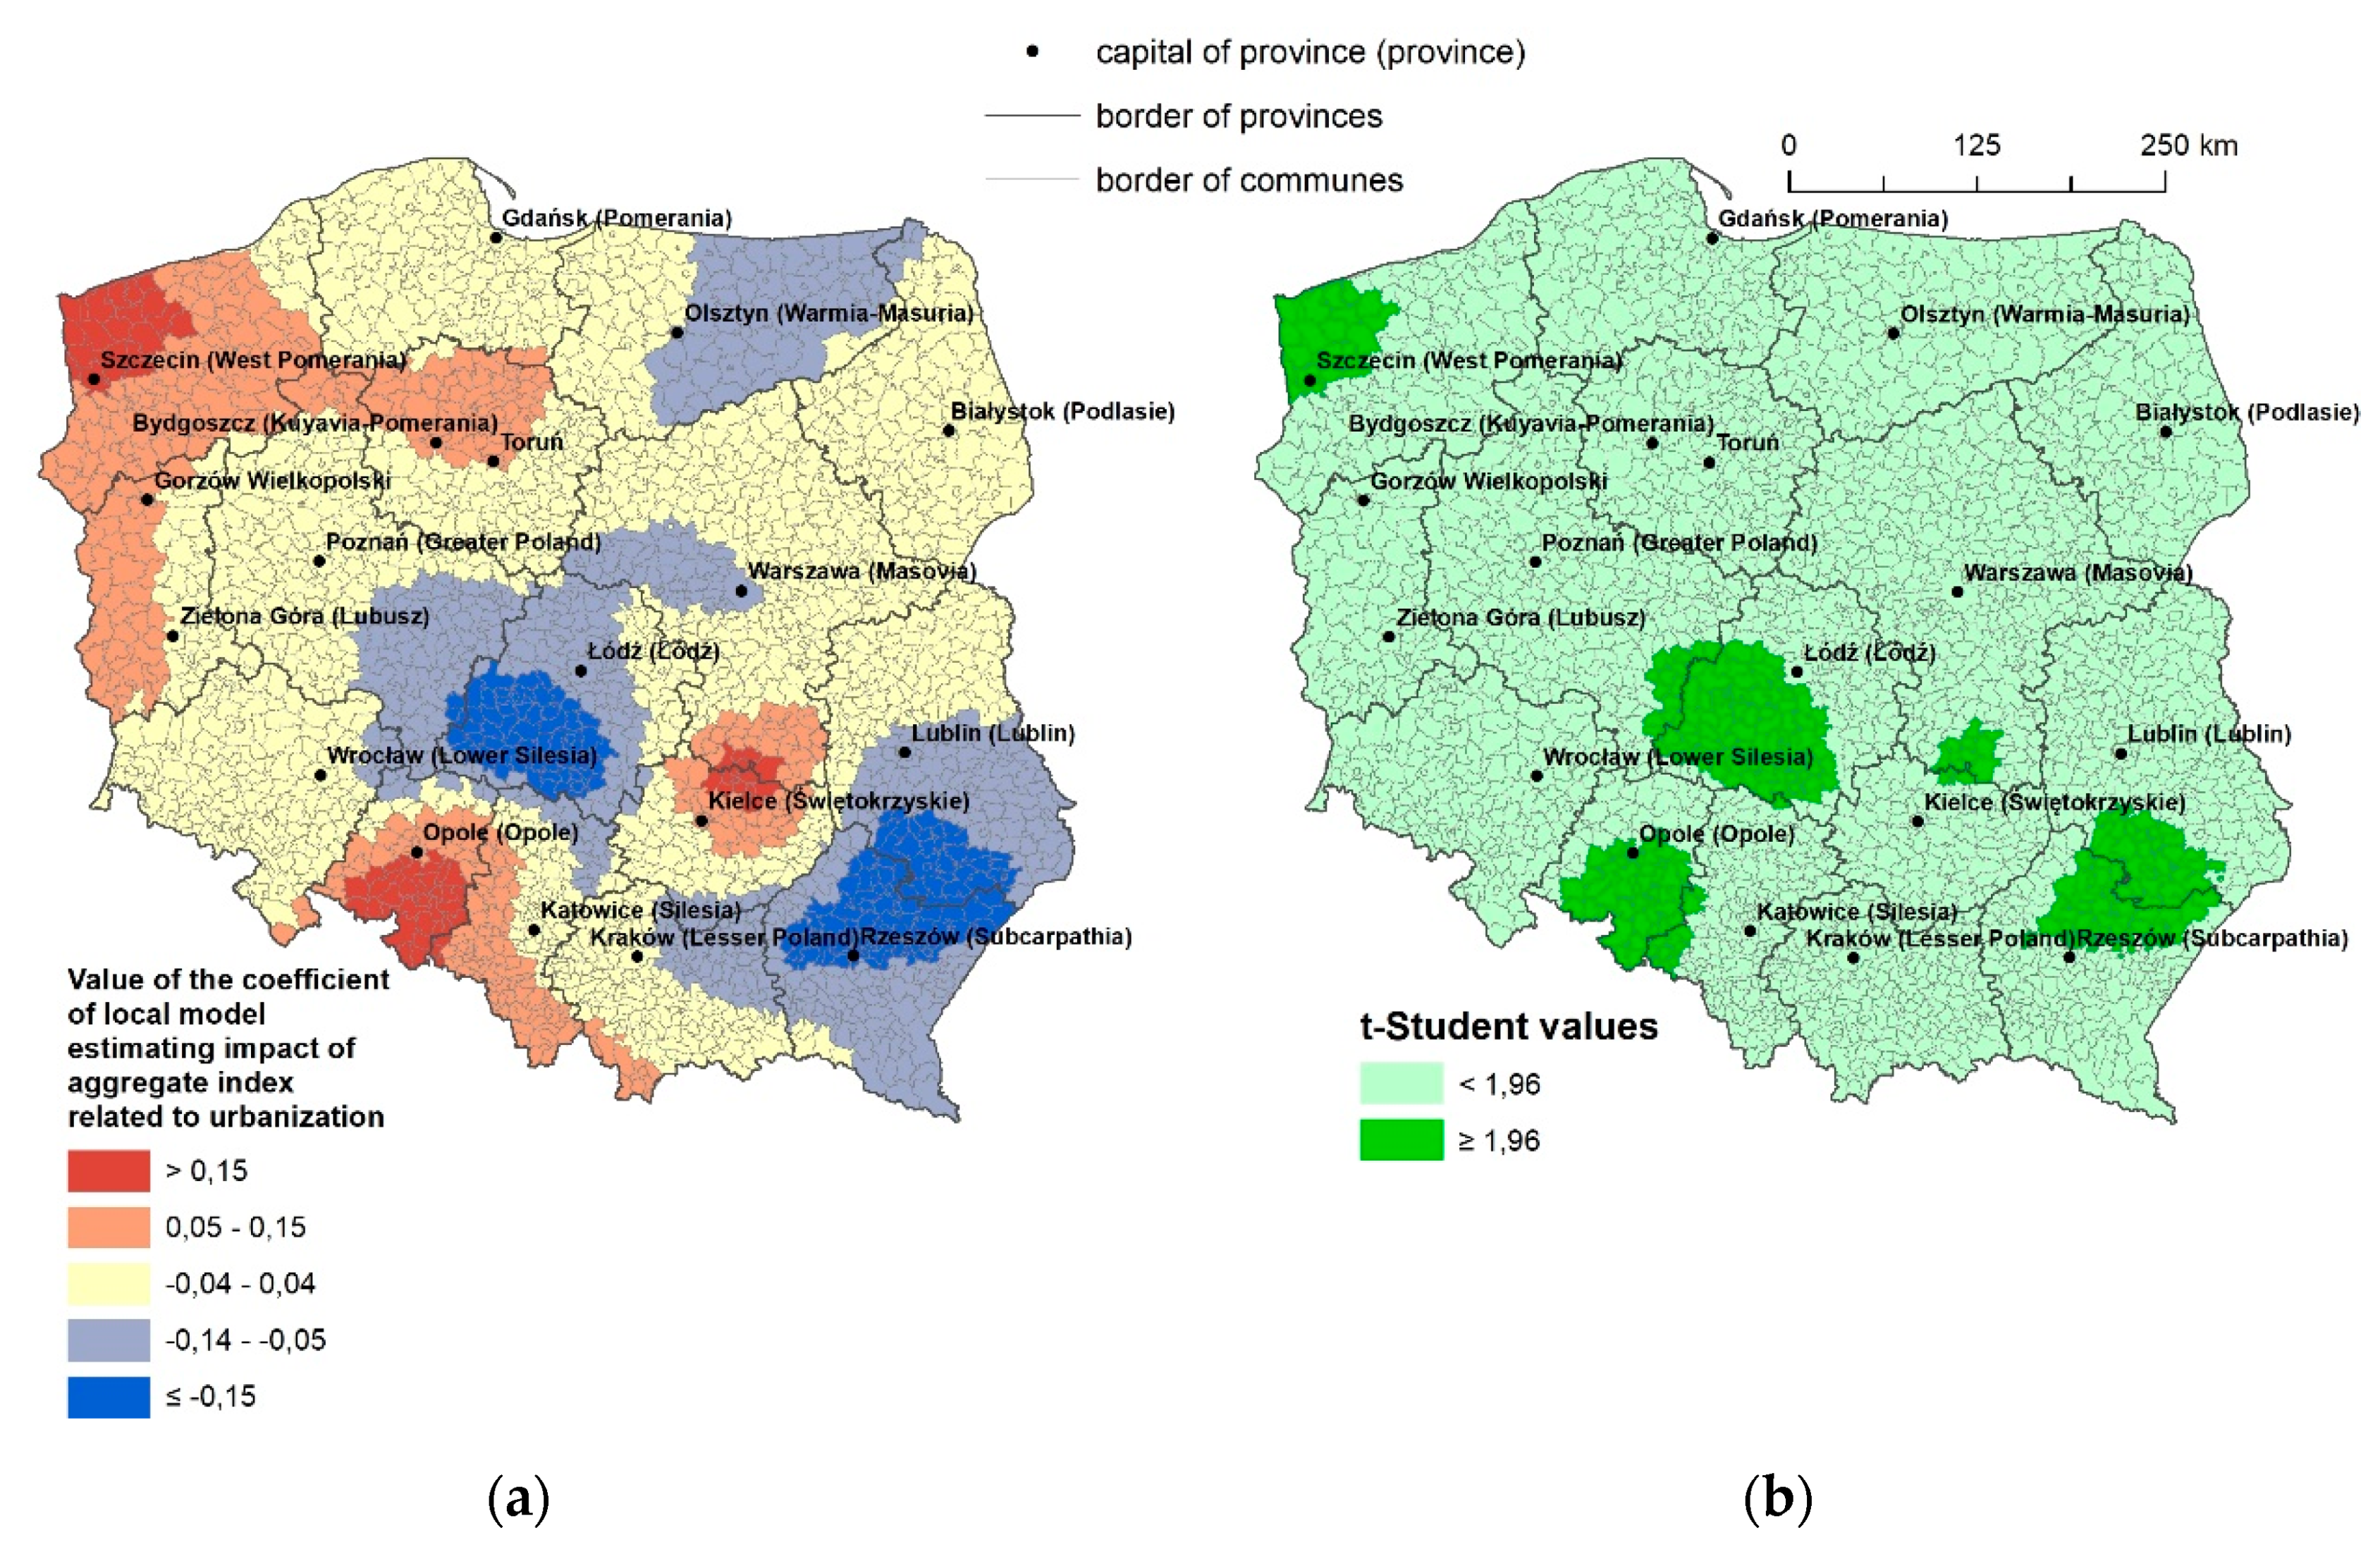
4.3. Determinants of Land Registry Errors

Urban performance, civic society development, education, and land ownership, as well as culture and quality of spatial planning, were introduced as aggregate indexes describing investigated social, demographic, and economic factors determining forest classification errors in the land registry of Poland. The descriptive statistics and global impact of the mentioned independent variables are presented in Table 2. It must be underlined that the global model estimated by applying OLS regression does not explain volatility of forest classification errors: The coefficient of determination was equal to 2.4%. However, all predictors but urbanization processes were recognized as statistically significant. Regarding the goal of this research, it must be underlined that spatially varying value and direction of impact of considered determinants of forest classification errors confirmed OLS as a completely ineffective method.
When analyzing models estimating the impact of particular factors (urbanization processes, civic society development, education, land ownership, and culture and quality of spatial planning) on the variable referring to forest classification errors, the main focus needs to be on the areas where the discrepancies between the land registry records and actual state identified by remote sensing techniques application are the largest. This means that both LL and HH clusters of FORESTCE variable need to be investigated with particular attention. Additionally, the greatest emphasis should be placed on areas where impact of particular factors is recognized as most significant. This means that t-Student values calculated for local coefficients describing impact of each separately discussed factor are expected to be equal or higher than 1.96.
A significant relation between urbanization processes and occurrence of forest classification errors was diagnosed in a few areas in Poland (see Figure 7). However, only in the Lublin province, the negative impact of urbanization corresponds to the spatial concentration of areas characterized by forest cover overestimated in the land registry. This is the only region where hypothesis H1 was confirmed. When considering this peripheral, relatively less developed region of Poland, it must be stated that the more intensive urbanization processes are, the bigger difference between actual forest cover and reported one occurs. It should be emphasized that in less developed areas, local development policy stimulating urbanization processes does not respect land use planning. Actual deforestation carried out for the purposes of, e.g., developmental investment projects and initiatives, is not reflected in the land registry.
The negative and significant impact of civic society development on the variable describing discrepancy between forest classification based on remote sensing techniques and forest cover reported in the land registry is evidenced in large areas in southeast and northeast part of Poland (see Figure 8). Moreover, in many border communes concentrated in the mentioned areas, the actual forest cover significantly exceeds the value reported in the land registry. This is contrary to hypothesis H2 and means that local civic societies are organized in opposition to state principles and institutions, including the land registry of Poland. Thus, the problem of inconsistencies in the development of borderland communities should be emphasized. It must be underlined that the land and building registry system should be re-engineered to better serve the needs of users, including citizens. As Williamson et al. [85] suggested, engagement of the society and good governance in decision-making and implementation is crucial. This requires building the necessary capacity in individuals, organizations, institutions and wider society so that they can perform their functions effectively, efficiently and sustainably. To provide spatial integrity of the cadaster and identification of every land parcel, it should be updated on a regular basis. In addition, a cadaster should ideally include all land in a jurisdiction: Public, private, communal, and open space.
The significant relation between education and land registry errors is evidenced in a strip covering the provinces of Lesser Poland, Silesia, and Łódż (see Figure 9). However, hypothesis H3, related to the impact of education level of the society on forest classification errors in the land registry, of Poland was confirmed only in the northeast part of the metropolitan area of Kraków in the Lesser Poland province. In the mentioned area, forest cover is significantly overestimated in the land registry. However, the increase of the education level of the society enables better understanding of the land registry importance. In consequence, it reduces the difference between actual and evidenced forest cover. It can be concluded that the northeast part of the metropolitan area of Kraków is the only region in Poland where increasing education level of the society protects urbanized areas from overestimation of forest cover in the land registry. On the other hand, the results evidenced for the Silesia province and the south part of the Łódź province substantially contradict hypothesis H3. In these areas, the higher the education level of the society is, the greater the overestimation of forest cover in the land registry. Some indirect influence of education on the difference between actual and evidenced forest cover was expected. Moderating role of urbanization processes might be the explanation. However, GWR application does not enable analysis of indirect effects of investigated factors. Thus, in-depth analysis of the impact of education on forest classification errors in the Silesia province and the south part of the Łódź province is demanded.
The influence of share of public forests managed by the State Forests on forest classification errors in the land registry of Poland is presented in Figure 10. It needs to be emphasized that hypothesis H4 was confirmed for both areas characterized by significantly overestimated and underestimated forest cover in the land registry. Within the areas where actual forest cover is less than the evidenced one, the State Forests’ policy and forest management was confirmed as a factor stimulating land registry update. The situation is evidenced in the Kuyavia-Pomerania and Pomerania provinces, as well as in small clusters of overestimated forest cover in the land registry detected in the West Pomerania province. Moreover, the Silesia province is the region where actual forest cover is larger than reported in the land registry. However, the investigated factor related to the land ownership was also confirmed as influencing the decrease of the difference between forest cover identified and evidenced. In contrary, the higher the percentage of forests managed by the State Forest in communes located on the western edge of the Białowieża Forest is, the bigger the differences between the land registration records and the actual state are. This confirms serious problems diagnosed in the eastern part of Poland, which the state-owned company managing forests have to face with.
The culture and quality of spatial planning was confirmed as the factor stimulating correction of the land registry data related to forest cover (see Figure 11). In particular, this is evidenced in both of the provinces of Kuyavia-Pomerania and Pomerania, where communes characterized by significant overestimated forest cover in the land registry are clustered. The mentioned provinces were identified as the areas where hypothesis H5 was confirmed. On the other hand, higher coverage by valid local spatial development plans does not protect all Polish communes against forest classification errors in the land registry. The problem is evidenced both in areas characterized by significantly underestimated (the metropolitan area of Warsaw, and mountain area on the border of the Silesia and Lesser Poland provinces), as well as overestimated (communes on the Polish-Ukrainian border) forest cover in the land registry. This also means that using coverage by valid local spatial development plans as a measure of culture and quality of spatial planning has serious limitations.

5. Conclusions

The goal of this paper relates to the social, demographic, and economic factors determining differences between forest identification based on remote sensing techniques and land registry. The combined application of the GWR method and local Moran’s I statistics allowed the identification of regions where urbanization processes, civic society development, education level of the society, land ownership, and culture and quality of spatial planning affect the differences between actual forest cover and evidenced in the land registry. Spatial patterns of mentioned relations were diagnosed in areas where forest cover is over- or underestimated in the land registry.
It was confirmed that in less developed areas, local development policy stimulating urbanization processes does not respect land use planning principles, including accuracy of land registry. The problem of inconsistencies in the development of borderland communities was confirmed as local civic societies are frequently organized in opposition to state principles and institutions, including the land registry. The metropolitan area of Kraków was evidenced as the territory where the education level of the society protects from a substantial overestimation of forest cover in the land registry. Issues related to the land registry quality diagnosed in the eastern part of Poland, mainly on the western edge of the Białowieża Forest, needs to be solved mainly by the state-owned company managing forests. Finally, higher coverage by valid local spatial development plans stimulates protection against forest classification errors in the land registry for a limited number for Polish communes.

Author Contributions

Conceptualization, M.A., K.L.-N., M.N. and T.N.; methodology, M.A., K.L.-N., M.N. and T.N.; software, M.A. and M.N.; validation, K.L.-N., M.N. and T.N.; formal analysis, T.N.; investigation, K.L.-N. and M.N.; data curation, M.A., M.B. and M.N.; writing—original draft preparation, M.A., M.B., K.L.-N., M.N. and T.N.; writing—review and editing, K.L.-N. and T.N.; visualization, M.A., M.N., K.L.-N. and T.N. All authors have read and agreed to the published version of the manuscript.

Funding

This research received no external funding.

Acknowledgments

We give here our special thanks to Małgorzata Orzechowska and Maria Wąchal (SoftwareMill) for the linguistic support.

Conflicts of Interest

The authors declare no conflict of interest.

References

  1. Boucher, Y.; Grondin, P.; Auger, I. Land use history (1840–2005) and physiography as determinants of southern boreal forests. Landsc. Ecol. 2014, 29, 437–450. [Google Scholar] [CrossRef] [Green Version]
  2. Pineda, J.N.B.; Bosque, S.J.; Gómez, D.M.; Franco, P.R. Exploring the driving forces behind deforestation in the state of Mexico (Mexico) using geographically weighted regression. Appl. Geogr. 2010, 30, 576–591. [Google Scholar] [CrossRef]
  3. Hu, X.; Wu, Z.; Wu, C.; Ye, L.; Lan, C.; Tang, K.; Xu, L.; Qiu, R. Effects of road network on diversiform forest cover changes in the highest coverage region in China: An analysis of sampling strategies. Sci. Total Environ. 2016, 565, 28–39. [Google Scholar] [CrossRef] [PubMed]
  4. Lossou, E.; Owusu-Prempeh, N.; Agyemang, G. Monitoring Land Cover changes in the tropical high forests using multi-temporal remote sensing and spatial analysis techniques. Remote Sens. Appl. Soc. Environ. 2019, 16, 100264. [Google Scholar] [CrossRef]
  5. Bhugeloo, A.; Peerbhay, K.; Ramdhani, S.; Sershen. Tracking indigenous forest cover within an urban matrix through land use analysis: The case of a rapidly developing African city. Remote Sens. Appl. Soc. Environ. 2019, 13, 328–336. [Google Scholar] [CrossRef]
  6. Gunggut, H.; Saufi, D.S.N.S.A.M.; Zaaba, Z.; Liu, M.S.-M. Where have All the Forests Gone? Deforestation in Land Below the Wind. Proced. Soc. Behav. Sci. 2014, 153, 363–369. [Google Scholar] [CrossRef] [Green Version]
  7. Singh, M. Evaluating the impact of future climate and forest cover change on the ability of Southeast (SE) Asia’s protected areas to provide coverage to the habitats of threatened avian species. Ecol. Indic. 2020, 114, 106307. [Google Scholar] [CrossRef]
  8. De Keersmaeker, L.; Onkelinx, T.; De Vos, B.; Rogiers, N.; Vandekerkhove, K.; Thomaes, A.; De Schrijver, A.; Hermy, M.; Verheyen, K. The analysis of spatio-temporal forest changes (1775–2000) in Flanders (northern Belgium) indicates habitat-specific levels of fragmentation and area loss. Landsc. Ecol. 2015, 30, 247–259. [Google Scholar] [CrossRef]
  9. Feranec, J.; Šuri, M.; Ot’ahel’, J.; Cebecauer, T.; Kolář, J.; Soukup, T.; Zdeňková, D.; Waszmuth, J.; Vâjdea, V.; Vîjdea, A.M.; et al. Inventory of major landscape changes in the Czech Republic, Hungary, Romania and Slovak Republic 1970s–1990s. ITC J. 2000, 2, 129–139. [Google Scholar] [CrossRef]
  10. Skaloš, J.; Engstová, B.; Trpáková, I.; Šantrůčková, M.; Podrázský, V. Long-Term changes in forest cover 1780–2007 in central Bohemia, Czech Republic. Eur. J. For. Res. 2012, 131, 871–884. [Google Scholar] [CrossRef]
  11. Wulf, M.; Sommer, M.; Schmidt, R. Forest cover changes in the Prignitz region (NE Germany) between 1790 and 1960 in relation to soils and other driving forces. Landsc. Ecol. 2010, 25, 299–313. [Google Scholar] [CrossRef]
  12. Jeon, S.B.; Olofsson, P.; Woodcock, C.E. Land use change in New England: A reversal of the forest transition. J. Land Use Sci. 2014, 9, 105–130. [Google Scholar] [CrossRef]
  13. Di Fazio, S.; Modica, G.; Zoccali, P. Evolution Trends of Land Use/Land Cover in a Mediterranean Forest Landscape in Italy BT—Computational Science and Its Applications—ICCSA 2011; Murgante, B., Gervasi, O., Iglesias, A., Taniar, D., Apduhan, B.O., Eds.; Springer: Berlin/Heidelberg, Germany, 2011; pp. 284–299. [Google Scholar]
  14. Puddu, G.; Falcucci, A.; Maiorano, L. Forest changes over a century in Sardinia: Implications for conservation in a Mediterranean hotspot. Agrofor. Syst. 2012, 85, 319–330. [Google Scholar] [CrossRef]
  15. Borowska-Stefańska, M.; Leśniewska-Napierała, K.; Wiśniewski, S. Land cover changes in Poland between 1990 and 2012. Geografie 2018, 123, 63–83. [Google Scholar] [CrossRef] [Green Version]
  16. Leśniewska-Napierała, K.; Nalej, M.; Napierała, T. The Impact of EU Grants Absorption on Land Cover Changes—The Case of Poland. Remote Sens. 2019, 11, 2359. [Google Scholar] [CrossRef] [Green Version]
  17. Kozak, J.; Estreguil, C.; Vogt, P. Forest cover and pattern changes in the Carpathians over the last decades. Eur. J. For. Res. 2007, 126, 77–90. [Google Scholar] [CrossRef]
  18. Kozak, J.; Estreguil, C.; Ostapowicz, K. European forest cover mapping with high resolution satellite data: The Carpathians case study. Int. J. Appl. Earth Obs. Geoinf. 2008, 10, 44–55. [Google Scholar] [CrossRef]
  19. Szymura, T.H.; Unajski, A.; Ruczakowska, A.M. Zmiany powierzchni lasów na obszarze Karkonoskiego Parku Narodowego w okresie 1747–1977 [Changes of forest cover in the Karkonosze National Park area in 1747–1977 period]. Opera Corcon. 2010, 47, 159–166. [Google Scholar]
  20. Gielarek, S.; Klich, D.; Antosiewicz, M. Zmiany powierzchni leśnej w Bieszczadach Zachodnich w XIX i XX wieku [Forest cover change in Western Bieszczady Mts. in 19 th and 20 th century]. Sylwan 2011, 155, 835–842. [Google Scholar]
  21. Nalej, M. Agricultural land cover changes in metropolitan areas of Poland for the period 1990–2012. Misc. Geogr. 2016, 20, 39–45. [Google Scholar] [CrossRef] [Green Version]
  22. Fiedeń, Ł. Changes in land use in the communes crossed by the A4 motorway in Poland. Land Use Policy 2019, 85, 397–406. [Google Scholar] [CrossRef]
  23. Pașca, A.; Năsui, D. The Use of CORINE Land Cover 2012 and Urban Atlas 2012 databases in agricultural spatial analysis. Case study: Cluj County, Romania. Res. J. Agric. Sci. 2016, 48, 314–322. [Google Scholar]
  24. Vanonckelen, S.; Rompaey, A. Van Spatiotemporal Analysis of the Controlling Factors of Forest Cover Change in the Romanian Carpathian Mountains. Mt. Res. Dev. 2015, 35, 338–350. [Google Scholar] [CrossRef]
  25. Gulinck, H.; Múgica, M.; De Lucio, J.V.; Atauri, J.A. A framework for comparative landscape analysis and evaluation based on land cover data, with an application in the Madrid region (Spain). Landsc. Urban Plan. 2001, 55, 257–270. [Google Scholar] [CrossRef]
  26. Teixido, A.L.; Quintanilla, L.G.; Carreño, F.; Gutiérrez, D. Impacts of changes in land use and fragmentation patterns on Atlantic coastal forests in northern Spain. J. Environ. Manag. 2010, 91, 879–886. [Google Scholar] [CrossRef]
  27. Valbuena-Carabaña, M.; de Heredia, U.L.; Fuentes-Utrilla, P.; González-Doncel, I.; Gil, L. Historical and recent changes in the Spanish forests: A socio-economic process. Rev. Palaeobot. Palynol. 2010, 162, 492–506. [Google Scholar] [CrossRef]
  28. Verburg, P.H.; Neumann, K.; Nol, L. Challenges in using land use and land cover data for global change studies. Glob. Chang. Biol. 2011, 17, 974–989. [Google Scholar] [CrossRef] [Green Version]
  29. Sylla, L.; Xiong, D.; Zhang, H.Y.; Bangoura, S.T. A GIS technology and method to assess environmental problems from land use/cover changes: Conakry, Coyah and Dubreka region case study. Egypt. J. Remote Sens. Sp. Sci. 2012, 15, 31–38. [Google Scholar] [CrossRef] [Green Version]
  30. Ciupa, T.; Suligowski, R.; Wałek, G. Zmiany w zasięgu lasów w Górach Świętokrzyskich w ostatnich 200 latach [Changes in forest coverage of the Holy Cross Mountains during last 200 years]. Eduk. Biol. Sr. 2016, 4, 16–23. [Google Scholar]
  31. Schaefer, M.; Thinh, N.X. Evaluation of Land Cover Change and Agricultural Protection Sites: A GIS and Remote Sensing Approach for Ho Chi Minh City, Vietnam. Heliyon 2019, 5, e01773. [Google Scholar] [CrossRef] [Green Version]
  32. Straume, K. The social construction of a land cover map and its implications for Geographical Information Systems (GIS) as a Management Tool. Land Use Policy 2014, 39, 44–53. [Google Scholar] [CrossRef]
  33. Liu, Z.; Zhang, T.; Yu, J.; Zhou, L. Determinants of rural households’ afforestation program participation: Evidence from China’s Ningxia and Sichuan provinces. Glob. Ecol. Conserv. 2019, 17, 1–14. [Google Scholar] [CrossRef]
  34. Patra, S.; Sahoo, S.; Mishra, P.; Mahapatra, S.C. Impacts of urbanization on land use /cover changes and its probable implications on local climate and groundwater level. J. Urban Manag. 2018, 7, 70–84. [Google Scholar] [CrossRef]
  35. Śleszyński, P.; Gibas, P.; Sudra, P. The Problem of Mismatch between the CORINE Land Cover Data Classification and the Development of Settlement in Poland. Remote Sens. 2020, 12, 2253. [Google Scholar] [CrossRef]
  36. Ünal, H.E.; Birben, Ü.; Bolat, F. Rural population mobility, deforestation, and urbanization: Case of Turkey. Environ. Monit. Assess. 2019, 191, 21. [Google Scholar] [CrossRef]
  37. Alig, R. Urbanization in the US: Land use trends, impacts on forest area, projections, and policy considerations. J. Resour. Energy Dev. 2010, 7, 35–60. [Google Scholar] [CrossRef]
  38. Cui, N.; Feng, C.-C.; Wang, D.; Li, J.; Guo, L. The Effects of Rapid Urbanization on Forest Landscape Connectivity in Zhuhai City, China. Sustainability 2018, 10, 3381. [Google Scholar] [CrossRef] [Green Version]
  39. Sejati, A.W.; Buchori, I.; Rudiarto, I. The Impact of Urbanization to Forest Degradation in Metropolitan Semarang: A Preliminary Study. IOP Conf. Ser. Earth Environ. Sci. 2018, 123, 012011. [Google Scholar] [CrossRef]
  40. De Clercq, E.M.; Clement, L.; De Wulf, R.R. Monte Carlo simulation of false change in the overlay of misregistered forest vector maps. Landsc. Urban Plan. 2009, 91, 36–45. [Google Scholar] [CrossRef]
  41. Seebach, L.; Strobl, P.; Vogt, P.; Mehl, W.; San-Miguel-Ayanz, J. Enhancing post-classification change detection through morphological post-processing—A sensitivity analysis. Int. J. Remote Sens. 2013, 34, 7145–7162. [Google Scholar] [CrossRef]
  42. Chmielewski, J. Problemy rozpraszania się zabudowy na obszarze metropolitalnym Warszawy [Problems of urban sprawl in the Warsaw metropolitan area]. Urbanista 2005, 7, 52–62. [Google Scholar]
  43. Makowska-Iskierka, M. Procesy Urbanizacyjne na Terenach Turystyczno-Wypoczynkowych Strefy Podmiejskiej Łodzi [The Urbanization Processes in the Tourist Destinations. Example of the Urban Fringe Zone of Łódź]; Łódzkie Towarzystwo Naukowe: Łódź, Poland, 2011. [Google Scholar]
  44. Janeczko, E.; Budnicka-Kosior, J.; Dąbrowski, R. The urbanisation processes and forest landscape on the example of the north part of the Mazowiecki Landscape Park (MPK). Miškininkystė ir Kraštotvarka. For. Landsc. Manag. 2017, 1, 35–40. [Google Scholar]
  45. Piussi, P. Expansion of European mountain forests. In Forests in Sustainable Mountain Development: A State of Knowledge Report for 2000; IUFRO Research Series 5; Price, M.F., Butt, N., Eds.; CABI Publishing: Wallingford, NY, USA, 2000; pp. 19–25. [Google Scholar]
  46. Gray, J.; Lämmerhirt, D. Data and the city—How can public data infrastructures change lives in urban regions? SSRN Electron. J. 2019. [Google Scholar] [CrossRef]
  47. McDougall, K. A Local-State Government Spatial Data Sharing Partnership Model to Facilitate Sdi Development; University of Melbourne: Victoria, Australia, 2006. [Google Scholar]
  48. Rajabifard, A.; Williamson, I.P. Spatial Data Infrastructures: Concept, SDI Hierarchy and Future Directions. In Proceedings of the Geomatics’ 80 Conference, Teheran, Iran, 29 April–2 May 2001; Available online: https://minerva-access.unimelb.edu.au/handle/11343/33897 (accessed on 18 June 2020).
  49. Bernhard, M. Civil Society after the First Transition: Dilemmas of Post-communist Democratization in Poland and Beyond. Communist Post Communist Stud. 1996, 29, 309–330. [Google Scholar] [CrossRef]
  50. Radzik-Maruszak, K.; Mieczkowska-Czerniak, K. From indifference to protest: Citizen activity at the local level in Poland. Ann. UMCS Politol. 2013, 20, 151–169. [Google Scholar]
  51. Letki, N. Socialization for participation? Trust, membership, and democratization in east-central Europe. Polit. Res. Q. 2004, 57, 665–679. [Google Scholar] [CrossRef]
  52. Kikosicka, K. Partycypacja społeczności lokalnej w planowaniu przestrzennym (przykład gminy Dąbrowice) [Local community participation in spatial planning (example municipalities Dąbrowice)]. Acta Univ. Lodz. Folia Geogr. Socio Oecon. 2014, 17, 97–113. [Google Scholar]
  53. Leśniewska-Napierała, K.; Napierała, T. Participatory budgeting: Creator or creation of a better place? Evidence from rural Poland. Bull. Geogr. Socio Econ. Ser. 2020, 48, 65–81. [Google Scholar] [CrossRef]
  54. Rymarczyk, E.; Parzych, P.; Szabat-Precikowska, A. Problematyka funkcjonowania ewidencji gruntów i budynków z punktu widzenia organu ją prowadzącego [The issue of the functioning land and buildings registration from the conducting perspective]. Infrastrukt. Ekol. Teren. Wiej. 2012, 1, 85–96. [Google Scholar]
  55. Wolny, B. Wybrane problemy aktualizacji danych ewidencji gruntów i budynków [Selected issues concerning updating of the register of lands and buildings]. Prz. Geod. 2005, 77, 14–17. [Google Scholar]
  56. Noszczyk, T.; Hernik, J. Potrzeba czynnego prowadzenia ewidencji gruntów i budynków [The Necessity to Keep Land and Property Registers in an Active Manner]. Infrastruct. Ecol. Rural. Areas 2017, I, 229–241. [Google Scholar] [CrossRef]
  57. Steudler, D.; Williamson, I.P. Evaluation of national land administration system in Switzerland—Case study based on a management model. Surv. Rev. 2005, 38, 317–330. [Google Scholar] [CrossRef]
  58. Walzer, M. Toward a Global Civil Society; Berghahn Books: Oxford, NY, USA, 1998. [Google Scholar]
  59. Norris, P. The Worldwide Digital Divide: Information Poverty, the Internet and Development; Cambridge University Press: Cambridge, UK, 2000. [Google Scholar]
  60. Jackson, G.; Perez-Diaz, V.M. The Return of Civil Society: The Emergence of Democratic Spain; Harvard University Press: Cambridge, MA, USA, 1993. [Google Scholar]
  61. Seligman, A. The Idea of Civil Society; Free Press: New York, NY, USA, 1992. [Google Scholar]
  62. Siemiński, W. Cele i zasady partycypacji społecznej w planowaniu przestrzennym—Przegląd literatury [Public participation in spatial planning as an element of city policy]. Człow. Środowisko 2007, 40, 77–93. [Google Scholar]
  63. Kohler-Koch, B.; Quittkat, C. What is civil society and who represents civil society in the EU? Results of an online survey among civil society experts. Policy Soc. 2009, 28, 11–22. [Google Scholar] [CrossRef] [Green Version]
  64. Banks, N.; Hulme, D. The Role of NGOs and Civil Society in Development and Poverty Reduction. Brooks World Poverty Institute Working Paper. 2012, p. 171. Available online: https://ssrn.com/abstract=2072157 (accessed on 18 June 2020).
  65. Healey, P. Planning through debate: The communicative turn in planning theory. Town Plan. Rev. 1992, 63, 143–162. [Google Scholar] [CrossRef]
  66. Howe, J.; Langdon, C. Towards a Reflexive Planning Theory. Plan. Theory 2002, 1, 209–225. [Google Scholar] [CrossRef]
  67. Strzelecki, A. The Development of Participation Budget in the Civic Society of Kujawsko-Pomorskie Voivodship. Law Adm. Post Soviet Eur. 2018, I, 52–63. [Google Scholar] [CrossRef] [Green Version]
  68. Leśniewska-Napierała, K. Budżet partycypacyjny jako narzędzie finansowania inwestycji w Łodzi [Participatory budget as a tool for financing investments in Łódź]. Stud. Miej. 2017, 25, 107–119. [Google Scholar] [CrossRef]
  69. Pietraszko-Furmanek, I. Partycypacja Społeczna w Środowiskach Lokalnych [Public Participation in Local Communities]; Krakowskie Towarzystwo Edukacyjne: Krakow, Poland, 2012; ISBN 9788375712605. [Google Scholar]
  70. Wendt, J.A. Wymiar Przestrzenny Struktur i Aktywności Społeczeństwa Obywatelskiego w Polsce [Spatial Aspect of the Structures and Activities of Civil Society in Poland]; IGiPZ PAN: Warsaw, Poland, 2007. [Google Scholar]
  71. Tasaki, T.; Kameyama, Y. Sustainability Indicators: Are We Measuring What We Ought to Measure? Glob. Environ. Res. 2015, 19, 147–154. [Google Scholar]
  72. Putnam, R.D. Social Capital: Measurement and Consequences. Can. J. Policy Res. 2001, 2, 41–51. [Google Scholar]
  73. Balaceanu, C.; Apostol, D.; Penu, D. Sustainability and Social Justice. Proced. Soc. Behav. Sci. 2012, 62, 677–681. [Google Scholar] [CrossRef]
  74. Woolcock, M.; Narayan, D. Social Capital: Implications for Development Theory, Research, and Policy. World Bank Res. Obs. 2000, 15, 225–249. [Google Scholar] [CrossRef] [Green Version]
  75. Brodie, E.; Cowling, E.; Nissen, N.; Ellis Paine, A.; Jochum, V.; Warburton, D. Understanding Participation: A Literature Review; National Council for Voluntary Organisations: London, UK, 2009. [Google Scholar]
  76. Grabowska, M.; Szawiel, T. Budowanie Demokracji. Podziały Społeczne, Partie Polityczne i Społeczeństwo Obywatelskie w Postkomunistycznej Polsce [Building Democracy. Social Divisions, Political Parties and Civil Society in Post-Communist Poland]; PWN: Warsaw, Poland, 2003. [Google Scholar]
  77. Stewart, S.; Dollbaum, J.M. Civil society development in Russia and Ukraine: Diverging paths. Communist Post Communist Stud. 2017, 50, 207–220. [Google Scholar] [CrossRef]
  78. Gumkowska, M.; Herbst, J.; Huszcz, J. Społeczny Kontekst Rozwoju Ekonomii Społecznej w Polsce—Raport z Badania [Social Context of the Development of the Social Economy in Poland—Research Report]; Fundacja Inicjatyw Społeczno-Ekonomicznych: Warsaw, Poland, 2006. [Google Scholar]
  79. Czapiński, J.; Panek, T. Social Diagnosis 2003; Wyższa Szkoła Finansów i Zarządzania: Białystok, Poland, 2003. [Google Scholar]
  80. Kalaitzidakis, P.; Mamuneas, T.P.; Savvides, A.; Stengos, T. Measures of human capital and nonlinearities in economic growth. J. Econ. Growth 2001, 6, 229–254. [Google Scholar] [CrossRef]
  81. Janc, K.; Czapiewski, K. Wykształcenie czynnikiem wspierającym rozwój gospodarczy obszarów wiejskich [Education as a Factor Supporting the Economic Development of Rural Areas]. Stud. Obsz. Wiej. 2005, 8, 69–84. [Google Scholar]
  82. Brach, M.; Karaszkiewicz, W.; Olenderek, H. Nowa Koncepcja Określania Działki Ewidencyjnej dla Gruntów w Zarządzie PGL Lasy Państwowe [New Concept of Registered Parcel Determination for Areas in the Property of the State Forests National Forest Holding]. Sylwan 2015, 159, 883–892. [Google Scholar] [CrossRef]
  83. Łuczyński, R. Technologiczne i prawne aspekty wznawiania oraz ustalania przebiegu granic działek ewidencyjnych [Technological and legal aspects of marking out and delimitation of borders of lands parcels]. Acta Sci. Pol. Geod. Descr. Terr. 2009, 8, 23–38. [Google Scholar]
  84. Felcenloben, D. Granice działki ewidencyjnej desygnatem wiarygodności publicznej katastru nieruchomości—Propozycje zmiany obowiązującego modelu [Borders of a cadastral parcel as a qualifier of social reliability of a real estate cadastre—Proposals of modifications of. Prz. Geod. 2010, 82, 9–13. [Google Scholar]
  85. Williamson, I.P.; Enemark, S.; Wallace, J.; Rajabifard, A. Land Administration for Sustainable Development; Esri Press: New York, NY, USA, 2009. [Google Scholar]
  86. Ghimbasan, A.C.; Vorovencii, I. Situation of cadaster and land registry at european and national level. Stud. Univ. Vasil. Gold. Stiint. Ing. Agro Tur. 2017, 12, 27–32. [Google Scholar]
  87. Busko, M.; Meusz, A. Current status of real estate cadastre in Poland with reference to historical conditions of different regions of the country. Environ. Eng. Proc. Int. Conf. Environ. Eng. ICEE 2014, 9, 1–8. [Google Scholar]
  88. Bennett, R.; Rajabifard, A.; Williamson, I.; Wallace, J. On the need for national land administration infrastructures. Land Use Policy 2012, 29, 208–219. [Google Scholar] [CrossRef]
  89. Felcenloben, D. Kryteria oceny jakości danych i informacji, gromadzonych i udostępnianych z katastru nieruchomości [Criteria for assessing the quality of data and information collected and shared from the real estate cadastre]. Prz. Geod. 2011, 83, 11–17. [Google Scholar]
  90. Zwirowicz, K. Wybrane problemy ekonomiczno-techniczne wykorzystywania danych ewidencyjnych na potrzeby związane z użytkowaniem ziemi [Selected Economic and Technical Aspects of the Use of Cadastral Data for the Purpose of Land Use]. Stud. Mater. Tow. Nauk. Nieruchom. 2010, 18, 67–76. [Google Scholar]
  91. Felcenloben, D. Ocena Jakości Danych Ewidencyjnych Oraz Efektywności Funkcjonowania Katastru Nieruchomości [Assessment of Registration Data Quality and the Efficiency of Functioning of the Real Estate Cadastre]; University of Environmental and Life Science: Wrocław, Poland, 2015. [Google Scholar]
  92. Dz.U. 1989 nr 30 poz. 163, Ustawa z dnia 17 maja 1989 r. In Prawo Geodezyjne i Kartograficzne [Geodetic And Cartographic Law of 17 May 1989]; The President of the Council of Ministers: Warsaw, Poland, 1989.
  93. Dz.U. 2001 nr 38 poz. In 454, Rozporządzenie Ministra Rozwoju Regionalnego i Budownictwa z Dnia 29 Marca 2001 r. w Sprawie Ewidencji Gruntów i Budynków; The President of the Council of Ministers: Warsaw, Poland, 2001.
  94. Budkowski, S.; Litwin, U. Issue of quality and reliability of spatial records information in the context of data concerning boundary points. Geomat. Landmanag. Landsc. 2018, 3, 35–44. [Google Scholar] [CrossRef]
  95. Kussul, N.; Lavreniuk, M.; Skakun, S.; Shelestov, A. Deep Learning Classification of Land Cover and Crop Types Using Remote Sensing Data. IEEE Geosci. Remote Sens. Lett. 2017, 14, 778–782. [Google Scholar] [CrossRef]
  96. Kamilaris, A.; Prenafeta-Boldú, F.X. A review of the use of convolutional neural networks in agriculture. J. Agric. Sci. 2018, 156, 312–322. [Google Scholar] [CrossRef] [Green Version]
  97. Liu, C.; Zeng, D.; Wu, H.; Wang, Y.; Jia, S.; Xin, L. Urban Land Cover Classification of High-Resolution Aerial Imagery Using a Relation-Enhanced Multiscale Convolutional Network. Remote Sens. 2020, 12, 311. [Google Scholar] [CrossRef] [Green Version]
  98. Krysiak, S.; Papińska, E.; Majchrowska, A.; Adamiak, M.; Koziarkiewicz, M. Detecting Land Abandonment in Łódź Voivodeship Using Convolutional Neural Networks. Land 2020, 9, 82. [Google Scholar] [CrossRef] [Green Version]
  99. Hu, Y.; Zhang, Q.; Zhang, Y.; Yan, H. A Deep Convolution Neural Network Method for Land Cover Mapping: A Case Study of Qinhuangdao, China. Remote Sens. 2018, 10, 2053. [Google Scholar] [CrossRef] [Green Version]
  100. Ronneberger, O.; Fischer, P.; Brox, T. U-Net: Convolutional Networks for Biomedical Image Segmentation. arXiv 2015, arXiv:1505.04597v1. [Google Scholar]
  101. Lin, T.-Y.; Dollar, P.; Girshick, R.; He, K.; Hariharan, B.; Belongie, S. Feature Pyramid Networks for Object Detection. In Proceedings of the 2017 IEEE Conference on Computer Vision and Pattern Recognition (CVPR), Honolulu, HI, USA, 21–26 July 2017; pp. 936–944. [Google Scholar]
  102. Chaurasia, A.; Culurciello, E. LinkNet: Exploiting Encoder Representations for Efficient Semantic Segmentation. IEEE VCIP 2017. [Google Scholar] [CrossRef] [Green Version]
  103. Zhao, H.; Shi, J.; Qi, X.; Wang, X.; Jia, J. Pyramid Scene Parsing Network. IEEE CVPR 2017. [Google Scholar] [CrossRef] [Green Version]
  104. Mazzia, V.; Khaliq, A.; Chiaberge, M. Improvement in Land Cover and Crop Classification based on Temporal Features Learning from Sentinel-2 Data Using Recurrent—Convolutional Neural Network (R-CNN). Appl. Sci. 2020, 10, 238. [Google Scholar] [CrossRef] [Green Version]
  105. Dz.U. 1991 nr 101 poz. In 444, Ustawa z Dnia 28 Września 1991 r. o Lasach [Forest Act of 28 September 1991]; The President of the Council of Ministers: Warsaw, Poland, 1991.
  106. Rocznik Statystyczny Leśnictwa [Statistical Yearbook of Forestry]; Główny Urząd Statystyczny [Statistics Poland]: Warsaw, Poland, 2018.
  107. Dz.U. 2011 nr 279 poz. In 1642, Rozporządzenie MSWiA z Dnia 17 Listopada 2011 r. w Sprawie Bazy Danych Obiektów Topograficznych Oraz Bazy Danych Obiektów Ogólnogeograficznych, a Także Standardowych Opracowań Kartograficznych; The President of the Council of Ministers: Warsaw, Poland, 2011.
  108. Majewska, J. Inter-Regional agglomeration effects in tourism in Poland. Tour. Geogr. 2015, 17, 408–436. [Google Scholar] [CrossRef]
  109. Majewska, J.; Napierała, T.; Adamiak, M. Wykorzystanie nowych technologii i informacji do opisu przestrzeni turystycznej [Using New Information and Communication Technologies for the Description of Tourism Space]. Folia Tur. 2016, 41, 309–339. [Google Scholar]
  110. Saisana, M.; Tarantola, S. State-Of-The-Art Report on Current Methodologies and Practices for Composite Indicator Development; European Commission Joint Research Centre, Institute for the Protection and the Security of the Citizen Technological and Economic Risk Management Unit: Ispra, Italy, 2002. [Google Scholar]
  111. Brown, S.; Versace, V.L.; Laurenson, L.; Ierodiaconou, D.; Fawcett, J.; Salzman, S. Assessment of Spatiotemporal Varying Relationships Between Rainfall, Land Cover and Surface Water Area Using Geographically Weighted Regression. Environ. Model. Assess. 2012, 17, 241–254. [Google Scholar] [CrossRef]
  112. Gao, J.; Li, S. Detecting spatially non-stationary and scale-dependent relationships between urban landscape fragmentation and related factors using Geographically Weighted Regression. Appl. Geogr. 2011, 31, 292–302. [Google Scholar] [CrossRef]
  113. Shariff, N.M.; Gairola, S.; Talib, A. Modelling urban land use change using geographically weighted regression and the implications for sustainable environmental planning. In Proceedings of the Modelling for Environment’s Sake: Proceedings of the 5th Biennial Conference of the International Environmental Modelling and Software Society, iEMSs 2010, Ottawa, ON, Canada, 5–8 July 2010; Available online: https://scholarsarchive.byu.edu/cgi/viewcontent.cgi?article=2330&context=iemssconference (accessed on 18 June 2020).
  114. Taghipour Javi, S.; Malekmohammadi, B.; Mokhtari, H. Application of geographically weighted regression model to analysis of spatiotemporal varying relationships between groundwater quantity and land use changes (case study: Khanmirza Plain, Iran). Environ. Monit. Assess. 2014, 186, 3123–3138. [Google Scholar] [CrossRef]
  115. Huang, J.; Huang, Y.; Pontius, R.G.; Zhang, Z. Geographically weighted regression to measure spatial variations in correlations between water pollution versus land use in a coastal watershed. Ocean Coast. Manag. 2015, 103, 14–24. [Google Scholar] [CrossRef]
  116. Su, S.; Xiao, R.; Zhang, Y. Multi-Scale analysis of spatially varying relationships between agricultural landscape patterns and urbanization using geographically weighted regression. Appl. Geogr. 2012, 32, 360–375. [Google Scholar] [CrossRef]
  117. Li, C.; Li, F.; Wu, Z.; Cheng, J. Exploring spatially varying and scale-dependent relationships between soil contamination and landscape patterns using geographically weighted regression. Appl. Geogr. 2017, 82, 101–114. [Google Scholar] [CrossRef]
  118. Matthews, S.A.; Yang, T.C. Mapping the results of local statistics: Using geographically weighted regression. Demogr. Res. 2012, 26, 151–166. [Google Scholar] [CrossRef] [PubMed] [Green Version]
  119. Mennis, J. Mapping the results of geographically weighted regression. Cartogr. J. 2006, 43, 171–179. [Google Scholar] [CrossRef] [Green Version]
Figure 1. Methodological framework of the research on social, demographic, and economic determinants of forest classification errors in the land registry. Source: Own elaboration.
Remotesensing 12 02628 g001
Figure 2. Simplified U-Net architecture applied in the research. Source: Own elaboration. Simplified U-Net architecture is composed of three conv2D + dropout blocks. Originally authors used a network that had six such blocks.
Remotesensing 12 02628 g002
Figure 3. Example of image (a) and segmentation (b) map. Source: Own elaboration.
Remotesensing 12 02628 g003
Figure 4. Forest cover of Poland in 2018 based on supervised machine learning classification of Sentinel-2 satellite images. Source: Own elaboration.
Remotesensing 12 02628 g004
Figure 5. Forest classification errors in the land registry of Poland in 2018. Source: Own elaboration.
Remotesensing 12 02628 g005
Figure 6. Spatial clusters of forest classification errors in the land registry of Poland in 2018. Source: Own elaboration.
Remotesensing 12 02628 g006
Figure 7. Value (a) and significance (b) of impact of urbanization processes on difference between actual and evidenced forest cover in Poland, in 2018. Source: Own elaboration.
Remotesensing 12 02628 g007
Figure 8. Value (a) and significance (b) of impact of civic society development on difference between actual and evidenced forest cover in Poland, in 2018. Source: Own elaboration.
Remotesensing 12 02628 g008
Figure 9. Value (a) and significance (b) of impact of education on difference between actual and evidenced forest cover in Poland, in 2018. Source: Own elaboration.
Remotesensing 12 02628 g009
Figure 10. Value (a) and significance (b) of impact of land ownership on difference between actual and evidenced forest cover in Poland, in 2018. Source: Own elaboration.
Remotesensing 12 02628 g010
Figure 11. Value (a) and significance (b) of impact of quality and culture of spatial planning on difference between actual and evidenced forest cover in Poland, in 2018. Source: Own elaboration.
Remotesensing 12 02628 g011
Table 1. Variables and measures related to various contexts of errors in the land registry in Poland.
Variable (Abbreviation)HypothesisMeasureData Source [2018]
Urbanization processes (URBAN)H1
  • Population density
BDL
  • Number of buildings per 1 km2
BDOT
Civic society development (CIVIC)H2
  • Number of NGOs per 10,000 population
BDL
  • Number of club and artistic groups members operating per 10,000 population
BDL
  • Turnout in local government elections in 2018
PKW
Education (EDU)H3
  • Municipal expenditures on education per capita
BDL
  • Percentage of councilors with higher education in a commune
BDL
Land ownership (LDOWN)H4
  • Share of public forests managed by the State Forests
BDL
Culture and quality of spatial planning (SPPLAN)H5
  • Share of area covered by valid local spatial development plans
BDL
Source: Own elaboration. The following abbreviations describing data sources were used: BDL—Local Data Bank, BDOT—Database of Topographic Objects, PKW—State Electoral Commission in Poland.
Table 2. Descriptive statistics and coefficients of global model estimating impact of aggregate indexes related to urbanization processes, civic society development, education, land ownership, and quality and culture of spatial planning on difference between actual and evidenced forest cover in Poland, in 2018.
VariableAverageStandard DeviationMinimumMaximumCoefficientp-Value
FORESTCE103.484.1052.50128.44
Intercept103.703→0
URBAN4.245.070.0265.90–0.0040.843
CIVIC34.305.162.6968.13–0.0330.036
EDU26.6310.751.6773.330.033→0
LDOWN63.5230.570.00100.00–0.0050.080
SPPLAN35.9939.840.00100.000.010→0
Source: Own elaboration.

