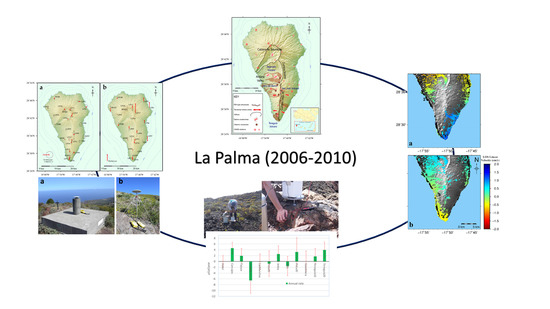
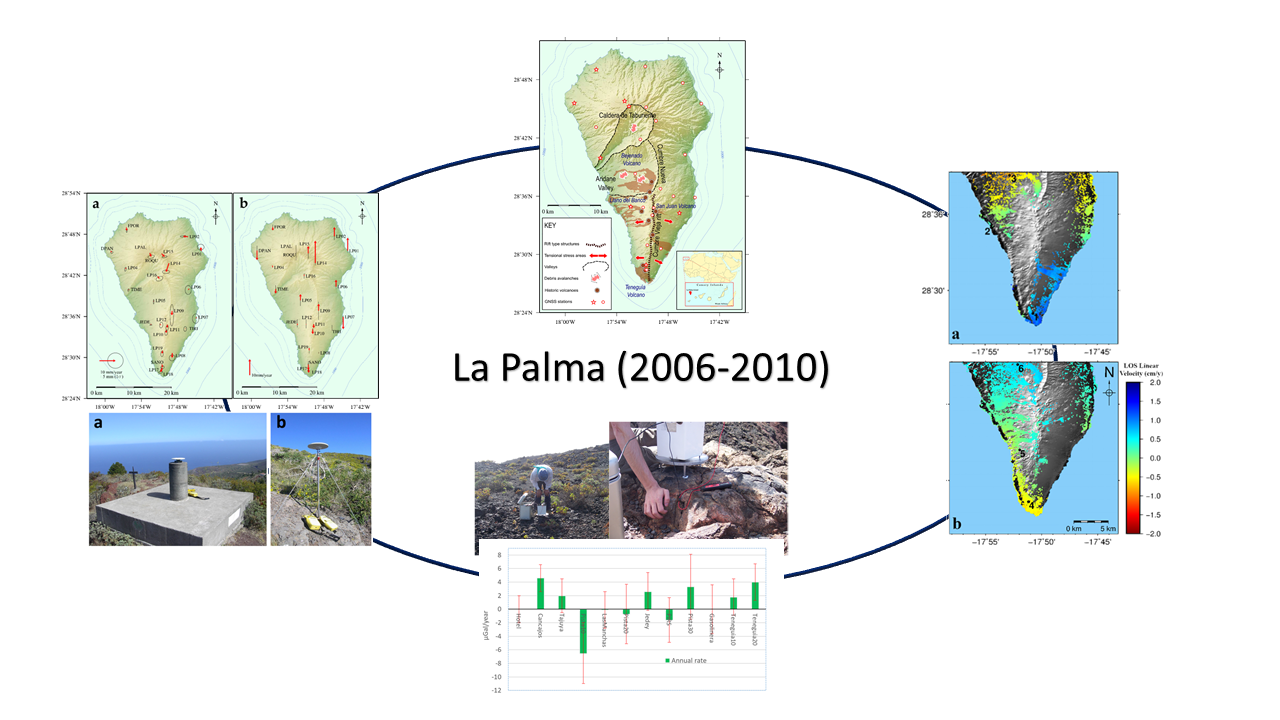
Geodetic Study of the 2006–2010 Ground Deformation in La Palma (Canary Islands): Observational Results

 ,
,  ,
,  ,
, 
 ,
,
Abstract
1. Introduction
2. Geodetic Observations and Results
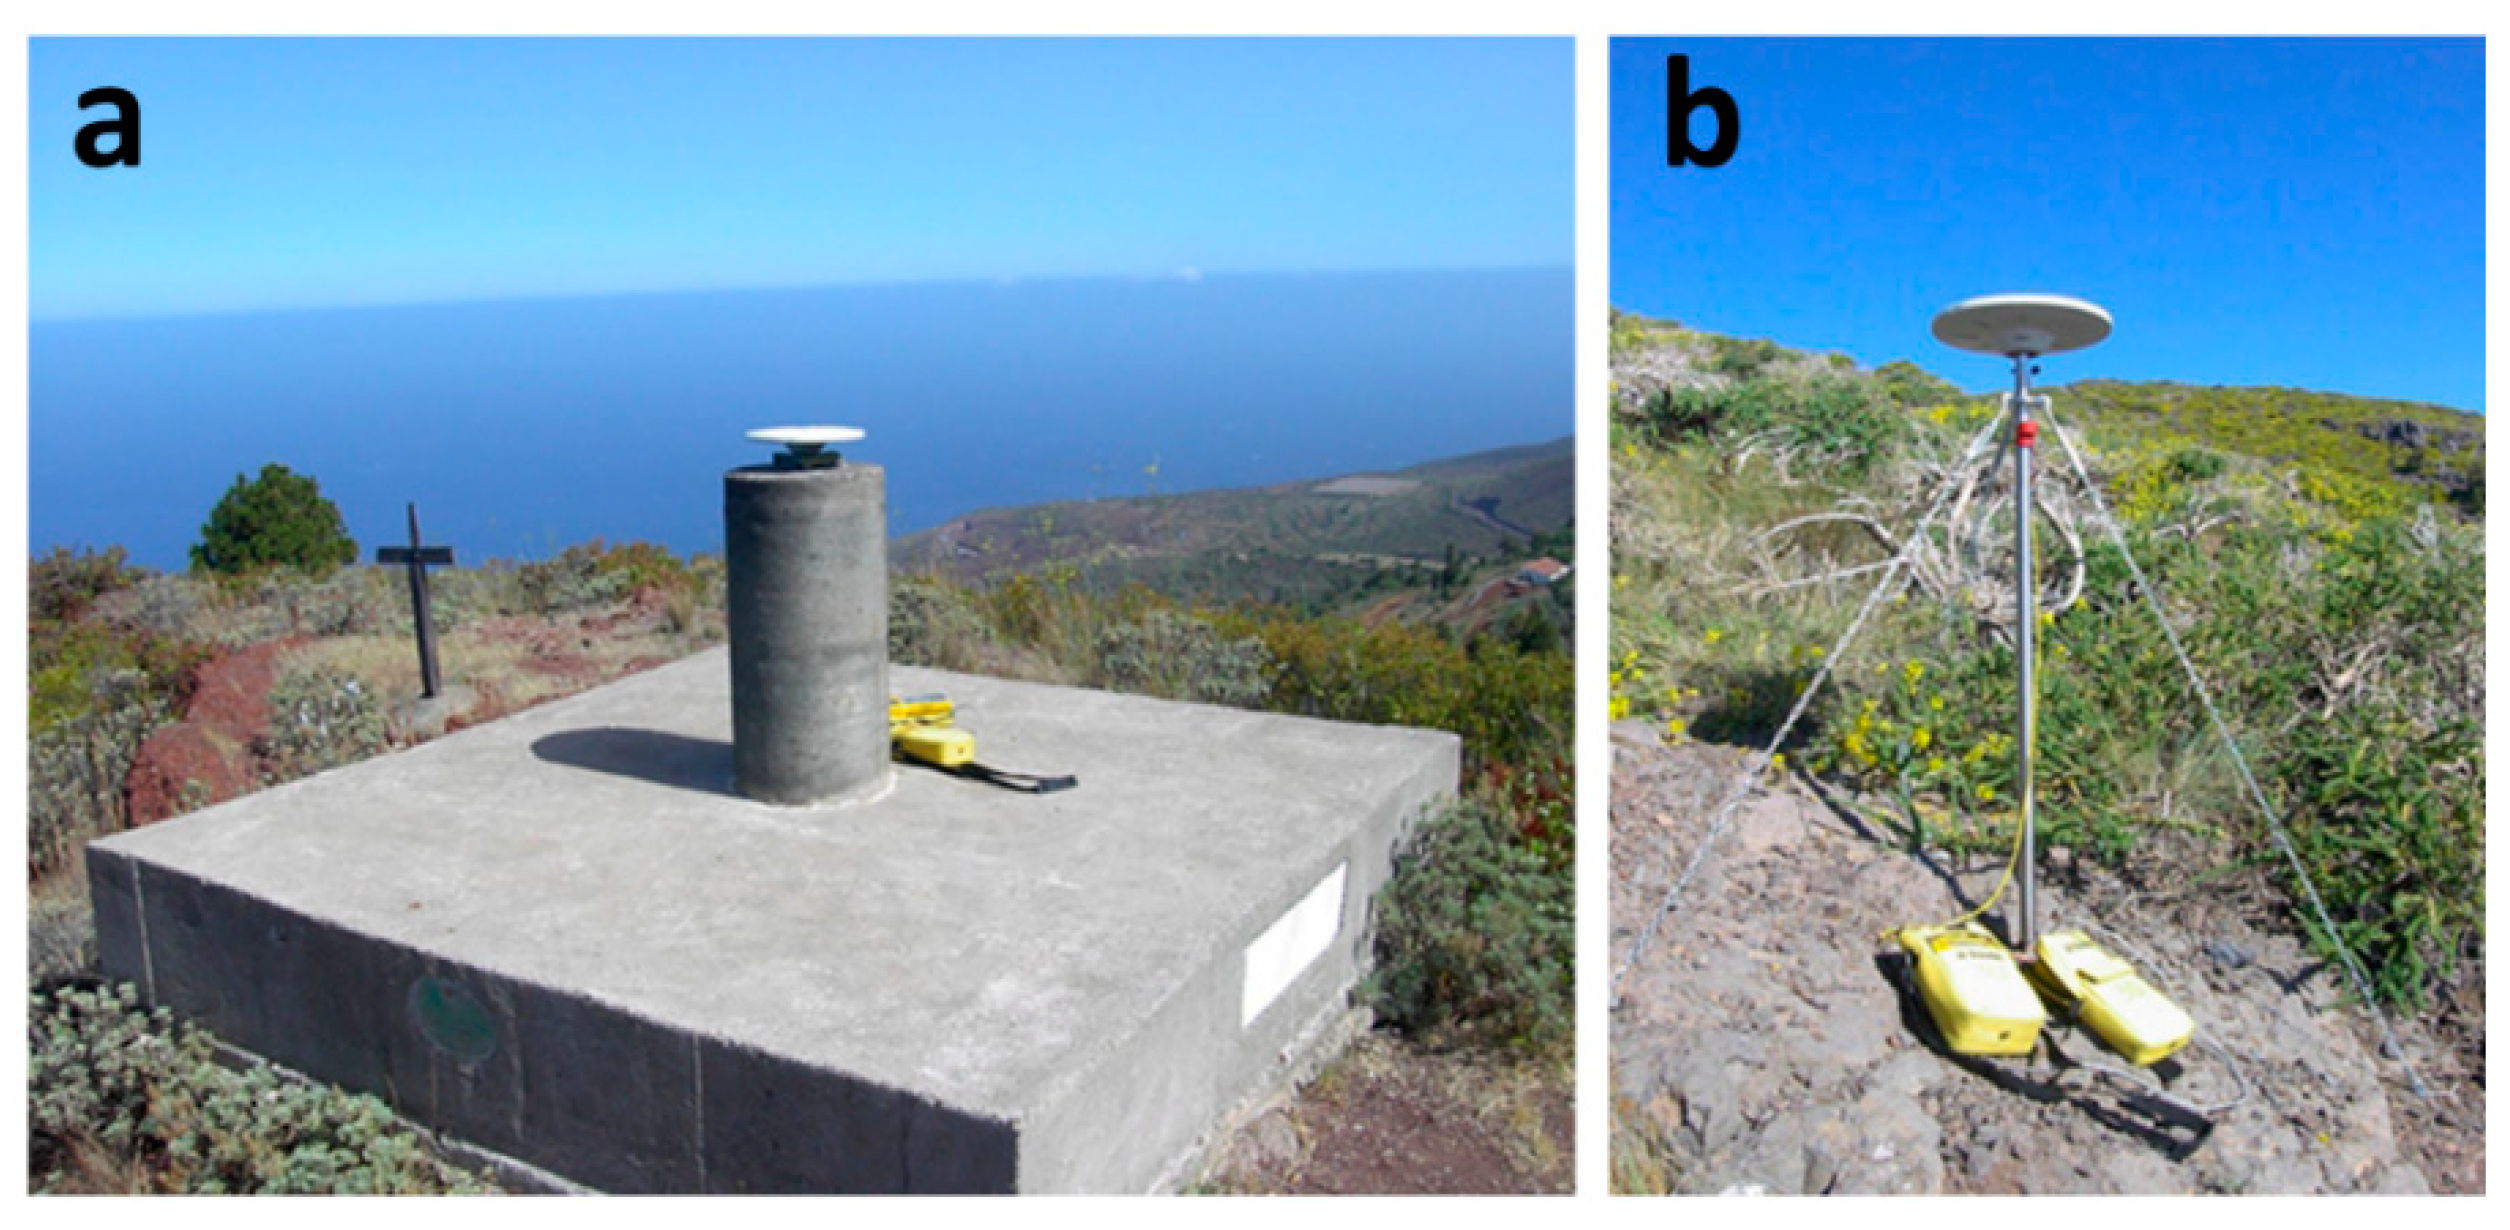
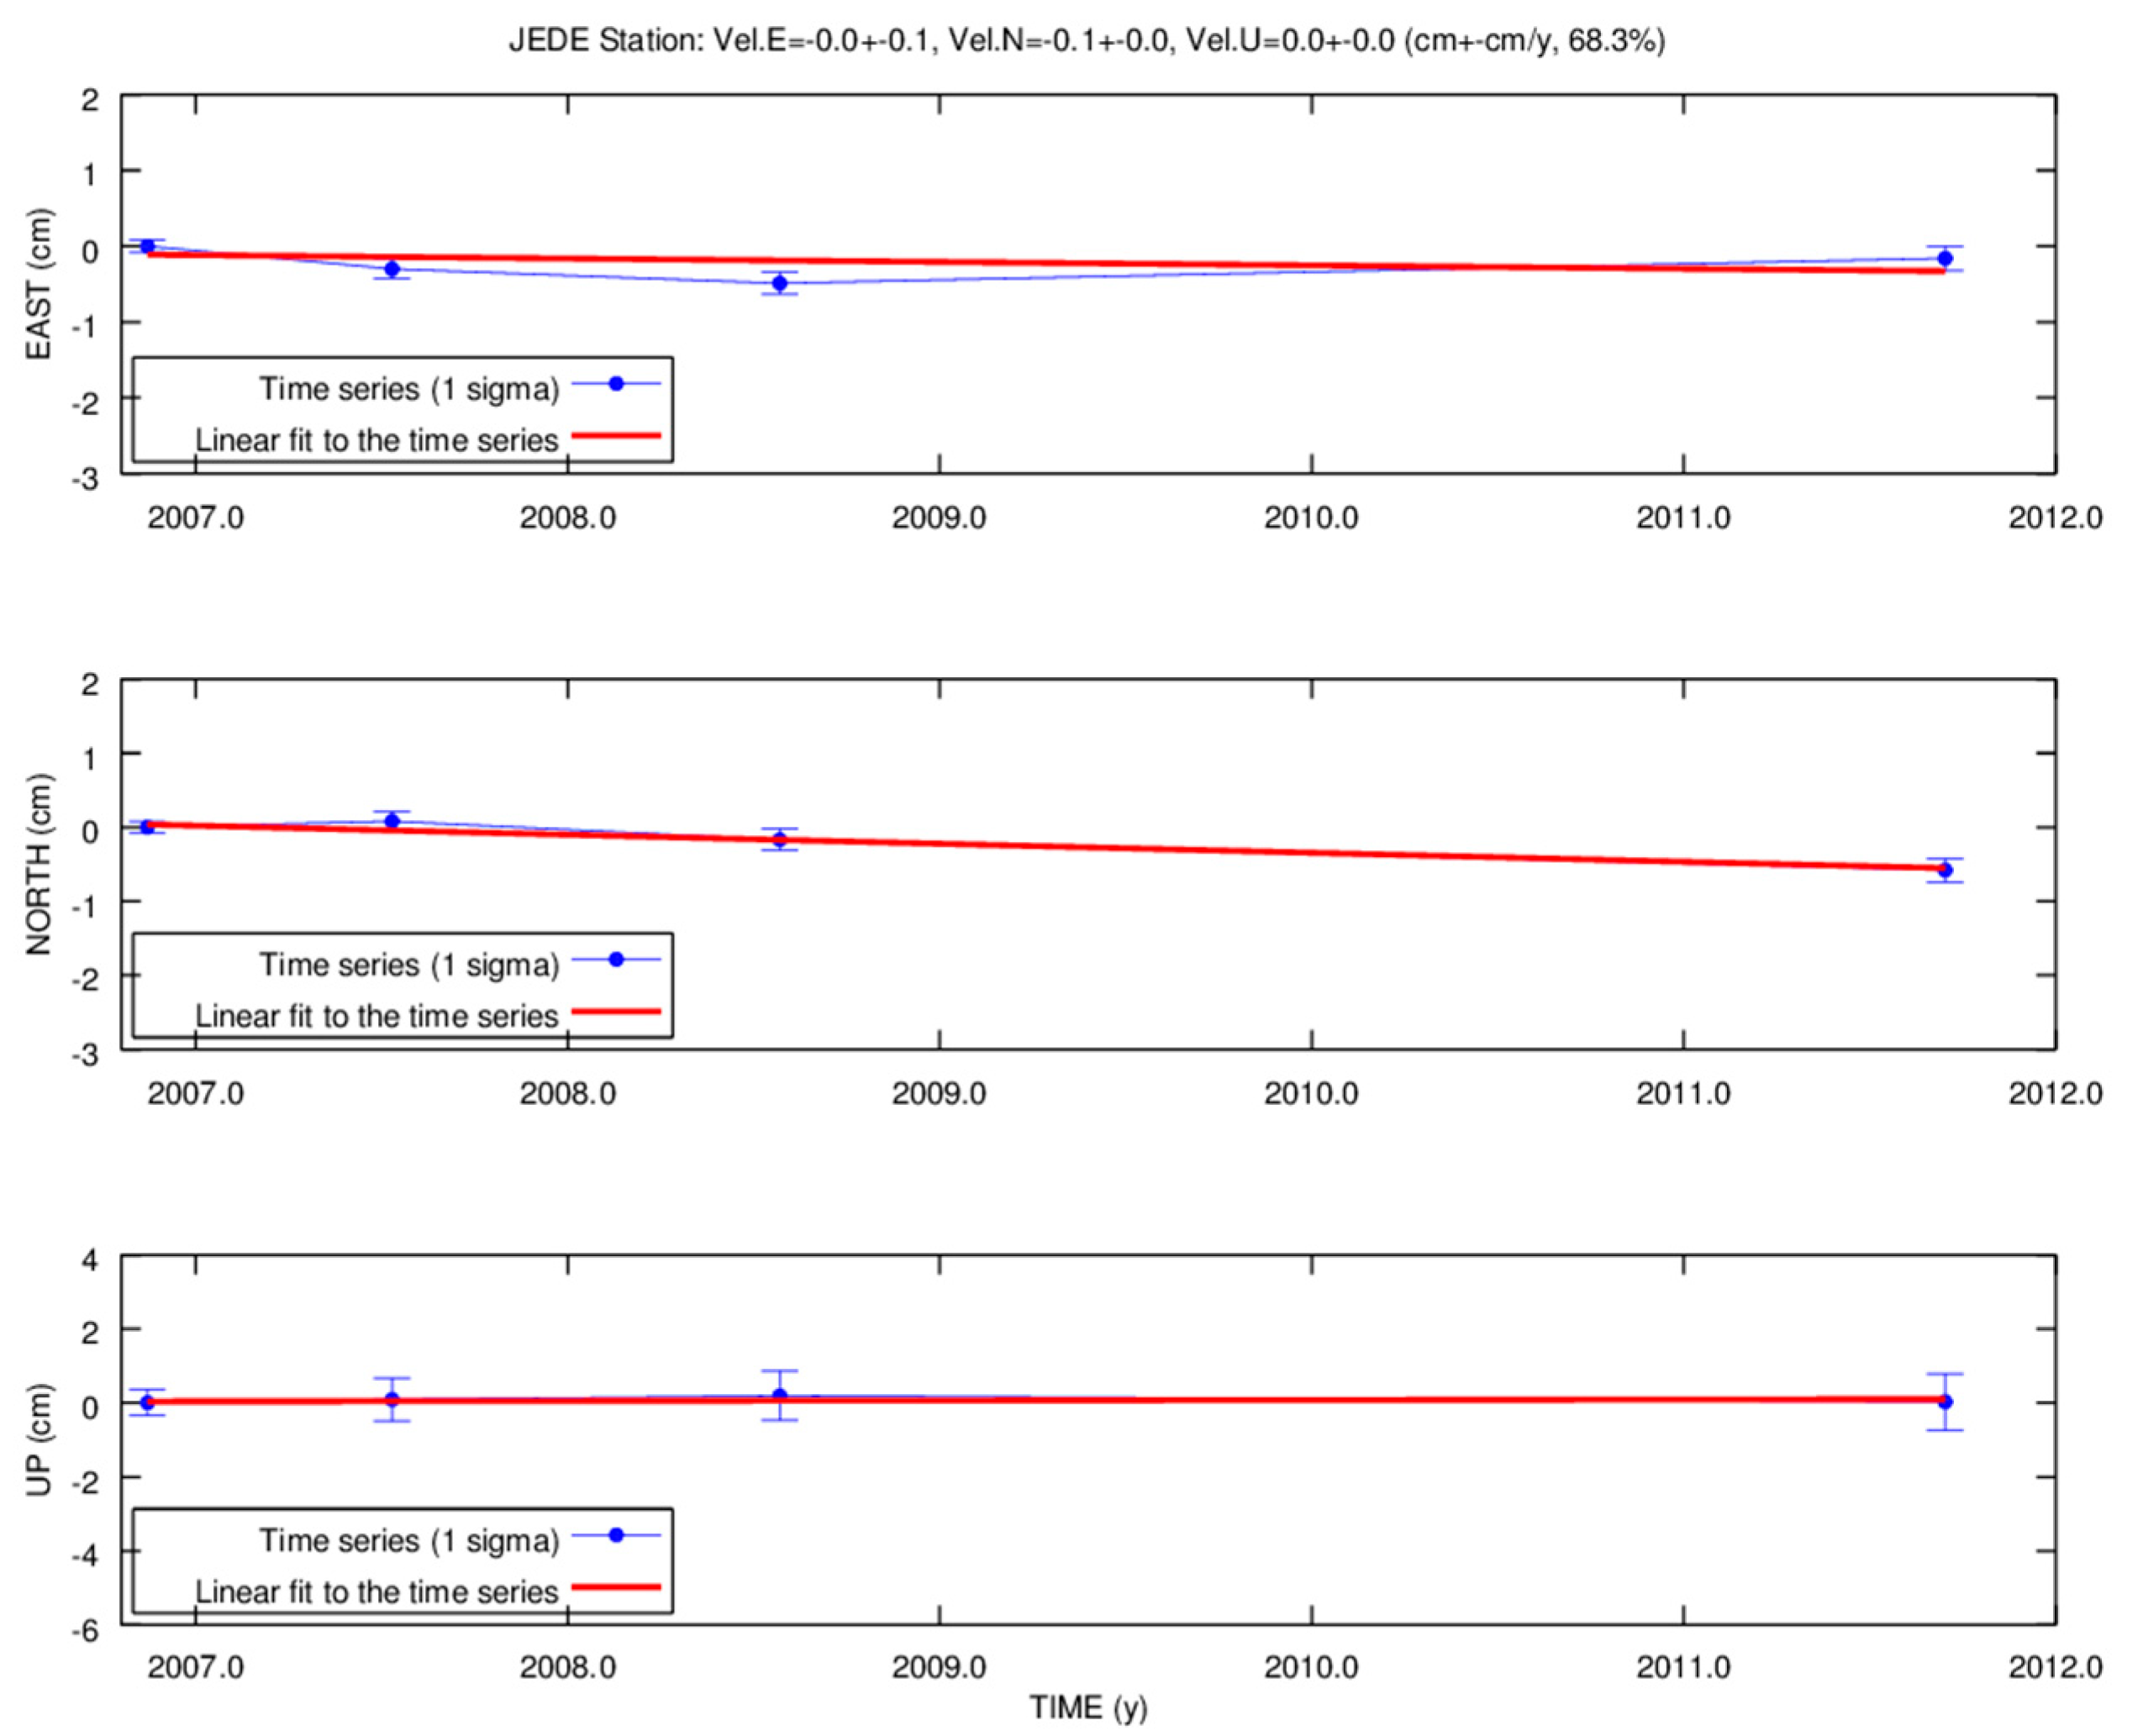
2.1. GNSS
2.2. A-DInSAR
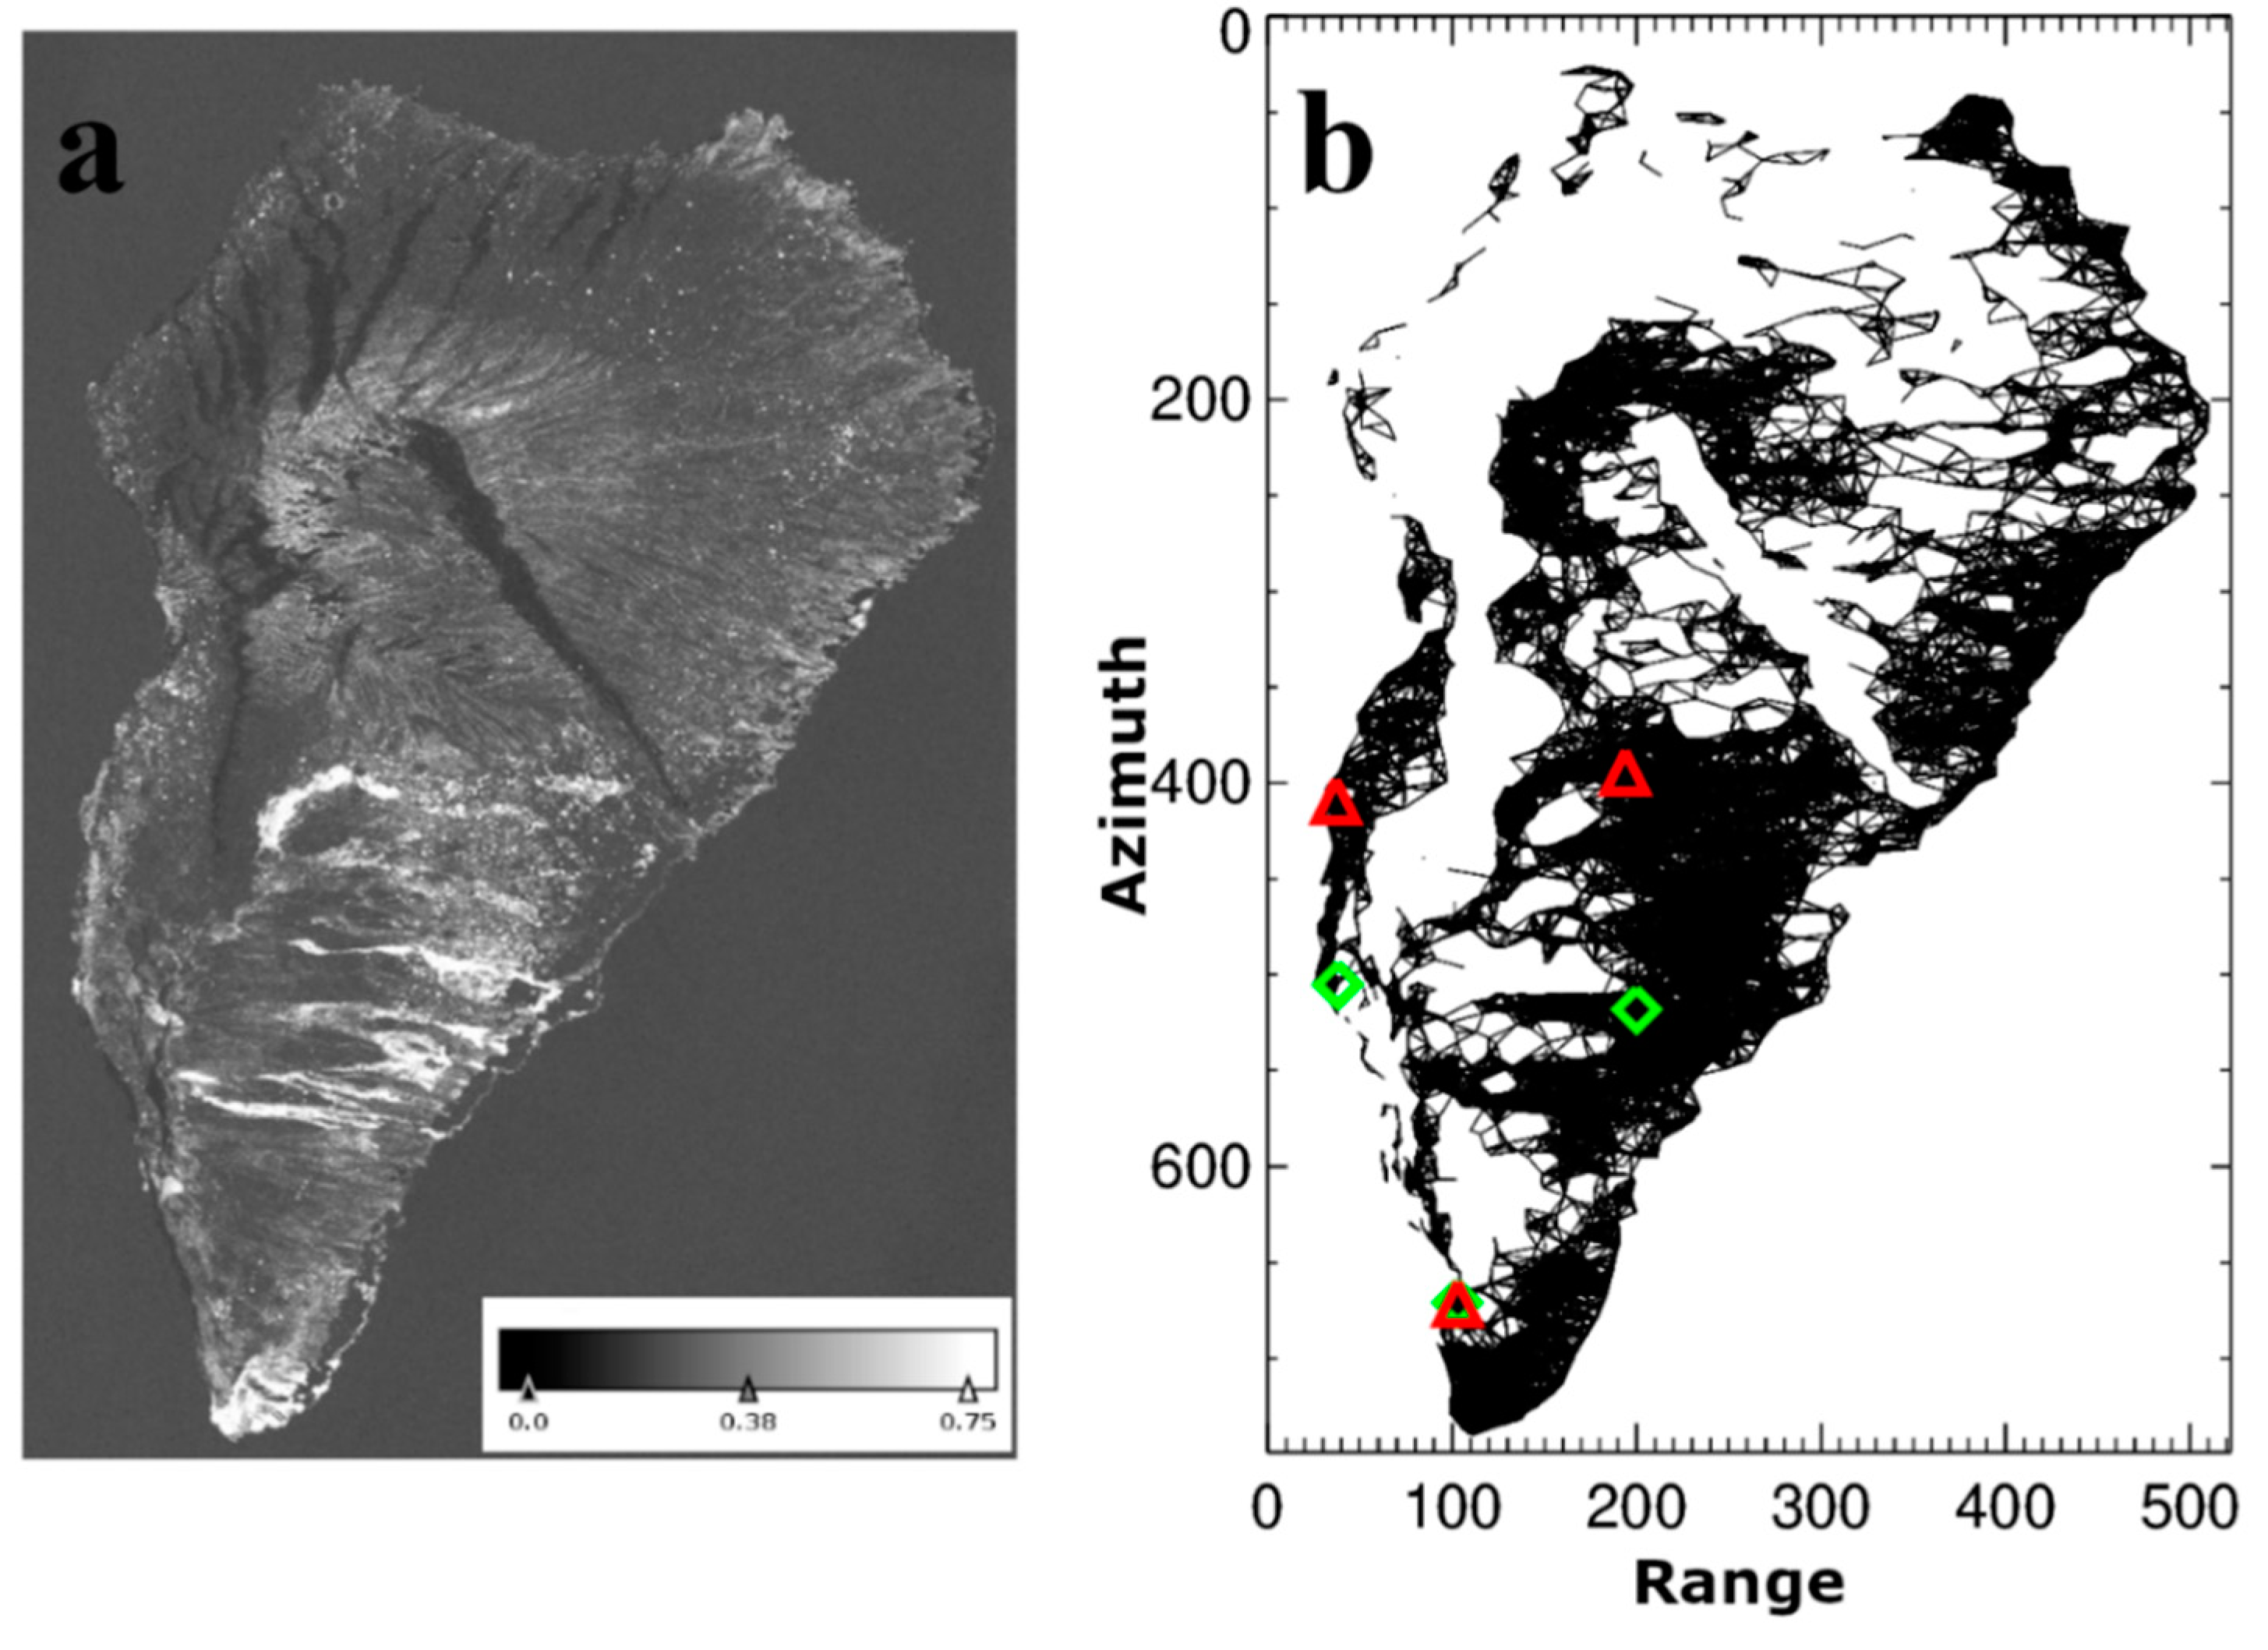
2.2.1. SAR Dataset
2.2.2. A-DInSAR Processing
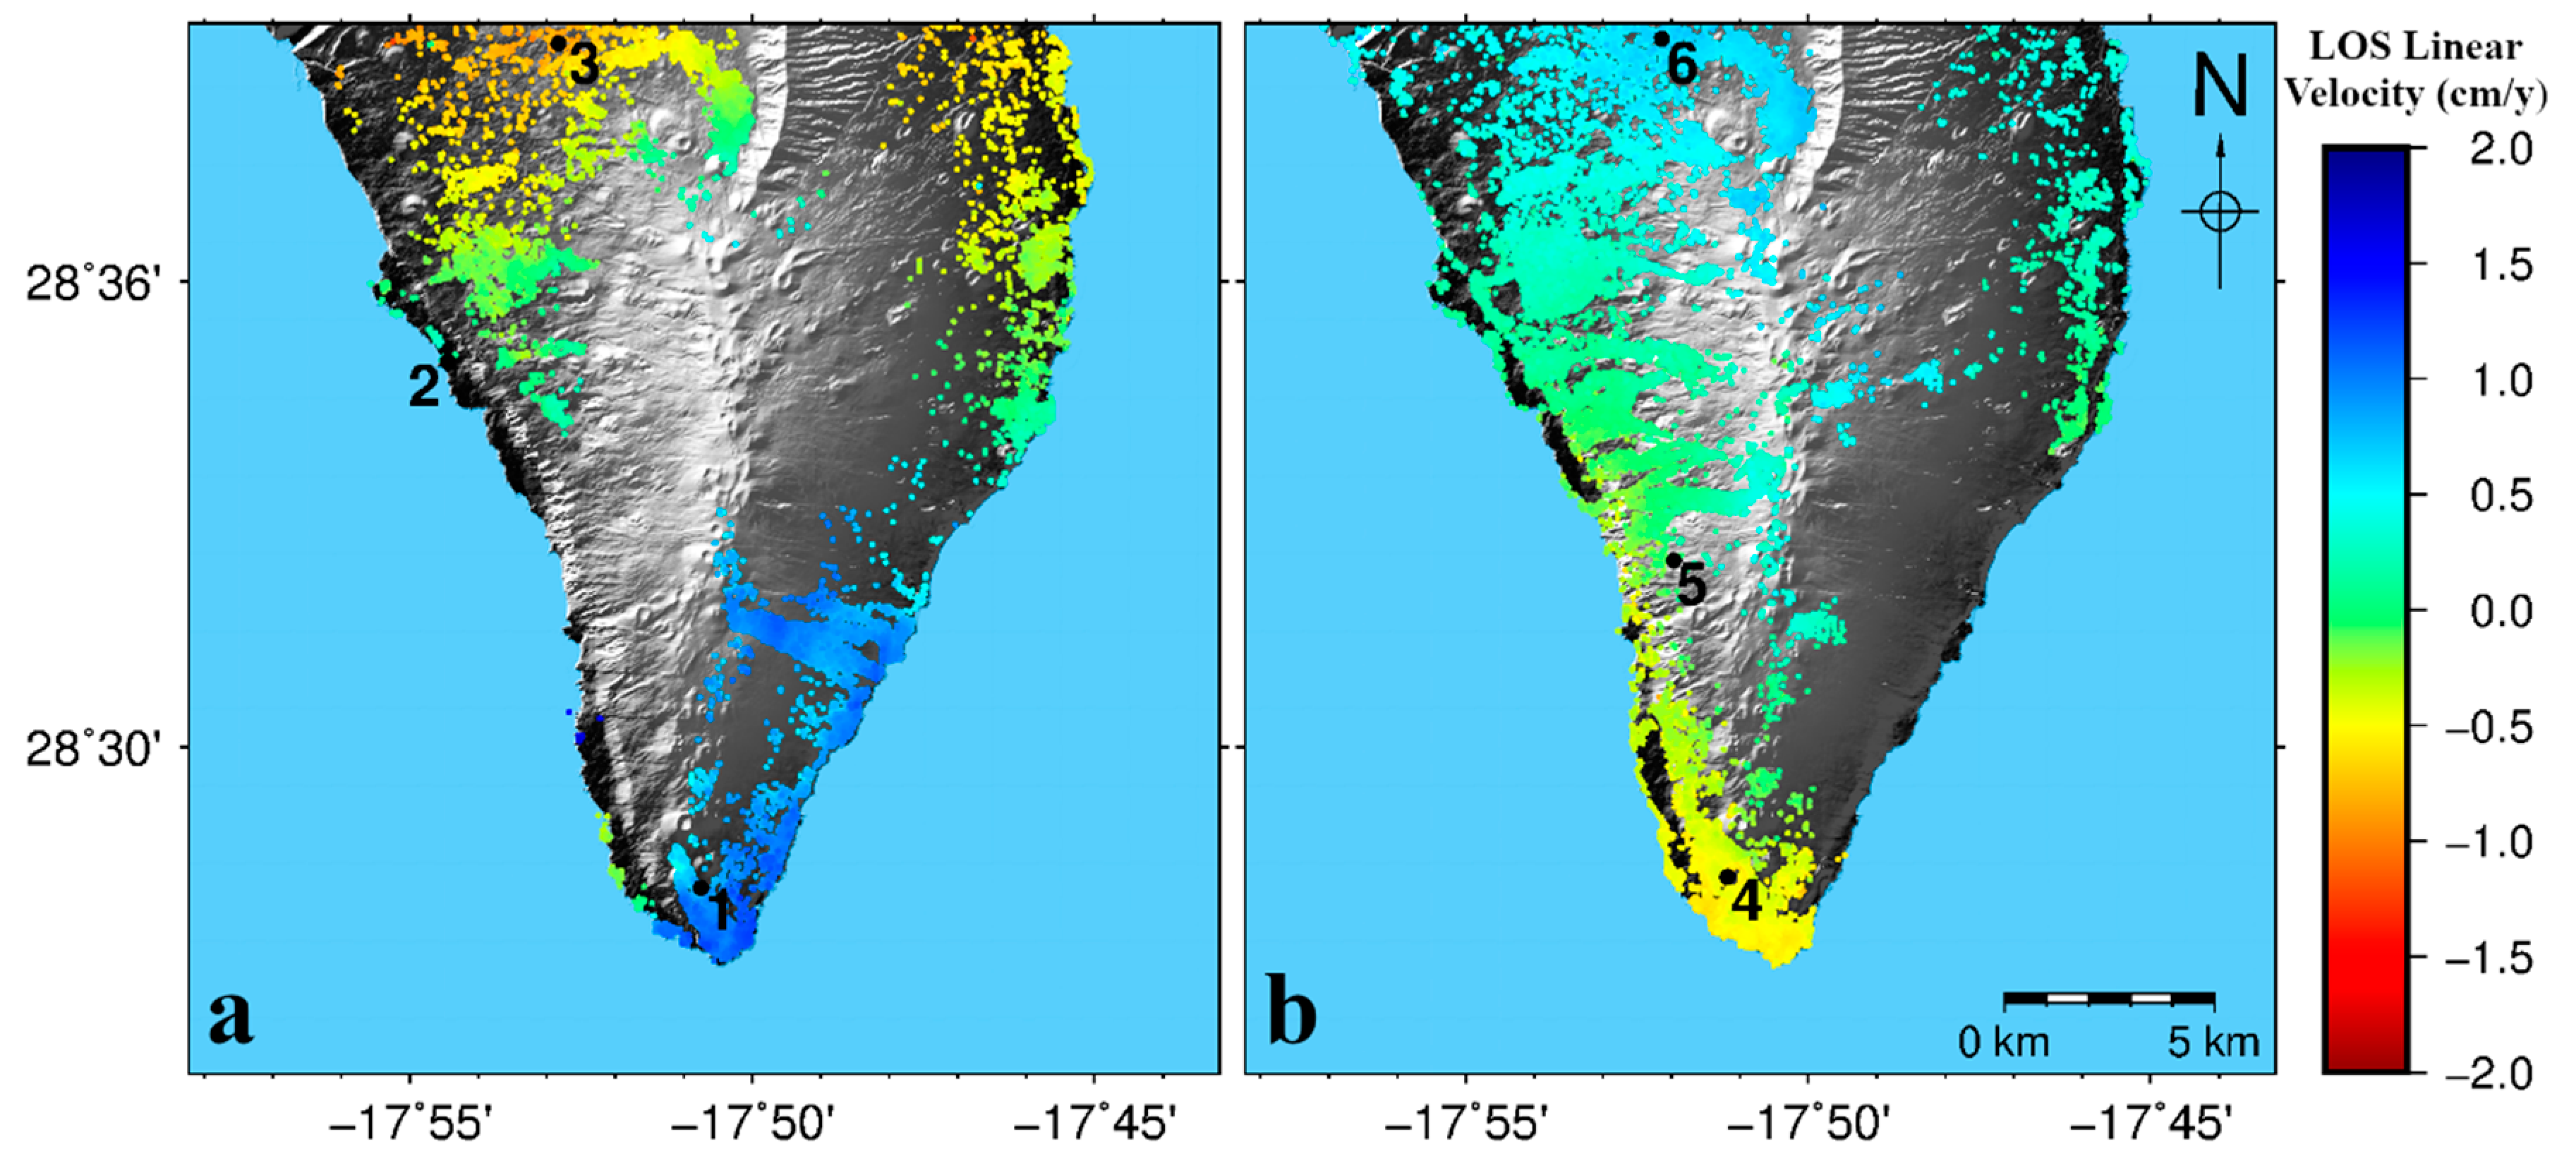
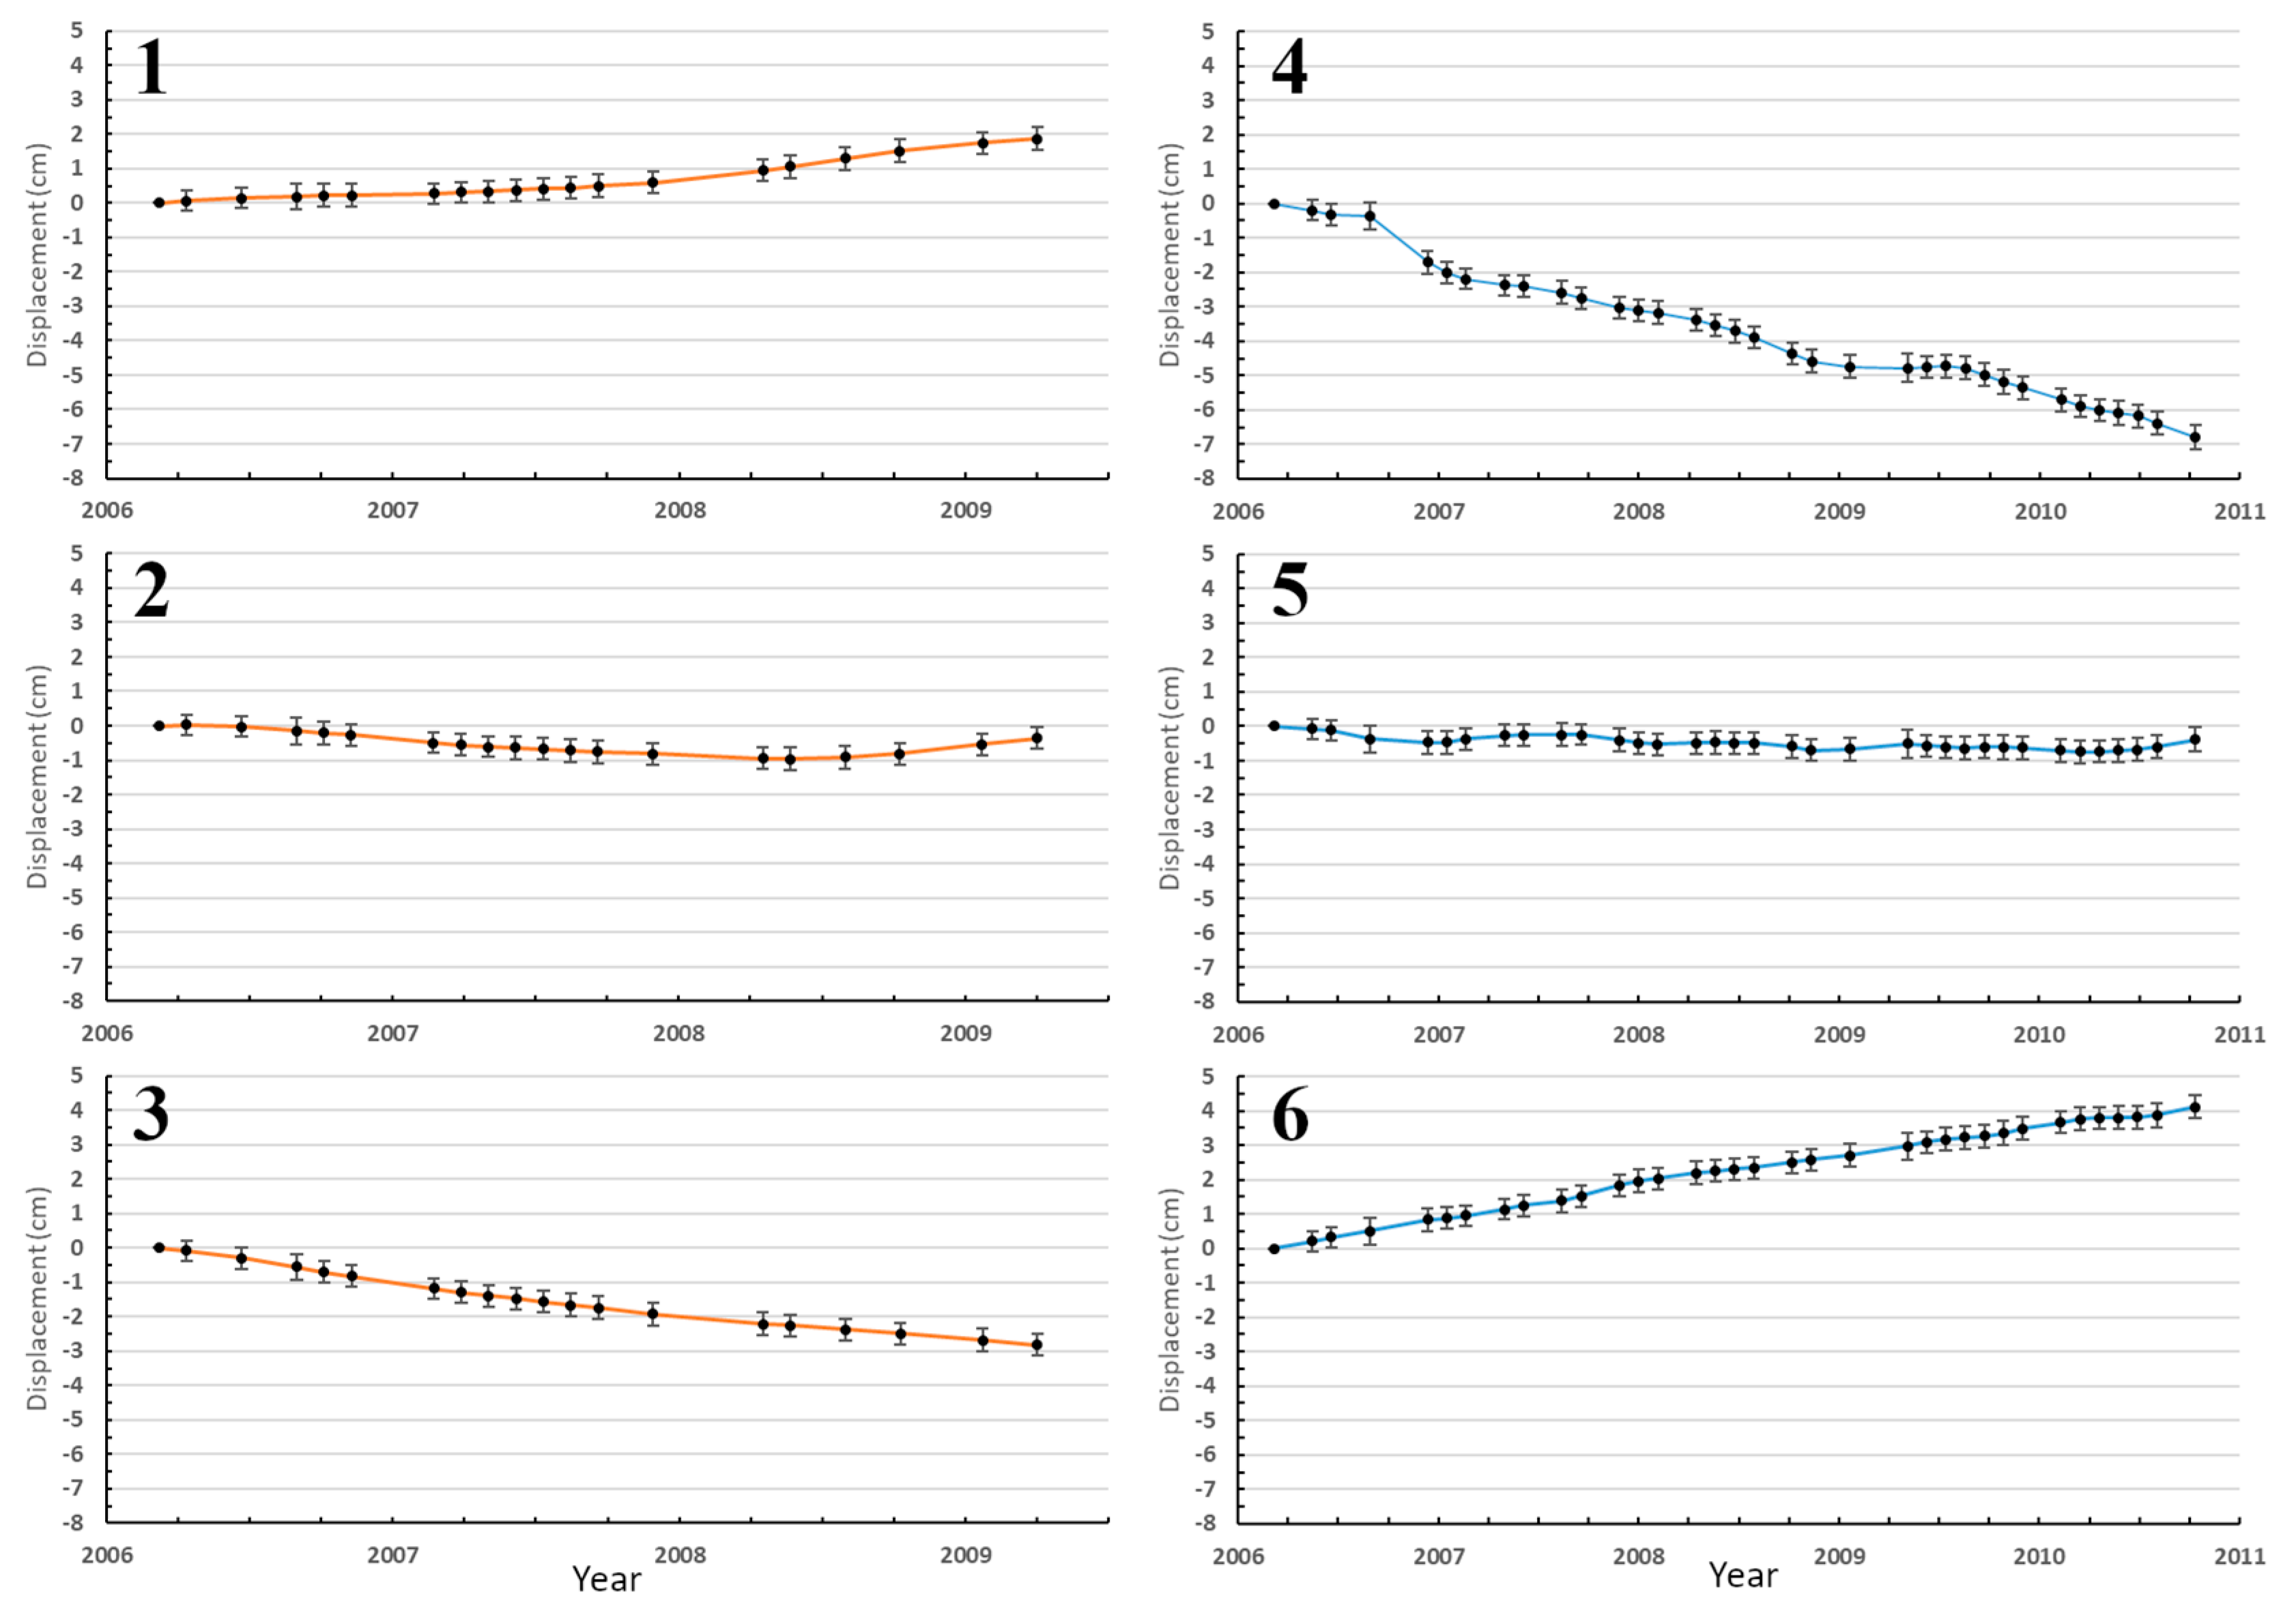
2.2.3. A-DInSAR Results
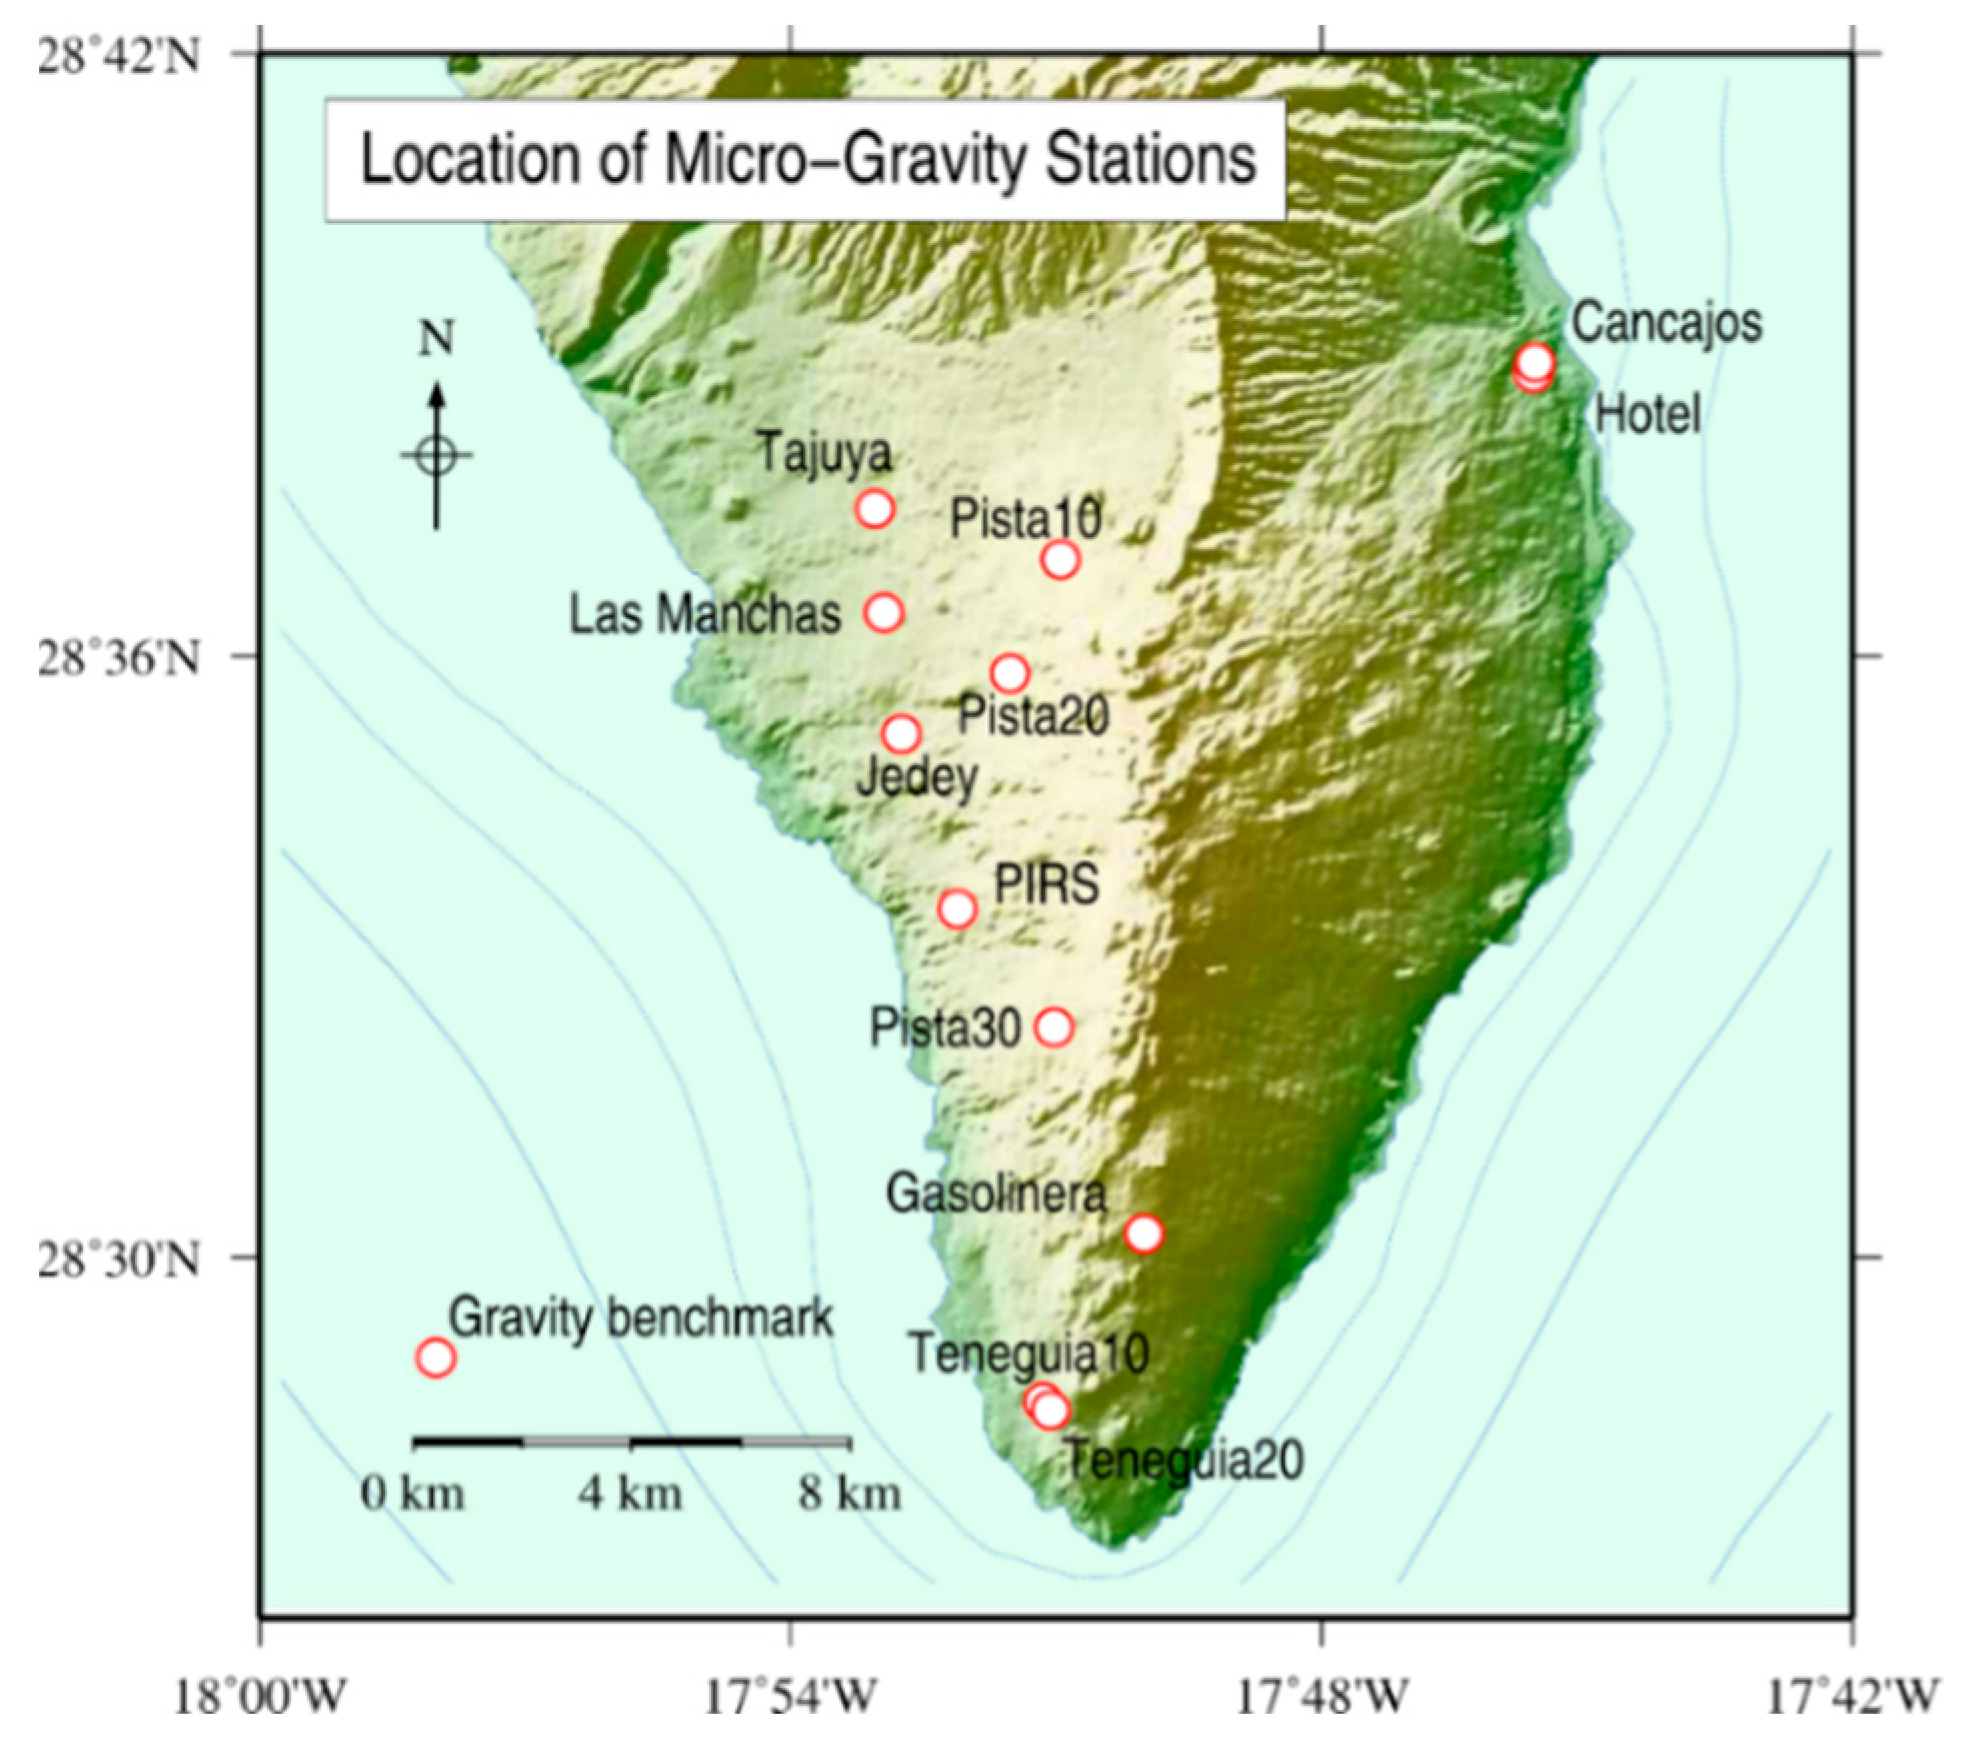
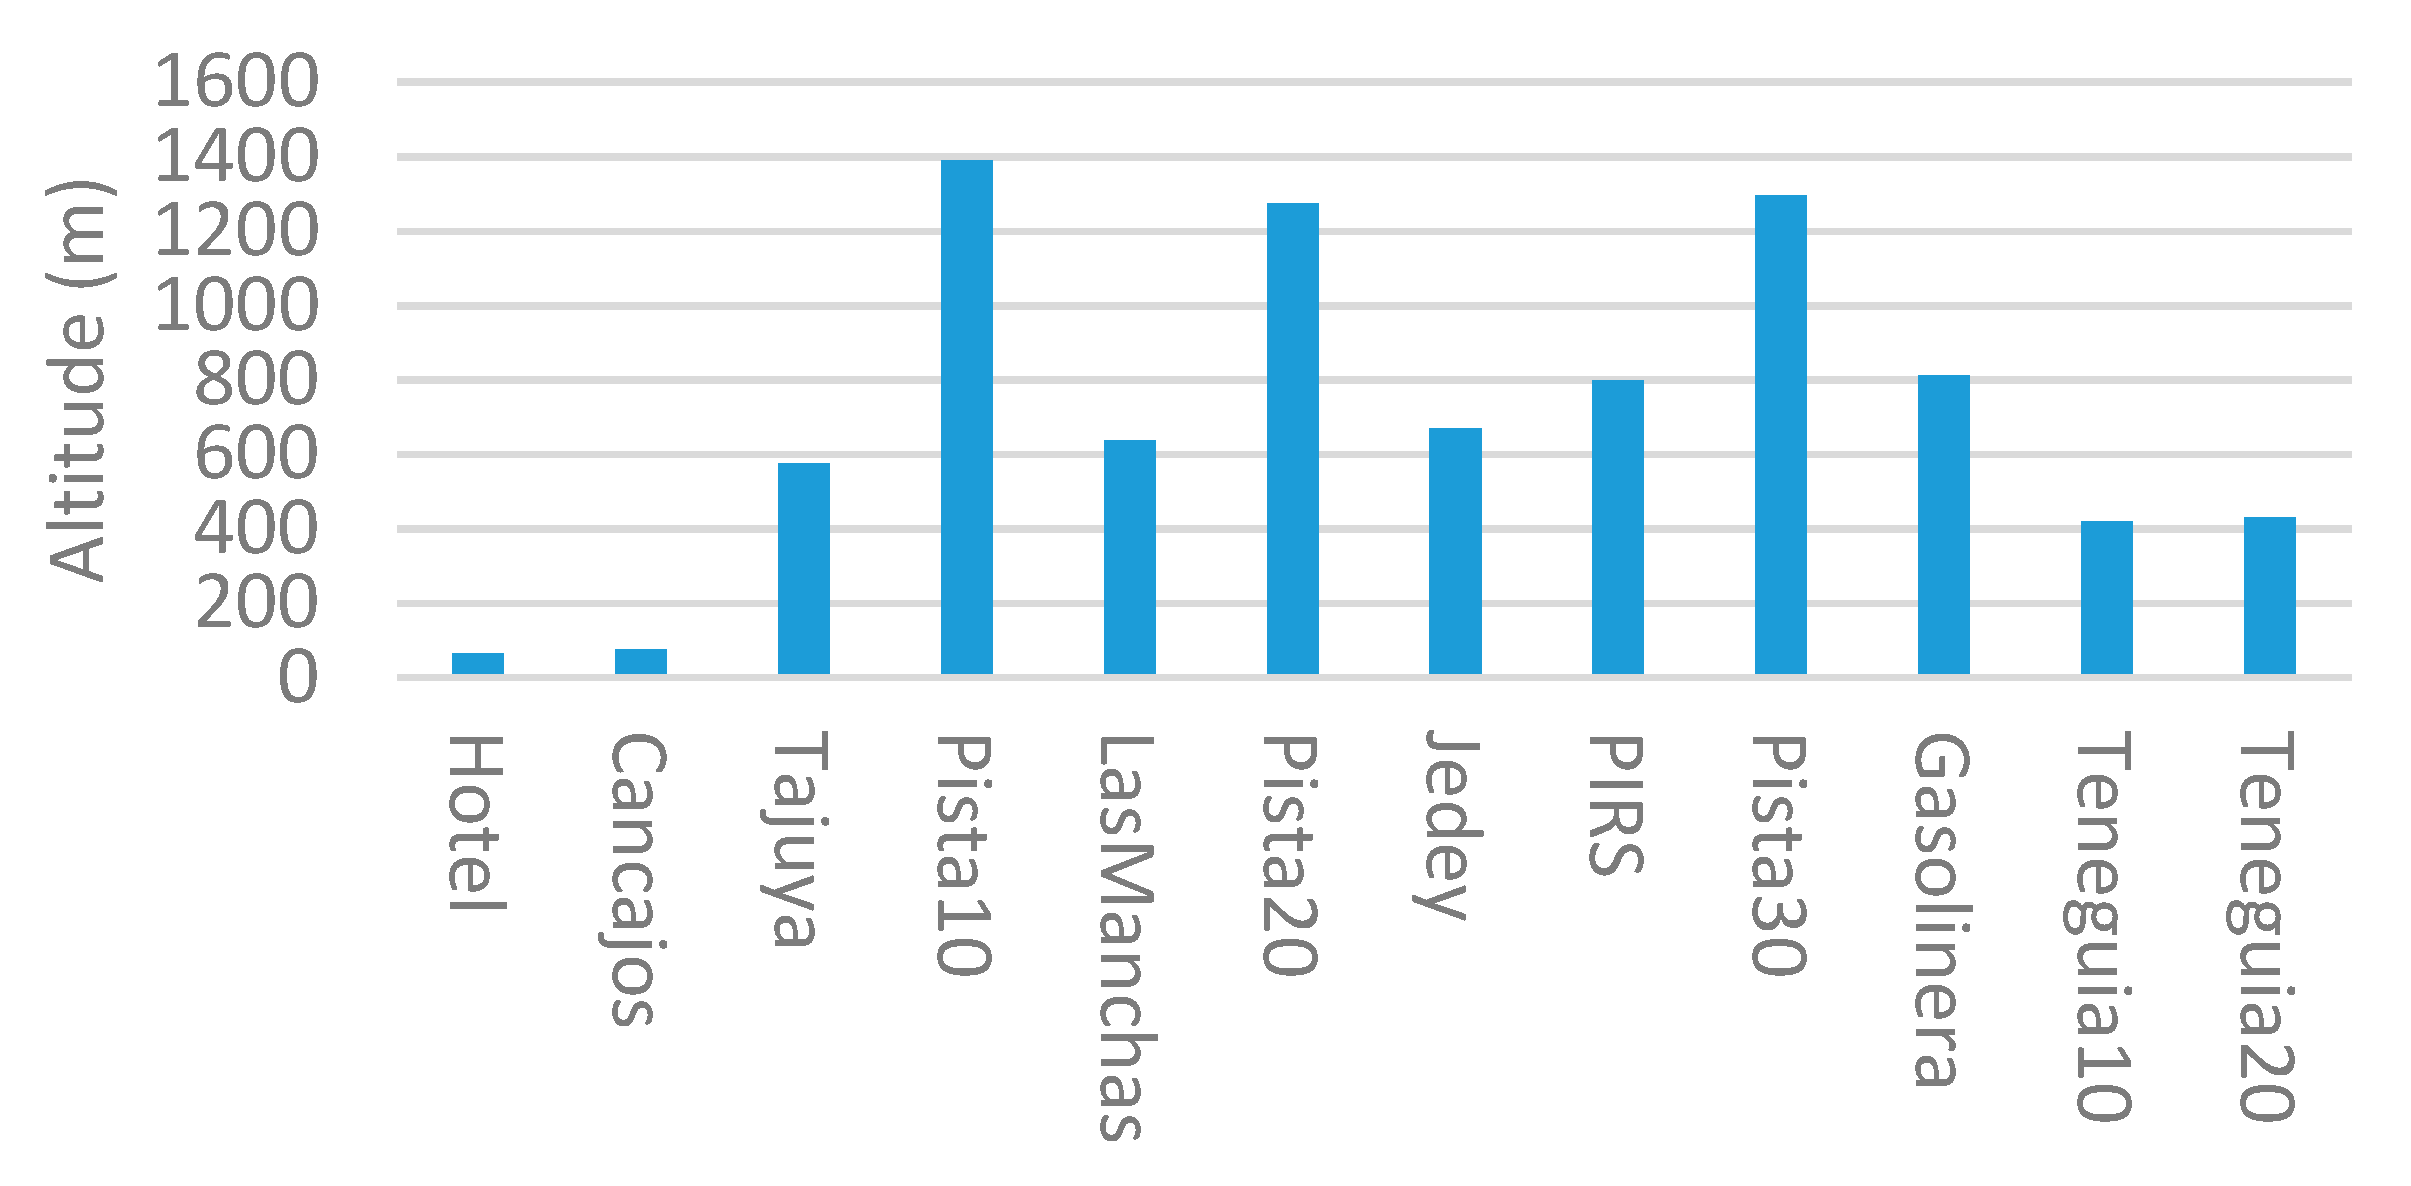
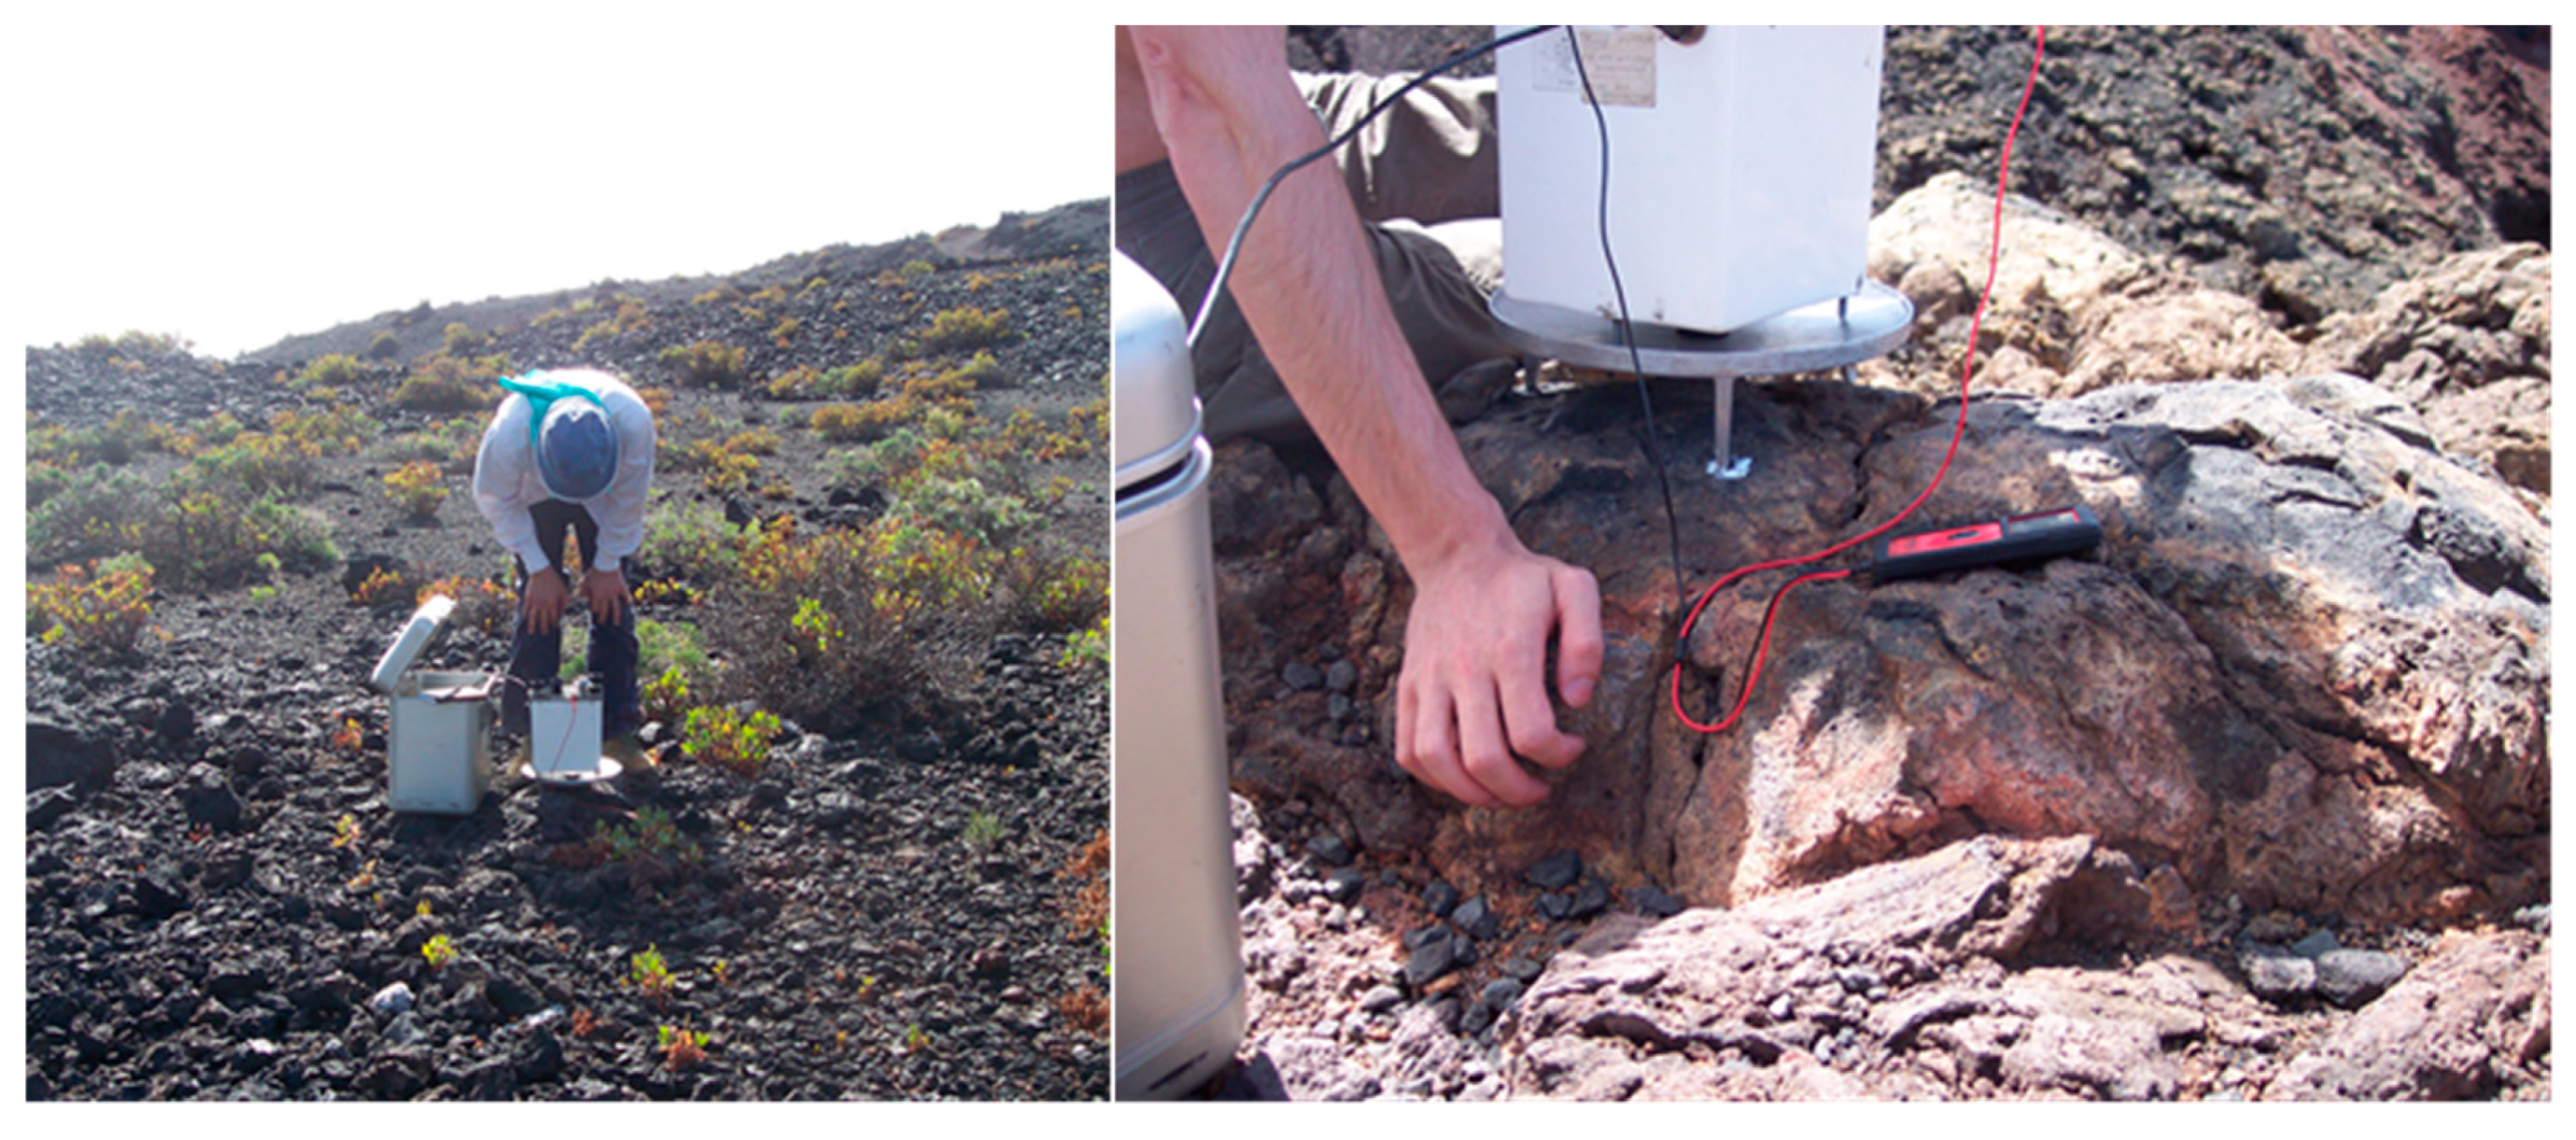
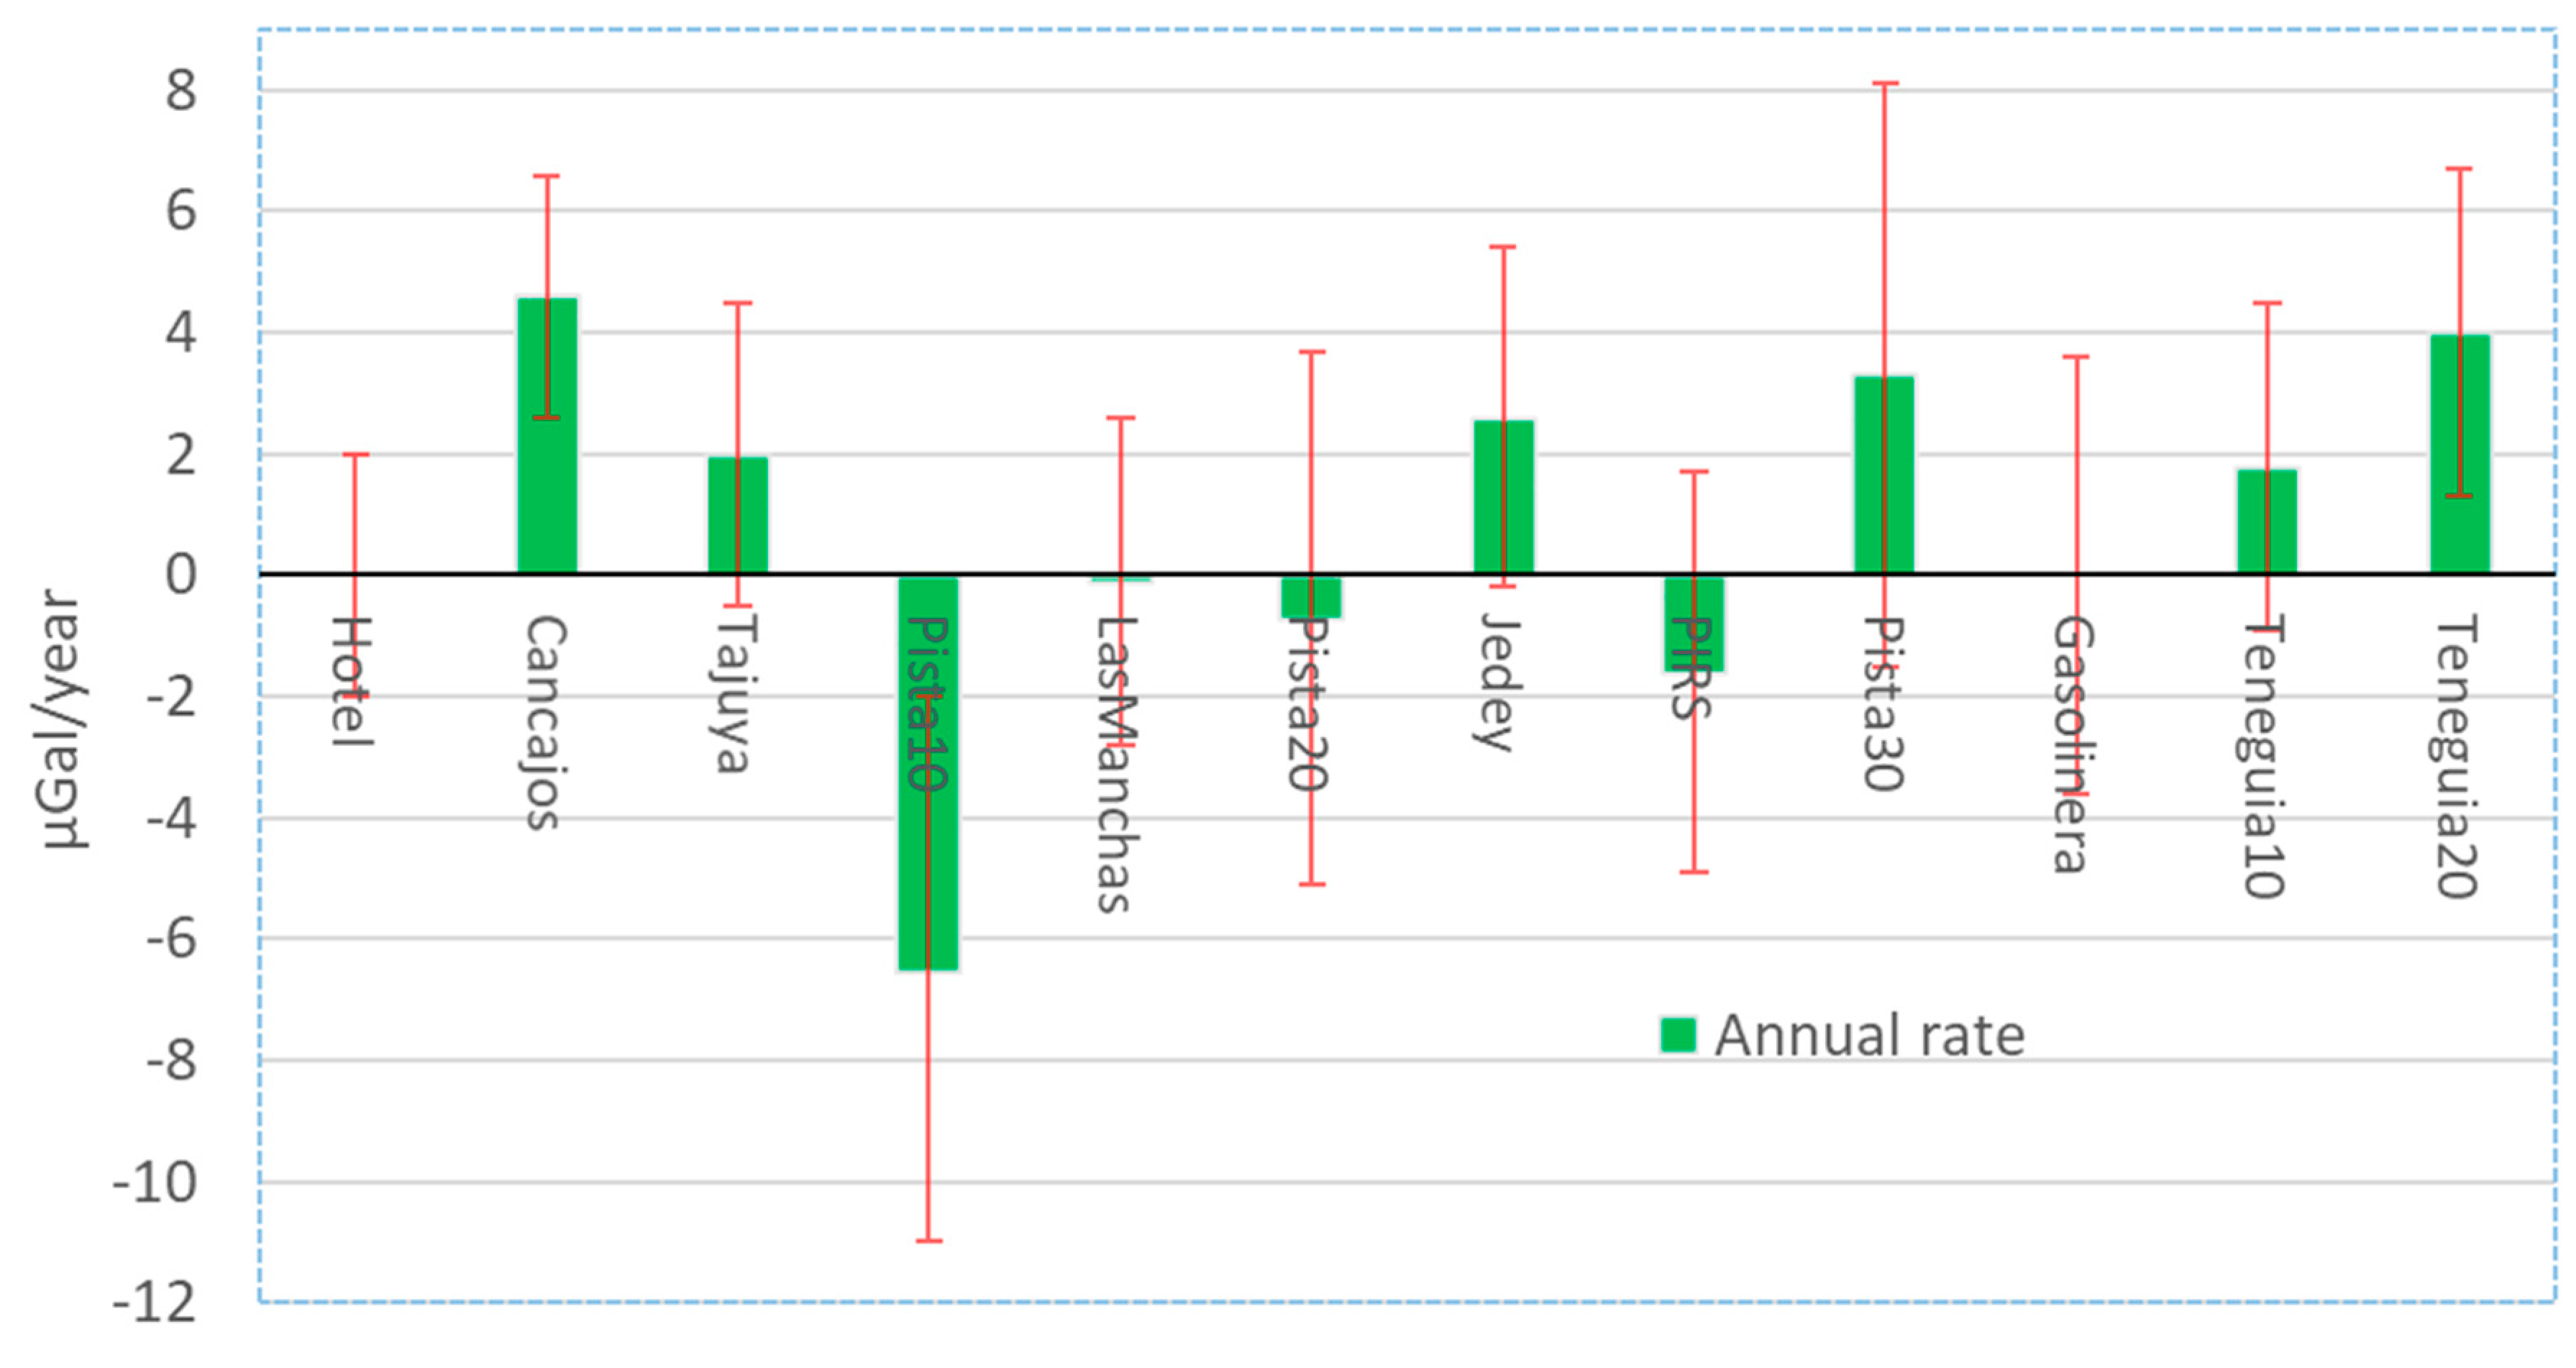
2.3. Micro-Gravimetry Observations
3. Discussion
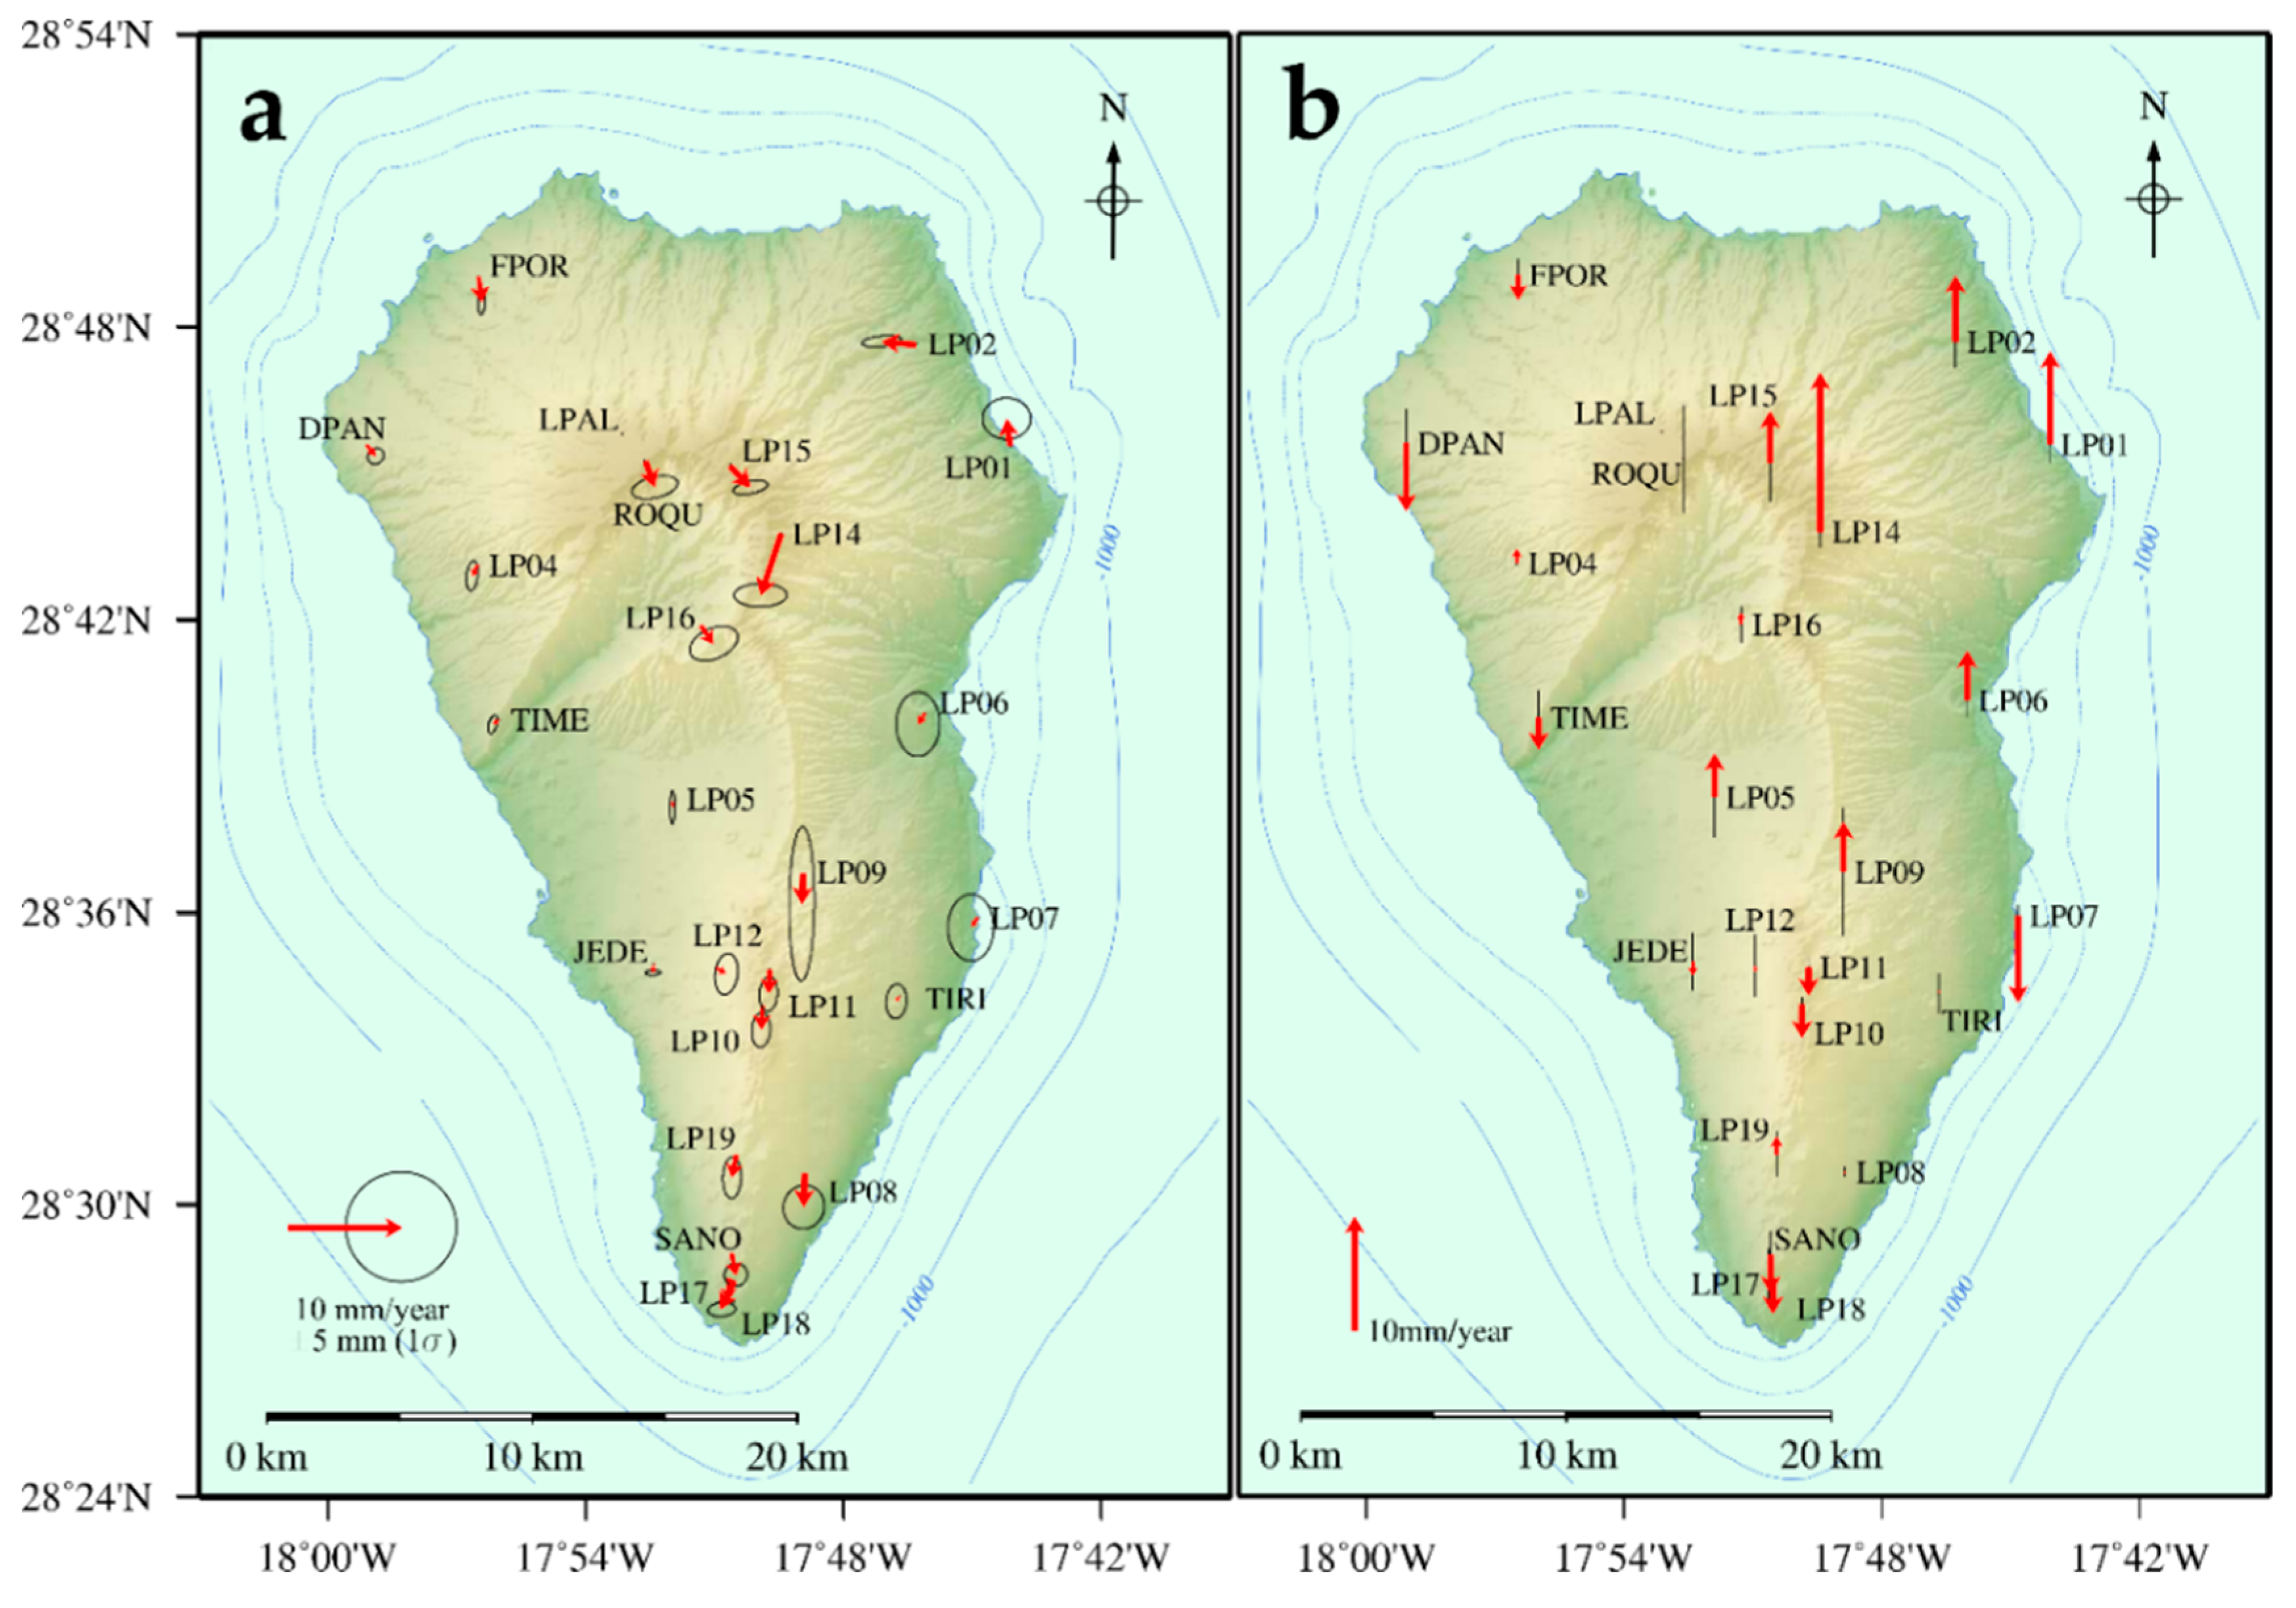
3.1. GNSS
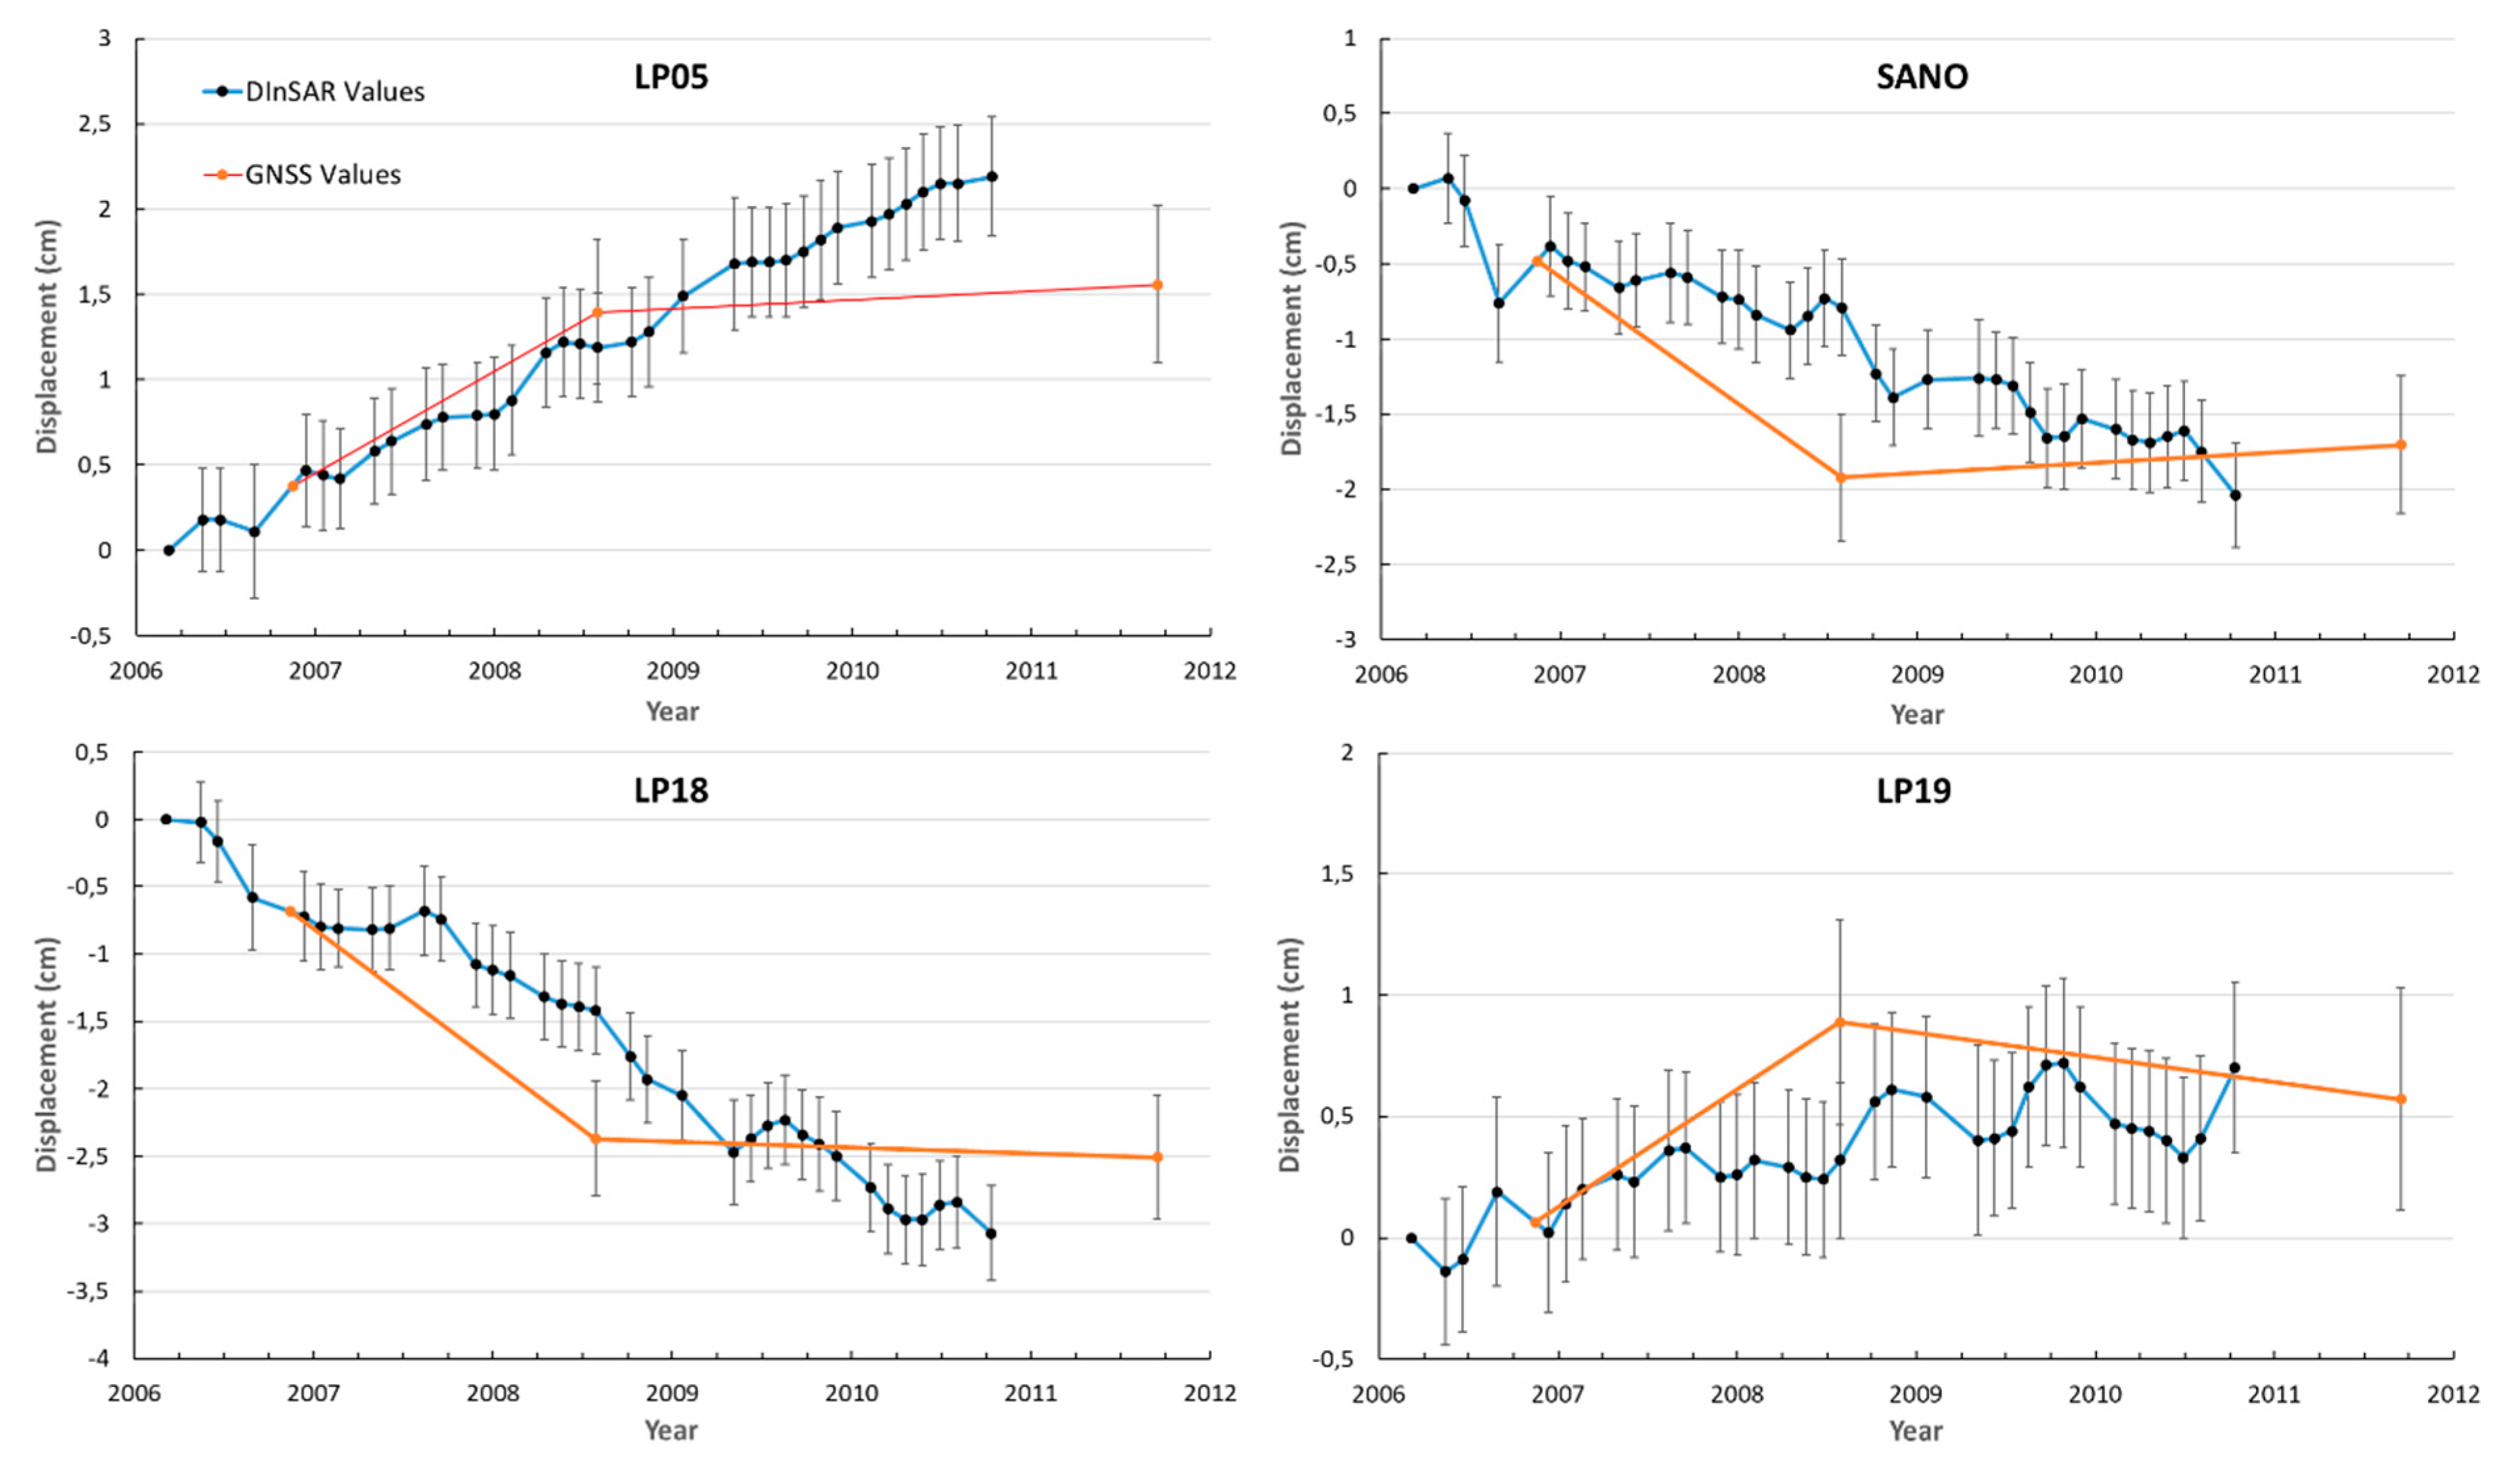
3.2. GNSS-InSAR Comparison
3.3. Comparison of the DInSAR Results with Previous Ones
3.4. Microgravimetry Results
4. Conclusions
Supplementary Materials
Author Contributions
Funding
Acknowledgments
Conflicts of Interest
References
- Sparks, R.S.J.; Biggs, J.; Neuberg, J.W. Monitoring Volcanoes. Science 2012, 335, 1310–1311. [Google Scholar] [CrossRef] [PubMed]
- Dzurisin, D. Volcano Deformation; Springer: Berlin/Heidelberg, Germany, 2006. [Google Scholar]
- Fernández, J.; Pepe, A.; Poland, M.P.; Sigmundsson, F. Volcano Geodesy: Recent developments and future challenges. J. Volcanol. Geotherm. Res. 2017, 344, 1–12. [Google Scholar] [CrossRef]
- Sigmundsson, F.; Hreinsdóttir, S.; Hooper, A.; Árnadóttir, T.; Pedersen, R.; Roberts, M.J.; Óskarsson, N.; Auriac, A.; Decriem, J.; Einarsson, P.; et al. Intrusion triggering of the 2010 Eyjafjallajökull explosive eruption. Nature 2010, 468, 426–430. [Google Scholar] [CrossRef] [PubMed]
- Moss, J.L.; McGuire, W.J.; Page, D. Ground deformation monitoring of a potential landslide at La Palma, Canary Islands. J. Volcanol. Geotherm. Res. 1999, 94, 251–265. [Google Scholar] [CrossRef]
- Ward, S.N.; Day, S. Cumbre Vieja Volcano-Potential collapse and tsunami at La Palma, Canary Islands. Geophys. Res. Lett. 2001, 28, 3397–3400. [Google Scholar] [CrossRef]
- Bru, G.; González, P.J.; Mateos, R.M.; Roldán, F.J.; Herrera, G.; Béjar-Pizarro, M.; Fernández, J. A-DInSAR monitoring of landslide and subsidence activity: A case of urban damage in Arcos de la Frontera, Spain. Remote Sens. 2017, 9, 787. [Google Scholar] [CrossRef]
- Fernandez, J.; Prieto, J.F.; Escayo, J.; Camacho, A.G.; Luzón, F.; Tiampo, K.F.; Palano, M.; Abajo, T.; Pérez, E.; Velasco, J.; et al. Modeling the two- and three-dimensional displacement field in Lorca, Spain, subsidence and the global implications. Sci. Rep. 2018, 8, 14782. [Google Scholar] [CrossRef]
- Camacho, A.G.; Fernández, J.; Samsonov, S.V.; Tiampo, K.F.; Palano, M. 3D multi-source model of elastic volcanic ground deformation. Earth Planet. Sci. Lett. 2020, 547, 116445. [Google Scholar] [CrossRef]
- Banda, E.; Dañobeitia, J.J.; Suriñach, E.; Ansorge, J. Features of crustal structure under the Canary Islands. Earth Planet. Sci. Lett. 1981, 55, 11–24. [Google Scholar] [CrossRef]
- Fernández, J.; González, P.J.; Camacho, A.G.; Prieto, J.F.; Brú, G. An overview of geodetic volcano research in the Canary Islands. Pure Appl. Geophys. 2015, 172, 3189–3228. [Google Scholar] [CrossRef]
- Gottsmann, J.; Wooller, L.; Martí, J.; Fernández, J.; Camacho, A.G.; Gonzalez, P.J.; Garcia, A.; Rymer, H. New evidence for the reawakening of Teide volcano. Geophys. Res. Lett. 2006, 33, L20311. [Google Scholar] [CrossRef]
- Gottsmann, J.; Camacho, A.G.; Martí, J.; Wooller, L.; Fernández, J.; García, A.; Rymer, H. Shallow structure beneath the Central Volcanic Complex of Tenerife from new gravity data: Implications for its evolution and recent reactivation. Phys. Earth Planet. Inter. 2008, 168, 212–230. [Google Scholar] [CrossRef]
- Almendros, J.; Ibáñez, J.M.; Carmona, E.; Zandomeneghi, D. Array analyses of volcanic earthquakes and tremor recorded at Las Cañadas caldera (Tenerife Island, Spain) during the 2004 seismic activation of Teide volcano. J. Volcanol. Geotherm. Res. 2007, 160, 285–299. [Google Scholar] [CrossRef]
- Martí, J.; Ortiz, R.; Gottsmann, J.; Garcia, A.; De La Cruz-Reyna, S. Characterising unrest during the reawakening of the central volcanic complex on Tenerife, Canary Islands, 2004–2005, and implications for assessing hazards and risk mitigation. J. Volcanol. Geotherm. Res. 2009, 182, 23–33. [Google Scholar] [CrossRef]
- Carracedo, J.C.; Torrado, F.P.; González, A.R.; Soler, V.; Turiel, J.L.F.; Troll, V.R.; Wiesmaier, S. The 2011 submarine volcanic eruption in El Hierro (Canary Islands). Geol. Today 2012, 28, 53–58. [Google Scholar] [CrossRef]
- López, C.; Blanco, M.J.; Abella, R.; Brenes, B.; Cabrera Rodríguez, V.M.; Casas, B.; Domínguez Cerdeña, I.; Felpeto, A.; de Villalta, M.F.; del Fresno, C.; et al. Monitoring the volcanic unrest of El Hierro (Canary Islands) before the onset of the 2011–2012 submarine eruption. Geophys. Res. Lett. 2012, 39. [Google Scholar] [CrossRef]
- González, P.J.; Samsonov, S.V.; Pepe, S.; Tiampo, K.F.; Tizzani, P.; Casu, F.; Fernández, J.; Camacho, A.G.; Sansosti, E. Magma storage and migration associated with the 2011–2012 El Hierro eruption: Implications for crustal magmatic systems at oceanic island volcanoes. J. Geophys. Res. Solid Earth 2013, 118, 4361–4377. [Google Scholar] [CrossRef]
- Martí, J.; Pinel, V.; López, C.; Geyer, A.; Abella, R.; Tárraga, M.; Blanco, M.J.; Castro, A.; Rodríguez, C. Causes and mechanisms of the 2011–2012 El Hierro (Canary Islands) submarine eruption. J. Geophys. Res. Solid Earth 2013, 118, 823–839. [Google Scholar] [CrossRef]
- Torres-González, P.A.; Luengo-Oroz, N.; Lamolda, H.; D’Alessandro, W.; Albert, H.; Iribarren, I.; Moure-García, D.; Soler, V. Unrest signals after 46 years of quiescence at Cumbre Vieja, La Palma, Canary Islands. J. Volcanol. Geotherm. Res. 2020, 392, 106757. [Google Scholar] [CrossRef]
- Fernández, J.; Yu, T.-T.; Rodríguez-Velasco, G.; González-Matesanz, J.; Romero, R.; Rodríguez, G.; Quirós, R.; Dalda, A.; Aparicio, A.; Blanco, M.J. New geodetic monitoring system in the volcanic island of Tenerife, Canaries, Spain. Combination of InSAR and GPS techniques. J. Volcanol. Geotherm. Res. 2003, 124, 241–253. [Google Scholar] [CrossRef]
- Hernández-Pacheco, A.; Valls, M.C. The historic eruptions of La Palma Island (Canaries), Archipielago. Rev. Univ. Acores 1982, 3, 83–94. [Google Scholar]
- González, P.J.; Tiampo, K.F.; Camacho, A.G.; Fernández, J. Shallow flank deformation at Cumbre Vieja volcano (Canary Islands): Implications on the stability of steep-sided volcano flanks at oceanic islands. Earth Planet. Sci. Lett. 2010, 297, 545–557. [Google Scholar] [CrossRef]
- Carracedo, J.C.; Badiola, E.R.; Guillou, H.; De La Nuez, J.; Pérez Torrado, F.J. Geology and volcanology of La Palma and El Hierro, Western Canaries. Estud. Geol. 2001, 57, 175–273. [Google Scholar] [CrossRef]
- Urgeles, R.; Masson, D.G.; Canals, M.; Watts, A.B.; Le Bas, T. Recurrent large-scale landsliding on the west flank of La Palma, Canary Islands. J. Geophys. Res. Solid Earth 1999, 104, 25331–25348. [Google Scholar] [CrossRef]
- Masson, D.; Watts, A.; Gee, M.J.; Urgeles, R.; Mitchell, N.; Le Bas, T.; Canals, M. Slope failures on the flanks of the western Canary Islands. Earth Sci. Rev. 2002, 57, 1–35. [Google Scholar] [CrossRef]
- Ancochea, E.; Hernán, F.; Cendrero, A.; Cantagrel, J.M.; Fúster, J.; Ibarrola, E.; Coello, J. Constructive and destructive episodes in the building of a young Oceanic Island, La Palma, Canary Islands, and genesis of the Caldera de Taburiente. J. Volcanol. Geotherm. Res. 1994, 60, 243–262. [Google Scholar] [CrossRef]
- Prieto, J.F.; González, P.J.; Seco, A.; Rodríguez-Velasco, G.; Tunini, L.; Perlock, P.A.; Arjona, A.; Aparicio, A.; Camacho, A.G.; Rundle, J.B.; et al. Geodetic and structural research in La Palma, Canary Islands, Spain: 1992–2007 Results. Pure Appl. Geophys. 2009, 166, 1461–1484. [Google Scholar] [CrossRef]
- Camacho, A.G.; Fernández, J.; González, P.J.; Rundle, J.B.; Prieto, J.F.; Arjona, A. Structural results for La Palma island using 3-D gravity inversion. J. Geophys. Res. 2009, 114, B05411. [Google Scholar] [CrossRef]
- Perlock, P.A.; González, P.J.; Tiampo, K.F.; Rodríguez-Velasco, G.; Samsonov, S.; Fernández, J. Time evolution of deformation using time series of differential interferograms: Application to La Palma Island (Canary Islands). Pure Appl. Geophys. 2008, 165, 1531–1554. [Google Scholar] [CrossRef]
- Day, S.; Carracedo, J.; Guillou, H.; Gravestock, P. Recent structural evolution of the Cumbre Vieja volcano, La Palma, Canary Islands: Volcanic rift zone reconfiguration as a precursor to volcano flank instability? J. Volcanol. Geotherm. Res. 1999, 94, 135–167. [Google Scholar] [CrossRef]
- Massonnet, D.; Sigmundsson, F. Remote sensing of volcano deformation by radar interferometry from various satellites. In Remote Sensing of Active Volcanism; Geophysical Monograph Series; Mouginis-Mark, P.J., Crisp, J.A., Fink, J.H., Eds.; AGU: Washington, DC, USA, 2000; Volume 116, pp. 207–221. [Google Scholar]
- Fernández, J.; Romero, R.; Carrasco, D.; Luzón, F.; Araña, V. InSAR volcano and seismic monitoring in Spain. Results for the period 1992–2000 and possible interpretations. Opt. Lasers Eng. 2002, 37, 285–297. [Google Scholar] [CrossRef]
- Arjona, A.; Monells, D.; Fernández, J.; Duque, S.; Mallorqui, J. Deformation analysis employing the Coherent Pixel Technique and ENVISAT and ERS images in Canary Islands. In Proceedings of the Workshop Fringe 2009, Frascati, Italy, 30 November–4 December 2009; European Space Agency: Paris, France, 2010; p. 8. [Google Scholar]
- Fernandez, J.; Gonzalez, P.J.; Camacho, A.G.; Rodriguez-Velasco, G.; Arjona, A.; Pallero, J.L.G.; Perlock, P.A.; Tiampo, K.F.; Aparicio, A.; Prieto, J.F.; et al. DInSAR, GPS and gravity observation results in La Palma, Canary islands. In Proceedings of the 2008 Second Workshop on Use of Remote Sensing Techniques for Monitoring Volcanoes and Seismogenic Areas, Naples, Italy, 11–14 November 2008; pp. 1–5. [Google Scholar]
- Regidor Gutierrez, J.; Prieto Morin, J.F.; Sanz Megia, J.M.; Quirós Donate, A.; Barbadillo Fernández, A. El Proyecto REGENTE. In Proceedings of the VII Congreso Nacional de Topografía y Cartografía (TOPCART 2000), Madrid, Spain, 16–20 October 2000; pp. 88–94. [Google Scholar]
- Prieto, J.F. Differential and Interferometric Methods for the Evaluation of Crustal Deformation by GNSS and InSAR Techniques Métodos Diferenciales e Interferométricos para la Evaluación de Deformaciones de la Corteza Terrestre Mediante técnicas GNSS e InSAR. Ph.D. Thesis, Universidad Politécnica de Madrid, Madrid, Spain, 2015. [Google Scholar]
- Fernández, J.; González-Matesanz, F.J.; Prieto, J.F.; Rodríguez-Velasco, G.; Staller, A.; Alonso-Medina, A.; Charco, M. GPS Monitoring in the N-W Part of the Volcanic Island of Tenerife, Canaries, Spain: Strategy and Results. Pure Appl. Geophys. 2004, 161, 1359–1377. [Google Scholar] [CrossRef]
- Herring, T.A.; King, R.W.; Floyd, M.A.; Mcclusky, S.C.; Sciences, P. GAMIT Reference Manual 10.6.; Department of Earth, Atmospheric, and Planetary Sciences—Massachusetts Institute of Technology: Cambridge, MA, USA, 2015; pp. 1–168. [Google Scholar]
- Department of Earth, Atmospheric and Planetary Science at MIT. Geodesy and Geodynamics. Available online: http://www-gpsg.mit.edu.
- IGS—International GNSS Service. Available online: http://www.igs.org/.
- International Earth Rotation Service. Available online: https://www.iers.org/IERS/EN/Home/home_node.html (accessed on 3 July 2020).
- Dow, J.M.; Neilan, R.E.; Rizos, C. The International GNSS Service in a changing landscape of Global Navigation Satellite Systems. J. Geod. 2009, 83, 191–198. [Google Scholar] [CrossRef]
- Saastamoinen, J. Atmospheric correction for the troposphere and stratosphere in radio ranging satellites. In The Use of Artificial Satellites for Geodesy; Henriksen, S.W., Mancini, A., Chovitz, B.H., Eds.; American Geophysical Union: Washington, DC, USA, 1972; pp. 247–251. [Google Scholar]
- Boehm, J.; Niell, A.; Tregoning, P.; Schuh, H. Global Mapping Function (GMF): A new empirical mapping function based on numerical weather model data. Geophys. Res. Lett. 2006, 33, L07304. [Google Scholar] [CrossRef]
- Altamimi, Z.; Collilieux, X.; Métivier, L. ITRF2008: An improved solution of the international terrestrial reference frame. J. Geod. 2011, 85, 457–473. [Google Scholar] [CrossRef]
- Palano, M.; González, P.J.; Fernández, J. Strain and stress fields along the Gibraltar Orogenic Arc: Constraints on active geodynamics. Gondwana Res. 2013, 23, 1071–1088. [Google Scholar] [CrossRef]
- Gabriel, A.K.; Goldstein, R.M.; Zebker, H.A. Mapping small elevation changes over large areas: Differential radar interferometry. J. Geophys. Res. 1989, 94, 9183. [Google Scholar] [CrossRef]
- Hanssen, R.F. Radar Interferometry: Data Interpretation and Error Analysis; Kluwer Academic Publishers: Dordrecht, The Netherlands, 2001; ISBN 0792369459. [Google Scholar]
- Lanari, R.; Casu, F.; Manzo, M.; Zeni, G.; Berardino, P.; Manunta, M.; Pepe, A. An overview of the small baseline subset algorithm: A DInSAR technique for surface deformation analysis. Pure Appl. Geophys. 2007, 164, 637–661. [Google Scholar] [CrossRef]
- Blanco-Sánchez, P.; Mallorquí, J.J.; Duque, S.; Monells, D. The Coherent Pixels Technique (CPT): An advanced DInSAR technique for nonlinear deformation monitoring. Pure Appl. Geophys. 2008, 165, 1167–1193. [Google Scholar] [CrossRef]
- Centolanza, G. Quality Evaluation of DInSAR Results from the Phase Statistical Analysis. Ph.D. Thesis, Universitat Politècnica de Catalunya, Barcelona, Spain, 2015. [Google Scholar]
- Mallorquí, J.; Mora, O.; Blanco, P.; Broquetas, A. Linear and non-linear long-term terrain deformation with DInSAR (CPT: Coherent Pixels Technique). In Proceedings of the FRINGE 2003 Workshop, Frascati, Italy, 1–5 December 2003; Universitat Politècnica de Catalunya: Barcelona, Spain, 2004; Volume 3, pp. 139–144. [Google Scholar]
- Di Martire, D.; Iglesias, R.; Monells, D.; Centolanza, G.; Sica, S.; Ramondini, M.; Pagano, L.; Mallorquí, J.J.; Calcaterra, D. Comparison between differential SAR interferometry and ground measurements data in the displacement monitoring of the earth-dam of Conza della Campania (Italy). Remote Sens. Environ. 2014, 148, 58–69. [Google Scholar] [CrossRef]
- Bru, G.; Escayo, J.; Fernández, J.; Mallorqui, J.; Iglesias, R.; Sansosti, E.; Abajo, T.; Morales, A. Suitability assessment of X-Band satellite SAR data for geotechnical monitoring of site scale slow moving landslides. Remote Sens. 2018, 10, 936. [Google Scholar] [CrossRef]
- Miranda, N.; Rosich, B.; Santella, C.; Grion, M. Review of the impact of ERS-2 piloting modes on the SAR Doppler stability. In Proceedings of the 2004 Envisat & ERS Symposium (ESA SP-572), Salzburg, Austria, 6–10 September 2004. [Google Scholar]
- Hooper, A.; Segall, P.; Zebker, H. Persistent scatterer interferometric synthetic aperture radar for crustal deformation analysis, with application to Volcán Alcedo, Galápagos. J. Geophys. Res. 2007, 112, B07407. [Google Scholar] [CrossRef]
- Berardino, P.; Fornaro, G.; Lanari, R.; Sansosti, E. A new algorithm for surface deformation monitoring based on small baseline differential SAR interferograms. IEEE Trans. Geosci. Remote Sens. 2002, 40, 2375–2383. [Google Scholar] [CrossRef]
- Ferretti, A.; Prati, C.; Rocca, F. Analysis of permanent scatterers in SAR interferometry. Int. Geosci. Remote Sens. Symp. 2000, 2, 761–763. [Google Scholar] [CrossRef]
- Mora, O.; Mallorqui, J.J.; Broquetas, A. Linear and nonlinear terrain deformation maps from a reduced set of interferometric sar images. IEEE Trans. Geosci. Remote Sens. 2003, 41, 2243–2253. [Google Scholar] [CrossRef]
- Battaglia, M.; Gottsmann, J.; Carbone, D.; Fernández, J. 4D volcano gravimetry. Geophysics 2008, 73, WA3–WA18. [Google Scholar] [CrossRef]
- Velasco-Gómez, J.; Prieto, J.F.; Molina, I.; Herrero, T.; Fábrega, J.; Pérez-Martín, E. Use of the gyrotheodolite in underground networks of long high-speed railway tunnels. Surv. Rev. 2016, 48, 329–337. [Google Scholar] [CrossRef]
- Tarantola, A. Inverse Problem Theory: Methods for Data Fitting and Model Parameter Estimation; Elsevier: Amsterdam, The Netherlands; New York, NY, USA, 1987. [Google Scholar]
- Fernández, J.; Carrasco, J.M.; Rundle, J.B.; Araña, V. Geodetic methods for detecting volcanic unrest: A theoretical approach. Bull. Volcanol. 1999, 60, 534–544. [Google Scholar] [CrossRef]
- Marrero, J.M.; García, A.; Berrocoso, M.; Llinares, Á.; Rodríguez-Losada, A.; Ortiz, R. Strategies for the development of volcanic hazard maps in monogenetic volcanic fields: The example of La Palma (Canary Islands). J. Appl. Volcanol. 2019, 8, 6. [Google Scholar] [CrossRef]
- Løvholt, F.; Pedersen, G.; Gisler, G. Oceanic propagation of a potential tsunami from the La Palma Island. J. Geophys. Res. 2008, 113, C09026. [Google Scholar] [CrossRef]
- Abadie, S.M.; Harris, J.C.; Grilli, S.T.; Fabre, R. Numerical modeling of tsunami waves generated by the flank collapse of the Cumbre Vieja Volcano (La Palma, Canary Islands): Tsunami source and near field effects. J. Geophys. Res. Ocean. 2012, 117. [Google Scholar] [CrossRef]
- Yu, T.-T.; Fernández, J.; Tseng, C.-L.; Sevilla, M.J.; Araña, V. Sensitivity test of the geodetic network in Las Cañadas Caldera, Tenerife, for volcano monitoring. J. Volcanol. Geotherm. Res. 2000, 103, 393–407. [Google Scholar] [CrossRef]
- Tomás, R.; Romero, R.; Mulas, J.; Marturià, J.J.; Mallorquí, J.J.; Lopez-Sanchez, J.M.; Herrera, G.; Gutiérrez, F.; González, P.J.; Fernández, J.; et al. Radar interferometry techniques for the study of ground subsidence phenomena: A review of practical issues through cases in Spain. Environ. Earth Sci. 2014, 71, 163–181. [Google Scholar] [CrossRef]
- Colesanti, C.; Wasowski, J. Investigating landslides with space-borne Synthetic Aperture Radar (SAR) interferometry. Eng. Geol. 2006, 88, 173–199. [Google Scholar] [CrossRef]
- Sobradelo, R.; Martí, J.; Mendoza-Rosas, A.T.; Gómez, G. Volcanic hazard assessment for the Canary Islands (Spain) using extreme value theory. Nat. Hazards Earth Syst. Sci. 2011, 11, 2741–2753. [Google Scholar] [CrossRef]
- Padrón, E.; Pérez, N.M.; Hernández, P.A.; Sumino, H.; Melián, G.; Barrancos, J.; Nolasco, D.; Padilla, G. Helium emission at Cumbre Vieja volcano, La Palma, Canary Islands. Chem. Geol. 2012, 312–313, 138–147. [Google Scholar] [CrossRef]


| Reference | Time Period Studied | Technique Used | Main Results |
|---|---|---|---|
| Moss et al. [5] | 1994–1997 | Observation of a geodetic network on the western flank of Cumbre Vieja using EDM and rapid-static GPS. | A coherent pattern of displacement vectors but with no statically significant values [4,22] |
| Massonet and Sigmundsson [32] | 1992–1995 | Classical InSAR without topographic correction using only 1 pair of ERS radar images. | No deformation of the order of tens of cm. Smaller deformations could be masked by topographic fringes. |
| Fernández et al. [33] | 1992–1999 | Classical InSAR without topographic correction using ERS radar images. | No deformation at the level of tens of cm in LOS. Smaller deformations could be masked by topographic fringes. |
| Perlock et al. [30] | 1992–2000 | InSAR phase analysis techniques (coherent pixels technique, CPT; coherent target modelling method; and stacking) using ERS radar images. | Subsidence on the Teneguía volcano, where the last eruption (1971) took place. No deformation on the northern part of the island. |
| Prieto et al. [28] | 2006–2008 | GNSS surveys with a geodetic network comprising 27 stations | Subsidence and horizontal displacement detected in the area of the Teneguía volcano. |
| Arjona et al. [34] | 1992–2008 | A-DInSAR using CPT and ERS and ENVISAT radar images | Negative LOS displacement in the Teneguía volcano area and on the western flank of the Cumbre Vieja volcano. |
| González et al. [23] | 1992–2000; 2003–2008 | DInSAR using stacking with ERS and ENVISAT radar images | Two clear negative LOS displacements in the Teneguía volcano area and on the western slopes of the Cumbre Vieja volcano. |
| Torres-González et al. [20] | 06/2017–06/2018 | Continuous GNSS observations in a network of six stations | No deformation was detected |
| Station | Altitude (m) | Annual Rate (μGal/Year) | Standard Deviation (μGal/Year) |
|---|---|---|---|
| Hotel | 65 | 0.0 | ±2.0 |
| Cancajos | 76 | 4.6 | ±2.0 |
| Pista10 | 576 | 2.0 | ±2.5 |
| Pista20 | 1390 | −6.5 | ±4.5 |
| Pista30 | 637 | −0.1 | ±2.7 |
| Gasolinera | 1273 | −0.7 | ±4.4 |
| Teneguia10 | 669 | 2.6 | ±2.8 |
| Teneguia20 | 799 | −1.6 | ±3.3 |
| PIRS | 1296 | 3.3 | ±4.8 |
| Jedey | 812 | 0.0 | ±3.6 |
| Area of Study | González et al. [23] | Arjona et al. [34] | This Work | |||
|---|---|---|---|---|---|---|
| Asc. Orbit | Desc. Orbit | Asc. Orbit | Desc. Orbit | Asc. Orbit | Desc. Orbit | |
| Western flank of Cumbre Vieja volcano | -- | −0.5 cm/year | -- | stable | -- | Stable or no data |
| Eastern flank of Cumbre Vieja volcano | -- | -- | +1 cm/year | -- | +1 cm/year | +1 cm/year |
| Teneguía volcano area | -- | −0.5/−0.8 cm/year | +1 cm/year | −2 cm/year | +0.7 cm/year | −0.8 cm/year |
| Aridane valley | -- | stable | stable | stable | −1 cm/year | +1 cm/year |
© 2020 by the authors. Licensee MDPI, Basel, Switzerland. This article is an open access article distributed under the terms and conditions of the Creative Commons Attribution (CC BY) license (http://creativecommons.org/licenses/by/4.0/).
Share and Cite
Escayo, J.; Fernández, J.; Prieto, J.F.; Camacho, A.G.; Palano, M.; Aparicio, A.; Rodríguez-Velasco, G.; Ancochea, E. Geodetic Study of the 2006–2010 Ground Deformation in La Palma (Canary Islands): Observational Results. Remote Sens. 2020, 12, 2566. https://doi.org/10.3390/rs12162566
Escayo J, Fernández J, Prieto JF, Camacho AG, Palano M, Aparicio A, Rodríguez-Velasco G, Ancochea E. Geodetic Study of the 2006–2010 Ground Deformation in La Palma (Canary Islands): Observational Results. Remote Sensing. 2020; 12(16):2566. https://doi.org/10.3390/rs12162566
Chicago/Turabian StyleEscayo, Joaquín, José Fernández, Juan F. Prieto, Antonio G. Camacho, Mimmo Palano, Alfredo Aparicio, Gema Rodríguez-Velasco, and Eumenio Ancochea. 2020. "Geodetic Study of the 2006–2010 Ground Deformation in La Palma (Canary Islands): Observational Results" Remote Sensing 12, no. 16: 2566. https://doi.org/10.3390/rs12162566
APA StyleEscayo, J., Fernández, J., Prieto, J. F., Camacho, A. G., Palano, M., Aparicio, A., Rodríguez-Velasco, G., & Ancochea, E. (2020). Geodetic Study of the 2006–2010 Ground Deformation in La Palma (Canary Islands): Observational Results. Remote Sensing, 12(16), 2566. https://doi.org/10.3390/rs12162566