1. Introduction
Vegetation phenology and productivity are important drivers of ecosystem function by influencing processes as varied as surface energy balance [
1] and plant species distribution [
2]. Shifts in the timing of plant seasonality occur largely due to annual weather patterns and climate change [
3], and these dynamics have consequences throughout terrestrial ecosystems. For example, phenology and productivity patterns strongly influence animal behavior, survival, and population dynamics [
4]. Shifts in the timing and amount of vegetation can lead to trophic mismatch [
5] and put stress on migratory species resilience and adaptive capacity [
6]. Thus, to understand changes to the scale, rate, spatial configuration, and variability of ecological processes, we need to accurately measure vegetation phenology and productivity at broad spatial and temporal scales [
7].
In recent decades, land surface phenology (LSP), the study of vegetation phenology and productivity from remote sensing, has revolutionized our understanding of ecological responses to phenological change [
8]. LSP observations broaden the spatial scale of data to previously unattainable extents, enabling analyses of regional and continental vegetation patterns over time, with certain datasets extending back more than 30 years. Studies of LSP metrics in recent decades in North America have shown trends toward later senescence in the fall but inconclusive evidence for earlier spring green-up [
9]. Green-up trends within ecological communities are complex, with plant species in the same community often showing opposite responses in both sign and magnitude to general warming patterns [
10]. These trend analyses, along with annual LSP metrics, provide users (researchers, biologists, ecologists, natural resource managers, etc.) from a variety of fields with important insights into ecosystem processes and changing landscape dynamics driven by weather, climate, and human and natural disturbances. However, few studies have provided regional summaries of change that are accessible to users who are managing resources [
7,
11] or provided information on trends in variability of phenology over time. Insights into changing variability is important for wildlife researchers, as environmental predictability may shift habitat use, population density, and movement patterns [
12].
Wildlife biologists began using LSP metrics in the early 2000s to better understand the influence of vegetation on the dynamics and distribution of animal populations including birds [
13,
14] and ungulates such as elk and deer [
4,
8,
15,
16,
17,
18,
19]. For example, the timing of spring has implications for the fitness and body condition of ungulates [
16,
20,
21,
22] and peak instantaneous rate of green-up date (PIRGd), the date half way between start of season (SOS) and peak of season (POS) and representative of optimal forage quality, explains migratory patterns of ungulates surfing the green wave [
23,
24,
25]. In addition, spatial heterogeneity of plant phenology, which may be declining due to warming temperatures, relates to the reproduction rates of caribou [
26]. Autumn phenology, which has received considerably less attention than that of spring, can influence body mass and overwinter survival of mule deer [
4] and migratory patterns of elk and red deer [
18,
27,
28]. In addition to phenology, vegetation productivity is closely correlated to greenness indices such as Normalized Difference Vegetation Index (NDVI) [
8] and explains ungulate habitat use [
24,
29], health characteristics [
30], and demographic parameters [
16].
Changes in the seasonal timing of LSP metrics and the development of new datasets from various satellite platforms have received substantial focus from the remote sensing field [
9,
31,
32,
33,
34]. However, despite the importance of LSP metrics to ecological applications, few studies have tested the quality of competing datasets in measuring LSP metrics against ground or near-surface observations or examined their relative agreement across various land cover types (but see [
32,
35]). Because LSP metrics synthesize information from millions of individual plants and multiple species, large biases across diverse vegetation communities can occur, and metrics may not directly represent the biological processes of the vegetation of interest [
36]. Differences in the processing algorithm of LSP data, such as the use of logistic curve fitting techniques versus splines, can also greatly impact performance [
37]. Although users choose datasets based on their desired temporal and spatial scale, often several datasets exist with similar resolution yet different processing methodologies. A comparison of the quality of freely accessed and commonly derived LSP datasets against near-surface observations would assist users in selecting the best dataset for their application.
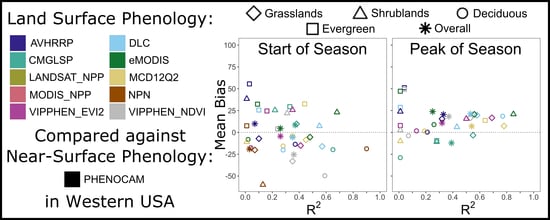
Here, we provide a comparison of commonly used phenology and productivity metrics derived from 10 freely available LSP datasets. We examine correlation and bias in the western United States from 2002 to 2014 with near-surface observations from PhenoCam, a network of cameras spread throughout North America providing data multiple times per day [
38]. We provide users of phenology and productivity metrics derived from remote sensing an indication of the strengths and weaknesses of different datasets, especially as related to land cover. We also compare long-term (1982–2016) trends in phenology from two leading LSP data products to identify spatial patterns, assess the agreement about changing vegetation dynamics over time, and describe changing variability in phenology.
2. Materials and Methods
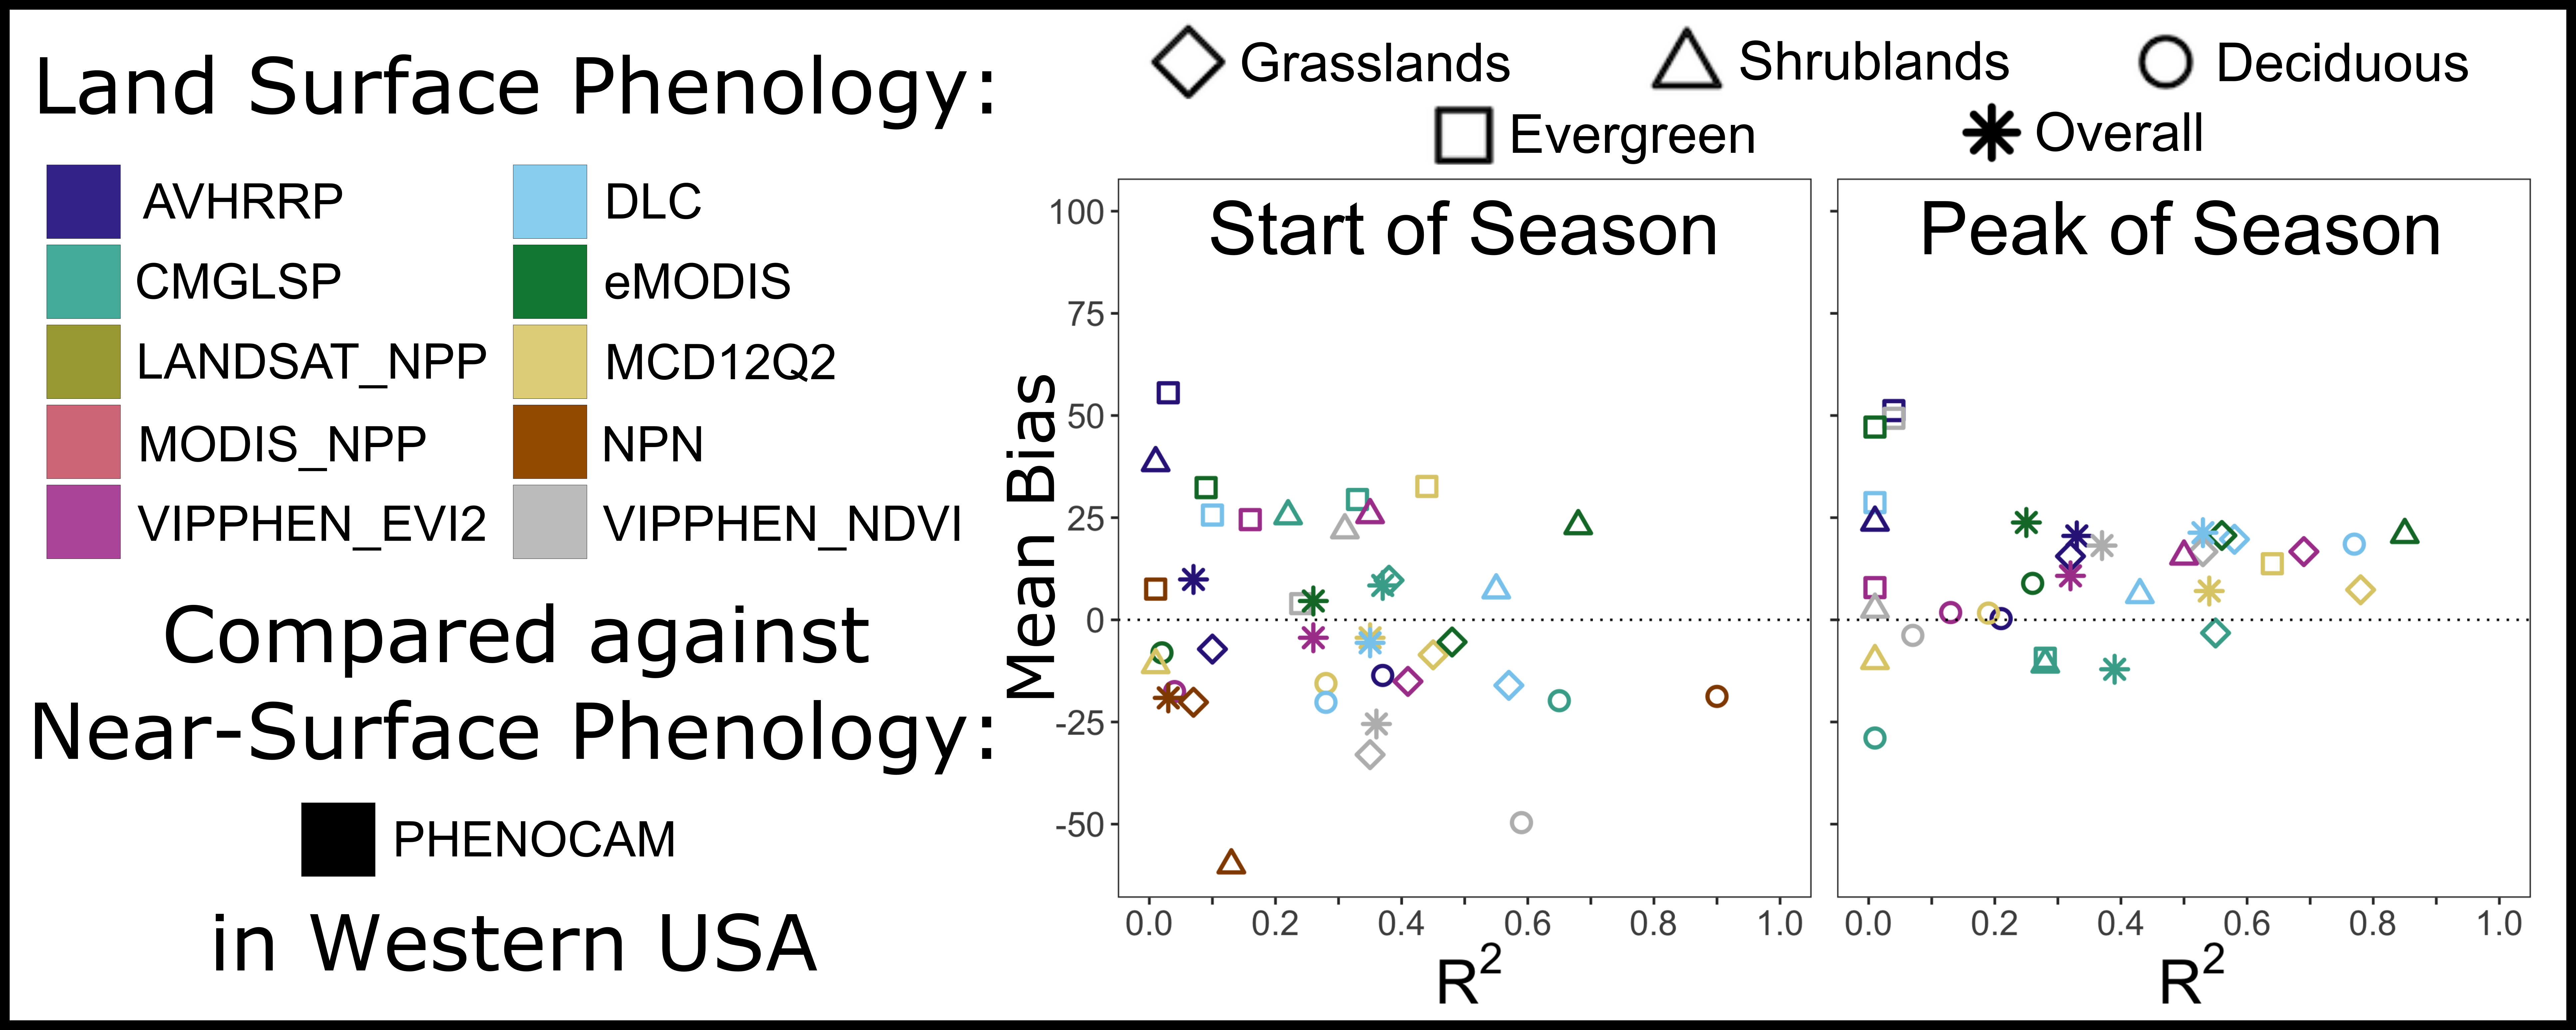
We evaluated six phenology and three productivity metrics across the western United States, which represents a diverse range of ecosystems and land cover types (
Figure 1). To evaluate agreement with PhenoCam data, we focused on 10 datasets from 2002 to 2014 (
Table 1), comparing overall agreement and agreement within land cover types. We then assessed long-term trends using a subset of more strongly associated datasets from 1982 to 2016.
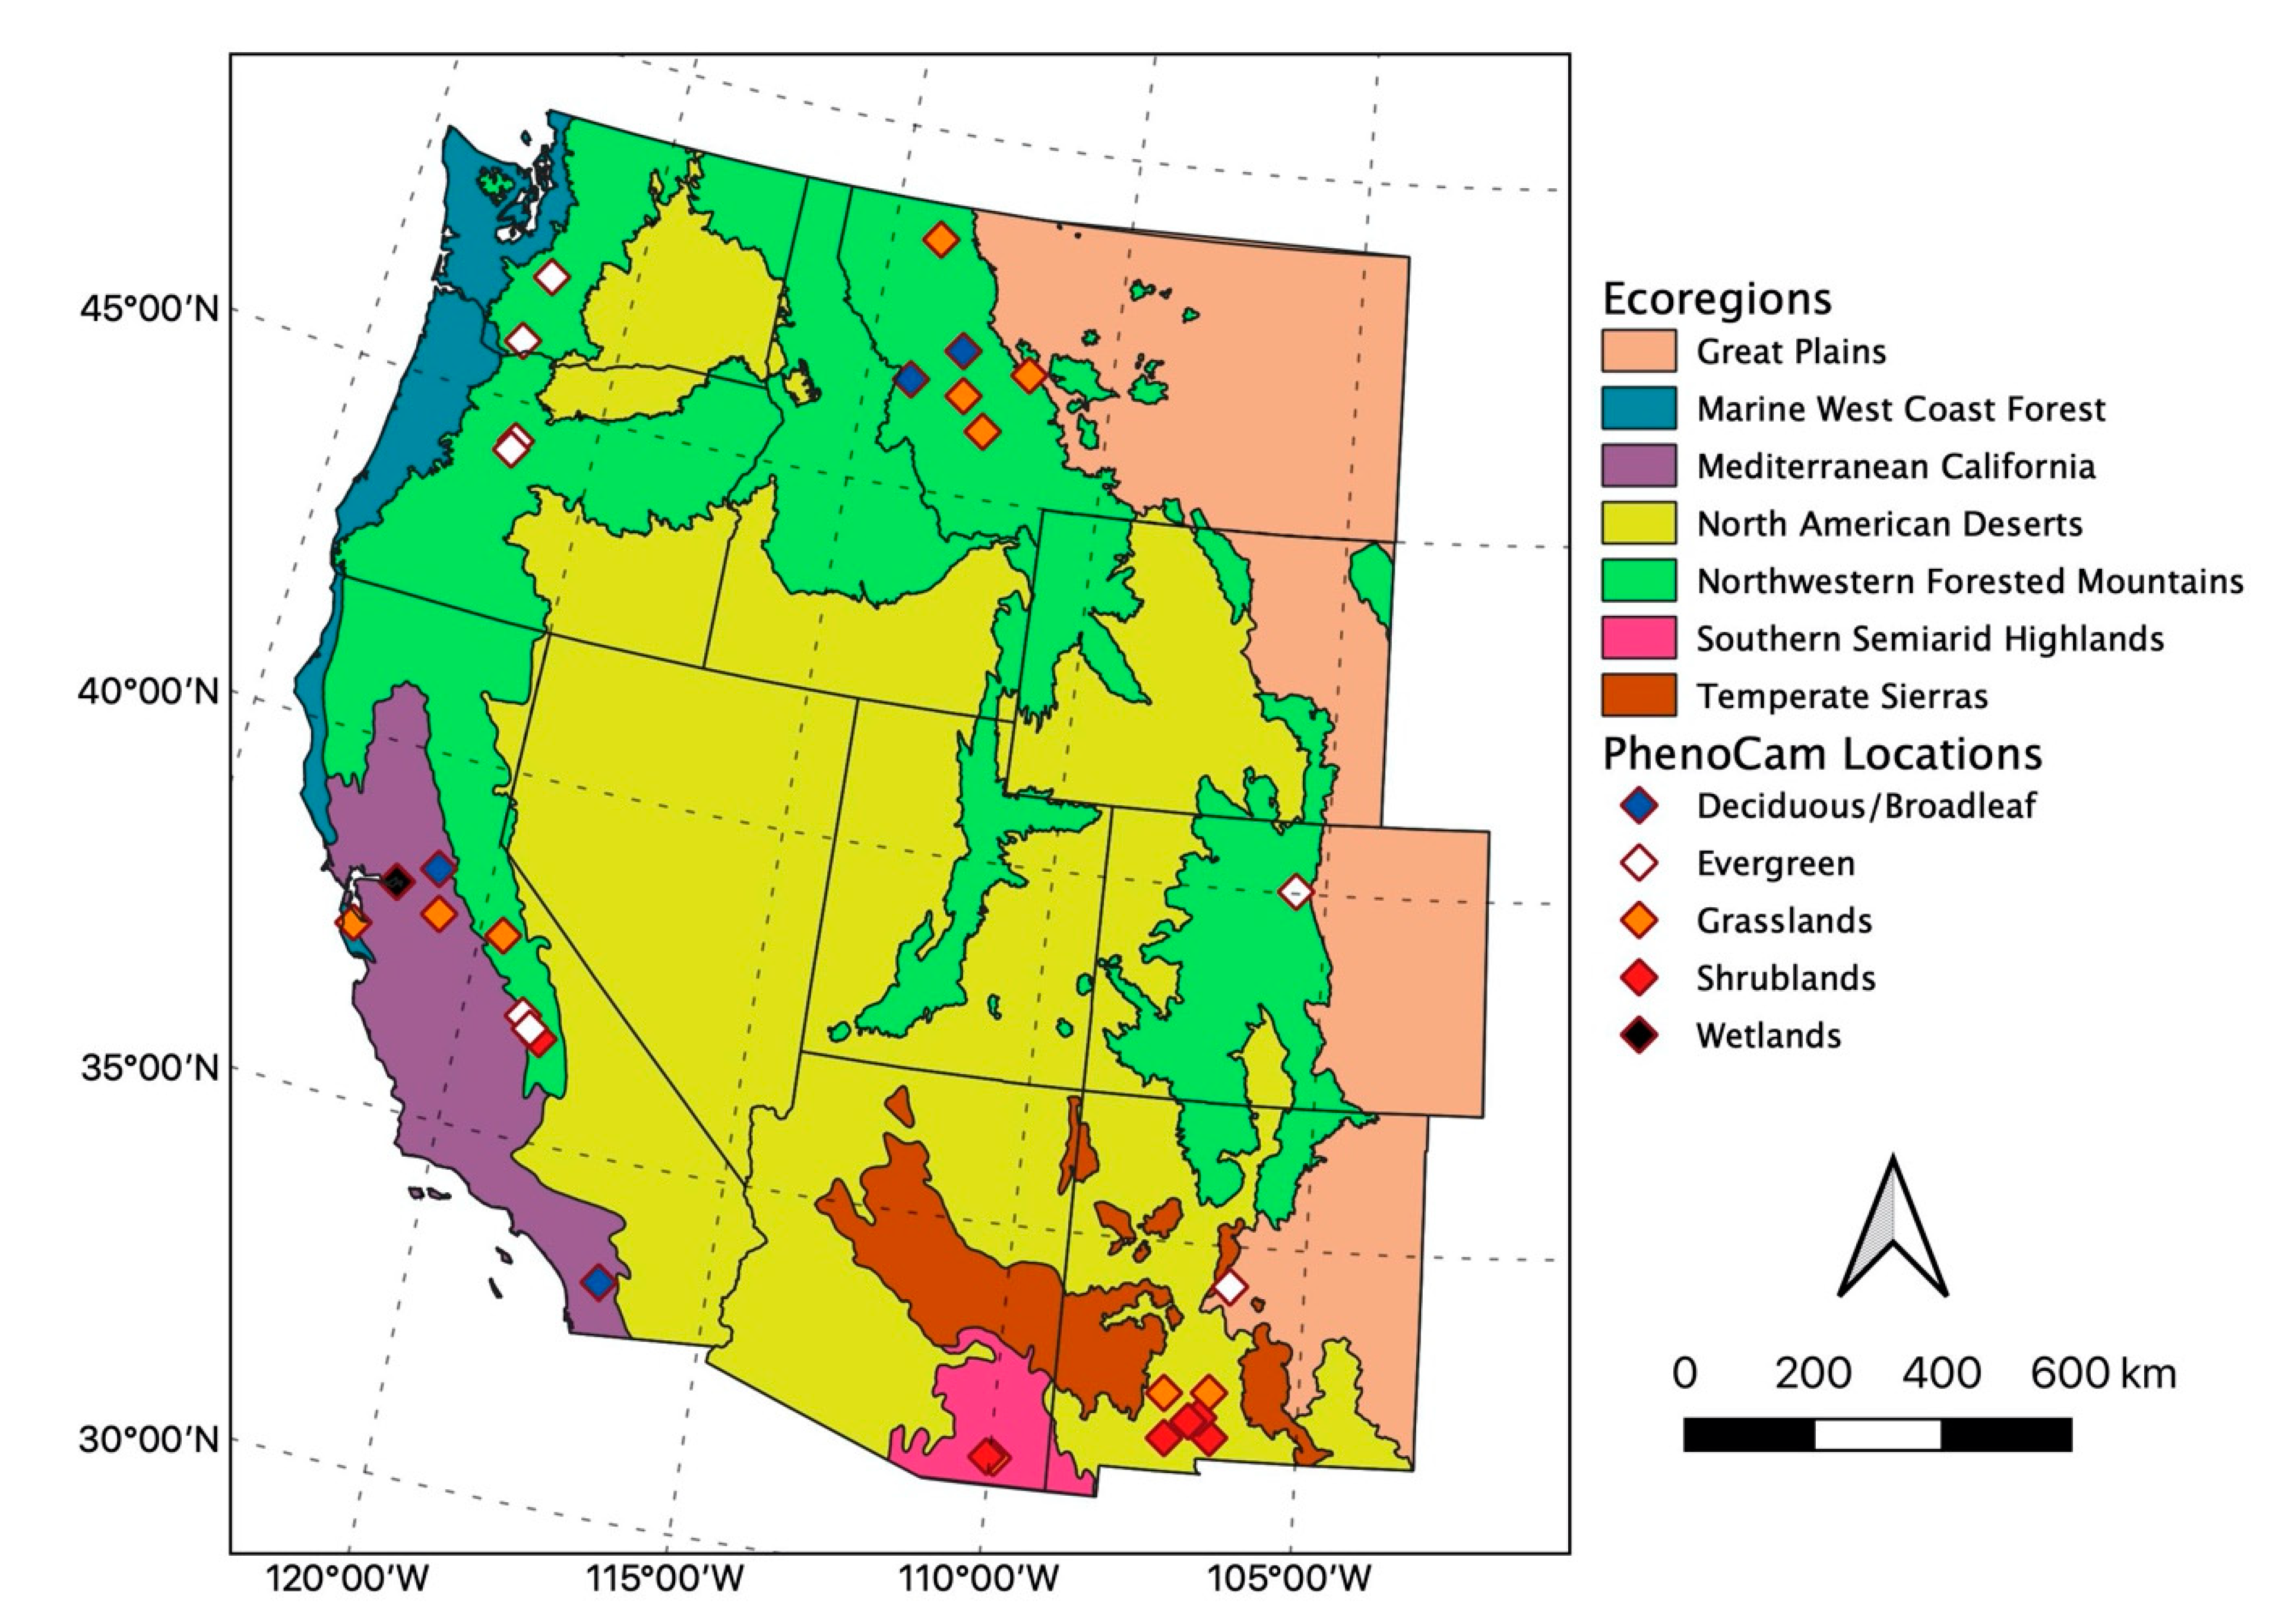
Phenology and productivity metrics can be derived from reflectance values recorded in optical satellite imagery. Optical satellite imagery captures differences in the reflectance of vegetation through phenology cycles. Most commonly users measure vegetation indices as a ratio between reflectance in the visual and near-infrared parts of the electromagnetic spectrum, with slightly different formulas for NDVI and Enhanced Vegetation Index (EVI; [
40]). From curves describing the cycle of change, users extract and evaluate key LSP phenology and productivity metrics including those evaluated here (
Figure 2): SOS, PIRGd, POS, end of season (EOS), length of spring (LOSp), length of growing season (LGS), integrated vegetation index (IVI), peak vegetation index (PVI), and amplitude of vegetation index (AVI).
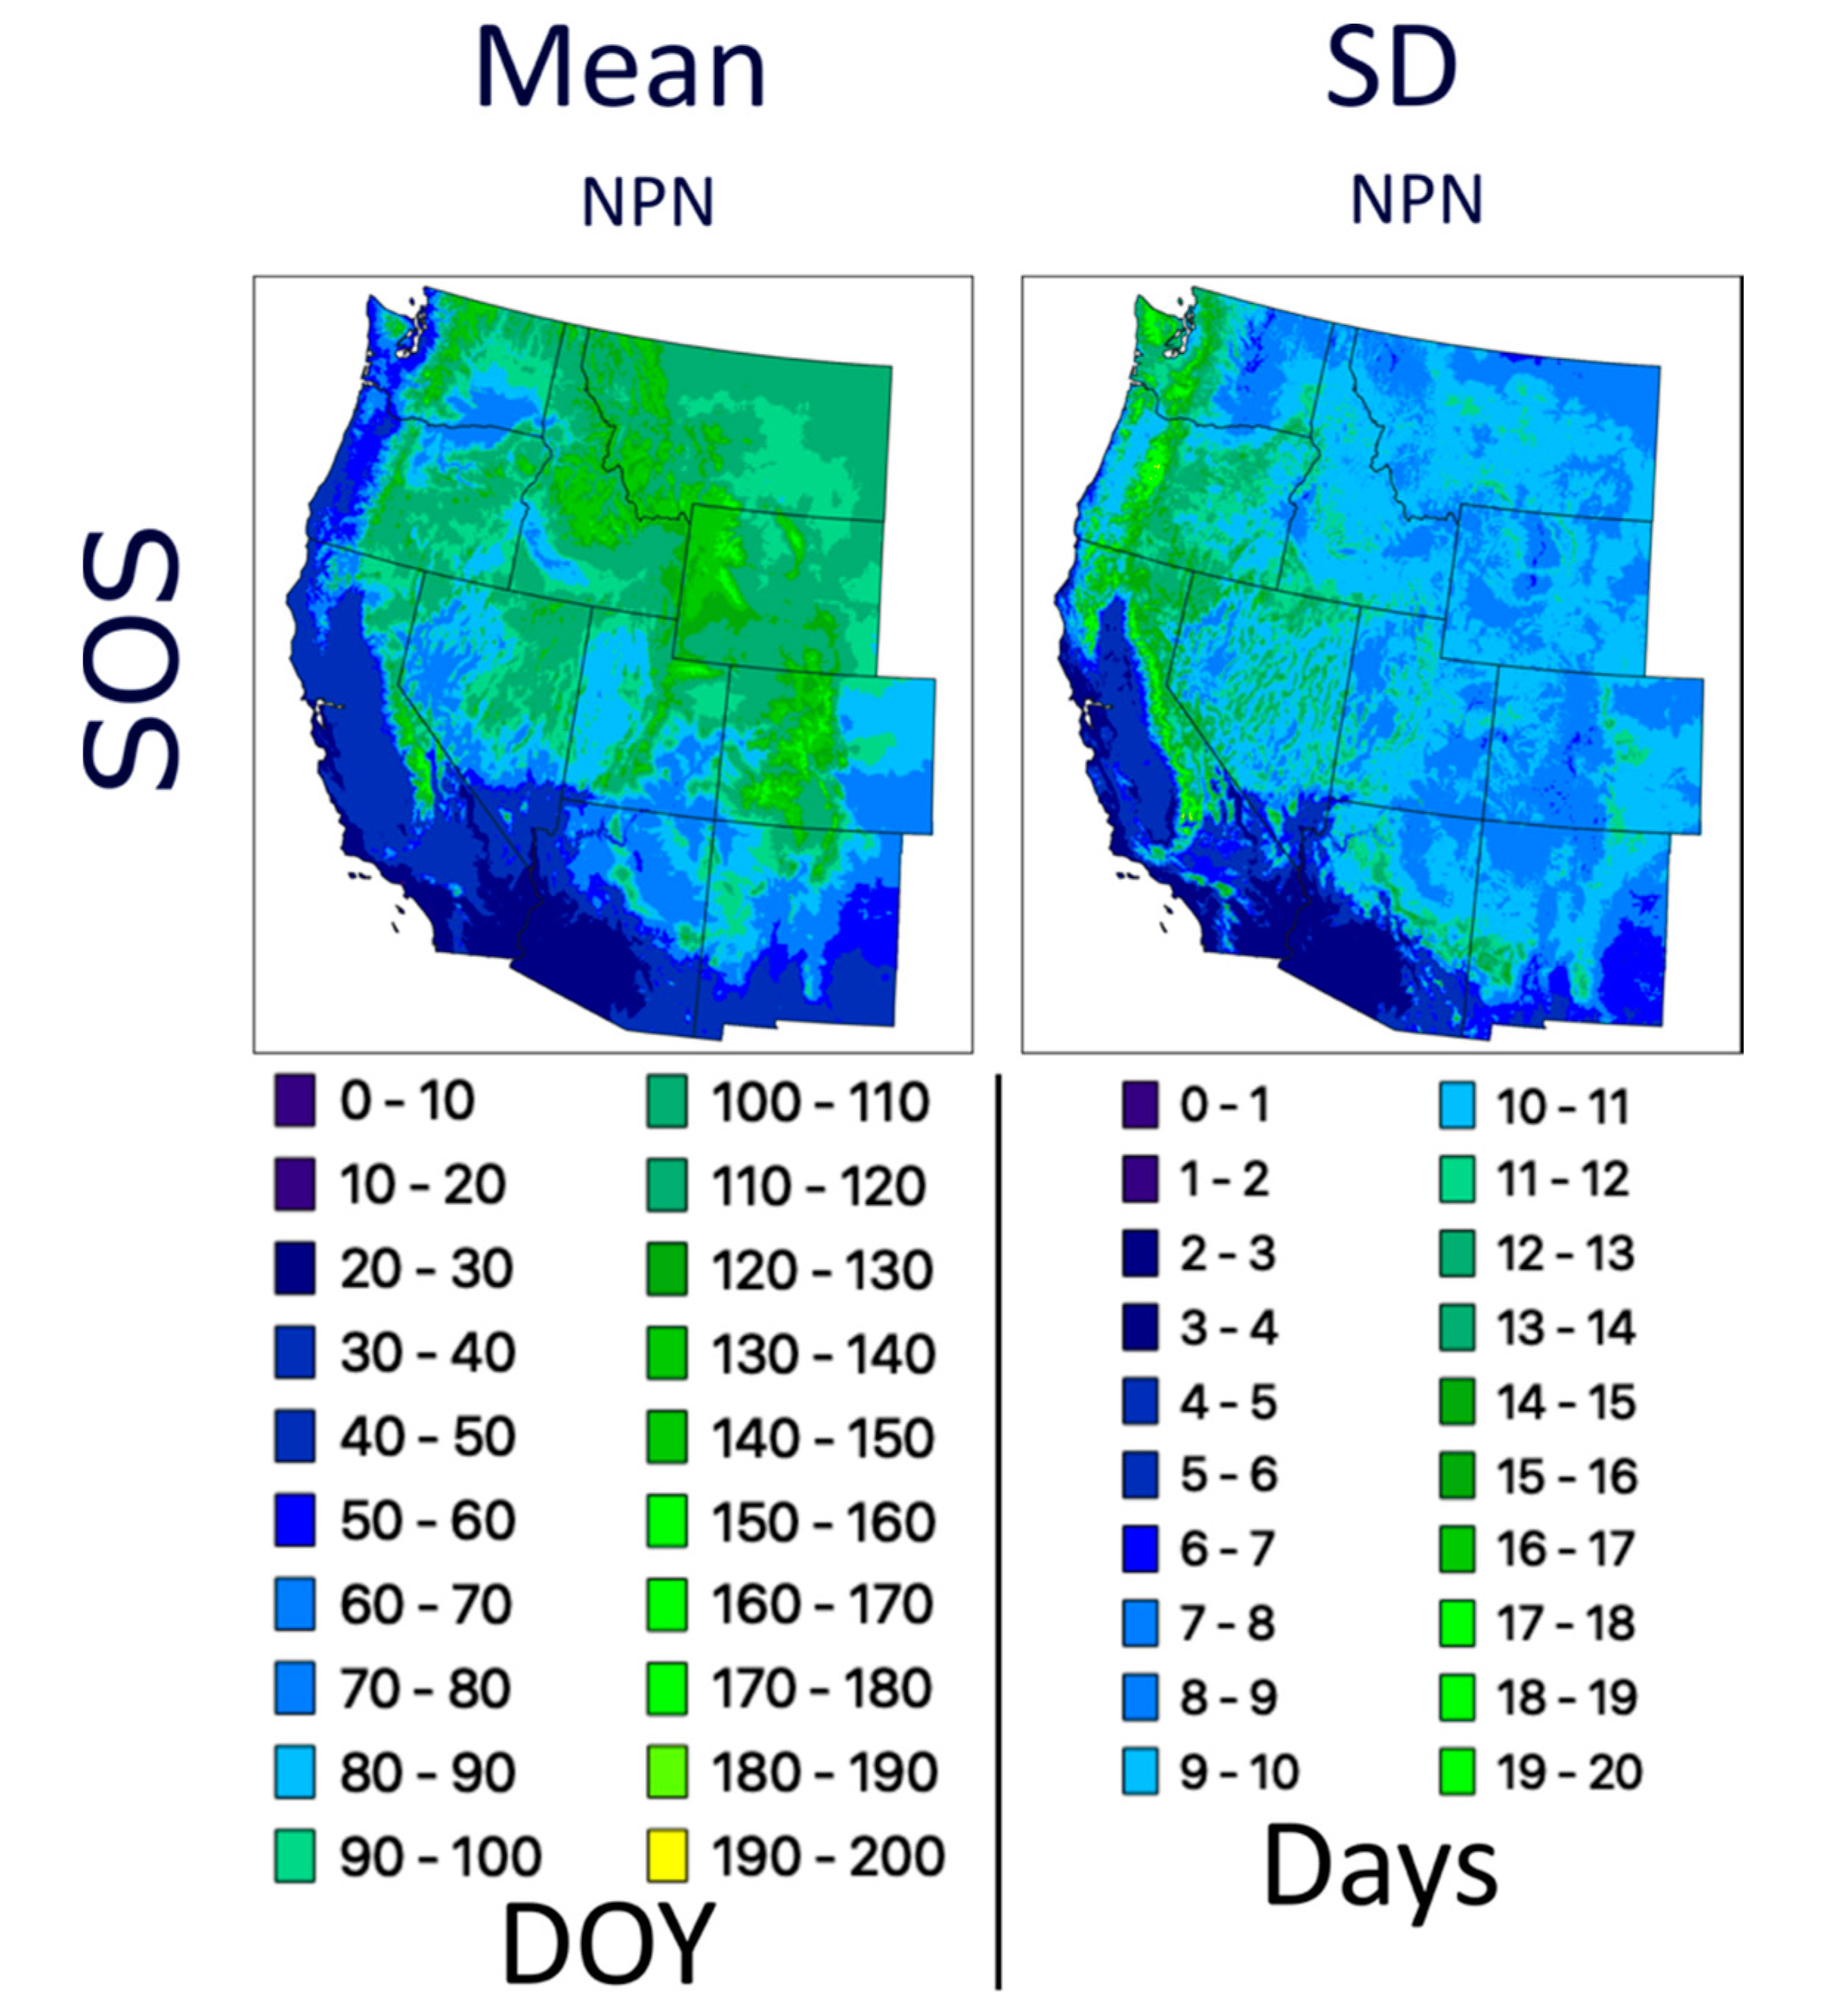
Most datasets we evaluated use NDVI or EVI calculated from the surface reflectance of the Moderate Resolution Imaging Spectroradiometer (MODIS) or Advanced Very High Resolution Radiometer (AVHRR) sensors (
Table 1). We also evaluated one dataset, the National Phenology Network first leaf spring index, hereinafter referred to as NPN, that models spatially explicit temperature measurements parametrized via an extensive network of in situ phenological observations [
41]. This is the only dataset evaluated that does not incorporate optical satellite imagery, but we included it because it is readily available and provides annual SOS estimates across the contiguous United States (CONUS). We also assessed two net primary productivity (NPP) datasets (CONUS Landsat NPP and CONUS MODIS NPP) that combine remote sensing with meteorological data and plant physiological parameters [
42]. Because they represent the total productivity across the season, we include NPP in the IVI comparisons. AVI and PVI both measure the height of the curve at the peak, but AVI only includes the height from the baseline to the peak. Spatial resolutions spanned 30 m to approximately 5 km (0.05 degrees) and all data were freely available. Most datasets required minimal code and memory because the relevant phenology and productivity metrics were pre-processed and could be downloaded directly (e.g., SOS, POS, and EOS;
Table 1). When necessary, we derived metrics (e.g., PIRGd and LOSp) from available metrics (see
Appendix A Table A1 and Equations (A1)–(A7) for a complete description of metric availability, source, and derivation formula). We calculated all metrics for one dataset based on MODIS MOD09Q1 NDVI (referred to as DLC for “double logistic curve”), fitting a double logistic curve and accounting for snow cover following methods of [
24], because of its use in many wildlife applications.
To compare datasets, we evaluated the agreement of LSP metrics from each dataset with metrics from PhenoCam data [
48] at 29 sites (106 site-years) across the western United States (
Figure 1) from 2002 to 2014. Using the R package phenocamr [
49], we downloaded 3 day window PhenoCam data and calculated the 90th percentile green chromatic coordinate (GCC; Equation (1)). The 90th percentile value effectively accounts for day-to-day variation due to weather and illumination patterns [
50]. We defined rising and falling phenophases with a 10% amplitude threshold (to derive SOS and EOS) as described in PhenoCam documentation [
48,
50]. We chose the 10% threshold because it more closely resembles SOS than a 25% or 50% threshold and minimizes the bias between PhenoCam transition dates and MODIS transition dates [
35]. GCC is a vegetation index derived from RGB camera imagery and is defined as:
where DNG, DNR, and DNB represent the digital number (i.e., strength) of the green, red, and blue channels, respectively.
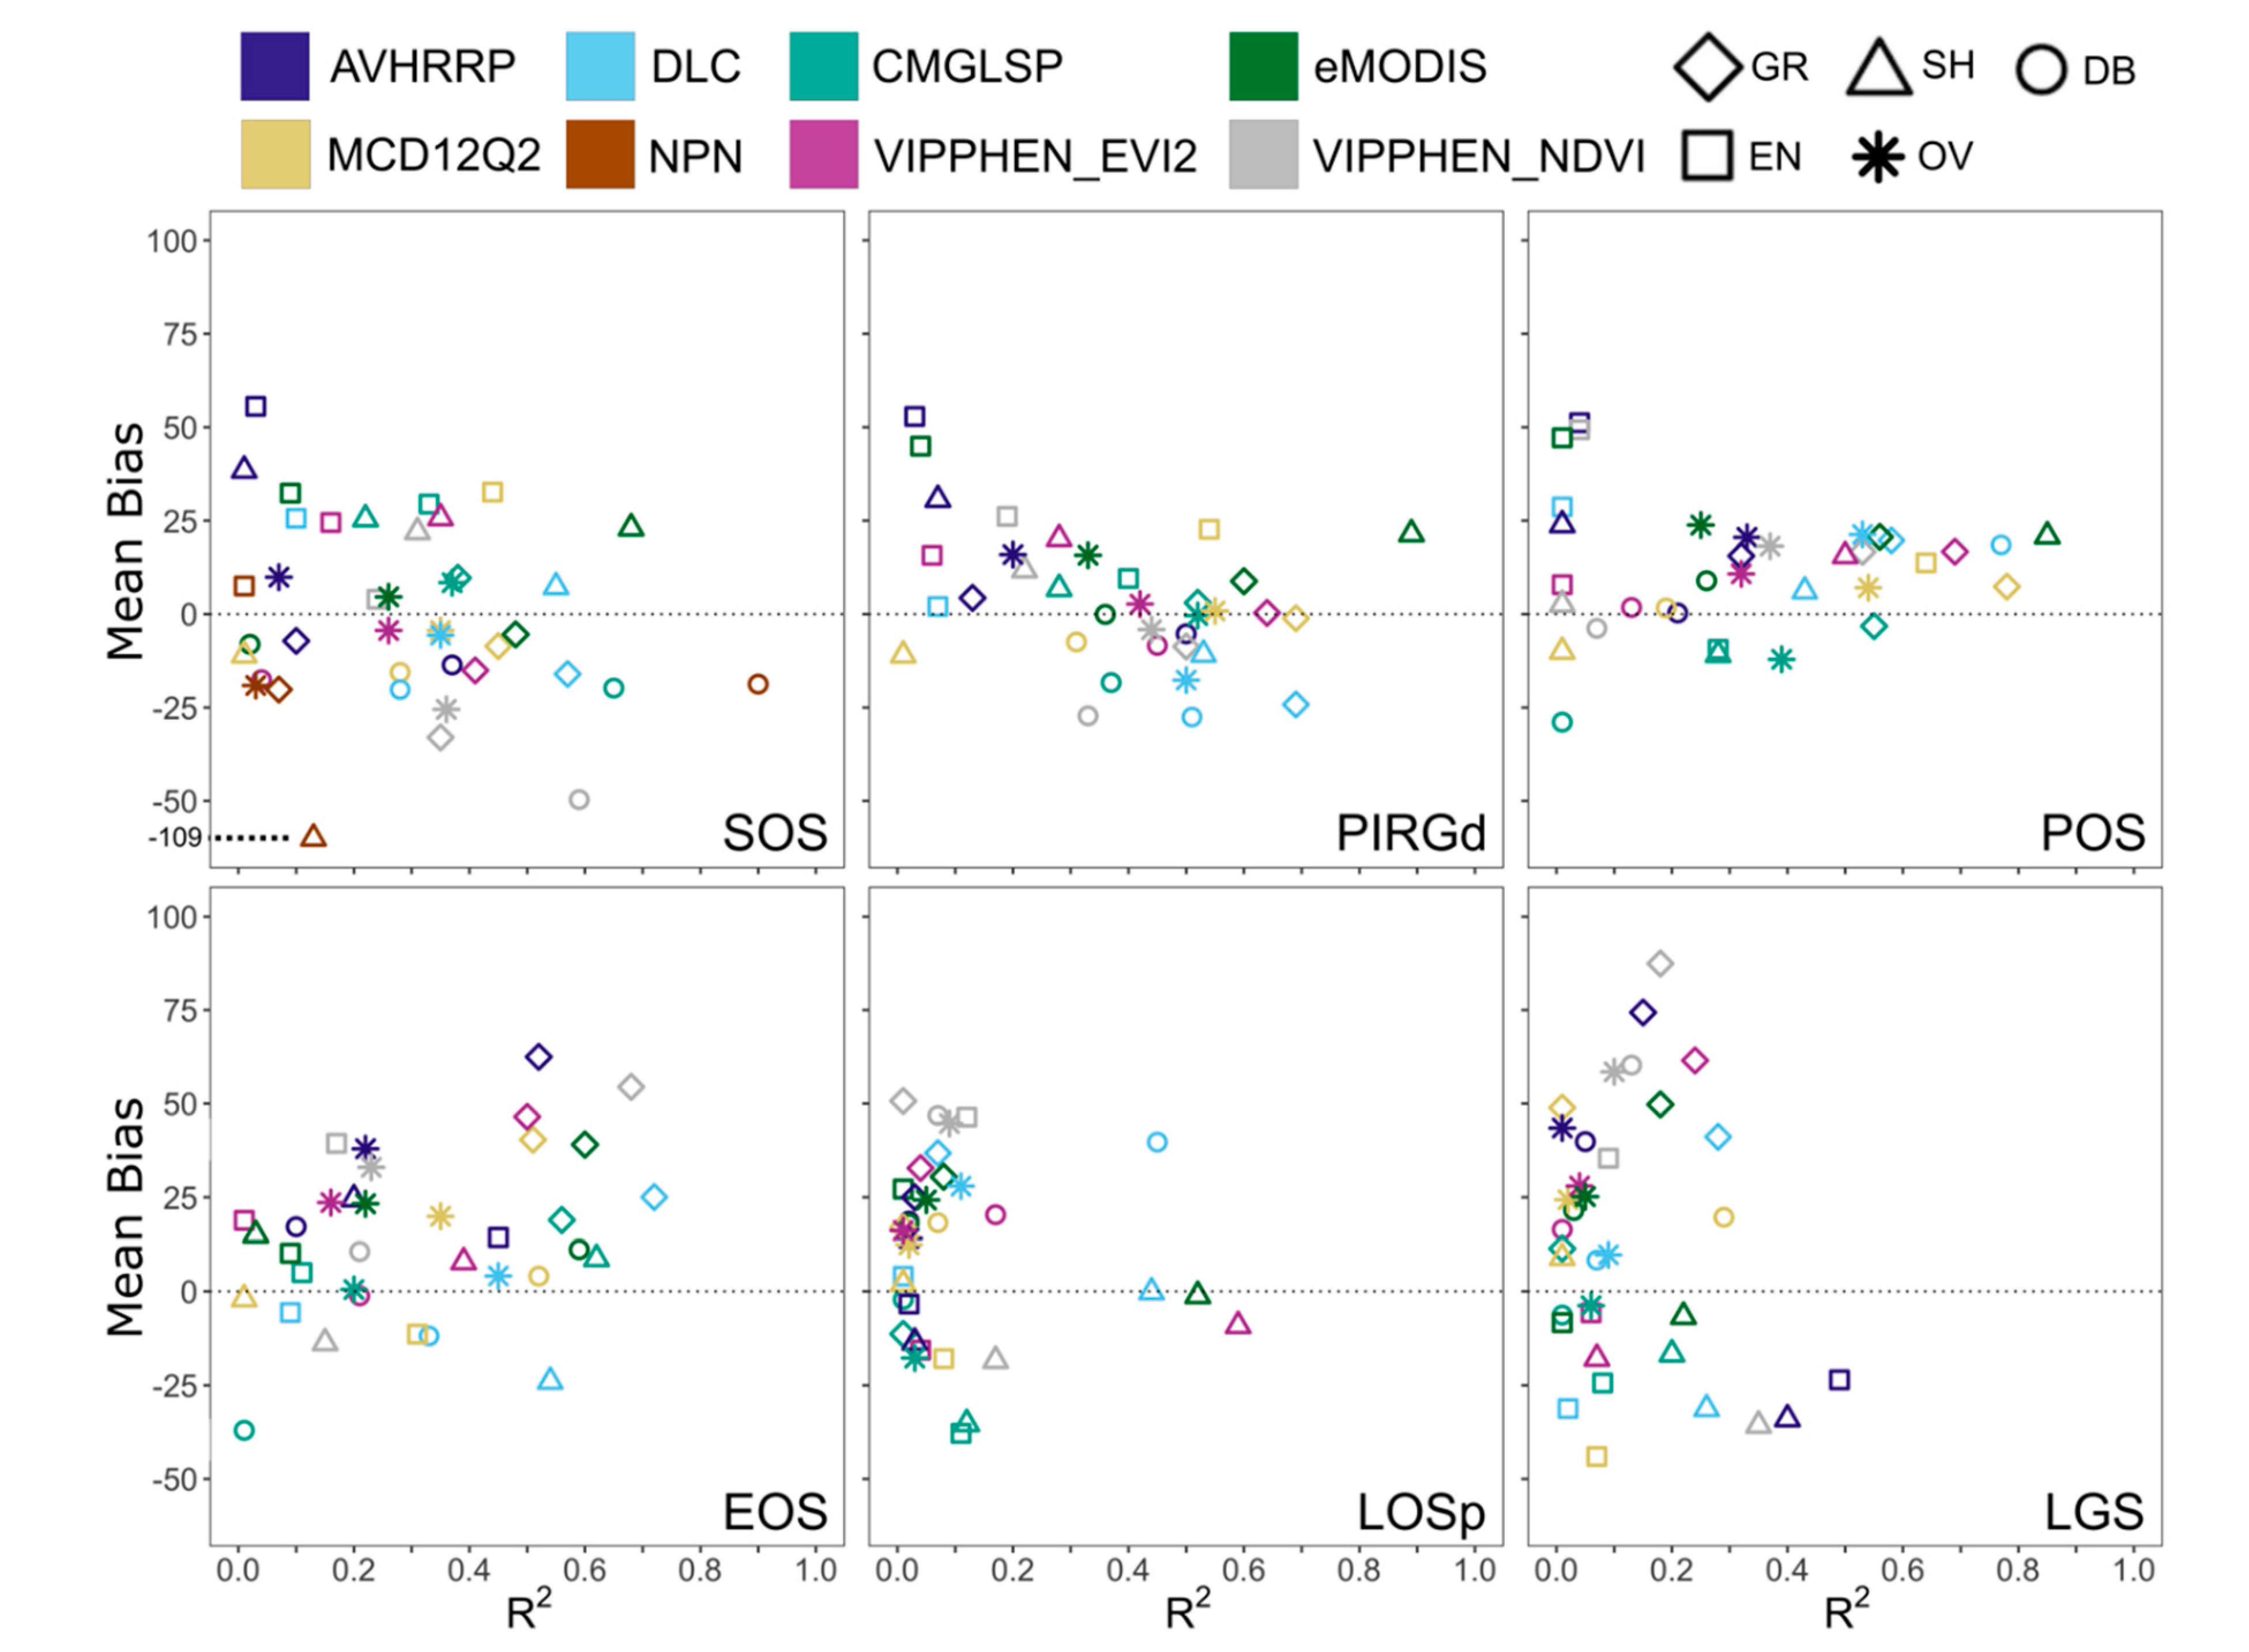
To assess the agreement of LSP metrics with PhenoCam, we compared correlation using the coefficient of determination (R
2) and the magnitude of difference using mean bias. These common measures of statistical agreement have been previously used to compare LSP and near-surface phenology [
36,
51,
52]. Mean bias is defined as:
where est
i and obs
i are the ith estimate (from LSP dataset) and observation (from PhenoCam) respectively. For productivity metrics, scales differ across datasets and thus we focused on correlation. We compared both overall agreement and agreement by landcover type, using the following vegetation types defined for PhenoCam sites (PhenoCam metadata: grasslands (GR, 45 site-years), shrublands (SH, 7 site-years), deciduous/broadleaf (DB, 27 site-years), evergreen (EN, 25 site-years), and wetlands (2 site-years). We excluded two sites in the Mediterranean California ecoregion that displayed a non-northern-temperate seasonal signal (SOS > 225) because green-up begins in late fall with rainfall and ends in early spring with drought. We excluded wetlands from the analysis by land cover classification due to the limited number of sites.
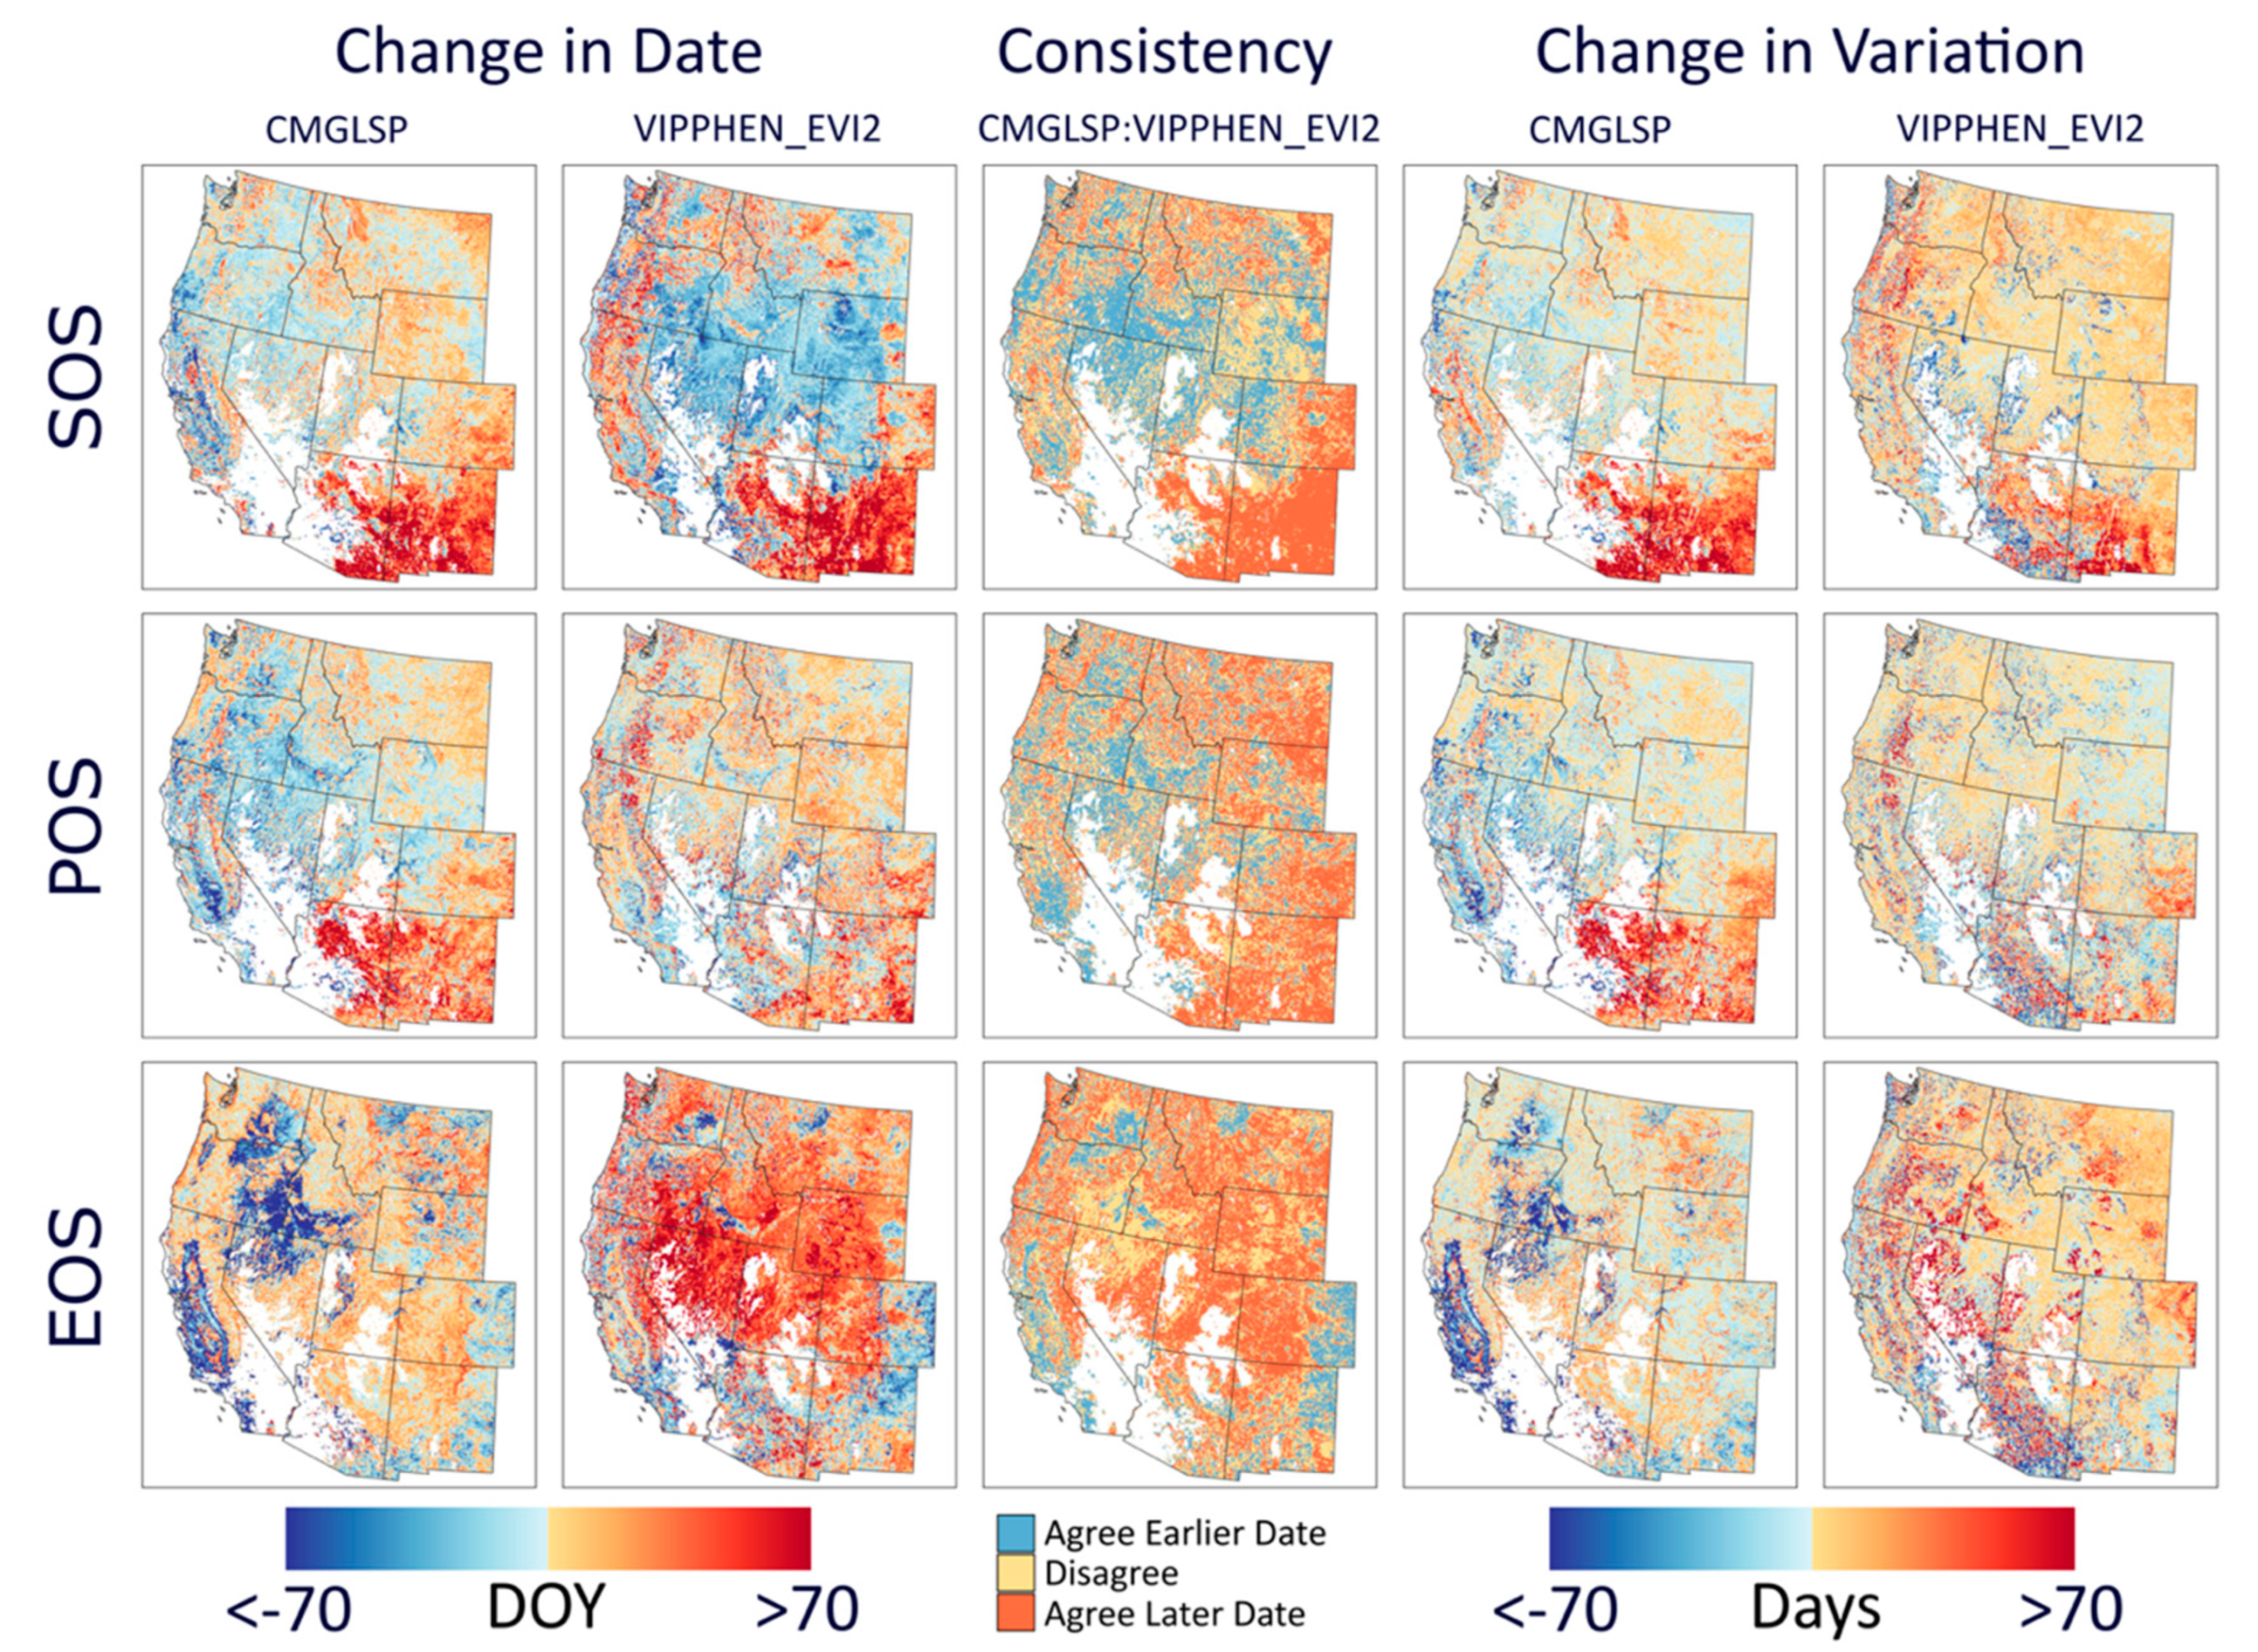
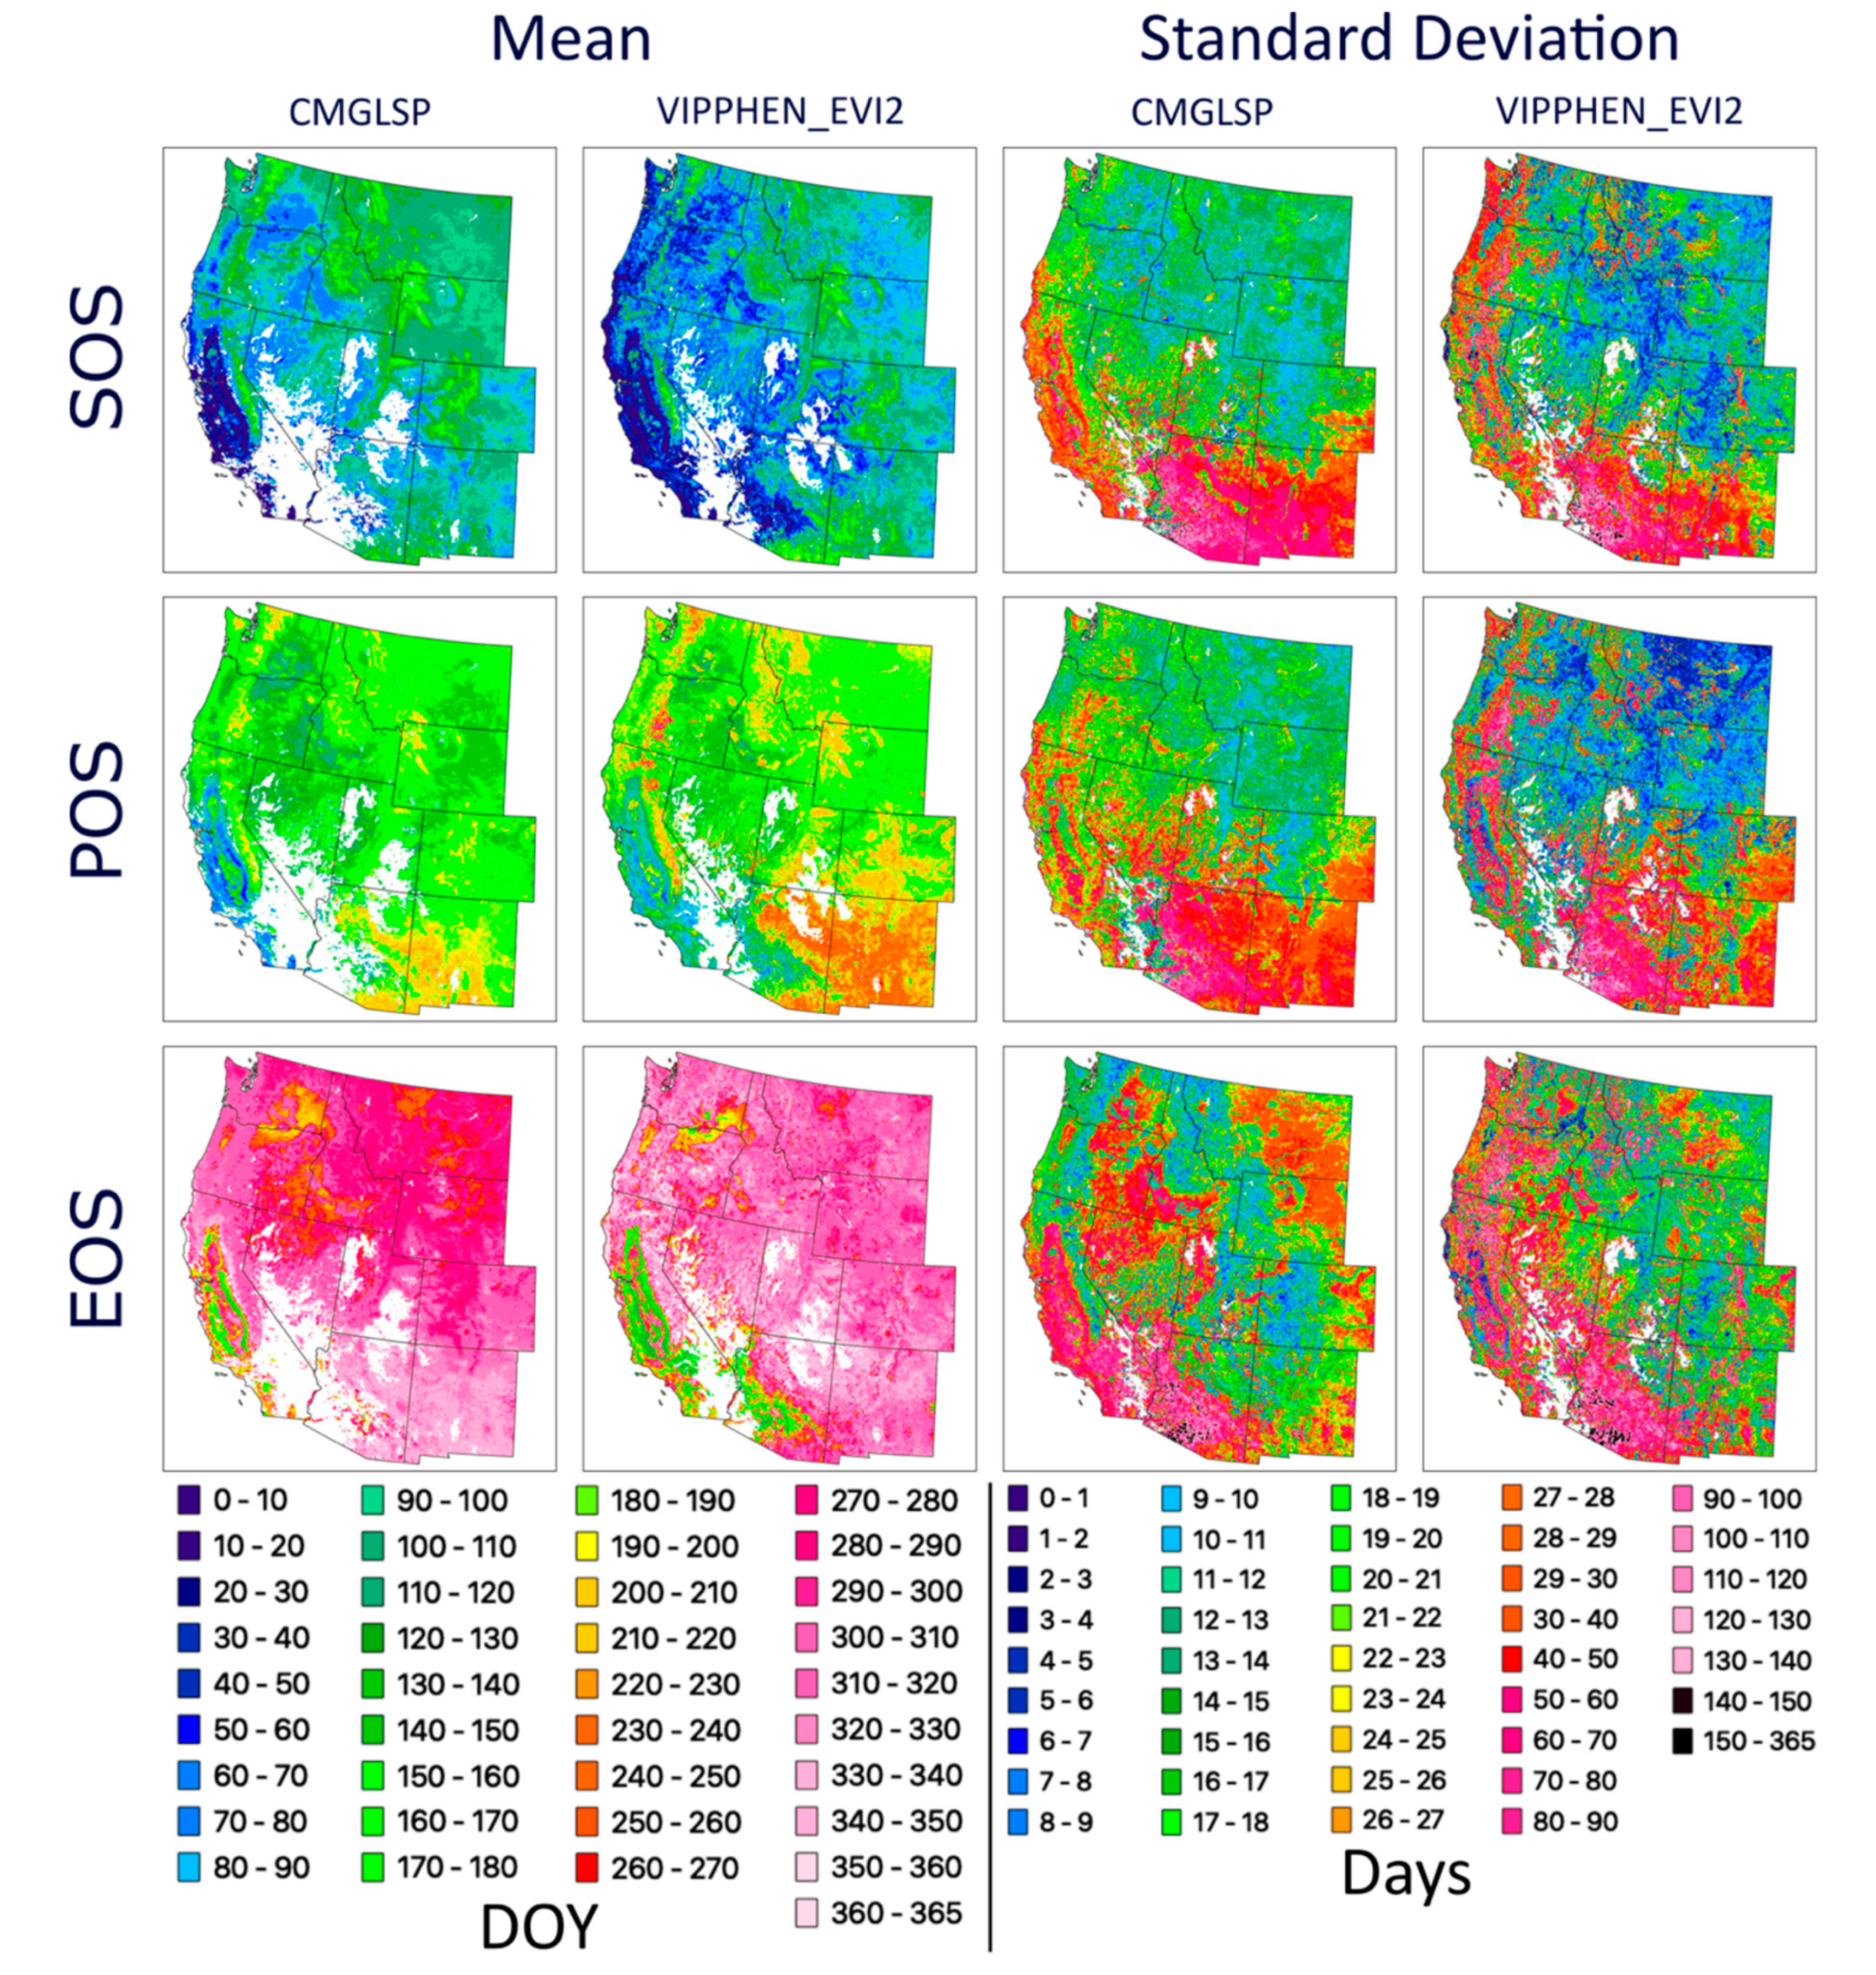
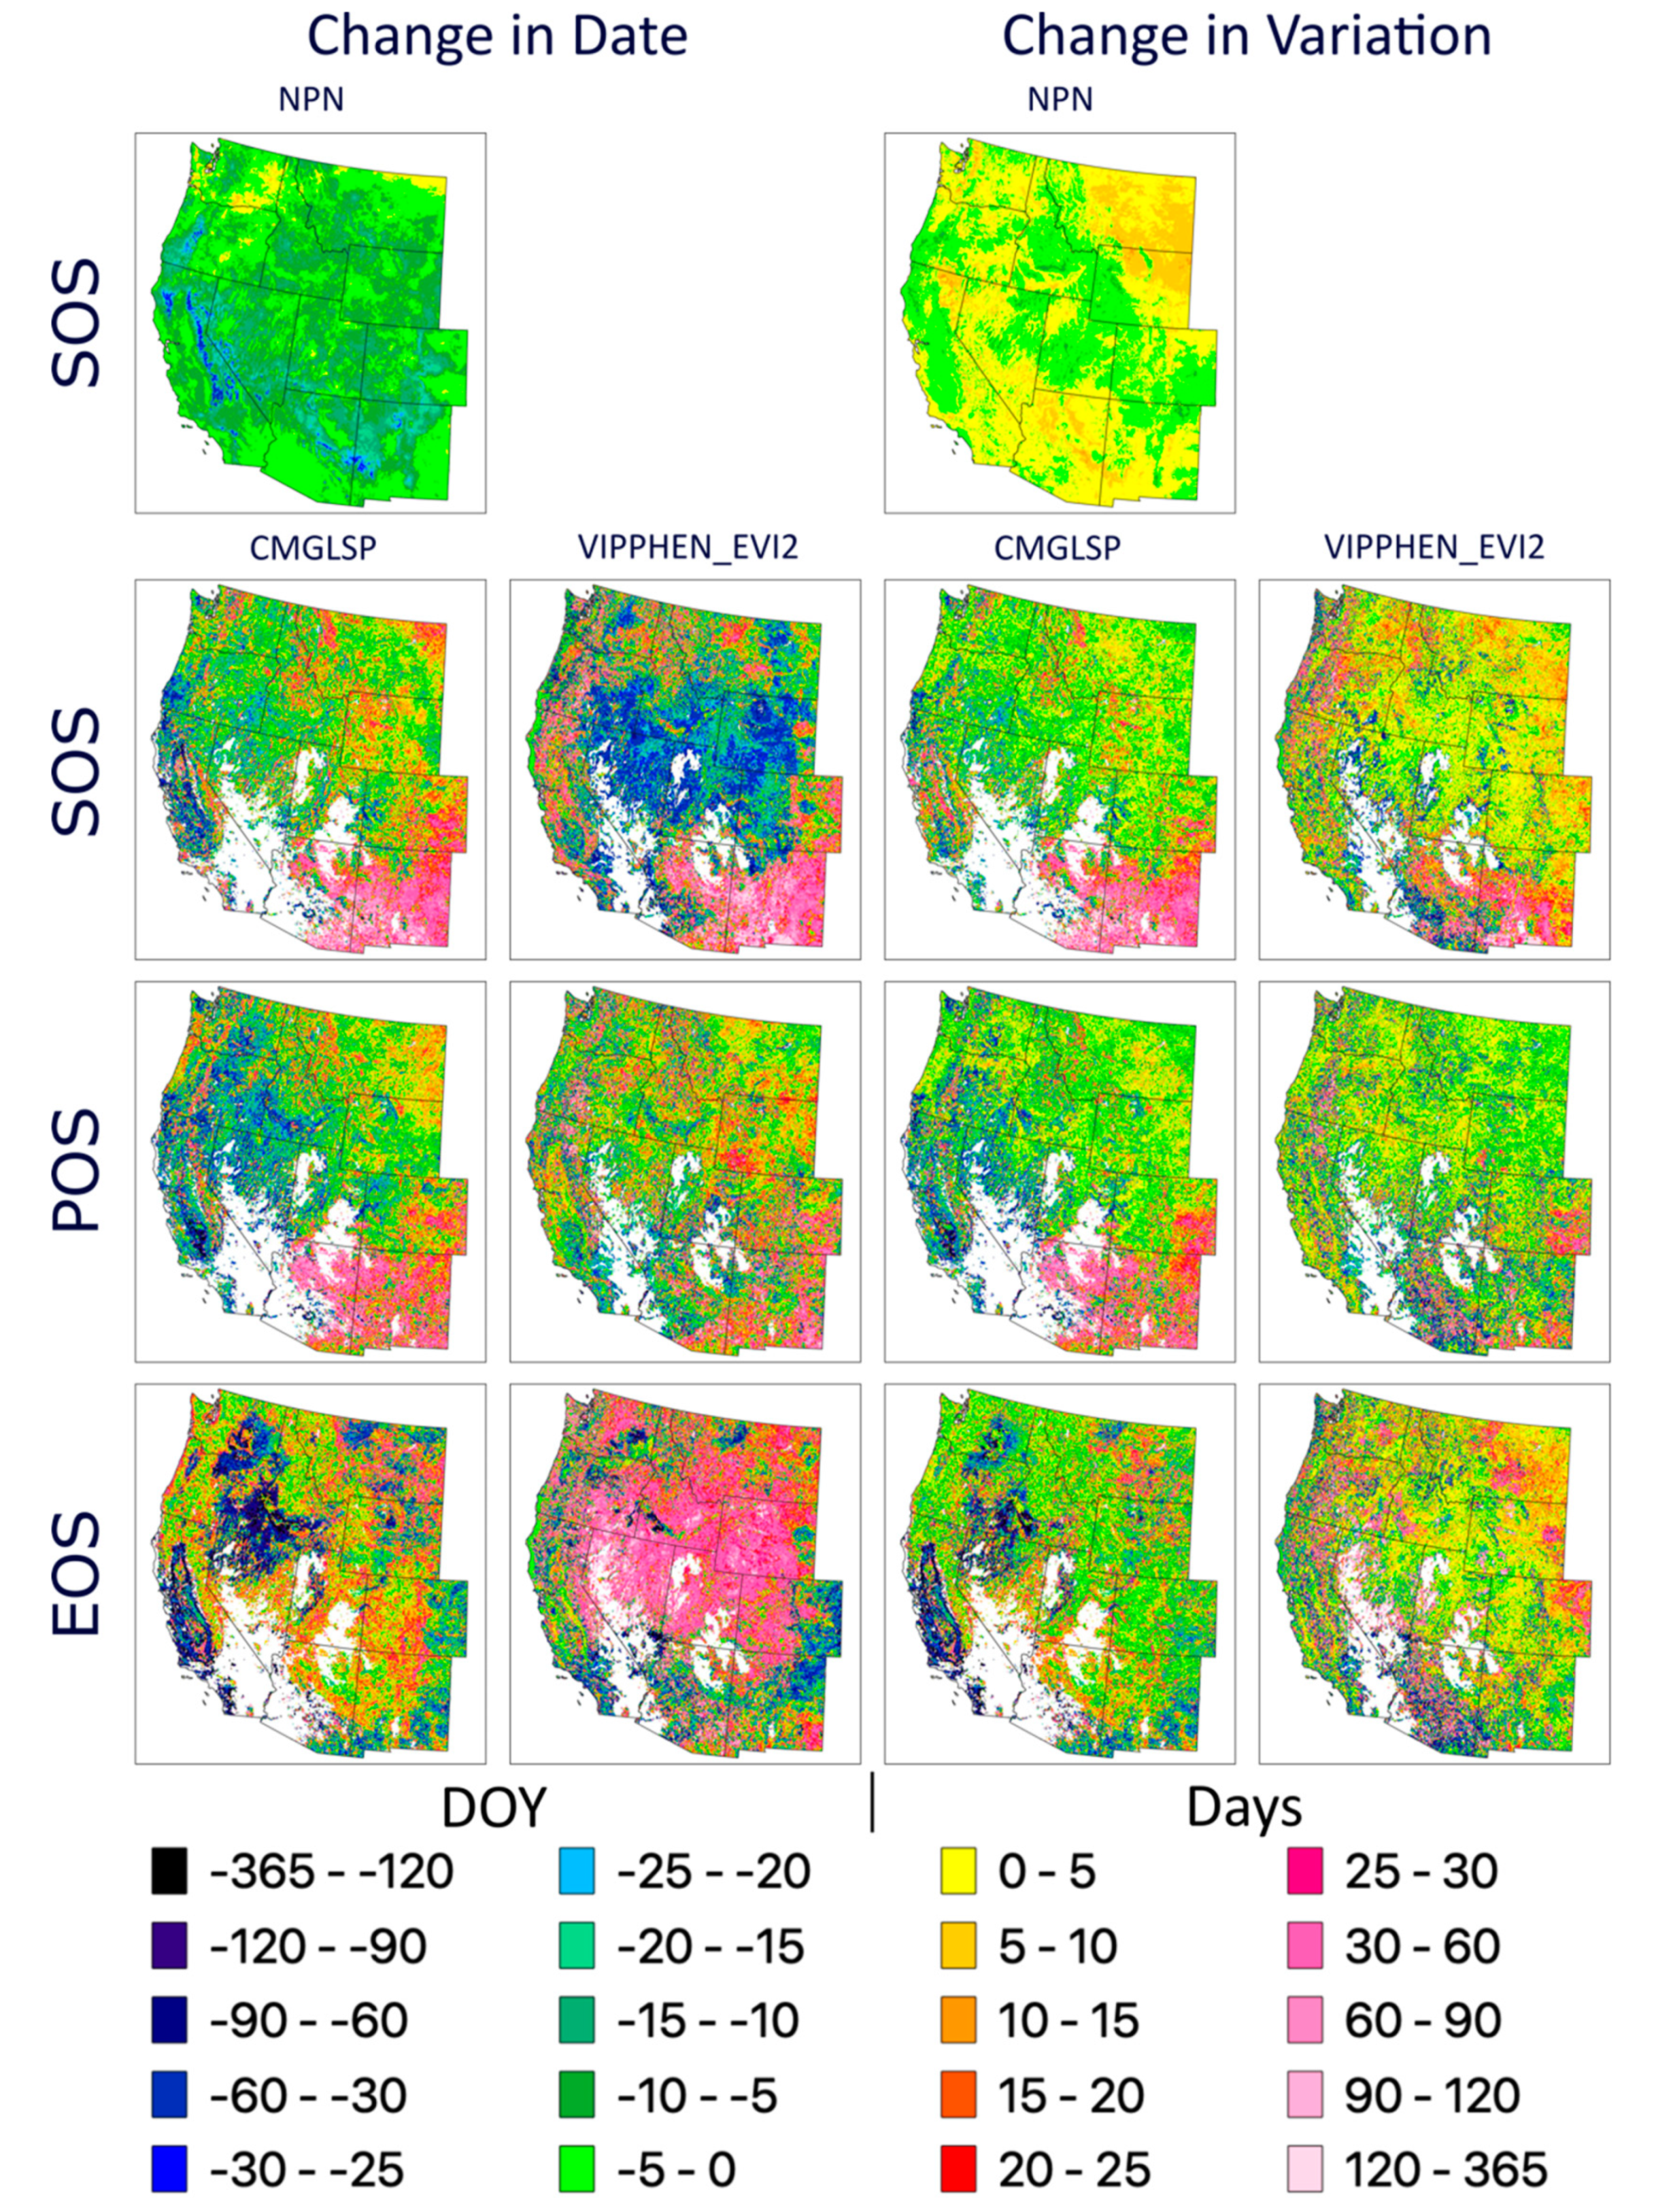
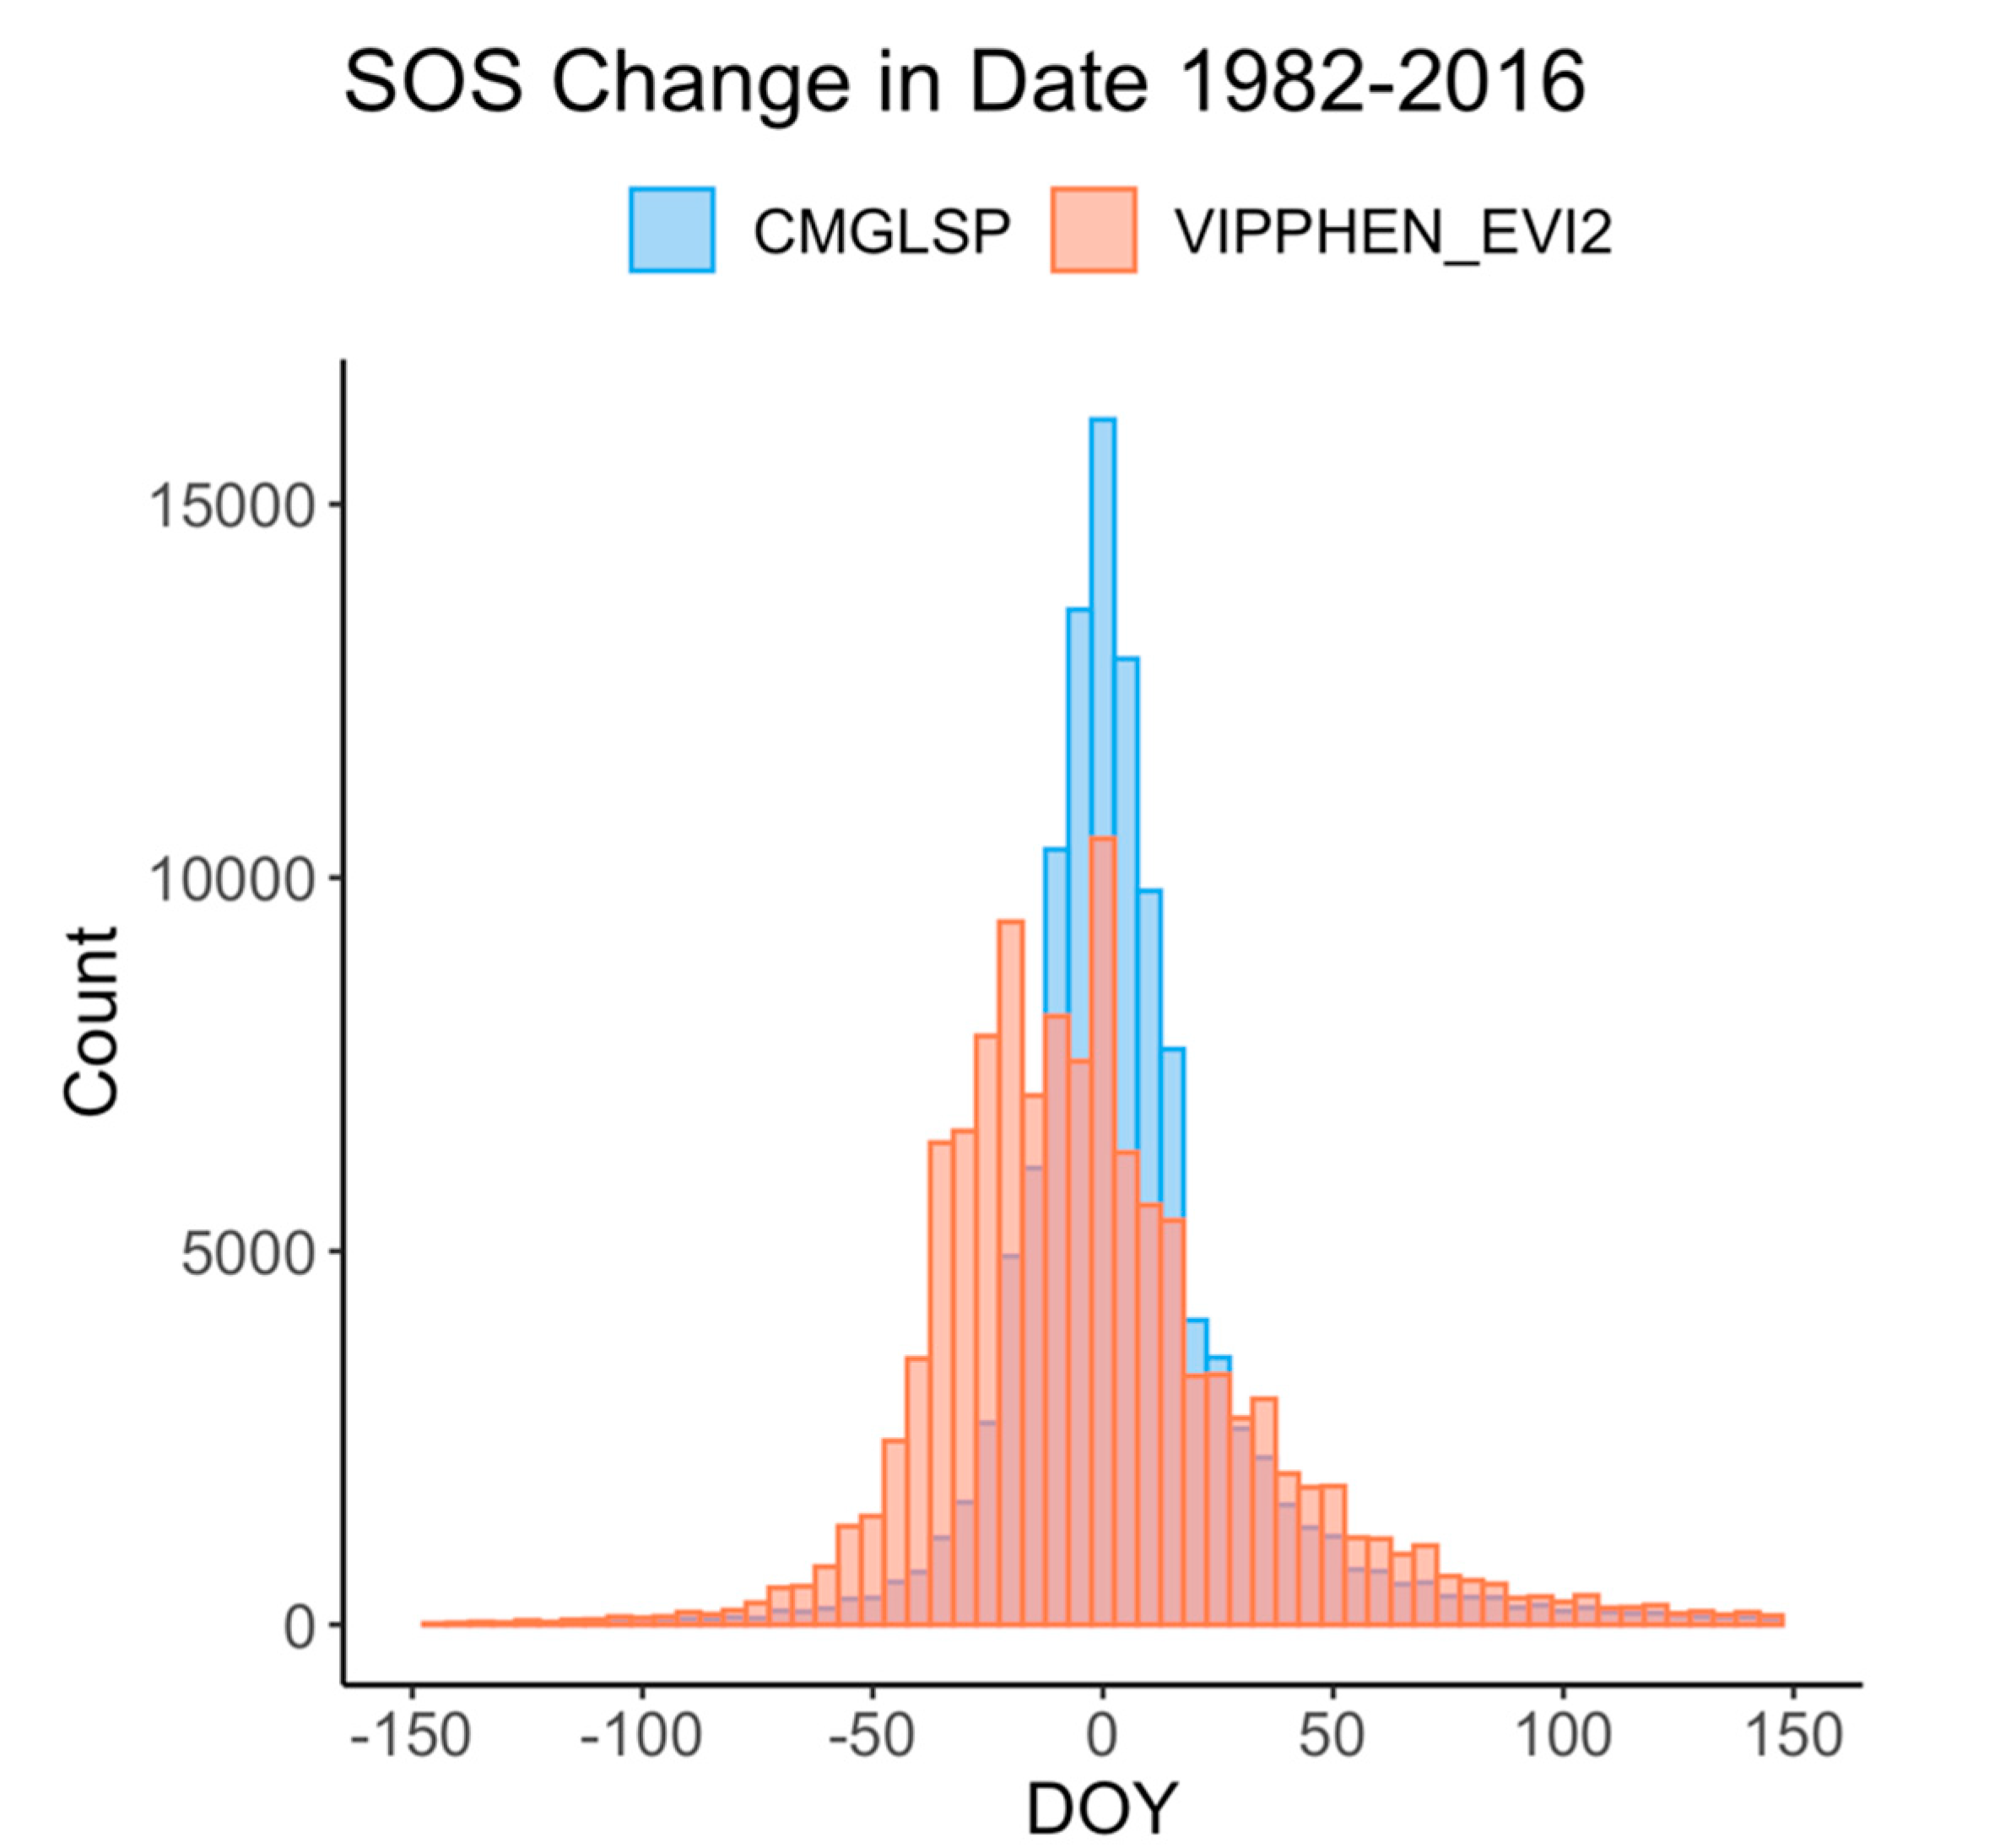
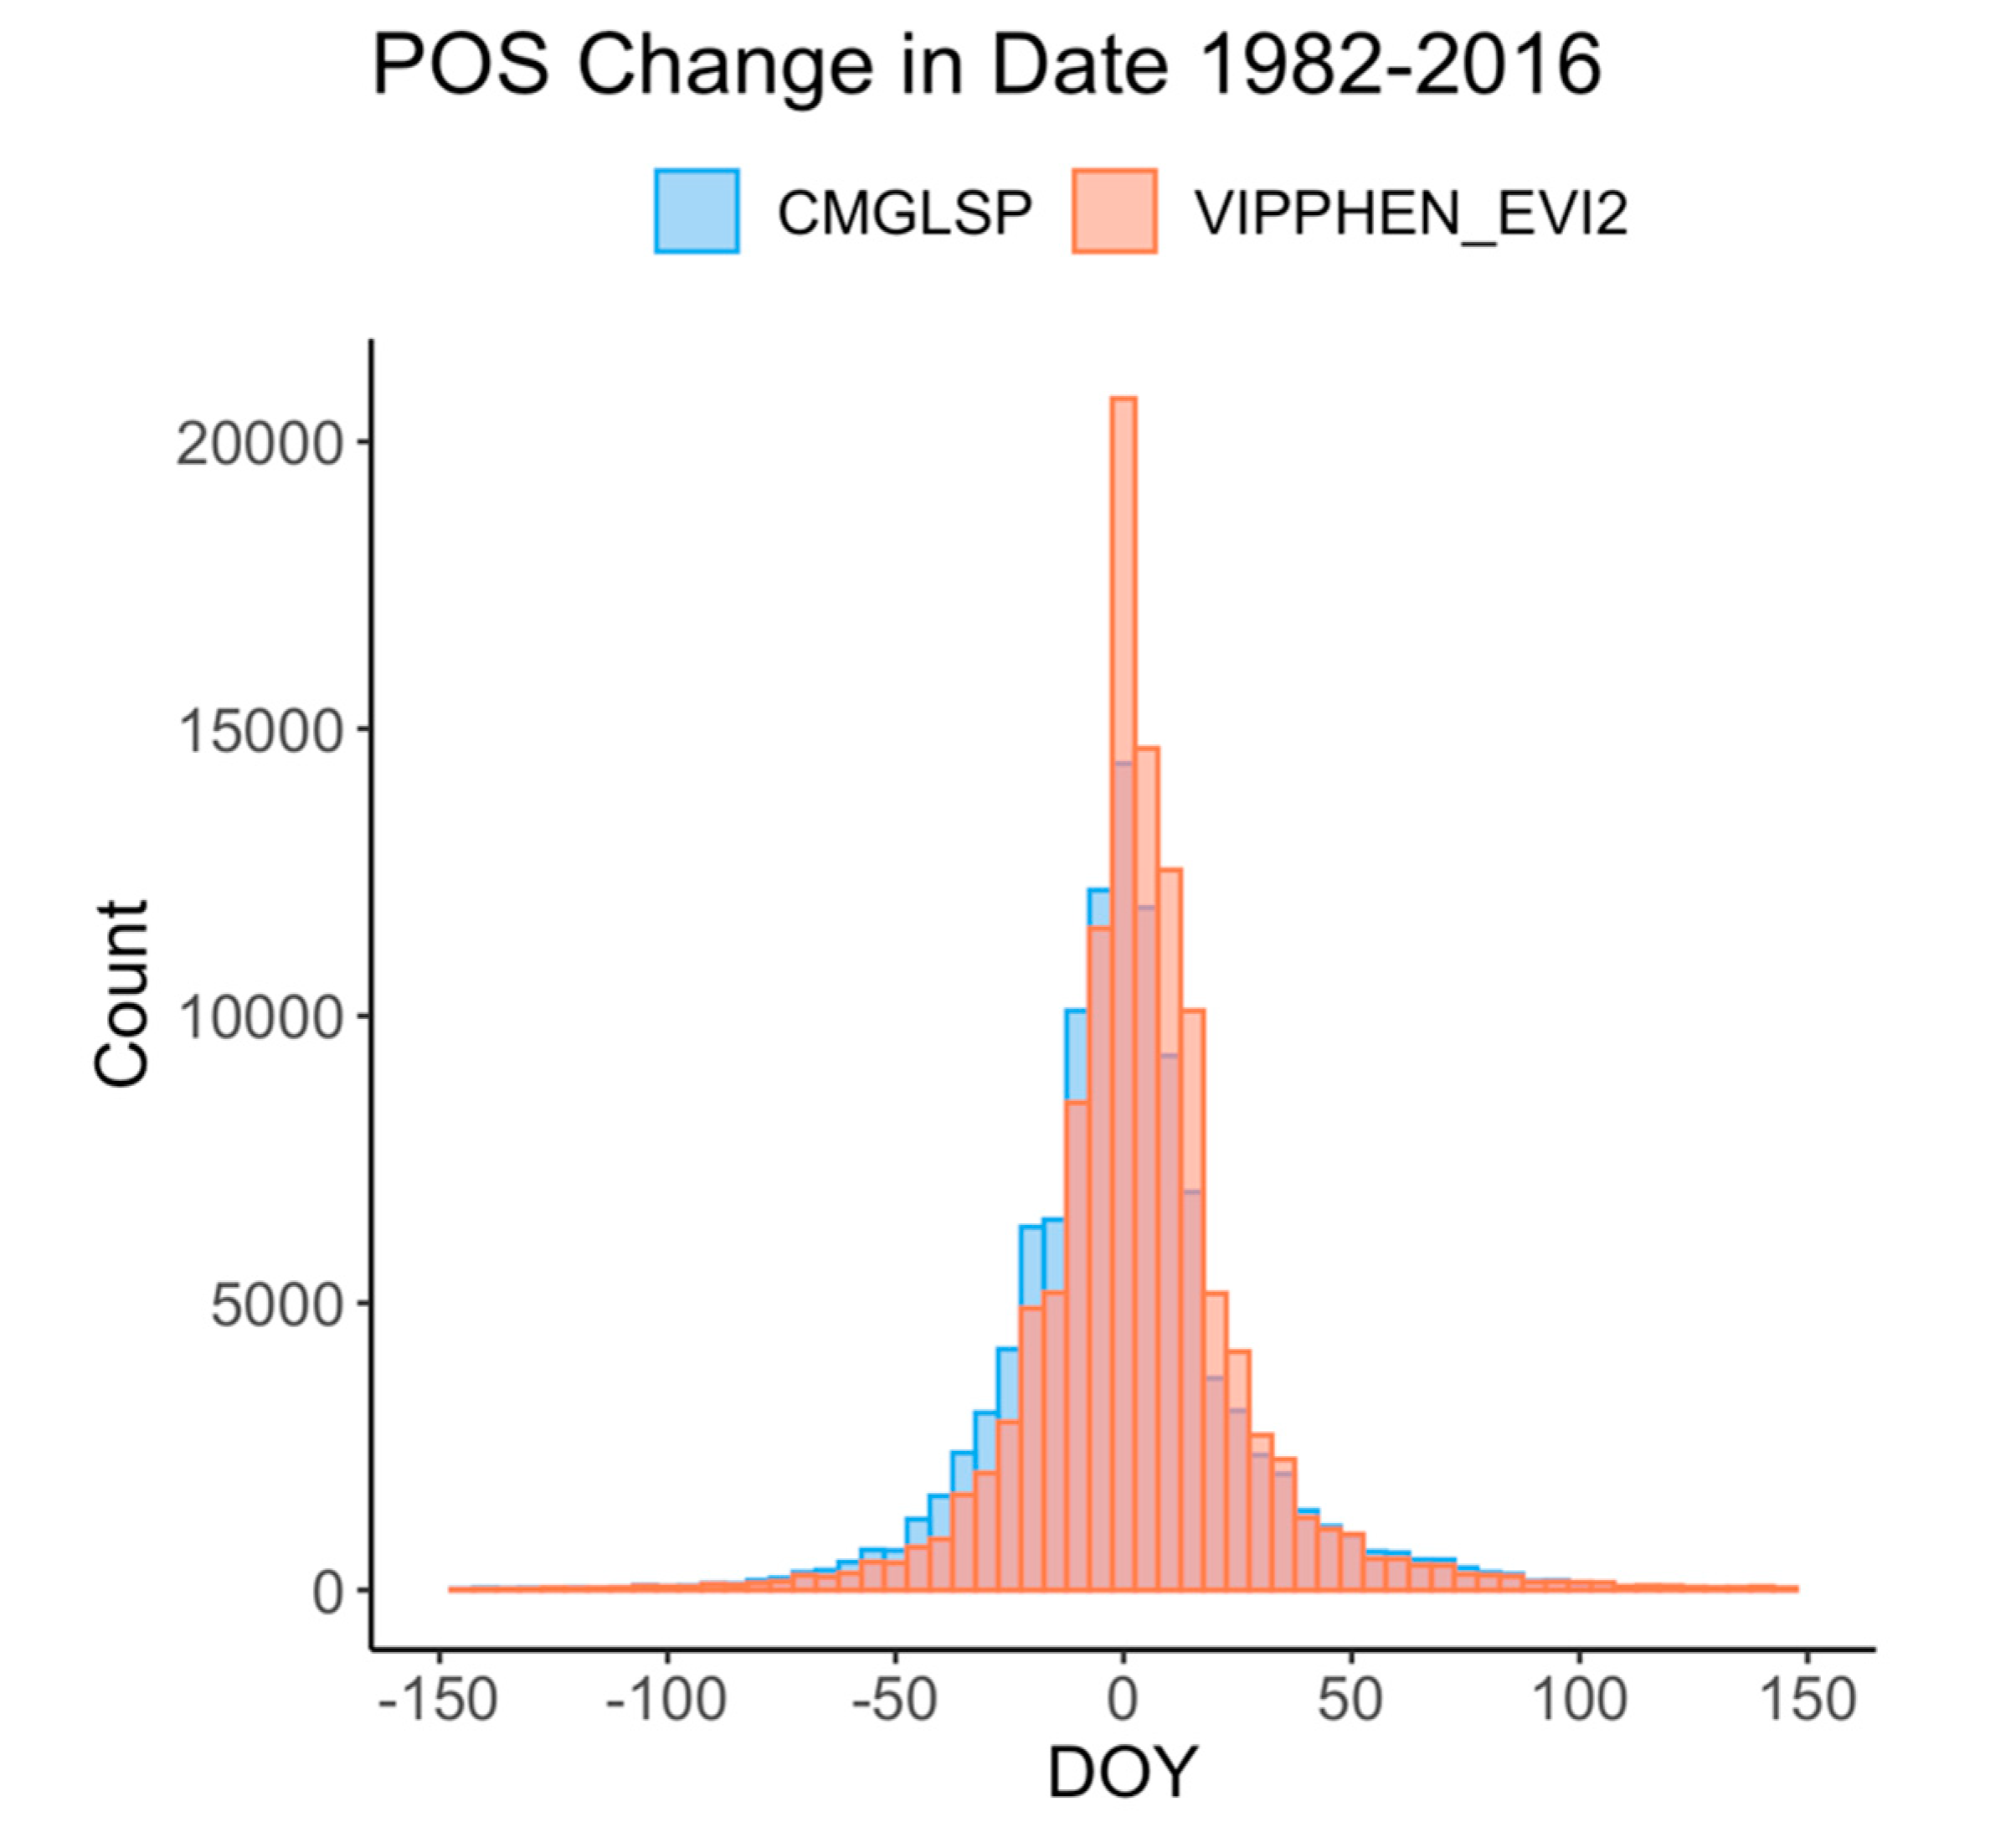
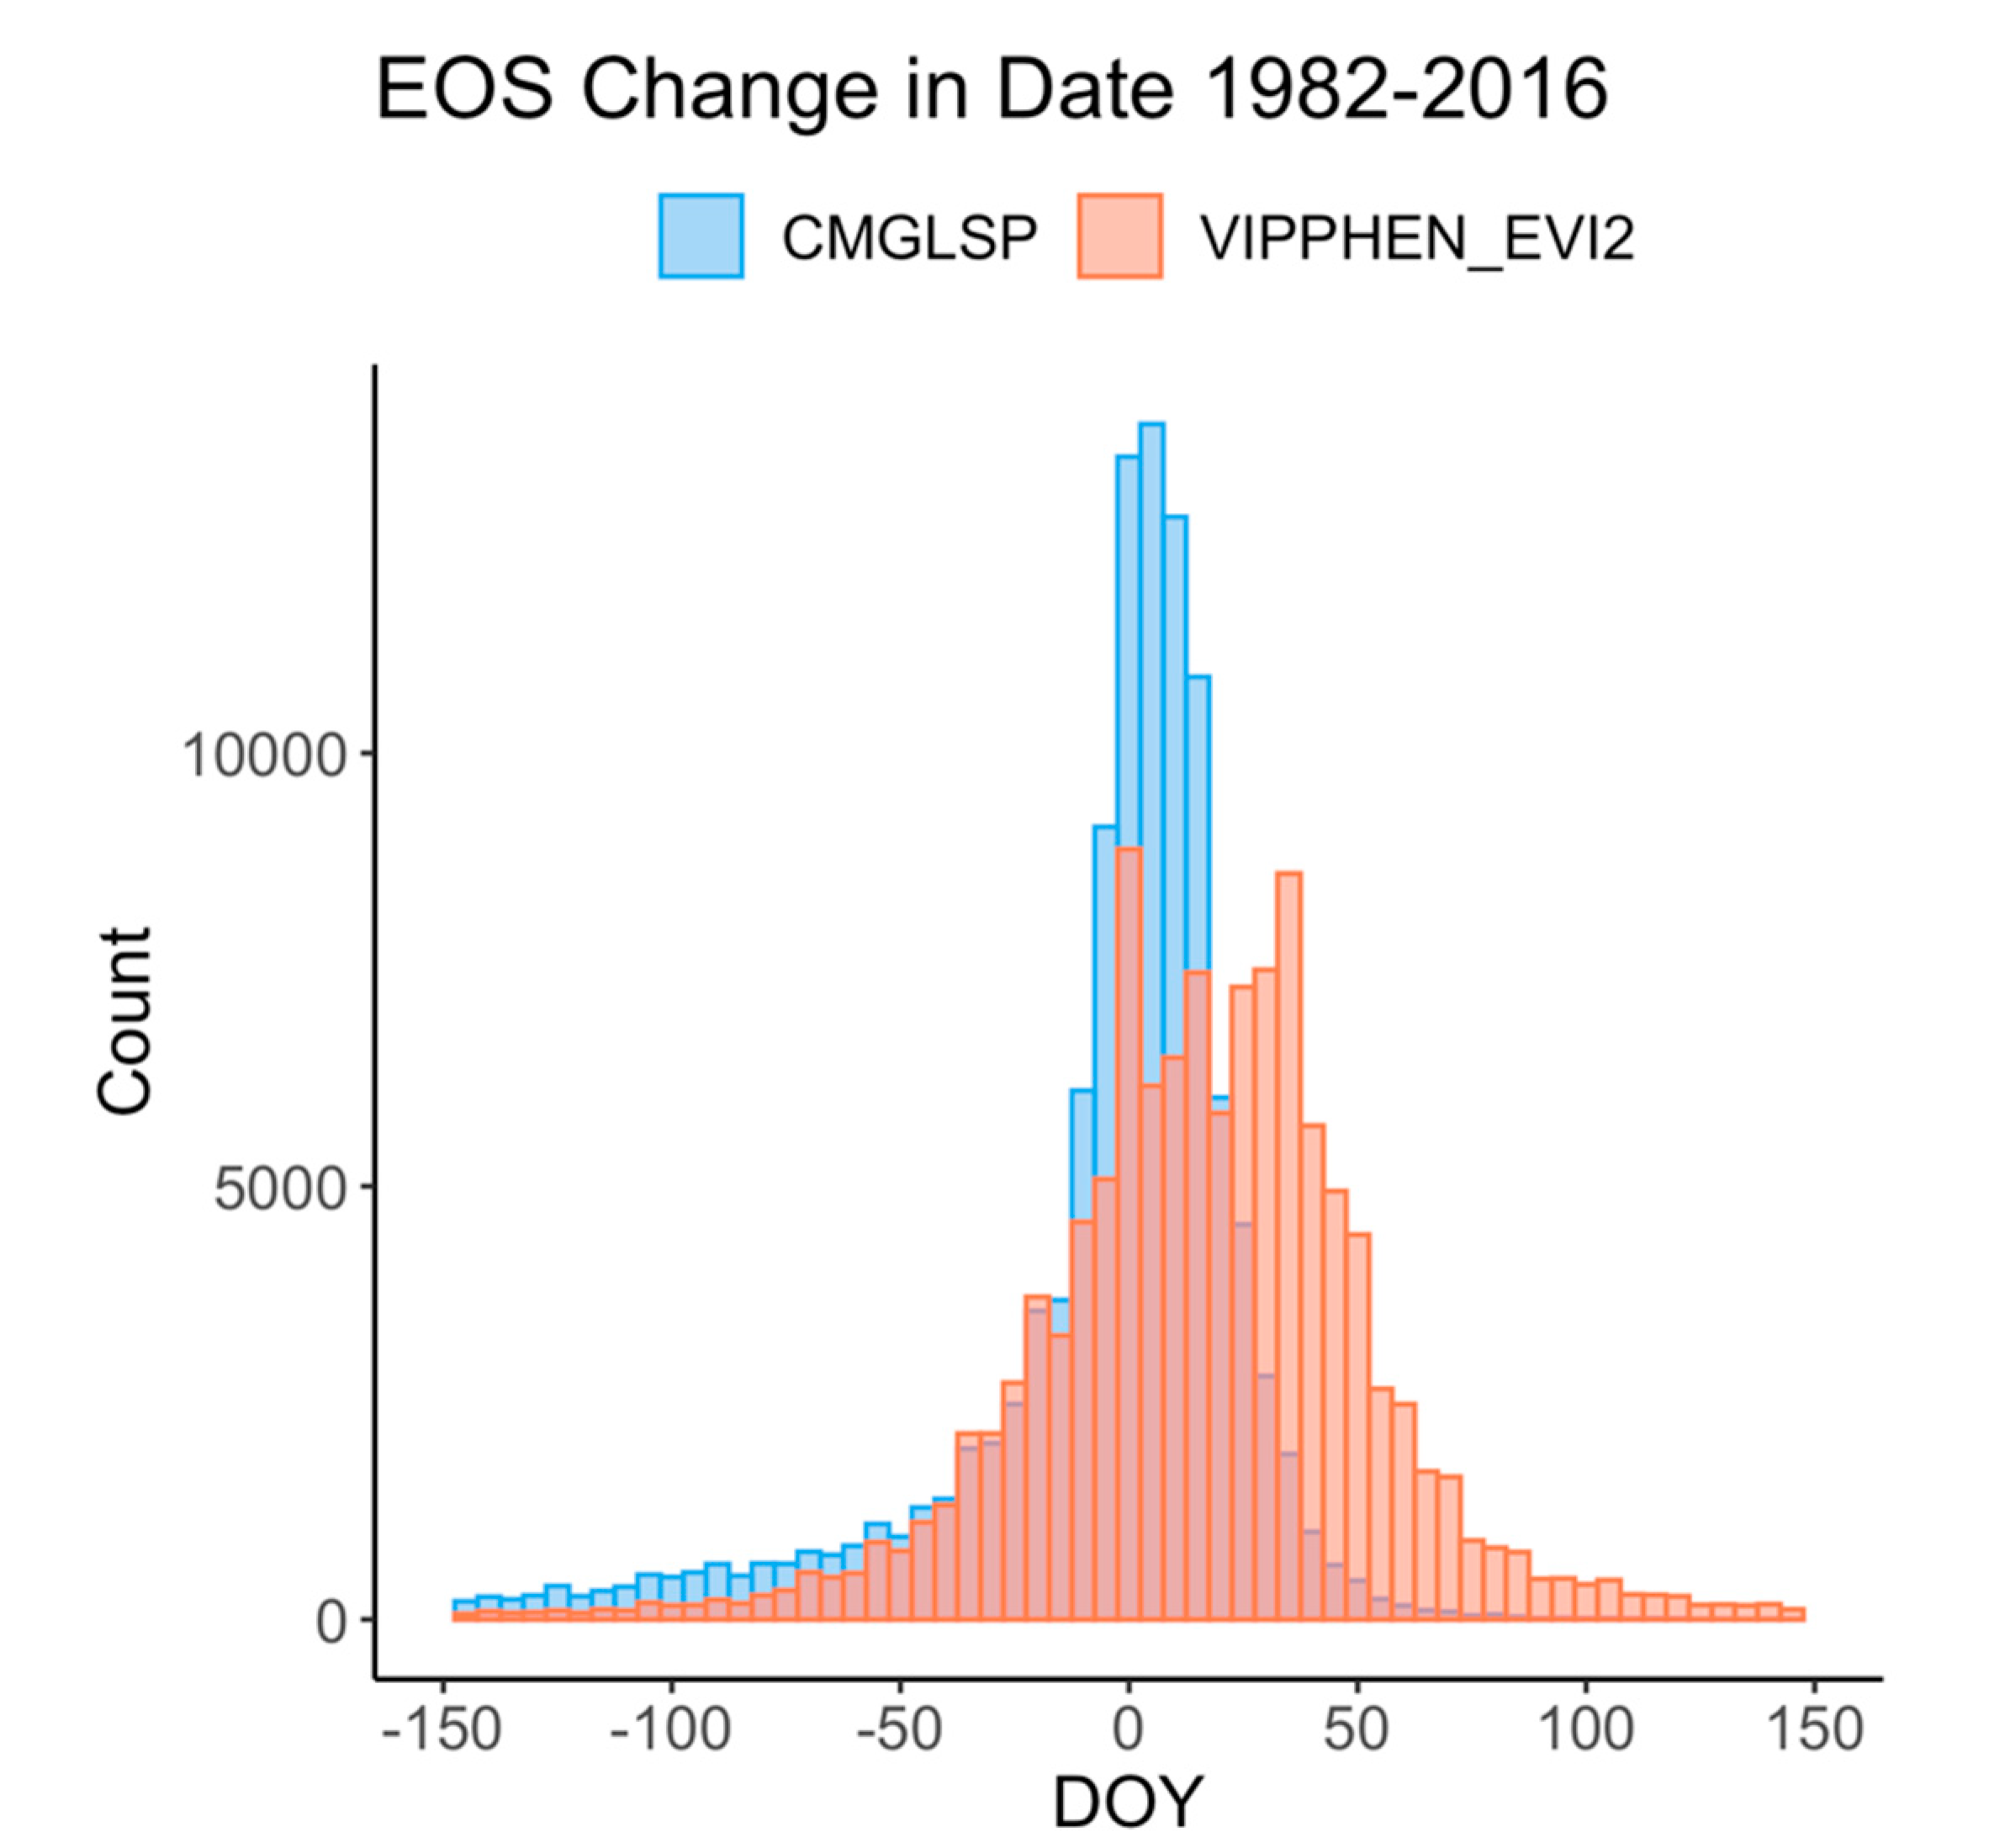
We analyzed long-term trends (1982–2016) across the western U.S. using CMGLSP and VIPPHEN_EVI2, which agreed best with PhenoCam of the datasets that extended back to the 1980s. Of the six phenology metrics, we reported trends for SOS, POS, and EOS, because the other three are derived directly from these metrics and PIRGd spatial patterns are similar to SOS and POS. Using the Theil–Sen slope, the median of slopes between all pairs of observations within a pixel [
53], we assessed each metric by pixel, including only pixels with data for at least 18 of 35 years. As a non-parametric test the Theil–Sen is more robust to outliers and provides higher statistical power when non-normality exists [
54]. Negative slopes indicate change to earlier dates and positive slopes indicate change to later dates. We did not screen pixels for disturbances as the goal of this work is to identify patterns and magnitudes of change, rather than make inferences about the causes of phenological change.
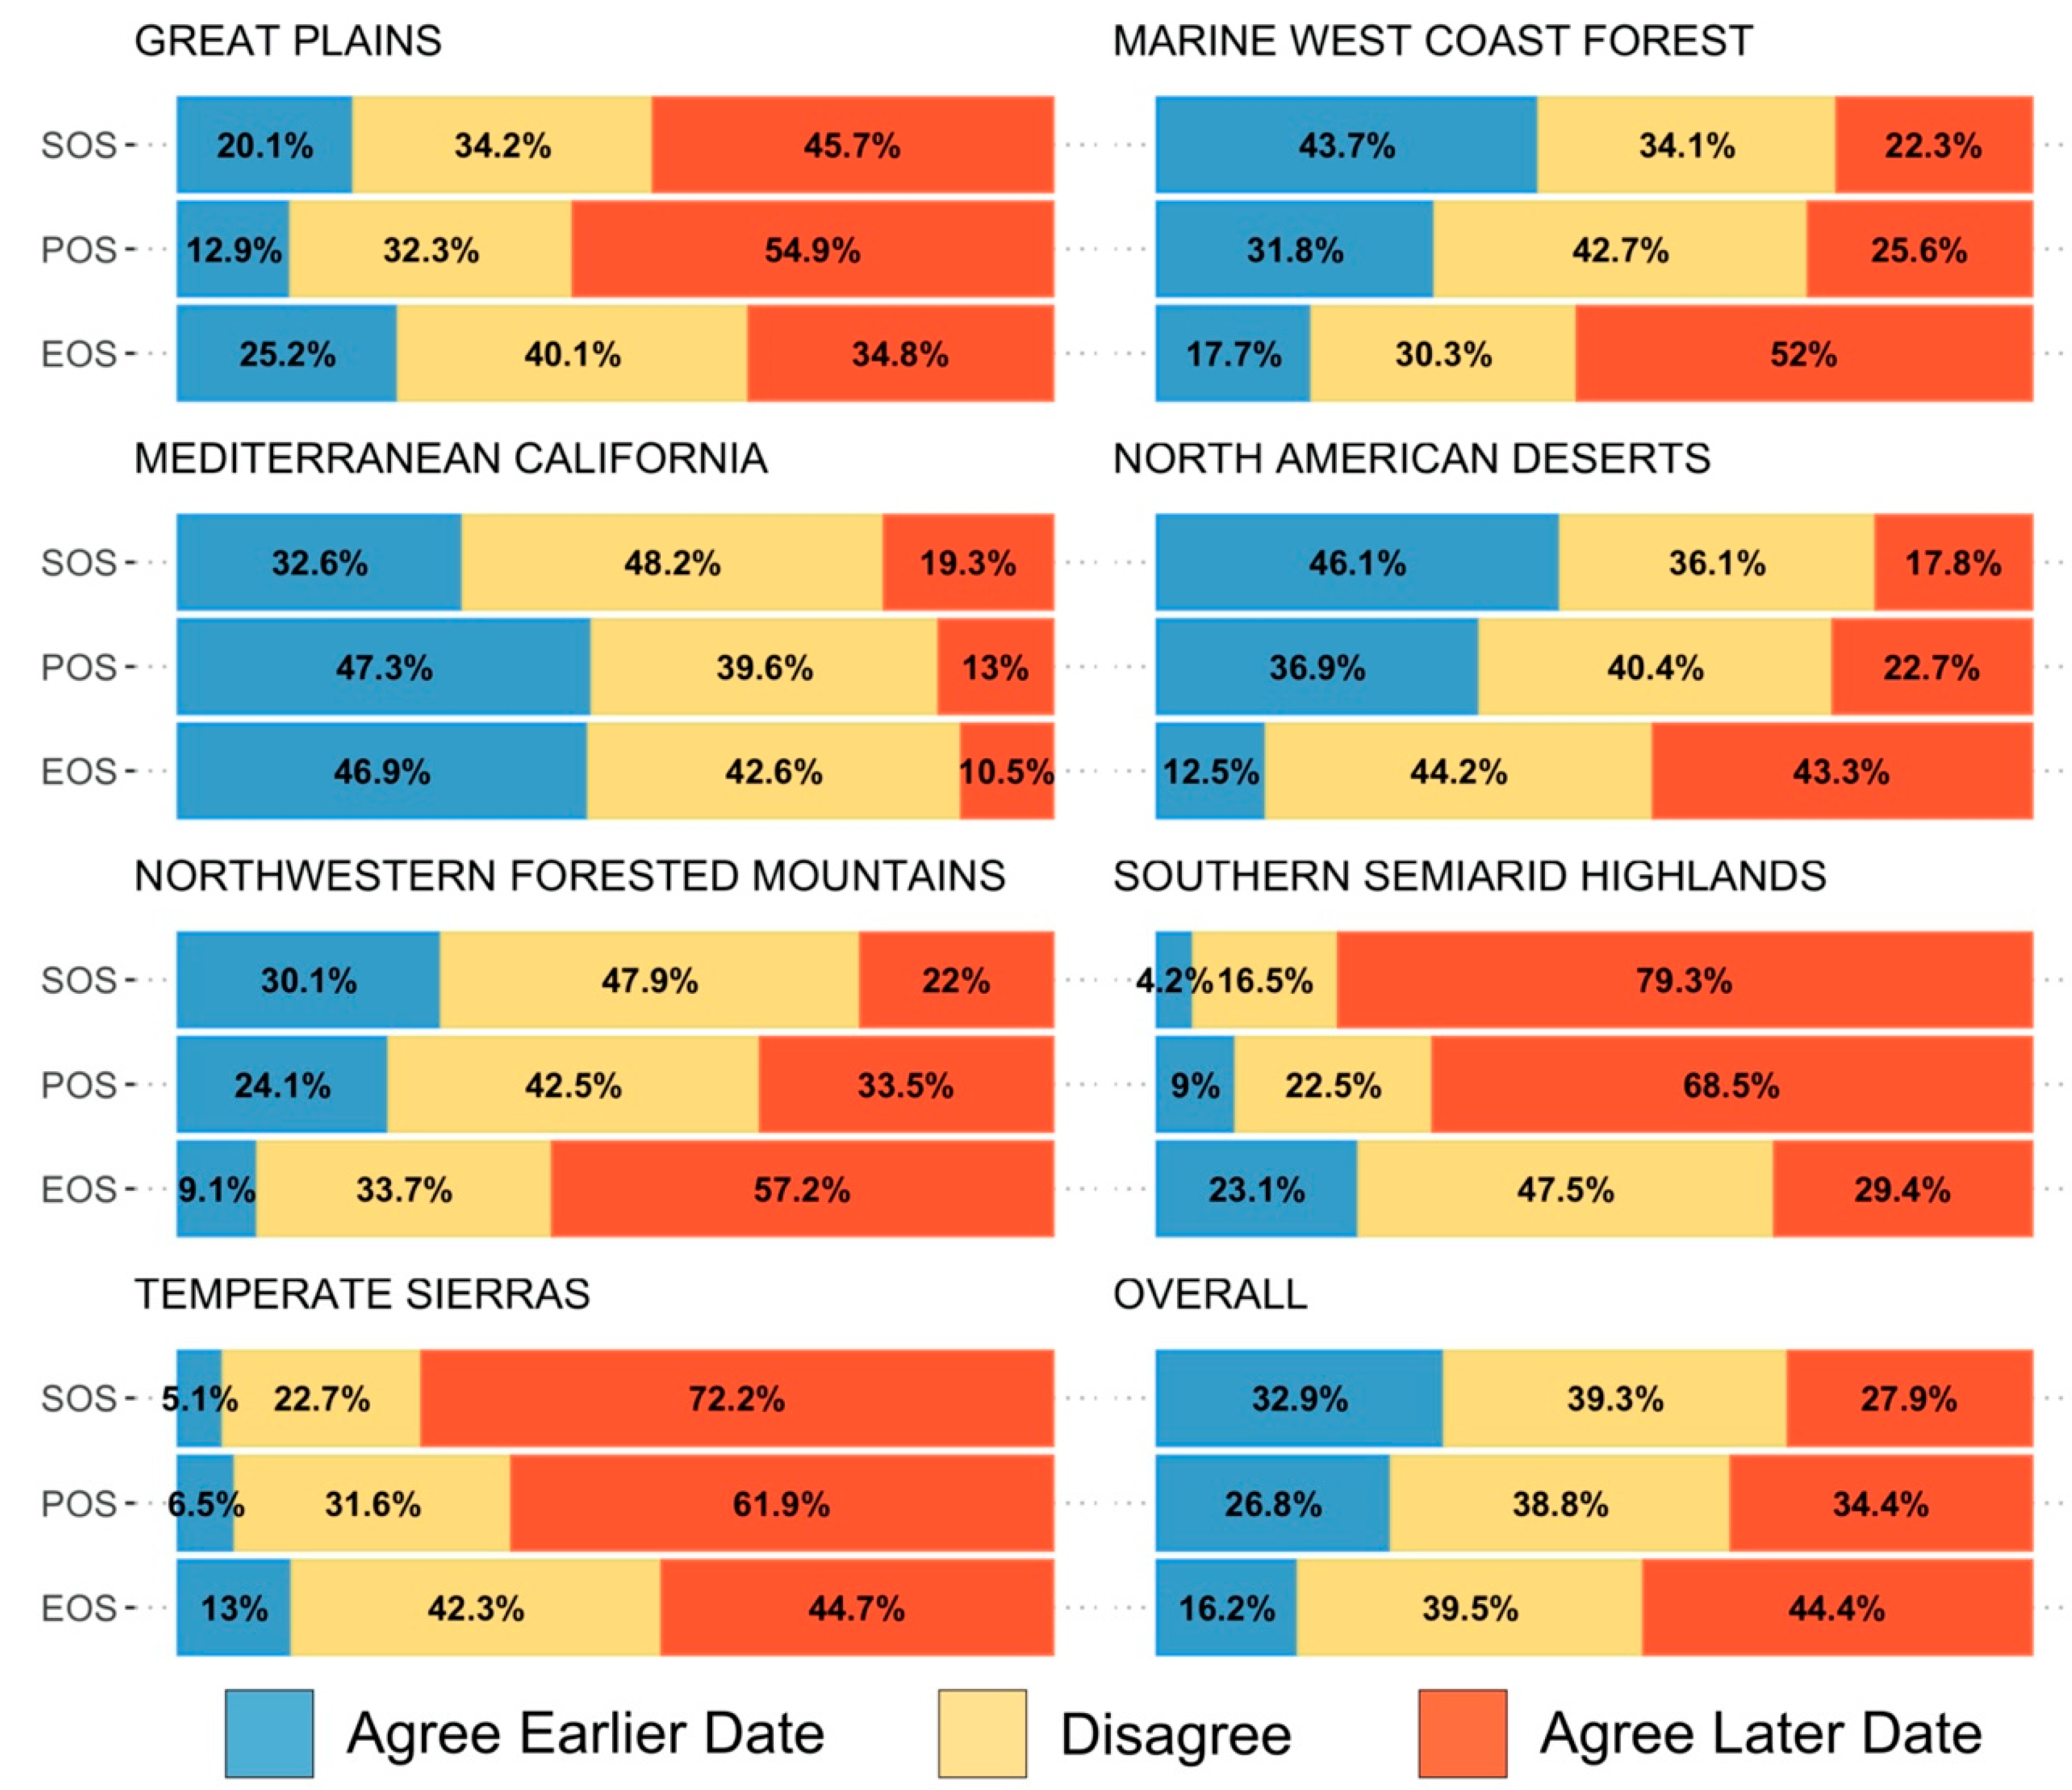
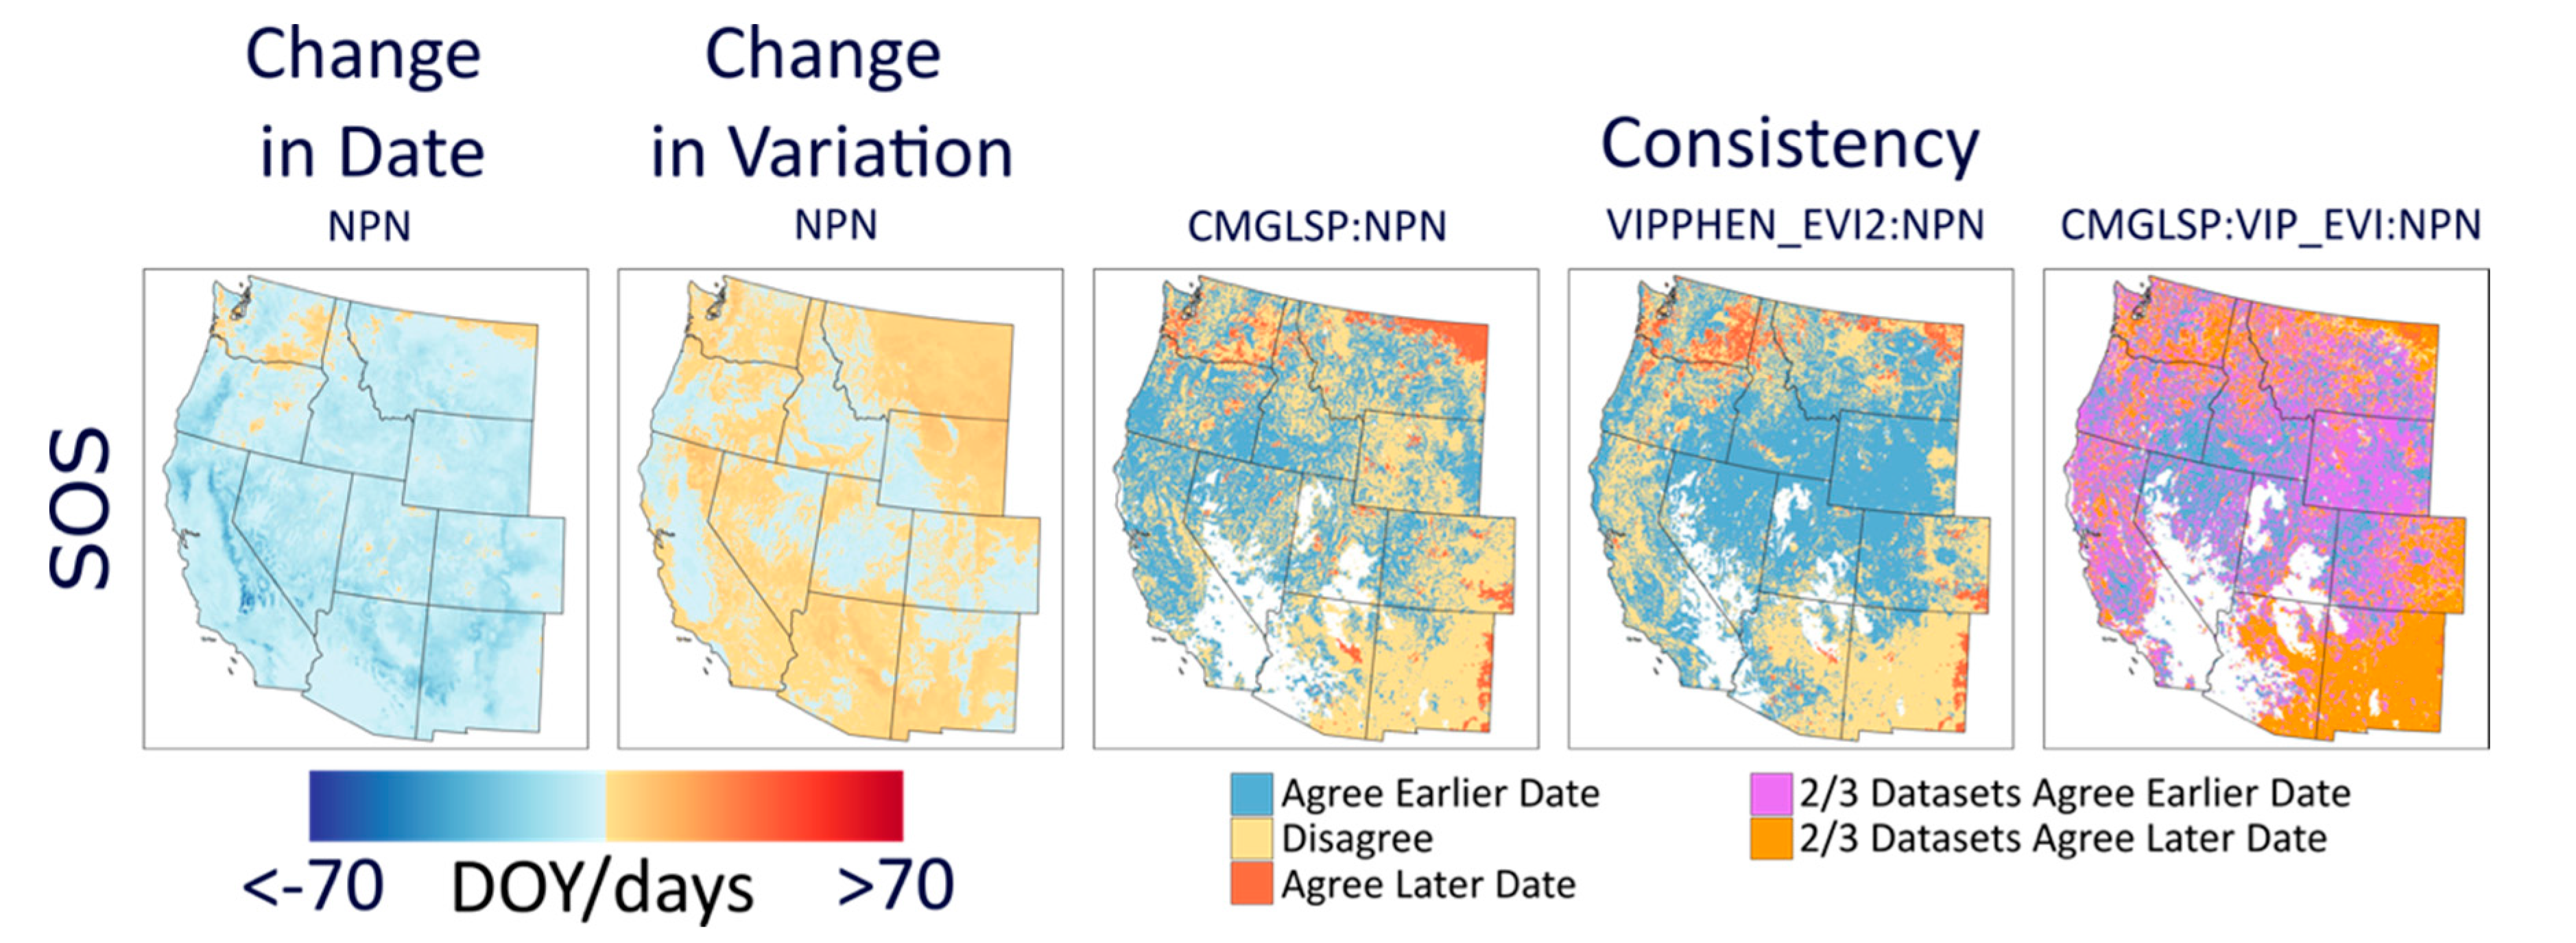
We evaluated overall variation within each pixel based on the standard deviation for each metric and whether variability has increased across years by applying the Theil–Sen slope to the absolute values of the residuals of the trend estimate against time. In addition, we measured consistency between the two datasets, defined as the by-pixel agreement that phenology dates are trending earlier or later. Lastly, to assess agreement in regional patterns of change, we report the proportion of area where both datasets agreed on direction of change by ecoregions using the United States Environmental Protection Agency Level 1 Ecoregions of North America dataset [
39]. We used the statistical computing environment R for all analyses [
55] and R package rkt [
56] to calculate the Theil–Sen slope estimator.
4. Discussion
In our comparison of 10 leading LSP datasets against a network of PhenoCam near-surface cameras, we found promising results in terms of R
2 and mean bias in some landcover types, but substantial variation between datasets and metrics (similar to [
32] for SOS estimates). This highlights a need for improved communication and more extensive dialogue on the strengths, weaknesses and development goals of LSP datasets, especially with the proliferation of applied data users from a variety of research and management practices.
When choosing an appropriate dataset for analysis, applied users should consider study location, years needed, spatial resolution, processing capacity, and quality in different land cover classes. For phenology metrics, our results indicate MCD12Q2 and CMGLSP best matched PhenoCam observations derived using a 10% amplitude threshold and the 90th GCC percentile (
Figure 3). For those interested in phenology prior to the 2000s, CMGLSP has global coverage and extends back to 1982, but has a coarse 0.05 degree (~5 km) spatial resolution and can only be acquired by request. VIPPHEN_EVI2 has the same temporal coverage and spatial resolution, can be downloaded directly, and agreed almost as well. For users working with high resolution data (such as from GPS collars in the wildlife field) and conducting analyses after 2001, MODIS-based datasets at 250 to 500 m spatial resolution provide finer-scale observations. MCD12Q2, with 500 m spatial resolution and global coverage, agreed best with PhenoCam and was the only dataset that had high correlations in evergreen forests. eMODIS also agreed well and has 250 m spatial resolution but is only available in the CONUS. The DLC method can be applied globally (we used MOD09Q1 as the base input) but requires substantial processing which may be prohibitive depending on study area size. This method also provides daily values of NDVI and instantaneous rate of green-up (IRG), which are useful for certain movement ecology and habitat questions such as those relating to the green-wave hypothesis [
21,
23,
24,
25,
57]. Readily available datasets from MODIS (e.g., MOD13A1, MOD13Q1, and eMODIS NDVI) only provide cleaned and pre-processed weekly to bi-weekly NDVI/EVI values and therefore could provide a coarser resolution IRG time series.
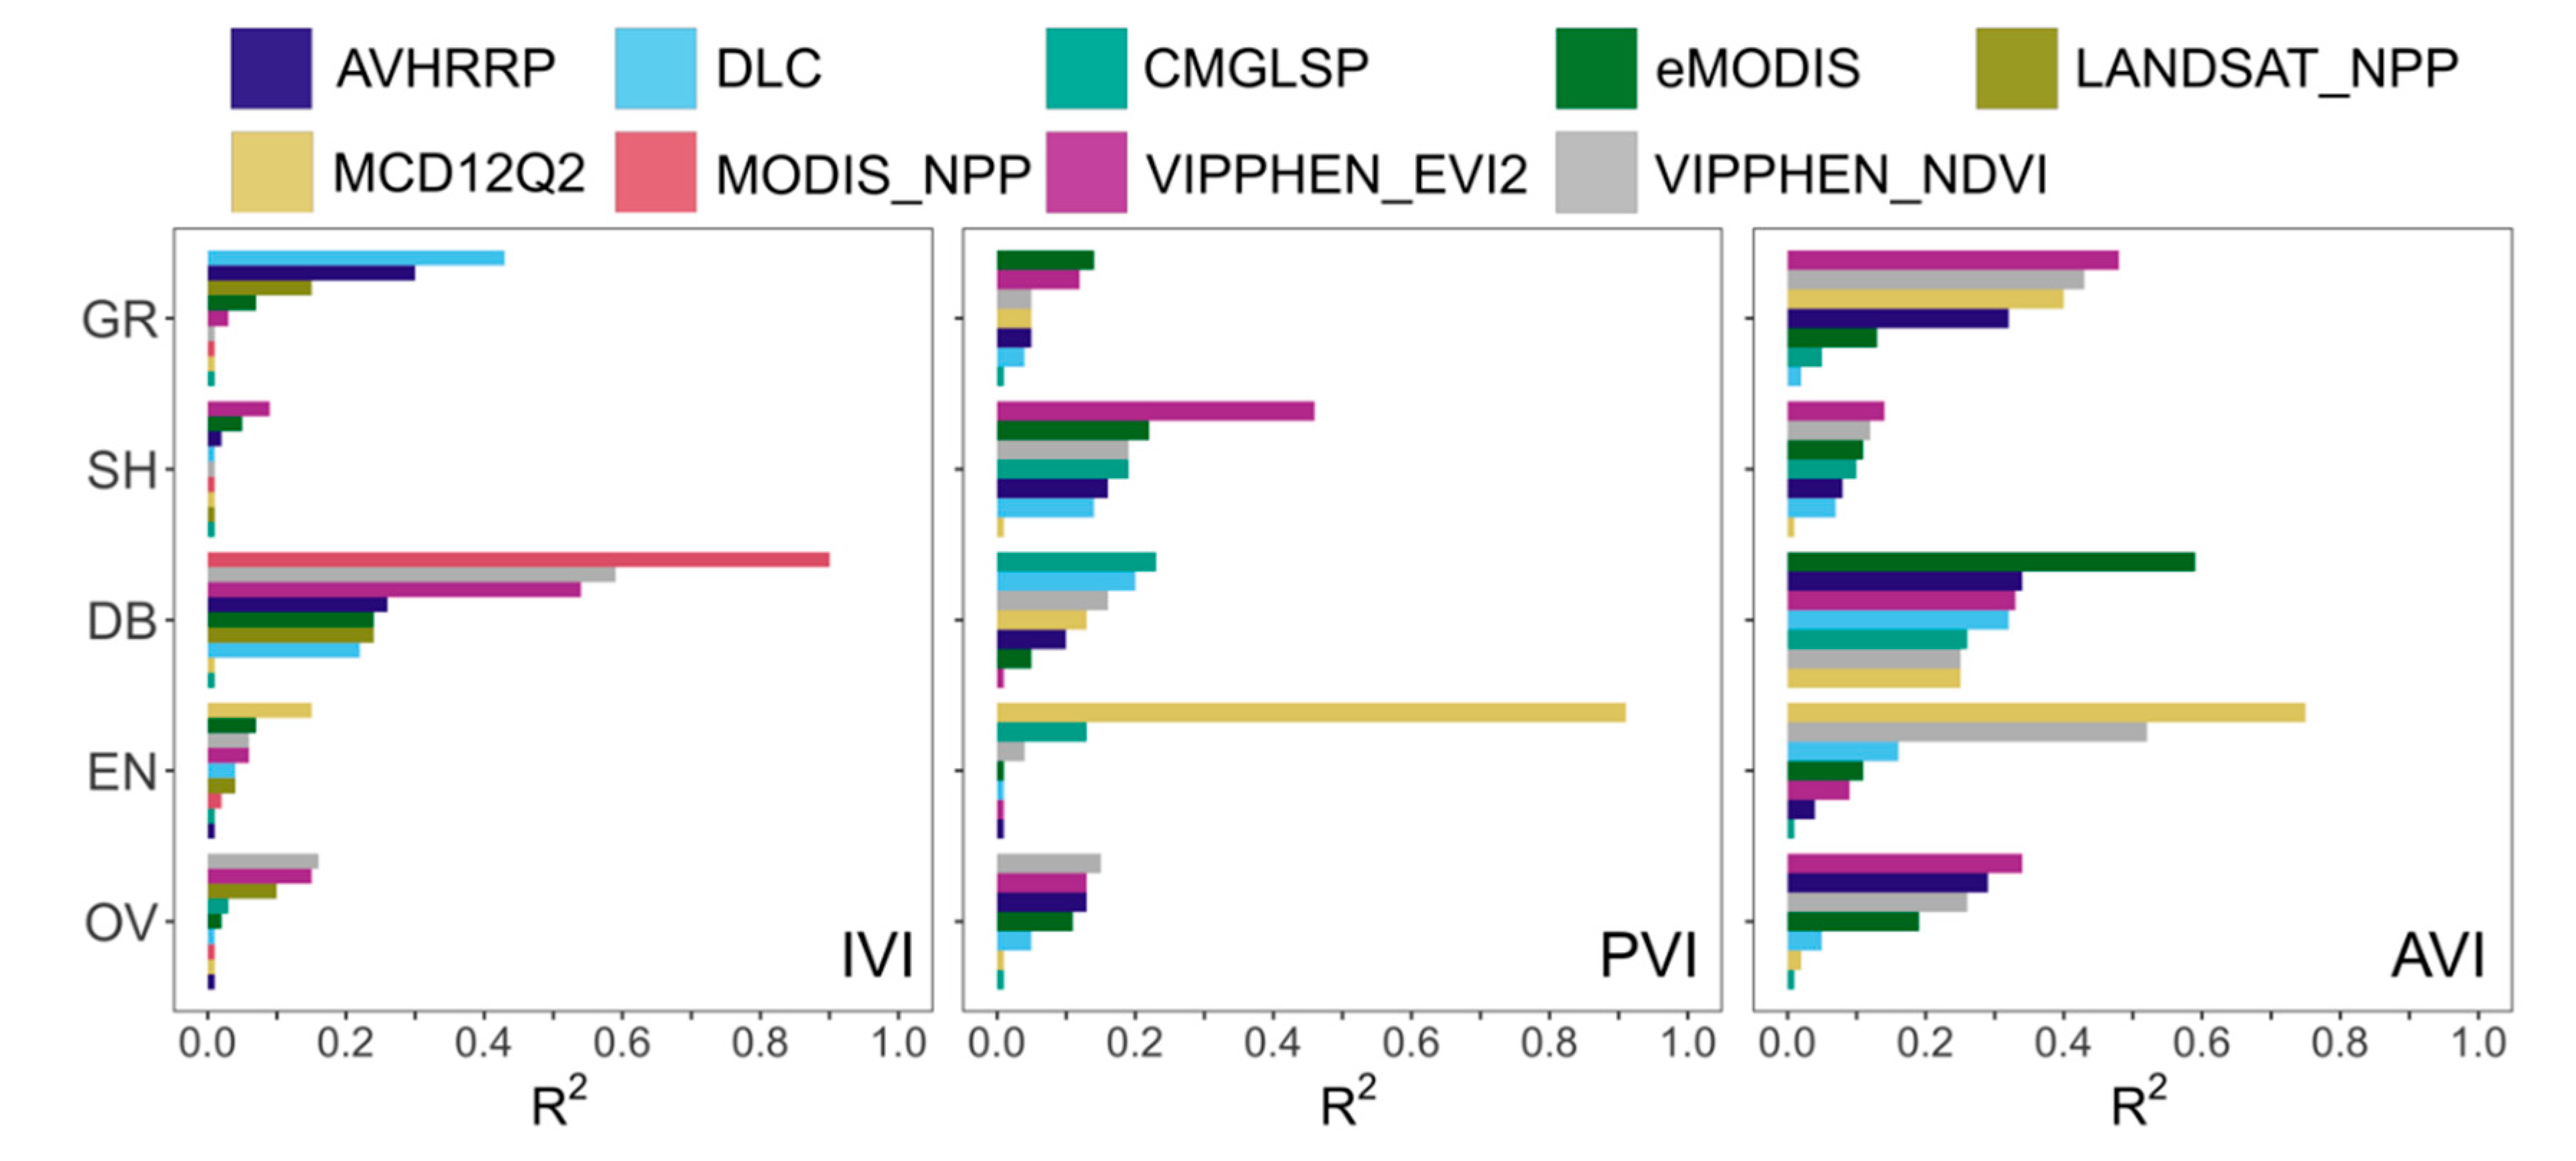
Based on the differences in dataset correlation and bias we found between land cover types, users should consider the predominant land cover of their study area in choosing a phenology or productivity dataset (
Figure 3;
Figure 4). For instance, eMODIS agreed best for PIRGd in shrublands, yet MCD12Q2 was better in grasslands and evergreen forests. Large differences in correlation were observed between productivity datasets, which correlated poorly overall but well in certain landcover types. For IVI, DLC agreed well in grasslands, but MODIS_NPP agreed best in deciduous/broadleaf forests. The lowest correlations between LSP estimates and PhenoCam observations were in evergreen forests, where identifying phenological metrics is challenging because of the small annual change in greenness amplitude and over-saturation [
35,
58]. Using the red chromatic coordinate to process PhenoCam transition dates, as opposed to GCC, has shown potential to improve predictions of SOS and EOS in these environments [
59]. Of all the LSP datasets, MCD12Q2 agreed best with PhenoCam at evergreen sites, possibly because it is EVI based [
40]. Ecologists studying wildlife in areas with multiple land cover types should be aware that phenology metrics in some land cover types are more reliable than others, which could influence results for analyses comparing wildlife GPS locations across different land cover classes [
17,
60,
61]. Quality of LSP metrics may differ geographically, and therefore our results are not necessarily indicative of dataset quality in other parts of North America or around the world [
62].
Quantifying phenology and productivity trends through time is crucial to improve our understanding of ecosystem processes, such as how changing forage in critical habitat or management units affects wildlife and how to manage for future climate and phenology scenarios [
8,
26,
63,
64]. We found a 44.4% agreement between CMGLSP and VIPPHEN_EVI2 trends toward a later EOS across the Western U.S and only a 16.2% agreement toward an earlier EOS, which is consistent with other studies signaling a general pattern toward a later EOS [
9,
65,
66]. Trends are influenced by a variety of factors, including temperature and precipitation, species succession, human and natural disturbance, and land management practices (as observed by [
37] from 1982 to 2006). The complex interactions between these factors make it difficult to interpret the ecological significance of large and spatially heterogeneous trends, especially across diverse ecosystems.
The large phenology trends and high variability we observed over a 35 year period likely reflect real changes in remote sensing metrics, but highlight the need to understand what exactly is changing throughout time, the role of data processing choices, and whether the changes are biologically significant. We know that patterns of temperature and precipitation in some areas are complex, leading to variability in the timing, seasonality, and spatial heterogeneity of snow coverage [
67], soil moisture, drought, and storms that may all influence the timing, variability, and heterogeneity of vegetation phenology and productivity. Variability can be an important component to ecosystem processes and to understanding the degree and mechanism of trends. For instance, vegetation strongly affected by climate conditions, such as invasive grasses responding to rainfall, can cause high year-to-year variability and therefore introduce uncertainty into the direction of overall trend, as well as have large effects on the ecosystem [
68,
69]. In our results, some regions in which LSP metrics changed by more than 70 days often showed high and increasing variability. Though these trends may be showing real changes in phenology throughout time within a pixel, it is challenging to interpret whether these changes are driven by variability caused by weather, invasive species, or other factors, or actually represent the changing dynamics of vegetation of interest, such as important forage species. This overall assessment is a first step in understanding the overall patterns and degree of change across the CONUS.
Several challenges exist in producing accurate LSP estimates and assessing their quality. Large differences in LSP metrics and trend are related to sensor-specific characteristics, such as revisit time and spectral resolution, as well as processing algorithms used to extract metrics, which may include cloud and atmospheric correction, gap filling and curve fitting. Greenness (NDVI/EVI/GCC) values differ between satellite platforms, as well as with near-surface cameras, and are therefore not always comparable without applying translation equations [
70]. Future work may scale PhenoCam and satellite derived productivity metrics to enable a comparison of mean bias and other statistics. Differences in consistency (by-pixel agreement on trend direction) between CMGLSP and VIPPHEN_EVI2 result solely from different processing algorithms, as both CMGLSP and VIPPHEN_EVI2 are based on EVI2 calculated from AVHRR and MODIS at a 0.05 degree spatial resolution (for CMGLSP, see [
46]; for VIPPHEN_EVI2, see [
47]). These two datasets yielded conflicting yet large trends in phenology around the Great Basin and Eastern Washington and Oregon, specifically for EOS. These areas experienced large fires, landcover changes, and other disturbances. It is possible that the different approaches to fitting NDVI/EVI curves and extracting metrics for these datasets are affected differently by these landcover type changes and thus lead to these conflicting signals.
In general, LSP datasets use different processing methodologies and different threshold values [
36,
37,
71], and dataset development goals rarely correspond to specific biological events important to data users. For instance, biological events recorded by a botanist to mark the start of growing season may include first leaf or flower dates, whereas an LSP dataset such as MCD12Q2 captures SOS as the date when EVI crosses the 15% threshold of AVI [
45]. Ref. [
32] used in situ first leaf observations to validate SOS from various LSP datasets and found high root mean squared error (~20 days), indicating a need to better understand the link between biological events and image reflectance values. Our use of near-surface cameras removes variability that may occur when comparing LSP metrics with the timing of biological processes from in situ observations. Although some research assesses LSP quality through comparison with other kinds of ground-based datasets [
72,
73], this may confound differences resulting from discrepancies between biological events and their reflectance values with differences in image quality, which can vary inter-annually and regionally [
62].
Datasets also vary in how they deal with growing seasons that span calendar years or have multiple annual cycles. Most datasets calculate phenology metrics based on a continuous time series yet report metrics in discrete annual data layers. The one exception in our analysis is the DLC dataset, which fits a curve to a single year of data. When phenology cycles span calendar years, such as when SOS occurs in the fall and/or when EOS occurs in late winter/early spring, users should ensure they understand the approach used to store the metrics within an annual data layer. Datasets handle patterns of multiple or missing annual wetness cycles in different ways, with some datasets reporting up to three annual cycles while others only report phenology dates from a single cycle that is not indexed to a general time of year. We most commonly see multiple annual cycles of green-up in arid and monsoonal environments, such as in the Southwest [
74] and Mediterranean California, but this varies by year.. When the number of cycles varies, such as when drought years lead to missed wet periods [
75], or seasonal weather patterns dictate two to three annual cycles, analyses of trends by year, as we have conducted, could suggest large changes in dates that might not reflect the complexity of the ecological impacts well. We briefly evaluated these potential issues, and did find strong positive trends in SOS and POS in areas prone to multiple annual cycles, but overall found that both varying numbers of cycles and small amplitude cycles had more limited extent than could easily explain the large changes in trend we found.
Inherently, the scale of near-surface PhenoCam observations does not match those of remote sensing pixels, which include heterogenous vegetation and even land cover class [
36,
38,
76]. The mismatch can be substantial even for our comparisons of PhenoCam with MODIS-based 250 or 500 m spatial resolution products versus CMGLSP at ~5 km resolution, in which the synthesis of large pixels could include billions of plants. LSP observations effectively provide only a broad picture of landscape phenology, and the scale of imagery has important implications for users. For example, CMGLSP at ~5 km spatial resolution may not provide the spatial variability needed to assess the behavior of a white-tailed deer or other animals with home ranges within one or two pixels, whereas it may be useful for understanding movement patterns of long distance migrating animals such as eagles or mule deer. Given the heterogeneity of vegetation within large pixels, we were surprised at the high agreement of CMGLSP with PhenoCam, at a spatial resolution of 0.05 degrees. The dynamics of LSP metrics in large pixels are complex and do not necessarily represent the average of smaller pixels [
77]. For SOS, [
78] found that the heterogeneity of landcover and SOS, as well as vegetation growth speed during spring, all influenced the scale effect. Variation in spatial footprints of PhenoCam data and resolution of LSP datasets could also add noise to the comparison of LSP and near-surface datasets. New fine-resolution datasets, such as daily 30 m EVI products developed using fusion between MODIS and Landsat [
79,
80] or combinations of Landsat and Sentinal-2 imagery to increase temporal resolution and enable 30 m phenology retrievals [
81], could better match the scale of reference data and user analysis objectives.
Applied data users will benefit from future developments in processing capacity and dataset construction, a better understanding of phenology drivers, and greater understanding of how algorithms intersect with phenology predictions. The growing popularity of platforms able to process large data quickly (such as Google Earth Engine) may render daily, global datasets derived from the DLC method readily available in the future. In terms of improving LSP estimates, the use of mechanistic models to predict key metrics [
82,
83,
84] may help to address data quality issues and discrepancies across land cover types and ecoregions. These models couple remote sensing data with local observations or other models of elevation, temperature, precipitation, and plant phenology to improve phenology and productivity metrics. While still limited, in the future these models may be developed into a single framework to derive more relevant phenology and productivity estimates across diverse regions using localized data. Similarly, an increased understanding of the drivers of phenological changes and variability on a local or regional scale may help users to better interpret and plan for long-term patterns of change. For example, [
85] showed that temperature, growing-season precipitation, and snowpack had larger effects than most management and habitat treatments on annual phenology metrics in sagebrush communities in Southwestern Wyoming, but identified that treatments had some impact on IVI and late season phenology metrics. Finally, deeper examination of how processing and curve-fitting techniques influence the resulting NDVI/EVI time series and phenology metrics will improve understanding of how to interpret large differences in phenology that are predicted from LSP data.

 ,
, 


