Letter

Monitoring the Influence of the Mesoscale Ocean Dynamics on Phytoplanktonic Plumes around the Marquesas Islands Using Multi-Satellite Missions

Laboratoire d’Océanographie Physique et Spatiale (LOPS), IUEM Brest, University of Brest, CNRS, IRD, Ifremer, 29200 Brest, France
*
Author to whom correspondence should be addressed.
Remote Sens. 2020, 12(16), 2520; https://doi.org/10.3390/rs12162520
Submission received: 30 June 2020 / Revised: 1 August 2020 / Accepted: 3 August 2020 / Published: 5 August 2020
(This article belongs to the Special Issue Remote Sensing of Ocean Primary Production)

Abstract

:
The Marquesas islands are a place of strong phytoplanktonic enhancement, whose original mechanisms have not been explained yet. Several mechanisms such as current−bathymetry interactions or island run-off can fertilize waters in the immediate vicinity or downstream of the islands, allowing phytoplankton enhancement. Here, we took the opportunity of an oceanographic cruise carried out at the end of 2018, to combine in situ and satellite observations to investigate two phytoplanktonic blooms occurring north and south of the archipelago. First, Lagrangian diagnostics show that both chlorophyll-a concentrations (Chl) plumes are advected from the islands. Second, the use of Finite-size Lyaponov Exponent and frontogenesis diagnostics reveal how the Chl plumes are shaped by the passage of a mesoscale cyclonic eddy in the south and by a converging front and finer-scale dynamic activity in the north. Our results based on these observations provide clues to the hypothesis of a fertilization from the islands themselves allowing phytoplankton to thrive. They also highlight the role of advection to disperse and shape the Chl plumes in two regions with contrasting dynamical regimes.

Graphical Abstract

1. Introduction

In the open ocean, usually limited in nutrients, phytoplanktonic enhancement can be locally observed downstream from islands and may cause the local development of marine ecosystems. This enhancement has been referred as the Island Mass Effect (IME, [1]). Several mechanisms induced by the islands can enhance nutrient concentrations allowing phytoplankton to thrive. Nearshore, isopycnal shoaling through coastal upwelling can drive vertical transport of nutrient-rich deep-waters [2]. Resuspension from sediments induced by internal wave surge, river discharges or land drainage can also enrich coastal waters [3,4]. On the other hand, interactions between currents and bathymetry can drive vertical transport of nutrient-rich waters offshore of the islands, through wind-shear convergent/divergent frontal regions, eddies and downstream mixing [5,6,7].
Located north of the Subtropical Gyre in the South Pacific Ocean, the Marquesas archipelago (8°S−11°S/141°W−138°W) is a place of a strong phytoplanktonic enhancement related to the IME. Large plumes of chlorophyll-a concentrations (Chl, a proxy of the phytoplankton biomass) are visible from space through radiometric observations (Figure 1). A 0.2 mg·m−3 annual mean of Chl, and up to 0.45 mg·m−3 during the 1998 La Niña event, have been reported around the islands from remote sensing [8,9]. By way of contrast, mean Chl values are about 0.1−0.15 mg·m−3 in the surrounding high nutrient low chlorophyll (HNLC) waters [10]. These waters have high macronutrient concentrations [11,12] but low micronutrient concentrations, especially with regard to iron [13]. In the case of the Marquesas, the exact processes involved in this IME have not yet been identified yet, although hypotheses do exist.
Warm surface wakes behind the largest northern islands have been reported from remote sensing and in situ observations, as well as with high-resolution numerical model simulations [14,15], refuting the hypothesis of a well-established wind-driven coastal upwelling. It rather reflects a wind-sheltered area caused by the abrupt topography of high islands. Induced wind-shear extending along either side of such a sheltered region can generate convergent and divergent frontal zones promoting eddy generation in the island wakes [5]. The formation and propagation of eddies in the Marquesas wakes have been consistently demonstrated through numerical modelling [14]. While eddies could have been conducive to nutrient uplift offshore of the islands, they were insufficient to produce phytoplankton blooms [16]. However, this result was likely due to a shallow mixed layer in the physical-biogeochemical coupled model and this process should not be definitively excluded. On the other hand, two recent studies have suggested some coastal water fertilization originating at the Marquesan IME. One study based on in situ observations highlighted contrasting nearshore/offshore Chl patterns with higher values close to the islands [15]. The second one based on numerical modelling pointed out that an input of iron from the island sediments was necessary to reproduce the phytoplankton enhancement in the archipelago [16].
From open and coastal oceans (see for instance recent studies by [17,18,19], and the references therein) to freshwater environments and lakes on land [20,21], remote sensing observations provide a synoptic view for monitoring the primary production. Hence, the objective of the present study is to investigate, through radiometric and surface current satellite products, the hypothesis of Chl blooms initiated from the islands and their possible offshore advections. In order to cross-reference these two data sets, the accuracy of surface current observations is of prime importance. Thus, the present study focuses on two Chl blooms occurring north and south of the archipelago at the end of 2018 (Figure 1a,b), during and shortly after the MOANA-MATY oceanographic cruise which was conducted from mid-September to mid-October 2018 [22]. During this cruise 15 Surface Velocity Program (SVP) drifters were deployed, allowing the calibration of the satellite-derived surface currents over this time period and the recourse to Lagrangian diagnostics. In Section 2, satellite and in situ observations, as well as the surface current calibration, Eulerian diagnostics and Lagrangian simulations are presented. The spatiotemporal evolution of the flow, and by extension features associated with the Chl distribution are investigated in Section 3, and discussed in Section 4.

2. Materials and Methods

2.1. Materials

In situ and satellite observations were combined to describe the spatiotemporal evolution of the two blooms and the role of the ocean dynamics.

2.1.1. In Situ Observations

In order to assess the phytoplankton communities observed during the MOANA MATY oceanographic cruise, water samples were collected with a rosette of 12-l Niskin bottles nearshore and offshore the islands. High performance liquid chromatography (HPLC) analysis of water samples was performed following the method of Ras et al. [23]. This technique allows for the differentiation of the pigments present in the water samples to infer phytoplankton taxa. Only the HPLC total Chl derived was used for validation of the satellite Chl. Then, total Chl was averaged from the two first sampling depths (i.e., 3 m and 15 m), as the first optical depth in the Marquesas has been reported to vary between 3 m and 17 m [16].
Fifteen SVP drifters provided by the National Oceanic and Atmospheric Administration (NOAA, from Pacific Gyre (Oceanside, United States of America)) Global Drifter Program were also deployed during the cruise. We used the 6-hourly positions of the drifters to estimate surface currents.

2.1.2. Satellite Data

The satellite Chl product used here was developed within the framework of the Globcolour project (www.globcolour.info). Chl was estimated by merging the normalized reflectance from multiple sensors with the semianalytical Garver Siegel Maritonera (GSM) algorithm [24]. The radiometric sensors available over the studied period (i.e., end of 2018) were the Moderate Resolution Imaging Spectroradiometer (MODIS) and the Visible Infrared Imaging Radiometer Suite (VIIRS) sensors. This product was used because it merged data from different satellite sensors enhancing the spatiotemporal coverage of Chl observations. The product was provided by the ACRI-ST Company and obtained from the website of Copernicus (http://marine.copernicus.eu/). The daily, near real time Level 3 product on a 1/25° grid was used here and compared with in situ Chl from the MOANA MATY cruise. Satellite data and in situ data colocalized on the same day and within an 8 km radius were selected, resulting in 27 pairs of observations. Of these, 15 pairs were retained because of missing satellite data induced by the cloud coverage. In situ and satellite Chl were significantly correlated (r = 0.68 with p = 0.01; Figure S1).
Surface currents were derived from a combination of several satellite missions, namely the Geostrophic and EKman Current Observatory (GEKCO) product developed by Sudre et al. [25]. The geostrophic and Ekman components were separately available with a daily temporal resolution on a 1/4° grid. The geostrophic component was calculated from the elevation of the sea surface height obtained with the AVISO (Archiving, Validation and Interpretation of Satellite Oceanographic data) product. The Ekman component was based on a linear regression of the Ekman layer thickness, drag coefficient and wind stress, evaluated from drifting buoys and scatterometer remote observations. Further information on the data validation are given in [25].
In order to evaluate the dispersion of a tracer such as Chl, surface dynamic fronts were quantified with a Lagrangian diagnosis based on the estimation of Finite Size Lyapunov Exponent (FSLE). High FSLE values are representative of convergent structures, transport barriers and small-scale fronts that can influence biogeochemical conditions and Chl variability [26,27,28]. FSLE are derived from the SSALTO/Duacs delayed-time satellite derived global ocean absolute geostrophic currents. The initial separation of particles is fixed at 0.02°, and 0.6° for the final position, representing the mesoscale features of the ocean. The FSLE product is delivered by AVISO+ (www.aviso.altimetry.fr) in delayed time of 20-day latency and available with a spatial resolution of 1/25°.

2.2. Methods

The effect of the surface currents on the Chl gradient was investigated by means of the frontogenesis function [29]. The frontogenesis refers to the intensification of the Chl lateral gradient at a front. The frontogenesis function is defined as:
D D t c 2 = H c .   H U . H c H w . H c c z + H F ( c ) . H c
With c the Chl, D D t c 2 the material derivative of the squared norm of the gradient of c, U = u + v u and v the zonal and meridional velocities, respectively, w the vertical velocity and F(c) a function for Chl sources and sinks. At the surface, since w   ( z = 0 ) = 0 uniformly then H w = 0 . To consider only the dynamical effects on Chl gradient, Chl is considered as a passive tracer. Thus, the biological sources and sinks are neglected, and F(c) = 0. All the terms on the right-hand side of Equation (1) represent the frontogenesis function g(c). When g(c) > 0, the horizontal Chl gradient intensifies as a function of the horizontal surface currents and it is characteristic of a convergence. Inversely, when g(c) < 0, the horizontal Chl gradient decreases representing a dispersion. As the GEKCO currents have a coarse spatial resolution in comparison to the Chl satellite product, a simple cubic-interpolation is used to fit the different horizontal resolutions.
In order to investigate the Chl dispersion/convergence by ocean dynamics, Lagrangian trajectories were calculated with the diagnostic tool ARIANE [30]. This tool allows the tracking of the origin and fate of simulated particles driven by the oceanic circulation provided from numerical models or satellite observations. Initially developed for the 3D study of ocean circulation, a 2D version was applied in the present study using the GEKCO surface currents. A first Lagrangian simulation was performed to assess the reliability of the GEKCO currents (Figure S2). The dispersion of simulated particles driven by the GEKCO currents were compared with those of the 15 SVP drifters deployed during the MOANA MATY cruise. Simulated particles were initially sampled north of the archipelago, in the area where the SVP drifters were deployed, and released daily from the 1st to the 10th of October 2018. Trajectories were integrated forward-in-time until the 31st of December (Figure S2). These simulations were run in a quantitative mode to allow the ARIANE software to set itself the number of particles released. Finally, a faster dispersion of the simulated particles compared to the SVP demonstrated that the Ekman component from GEKCO was overestimated by 50% (Table S1) in this region of the South Pacific. Therefore, a corrected version of the total surface current now adding only 50% of the Ekman component to the geostrophic one was used to perform this study.

3. Results

At mid-cruise (the 3rd of October) and shortly after (end of November), two phytoplankton blooms could be observed south and north of the archipelago (Figure 1a,b, respectively). These blooms were remarkable due to their extension over hundreds of kilometers with a Chl up to 1.5 mg·m−3 in the south and to 3.9 mg·m−3 in the north. The origin of these two blooms and how the ocean dynamics influenced their plumes south and north of the archipelago are here investigated.

3.1. Mesoscale Activity Influence on the Chl Plume South of the Marquesas

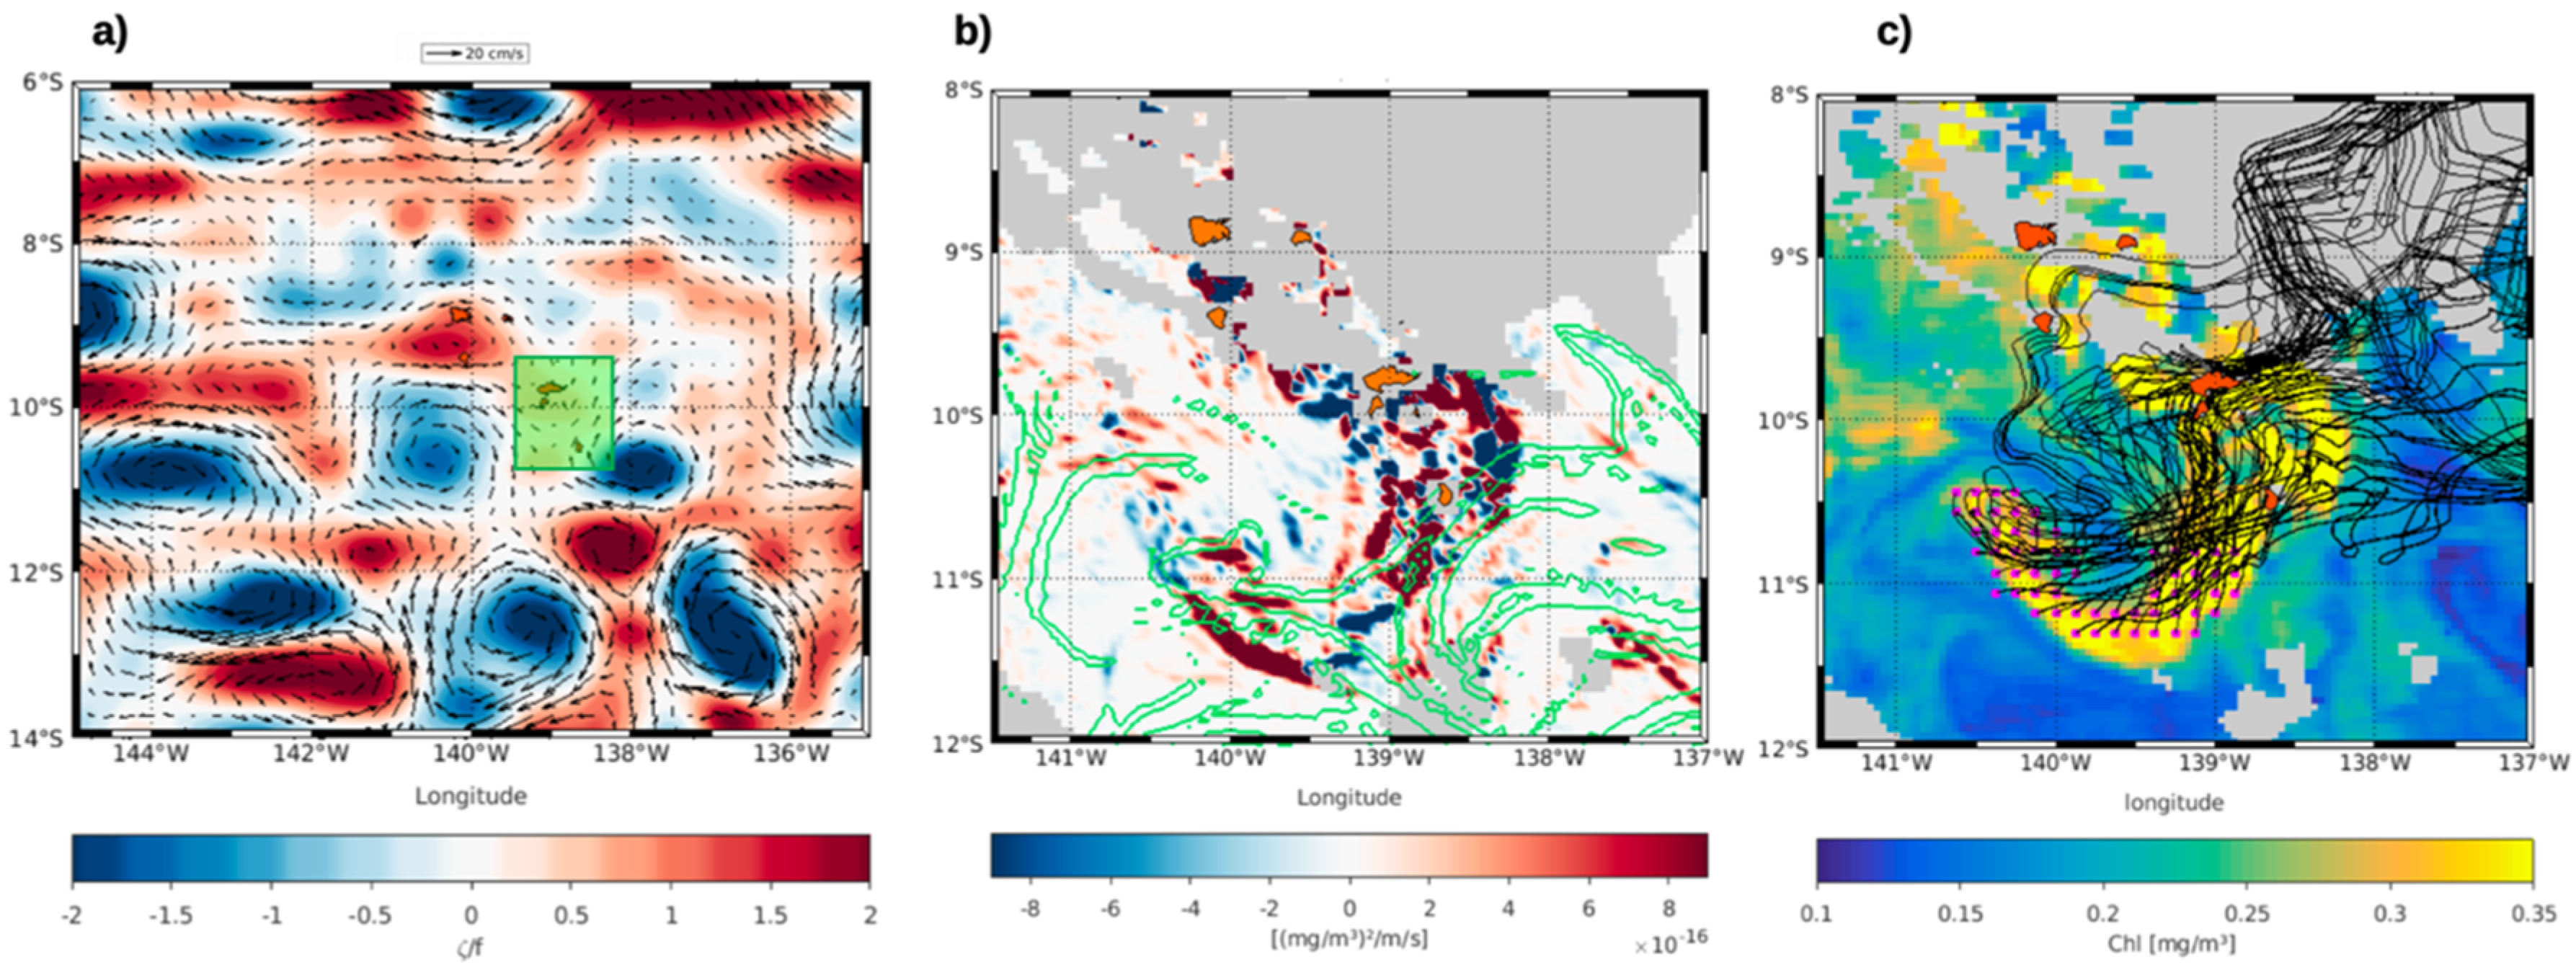
The strong phytoplanktonic enhancement occurring in the south of the archipelago showed a Chl plume with a vortex shape extending south-westward from Fatu Hiva over more than 200 km, and concentrations higher than 0.3 mg·m³ (Figure 1a). This shape is associated with a mesoscale cyclonic eddy (negative values of the normalized vorticity, in blue in Figure 2a). Transport barriers on the edges of this eddy were highlighted by FSLEs (green lines in Figure 2b). They were associated with positive values of the frontogenesis function (in red in Figure 2b) appearing to be attractive fronts which induce a local strengthening of the Chl gradient. Conversely, the absence of FSLE or the separation of two attractive fronts (such as at 11.2°S−139.2°W, negative values of the frontogenesis function, blue in Figure 2b) were rather related to Chl dispersion.
Lagrangian simulations were run with the GEKCO current product to investigate the spatiotemporal evolution and the origin of the bloom. The 60 simulated particles were initialized in the Chl plume delimited by higher values than 0.2 mg·m−3 and the integrations were performed backward-in-time with ARIANE over 150 days (backward particle trajectories are illustrated as black lines in Figure 2c). Considering the low spatial resolution of the surface currents with regards to the island size, it should be noted that the beaching of simulated particles on land could not be reproduced, and thus some trajectories crossed the islands. Simulated particles were advected from the north-east of the Marquesas. Along their pathways, almost all the simulated particles drifted through or very close to an island: Some 91.7% of the particles encountered Hiva Oa and/or Fatu Hiva and 8.3% encountered Ua Pou (9°S−140°W). This result suggests that the Chl plume is triggered near the islands before being advected downstream by the cyclonic eddy.

3.2. Convergence Fronts to Shape the Chl Plume North of the Marquesas

The second event of strong phytoplanktonic enhancement occurred almost two months later (the 29th of November) in the northernmost region of the archipelago. It was associated with two blooms with Chl higher than 0.4 mg·m−3, nearshore of the island of Eiao and north-west offshore of the island (Figure 1b). Compared to the southern case, the connection between nearshore Eiao bloom and the offshore bloom was not so evident. First, the two blooms were connected by a very thin filament of higher Chl than the surrounding waters with no clear mesoscale circulation pattern on the Chl distribution. Secondly, if both blooms had been initiated at Eiao, then the offshore one would have been advected northward while the South Equatorial Current (SEC) was on average directed westward/southwestward [31].
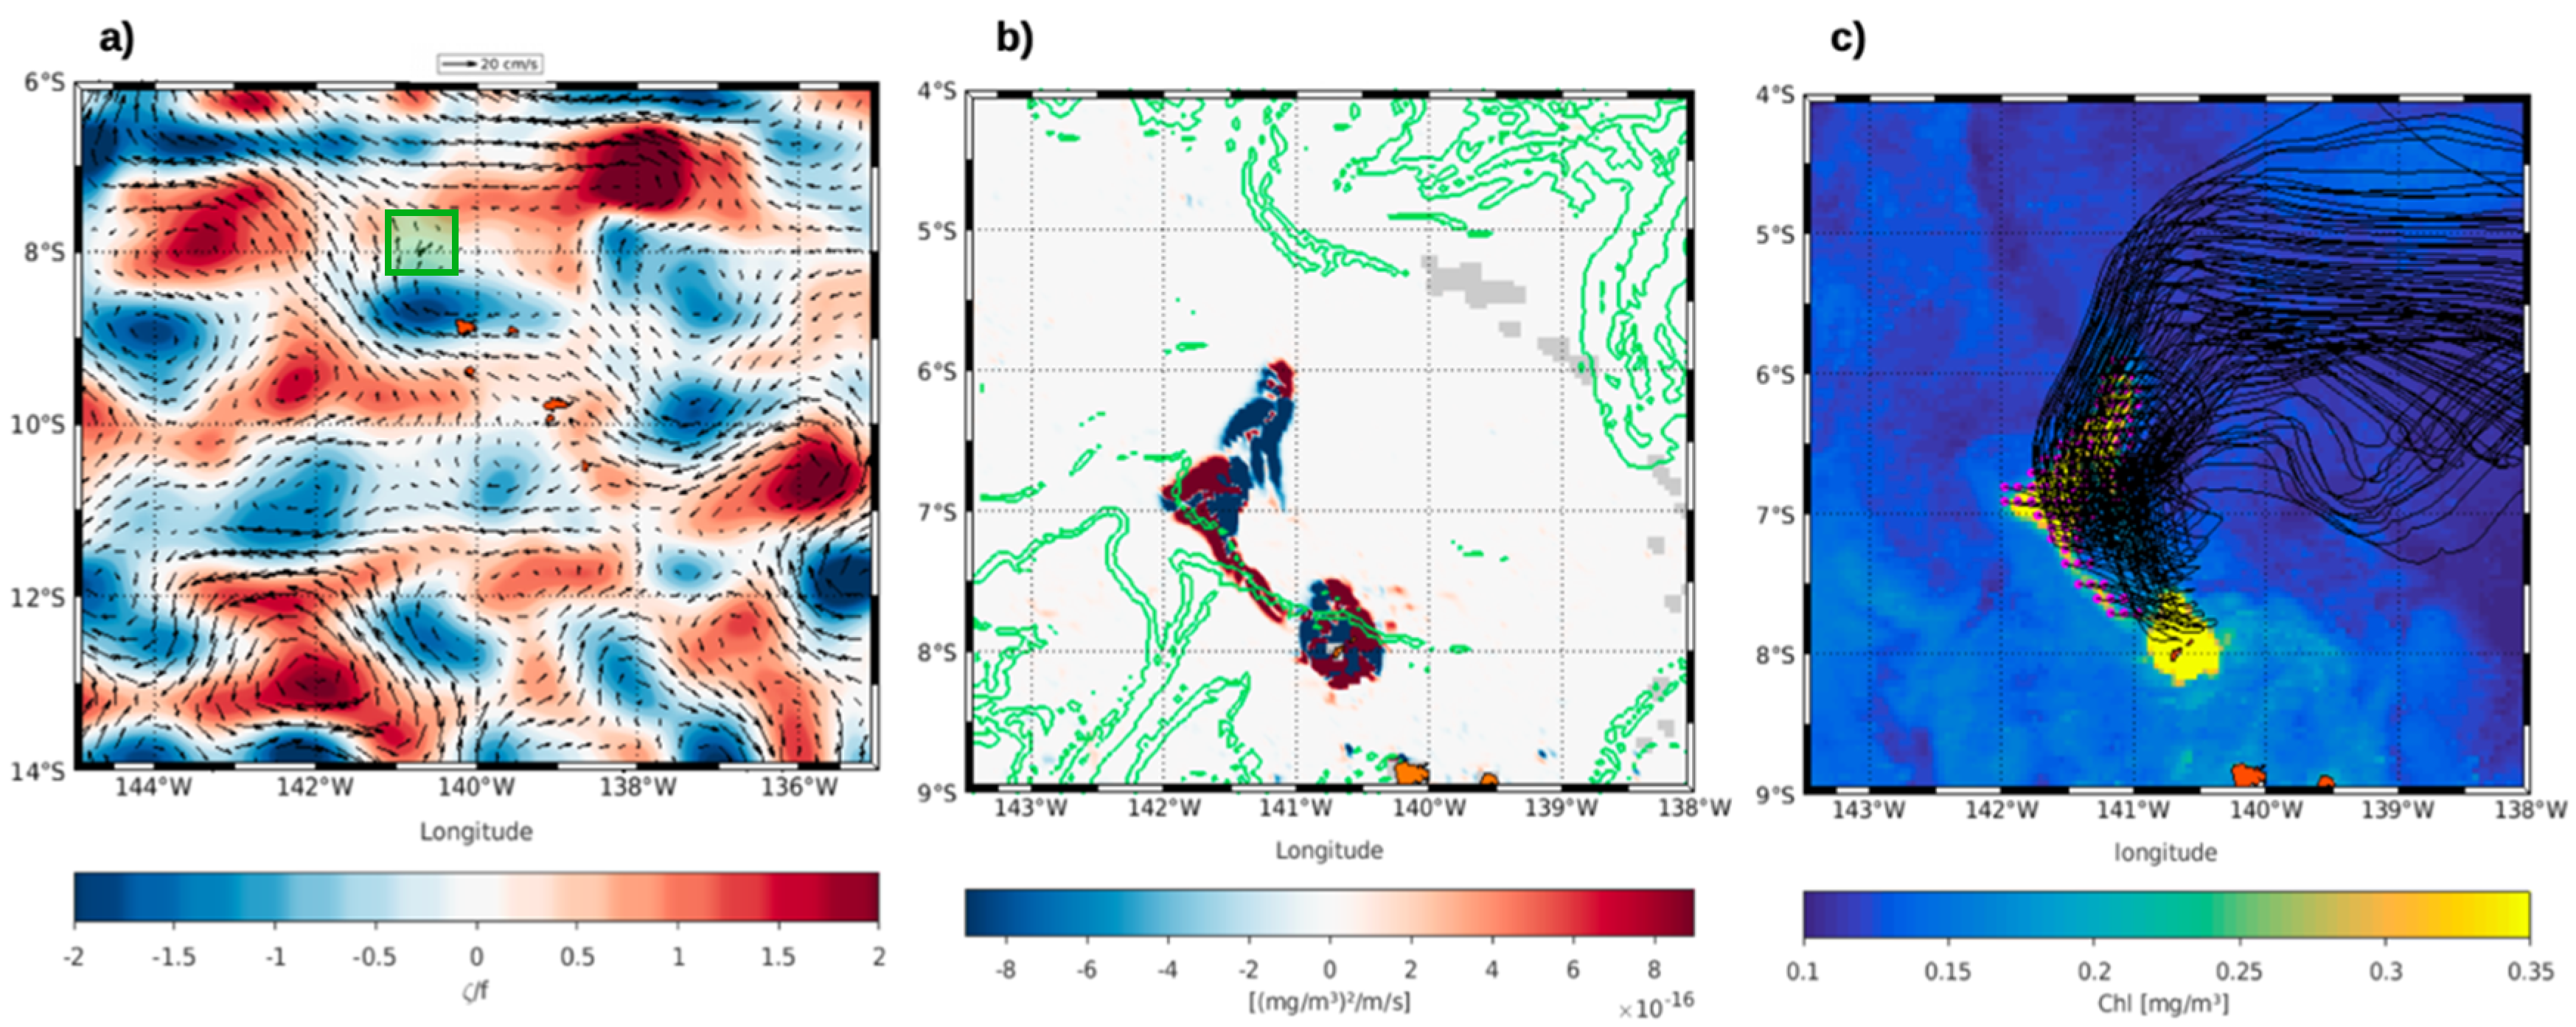
The surface current north of Eiao on the 29th of November flowed northwestward through the convergence of two flows. One flow came from the south and the second one was a meander initially flowing from the north-east (Figure 3a). FSLE values of 0.4 d−1 highlighted the front driven by the convergence of these two flows (Figure 3b). This front was related to an intensification of the Chl gradient along the filament (positive values of the frontogenesis function, in red in Figure 3b). Thus, the horizontal stirring induced by the convergence of the surface currents generated a sub-mesoscale filament which in turn shaped the Chl plume.
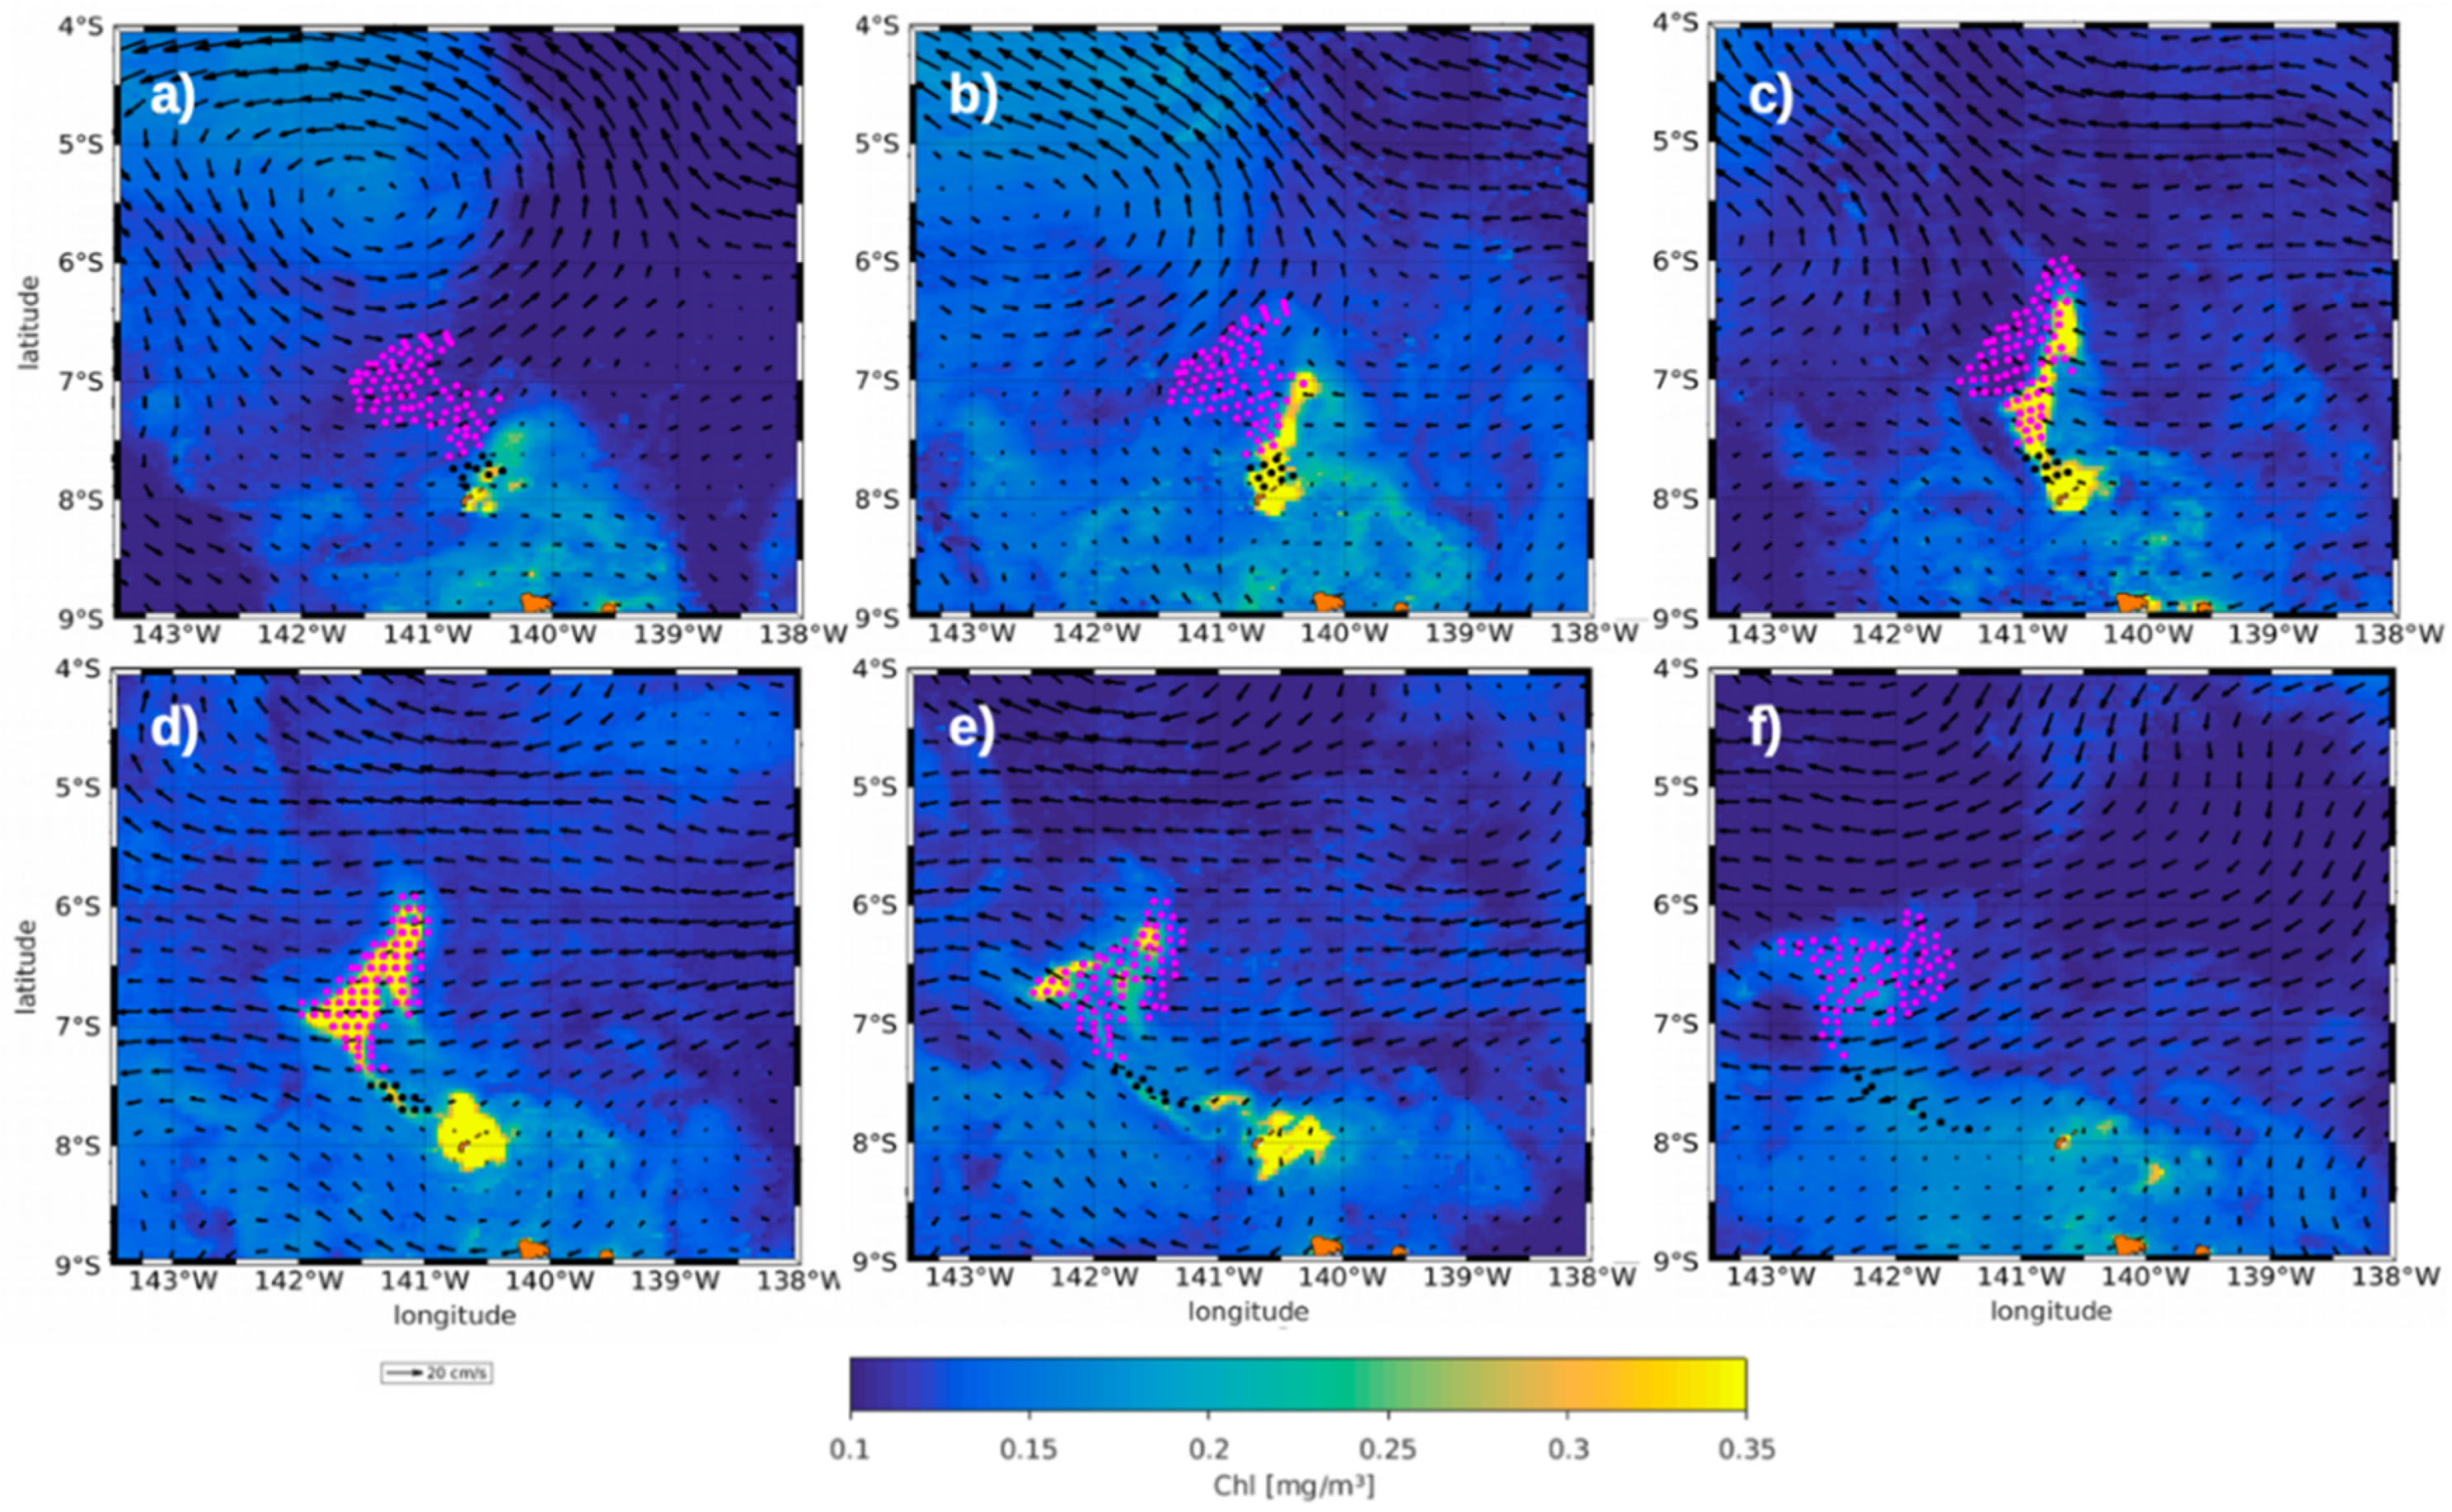
Unlike in the south, less cloud coverage here allowed a comparison between Chl observations and Lagrangian simulations over a longer time period. A total of 88 simulated particles were seeded on the 29th of November, in the offshore and elongated Chl plumes defined by higher values than 0.2 mg·m−3 (dots in Figure 3c and Figure 4d). Integrations were performed over 150 days both (i) backward-in-time to investigate a potential connection between the offshore and nearshore high Chl (the 17th, 20th and 24th of November in Figure 4a–c), (ii) forward-in-time to study the ultimate evolution of these Chl plumes (the 3rd and 8th of December in Figure 4e,f).
With respect to the backward trajectories, all the particles located in the Chl plume originated from the north-east of the archipelago (Figure 3c). They were advected westward zonally before turning southwestward, following the well-known mean pattern of the SEC. A few particles reached Eiao (Figure 3c and black dots in Figure 4a). The 17th of November, the SEC changed direction to northwest. As a result, some of the high Chl particles from Eiao were advected along the convergence front, creating the thin filament which linked the onshore and offshore blooms (black dots in Figure 4a–d). This very specific convergence front dynamics succeeded in capturing the Chl advection from Eiao. Conversely, the particles seeded within the offshore bloom (pink dots in Figure 4a–d) were not advected from Eiao in the present Lagrangian simulations. On the 3rd of December all the particles continued to drift northwestward, consistently with the Chl plume advection, while the bloom weakened (Figure 4e,f). These simulations suggested that the observed offshore phytoplanktonic enhancement was, at least partly, generated from the island of Eiao itself, despite its modest size (43.8 km²).

4. Discussion

Multi-platform satellite observations and Lagrangian simulations demonstrated that, for both bloom events analyzed in this study, fertilization occurred locally from the islands, providing the required nutrients for phytoplankton to thrive. The beneficial coastal effect of the islands for the biological enhancement observed here, corroborate a recent hypothesis from a physical-biogeochemical model [16]. Indeed, numerical simulations showed that an iron input from the island sediments was a prerequisite to reproduce both horizontal and vertical patterns of Chl observed at the archipelago scale from radiometric satellites and a biogeochemical-Argo profiling float. However, which processes are involved in the nearshore fertilization remain an open question. Local processes related to the islands themselves could be at play (e.g., land drainage, internal wave surge). A transient island−ocean dynamics interaction releasing nutrients from the sediments could also be an explanation. In the Mozambique Channel, numerical simulations have shown that eddy activity could advect nutrient-rich coastal waters through lateral transport enhancing offshore phytoplankton productivity [32]. Further investigations of these eddy−island interactions might be of particular interest as an analysis with the GEKCO currents pointed out that mesoscale eddies regularly flow in the southern region of the Marquesas (Figure S3). Contrastingly, mesoscale oceanic activity is less important in the northern region (Figure S4), a north/south pattern which has been observed on longer time-scales [17].
The Lagrangian simulations clearly highlight the offshore advection of Chl from the islands in the south and along the filament in the north. However, results are not as conclusive for the offshore bloom north of Eiao (pink dots in Figure 4d). According to the present Lagrangian simulations, these water particles would have drifted from an area with Chl values not significantly different from the background waters (Figure 4a–c). It suggests that smaller scales dynamics than mesoscale could be involved but are not captured by the GECKO product with a ¼° spatial resolution. These smaller scales could be responsible either for a Chl advection from the islands, or for some local nutrient uplift. However, the shallow penetration of sub-mesoscale vertical currents would seem to limit their impact on productivity [27] and considering the strong Chl enhancement observed for this bloom, this later hypothesis is open for debate.
Finally, Lagrangian simulations, FSLE and the frontogeneses function highlight the relevance of (sub)mesoscale dynamics of the archipelago in the dispersion and structure of Chl plumes. The horizontal transport of coastal rich waters in the south extends over hundreds of kilometers, a remarkable expansion despite the modest size of the islands. Additional mechanisms associated with mesoscale eddy vertical variations in nutrient and/or light availability (e.g., eddy pumping, eddy−wind interaction, and eddy impacts on mixed-layer depth) [33,34,35] could also modulate biological rates (see [36]) and enhance such advected Chl plume. Although vertical processes in the supply of nutrients to the upper-lit layer are widely emphasized in the literature, horizontal transport processes are far from being negligible (e.g., [32,37,38,39]). Spatial heterogeneities induced by lateral stirring in the euphotic zone may impact the temporal and spatial distribution of the carbon export [40]. Thus, using a high-resolution physical-biogeochemical coupled model would enable the discrimination of nutrient vertical transport (or Chl from the deep chlorophyll maximum [7]) from Chl horizontal transport and quantify the impact of mesoscale activity on biological lateral advection and carbon flux in such IME.

5. Conclusions

Two phytoplanktonic blooms, remarkable for their extension and unexpectedly high values for such a HNLC region, occurred north and south of the Marquesas archipelago during and shortly after the MOANA MATY cruise. The present study aimed to investigate some physical mechanisms likely to be involved in these two blooms. A combination of satellite observations and Lagrangian 2D simulations illustrated the role of island fertilization and mesoscale oceanic activity in both events. Our study supports, through remote sensing, recent results from a physical-biogeochemical model demonstrating the need of iron input from the island sediment to reproduce the Marquesan IME. Then, Lagrangian simulations also highlighted the key role of mesoscale surface currents in the spectacular spatial coverage and dispersion of both Chl plumes. Moreover, the different Chl plumes highlighted contrasting dynamical regimes within the archipelago, with rather mesoscale eddies in the south and finer-scale dynamic activity in the north.

Supplementary Materials

The following are available online at https://www.mdpi.com/2072-4292/12/16/2520/s1, Figure S1: Correlation between in situ Chl from the MOANA MATY cruise and satellite Chl; Figure S2: Comparison of the dispersion of the simulated particles and the SVP drifters deployed during the MOANA-MATY cruise; Table S1: Average distances of simulated particles from their barycenter during the Lagrangian simulations; Figure S3: Hovmoller diagram of the normalized vorticity on latitude 10.3°S in 2018; Figure S4: Average of FSLEs for the year 2018 in the Marquesas archipelago.

Author Contributions

A.C. analyzed the results and wrote the first draft of the manuscript, E.M. and C.M. contributed to the supervision and provided support in the analysis and significant writing input for the manuscript, X.C. provided support in the analysis and the feedback on the physical approach, T.G. provided the feedback on the biogeochemical approach. All authors have read and agreed to the published version of the manuscript.

Funding

This work was supported by INSU LEFE Cyber within the framework of the Moana Maty project, as well as the government of French Polynesia for the financial support of the Moana O Te Ati Enana project (convention °07498°).

Acknowledgments

Rick Lumpkin and Shaun Dolk from NOAA/AOML are greatly thanked for providing and sharing SVP drifters and data. We also thank the captain and crew of the oceanic vessel Alis, as well as the head of the mission M.Rodier. We would like to thank the three anonymous reviewers whose comments have helped to improve the manuscript.

Conflicts of Interest

The authors declare no conflict of interest.

References

  1. Doty, M.S.; Oguri, M. The Island Mass Effect. ICES J. Mar. Sci. 1956, 22, 33–37. [Google Scholar] [CrossRef]
  2. Coutis, P.F.; Middleton, J.H. Flow-topography interaction in the vicinity of an isolated, deep ocean island. Deep Sea Res. Part Oceanogr. Res. 1999, 46, 1633–1652. [Google Scholar] [CrossRef]
  3. Bucciarelli, E.; Blain, S.; Tréguer, P. Iron and Manganese in the wake of the Kerguelen Islands (Southern Ocean). Mar. Chem. 2001, 73, 21–36. [Google Scholar] [CrossRef]
  4. Leichter, J.; Shellenbarger, G.; Genovese, S. Breaking internal waves on a Florida (USA) coral reef: A plankton pump at work? Mar. Ecol. Prog. Ser. 1998, 166, 83–97. [Google Scholar] [CrossRef]
  5. Basterretxea, G.; Barton, E.D.; Tett, P.; Sangrà, P.; Navarro-Perez, E.; Aristegui, J. Eddy and deep chlorophyl maximum response to wind-shear in the lee of Gran Canaria. Deep Sea Res. Part I Oceanogr. Res. Pap. 2002, 49, 1087–1101. [Google Scholar] [CrossRef] [Green Version]
  6. Jiménez, B.; Sangrà, P.; Mason, E. A numerical study of the relative importance of wind and topographic forcing on oceanic eddy shedding by tall, deep water islands. Ocean Model. 2008, 22, 146–157. [Google Scholar] [CrossRef]
  7. Hasegawa, D.; Lewis, M.R.; Gangopadhyay, A. How islands cause phytoplankton to bloom in their wakes. Geophys. Res. Lett. 2009, 36. [Google Scholar] [CrossRef]
  8. Martinez, E.; Maamaatuaiahutapu, K. Island mass effect in the Marquesas Islands: Time variation. Geophys. Res. Lett. 2004, 31. [Google Scholar] [CrossRef] [Green Version]
  9. Signorini, S.R.; McClain, C.R.; Dandonneau, Y. Mixing and phytoplankton bloom in the wake of the Marquesas Islands. Geophys. Res. Lett. 1999, 26, 3121–3124. [Google Scholar] [CrossRef]
  10. Claustre, H.; Sciandra, A.; Vaulot, D. Introduction to the special section bio-optical and biogeochemical conditions in the South East Pacific in late 2004: The BIOSOPE program. Biogeosciences 2008, 5, 679–691. [Google Scholar] [CrossRef] [Green Version]
  11. Raimbault, P.; Garcia, N.; Cerutti, F. Distribution of inorganic and organic nutrients in the South Pacific Ocean & minus; evidence for long-term accumulation of organic matter in nitrogen-depleted waters. Biogeosciences 2008, 5, 281–298. [Google Scholar] [CrossRef] [Green Version]
  12. Raimbault, P.; Garcia, N. Evidence for efficient regenerated production and dinitrogen fixation in nitrogen-deficient waters of the South Pacific Ocean: Impact on new and export production estimates. Biogeosciences 2008, 5, 323–338. [Google Scholar] [CrossRef] [Green Version]
  13. Blain, S.; Bonnet, S.; Guieu, C. Dissolved iron distribution in the tropical and sub tropical South Eastern Pacific. Biogeosciences 2008, 5, 269–280. [Google Scholar] [CrossRef] [Green Version]
  14. Raapoto, H.; Martinez, E.; Petrenko, A.; Doglioli, A.M.; Maes, C. Modeling the Wake of the Marquesas Archipelago. J. Geophys. Res. Oceans 2018, 123, 1213–1228. [Google Scholar] [CrossRef]
  15. Martinez, E.; Rodier, M.; Pagano, M.; Sauzede, R. Plankton spatial variability within the Marquesas archipelago during the Pakaihi I te Moana cruise. J. Mar. Syst. (in review).
  16. Raapoto, H.; Martinez, E.; Petrenko, A.; Doglioli, A.; Gorgues, T.; Sauzède, R.; Maamaatuaiahutapu, K.; Maes, C.; Menkes, C.; Lefèvre, J. Role of Iron in the Marquesas Island Mass Effect. J. Geophys. Res. Oceans 2019, 124, 7781–7796. [Google Scholar] [CrossRef]
  17. Martinez, E.; Raapoto, H.; Maes, C.; Maamaatuaihutapu, K. Influence of Tropical Instability Waves on Phytoplankton Biomass near the Marquesas Islands. Remote Sens. 2018, 10, 640. [Google Scholar] [CrossRef] [Green Version]
  18. de Verneil, A.; Rousselet, L.; Doglioli, A.M.; Petrenko, A.A.; Moutin, T. The fate of a southwest Pacific bloom: Gauging the impact of submesoscale vs. mesoscale circulation on biological gradients in the subtropics. Biogeosciences 2017, 14, 3471–3486. [Google Scholar] [CrossRef] [Green Version]
  19. McEliece, R.; Hinz, S.; Guarini, J.-M.; Coston-Guarini, J. Evaluation of Nearshore and Offshore Water Quality Assessment Using UAV Multispectral Imagery. Remote Sens. 2020, 12, 2258. [Google Scholar] [CrossRef]
  20. Jing, Y.; Zhang, Y.; Hu, M.; Chu, Q.; Ma, R. MODIS-Satellite-Based Analysis of Long-Term Temporal-Spatial Dynamics and Drivers of Algal Blooms in a Plateau Lake Dianchi, China. Remote Sens. 2019, 11, 2582. [Google Scholar] [CrossRef] [Green Version]
  21. Buma, W.G.; Lee, S.-I. Evaluation of Sentinel-2 and Landsat 8 Images for Estimating Chlorophyll-a Concentrations in Lake Chad, Africa. Remote Sens. 2020, 12, 2437. [Google Scholar] [CrossRef]
  22. Rodier, M. MOANA-MATY 2018 Cruise, Alis R/V. 2018. Available online: https://doi.org/10.17600/18000580 (accessed on 1 June 2020).
  23. Ras, J.; Claustre, H.; Uitz, J. Spatial variability of phytoplankton pigment distributions in the Subtropical South Pacific Ocean: Comparison between in situ and predicted data. Biogeosciences 2008, 5, 353–369. [Google Scholar] [CrossRef] [Green Version]
  24. Maritorena, S.; d’Andon, O.H.F.; Mangin, A.; Siegel, D.A. Merged satellite ocean color data products using a bio-optical model: Characteristics, benefits and issues. Remote Sens. Environ. 2010, 114, 1791–1804. [Google Scholar] [CrossRef]
  25. Sudre, J.; Maes, C.; Garçon, V. On the global estimates of geostrophic and Ekman surface currents. Limnol. Oceanogr. Fluids Environ. 2013, 3, 1–20. [Google Scholar] [CrossRef] [Green Version]
  26. d’Ovidio, F.; De Monte, S.; Alvain, S.; Dandonneau, Y.; Levy, M. Fluid dynamical niches of phytoplankton types. Proc. Natl. Acad. Sci. USA 2010, 107, 18366–18370. [Google Scholar] [CrossRef] [PubMed] [Green Version]
  27. Levy, M.; Franks, P.; Smith, K. The role of submesoscale currents in structuring marine ecosystems. Nat. Commun. 2018, 9, 1–16. [Google Scholar] [CrossRef] [PubMed] [Green Version]
  28. d’Ovidio, F.; Della Penna, A.; Trull, T.W.; Nencioli, F.; Pujol, M.-I.; Rio, M.-H.; Park, Y.-H.; Cotté, C.; Zhou, M.; Blain, S. The biogeochemical structuring role of horizontal stirring: Lagrangian perspectives on iron delivery downstream of the Kerguelen Plateau. Biogeosciences 2015, 12, 5567–5581. [Google Scholar] [CrossRef] [Green Version]
  29. Hoskins, B.J. The Mathematical Theory of Frontogenesis. Annu. Rev. Fluid Mech. 1982, 14, 131–151. [Google Scholar] [CrossRef]
  30. Blanke, B.; Raynaud, S. Kinematics of the Pacific Equatorial Undercurrent: An Eulerian and Lagrangian Approach from GCM Results. J. Phys. Oceanogr. 1997, 27, 1038–1053. [Google Scholar] [CrossRef]
  31. Martinez, E.; Ganachaud, A.; Lefèvre, J.; Maamaatuaiahutapu, K. Central South Pacific thermocline water circulation from a high-resolution ocean model validated against satellite data: Seasonal variability and El Niño 1997–1998 influence. J. Geophys. Res. 2009, 114. [Google Scholar] [CrossRef] [Green Version]
  32. José, Y.S.; Penven, P.; Aumont, O.; Machu, E.; Moloney, C.L.; Shillington, F.; Maury, O. Suppressing and enhancing effects of mesoscale dynamics on biological production in the Mozambique Channel. J. Mar. Syst. 2016, 158, 129–139. [Google Scholar] [CrossRef] [Green Version]
  33. McGillicuddy, D.J.; Robinson, A.R.; Siegel, D.A.; Jannasch, H.W.; Johnson, R.; Dickey, T.D.; McNeil, J.; Michaels, A.F.; Knap, A.H. Influence of mesoscale eddies on new production in the Sargasso Sea. Nature 1998, 394, 263–266. [Google Scholar] [CrossRef]
  34. McGillicuddy, D.J.; Anderson, L.A.; Bates, N.R.; Bibby, T.; Buesseler, K.O.; Carlson, C.A.; Davis, C.S.; Ewart, C.; Falkowski, P.G.; Goldthwait, S.A.; et al. Eddy/wind interactions stimulate extraordinary mid-ocean plankton blooms. Science 2007, 316, 1021–1026. [Google Scholar] [CrossRef] [PubMed]
  35. Siegel, D.; Mcgillicuddy, D.; Fields, E. Mesoscale eddies, satellite altimetry, and new production in the Sargasso Sea. J. Geophys. Res. 1999, 104, 13359–13380. [Google Scholar] [CrossRef] [Green Version]
  36. McGillicuddy, D.J. Mechanisms of Physical-Biological-Biogeochemical Interaction at the Oceanic Mesoscale. Annu. Rev. Mar. Sci. 2016, 8, 125–159. [Google Scholar] [CrossRef] [Green Version]
  37. Auger, P.-A.; Gorgues, T.; Machu, E.; Aumont, O.; Brehmer, P. What drives the spatial variability of primary productivity and matter fluxes in the north-west African upwelling system? A modelling approach. Biogeosciences 2016, 13, 6419–6440. [Google Scholar] [CrossRef] [Green Version]
  38. Gorgues, T.; Menkes, C.; Aumont, O.; Vialard, J.; Dandonneau, Y.; Bopp, L. Biogeochemical impact of tropical instability waves in the equatorial Pacific. Geophys. Res. Lett. 2005, 32, L24615. [Google Scholar] [CrossRef] [Green Version]
  39. Messié, M.; Petrenko, A.; Doglioli, A.M.; Aldebert, C.; Martinez, E.; Koenig, G.; Bonnet, S.; Moutin, T. The Delayed Island Mass Effect: How Islands can Remotely Trigger Blooms in the Oligotrophic Ocean. Geophys. Res. Lett. 2020, 47, e2019GL085282. [Google Scholar] [CrossRef] [Green Version]
  40. Martinez, E.; Richards, K.J. Impact of spatio-temporal heterogeneities and lateral stirring and mixing on mid-water biotic interactions. J. Mar. Syst. 2010, 82, 122–134. [Google Scholar] [CrossRef]
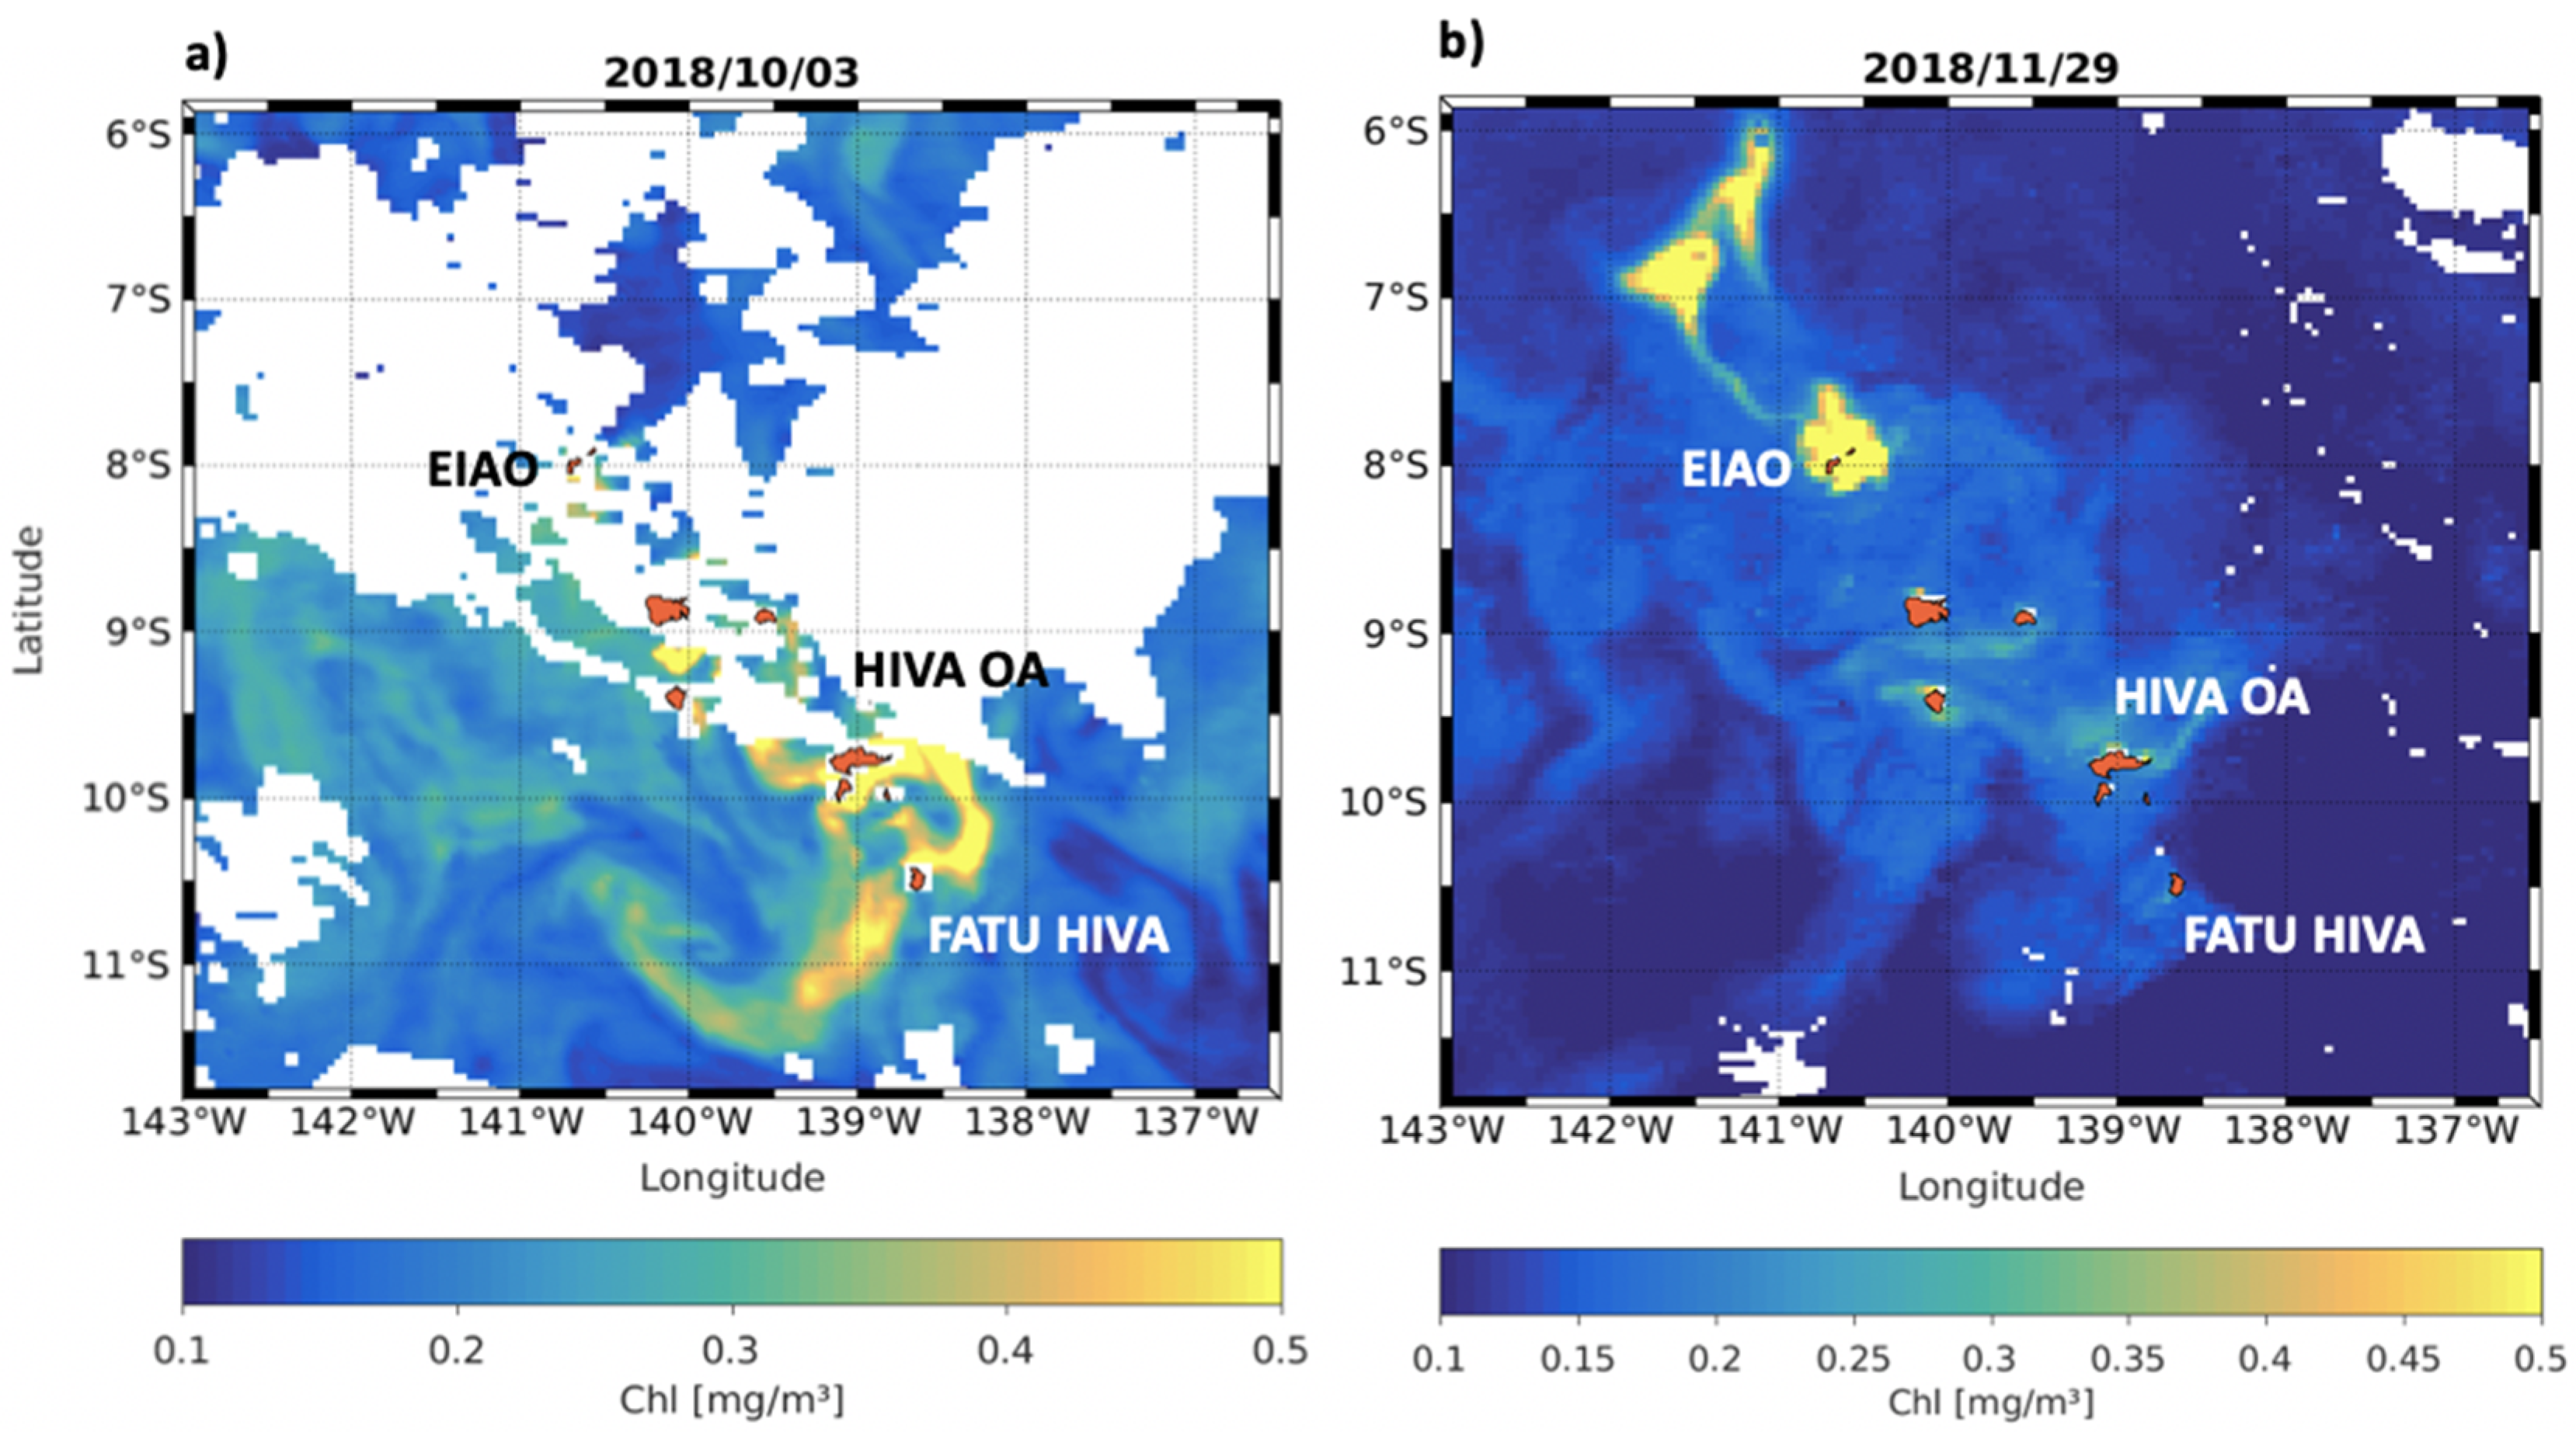
Figure 1. Chl (mg·m−3) derived from the Garver Siegel Maritonera algorithm merging multiple satellite sensors (MODIS and VIIRS) data in the Marquesas archipelago (a) 3 October 2018 and (b) 29 November 2018. The Marquesas islands are in orange and missing data induced by the cloud coverage are in white.
Remotesensing 12 02520 g001
Figure 2. The 3rd October 2018: (a) relative vorticity normalized by the Coriolis parameter f, ζ f With positive values in red standing for anticyclonic eddies and negative values in blue for cyclonic eddies. The green box highlights the position of the island called Hiva Oa and Fatu Hiva. Surface current fields from GEKCO are superimposed in black; (b) frontogenesis [(mg·m−3)2.m−1.s−1] with positive values in red stands for the intensification of the Chl lateral gradient and negative values in blue represent the relaxation of the Chl gradient, FSLEs contours of 0.5 d−1 are superimposed in green; (c) particle trajectories simulated with ARIANE are superimposed on the Chl map [mg·m−3]. The 60 particles are initialized (pink dots) in the Chl plume contour defined with higher values than 0.2 mg·m−3 the 3rd of October 2018. Trajectories are then integrated backward-in-time over 150 days (black lines). Islands are in orange.
Remotesensing 12 02520 g002
Figure 3. The 29th of November 2018, (a) and (b) same as in Figure 2a,b, with a focus around Eaio (green box in (a) is (b)). The green box in (a) highlights the position of the island called Eiao. (c) Particle trajectories simulated with ARIANE are superimposed on Chl map [mg·m−3]. The 88 particles are initialized (pink dots) in the Chl plume defined with higher Chl than 0.2 mg·m−3 the 29th November, and then integrated backward-in-time over 150 days (black lines). Islands are in orange.
Remotesensing 12 02520 g003
Figure 4. Chl maps, surface current fields from GEKCO and ARIANE simulations running for the (a) 17th (b) 20th and (c) 24th of November (the backward-in-time simulations), (d) the 29th of November (the initial day) and the (e) 3rd and (f) 8th of December (the forward-in-time simulations). The black particles encountering Eiao are highlighted as black dots whereas the pink dots stay away from the island. The islands are in orange.
Remotesensing 12 02520 g004