Quantifying Ground Subsidence Associated with Aquifer Overexploitation Using Space-Borne Radar Interferometry in Kabul, Afghanistan


Abstract
1. Introduction
2. Descriptions of the Study Area
- Top layer is silt-rich fine sediment loess and alluvial fans developed on the flanks of the mountains [4];
- Quaternary layer consists of coarse-grained gravel and conglomerate with a thickness around 70 m.
- Neogene layer consists of clay, clay-silt and fine sand-clay sediments with a thickness of 1000 m.
- Aquiclude (bedrock) underlying the aquifers.
3. Data and Methods
3.1. Interferometric Processing
3.2. Time-Series Analysis
3.3. Multi-Geometry Data Fusion to Derive 2D Model
3.4. Wavelet Transform Analysis
4. Results
4.1. InSAR-Derived Mean LOS Displacement Rate
4.2. Decomposition into Horizontal and Vertical Displacements
4.3. Spatial Patterns
4.4. Temporal Patterns
5. Discussion
5.1. Comparisons with Groundwater Level Change
5.2. Comparisons with Geotechnical Properties of Sediments
6. Conclusions
- The integration of ascending and descending LOS displacement rates reveals a mean annual vertical displacement of up to −5.3 cm/year, with limited horizontal motion during the study period from 2014 to 2019.
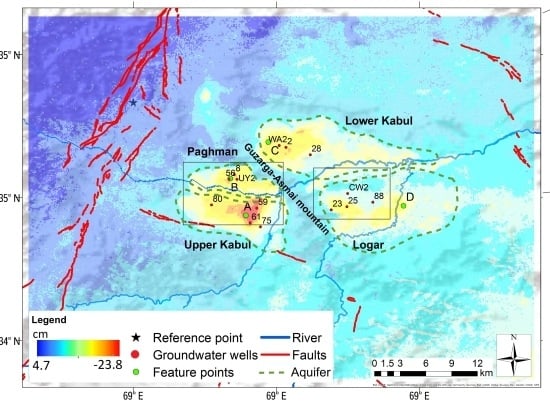
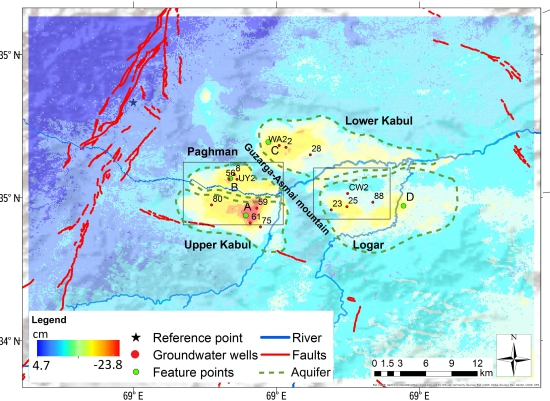
- Four large subsiding bowls are detected in four aquifer basins: Upper and Lower Kabul, Paghman, and Logar, with the former experiencing twice and three times as much subsidence as the three other sites. The maximum cumulative subsidence accounts for −23.8, −10.9, −12.9, and −8.6 cm, respectively.
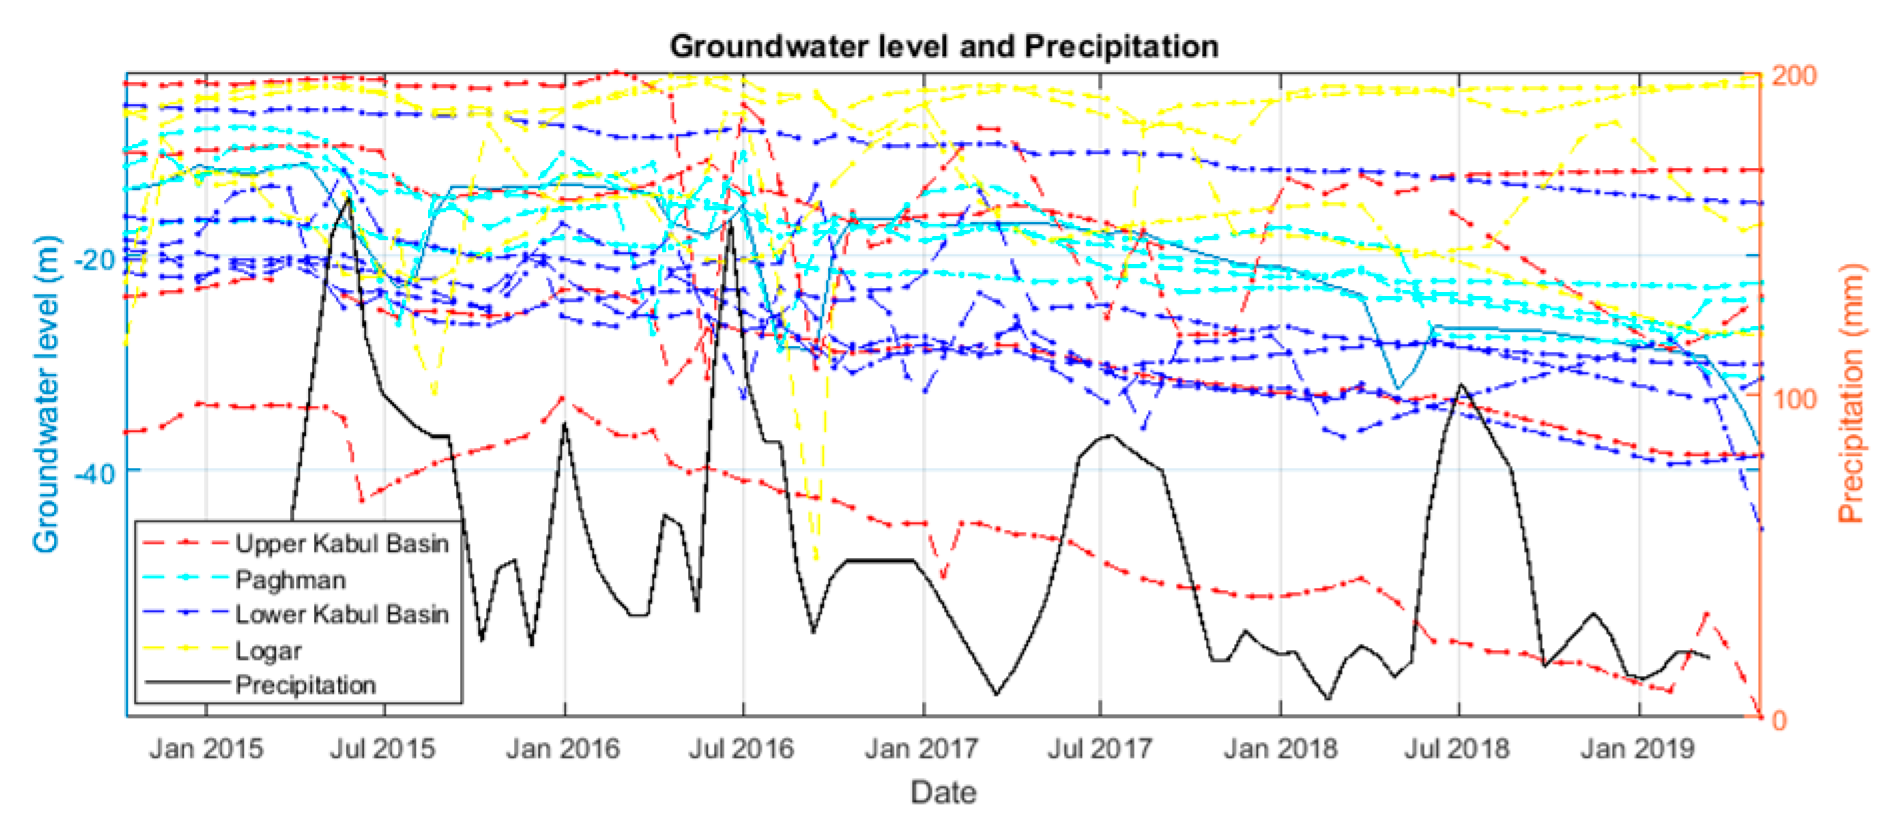
- Analysis of groundwater level change illustrates its synchronized variations with subsidence: the larger the groundwater level drop, the greater the subsidence rates observed. Similarly, seasonal fluctuations in the groundwater level in Logar basin coincide with observed non-linear deformation patterns. Cross-wavelet transform analysis allows the estimation of the temporal lag of the system response (ground subsidence) to triggering factor (groundwater decrease) in Logar basin.
- A greater magnitude of subsidence is observed in areas with compressible clayey sediments in shallow geology.
Author Contributions
Funding
Acknowledgments
Conflicts of Interest
References
- Qu, D. Aquastat Country Profile—Afghanistan; FAO: Rome, Italy, 2012. [Google Scholar]
- Saffi, M.H.; Paikob-e-Naswar, W. Groundwater resources at risk in Afghanistan. Dan. Comm. Aid Afghan Refug. Sci. Investig. Rep. Kabul Afghan. 2007, 1, 5–7. [Google Scholar]
- Macpherson, G.; Johnson, W.C.; Liu, H. Viability of karezes (ancient water supply systems in Afghanistan) in a changing world. Appl. Water Sci. 2017, 7, 1689–1710. [Google Scholar] [CrossRef]
- Mack, T.J.; Chornack, M.P.; Verstraeten, I.M. Sustainability of Water Supply at Military Installations, Kabul Basin, Afghanistan. In Sustainable Cities and Military Installations; Springer: Berlin/Heidelberg, Germany, 2014; Volume 1, pp. 199–226. [Google Scholar]
- Custodio, E. Aquifer overexploitation: What does it mean? Hydrogeol. J. 2002, 10, 254–277. [Google Scholar] [CrossRef]
- Poland, J.F.; Davis, G.H. Land Subsidence due to Withdrawal of Fluids; Reviews in Engineering Geology: New York, NY, USA, 1969; Volume 2, pp. 187–269. [Google Scholar]
- Terzaghi, K. Principles of soil mechanics, IV—Settlement and consolidation of clay. Eng. News Rec. 1925, 95, 874–878. [Google Scholar]
- Ikehara, M.E. Global Positioning System surveying to monitor land subsidence in Sacramento Valley, California, USA. Hydrol. Sci. J. 1994, 39, 417–429. [Google Scholar] [CrossRef]
- Bitelli, G.; Russo, P. Levelling Data Management for the Monitoring of Land Subsidence. In Proceedings of the Fourth International Symposium on Land Subsidence, Houston, TX, USA, 12–17 May 1991; Volume 1, pp. 12–17. [Google Scholar]
- Poland, J.F. Guidebook to Studies of Land Subsidence due to Groundwater withdrawal, v. 40 of UNESCO studies and Reports in Hydrology. ParisFr. United Nations Educ. Sci. Cult. Organ. 1984, 305, 17–35. [Google Scholar]
- Froese, C.R.; Mei, S. Mapping and monitoring coal mine subsidence using LiDAR and InSAR. GeoEdmonton 2008, 8, 1127–1133. [Google Scholar]
- Zhu, L.; Gong, H.; Li, X.; Wang, R.; Chen, B.; Dai, Z.; Teatini, P. Land subsidence due to groundwater withdrawal in the northern Beijing plain, China. Eng. Geol. 2015, 193, 243–255. [Google Scholar] [CrossRef]
- Li, Z.; Fielding, E.J.; Cross, P. Integration of InSAR time-series analysis and water-vapor correction for mapping postseismic motion after the 2003 Bam (Iran) earthquake. IEEE Trans. Geosci. Remote Sens. 2009, 47, 3220–3230. [Google Scholar]
- Massonnet, D.; Feigl, K.L. Radar interferometry and its application to changes in the Earth’s surface. Rev. Geophys. 1998, 36, 441–500. [Google Scholar] [CrossRef]
- Crosetto, M.; Monserrat, O.; Cuevas-González, M.; Devanthéry, N.; Crippa, B. Persistent Scatterer Interferometry: A review. Isprs J. Photogramm. Remote Sens. 2016, 115, 78–89. [Google Scholar] [CrossRef]
- Solari, L.; Del Soldato, M.; Bianchini, S.; Ciampalini, A.; Ezquerro, P.; Montalti, R.; Raspini, F.; Moretti, S. From ERS 1/2 to Sentinel-1: Subsidence Monitoring in Italy in the Last Two Decades. Front. Earth Sci. 2018, 6, 1–16. [Google Scholar] [CrossRef]
- Osmanoğlu, B.; Sunar, F.; Wdowinski, S.; Cabral-Cano, E. Time series analysis of InSAR data: Methods and trends. ISPRS J. Photogramm. Remote Sens. 2016, 115, 90–102. [Google Scholar] [CrossRef]
- Rosen, P.; Hensley, S.; Joughin, I.R.; Li, F.K.; Madsen, S.; Rodriguez, E.; Goldstein, R.M. Synthetic Aperture Radar Interferometry. Proc. IEEE 2000, 88, 333–382. [Google Scholar] [CrossRef]
- Gabriel, A.K.; Goldstein, R.M.; Zebker, H.A. Mapping small elevation changes over large areas: Differential radar interferometry. J. Geophys. Res. Solid Earth 1989, 94, 9183–9191. [Google Scholar] [CrossRef]
- Rosi, A.; Tofani, V.; Tanteri, L.; Stefanelli, C.T.; Agostini, A.; Catani, F.; Casagli, N. The new landslide inventory of Tuscany (Italy) updated with PS-InSAR: Geomorphological features and landslide distribution. Landslides 2018, 15, 5–19. [Google Scholar] [CrossRef]
- Wright, T.J.; Parsons, B.E.; Lu, Z. Toward mapping surface deformation in three dimensions using InSAR. Geophys. Res. Lett. 2004, 31, 1–5. [Google Scholar] [CrossRef]
- Chaussard, E.; Amelung, F.; Abidin, H.; Hong, S.-H. Sinking cities in Indonesia: Alos Palsar detects rapid subsidence due to groundwater and gas extraction. Remote Sens. Environ. 2013, 128, 150–161. [Google Scholar] [CrossRef]
- Chen, M.; Tom·s, R.; Li, Z.; Motagh, M.; Li, T.; Hu, L.; Gong, H.; Li, X.; Yu, J.; Gong, X. Imaging Land Subsidence Induced by Groundwater Extraction in Beijing (China) Using Satellite Radar Interferometry. Remote Sens. 2016, 8, 468. [Google Scholar] [CrossRef]
- Dai, K.; Liu, G.; Li, Z.; Li, T.; Yu, B.; Wang, X.; Singleton, A. Extracting vertical displacement rates in Shanghai (China) with multi-platform SAR images. Remote Sens. 2015, 7, 9542–9562. [Google Scholar] [CrossRef]
- Gao, M.; Gong, H.; Chen, B.; Li, X.; Zhou, C.; Shi, M.; Si, Y.; Chen, Z.; Duan, G. Regional Land Subsidence Analysis in Eastern Beijing Plain by InSAR Time Series and Wavelet Transforms. Remote Sens. 2018, 10, 365. [Google Scholar] [CrossRef]
- Bonì, R.; Pilla, G.; Meisina, C. Methodology for Detection and Interpretation of Ground Motion Areas with the A-DInSAR Time Series Analysis. Remote Sens. 2016, 8, 686. [Google Scholar] [CrossRef]
- Haghighi, M.H.; Motagh, M. Ground surface response to continuous compaction of aquifer system in Tehran, Iran: Results from a long-term multi-sensor InSAR analysis. Remote Sens. Environ. 2019, 221, 534–550. [Google Scholar] [CrossRef]
- Qu, F.; Zhang, Q.; Lu, Z.; Zhao, C.; Yang, C.; Zhang, J. Land subsidence and ground fissures in Xi’an, China 2005–2012 revealed by multi-band InSAR time-series analysis. Remote Sens. Environ. 2014, 155, 366–376. [Google Scholar] [CrossRef]
- Houben, G.; Niard, N.; Tünnermeier, T.; Himmelsbach, T. Hydrogeology of the Kabul Basin (Afghanistan), part I: Aquifers and hydrology. Hydrogeol. J. 2009, 17, 665–677. [Google Scholar] [CrossRef]
- Banks, D.; Soldal, O. Towards a policy for sustainable use of groundwater by non-governmental organisations in Afghanistan. Hydrogeol. J. 2002, 10, 377–392. [Google Scholar] [CrossRef]
- Gellasch, C.A. Hydrogeology of Afghanistan and its impact on military operations. Mil. Geosci. Twenty-First Century.-Geol. Soc. Am. Rev. Eng. Geol. 2014, 22, 69–81. [Google Scholar]
- Mack, T.J.; Akbari, M.; Ashoor, M.; Chornack, M.P.; Coplen, T.B.; Emerson, D.G.; Hubbard, B.E.; Litke, D.W.; Michel, R.L.; Plummer, L. Conceptual Model of Water Resources in the Kabul Basin, Afghanistan; U.S. Geological Survey Scientific Investigation Report; U.S. Geological Survey: Reston, VA, USA, 2010; Volume 1, pp. 1–240.
- Saffi, M.H. Groundwater Natural Resources and Quality Concern in Kabul Basin, Afghanistan; Danish Committee for Aid to Afghan Refugees Organization: Kabul, Afghanistan, 2011; Volume 1, pp. 1–24. [Google Scholar]
- Böckh, E. Report on the Groundwater Resources of the City of Kabul-Report for Bundesanstalt Für Geowissenschaften Und Rohstoffe. BGR File, 1971; 43, Unpublished Work. [Google Scholar]
- Japan International Cooperation Agency; RECS International Inc.; Yachiyo Engineering Co. Ltd.; CTI Engineering International Co. Ltd.; Sanyu Consultants Inc. The Study for the Development of the Master Plan for the Kabul Metropolitan Area in the Islamic Republic of Afghanistan. 2009, 11, pp. 152–162. Available online: https://openjicareport.jica.go.jp/pdf/11965225.pdf (accessed on 5 June 2019).
- Doebrich, J.L.; Wahl, R.R. Geologic and Mineral Resource Map of Afghanistan. U.S. Geological Survey Open-File Report 2006-1038, Version 2, United States; 2006. Available online: https://mrdata.usgs.gov/catalog/cite-view.php?cite=54 (accessed on 30 July 2020).
- Mack, T.J.; Chornack, M.P.; Coplen, T.; Plummer, L.; Rezai, M.; Verstraeten, I.M. Availability of Water in the Kabul Basin, Afghanistan. US Geol. Surv. 2010, 1, 3. [Google Scholar]
- Harris, I.; Osborn, T.J.; Jones, P.; Lister, D. Version 4 of the CRU TS monthly high-resolution gridded multivariate climate dataset. Sci. Data 2020, 7, 109. [Google Scholar] [CrossRef]
- Torres, R.; Snoeij, P.; Geudtner, D.; Bibby, D.; Davidson, M.; Attema, E.; Potin, P.; Rommen, B.; Floury, N.; Brown, M.; et al. GMES Sentinel-1 mission. Remote Sens. Environ. 2012, 120, 9–24. [Google Scholar] [CrossRef]
- Werner, C.; Wegmüller, U.; Strozzi, T.; Wiesmann, A. Gamma SAR and Interferometric Processing Software. In Proceedings of the Ers-Envisat Symposium, Gothenburg, Sweden, 16–20 October 2000; Volume 1, p. 1620. [Google Scholar]
- Prats, P.; Marotti, L.; Wollstadt, S.; Scheiber, R. Investigations on TOPS Interferometry with TerraSAR-X. In Proceedings of the 2010 IEEE International Geoscience and Remote Sensing Symposium, Honolulu, HI, USA, 25–30 July 2010; Volume 1, pp. 2629–2632. [Google Scholar]
- Wegmüller, U.; Werner, C.; Strozzi, T.; Wiesmann, A.; Frey, O.; Santoro, M. Sentinel-1 IWS Mode Support in the GAMMA Software. In Proceedings of the 2015 IEEE 5th Asia-Pacific Conference on Synthetic Aperture Radar (APSAR), Marina Bay Sands, Singapore, 1–4 September 2015; Volume 1, pp. 431–436. [Google Scholar]
- Scheiber, R.; Moreira, A. Coregistration of interferometric SAR images using spectral diversity. IEEE Trans. Geosci. Remote Sens. 2000, 38, 2179–2191. [Google Scholar] [CrossRef]
- Hooper, A.; Zebker, H.A. Phase unwrapping in three dimensions with application to InSAR time series. JOSA A 2007, 24, 2737–2747. [Google Scholar] [CrossRef] [PubMed]
- Costantini, M.; Rosen, P.A. A Generalized Phase Unwrapping Approach for Sparse Data. In Proceedings of the IEEE 1999 International Geoscience and Remote Sensing Symposium, Hamburg, Germany, 28 June–2 July 1999; Volume 1, pp. 267–269. [Google Scholar]
- Chen, C.W.; Zebker, H.A. Phase unwrapping for large SAR interferograms: Statistical segmentation and generalized network models. IEEE Trans. Geosci. Remote Sens. 2002, 40, 1709–1719. [Google Scholar] [CrossRef]
- Ferretti, A.; Prati, C.; Rocca, F. Permanent scatterers in SAR interferometry. IEEE Trans. Geosci. Remote Sens. 2001, 39, 8–20. [Google Scholar] [CrossRef]
- Berardino, P.; Fornaro, G.; Lanari, R.; Sansosti, E. A new algorithm for surface deformation monitoring based on small baseline differential SAR interferograms. IEEE Trans. Geosci. Remote Sens. 2002, 40, 2375–2383. [Google Scholar] [CrossRef]
- Ferretti, A.; Fumagalli, A.; Novali, F.; Prati, C.; Rocca, F.; Rucci, A. A New Algorithm for Processing Interferometric Data-Stacks: SqueeSAR. IEEE Trans. Geosci. Remote Sens. 2011, 49, 3460–3470. [Google Scholar] [CrossRef]
- Ferretti, A.; Prati, C.; Rocca, F. Nonlinear subsidence rate estimation using permanent scatterers in differential SAR interferometry. IEEE Trans. Geosci. Remote Sens. 2000, 38, 2202–2212. [Google Scholar] [CrossRef]
- Hu, J.; Li, Z.; Ding, X.; Zhu, J.; Zhang, L.; Sun, Q. Resolving three-dimensional surface displacements from InSAR measurements: A review. Earth-Sci. Rev. 2014, 133, 1–17. [Google Scholar] [CrossRef]
- Fernandez, J.; Prieto, J.F.; Escayo, J.; Camacho, A.G.; Luzón, F.; Tiampo, K.F.; Palano, M.; Abajo, T.; Pérez, E.; Velasco, J.; et al. Modeling the two- and three-dimensional displacement field in Lorca, Spain, subsidence and the global implications. Sci. Rep. 2018, 8, 14782. [Google Scholar] [CrossRef]
- Fialko, Y.; Sandwell, D.; Simons, M.; Rosen, P. Three-dimensional deformation caused by the Bam, Iran, earthquake and the origin of shallow slip deficit. Nature 2005, 435, 295. [Google Scholar] [CrossRef]
- Ng, A.H.-M.; Ge, L.; Zhang, K.; Chang, H.-C.; Li, X.; Rizos, C.; Omura, M. Deformation mapping in three dimensions for underground mining using InSAR–Southern highland coalfield in New South Wales, Australia. Int. J. Remote Sens. 2011, 32, 7227–7256. [Google Scholar] [CrossRef]
- Tary, J.B.; Herrera, R.H.; van der Baan, M. Analysis of time-varying signals using continuous wavelet and synchrosqueezed transforms. Philos. Trans. A Math Phys. Eng. Sci. 2018, 376, 20170254. [Google Scholar] [CrossRef] [PubMed]
- Grinsted, A.; Moore, J.C.; Jevrejeva, S. Application of the cross wavelet transform and wavelet coherence to geophysical time series. Nonlinear Process. Geophys. 2004, 11, 561–566. [Google Scholar] [CrossRef]
- Torrence, C.; Compo, G. A practical guide to wavelet analysis. Bull. Am. Meteorol. Soc. 1998, 79, 61–78. [Google Scholar] [CrossRef]
- Bonì, R.; Meisina, C.; Teatini, P.; Zucca, F.; Zoccarato, C.; Franceschini, A.; Ezquerro, P.; Bejar, M.; Fernandez-Merodo, J.A.; Guardiola-Albert, C.; et al. Understanding the dynamic behaviour for the Madrid aquifer (Spain): Insights from the integration of A-DInSAR and 3-D groundwater flow and geomechanical models. Proc. Int. Assoc. Hydrol. Sci. 2020, 382, 409–414. [Google Scholar] [CrossRef]
- Ruleman, C.A.; Crone, A.J.; Machette, M.N.; Haller, K.M.; Rukstales, K.S. Map and database of probable and possible Quaternary faults in Afghanistan: U.S. Geol. Surv. Open File Rep. 2007, 1103, 36. [Google Scholar]
- Sheard, R.W. Movement of Water in Soil. Sports Turf Newsletter. 1992, 5, 1. [Google Scholar]
- Bianchini, S.; Solari, L.; Soldato, M.D.; Raspini, F.; Montalti, R.; Ciampalini, A.; Casagli, N. Ground Subsidence Susceptibility (GSS) Mapping in Grosseto Plain (Tuscany, Italy) Based on Satellite InSAR Data Using Frequency Ratio and Fuzzy Logic. Remote Sens. 2019, 11, 2015. [Google Scholar] [CrossRef]
- Pradhan, B.; Abokharima, M.H.; Jebur, M.N.; Tehrany, M.S. Land subsidence susceptibility mapping at Kinta Valley (Malaysia) using the evidential belief function model in GIS. Nat. Hazards 2014, 73, 1019–1042. [Google Scholar] [CrossRef]
- Galloway, D.; Coplin, L.; Ingebritsen, S. Effects of Land Subsidence in the Greater Houston Area. Water Sci. Technol. Libr. 2003, 46, 187–204. [Google Scholar] [CrossRef]
- Poland, J. Mechanics of Land Subsidence Due to Fluid Withdrawal. In Guidebook to Studies of Land Subsidence due to Ground-Water Withdrawal, Studies and Reports in Hydrology; United Nations Educational, Scientific, and Cultural Organization (UNESCO): New York, NY, USA, 1984; Volume 40, pp. 37–54. [Google Scholar]
- Tomás, R.; Li, Z.; Lopez-Sanchez, J.; Liu, P.; Singleton, A. Using wavelet tools to analyse seasonal variations from InSAR time-series data: A case study of the Huangtupo landslide. Landslides 2016, 13, 437–450. [Google Scholar] [CrossRef]
- Suryadi, F.X. Soil and Water Management Strategies for Tidal Lowlands in Indonesia; CRC Press: Boca Raton, FL, USA, 2020. [Google Scholar]
- De Glopper, R.; Ritzema, H. Land Subsidence. In Drainage Principles and Applications; ILRI: Wageningen, The Netherlands, 2006; pp. 477–512. [Google Scholar]
- Young, R. Soil Properties and Behaviour; Elsevier: Amsterdam, The Netherlands, 2012; Volume 5. [Google Scholar]
- Ciampalini, A.; Solari, L.; Giannecchini, R.; Galanti, Y.; Moretti, S. Evaluation of subsidence induced by long-lasting buildings load using InSAR technique and geotechnical data: The case study of a Freight Terminal (Tuscany, Italy). Int. J. Appl. Earth Obs. Geoinf. 2019, 82, 101925. [Google Scholar] [CrossRef]
- Galloway, D.L.; Jones, D.R.; Ingebritsen, S.E. Land Subsidence in the United States; U.S. Geological Survey: Hunter Mill, VA, USA, 1999.
- Aobpaet, A.; Cuenca, M.C.; Hooper, A.; Trisirisatayawong, I. InSAR time-series analysis of land subsidence in Bangkok, Thailand. Int. J. Remote Sens. 2013, 34, 2969–2982. [Google Scholar] [CrossRef]
- Cabral-Cano, E.; Dixon, T.H.; Sánchez, O. InSAR and GPS Analysis of Ground Subsidence in Mexico City. In Proceedings of the AGU Fall Meeting Abstracts, San Francisco, CA, USA, 1 December 2002. [Google Scholar]
- Hu, R.L.; Yue, Z.Q.; Wang, L.C.; Wang, S.J. Review on current status and challenging issues of land subsidence in China. Eng. Geol. 2004, 76, 65–77. [Google Scholar] [CrossRef]


| Satellite | Orbit | Path | Mean Angle of Incidence | Heading Angle | Number of Scenes | Number of Interferograms |
|---|---|---|---|---|---|---|
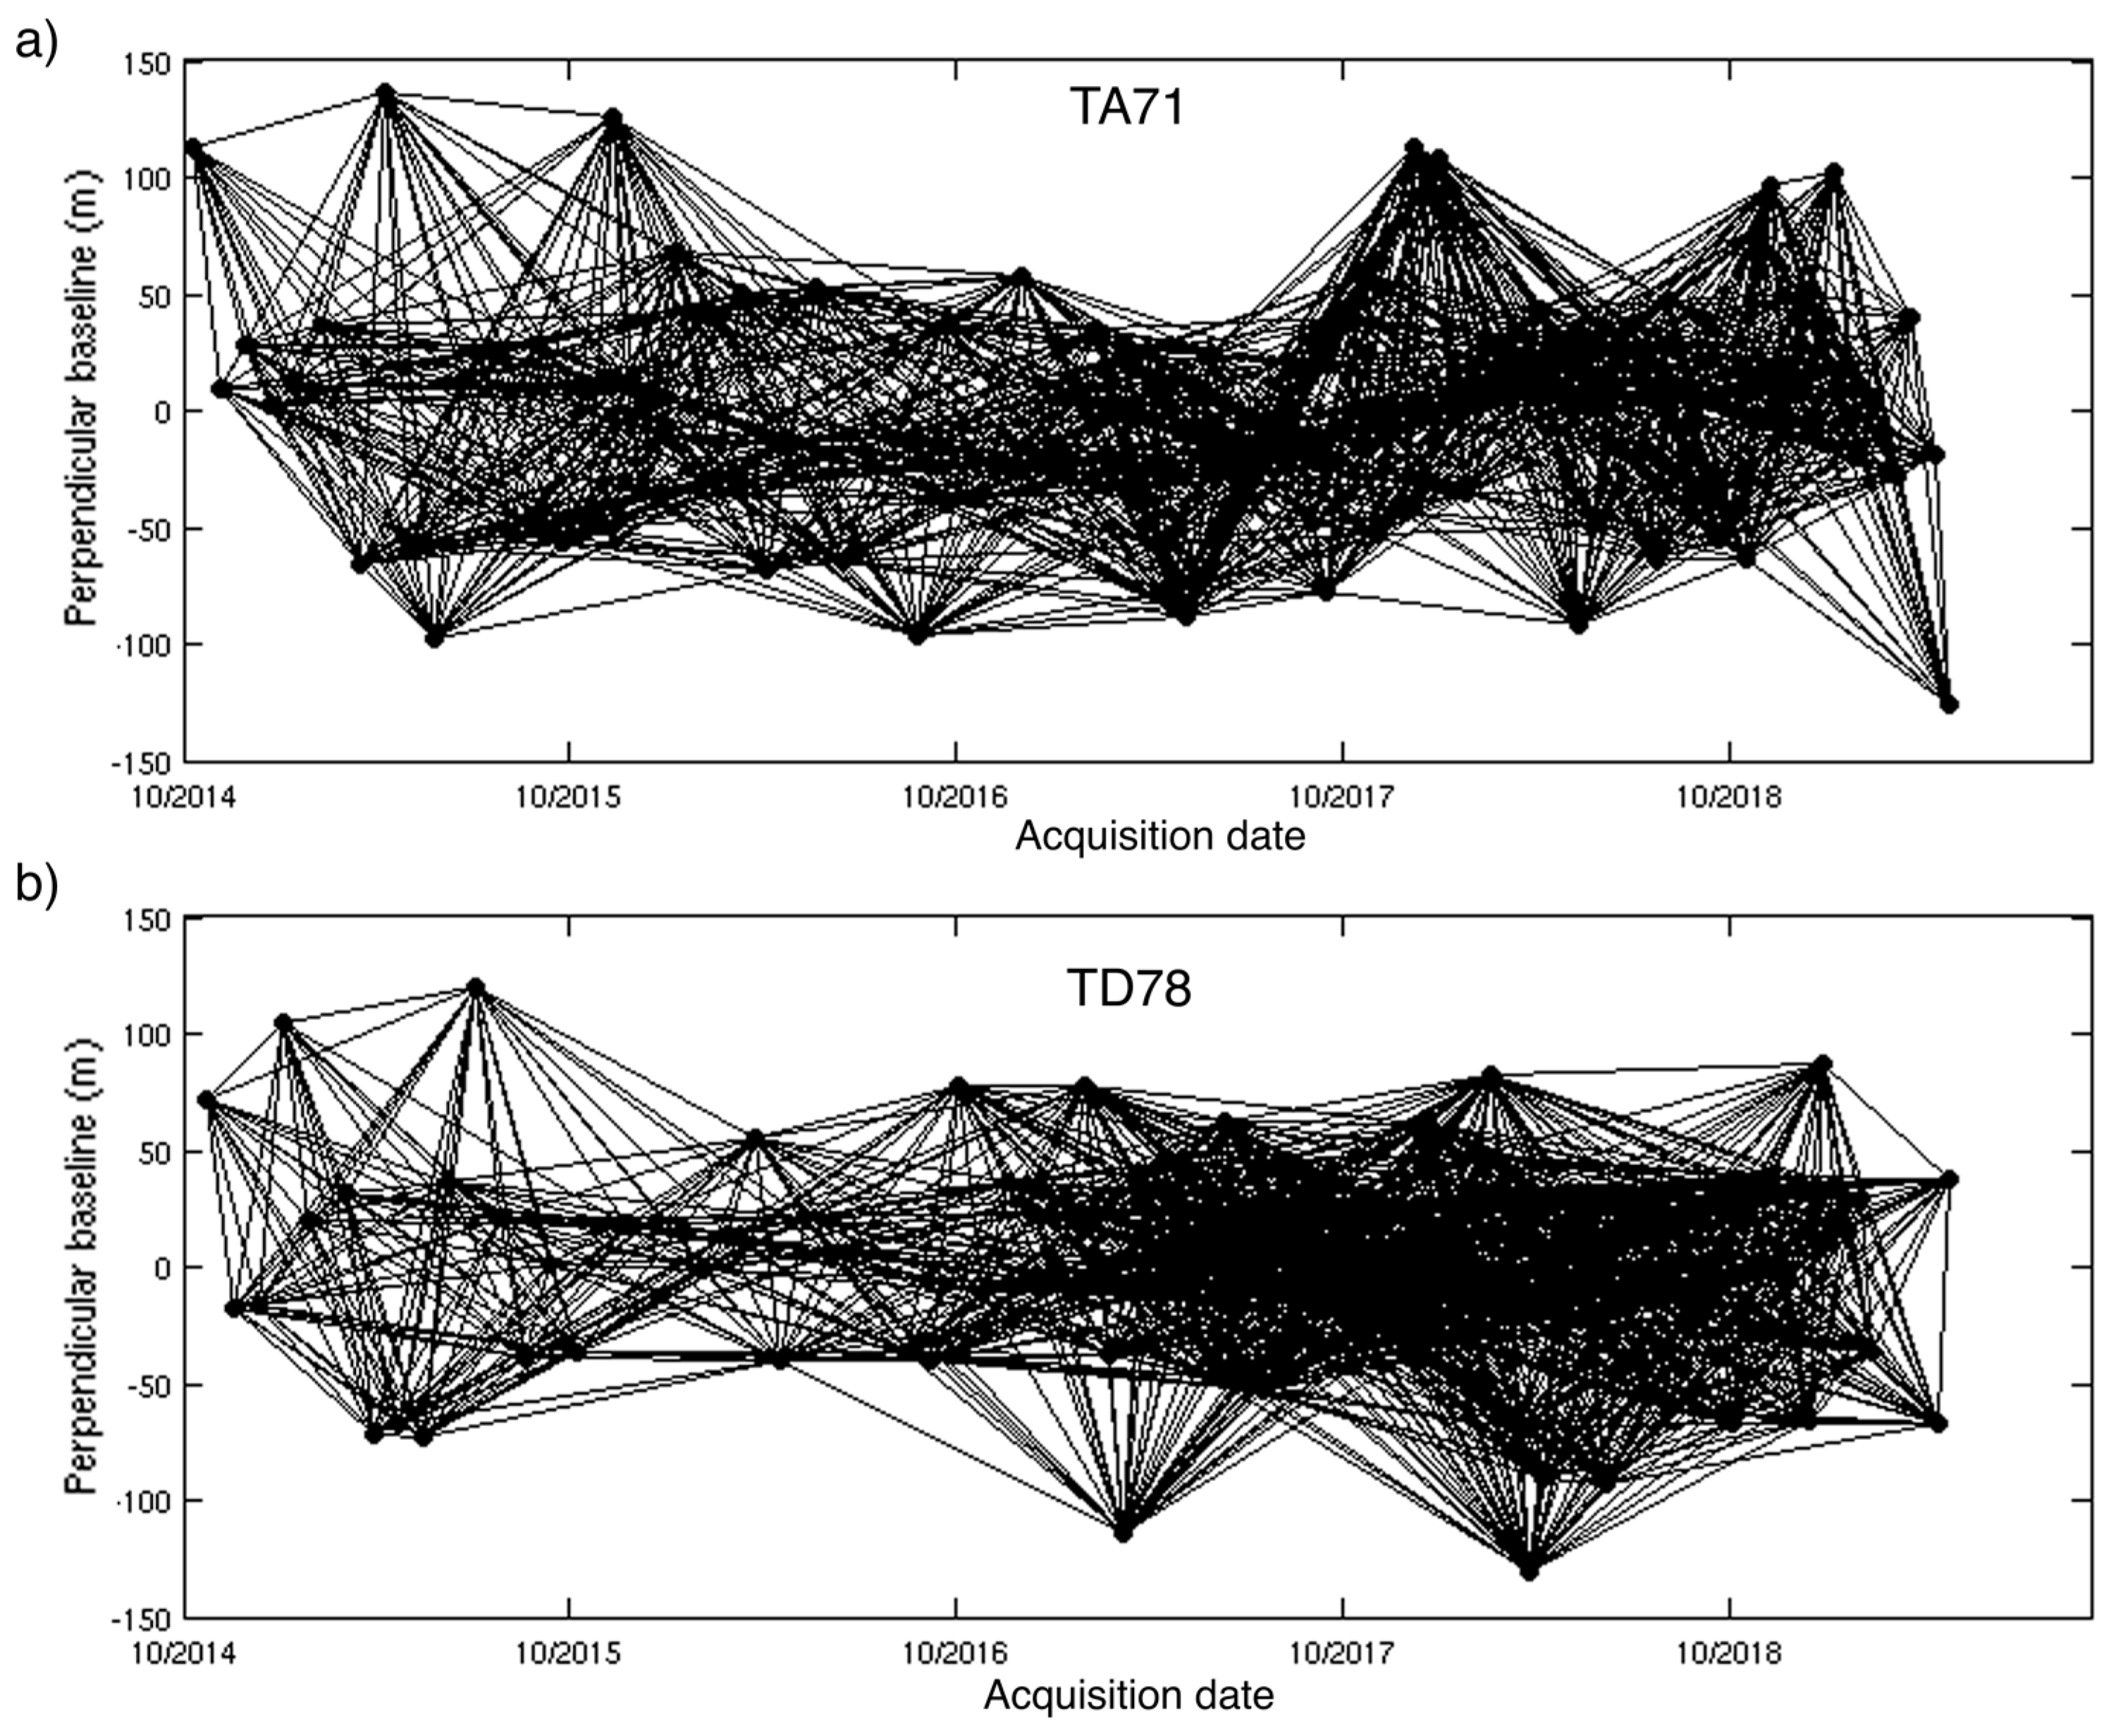
| S-1 | Ascending | 71 | 36.9040 | −13.018 | 106 | 1822 |
| S-1 | Descending | 78 | 41.6189 | −193.011 | 101 | 1825 |
© 2020 by the authors. Licensee MDPI, Basel, Switzerland. This article is an open access article distributed under the terms and conditions of the Creative Commons Attribution (CC BY) license (http://creativecommons.org/licenses/by/4.0/).
Share and Cite
Meldebekova, G.; Yu, C.; Li, Z.; Song, C. Quantifying Ground Subsidence Associated with Aquifer Overexploitation Using Space-Borne Radar Interferometry in Kabul, Afghanistan. Remote Sens. 2020, 12, 2461. https://doi.org/10.3390/rs12152461
Meldebekova G, Yu C, Li Z, Song C. Quantifying Ground Subsidence Associated with Aquifer Overexploitation Using Space-Borne Radar Interferometry in Kabul, Afghanistan. Remote Sensing. 2020; 12(15):2461. https://doi.org/10.3390/rs12152461
Chicago/Turabian StyleMeldebekova, Gauhar, Chen Yu, Zhenhong Li, and Chuang Song. 2020. "Quantifying Ground Subsidence Associated with Aquifer Overexploitation Using Space-Borne Radar Interferometry in Kabul, Afghanistan" Remote Sensing 12, no. 15: 2461. https://doi.org/10.3390/rs12152461
APA StyleMeldebekova, G., Yu, C., Li, Z., & Song, C. (2020). Quantifying Ground Subsidence Associated with Aquifer Overexploitation Using Space-Borne Radar Interferometry in Kabul, Afghanistan. Remote Sensing, 12(15), 2461. https://doi.org/10.3390/rs12152461