Article

Detecting and Assessing Nondominant Farmland Area with Long-Term MODIS Time Series Images

1
College of Resources and Environment Sciences, Northeast Agricultural University, Harbin 150030, China
2
Asia Hub, Nanjing Agricultural University, Nanjing 210095, China
3
International Institute for Earth System Sciences, Nanjing University, Nanjing 210023, China
4
Northeast Institute of Geography and Agroecology Chinese Academy of Sciences, Changchun 130102, China
*
Author to whom correspondence should be addressed.
Remote Sens. 2020, 12(15), 2441; https://doi.org/10.3390/rs12152441
Submission received: 6 June 2020 / Revised: 10 July 2020 / Accepted: 13 July 2020 / Published: 30 July 2020
(This article belongs to the Section Remote Sensing in Agriculture and Vegetation)

Abstract

:
While most land use and land cover (LULC) studies have focused on modeling, change detection and driving forces at the class or categorical level, few have focused on the subclass level, especially regarding the quality change within a class such as farmland. The concept of nondominant farmland area (NAF) is proposed in this study to assess within class variability and quantify farmland areas where poor environmental conditions, unsuitable natural factors, natural disasters or unsustainable management practices lead to poor crop growth and thus low yield. A 17-year (2000–2016) time series of the Normalized Difference Vegetation Index (NDVI) was used to develop a NAF extraction model with abnormal features in the NDVI curves and subsequently applied to Heilongjiang province in China. The NAF model was analyzed and assessed from three aspects: agricultural disasters, soil types and medium- and low-yield fields, to determine dominant factors of the NAF patterns. The results suggested that: (1) the NAF model was able to extract a variety of NAF types with an overall accuracy of ~80%. The NAF area accumulated more than 8 years in 17 years is 6.20 thousand km2 in Heilongjiang Province, accounting for 3.75% of the total cultivated land area; (2) the NAF had significant spatial clustering characteristics and temporal variability. 53.24% of the NAF accumulated more than 8 years in 17 years is mainly concentrated in the west of Heilongjiang Province. The inter-annual NAF variability was related with meteorological variations, topography and soil properties; and (3) the spatial and temporal NAF patterns seem to reflect a cumulative impact of meteorological disasters, poor farmland quality, and soil degradation on crop growth. The determinant factors of the observed NAF patterns differed across regions, and must be interpreted in the local context of topography, soil properties and meteorological environment. Spatial and temporal NAF variability could provide useful, diagnostic information for precision farmland management.

Graphical Abstract

1. Introduction

The world’s population has reached 7.7 billion (United Nations [1]), and there is a substantial demand for food but there is a limited amount of reclaimable farmland. Therefore, increasing the yields of middle- and low-yield farmland is probably the most feasible means to grow more food to meet the increasing demand. Low-yield farmland is defined as lands with a lower or much lower productivity than its potential under the current natural and socioeconomic conditions [2]. Middle- and low-yield farmland areas are generally extracted using an evaluation index system of farmland quality [3,4]. However, these evaluation index systems take little into account of crop growth dynamics and, therefore, higher farmland ranks do not always translate into high yields, due to the suitability of crop varieties and other factors.
In this paper, the concept of nondominant farmland area (NAF) is proposed, referring to areas with poor environmental conditions, uncoordinated crop environmental factors and disaster-prone farmland leading to poor crop growth and thus a low yield. There are a variety of factors that form the NAF, such as meteorological disasters [5,6], poor farmland quality [7], low-yield fields [2], and soil degradation [8,9]. The extraction of the NAF is conducive to the evaluation of farmland quality, macroscopic management, targeted improvements and farmland protection, which could provide scientific guidance for crop planting structure adjustments, disaster monitoring, agricultural production management and macro decision making.
There have been numerous studies on the various types of NAF. Cheng et al. [10] evaluated the planting area of double-cropping rice by remote sensing data and evaluated the risk of chilling injury in Hunan Province based on 1951–2010 meteorological data, thus establishing the risk assessment method of chilling injury in double-cropping rice. Liu et al. [11] used 1961–2007 agricultural statistics to quantitatively assess regional agrometeorological disasters. Yang et al. [12] assessed land quality by classifying land quality through indicators such as air quality, irrigation water quality and agricultural product safety. Yan et al. [2] used Moderate Resolution Imaging Spectroradiometer (MODIS) remote sensing data and light use efficiency (LUE) combined with high-resolution farmland distribution data and farming system zoning information to estimate farmland productivity, dividing the types of fields into high-, middle- and low-yield fields. Rayegani et al. [13] used remote sensing time series data to obtain remote sensing indices (such as an iron oxide index and a ferrous mineral index) to evaluate soil conditions and improve the accuracy of soil environmental assessment models. Nezomba et al. [14] proposed a soil degradation assessment scheme using the relationship between weed species and soil properties. Zhao et al. [4] constructed a comprehensive evaluation index system of farmland quality based on four aspects: soil physical and chemical properties, agricultural production conditions, location conditions and the soil environment. Most of the food disasters caused by agricultural disasters or sudden extreme weather events were analyzed by statistical data [15,16,17,18]. Middle- and low-yield fields have mainly been divided by productivity level, average yield, and potential yield (ratio of actual production capacity to maximum production potential), which is a laborious and time-consuming process and difficult for the near real-time monitoring and evaluation of cropland quality on a large scale. The potential productivity method requires an estimation of the maximum potential productivity of cropland and involves complex computational processes [2]. Soil degradation assessments should be based on the soil natural environment, chemical and physical properties and other categories to determine more than a dozen indicators to build a soil degradation evaluation index system [19,20].
Agricultural disasters, farmland quality, middle- and low-yield fields, and soil degradation involve agriculture, engineering, hydrology, soil science, economics, ecology and many other subjects. In these above studies, soil science has been used to analyze soil properties and crop growth [21]. Meteorology is needed for analyzing the meteorological disasters caused by extreme weather events [22,23]. Agronomy is used to analyze crop growth status by assessing canopy structure, biomass and the leaf area index [24]. The single-method extraction of a certain NAF has its own limitations, but multidisciplinary synthesis requires complex models, and the simplification process of each factor will affect model accuracy.
The NAF is not only restricted by the combination of factors, such as light, heat, water and soil, but also affected by the input of materials and the promotion of agricultural technologies [25,26]. Therefore, it is not comprehensive to regard only one aspect of the NAF. However, remote sensing technology offers unique advantages for monitoring crop growth dynamics. Regardless of the comprehensive effect of the limiting factors that form the NAF, the characteristics will emerge from a certain growth period or the whole growing period regarding the growth, canopy structure, biomass, and leaf area index that differ from those of normal crops. These differences could be extracted by remote sensing monitoring, and the extraction range can be analyzed to identify the limiting factors of the NAF.
Hence, the overarching goal of this study was to build a NAF model based on remotely sensed imagery to better understand the spatial and temporal dynamics of farmlands. The constructed NAF model was then validated to assess its accuracy from three aspects: agricultural disasters, soil types and medium- and low-yield fields. The model was applied in a case study in Heilongjiang Province, China, to determine the driving factors by observing the NAF patterns in the region.

2. Material and Methods

2.1. Study Area

Heilongjiang Province (Figure 1), located in the northeastern China, is an important grain-producing area and commodity grain base in China. Heilongjiang Province has a total area of 42.66 million hectares, accounting for 4.7% of the total national land area, and 3378.74 million hectares of agricultural land, accounting for 83.5% of the total land area of the province.
In 2016, the sown area and crop yield of Heilongjiang Province accounted for 10.44% and 9.8% of the total in China, respectively. Songnen Plain within the province is formed by the alluviation of the Songhua River and Nenjiang in the western portion of Heilongjiang Province, and the midwestern portion of Songnen Plain belongs to the aeolian sandy soil zone. The region has experienced many years of drought. The northeastern portion of Heilongjiang Province is Sanjiang Plain, which is surrounded by mountains on three sides. Xiao Hinggan Ling branch of the Green Montenegro is to the west, the Wandashan branch vein of the Fen Shui Gang is to the south and the Nadanhada Ridge of the Wandashan main vein reaches to the east. Heilongjiang Province has a temperate continental monsoon climate, four distinct seasons, a short summer, a long winter, and a large seasonal temperature difference. The annual average temperature is between −5 and 5 °C, the annual average precipitation is 400–600 mm, and the crop growth period is typically within the range of 122–274 days. The main crops grown in Heilongjiang Province are corn, soybean, rice, potato, wheat and sugar beet.

2.2. Data Acquisition

The remote sensing data used in this study are 250 m MODIS 8-day synthetic data (MOD09Q1 and MYD09Q1) from 2000 to 2016 and 250 m MODIS 16-day synthetic data (MOD13Q1). (Four MODIS 8-day data images that were of poor quality were replaced by the 16-day data.) There were two phases per year (day of year [DOY] 185 and 193) for a total of 34 phases of remote sensing images (see http://reverb.echo.nasa.gov/reverb). The Net Primary Productivity (NPP) and spatial distribution of the soil texture in China were obtained from 2000 to 2010. These datum set was provided by Data Center for Resources and Environmental Sciences, Chinese Academy of Sciences (RESDC) (http://www.resdc.cn). Global 30-meter land cover data (see http://www.globallandcover.com) and digital elevation model (DEM) data at a 90-meter resolution were obtained for Heilongjiang Province (see http://www.gscloud.cn). The MODIS 8-day reflectance products and 16-day NDVI (Normalized Difference Vegetation Index) products were converted to projections using MODIS Reprojection Tool (MRT), and then MODIS 8-day reflectance products were computed in ArcGIS (geographic information system) toolbox to obtain the NDVI.
The meteorological data (temperature, precipitation) were obtained from 11 agrometeorological observation stations in Heilongjiang Province from 2000 to 2016, the meteorological data of agricultural meteorological disasters from 2000–2011, the crop growth development and the farmland soil moisture in Heilongjiang Province from 2000 to 2013 were obtained from the meteorological data center of China Meteorological Administration (see http://data.cma.cn/user/toLogin.html). The China meteorological spatial interpolation dataset for 20002015 were obtained from the Chinese Academy of Sciences, Resources and Environmental Science Data Center (see http://www.resdc.cn).
Agricultural insurance companies provided insurance data for 182,913, 180,208, 18,359, and 221,362 cropland patches from 2013–2016 through the digital imaging of high-resolution spatial images. The land survey confirmed that the accuracy of the land insurance data was higher than 93%, based on the data for 24 crop types. A total of 216 and 779 disaster points were obtained in 2015 and 2016, respectively (Figure A1a). In 2017, 58 aeolian sandy soil samples were collected [27].

2.3. Determination of the Critical Period for the Remote Sensing Images

The agricultural meteorological datasets of Heilongjiang Province contain 30 coerced sites from 2000 to 2011 (Table A1). The results showed that 87.8% of the crops were stressed before 19th July (DOY 201) in 10 typical counties distributed throughout the province.
Climatic differences lead to different crop growing determinations in Heilongjiang Province. There are differences when sowing in the morning and evening and between early- and late-maturing varieties, and phenology zoning could be responsible for this difference [28]. The main crop phenology (Table 1) shows that the late-sowing crop was in the early growth stage on DOY 177, and the early maturing variety was mature on DOY 201. Therefore, the accuracy of crop growth will be limited by monitoring the status of crop growth before DOY 185 or after DOY 201. At the same time, the disasters mainly occurred in the early period, and early monitoring could better characterize the farmland quality. Therefore, it is reasonable to use the remote sensing data of DOY 185 and 193 to monitor the crop growth.

2.4. Phenology Zoning of Farmland

Crop phenology refers to the regular growth and change in crops in a certain environment and shows the temporal variation in crop growth during the year. Crops changes in the timing of leaf out, leaf senescence, and flowering according to environmental cues [29,30], significantly impact ecosystem structure and function [31]. The phenological characteristics of the crops in different regions are diverse, and the crop growth is discrepant [32].
The geography and climatic conditions in the study area are quite different. It is difficult to accurately determine the NAF through unified monitoring of the entire study area; therefore, it was necessary to divide the study area into several regions with a uniform phenology. According to the variations in the time series NDVI curves, the phenology of the relatively homogeneous region of Heilongjiang Province was extracted using the phenological parameters by nearest neighbor classification method [33].

2.5. NAF Extraction Modeling

NAF refers to an area with poor environmental conditions, unsuitable crop environmental factors, a low yield, disaster-prone farmland or land that is not suitable for crop growth. NAF not only refers to the quality of farmland problems but also incorporates climate suitability issues, including vulnerability to meteorological disasters, poor farmland quality, low-yield fields, soil degradation and other zones. NAF formation is mainly affected by meteorology, soil, topography, crop variety selection, tillage methods and management measures.
The NAF was extracted using the vegetation index spatial statistical analysis method. Many researchers have used the anomaly index to monitor crop growth and disasters. This method extracts poor growth regions by comparing the same pixel in different years. If a region has experienced poor growth for several years, it is difficult to extract the NAF. NDVI is the most widely used index for crop growth monitoring [34]. According to the zoning results of the farmland phenology in Heilongjiang Province, the NDVI of each phenological region was statistically analyzed, and the NAF was extracted by the NDVI mean value and standard deviation. Figure 2 is a flowchart in this study.
NDVI values in the phenological region are normally distributed (Figure A2), and the average NDVI value in the phenological region is calculated. The ratio of NDVI value to NDVI mean value in any pixel is calculated, and the standard deviation is graded on the comparison value. The pixel of the ratio less than the mean value minus the standard deviation belong to the NAF:
G = N D V I N D V I M
where G is the crop growth index and N D V I M is the average NDVI in each phenological region.
The GMIN values of normal growth regions (NGR) in each phenological region (Equation (2)) were higher than the threshold of NAF, indicating that monitoring the NAF using DOY 185 and 193 data could better exclude the monitoring differences caused by the different crops:
G M I N = G M E A N G S T D
where G M I N is the threshold of the NAF, which is less than the minimum value of the normal growth crop of G in the phenology region, G M E A N is the average G of this phenological region, and G S T D is the G standard deviation of this phenological region.

2.6. Vector Angle Method

The vector angle method was also applied to an n-dimensional vector. Assuming that A and B are two n-dimensional vectors, A is [ A 1 , A 2 , …, A n ] and B is [ B 1 , B 2 , …, B n ], the cosine of angle θ between A and B is equal to the following expression:
cos θ = i = 1 n ( A i × B i ) i = 1 n ( A i ) 2 × i = 1 n ( B i ) 2  
where A i is the interannual variation in the NAF area in a county, B i is the interannual variation in the NAF area in another county, i = 1 is the year 2000, and n is the cumulative year of the study.
When the cosine of the angle between the two curves is equal to 1, the two curves are completely coincident. When the cosine of the angle is close to 1, the two curves are similar and can be classified into one class. The smaller the angle cosine is, the more irrelevant the two curves are. This paper assumes that the interannual variation in the NAF area of a county is a vector (such as Nehe 2000–2001, 2001–2002, etc. for the Nehe county vector). The vector angle method was used to classify the region with the NAF change trend in 80 counties of Heilongjiang Province from 2000–2016.

2.7. Correlation Analysis

Crop growth is closely related to weather conditions factors such as temperature and precipitation that affect all crop stages from planting to harvest [35]. The average temperature and precipitation in the main growing period of each year (early April to early July) were compared with the NAF area in the typical counties in Heilongjiang Province, and their correlation was obtained.
NPP represents the accumulated organic matter of plants per unit area and time and is the total primary production minus the remaining organic or energy of plant respiration. Therefore, NPP can represent crop growth and verify the extraction accuracy of the NAF. The correlation between the NAF and NPP was used to verify the extraction accuracy of the NAF. According to the definitions of NAF and NPP, if the NAF is large, then the NPP value should be small. Therefore, Corn belt of Songnen Plain was obtained according to the planting structure of Heilongjiang Province extracted by Liu et al. [33].

2.8. Accuracy Assessment

Based on the field-based field disaster acquisition, the agricultural insurance companies provided 216, 779 disaster samples in 2015 and 2016, and the overall NAF accuracy was verified. Yan et al. [2] extracted a 5.61 ten thousand km2 low-yield field in Heilongjiang using the NPP of farmland from 2000 to 2008. The NAF area was extracted in this paper and compared with that of Yan et al. Fifty-eight aeolian sandy soil samples collected in the field in 2016 were used to verify the NAF caused by soil-limiting factors:
P = P C N
where P is the overall accuracy, P C is the number of correct categories and N is the total number of sample points.

3. Results

3.1. Model Validation
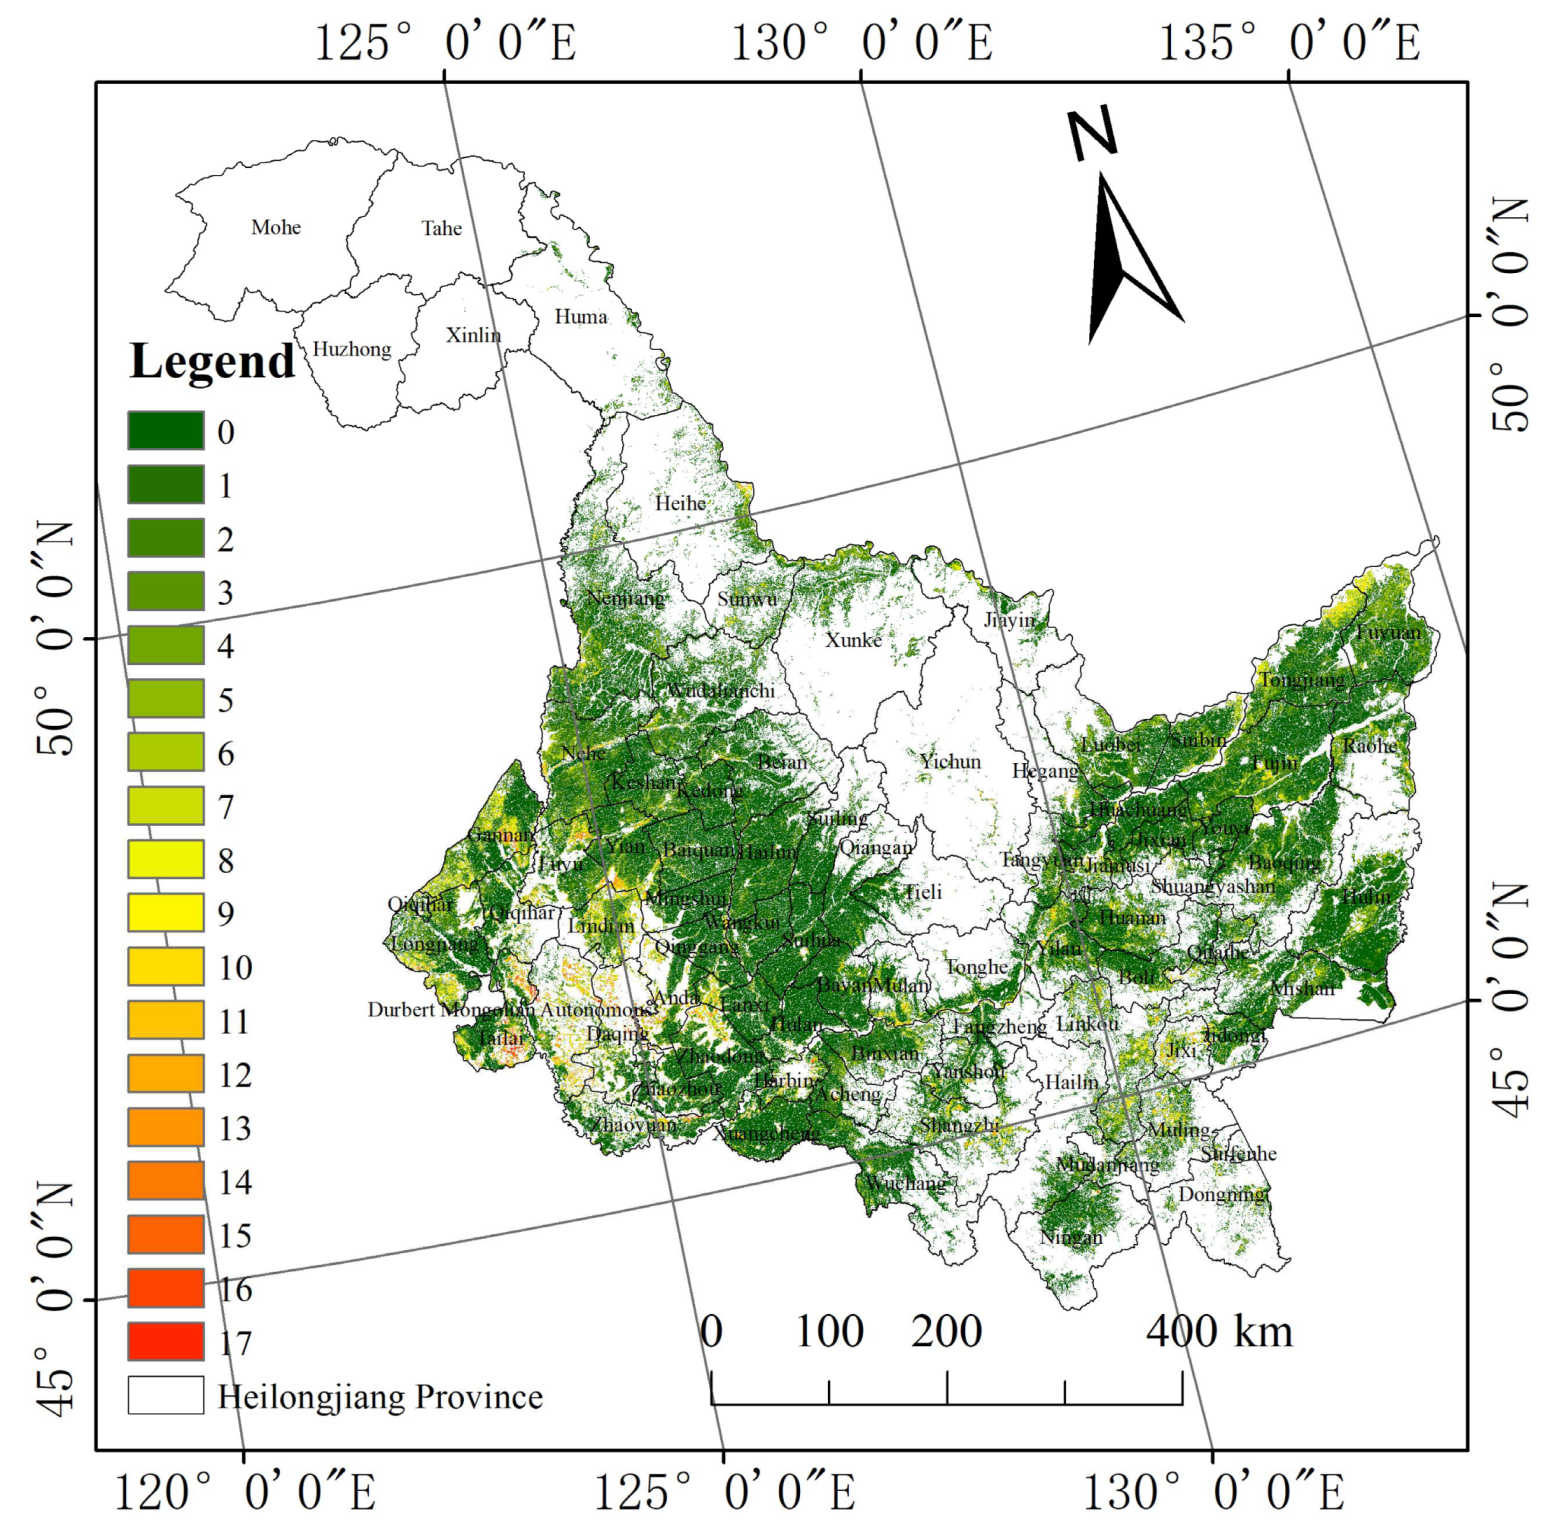
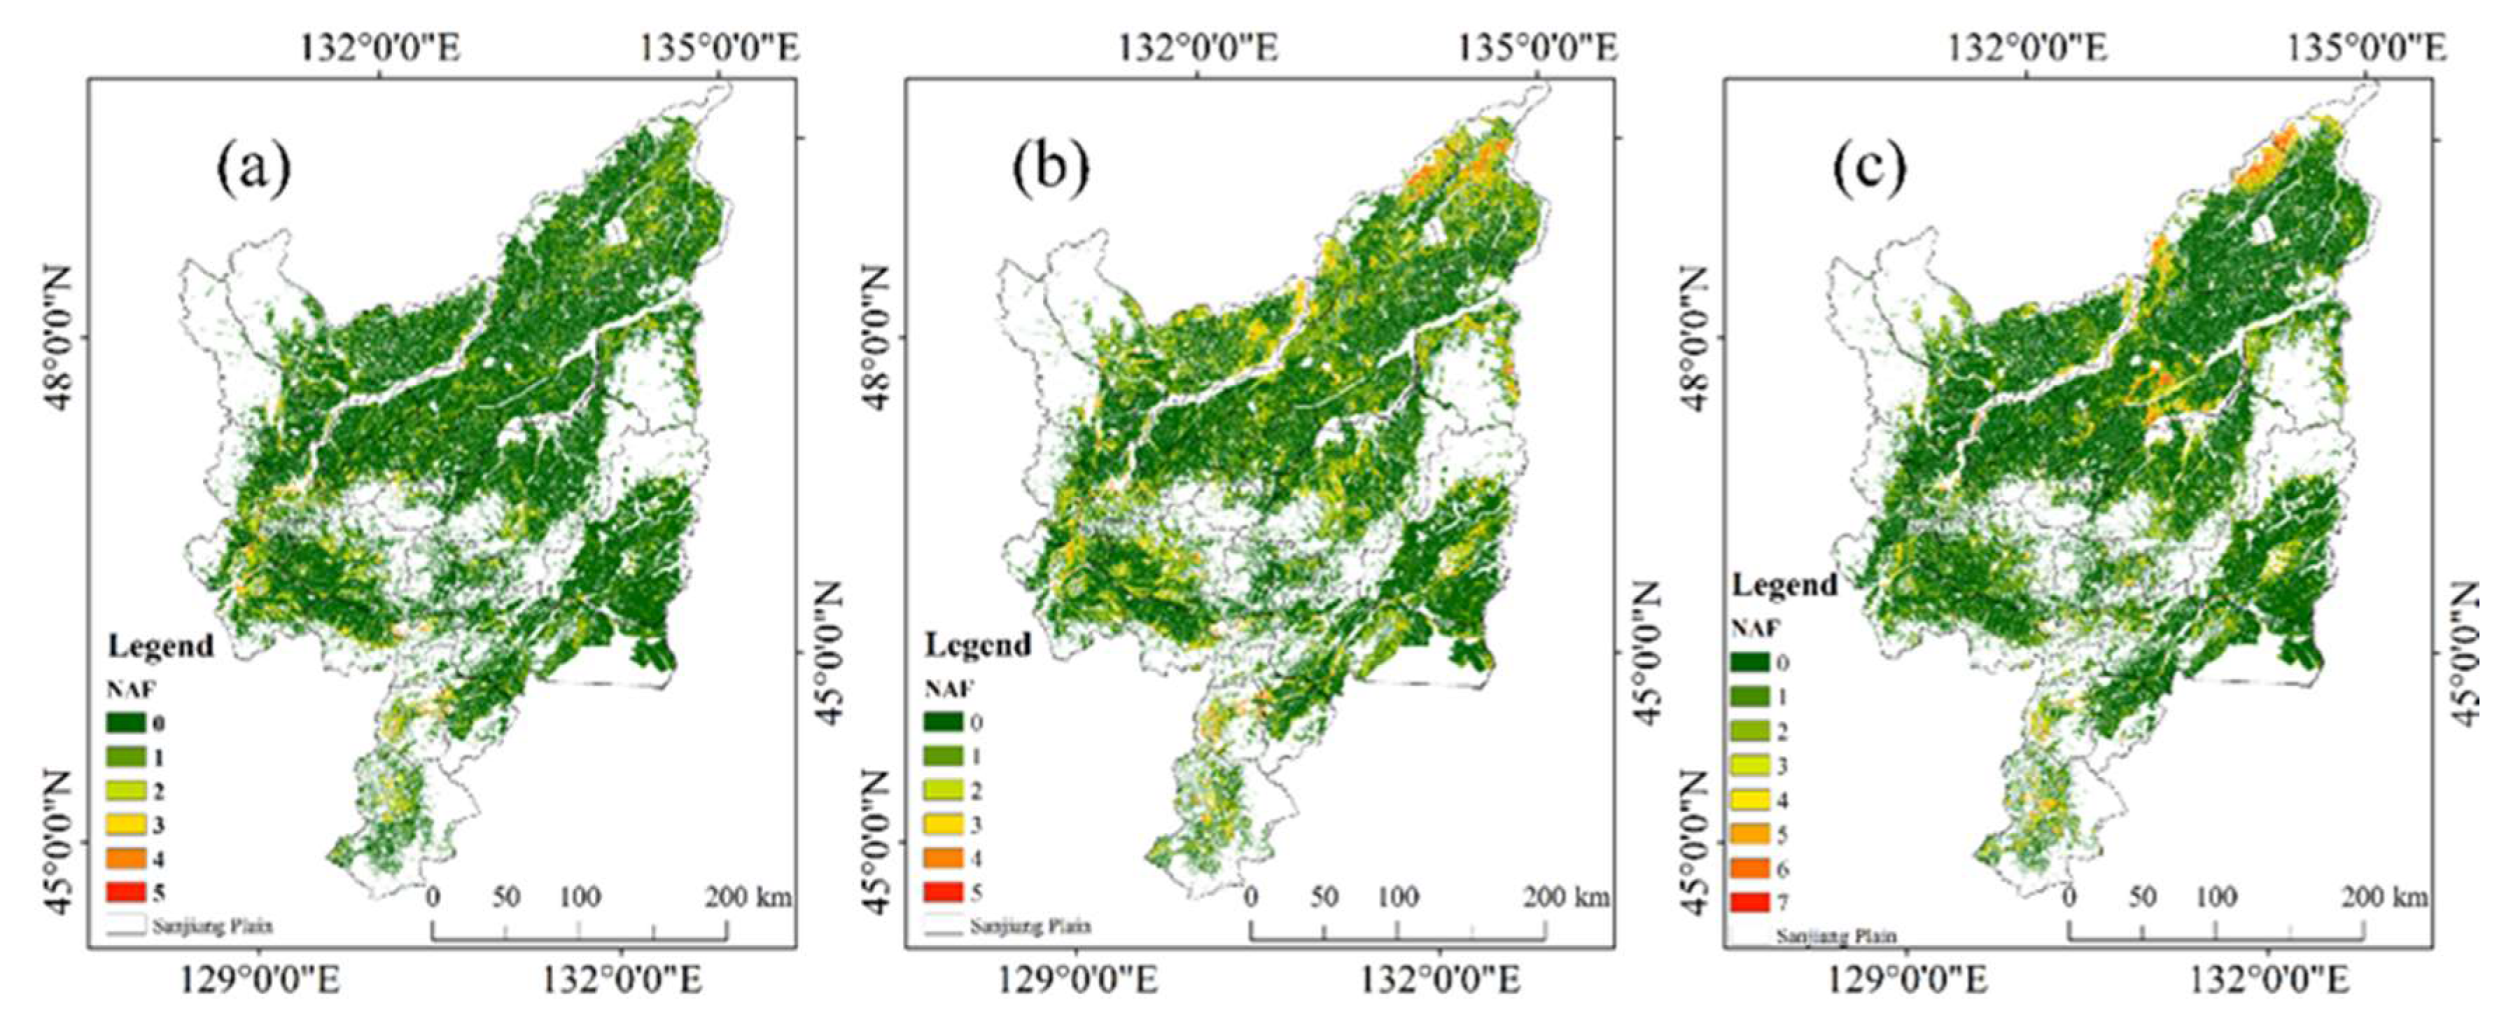
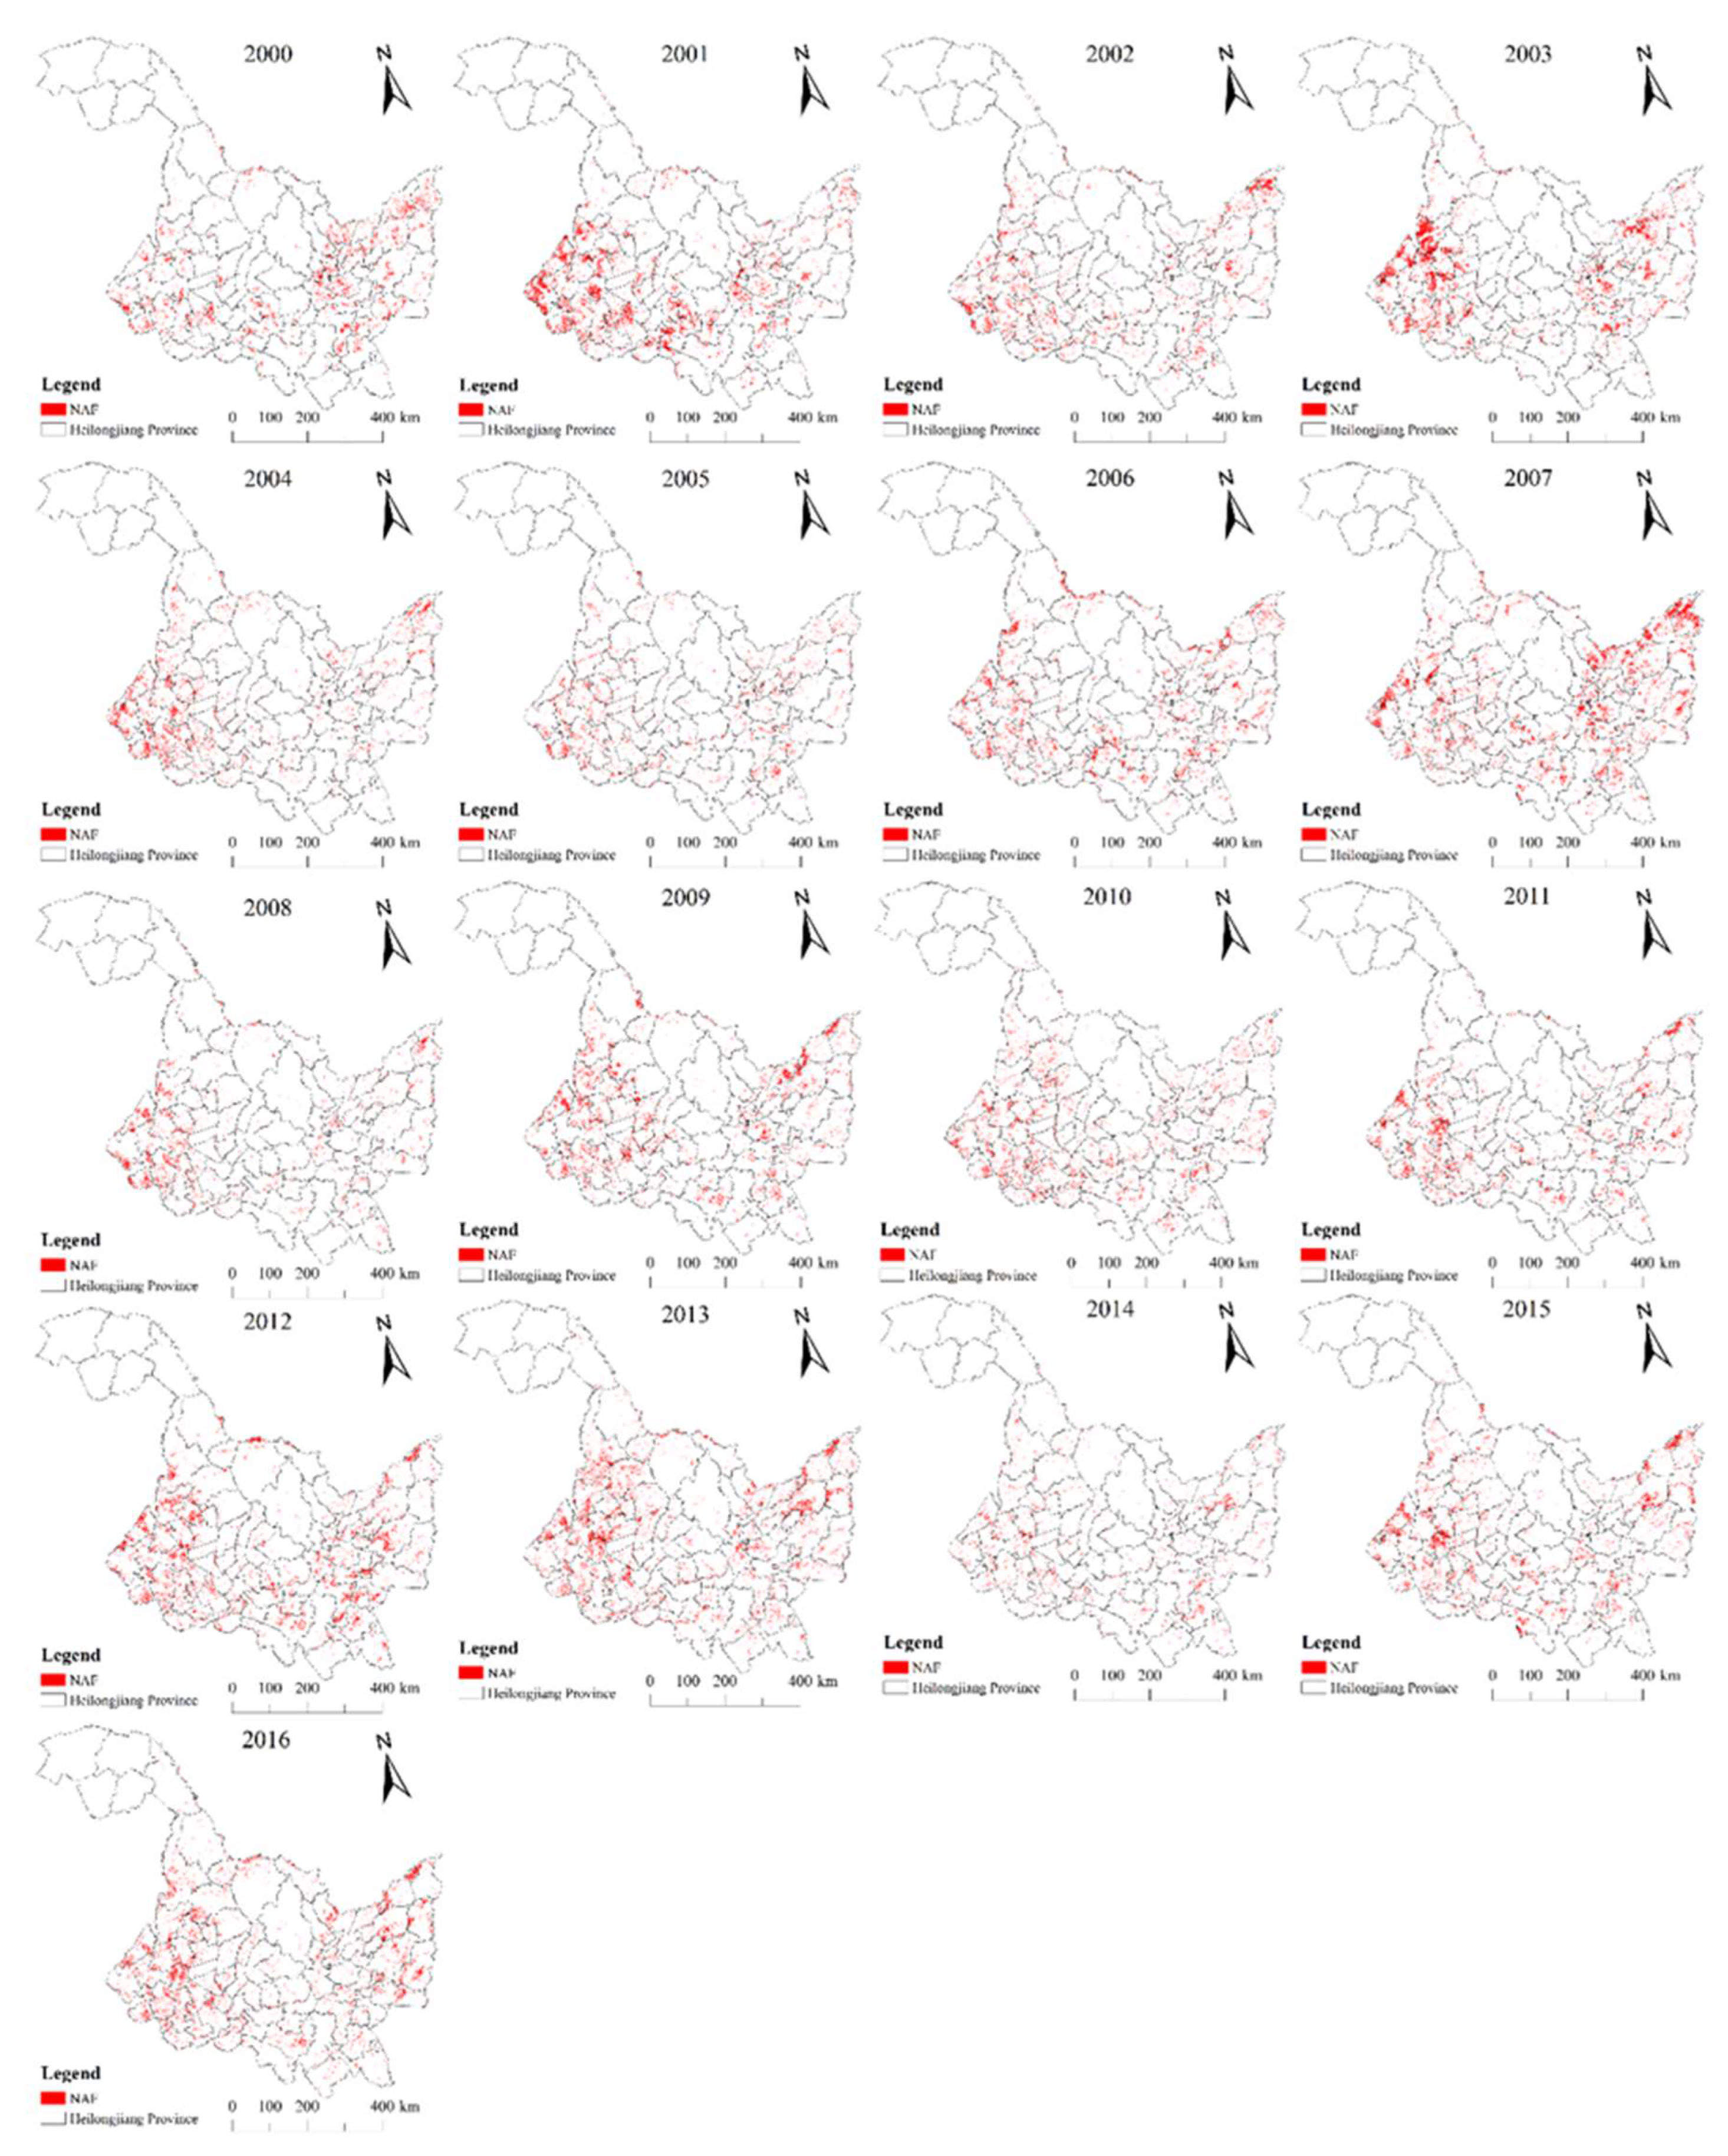
To validate the accuracy of the threshold, the sample points of three crops (soybean, corn and rice) on three typical farms (Keshan, Yaluhe and Hailin farm) were collected in 2016, which were 56, 209 and 42, respectively. The average and standard deviation of G on DOY 185 and 193 NGR of the three crops were counted to calculated GMIN (Equation (2)). The GMIN values of DOY 185 and 193 of the 3 farms located in different phenological regions are 0.648, 0.773, 0.728, 0.791, 0.694 and 0.752 calculated by Equation. (2), which is the threshold of model in 2016 (Figure 3).
Figure 3 clearly shows the GMIN values are lower than the minimum G of NGR, indicating the model can extract NAF well. The NAF range in Heilongjiang Province from 2000–2016 (Figure A3) was obtained by constructing a grading model of the vegetation index ratio.

3.2. NAF Patterns

Figure 4 is spatial distribution of NAF in Heilongjiang Province from 2000 to 2016. The NAF area accumulated more than 8 years in 17 years is 6.20 thousand km2 in Heilongjiang Province, accounting for 3.75% of the total cultivated land area. The NAF area from 2000 to 2008 extracted in this study was 5.55 ten thousand km2 in Heilongjiang Province, which is almost consistent with 5.61 ten thousand km2 low-yield field extracted by Yan et al. [2]. In addition, according to the NPP threshold of low-yielding fields set by Yan et al., 2.59 ten thousand km2 of low-yielding fields were extracted by using 2009 and 2010 NPP data, which is roughly consistent with the 2.41 ten thousand km2 NAF extracted in this paper. The correlation coefficient between the NAF area of the corn belt on Songnen Plain and the NPP was −0.57. At the same time, the overall accuracy of the disaster verification points in 2015 and 2016 were respectively 82.87% and 79.33% and that of aeolian sandy soil was 91.38%. The above results demonstrated that the NAF model can extract low-yielding fields commendably.
The spatial distribution of the NAF in Heilongjiang Province was showed according to the NAF accounting for the proportion of cultivated land from 2000–2016 (Figure 5). The NAF proportions on the southwest of Songnen Plain, including Durbert, Lindian, Daqing, Tailai, Anda, Gannan and Fuyu county, were more than 15%. 53.24% of the NAF accumulated more than 8 years in 17 years is mainly concentrated in the west of Heilongjiang Province, due to mainly located in the aeolian sandy soil region that have a poor resistance to drought and flooding. However, the NAF proportions in the southwest of Songnen Plain, including Suihua, Qing’an, Hulan, Mingshui Suileng and Wangkui county, were less than 3%, because of being mainly located in the black soil region with good-quality farmland. Moreover, the NAF proportions of Sanjiang Plain was lower overall except Jixi county being located among mountains and prone to floods during the rainy season (Figure A4).
Songnen Plain is one of the two major grain production bases in Heilongjiang Province. By superposing the NAF of similar years on Songnen Plain, we obtained three spatial distribution patterns of NAF (Figure 6). Pattern 1 was the cumulative result of 2000, 2002, 2005, 2006, 2008, 2011 and 2014 (Figure 6a), which was mainly distributed in the southwestern of Songnen Plain, including Gannan, Longjiang, Fuyu, Tailai, Lindian, Durbert, Daqing, Zhaodong, Lanxi, and Anda, Harbin, Mulan, and Binxian county. The average precipitation of pattern 1 was 502.95 mm (Figure A5a). Pattern 2 was the cumulative result of 2001, 2003, 2004, 2007, 2010 and 2015 (Figure 6b). Compared with pattern 1, the NAF expanded to the northwestern of Songnen Plain and some typical black soil areas such as Nehe, Keshan and Wudalianchi county. At the same time, the range of the NAF in the southwestern of Songnen Plain expanded as well. The average precipitation of pattern 2 was 356.65 mm (Figure A5b), which was the least precipitation. Pattern 3 was the cumulative result of 2009, 2012, 2013 and 2016 (Figure 6c). The average precipitation of pattern 3 was 577.83 mm (Figure A5c), which was more than other patterns. Although the precipitation ranges of Pattern 1 and Pattern 3 are roughly the same, the spatial distribution is significantly different. The precipitation of pattern 1 gradually decreases from southwest to northeast (Figure A5a), but the precipitation of pattern 3 gradually decreases from northwest to southeast (Figure A5c).
By superposing the NAF of a similar year on Sanjiang Plain (Figure 7), we obtained three spatial distribution patterns: Pattern 1 was the cumulative result of 2000, 2001, 2005, 2008 and 2010 (Figure 7a). The area was mainly distributed in the southwestern portion of Sanjiang Plain and had a small overall size. The crop grew well in pattern 1, which was formed when the weather conditions were superior, such as average precipitation was 532.78 mm (Figure A6a). Pattern 2 was the cumulative result of 2001, 2002, 2003, 2004, 2006 and 2007 (Figure 7b). In pattern 2, there was more precipitation in 2002, 2004 and 2006, with the average precipitation was 575.11 mm (Figure A6b), while the precipitation was lower in 2003 and 2007, with average precipitation was 525.33 mm (Figure A6c). Pattern 3 was the cumulative result of 2009, 2011, 2012, 2013, 2014, 2015 and 2016 (Figure 7c), which was mainly distributed in the southern and northeastern regions of Sanjiang Plain. The average precipitation of pattern 3 was 630.83 mm (Figure A5c), which was the most precipitation. It is worth mentioning that the northwestern of Sanjiang Plain became a flood-prone and drought-prone region due to the change from a large number of dry lands to paddy fields in Tongjiang and Fuyuan county after 2009 (Figure A6d), which was distributed in pattern 2 and 3.

3.3. NAF Classification

The vector angle method was used to classify the regions where the variation tendency in the NAF was consistent from 2000 to 2016 in 80 counties of Heilongjiang Province. when the cosine values between two counties are greater than 0.88, they belong to the same category. Therefore, 80 counties were divided into 11 categories (Figure 8), clearly demonstrating that almost all adjacent counties in the same category. For instance, the five counties of Qiqihar, Tailai, Durbert, Daqing and Anda on Songnen Plain were classified into the same category, and the three counties of Tongjiang, Fujin and Raohe on Sanjiang Plain were classified into the same category as well. Moreover, four categories were selected from 11 categories to map the interannual variation in the NAF in similar regions from 2000 to 2016 (Figure A7). The curve trends of Nehe, Gannan, Yi’an, Fuyu and Baiquan county were the most consistent, as seen in Figure A7a, and the curves in Figure A7b–d showed roughly the same trend.

3.4. NAF Pattern Formed Factors

According to our knowledge, we analyzed the formed factors of NAF patterns from soil properties and meteorological conditions. Figure 9a clearly showed the NAF of Songnen Plain distribution was mainly in the southwest. The NAF area accumulated more than 8 years in 17 years is 4.22 thousand km2 on Songnen Plain. Combining the field samples and the soil-sand distribution (Figure 9b), most of the soil types in the NAF of the southwestern Songnen Plain were saline-alkali soil, aeolian sandy soil and sandy soil, which are low organic matter and weak water holding capacity [27], leading to the long-term poor crop growth in these areas. At the same time, the NAF accounted for more than 10% of the total farmland area (Figure 5), indicating that the soil texture has a greater influence on the NAF in Duerbote, Daqing, Tailai, Gannan, and Longjiang county than the meteorological conditions.
In order to understand the effect of precipitation and temperature on NAF, the correlation coefficients between the NAF and the meteorological data of 9 typical counties from 2000 to 2016 shown in Table 2.
The NAF of three typical counties (Yilan, Baoqing and Fuyuan county) on the Sanjiang Plain was more related with precipitation, yet it was not significant correlation with temperature, demonstrating precipitation was the main factor of NAF formation. For example, the average precipitation of Yilan county was 194.1 mm during the main growing period from 2000 to 2016. The precipitation was lower in 2001 (73.7 mm) than that in 2002 (299.3 mm), but the NAF in 2001 was higher than that in 2002 (Figure 10a,b).
Compared with Sanjiang Plain, the NAF of three typical counties (Gannan, Longjiang and Lanxi county) on Songnen Plain was affected by different factors. For instance, the correlation between precipitation and temperature with NAF in Longjiang county was 0.57 and 0.5 (Table 2), respectively, however, that in Gannan and Lanxi county were −0.38 and 0.07, and −0.1 and 0.5 (Table 2), respectively.
The NAF were more related with temperature on northwest of Xiao Hinggan Ling. The correlation between NAF and temperature in Nenjiang and Heihe county was 0.38 and 0.24 (Table 2), respectively. Taking Nenjiang county as an example, the average temperature of Nenjiang county during the main growing period from 2000 to 2016 was 13.63 °C. The temperature was higher (14.32 °C) in 2002 than that in 2013 (12.95 °C), but the NAF in 2002 was lower than that in 2013 (Figure 11a,b).
Nevertheless, southeast of Xiao Hinggan Ling is unlike any other place in Heilongjiang Province. the correlation between precipitation and temperature with NAF in Ning’an county was −0.14 and −0.06 (Table 2), respectively, indicating the NAF of Ning’an county was neither affected by precipitation nor by temperature. As expected, the elevation of profile fluctuates greatly in Ning’an county (Figure A4b). Hence, topography was the main factor of NAF formation for southeast of Xiao Hinggan Ling.

4. Discussion

In this paper, remote sensing images according to the main periods of crop stress and the main period of crop phenology were selected to build an NDVI ratio model in the different phenology regions to evaluate the growing conditions of crops, effectively avoiding phenological differences. At the same time, The GMIN values of NGR in each phenological region were higher than the threshold of NAF, indicating that monitoring the NAF using the model could better exclude the monitoring differences caused by the different crops. Previous researchers have mainly used LUE, temperature, moisture and leaf phenology to build productivity models and then estimate NPP, which is a laborious and time-consuming process [36]. In this paper, a variety of unfavorable factors were considered synthetically, eliminating the influence of crop types, phenology and topography. This method provides a quantitative way to evaluate the internal variations in the same land use type and the spatial and temporal patterns of internal farmland quality.
The spatial distribution of NAF in Heilongjiang Province was mostly aggregated (Figure 5 and Figure 8), indicating that soil conditions, terrain and climatic factors play a decisive role in the spatial distribution. For example, these regions of classes 1, 3, and 7 were mainly caused by the soils, and the NAF proportions of them were 20–30%, 10–20%, 7–10% (Figure 5), respectively; the NAF caused by terrain included classes 8 and 9, and the NAF proportions of them were 0–20% and 5–10% respectively; classes 2, 10 and 11 were mainly caused by precipitation, and the NAF proportions of them account for 0–10%, 5–20%, 7–10%, respectively; both classes 5 and 6 were caused by temperature, and the NAF proportions of them were 0–7%. It is worth mentioning that the range of pattern 1 (Figure 6a) was the common part of the three patterns (Figure 6) due to the poor soil texture in the southwestern of Songnen Plain. Additionally, the typical regions of Heilongjiang Province were selected to analyze the reasons for the NAF formation. NAF in the southwestern of Songnen Plain is formed because of the soil texture, such as Lindian, Tailai, Gannan and Longjiang county (Figure 9). Therefore, we could adjust the planting structure according to the limiting factors and characteristics of the local region to carry out the planting and breeding structure by combining agriculture and animal husbandry. Moreover, temperature seriously impacts on crop growth in Nenjiang and Heihe county, however, the temperature is more suitable for soybean growth. Thus, the rotation between grain and bean should be implemented in eco-friendly farming systems in Nenjiang and Heihe. Unlike Songnen Plain, Sanjiang Plain, such as Baoqing, Fuyuan and Yilan county, is seriously affected by precipitation. However, the soil is more fertile and the precipitation is more adequate in this region. Hence, flood-resistant and drought-resistant crops can be planted in flood-prone and drought-prone regions. In addition, Ning’an county is surrounded by mountains on both sides, causing the topography seriously effects on crop growth. Therefore, this region could be changed to the cultivation of medicinal herbs.
Remote sensing technology has advantages to eliminate the effects of crop type, phenology and topography by directly monitoring phenology zoning of the crop growth [37,38]. According to the analysis of the influencing factors of the NAF in the typical counties (Section 3.4), the dominant factors in the different regions were discrepant for the large-scale NAF and the middle- and low-yield fields. Currently, the existing methods generally constructed index systems, and the weights of the different index systems were fixed. In fact, the contribution rate of the factors in the different regions differed. For example, the northwestern region was mainly affected by temperature, the southwestern region was mainly affected by precipitation, soil desertification, and the salinization degree, and the eastern region was affected by topography and precipitation. If the evaluation model is constructed according to a uniform weight, the result of the extraction will deviate from the actual result. Agricultural experts can analyze the formation causes (such as topography, soil and hydrology) [39,40,41] according to the different spatial positions of the NAF, to make targeted improvements and adjust the planting structure. NAF is not only affected by topography, soil, and meteorological and other environmental factors, but the adjustment of crop planting structure also leads to the changes of NAF pattern. The NAF pattern on Sanjiang Plain shown in Figure 7c was due to the large number of dry lands changed to paddy fields. It would be difficult to monitor this change by using the traditional evaluation index system considering only the role of environmental factors.
The crop planting structure could be adjusted and agricultural production management policy could be drafted by accurately extracting the spatial and temporal distribution of the NAF. The annual precipitation of Songnen Plain (Figure A5) showed the overall precipitation pattern, i.e., Figure A5c > Figure A5a > Figure A5b, on Songnen Plain. And thus, the range of pattern 2 was an arid area. Combined with Figure 6a–c, it was found that excessive or low precipitation on Songnen Plain could increase the NAF area. Therefore, we can predict the spatial and temporal distribution of NAF in this region according to the forecast of future precipitation by meteorological experts, which is helpful for early disaster warnings and provides a scientific basis for disaster prevention and mitigation and policy adjustment. China proposed the adjustment of the planting structure in the “Sickle Bay” region to reduce corn planting areas [42]. At present, the government adjusts the planting structure mainly based on statistical data, which are one-sided. The NAF extracted in this paper not only includes the nondominant area of corn but also the nondominant area of other crops, which can be used to pertinently adjust the crop planting structure.
The NAF extracted using lower spatial resolution of MODIS data limits the final extraction accuracy. For example, the mixed pixel problem of farmland and construction land in the central portion of Harbin was monitored as the NAF (Figure 5). Further research is needed to consider the fusion of different time and space resolution data to construct a high time and space resolution dataset to improve the accuracy. The model proposed in this study is suitable only for one crop a year, however, the multiple cropping region in one year needs to be classified for different phenological zoning, and then the nondominant area of different crops needs to be extracted.

5. Conclusions

In this paper, a 17-year (2000–2016) time series of NDVI was used as the basis of a NAF extraction model that was used to extract the NAF with abnormal time series NDVI curves. The model accuracy was validated from three aspects: agricultural disasters, soil types and medium- and low-yield fields. Then, the driving factors of the NAF spatial and temporal pattern were analyzed based on meteorological, soil and topographic data. The following conclusion were obtained:
(i) Extracting the NAF using time series remote sensing data had high accuracy, eliminated strong subjectivity in statistics and obtained a more accurate spatial and temporal NAF distribution. Based on the meteorological conditions, the NAF can be predicted ahead of time, which can result in early warnings and provide scientific guidance for the adjustment of planting structure, disaster monitoring, agricultural production management and macro decision making.
(ii) The NAF has significant spatial and temporal variations and regional clustering characteristics. The interannual variation trend in the NAF was consistent with similar topographic, soil and meteorological conditions. Based on the phenological division to monitor crop growth, the NAF extraction model eliminates the effects of crop type, phenology and topography.
(iii) The influence factors of NAF in different regions are discrepant. The reasons of NAF formation were not only topography, soil, meteorological factors and other environmental factors, but also the adjustment of crop planting structure, which leads to the NAF change patterns.

Author Contributions

All the authors contributed to this study. Conceptualization, S.Y. and H.L.; methodology, S.Y.; software, S.Y. and X.Z. (Xiaokang Zhang); writing, S.Y.; writing—review and editing, S.Y., X.Z. (Xiaokang Zhang), H.L., Y.S. and J.Q.; investigation, Y.S. and X.Z. (Xiaokang Zhang); data curation, Y.S.; funding Acquisition, J.Q., H.L. and X.Z. (Xinle Zhang) All authors have read and agreed to the published version of the manuscript.

Funding

This research is funded by the National Key Research and Development Program of China (2016YFD0200600 and 2016YFD0200603) and by the Asia Hub initiative at Nanjing Agricultural University.

Acknowledgments

We gratefully acknowledge the support from Sunlight Agricultural Mutual Insurance Company for their help in the field work. We further acknowledge our group members for their help.

Conflicts of Interest

The authors declare no conflict of interest.

Appendix A

Appendix A.1. Determination of the Critical Period for the Remote Sensing Images

Table A1. Main crop stress schedule in Heilongjiang Province.
CountyCropDisaster TypeTimeArea
(104 mu)
Percentage
(%)
HeiheWheatDrought6 June 2000Over 100
SoybeanDrought10 July 20007090–100
WheatDrought7 June 2001180–89
Other cropsHail16 July 20010.810–19
WheatWind disaster12 July 20020.30–9
SoybeanChilling injury8 June 20035.10–9
All cropsDrought12 June 20035.00–9
SoybeanFrost7 June 20043.10–9
WheatDrought21 June 20087.570–79
WheatDrought1 June 20101.040–49
KeshanOther cropsDrought11 June 2000Over 10080–89
Other cropsDrought3 June 2001Over 10070–79
Other cropsPest2 June 2002Over 10080–89
All cropsRainstorm28 June 200337.510–19
Rainstorm28 July 2003Over 10090–100
All cropsDrought22 June 2010Over 10090–100
LongjiangAll cropsDrought3 June 2003Over 10060–69
All cropsDrought11 June 2004Over 10090–100
All cropsDrought21 July 2007Over 10070–79
All cropsDrought24 May 2009Over 10080–89
HarbinOther cropsDrought7 June 200028.650–59
Other cropsHail4 July 20013.10–9
All cropsDrought21 May 200345.050–59
All cropsDrought21 May 200651.020–29
FujinWheatDrought14 June 200035.070–79
WheatDrought1 July 20004.080–89
FuyuanSoybeanDrought1 July 200060.060–69
BoliOther cropsDrought20 June 200076.670–79
Other cropsFlood17 July 200220.020–29
All cropsDrought28 May 200330.030–39
SoybeanPest21 August 200410.010–19
All cropsDrought13 July 200715.20–9
FangzhengRiceDrought1 June 200016.220–29
Other cropsHail2, 7 and 10 July 20021.10–9
All cropsHail17 July 20031.80–9
CornHail9 September 200445.00–9
NinganOther cropsDrought18 June 20000.850–59
HailunOther cropsDrought11 June 2001Over 10090–100
Other cropsOther disasters21, 22 and 26 June 2001Over 10040–49
Other cropsOther disasters1, 2 and 6 July 2001Over 10030–39
All cropsRainstorm28 August 2003Over 10070–79

Appendix A.2. Crop Sample Points

Heilongjiang Province is mainly divided into four parts: Songnen Plain, Sanjiang Plain, Xiao Hinggan Ling and Da Hinggan Ling (Figure 1b), but there is very little cultivated land on Da Hinggan Ling (Figure 1c). Hence, Sanjiang Plain, Songnen Plain and Xiaoxing’anling each selected a farm as a sampling area. Moreover, the main crops in Heilongjiang Province are corn, soybean and rice. In 2016, corn, soybean and rice grown occupy of the total account for 53.90%, 26.82% and 16.44%, respectively. Therefore, the sample points of corn, soybean and rice 209, 56 and 42, respectively. Figure A1a is the spatial distribution map with a total of 216 and 779 disaster points obtained in 2015 and 2016, respectively.
Figure A1. (a) Disaster points in 2015 and 2016, (b) Crop sample points on 3 typical farms.
Remotesensing 12 02441 g0a1
Figure A1b is the sample points of three crops (soybean, corn and rice) on 3 typical farms.

Appendix A.3. NDVI Histogram

NDVI values on DOY 185 in Keshan phenological region are normally distributed, indicating the crop growth index ( G ) is normally distributed.
Figure A2. NDVI histogram in a certain phenological region.
Remotesensing 12 02441 g0a2

Appendix A.4. NAF Range

The NAF range in Heilongjiang Province from 2000–2016 was obtained by constructing a grading model of the vegetation index ratio.
Figure A3. NAF from 2000 to 2016.
Remotesensing 12 02441 g0a3

Appendix A.5. The Elevation Map in Study Area

The elevations of Xiao Hinggan Ling and Da Hinggan Ling are higher than other regions. There is almost no farmland on Da Hinggan Ling. Figure A4b is the red line (Figure A4a) elevation of profile in the Southeast of Xiao Hinggan Ling. The elevation of profile fluctuates greatly on Jixi and Ning’an.
Figure A4. (a) Elevation map, (b) Profile map.
Remotesensing 12 02441 g0a4

Appendix A.6. Spatial Precipitation Map

The spatial precipitation data showed three patterns on Songnen Plain (Figure A5). The spatial precipitation data showed three patterns on Sanjiang Plain (Figure A6). Figure A6b and Figure A6c are precipitation of pattern 2 (Figure 7b).
Figure A5. Songnen Plain annual precipitation (a) pattern 1, (b) pattern 2, and (c) pattern 3.
Remotesensing 12 02441 g0a5
Figure A6. Sanjiang Plain annual precipitation, (a) pattern 1, (b) pattern 2, (c) pattern 2 and (d) pattern 3.
Remotesensing 12 02441 g0a6

Appendix A.7. NAF Interannual Variation Curve

The interannual NAF curves of four similar regions were plotted (Figure A7). The curve trends of Nehe, Gannan, Yi’an, Fuyu and Baiquan were the most consistent, as seen in A7a, and the curves in Figure A7b–d showed roughly the same trend.
Figure A7. Interannual variation in the similar NAF regions from 2000–2016. (a) is category 1 in Figure 8, (b) is category 7, (c) is category 5, and (d) is category 8).
Remotesensing 12 02441 g0a7

References

  1. Adetunjia, O.; Chigozirim, A.; Otunemec, N.; Omotoshod, O.J. Dawning of Progressive Web Applications (PWA): Edging Out the Pitfalls of Traditional Mobile Development. Am. Sci. Res. J. Eng. Technol. Sci. (ASRJETS) 2020, 68, 85–99. [Google Scholar]
  2. Yan, H.; Ji, Y.; Liu, J.; Liu, F.; Hu, Y.; Kuang, W. Potential promoted productivity and spatial patterns of medium- and low-yield cropland land in China. J. Geogr. Sci. 2016, 26, 259–271. [Google Scholar] [CrossRef] [Green Version]
  3. Xu, E.; Zhang, H. Spatially-explicit sensitivity analysis for land suitability evaluation. Appl. Geogr. 2013, 45, 1–9. [Google Scholar] [CrossRef]
  4. Zhao, X.; Ye, Y.; Zhou, J.; Liu, L.; Dai, W.; Wang, Q.; Hu, Y. Comprehensive evaluation of cultivated land quality and sensitivity analysis of index weight in hilly region of pearl river delta. Trans. Chin. Soc. Agric. Eng. 2017, 33, 226–235. [Google Scholar] [CrossRef]
  5. Lesk, C.; Rowhani, P.; Ramankutty, N. Influence of extreme weather disasters on global crop production. Nature 2016, 529, 84–87. [Google Scholar] [CrossRef]
  6. Wanda, D.K.; Stef, L.; Michael, H.; Laurent, T.; Pol, C.; Ben, S. Assessment of Regional Vegetation Response to Climate Anomalies: A Case Study for Australia Using GIMMS NDVI Time Series between 1982 and 2006. Remote Sens. 2017, 9, 34. [Google Scholar] [CrossRef] [Green Version]
  7. Zhou, R.; Wu, Y.; Hai, C.; Li, X.; Zhou, D. Comprehensive Evaluation of Cultivated Land Quality Based on GIS in Tumote Right Banner of Inner Mongolia Autonomous Region; Geo-Informatics in Resource Management and Sustainable Ecosystem; Springer: Berlin Heidelberg, Germany, 2013; Volume 399. [Google Scholar]
  8. Hu, B.; Yan, Z.; Liao, C. GIS-based risk evaluation of karst land degradation disaster: A case of Du’an Yao Autonomous County. J. Nat. Disasters 2006, 15, 100–106. [Google Scholar] [CrossRef]
  9. Žížala, D.; Zádorová, T.; Jiri, K. Assessment of Soil Degradation by Erosion Based on Analysis of Soil Properties Using Aerial Hyperspectral Images and Ancillary Data, Czech Republic. Remote Sens. 2017, 9, 28. [Google Scholar] [CrossRef] [Green Version]
  10. Cheng, Y.; Huang, J.; Han, Z.; Guo, J.; Zhao, Y.; Wang, X.; Guo, R. Cold Damage Risk Assessment of Double Cropping Rice in Hunan, China. J. Integr. Agric. 2013, 12, 352–363. [Google Scholar] [CrossRef]
  11. Liu, Y.; Liu, B.; Yang, X.; Bai, W.; Wang, J. Relationships between drought disasters and crop production during ENSO episodes across the North China Plain. Reg. Environ. Chang. 2015, 15, 1689–1701. [Google Scholar] [CrossRef]
  12. Yang, Z.; Yu, T.; Hou, Q.; Xia, X.; Feng, H.; Huang, C.; Wang, L.; Lv, Y.; Zhang, M. Geochemical evaluation of land quality in China and its applications. J. Geochem. Explor. 2014, 139, 122–135. [Google Scholar] [CrossRef]
  13. Rayegani, B.; Barati, S.; Sohrabi, T.A.; Sonboli, B. Remotely sensed data capacities to assess soil degradation. Egypt. J. Remote Sens. Space Sci. 2016, 19, 207–222. [Google Scholar] [CrossRef] [Green Version]
  14. Nezomba, H.; Mtambanengwe, F.; Tittonell, P.; Mapfumo, P. Practical assessment of soil degradation on smallholder farmers’ fields in Zimbabwe: Integrating local knowledge and scientific diagnostic indicators. Catena 2017, 156, 216–227. [Google Scholar] [CrossRef]
  15. Reidsma, P.; Ewert, F.; Lansink, A.O.; Leemans, R. Adaptation to climate change and climate variability in European agriculture: The importance of farm level responses. Eur. J. Agron. 2010, 32, 91–102. [Google Scholar] [CrossRef]
  16. Hou, X.; Han, Y. Herdsmen’s perceptions and adaptation of climate change in typical areas of Inner Mongolia. Geogr. Res. 2011, 30, 1753–1764. [Google Scholar] [CrossRef]
  17. Zhang, J.; Wang, J.; Li, R.; Chen, S. Agricultural Drought Adaptation Model of Farming-Pastoral Zone and Regional Sustainable Development——A Case Study of Xinghe County in Inner Mongolia. J. Catastrophology 2011, 26, 91–95+113. [Google Scholar]
  18. Jena, P.P.; Chatterjee, C.; Pradhan, G.; Mishra, A. Are recent frequent high floods in Mahanadi basin in eastern India due to increase in extreme rainfalls. J. Hydrol. 2014, 517, 847–862. [Google Scholar] [CrossRef]
  19. Vrieling, A.; Sterk, G.; Vigiak, O. Spatial evaluation of soil erosion risk in the West Usambara Mountains, Tanzania. Land Degrad. Dev. 2006, 17, 301–319. [Google Scholar] [CrossRef]
  20. Chang, C.; Zhao, G.; Li, J.; Wang, L.; Wang, Z. Remote sensing inversion of soil degradation in typical vulnerable ecological region of Yellow River Delta. Trans. Chin. Soc. Agric. Eng. 2015, 31, 127–132. [Google Scholar] [CrossRef]
  21. Lipiec, J.; Hatano, R. Quantification of compaction effects on soil physical properties and crop growth. Geoderma 2003, 116, 107–136. [Google Scholar] [CrossRef]
  22. Rahman, M.R.; Lateh, H. Meteorological drought in Bangladesh: Assessing, analysing and hazard mapping using SPI, GIS and monthly rainfall data. Environ. Earth Sci. 2016, 75, 1026. [Google Scholar] [CrossRef]
  23. Sung, J.H.; Chung, E.; Kim, Y.; Lee, B. Meteorological hazard assessment based on trends and abrupt changes in rainfall characteristics on the Korean peninsula. Theor. Appl. Climatol. 2015, 127, 1–22. [Google Scholar] [CrossRef]
  24. Kross, A.; McNairn, H.; Lapen, D.; Sunohara, M.; Champagne, C. Assessment of RapidEye vegetation indices for estimation of leaf area index and biomass in corn and soybean crops. Int. J. Appl. Earth Obs. Geoinf. 2015, 34, 235–248. [Google Scholar] [CrossRef] [Green Version]
  25. Yang, J.; Mao, X.; Wang, K.; Yang, W. The coupled impact of plastic film mulching and deficit irrigation on soil water/heat transfer and water use efficiency of spring wheat in Northwest China. Agric. Water Manag. 2018, 201, 232–245. [Google Scholar] [CrossRef]
  26. Sharpe, S.M.; Yu, J.; Boyd, N.S. Strawberry, black medic (Medicago lupulina), and Carolina geranium (Geranium carolinianum) growth under light-limiting conditions. Weed Technol. 2019, 33, 503–508. [Google Scholar] [CrossRef]
  27. Zhang, X.; Liu, H.; Zhang, X.; Yu, S.; Dou, X.; Xie, Y.; Wang, N. Allocate soil individuals to soil classes with topsoil spectral characteristics and decision trees. Geoderma 2018, 320, 12–22. [Google Scholar] [CrossRef]
  28. Meng, J.; Du, X.; Zhang, M.; You, X.; Wu, B. Integrating Crop Phenophase Information in Large-area Crop Condition Evaluation with Remote Sensing. Remote Sens. Technol. Appl. 2014, 29, 278–285. [Google Scholar]
  29. Richardson, A.D.; Bailey, A.S.; Denny, E.G.; Martin, C.W.; O’Keefe, J. Phenology of a northern hardwood forest canopy. Glob. Chang. Biol. 2006, 12, 1174–1188. [Google Scholar] [CrossRef] [Green Version]
  30. Vitasse, Y.; Francois, C.; Delpierre, N.; Dufrene, E.; Kremer, A.; Chuine, I.; Delzon, S. Assessing the effects of climate change on the phenology of European temperate trees. Agric. For. Meteorol. 2011, 151, 969–980. [Google Scholar] [CrossRef]
  31. Richardson, A.D.; Anderson, R.S.; Arain, M.A.; Barr, A.G.; Bohrer, G.; Chen, G.S.; Chen, J.; Ciais, P.; Davis, K.J.; Desai, A.R.; et al. Terrestrial biosphere models need better representation of vegetation phenology: Results from the North American Carbon Program Site Synthesis. Glob. Chang. Biol. 2012, 18, 566–584. [Google Scholar] [CrossRef] [Green Version]
  32. Gao, F.; Anderson, M.; Zhang, X.; Yang, Z.; Alfieri, J.; Kustas, W.; Mueller, R.; Johnson, D.; Prueger, J. Toward mapping crop progress at field scales through fusion of Landsat and MODIS imagery. Remote Sens. Environ. 2017, 188, 9–25. [Google Scholar] [CrossRef] [Green Version]
  33. Liu, H.; Yan, Y.; Zhang, X.; Qiu, Z.; Wang, N.; Yu, W. Remote sensing extraction of crop planting structure oriented to agricultural regionalization. Chin. J. Agric. Resour. Reg. Plan. 2017, 38, 43–54. [Google Scholar]
  34. Guindin-Garcia, N.; Gitelson, A.A.; Arkebauer, T.J.; Shanahan, J.; Weiss, A. An evaluation of MODIS 8-and 16-day composite products for monitoring maize green leaf area index. Agric. For. Meteorol. 2012, 161, 15–25. [Google Scholar] [CrossRef] [Green Version]
  35. Huang, Q.; Zhou, Q.; Wang, L.; Li, D. Relationship between Winter Wheat Growth Grades Obtained from Remote-sensing and Meteorological Factor. Trans. Chin. Soc. Agric. Mach. 2014, 45, 301–307. [Google Scholar] [CrossRef]
  36. Zhang, Y.; Qi, W.; Zhou, C.; Ding, M.; Liu, L.; Gao, J.; Bai, W.; Wang, Z.; Zheng, D. Spatial and temporal variability in the net primary production of alpine grassland on the Tibetan Plateau since 1982. J. Geogr. Sci. 2014, 24, 269–287. [Google Scholar] [CrossRef]
  37. Wardlow, B.D.; Egbert, S.L.; Kastens, J.H. Analysis of time-series MODIS 250 m vegetation index data for crop classification in the U.S. Central Great Plains. Remote Sens. Environ. 2006, 108, 290–310. [Google Scholar] [CrossRef] [Green Version]
  38. Cheng, T.; Yang, Z.; Inoue, Y.; Zhu, Y.; Cao, W. Preface: Recent Advances in Remote Sensing for Crop Growth Monitoring. Remote Sens. 2016, 8, 116. [Google Scholar] [CrossRef] [Green Version]
  39. Muñoz, J.D.; Steibel, J.P.; Snapp, S.; Kravchenko, A.N. Cover crop effect on corn growth and yield as influenced by topography. Agric. Ecosyst. Environ. 2014, 189, 229–239. [Google Scholar] [CrossRef]
  40. Zhao, H.; Zhou, R.; Drake, S. Effects of aeolian deposition on soil properties and crop growth in sandy soils of northern China. Geoderma 2007, 142, 342–348. [Google Scholar] [CrossRef]
  41. Zhao, Y.; Xiao, D.; Bai, H.; Tao, F. Research progress on the response and adaptation of crop phenology to climate change in China. Prog. Geogr. 2019, 38, 224–235. [Google Scholar]
  42. Chen, Y.; Zhang, P.; Liu, S.; Tan, J. The Spatio-temporal Pattern Change and Optimum Layout of Grain Production in the West of Northeast China. Sci. Geogr. Sin. 2016, 36, 1397–1407. [Google Scholar] [CrossRef]
Figure 1. Map of the study area, (a) Location map, (b) Zoning map, (c) Farmland distribution map.
Remotesensing 12 02441 g001
Figure 2. Flowchart of the overall procedure.
Remotesensing 12 02441 g002
Figure 3. Threshold (red numbers) and the G values of NGR of different crops in three typical farms in 2016. (a) Keshan farm, (b) Yaluhe farm, (c) Hailin farm.
Remotesensing 12 02441 g003
Figure 4. Spatial distribution of NAF in Heilongjiang Province from 2000 to 2016. “0–17” respectively represents the numbers of poor crop growth years.
Remotesensing 12 02441 g004
Figure 5. NAF accounts for the proportion of cultivated land of every county in Heilongjiang Province.
Remotesensing 12 02441 g005
Figure 6. NAF pattern on Songnen Plain (a) pattern 1, (b) pattern 2, and (c) pattern 3.
Remotesensing 12 02441 g006
Figure 7. NAF pattern on Sanjiang Plain (a) pattern 1, (b) pattern 2, and (c) pattern 3.
Remotesensing 12 02441 g007
Figure 8. Regional classification of the NAF change trend of the crops. The white area is not classified, and there is no county consistent with its interannual variation.
Remotesensing 12 02441 g008
Figure 9. (a) Spatial distribution maps of cumulative NAF over 8 years, (b) Spatial distribution of soil sandy content.
Remotesensing 12 02441 g009
Figure 10. (a) Distribution of NAF in Yilan in 2001, (b) Distribution of NAF in Yilan in 2002.
Remotesensing 12 02441 g010
Figure 11. (a) Distribution of NAF in Nenjiang in 2002, (b) Distribution of NAF in Nenjiang in 2013.
Remotesensing 12 02441 g011
Table 1. The main crop phenology of two areas in Heilongjiang Province. SW, SD, HD, MT, FL, PD, JT, TS, ML, TP and TL represent Sowing, Seedling, Heading, Mature, Flowering, Podding, Jointing, Tassel, Milk, Transplanting and Tillering, respectively.
Month 456789
Ten Days 123123123123123123
HumaWheat SWSD HD MT
Soybean SWSDFLPD MT
HailunCorn SWSD JTTSHDML MT
Potato SWSD FL MT
HulinRiceSW TP TL HD MT
Table 2. Correlation coefficients between NAF of typical sites and meteorological data. NW and SE respectively represent northwest and southeast of Xiao Hinggan Ling. P: Precipitation from April to early July; T: average temperature from April to early July; “*” and “**” represent a significant difference at the 0.05 level and that at the 0.01 level, respectively.
Sanjiang PlainSongnen PlainNWSE
YilanBaoqingFuyuanGannanLongjiangLanxiNenjiangHeiheNing’an
P−0.82 **−0.53 *−0.38−0.38−0.57 *−0.100.190.19−0.14
T0.430.300.060.070.55 *0.50 *−0.450.49 *−0.06

