Article

Water Storage Monitoring in the Aral Sea and its Endorheic Basin from Multisatellite Data and a Hydrological Model

1
State Key Laboratory of Geodesy and Earth’s Dynamics, Innovation Academy for Precision Measurement Science and Technology, Chinese Academy of Sciences, Wuhan 430077, China
2
College of Earth and Planetary Sciences, University of Chinese Academy of Sciences, Beijing 100049, China
3
Department of Environment Science and Tourism, Nanyang Normal University, Nanyang 473061, China
*
Author to whom correspondence should be addressed.
Remote Sens. 2020, 12(15), 2408; https://doi.org/10.3390/rs12152408
Submission received: 22 June 2020 / Revised: 22 July 2020 / Accepted: 24 July 2020 / Published: 27 July 2020
(This article belongs to the Section Remote Sensing in Geology, Geomorphology and Hydrology)

Abstract

:
Inland water storage change is a fundamental part of the hydrologic cycle, which reflects the impact of climate change and anthropogenic activities on water resources. In this study, we used multisatellite data (from satellite altimetry, remote sensing, and the Gravity Recovery and Climate Experiment (GRACE)) to investigate water storage changes in the Aral Sea and its endorheic basin. The water storage depletion rate in the Aral Sea from calibrated hypsometric curves (CHCs) created by satellite altimetry and image data agrees with the GRACE-derived result using the Slepian space domain inverse method (SSDIM). Compared with the combined filtering method (CFM) and mascon solutions, the SSDIM was shown to be an effective method of reducing the GRACE leakage error and restoring the signal attenuation in the Aral Sea. Moreover, we used the WaterGAP global hydrology model (WGHM) to qualitatively analyze the variations in the water storage components. The results show that the groundwater in the Aral Sea affects the change in the interannual water storage, especially during the extreme dry and humid periods. However, from the long-term water storage trend, the decrease in the surface storage dominates the shrinking of the Aral Sea. In addition, more details of the water storage change pattern in the endorheic basin were revealed by the enhanced GRACE solution. Our findings accentuate the severe water storage states of the Aral Sea endorheic basin under the impact of climate change and human interventions.

1. Introduction

Lake water storage change is a sensitive indicator of regional climate change and human activities. Over the past few decades, the Aral Sea in central Asia (in Figure 1), which was once the world’s fourth largest lake, has experienced a dramatic decrease in water storage due to agricultural expansion [1,2]. This evident atrophy has caused catastrophic environmental problems, such as soil salinization, raging dust/salt storms, degradation of biological communities, and even regional climate change [3]. In fact, the Aral Sea crisis is not only an environmental disaster caused by the evolution of a lake, but it is also significantly related to the allocation of water under natural and human forcing in an endorheic basin. The rapid increase in temperature accelerated the melting of glaciers and snow cover in the mountains upstream, reducing the amount of available water downstream and further increasing the water demand during the dry season [4]. In order to meet the growing agricultural demand for water, large irrigation systems and hydraulic construction projects have intercepted the inflow to the Aral Sea [5]. Numerous signs show that global warming and human interventions have exacerbated the temporal and spatial variability of the water storage in the region [6,7,8]. Monitoring changes in the water storage in the Aral Sea and its endorheic basin is essential to water resource management and climate change adaptation.
The implementation of the systematic hydrological observations of the Aral Sea was realized in 1911 [9]. Over the next 40 years or so, the Aral Sea was characterized by relatively stable hydrological changes [10]. Since the early 1960s, with the expansion of agricultural irrigation, the inflow supply of the Aral Sea has been strongly diverted into natural depressions in the desert, where it is lost to intense evaporation. Consequently, the water storage in the Aral Sea decreased at a rate of 27 km3/year from 1960 to 1990 [2]. At the end of the 1980s, the decreasing water level caused the Aral Sea to be divided into two parts: The North Aral Sea and the South Aral Sea (also called the Small Aral Sea and the Big Aral Sea) [11]. After the Soviet Union collapsed in 1991, continuous hydrological observations in the Aral Sea were interrupted [12].
Fortunately, it also marks the beginning of the era of using multisatellite sensors to monitor the shrinking of the Aral Sea. A first look at the Aral Sea water level derived from the TOPEX/POSEIDON (T/P) revealed that the water level of the North Aral Sea and the South Aral Sea exhibited different seasonal profiles after the loss of connection [13]. Since then, multisource altimetry satellites (e.g., the Geosat Follow-On (GFO); Jason families; ENVISAT; ice, cloud, and land elevation satellite (ICESat); and CryoSat-2) captured that the water level in the South Aral Sea dropped rapidly [14,15,16]. Meanwhile, the seasonal and interannual dramatic changes in the Aral Sea area were also revealed by satellite optical images [15,17]. From the water volume derived from the water level and surface area, after 2000, the South Aral Sea continued to shrink, while the North Aral Sea remained stable and even experienced a brief expansion [18,19,20]. In addition, the Gravity Recovery and Climate Experiment (GRACE) also detected large annual runoff emissions to the Aral Sea and the trend in water storage [15]. Therefore, it is feasible to use multisatellite data to trace the change in water storage in the Aral Sea. However, due to the inherent uncertainty in the different satellite data, past studies have usually qualitatively compared the Aral Sea water storage changes calculated by different satellite data [15,21]. In the absence of in situ data, it is difficult to ensure the retrieved water storage changes are reliable. The purpose of this paper was to integrate multisource satellite data to investigate the depletion of the Aral Sea and propose a mutual verification with careful processing.
The terrestrial water storage (TWS) variations in the endorheic basin are affected by the combination of climate change and anthropogenic activities [6]. This dual pressure is expected to exacerbate the heterogeneous patterns in water storage variations. From April 2002 to March 2016, the decrease rate of the TWS derived from GRACE data in the endorheic basin was −7.31 ± 1.68 Gt/year. The loss of surface water and soil water is the main portion of the decline in the TWS [22]. Within the basin, the water storage in the Aral Sea was significantly depleted by flow diversion and intense evaporation, while the middle reaches of the Amu Darya irrigation area experienced a significant increase in water storage, with increasing infiltration from GRACE [21]. In addition, further details of the water storage variations in local areas have not been investigated and explained. Previous studies have mainly focused on the overall trend in the TWS variations derived from GRACE data in the basin [22,23,24], which is insufficient for understanding the variability in the water storage under the impact of human interventions and climate change. Another purpose of this paper was to assess the spatio-temporal variation in the water storage with an enhanced GRACE data processing strategy and to determine possible causes for this pattern in the Aral Sea endorheic basin.
Our work focused on the water storage changes in the Aral Sea and its endorheic basin by integrating satellite observations and hydrological model outputs. The Landsat-8 Operational Land Imager and Thermal Infrared Sensor (OLI/TIRS) and the Landsat-7 Enhanced Thematic Mapper Plus (ETM+) images were used to detect the dynamic area of the Aral Sea. By combining the Envisat geophysical data record (GDR) product and the Cryosat-2 data from the Synthetic Aperture Radar Interferometric Mode (SARIn), we retrieved the robust time series of the Aral Sea water level from 2002 to 2018. Furthermore, the hypsometric curves of the four parts of the water body of the Aral Sea were established using the high-precision area and water level data to obtain the water volume change of the Aral Sea. To estimate the water storage changes of the Aral Sea and its endorheic basin from GRACE data, we employed the Slepian space domain inverse method (SSDIM) [25,26]. Compared with the results of the combined filtering method (CFM) [27,28] and the mascon solutions [29,30], the effectiveness (reduce the leakage and restore the attenuation of the GRACE signals) of the SSDIM at estimating the water storage change was verified. In addition, the WaterGAP global hydrology model (WGHM) was used to qualitatively study the effect of groundwater on the interannual water storage changes of the Aral Sea. Finally, we discussed the impact of climate change and human activities on the water storage changes in the endorheic basin.

2. Materials and Methods

2.1. Landsat-7 ETM+ and Landsat-8 OLI/TIRS

2.1.1. Landsat Image

Landsat-7 was launched in 1999. The (ETM+) scan line corrector(SLC) failed on 31 May 2003, which caused large gaps, with around 22% of the pixels missing from the collected data [31]. As the latest satellite in the Landsat series, Landsat-8 carries the OLI/TIRS to collect images using 9 shortwave spectral bands over a 190-km swath, with a 30-m spatial resolution for all of the bands except the 15-m panchromatic band. Actually, the ETM+ equally achieves the same resolution, and both sensors have a 16-day repeat coverage [32]. The high temporal and spatial resolution make it possible to obtain seasonal and annual lake area variations. For obtaining the shoreline and area of the Aral Sea during the study period, Landsat-7 and Landsat-8 images (from 2002 to 2018) were acquired from the United States Geological Survey EarthExplorer (https://earthexplorer.usgs.gov/).

2.1.2. Surface Water Mapping

Before proceeding further, the Landsat-7 images were retrieved using a local adaptive regression analysis model in the Environment for Visualizing Images (ENVI). Images fail in bad weather (clouds, dust storms, and aerosols). Instead, images from the near cycle were used. The average time interval did not exceed 16 days. In addition, it was necessary to preprocess the image before mapping the Aral Sea area. The preprocessing steps include radiometric calibration, atmospheric correction, mosaicking, co-registration, and resampling. Manual visual inspection was used to control the quality of the mapping.
In the study, the Aral Sea is divided into four parts (Figure 2): the Tchebas Bay (TB), the North Aral Sea (NAS), the West Aral Sea (WAS), and the East Aral Sea (EAS). The modified normalized difference water index (MNDWI) was used to conduct the Aral Sea surface area mapping [33]:
M N D W I = ( G r e e n M I R ) / ( G r e e n + M I R ) ,
where Green is the green-band value, which corresponds to OLI/TIRS band 3 and ETM+ band 2; and MIR is the middle infrared band value, which corresponds to OLI/TIRS band 6 and ETM+ band 5.

2.2. Envisat and CryoSat-2

2.2.1. Altimetry Data

Envisat was launched in March 2002 and ended service in March 2012. The radar altimeter (RA-2) onboard the Envisat is a dual-frequency altimeter: The Ku band has a frequency of 13.575 GHz and the S band has a frequency of 3.2 GHz. The former mainly realizes spatial ranging, and the latter is primarily used to correct for ionospheric noise [34]. To extract the water level of the Aral Sea, we used the Geophysical Data Record (GDR) V3.0 products (from May 2002 to April 2012) from the European Space Agency (ESA) (ftp://ra2-ftp-ds.eo.esa.int/).
Since it was a follow-up to CryoSat, the software and hardware of CryoSat-2 (CS-2) was updated and improved. It was launched by the ESA in April 2010. At present, CS-2 is still operating in three modes, including the Low Resolution Mode (LRM), the Synthetic Aperture Radar Mode (SAR), and the Synthetic Aperture Radar Interferometric Mode (SARIn). Its repeat cycle is 369 days with a 30-day sub-cycle, and the sampling resolution of the along-track SAR and SARIn modes reaches approximately 300 m [35]. Hence, the CS-2 provides more ground tracks in a smaller area rather than a single track across in a cycle while guaranteeing higher sampling along the track. In the study, the CS-2 level 1b baseline C data (from July 2010 to December 2018) were used to extract the Aral Sea water level (https://science-pds.cryosat.esa.int/).

2.2.2. Water Level Extraction

The water level was retrieved using the following equations:
H w l = H s R N ,
R = r + C s u m r r e t r a c k ,
C s u m = C d r y + C w e t + C i o n + C s o i l d + C p l o e ,
where H w l is the water level with respect to the EGM2008 geoid; H s is the satellite altitude with respect to the WGS84 ellipsoidal; N is the geoid height (EGM2008); R is the range measurement value after all of the corrections; r is the range measurement after the instrument corrections; r r e t r a c k is the waveform retracking correction; and C s u m is the sum of the path delay corrections, including the dry troposphere correction C d r y , the wet troposphere correction C w e t , the ionosphere correction C i o n , the solid earth tide correction C s o i l d , and the pole tide correction C p l o e .
The Envisat GDR product provides the range measurement using the Ocean, Ice1, Ice2, and Sea-Ice waveform retrackers [34]. Compared with the in situ data, the Ice1 algorithm products more reliably retrieve the inland water level than the other retrackers [36,37,38]. The best retracking product was chosen to estimate the Aral Sea water level variations from May 2002 to April 2012. During the study period, CS-2 operated in SARIn mode in the Aral Sea. The narrow primary peak threshold was used to retrack the SARIn waveforms [39].
Removing the outliers involved five steps: (1) Divide the water level results into multiple groups based on the satellite visit time. Valid water level observations were extracted using the water mask from the Landsat images; (2) combine all of the year groups to remove the outliers that exceed the empirical threshold; (3) calculate the mean absolute deviation (MAD) of each track’s observations, removing any outliers beyond 2 MAD; (4) delete any track with less than 6 water level observations on a single track; and (5) calculate the mean along-track values as the final mean water level. Intersatellite offsets should be considered when establishing a continuous time series combining multiple satellite data [40,41,42]. It is usually corrected using the in situ hydrological station data. However, the record from the hydrological stations is not usually available, especially in the Aral Sea. Other than this method, the repeat-track and crossover methods can reduce this bias [43]. However, the track of the CS-2 has a very long cycle (369 days). Its tracks do not repeat as that of Envisat does in a short cycle. Due to a lack of enough crossover points over the Aral Sea, the use of crossover analysis is also inadvisable. Therefore, we adopted a more feasible method for correcting the altimeters biases. Not only the mean annual water level from all of the available data was compared but the data during the overlapping period was also used to capture the deviation between the Envisat and CS-2 [44].

2.3. Calibrated Hypsometric Curves

The volume anomalies of the water body Δ V can be calculated from the integral with the water level:
Δ V = H 1 H 2 A d H ,
where A is an area function of the water level, namely the hypsometric curve function; and H 1 and H 2 are the water levels at the start and end time of a certain period, respectively. In general, the hypsometric function can be expressed by a low-order polynomial [45]:
A = i = 0 n C i H i ,
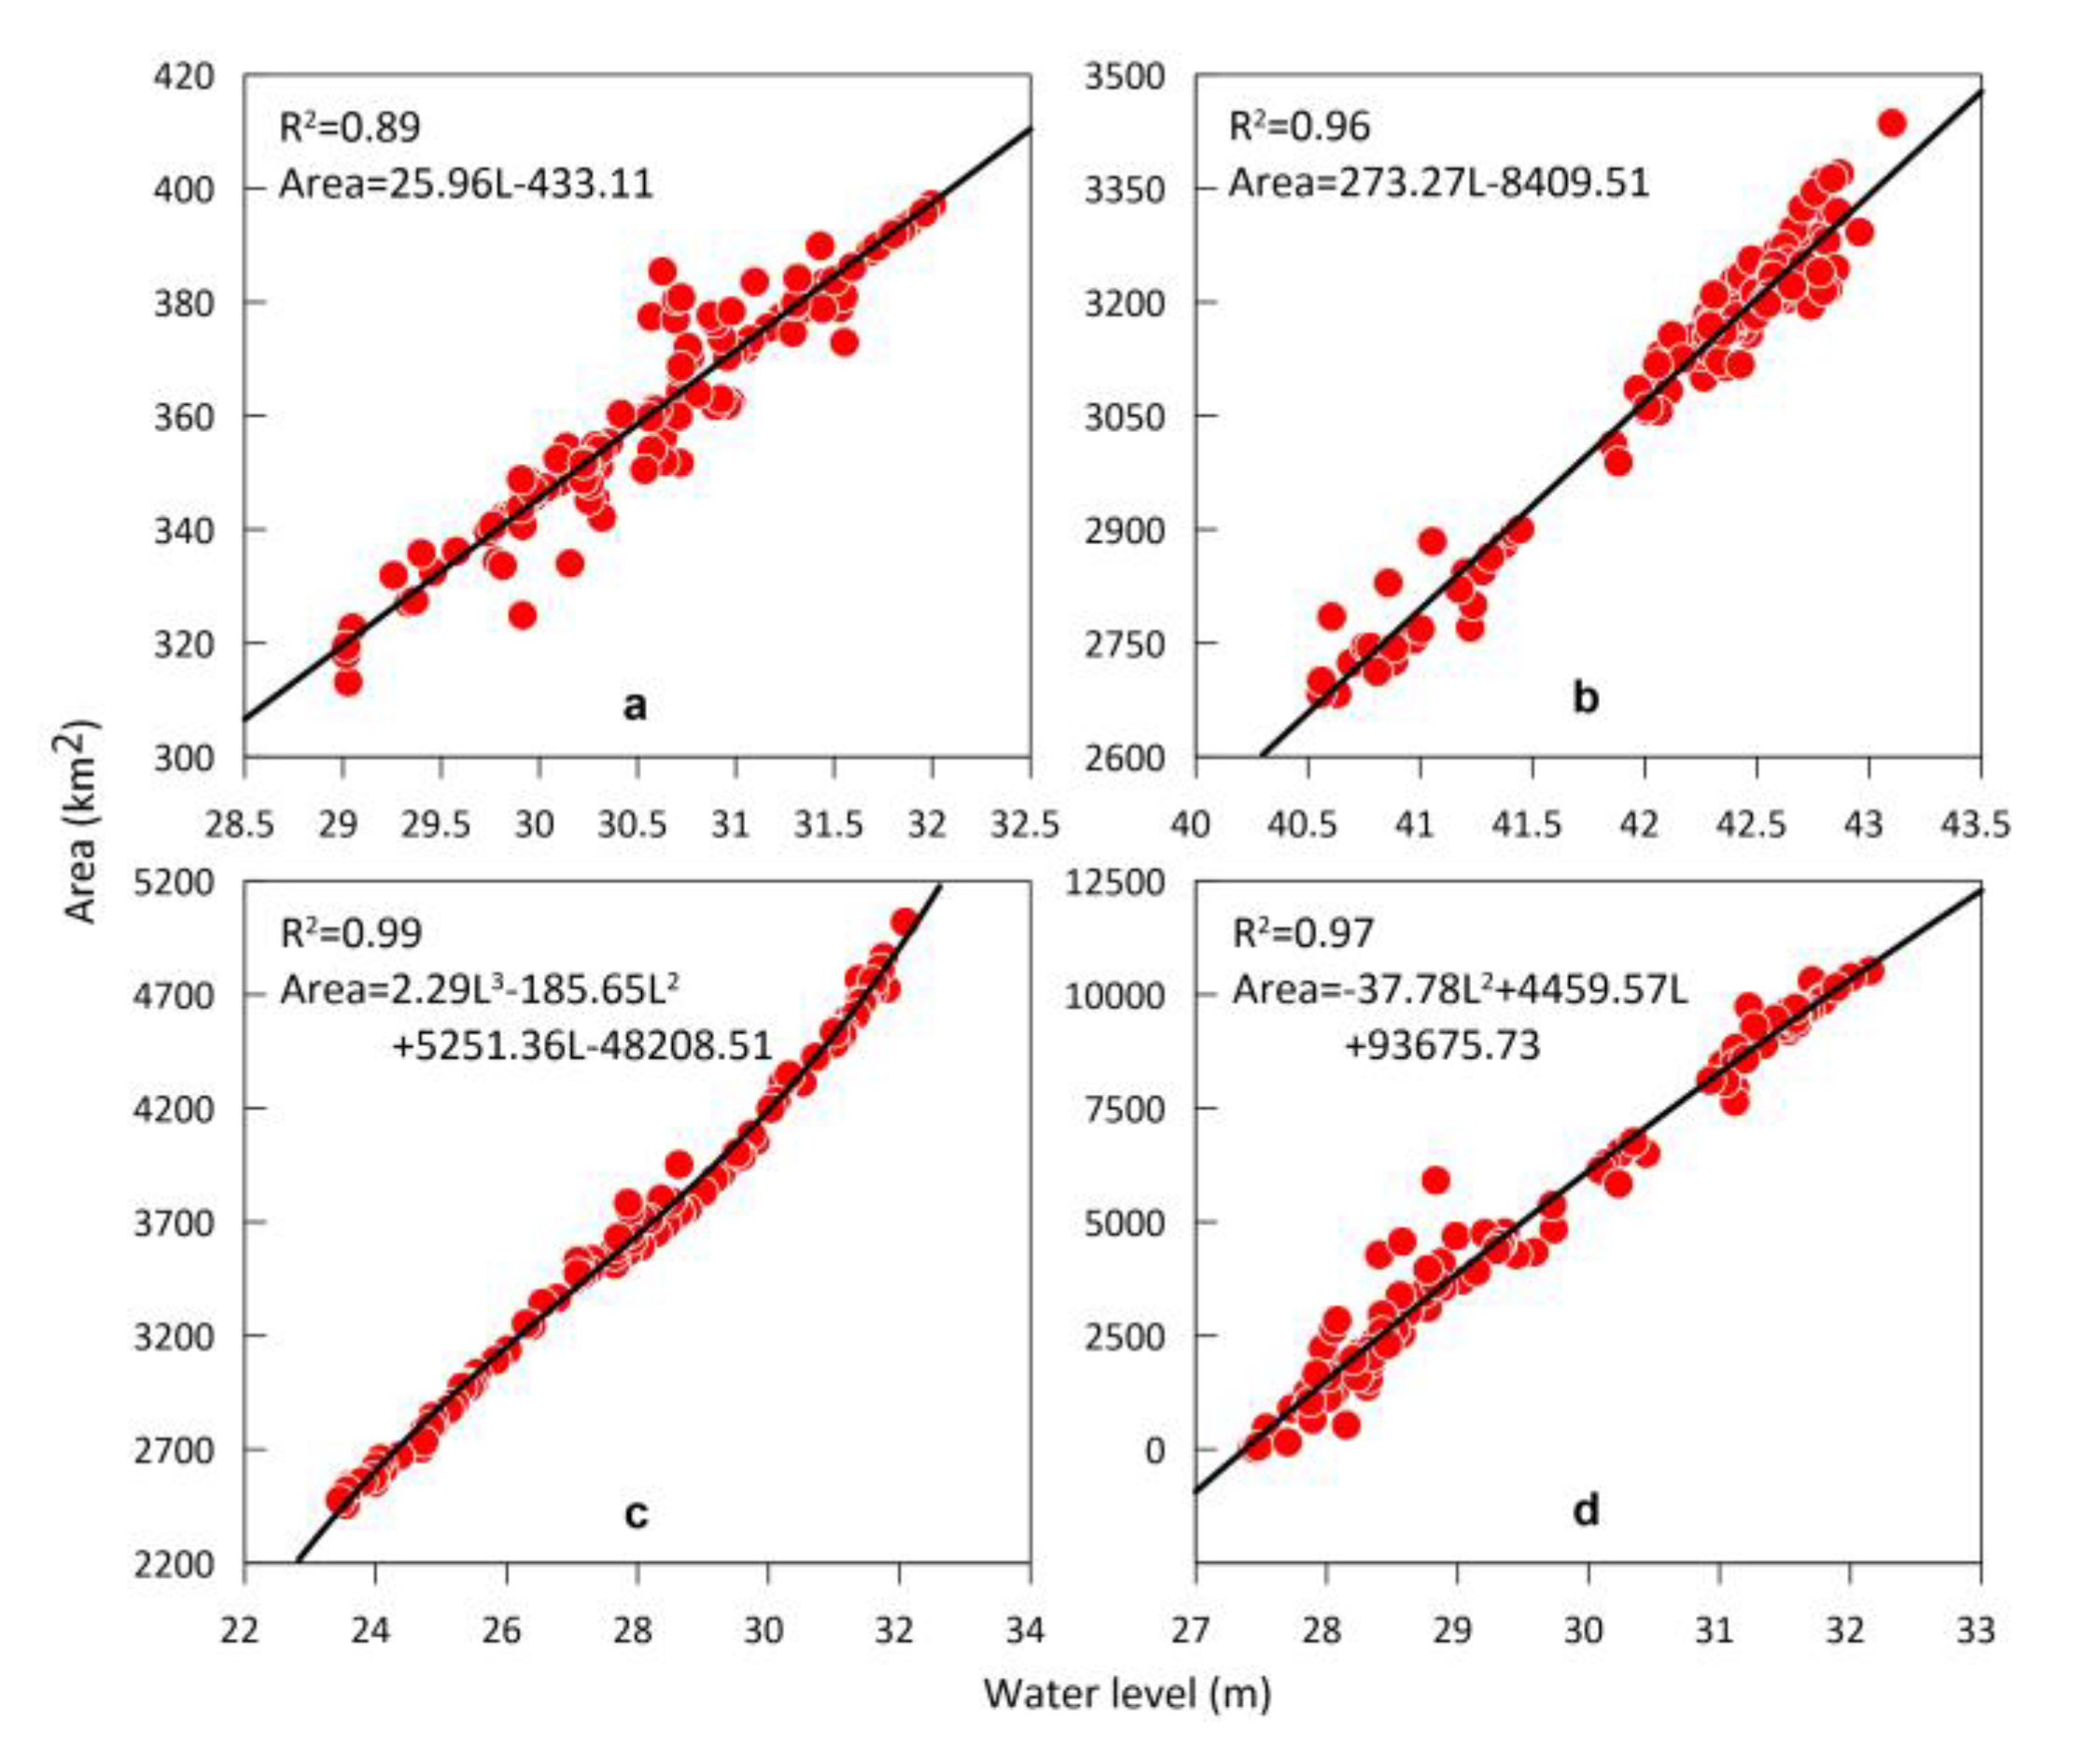
where C i represents the unknown coefficients in the expressions; and i is the order of the polynomial with n 3 usually. In order to estimate the volume anomaly of the Aral Sea, we used the level-area pairs to fit the hypsometric curves based on the least square principle.
In the study, the mapping area was sparse compared to the water level measurements. To make full use of the area data when constructing the level-area pairs, if there was no corresponding water level measurement of the inundated area for the acquisition time, the water level data were interpolated. The reserved level-area pairs were used to calibrate the hypsometric curves (CHCs) to limit the propagation of the uncertainties in the volume anomalies. Since the hypsometric curves were constructed using the water level and area data during the study period, accuracy is not guaranteed when extrapolating on the basis of it.

2.4. GRACE Gravimetry

GRACE estimates variations in the TWS by measuring anomalies in the Earth’s gravitational field [46]. Several versions of the global monthly gravitational field model have been released by several agencies since the successful implementation of this mission in 2002. Here, we used the RL06 GRACE spherical harmonic solutions from the Center for Space Research (CSR), Austin. Concurrently, the RL06 Jet Propulsion Laboratory mascon solution (JPL-M) and the CSR mascon solution (CSR-M) were also used for comparative analysis. Save et al. (2016, 2019) and Watkins et al. provided descriptions of the CSR-M and JPL-M data processing [29,47], so we will not go into detail here.
Limited by the native spatial resolution, the GRACE signals show serious leakage and attenuation at the small basin scale [28]. It will ultimately reduce the reliability of the estimated TWS changes. The Slepian spatiospectral concentration method (SSCM) was proposed to study the mass change of the region of interest, which has been proved to be effective in reducing the leakage effect of the GRACE signals [48,49,50]. In this study, we demonstrated an improving post-processing technique for the GRACE data, the SSDIM [25,26], which was developed by introducing the principle of spatial inversion into the SSCM [51,52]. For a more detailed calculation and explanation, see Gao et al. (2015, 2019) [25,26]. In addition, the CFM, with a decorrelation filter [28] and a Gaussian filter with a radius of 250 km [27], was also used to evaluate the performance of the different GRACE solutions for the Aral Sea and its endorheic basin.
The errors in the GRACE-derived TWS changes from the SSDIM and CFM were estimated using the approach described by Gao et al. [28], which were propagated from the errors in the measurements, the leakage, the tidal alias, and the errors that occur when deducting other signals, including the atmosphere and the glacial isostatic adjustment (GIA). For the GIA effects, we corrected all of the GRACE-derived maps of the water storage changes using the GIA model of A et al. (2013), which is based on the ICE-5G ice load history and a 3-D viscosity structure [53]. The mascon solutions provide an alternative approach to calculating the TWS changes through the regional mass concentration function. It minimizes the leakage effect by defining the mass change as points or tiles [54]. For the JPL-M, the error corresponding to each grid is directly given in the JPL-M products. However, the CSR mascon errors were estimated using the residual after fitting the GRACE time series in the study because their error calculation mechanism is not clearly explained by the product release organization. The total GRACE error in the TWS changes was calculated using the law of error propagation.

2.5. Land Surface Model and Hydrological Model

The global land data assimilation system (GLDAS) is a commonly used land surface modeling system, which includes the Noah model (Noah), the community land model (CLM), the mosaic model (MOS), and the variable infiltration capacity model (VIC) [55]. The model accurately simulates the hydrological components’ status and energy fluxes based on the ground and satellite observations and the run outputs with a temporal resolution of 3 h to 1 month and a spatial resolution of 1° to 0.25°. In this study, we obtained the soil moisture and snow water equivalent data from GLDAS coupled with the Noah model.
WGHM was developed by the Center for Environmental Systems Research at the University of Kassel and the National Institute of Public Health and the Environment of the Netherlands [56]. The model simulates hydrological processes and provides the variations in the water storage compartments (groundwater, surface water, soil water, snow, and canopy water) with a spatial resolution of 0.5° × 0.5° [57]. The version of the WGHM used in this study was WaterGAP 2.2 b, which was provided by Zizhan Zhang (personal communication). The modified model algorithm has been applied in arid and semi-arid areas [58], which makes it appropriate for studying water storage dynamics in the Aral Sea region. Additionally, several decades of measured discharge in this endorheic basin (the Aral Sea) were used to calibrate the WGHM-simulated water storages at the basin scale [59].

2.6. Auxiliary Databases

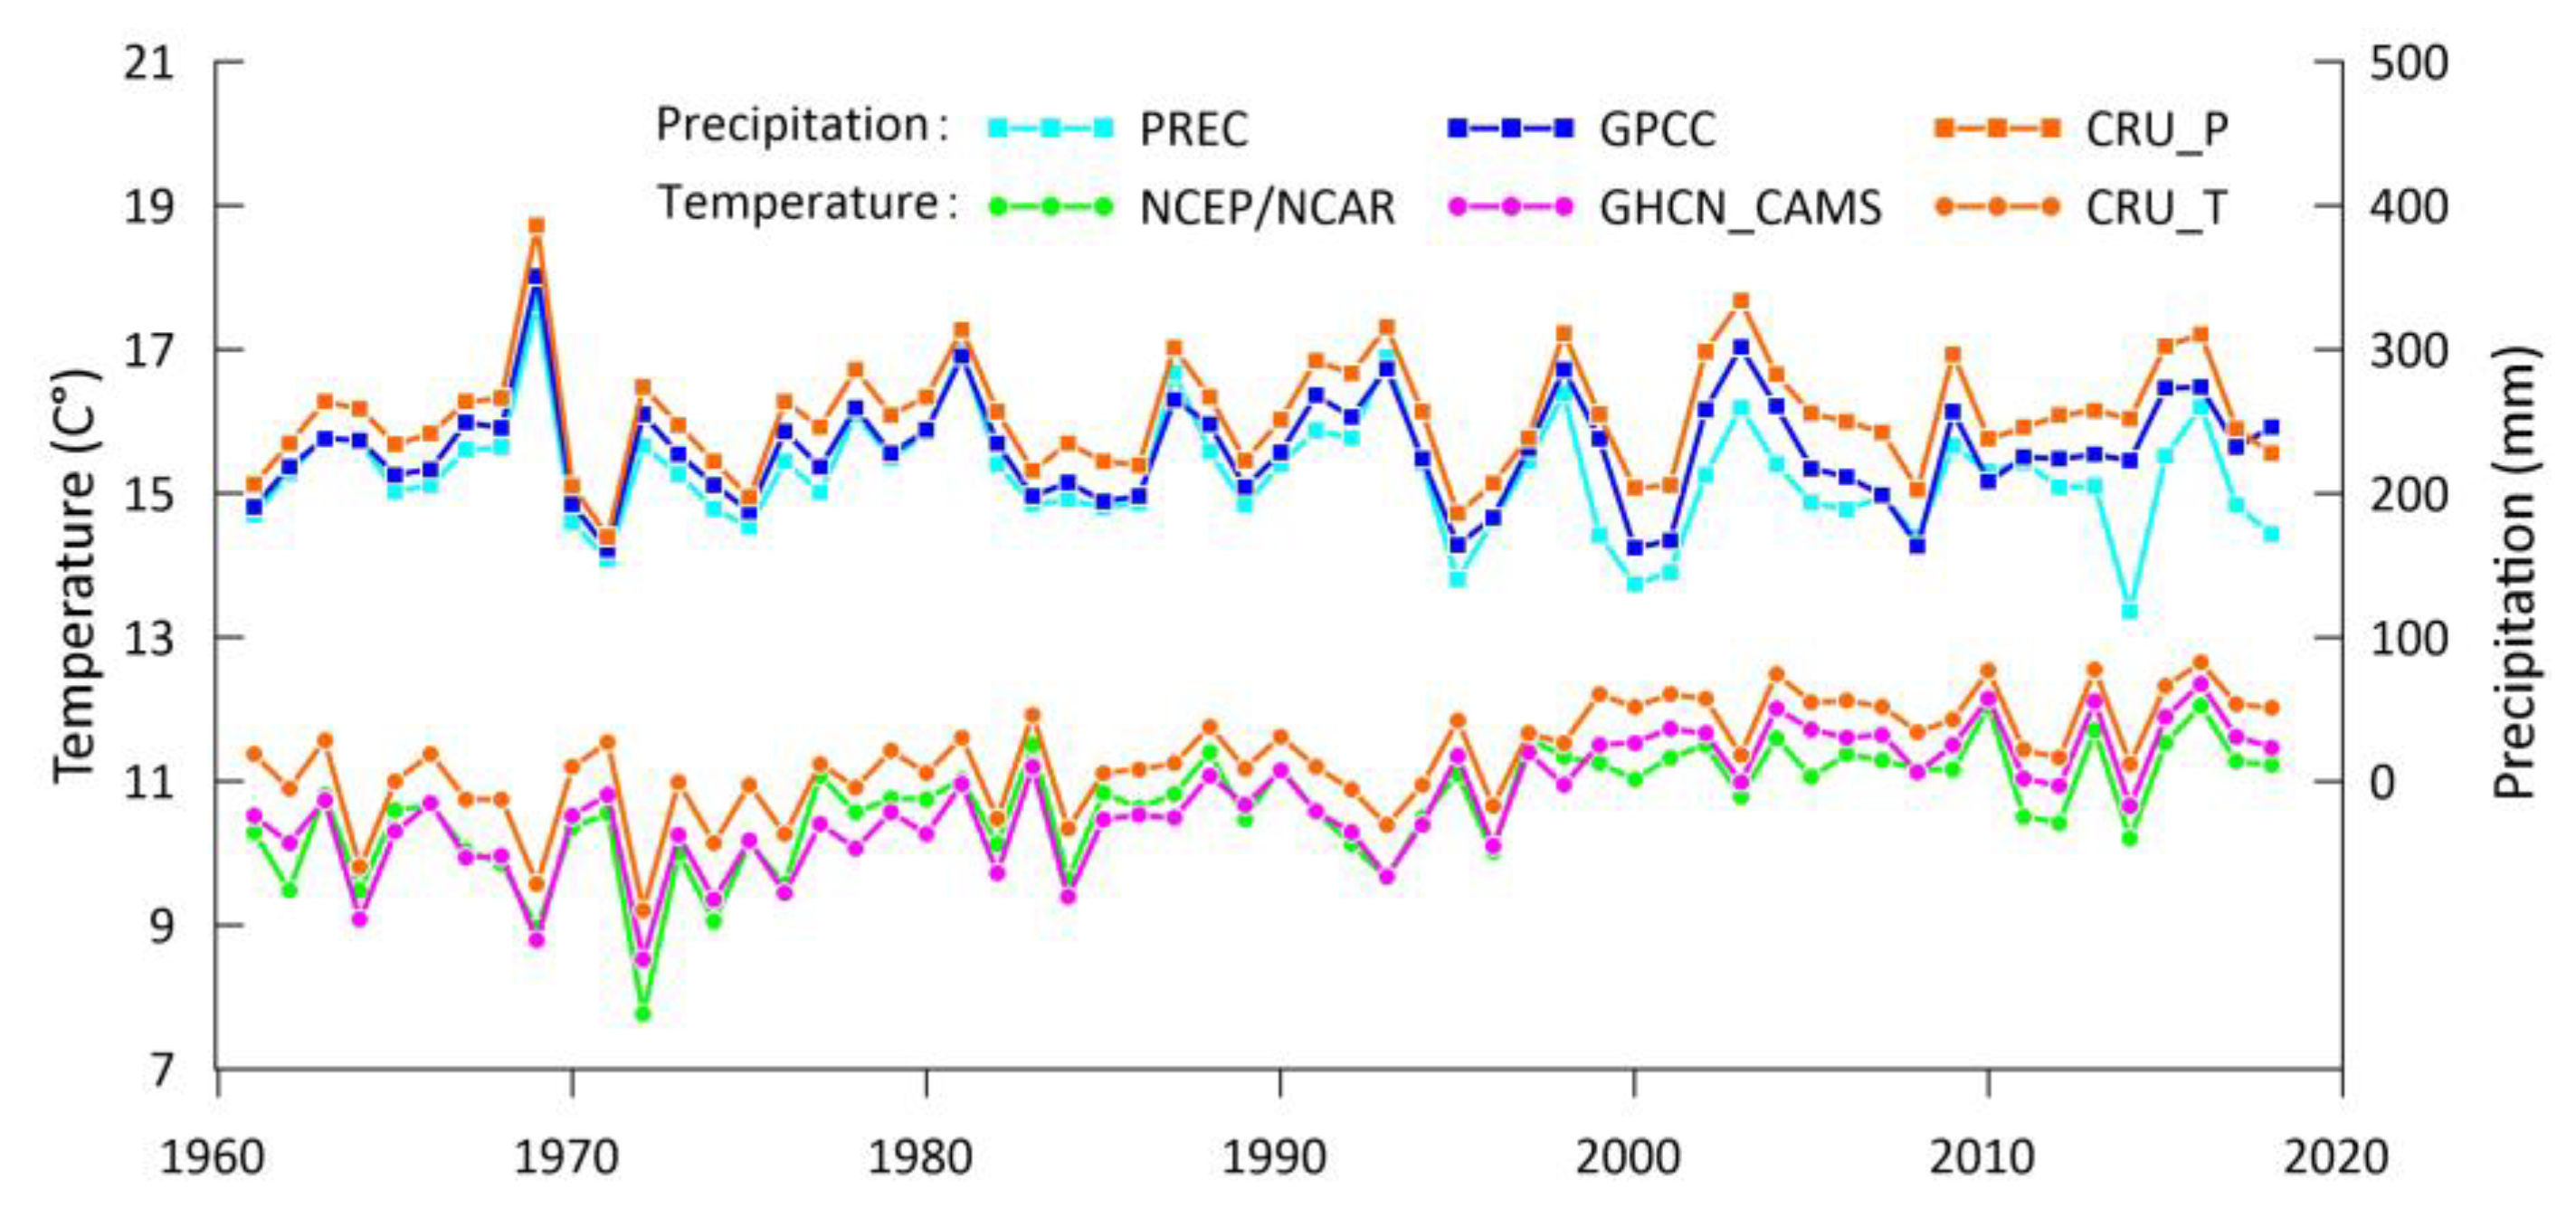
Due to the lack of in situ data, in order to verify the reliability of the water level time series retrieved from CryoSat-2 and Envisat, several public global lake datasets were used for comparison. The water level datasets from the Database for Hydrological Time Series over Inland Waters (DAHITI) [16], the Global Reservoir and Lake Monitor (GRLM) [60], and the Hydroweb database [14] covering the period from 2002 to 2018 were used. In addition, to gain insight into the impacts of climate change on the endorheic basin water storage, we also selected several high-resolution precipitation and temperature datasets. For a single climatic element, multiple independent datasets were used for the simple intercomparison to determine the robust temperature and precipitation changes (Figure A1). The auxiliary datasets used in this paper are summarized in Table 1.

3. Results

3.1. Water Level, Surface Area, and Volume Anomaly of the Aral SEA

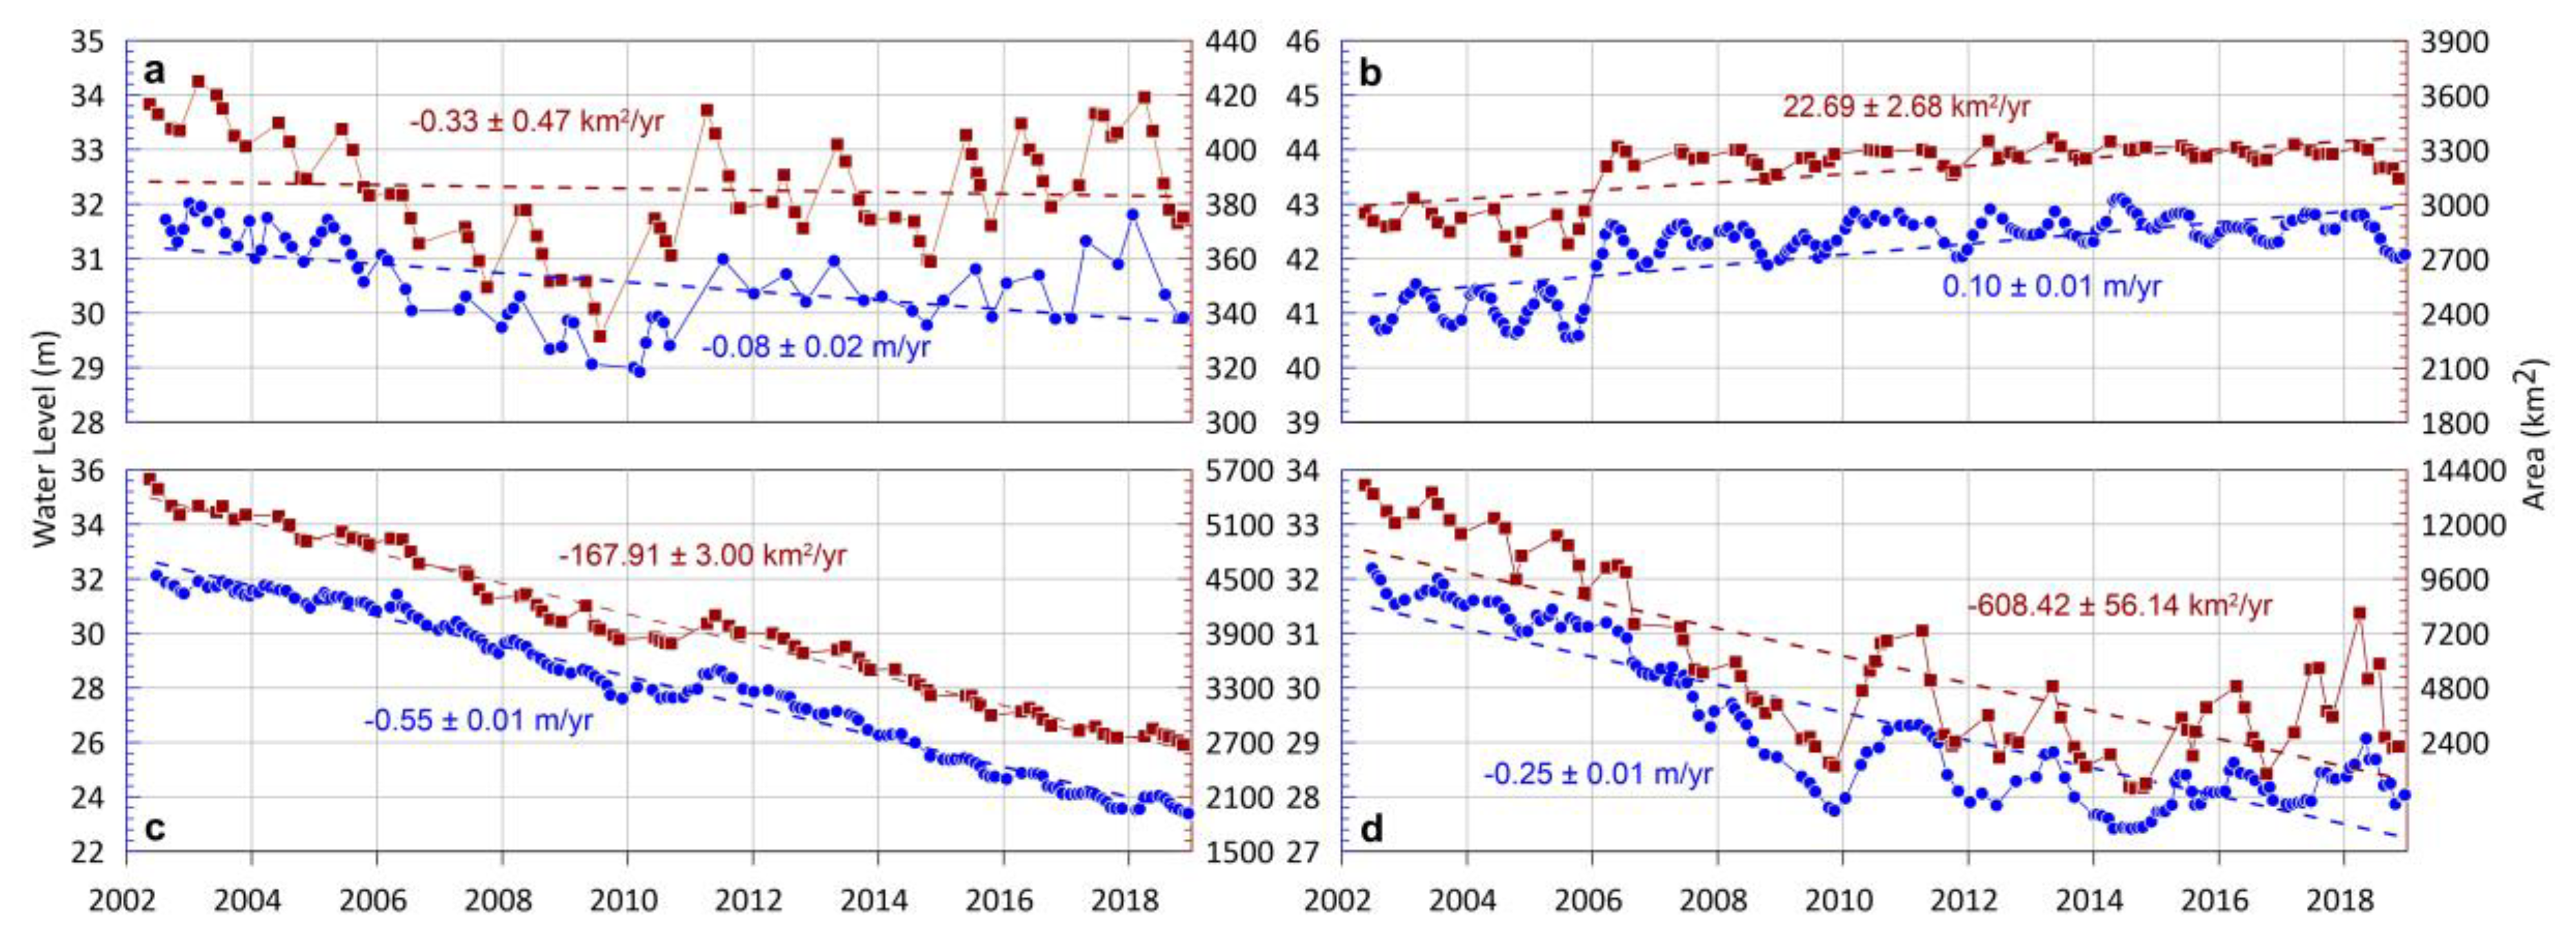
The CryoSat-2 and Envisat satellite altimetry data were combined to establish a robust and accurate time series of the water level in the Aral Sea. In the process of establishing a water level time series, geophysical corrections, waveforms retracking, removing outliers, and intersatellite offsets were considered, which was described in detail in Section 2.2.2. As shown in Figure 3, the water level of the East Aral Sea (EAS) has fluctuated sharply since the end of 2009. The Envisat track that originally passed through the water body deviated from the actual water area. Therefore, we used the extracted areas from Landsat to inverse the water levels using the calibrated hypsometric curve for 2009. Because the ESA dried up in 2014, the water mask did not exist in 2014, and the water mask of the previous year (2013) was chosen as a pseudo water mask. The actual surface height with respect to the geoid within the pseudo water mask reflected the desiccation of the EAS. Given the sensitivity of the microwave radar altimetry satellite to the surrounding terrain when retrieving the lake water level, we conducted statistical analysis of the SARIn waveforms to remove the seriously contaminated waveforms. Moreover, based on a comparison of the back-calculated water level from the hypsometric curves, when the difference between the two fields was greater than 10 cm (an empirical threshold), the water level obtained from the altimeters was considered invalid. The final water level changes of the four water bodies are shown in Figure 3 (the left y-axis represents the water level).
From the perspective of the water level change trend during the study period, the decline rate of the Tchebas Bay (TB) is about −0.08 ± 0.02 m/year. The maximum water level increase of the TB from 2010 to 2011 was about 2 m. If the seasonal water level fluctuations are ignored, it remained relatively stable after 2011. Among the four water bodies, only the trend of the water level changes of the North Aral Sea (NAS) is positive. Since the summer of 2005, the water level of the NAS has increased significantly, and it later stabilized at 42.45 m. The declining trend of the water level in the West Aral Sea (WAS) is stable. The rate is about −0.55 ± 0.01 m/year. By 2009, the decline rate of the EAS was −0.52 ± 0.01 m/year, which is close to the −0.53 ± 0.02 m/year rate of the WAS from 2002 to 2009. The disconnection between the WAS and the EAS did not occur until late 2009 [21]. Over the next few years, the water level of the EAS decreased at a lower rate of −0.05 ± 0.01 m/year. However, the water level fluctuated very sharply. A huge net evaporation and seasonal intermittent flow led to the dramatic water level changes.
The ongoing changes of the Aral Sea water level drive the surface area variations in Figure 3 (the right y-axis represents the inundated area). The time series of the surface area derived from Landsat 8 OLI/TIRS and Landsat 7 ETM+ with a 30-m spatial resolution ensures the accuracy of the mapping area. Because the images acquired in 2003 were affected by clouds and dust storms and thus cannot be used, the water level retrieved was used to derive the inundation area using the hypsometric curve for 2003. It is clear that the area changes of the four individual water bodies are close to those of the water level. This result validates the possibility of combining multiple remote sensors to detect the synchronous hydrological changes of the Aral Sea.
The CHC of the four water bodies are shown in Figure A2. Overall, the root mean square errors of the four fitted curves are large. Among them, the NAS, the WAS, and the EAS have the best effect, i.e., all of them have R2 values of ≥ 0.95. Followed by ~0.90 for the TB. This is because the TB has the smallest area (~360 km2), and the valid measurements generated by the satellite altimetry as it passes over the lake are also less abundant than those of the other three water bodies. Consequently, under the same observation conditions as the satellite altimetry, the mapping area and the retrieving water level of the TB have a larger uncertainty, which causes the level-area pairs to be more discrete. Given the particularity of the TB and the excellent performance of the other three water bodies’ hypsometric curves, it is acceptable to use the hypsometric curve to derive the water storage anomalies of the Aral Sea.
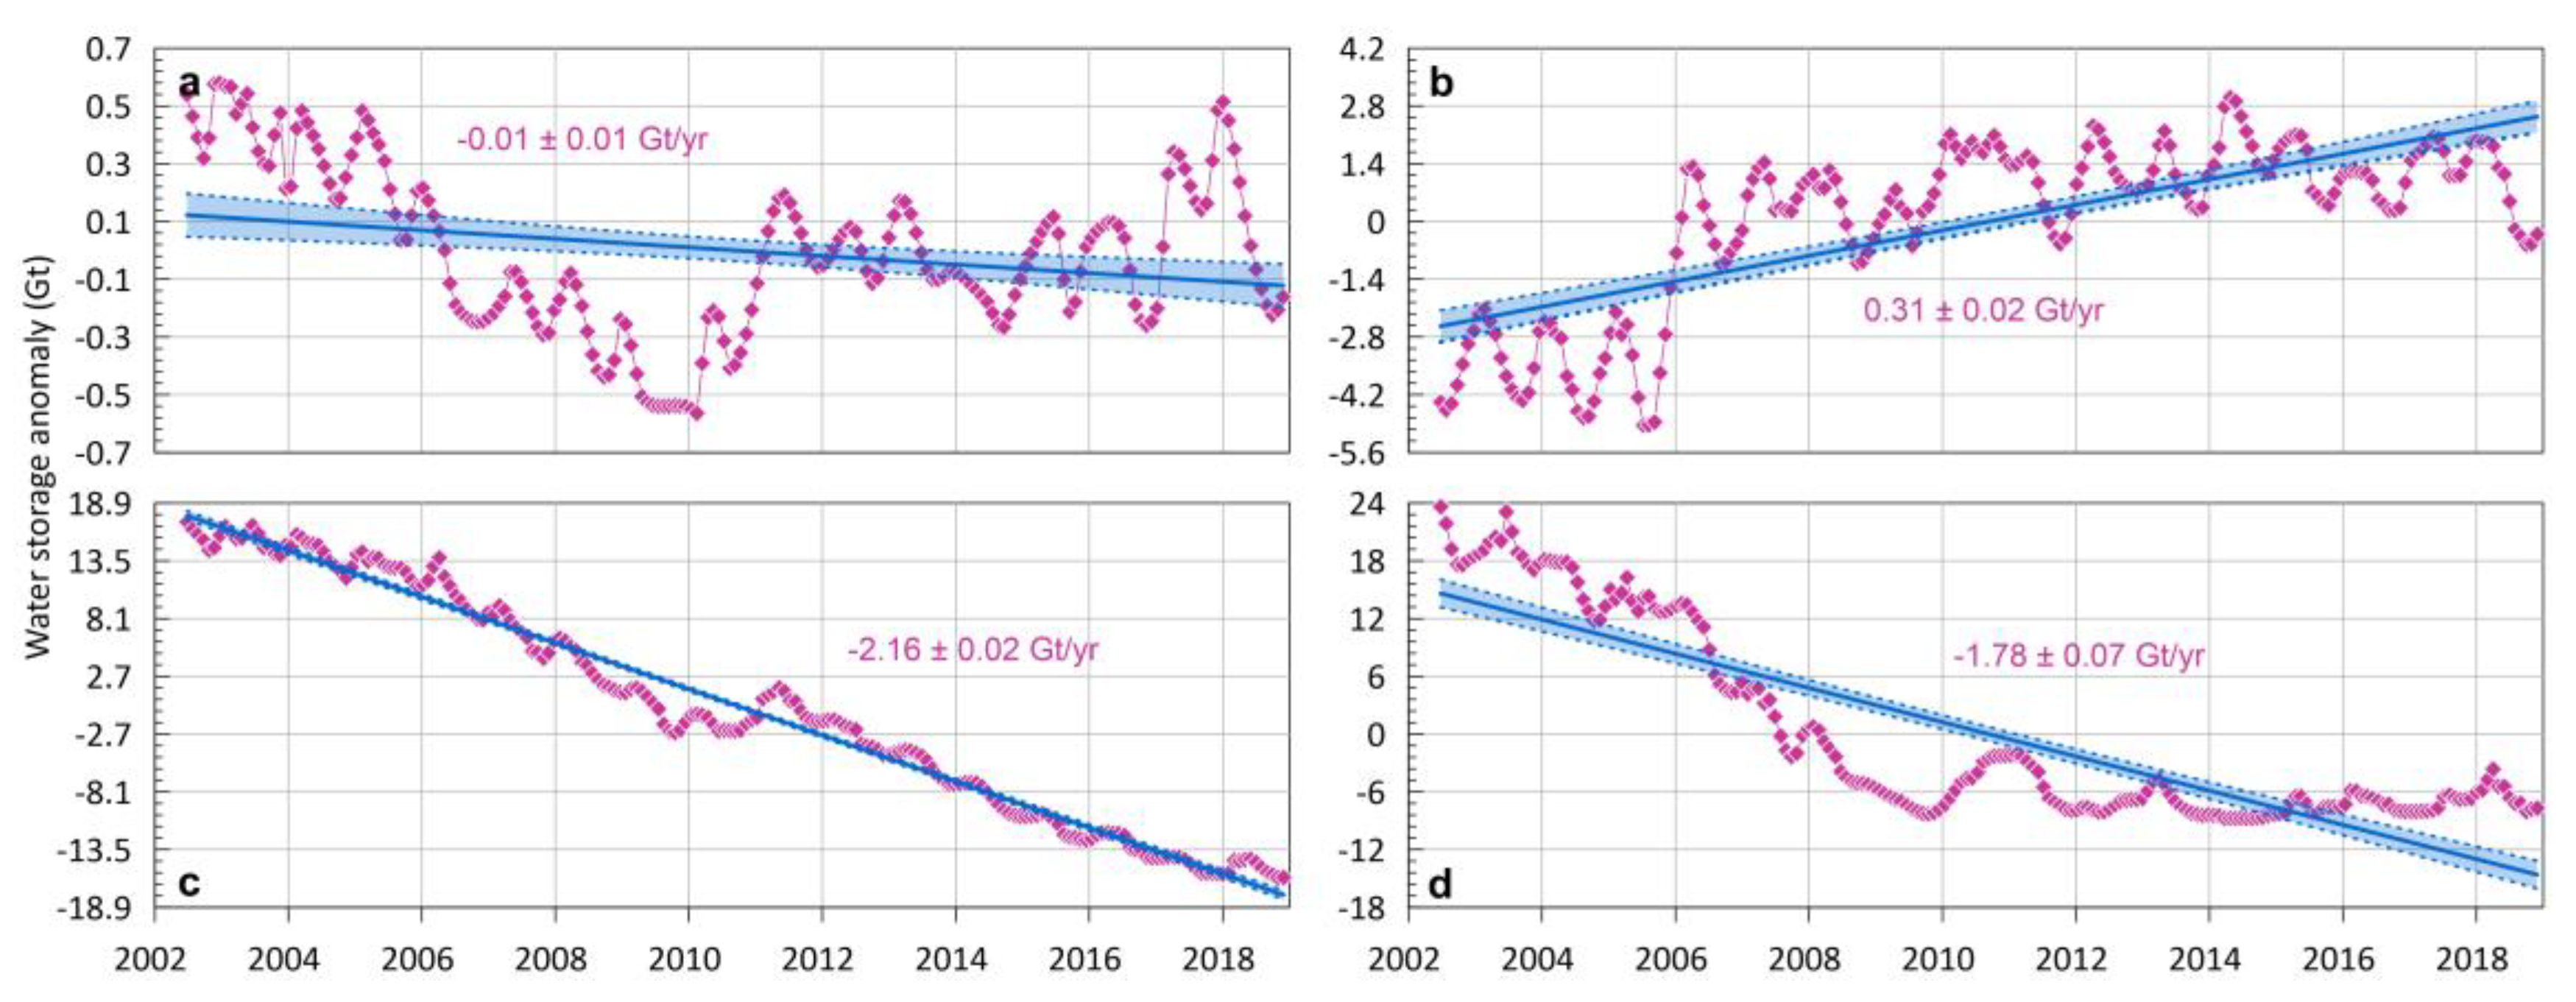
In Figure 4, the change in the Aral Sea water storage anomalies was obtained by integrating the water level with the hypsometric curve (Figure A2). In the TB, the sparse valid observations cause a large uncertainty range in the trend of the volume anomalies. Among the four parts of the Aral Sea, the volume of the NAS is the only one that is increasing. The success of the recovery of the NAS is attributed to the Kok-Aral dam, which stretches across the Berg Straits [19]. After the dam was completed in August 2005, the Syr Darya supported the volume of the NAS to maintain its stability. The decrease in the water storage of the South Aral Sea is the most significant. The WAS has the largest decreasing trend and is the most stable at −2.16 ± 0.02 Gt/year, and the second fastest decrease is the EAS at −1.78 ± 0.07 Gt/year. Before 2009, the water storages of the two water bodies had similar rates of decrease. However, when an extreme drought occurred in 2009, the water level of the EAS experienced a significant decline. This caused the two water bodies, which had previously been connected by a tiny channel, to be disconnected. Apart from the small amount of precipitation, the WAS mainly relies on the EAS’s overflow supply. The floods in 2010 brought nearly 5 Gt of water into the EAS, and it also restored the channel linking the EAS to the WAS. As shown in Figure 4c, after several months of delay, the WAS water storage reached its peak. As the water losses continued, the connection was broken again. Since the WAS is much deeper than the EAS, the two water bodies with the fastest rates of decrease have exhibited different behaviors in recent years.

3.2. Water Storage Changes in the Aral Sea and Its Endorheic Basin

To estimate the water storage changes of the Aral Sea and its endorheic basin, we evaluated several GRACE solutions, including the CSR-M, JPL-M, CFM, and SSCM solutions. The spatial patterns of all of the solutions were gridded into a 0.125° × 0.125° grid. The JPL-M originally provided 3° × 3° monthly gridded values, which is different from the 1° × 1° parameterization method of the CSR-M. Accordingly, the spatial pattern of the TWS changes from the JPL-M is far less smooth than those of the other solutions. The CFM and the mascon solutions can provide the TWS changes at the global scale, while the SSCM does not provide mass variations in the neighboring areas. The signals of the mass change outside the endorheic basin were not the focus of this study. Since a single grid cell does not represent the native resolution of GRACE, the grid cells were aggregated into a real GRACE resolution.
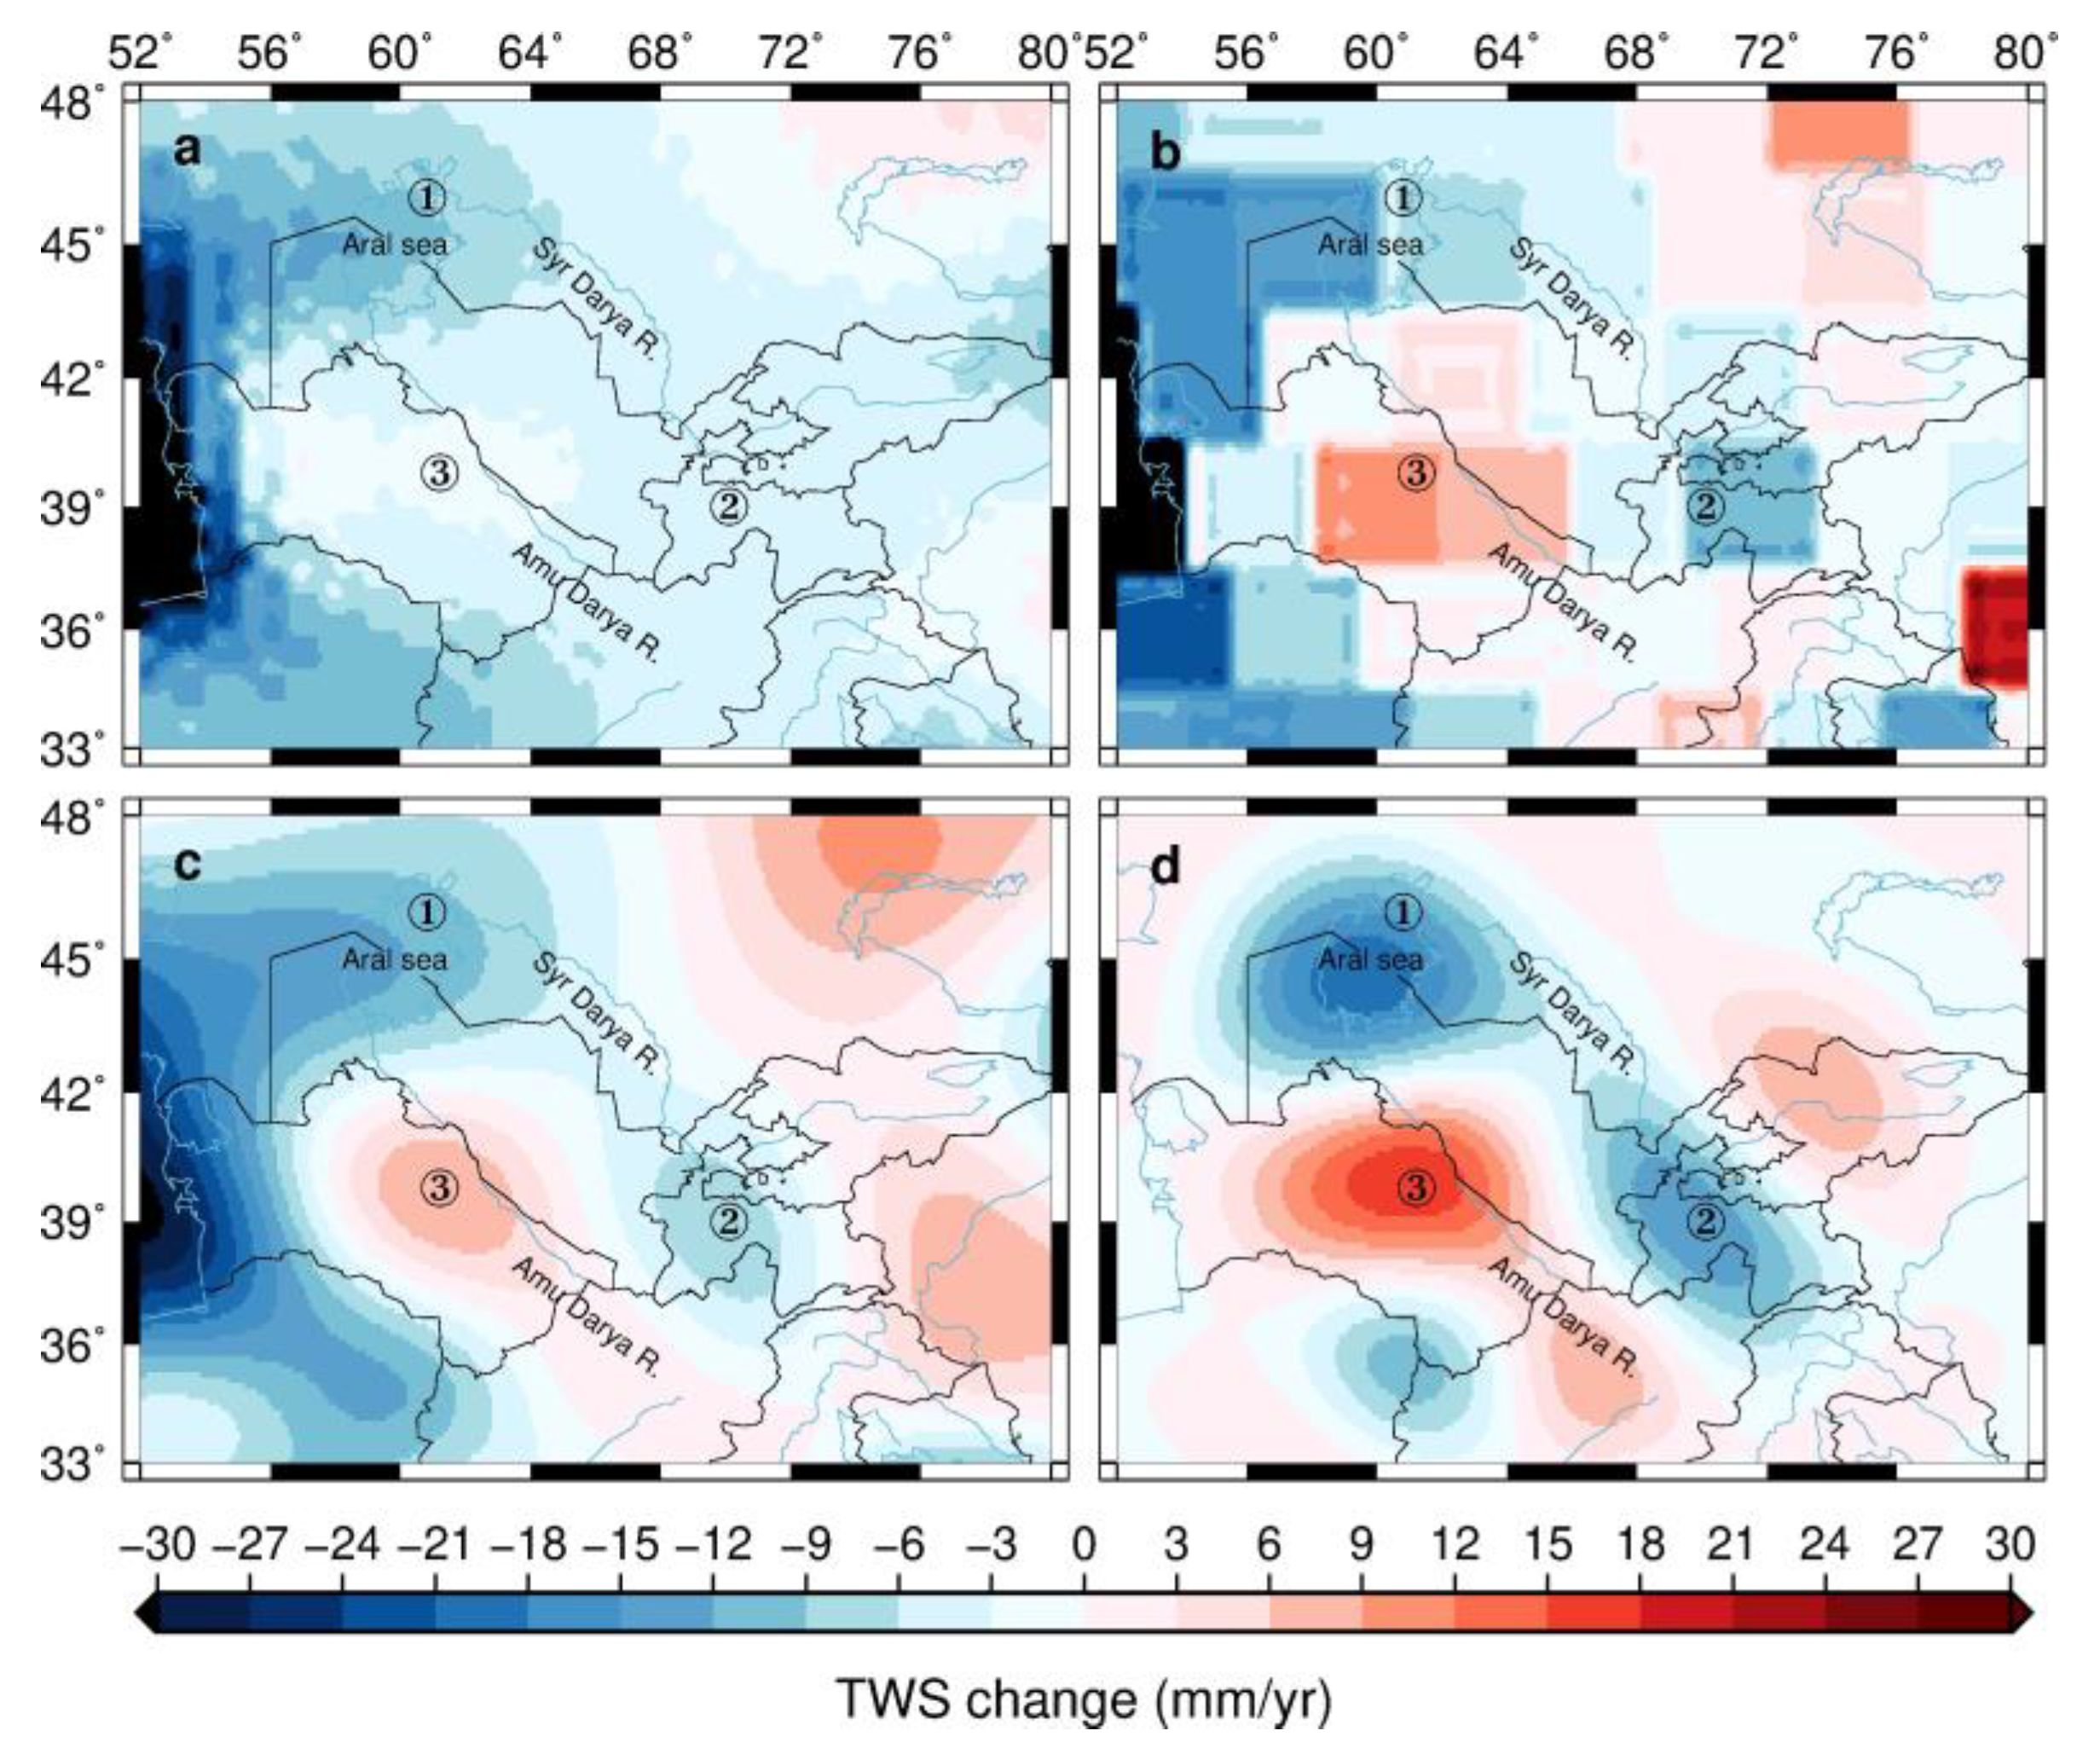
The spatial pattern of the TWS changes in the endorheic basin is shown in Figure 5. The main TWS change signals were captured in the endorheic basin (surrounded by thick blue lines in Figure 1). (1) There is a significant TWS decline in the Aral Sea; (2) the signal of the TWS loss is in Eastern Uzbekistan and Tajikistan; and (3) the positive TWS trend is in central Turkmenistan. From the perspective of the entire basin, all of the spatial patterns of the TWS change are very consistent in the direction of change, while the significant discrepancies are reflected by the magnitude. The CSR-M provides weaker signals than the rest solutions, especially in areas 2 and 3, followed by the long-term trend of the CFM. The TWS rates of areas 2 and 3 from the JPL-M and SSCM are close to each other. In area 1 (the Aral Sea), the GRACE solutions exhibit significant negative signals. Moreover, the magnitude of the Aral Sea TWS change derived from the SSCM is larger than those derived from the CSR-M, JPL-M, and CFM. It appears that the GRACE data experienced signal leakage, attenuation, and error introduction after adopting the different post-processing strategies.
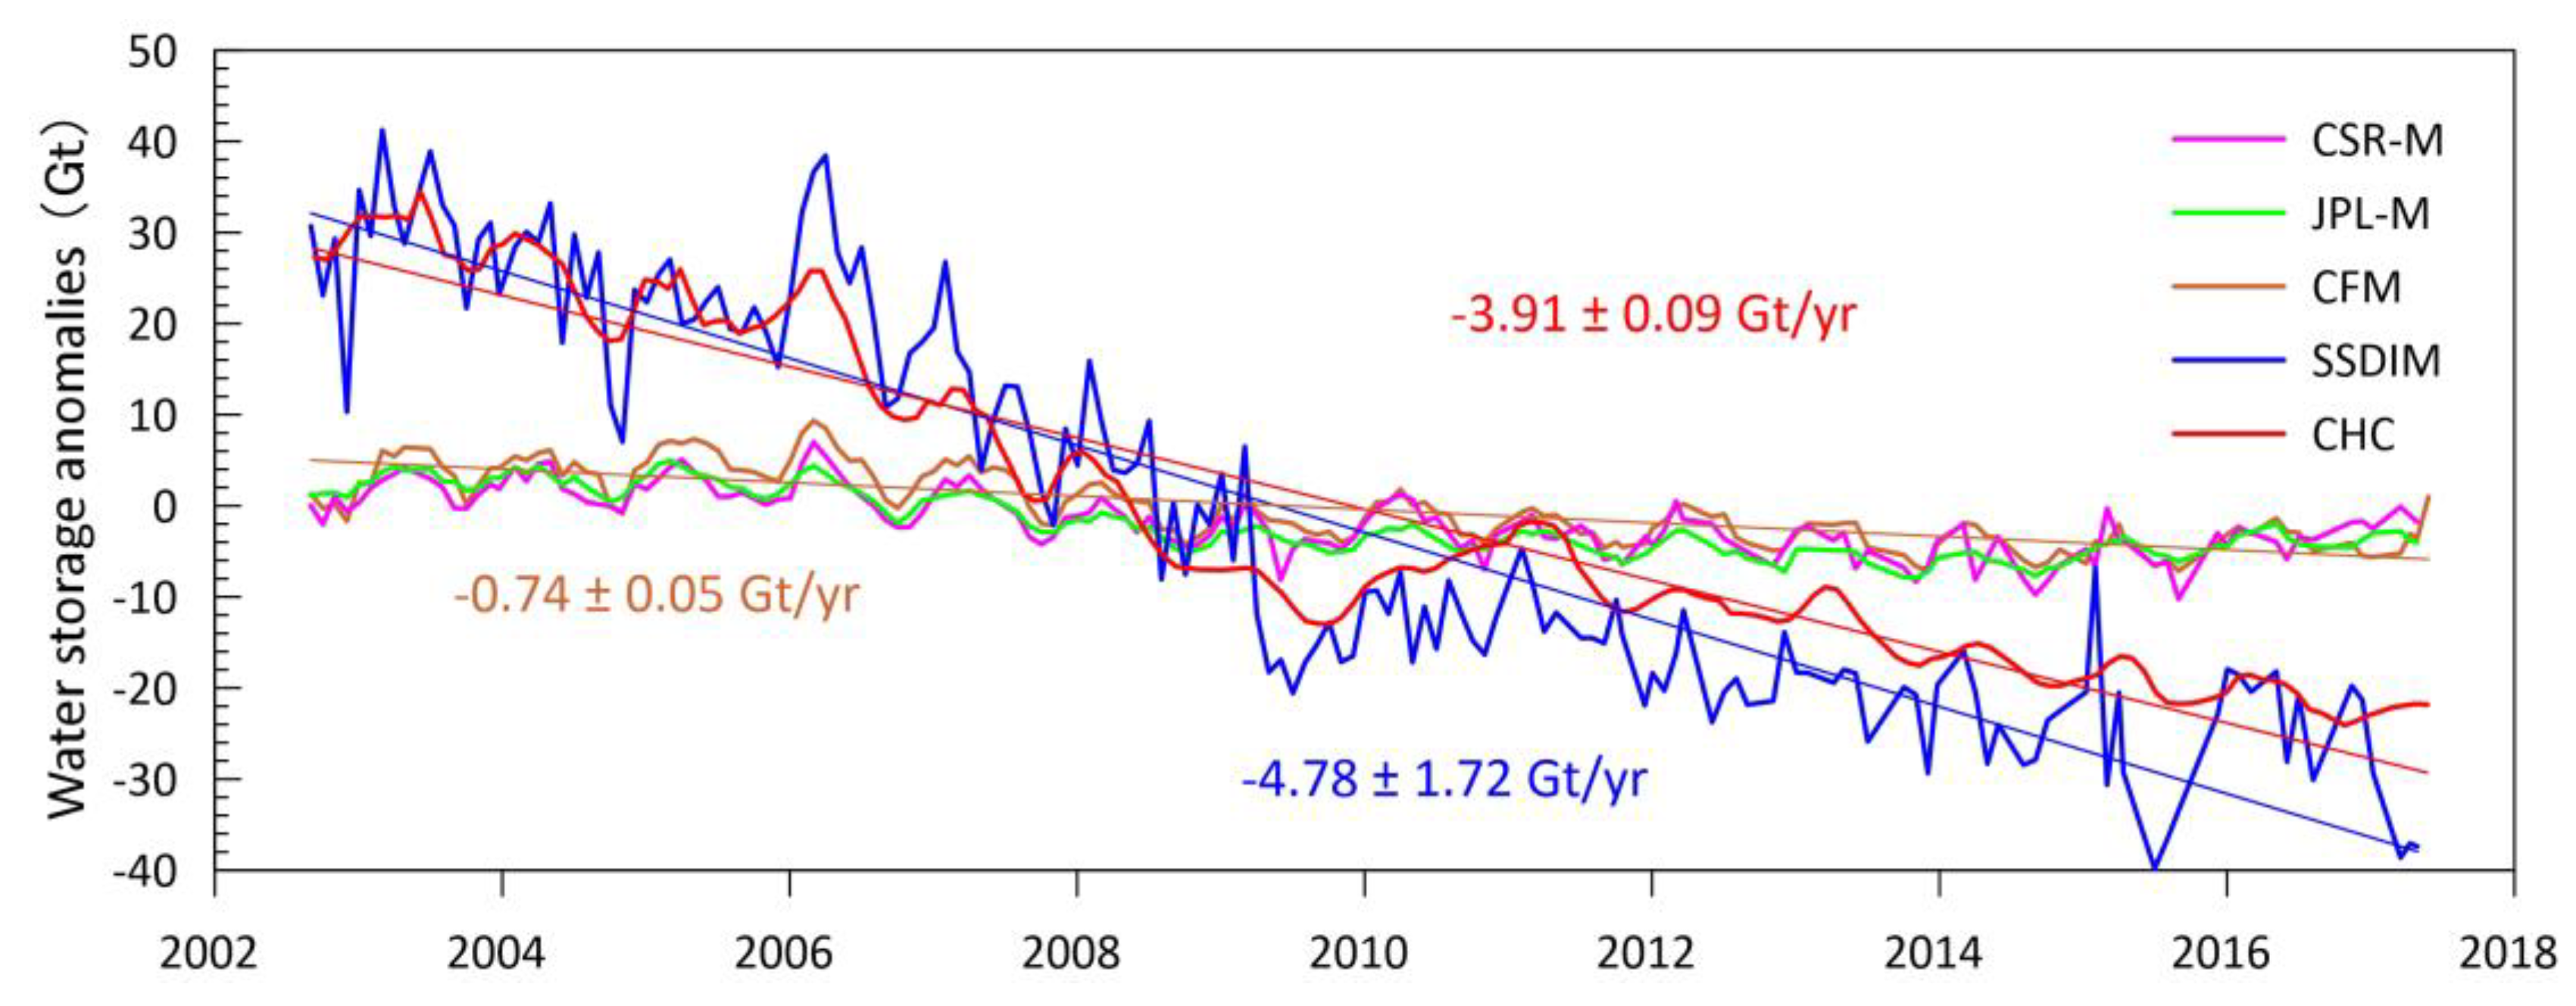
In order to monitor the water storage changes in the Aral Sea from the GRACE data, a time series of the water storage anomalies is illustrated in Figure 6. Significant discrepancies exist in the results derived from the GRACE solutions. The amplitude and magnitude of the CFM and the mascon solutions are significantly smaller than those of the SSDIM, and they are even lower than the CHC-derived result (−3.91 ± 0.09 Gt/year). The mascon solutions have minimum trends of nearly −0.57 ± 0.05 Gt/year (CSR-M) and −0.69 ± 0.04 Gt/year (JPL-M). This is a serious departure from the fact that the Aral Sea is rapidly shrinking year by year. Previous studies have shown that the mascon solutions have advantages over the spherical harmonic method in reducing the leakage error and improving the estimation accuracy [66,67]. However, on small scales, such as that of the Aral Sea (~3° × 3°), the mascon’s performance in estimating real mass changes is poor. This finding is consistent with the conclusion drawn by Zhang et al. [68]. In this study, after being processed using the CFM, the mass reduction signal of the Aral Sea leaks into the Caspian Sea significantly, and the trend in the water storage change in the basin is distinctly smaller than that derived from the SSDIM. In contrast to the mascon solutions and the CFM, the SSDIM is recognized as an enhanced representation of the GRACE solutions in small basins. A significant advantage of this method is that it can constrain the GRACE signal to the region of interest, reduce the leakage errors, and recover the attenuation of the signal using the least square principle.
The TWS changes derived from the GRACE data vertically integrate the water storage changes. It contains the variations in the groundwater storage ( Δ G W S ), surface water storage ( Δ S y r W S ), soil moisture storage ( Δ S M S ), snow water equivalent storage ( Δ S W E S ), and canopy water storage ( Δ P W S ), but the latter is usually ignored:
Δ T W S = Δ G W S + Δ S y r W S + Δ S M S + Δ S W E S .
In the study area (the blue dotted rectangle in Figure 2), the soil moisture and snow water equivalents in the GLDAS/Noah model were estimated. After deducting the soil water and snow water equivalents from the water storage change based on the SSDIM, the new rate of decrease was −4.84 ± 1.81 Gt/year, which is slightly higher than the previous rate of −4.78 ± 1.72 Gt/year. This illustrates that the changes in the soil water and snow water in this area make only a small contribution to the long-term trend in the water storage. The residual signal is expected to include the surface water storage changes, groundwater changes, and unknown errors.
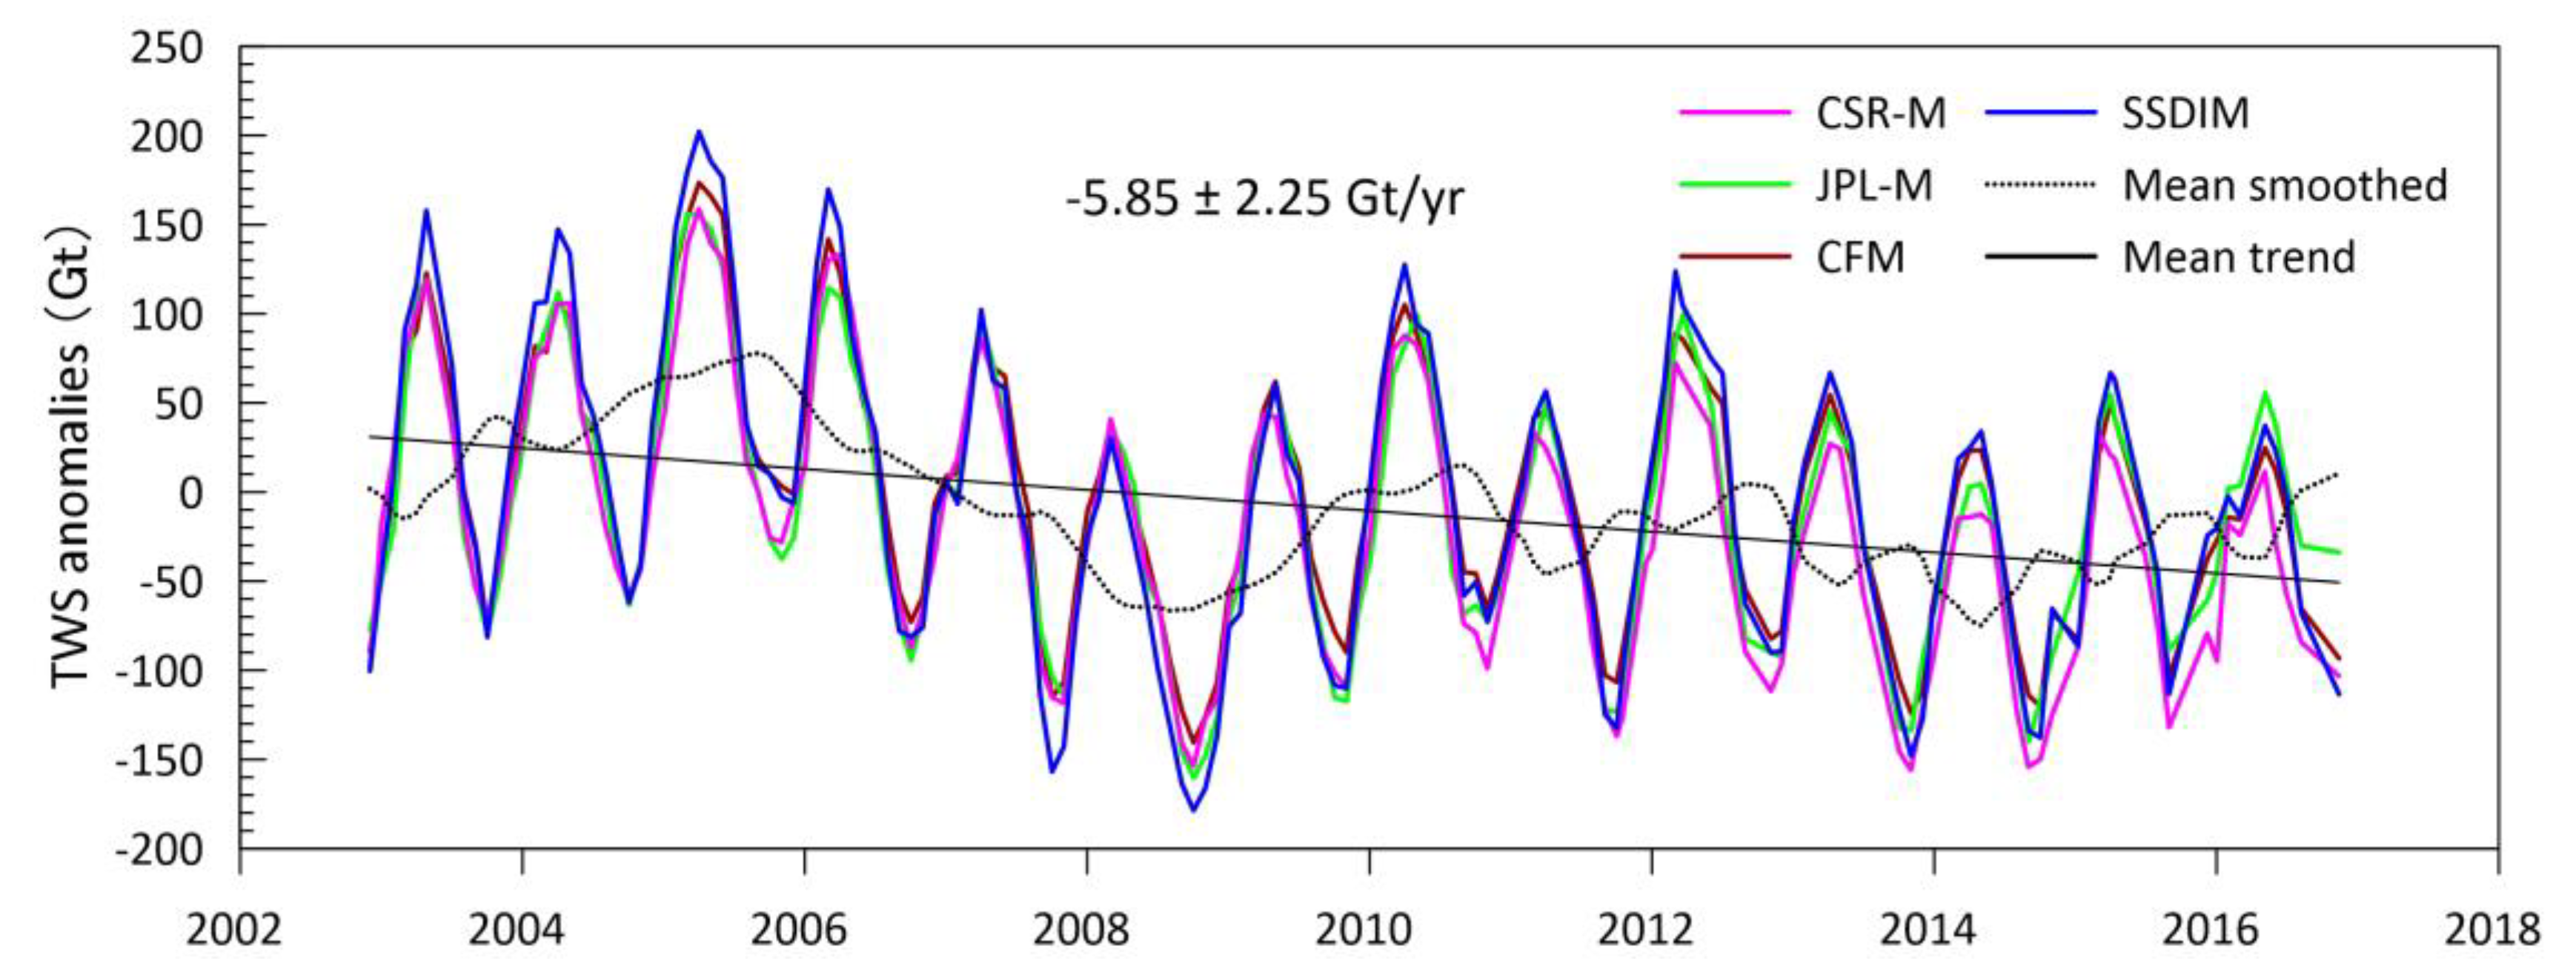
In contrast, four GRACE solutions have a higher accordance with the TWS anomalies of the endorheic basin (Figure 7). In particular, these time series have similar amplitudes and phases during the study period. Compared with the various magnitudes and temporal patterns of the four solutions for the Aral Sea, they show an excellent ability to detect the TWS changes on larger basin scales. The mean TWS change rate calculated from the four solutions is −5.85 ± 2.25 Gt/year, which is lower than that reported by Wang et al. (JPL-RL05M: −7.31 ± 1.68 Gt/year) [22]. The improvement of the data quality and the extension of the recording timespan in the latest GRACE products (RL06) may be the main reasons for this difference. In addition, we performed a 13-month smoothing of the mean TWS anomaly time series. In 2005 and 2010, the TWS growth in the basin was significant, while in 2008–2009, there was a distinct decrease in the TWS in the endorheic basin. The Aral Sea behaved similarly during this period (Figure 5). This shows that as the terminal lake, the Aral Sea acts as an indicator of extreme hydrological events (e.g., floods and droughts). However, this also indicates that the intensities and scopes of the three extreme events are so large that they can be captured by the GRACE data at the basin scale.

3.3. Precision Evaluation

The calibrated hypsometric curves were created using level-area pairs. Consequently, two sources of error were identified to have propagated the uncertainties of lake volume anomalies, including the mean water level retrieved from the satellite altimetry data and the mapping areas extracted from the images. Additionally, uncertainties are also caused by the hydrological curve fitting. We calculated the root mean square error (R2) of each hypsometric curve as the part of uncertainty (Figure A2). The Monte Carlo method is used to estimate the trend uncertainty of the Aral Sea water volume caused by these errors [69]. We present a detailed evaluation of the first two more significant errors below.
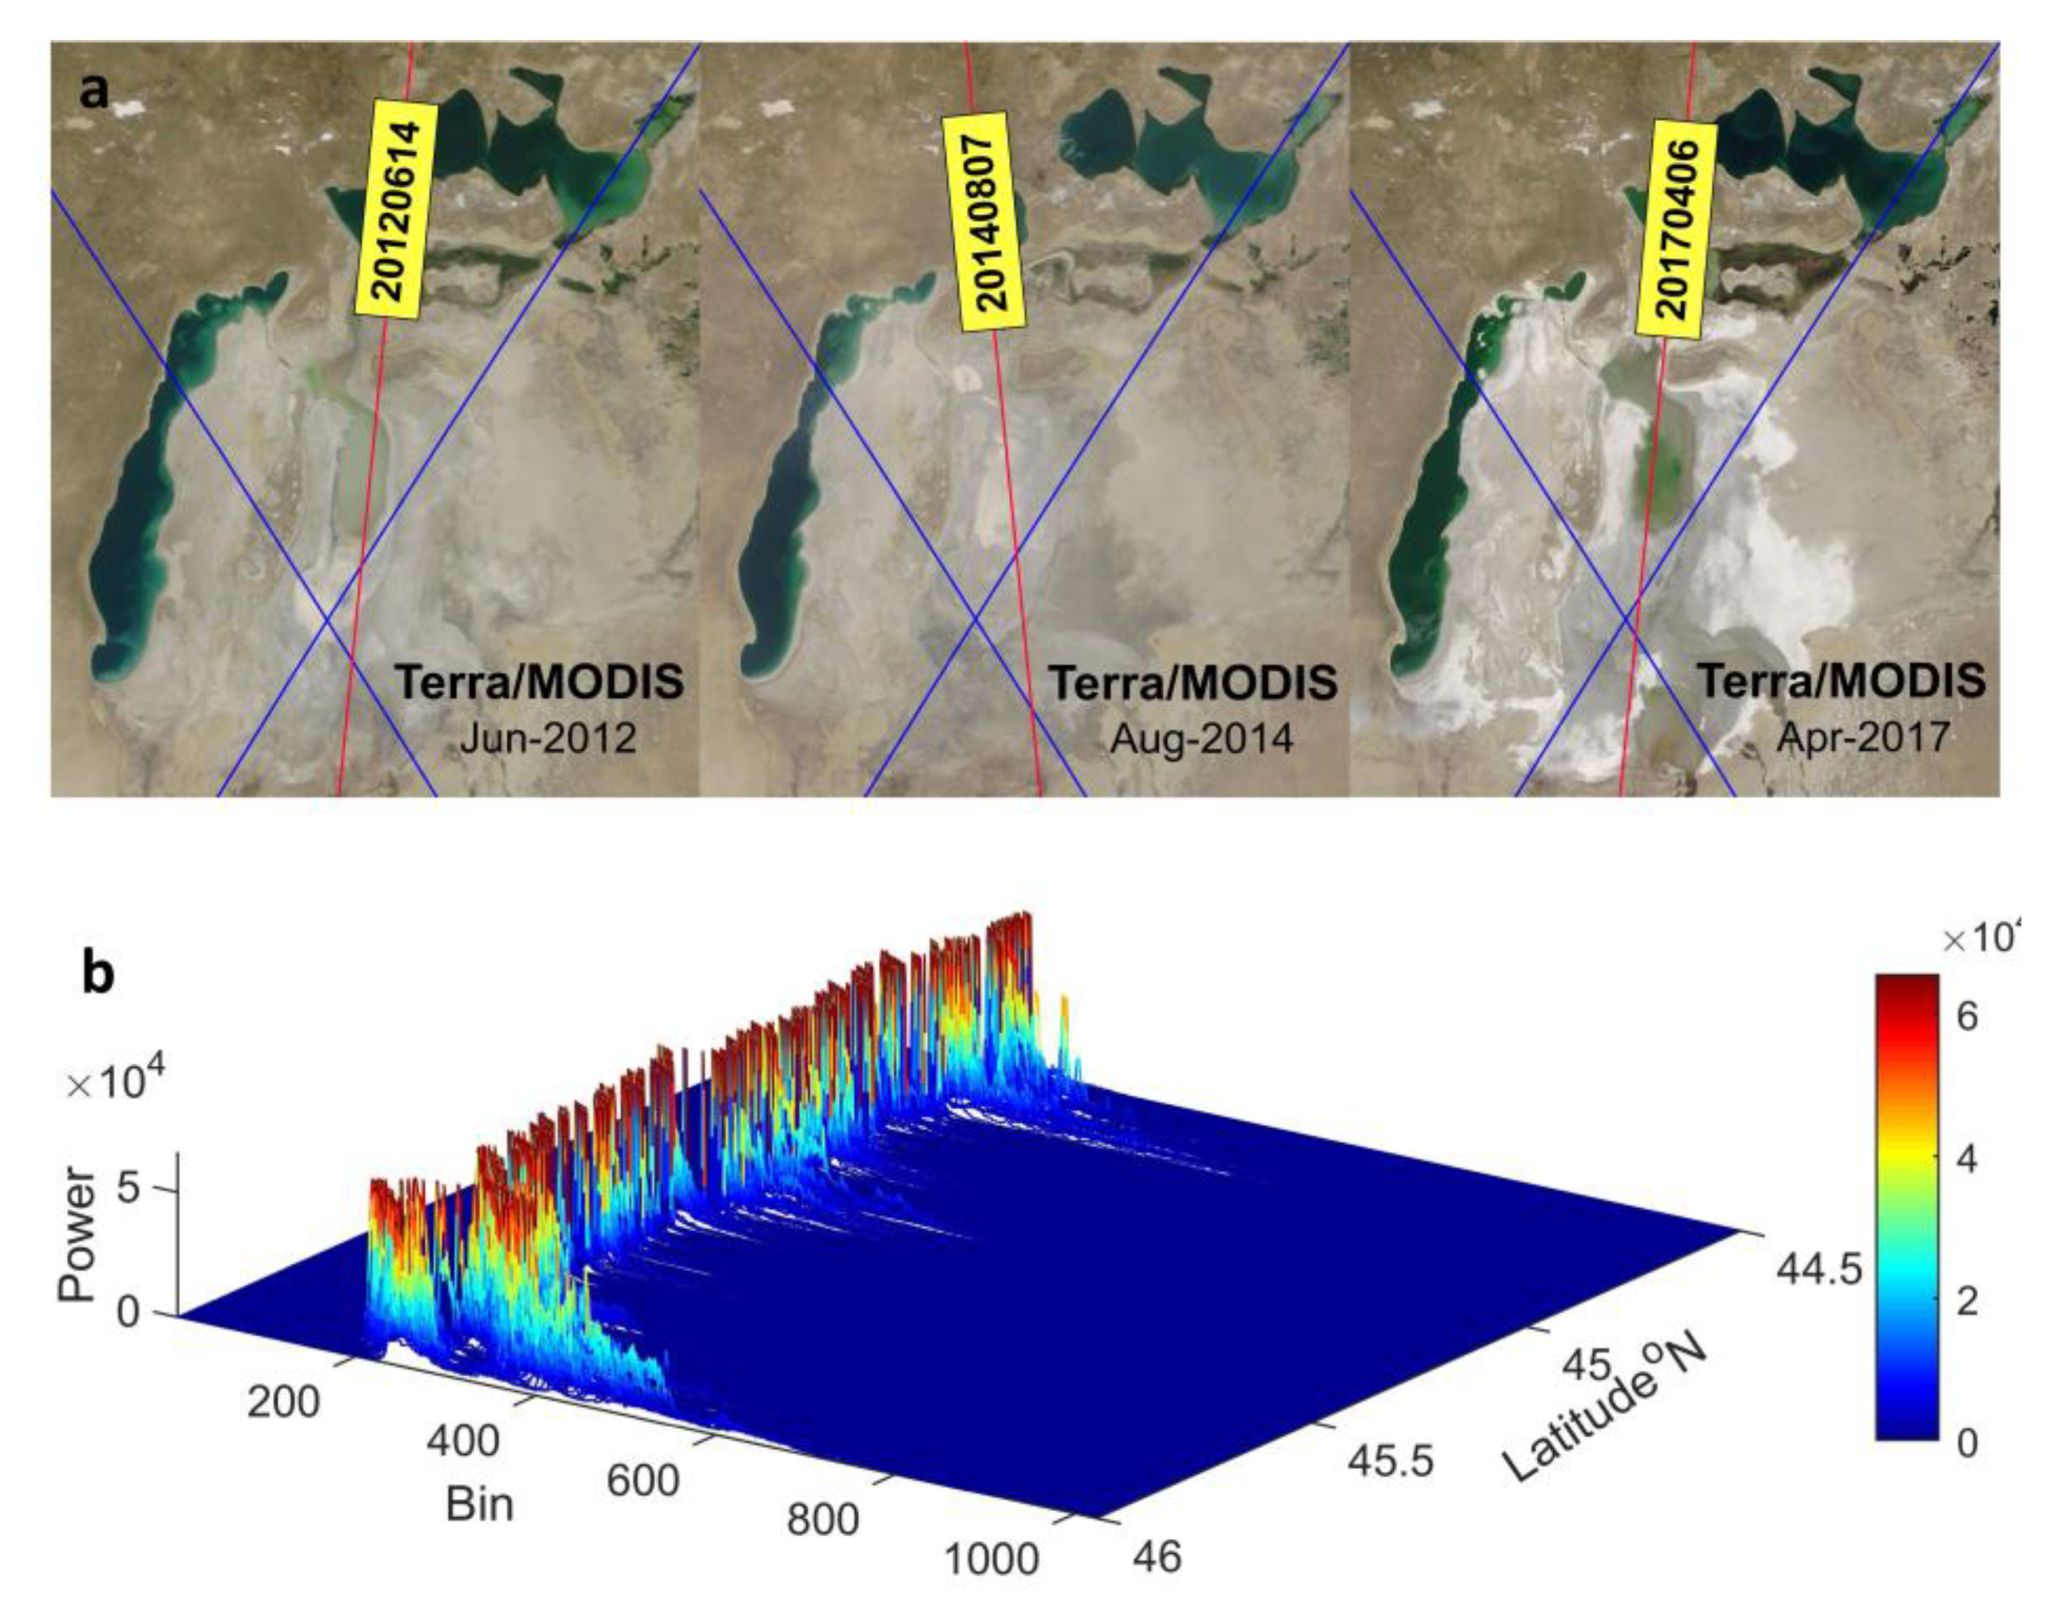
Here, we compared the time series of the water level with the open inland water level datasets, which are described in Section 2.5. In Figure A3, the GRLM was smoothed using a median filter. Similarly, Kalman filtering was applied to the DAHITI. The water level reference surfaces of both datasets were converted to EGM2008, while the datum of the water level from Hydroweb was GRACE GGM02C. In the TB, the time series of the water level from the DAHITI contains distinct outliers in 2013 and at the end of 2015. In the NAS, the water level variations of the three datasets are highly consistent with the results of this study. Many large abnormal fluctuations in the Hydroweb were found from 2013 to 2016 in the WAS, and there is a large deviation between the GRLM and DAHITI. The reason for this is the fact that only one altimeter track was used to estimate the water level variations in the GRLM and Hydroweb products, while the DAHITI combined the data from multiple satellites to retrieve the water level of the WAS, which effectively reduced the errors caused by using only one track. In the WAS, the correlation between this study and the DAHITI reaches 99.78%. In the EAS, the water level from the DAHITI and GRLM derived from Jason are very consistent with studies conducted before 2009. However, the time series of the EAS water level that we retrieved significantly deviated from that of the above datasets, especially in 2009, 2012, 2014, and 2017. Except for the EAS water level in 2009, the time series was obtained by reversing the hypsometric curve. When the EAS water level dropped sharply in 2012, 2014, and 2017, the tracks of the Jason-series satellites did not pass over the water surface in Figure A4, and the elevation of the anhydrous area was horizontal in the water level time series. However, CryoSat-2 has a 30-day special sub-cycle that provides more ground coverage data over a 369-day repeat cycle rather than a single track across for a small area. This advantage makes it possible to detect more details on the dynamics of water level changes during the dry period of the EAS. In short, compared with the above widely used datasets, the Aral Sea water level changes retrieved in this study are more reliable.
Due to the lack of area measurements for the Aral Sea, and the lack of a publicly available high-precision area datasets to verify the inundated areas during the study period, in order to evaluate the extracted water area, we calculated the error matrix and the kappa coefficient to analyze the accuracy of the water area extraction. In the Aral Sea, 300 water samples and 500 non-water samples were selected. The accuracy assessment shows that the overall accuracy achieved by the MNDWI was 95.62%, and the kappa coefficient was 0.93. The coordinated changes in the extracted lake area and the water level in Figure 3 are noteworthy. It is clear that the inter-annual and even the seasonal change signals in the water area are almost in complete agreement with the water level changes. This further shows that the extracted time-variable inundation areas are reliable, although it was not verified using public datasets as the water level changes were.
We note the good agreement between the results from the different GRACE solutions for in the endorheic basin, and the robustness of the large area (greater than GRACE’s spatial resolution) observations with respect to errors of the leakage errors and to the various GRACE processing methods. In the Aral Sea, where the area is less than GRACE’s spatial resolution, the different GRACE processing strategies have a significant impact on the TWS trend estimates. As an empirical method, the SSDIM was originally designed to improve GRACE signal recovery in small areas. The consistent estimation of the SSDIM solutions and the CHC for the Aral Sea indicate that the method provides reasonable results.

4. Discussion

4.1. Interannual Variabilities in the Water Storage Components of the Aral Sea

In addition to the GRACE measurement errors, the signal leakage and attenuation, and the GIA effects, the residual signals from the SSDIM in the Aral Sea include variabilities in the groundwater and surface storage. Due to the lack of measurements for the groundwater in the Aral Sea, it is difficult to accurately separate the observed integral gravity signal into underground aquifer and surface water changes. Although combining the GRACE data with the land surface models can be used to estimate the water storage component, in the absence of independent validation and reliable observations, high uncertainties could be introduced into the estimation due to errors in the GRACE observations and the model. Given the potential contribution of the groundwater in the Aral Sea to the changes in the TWS, a qualitative assessment is necessary. Herein, we extracted the interannual variations in the groundwater and surface water components from the WGHM to conduct the cross-validation analysis.
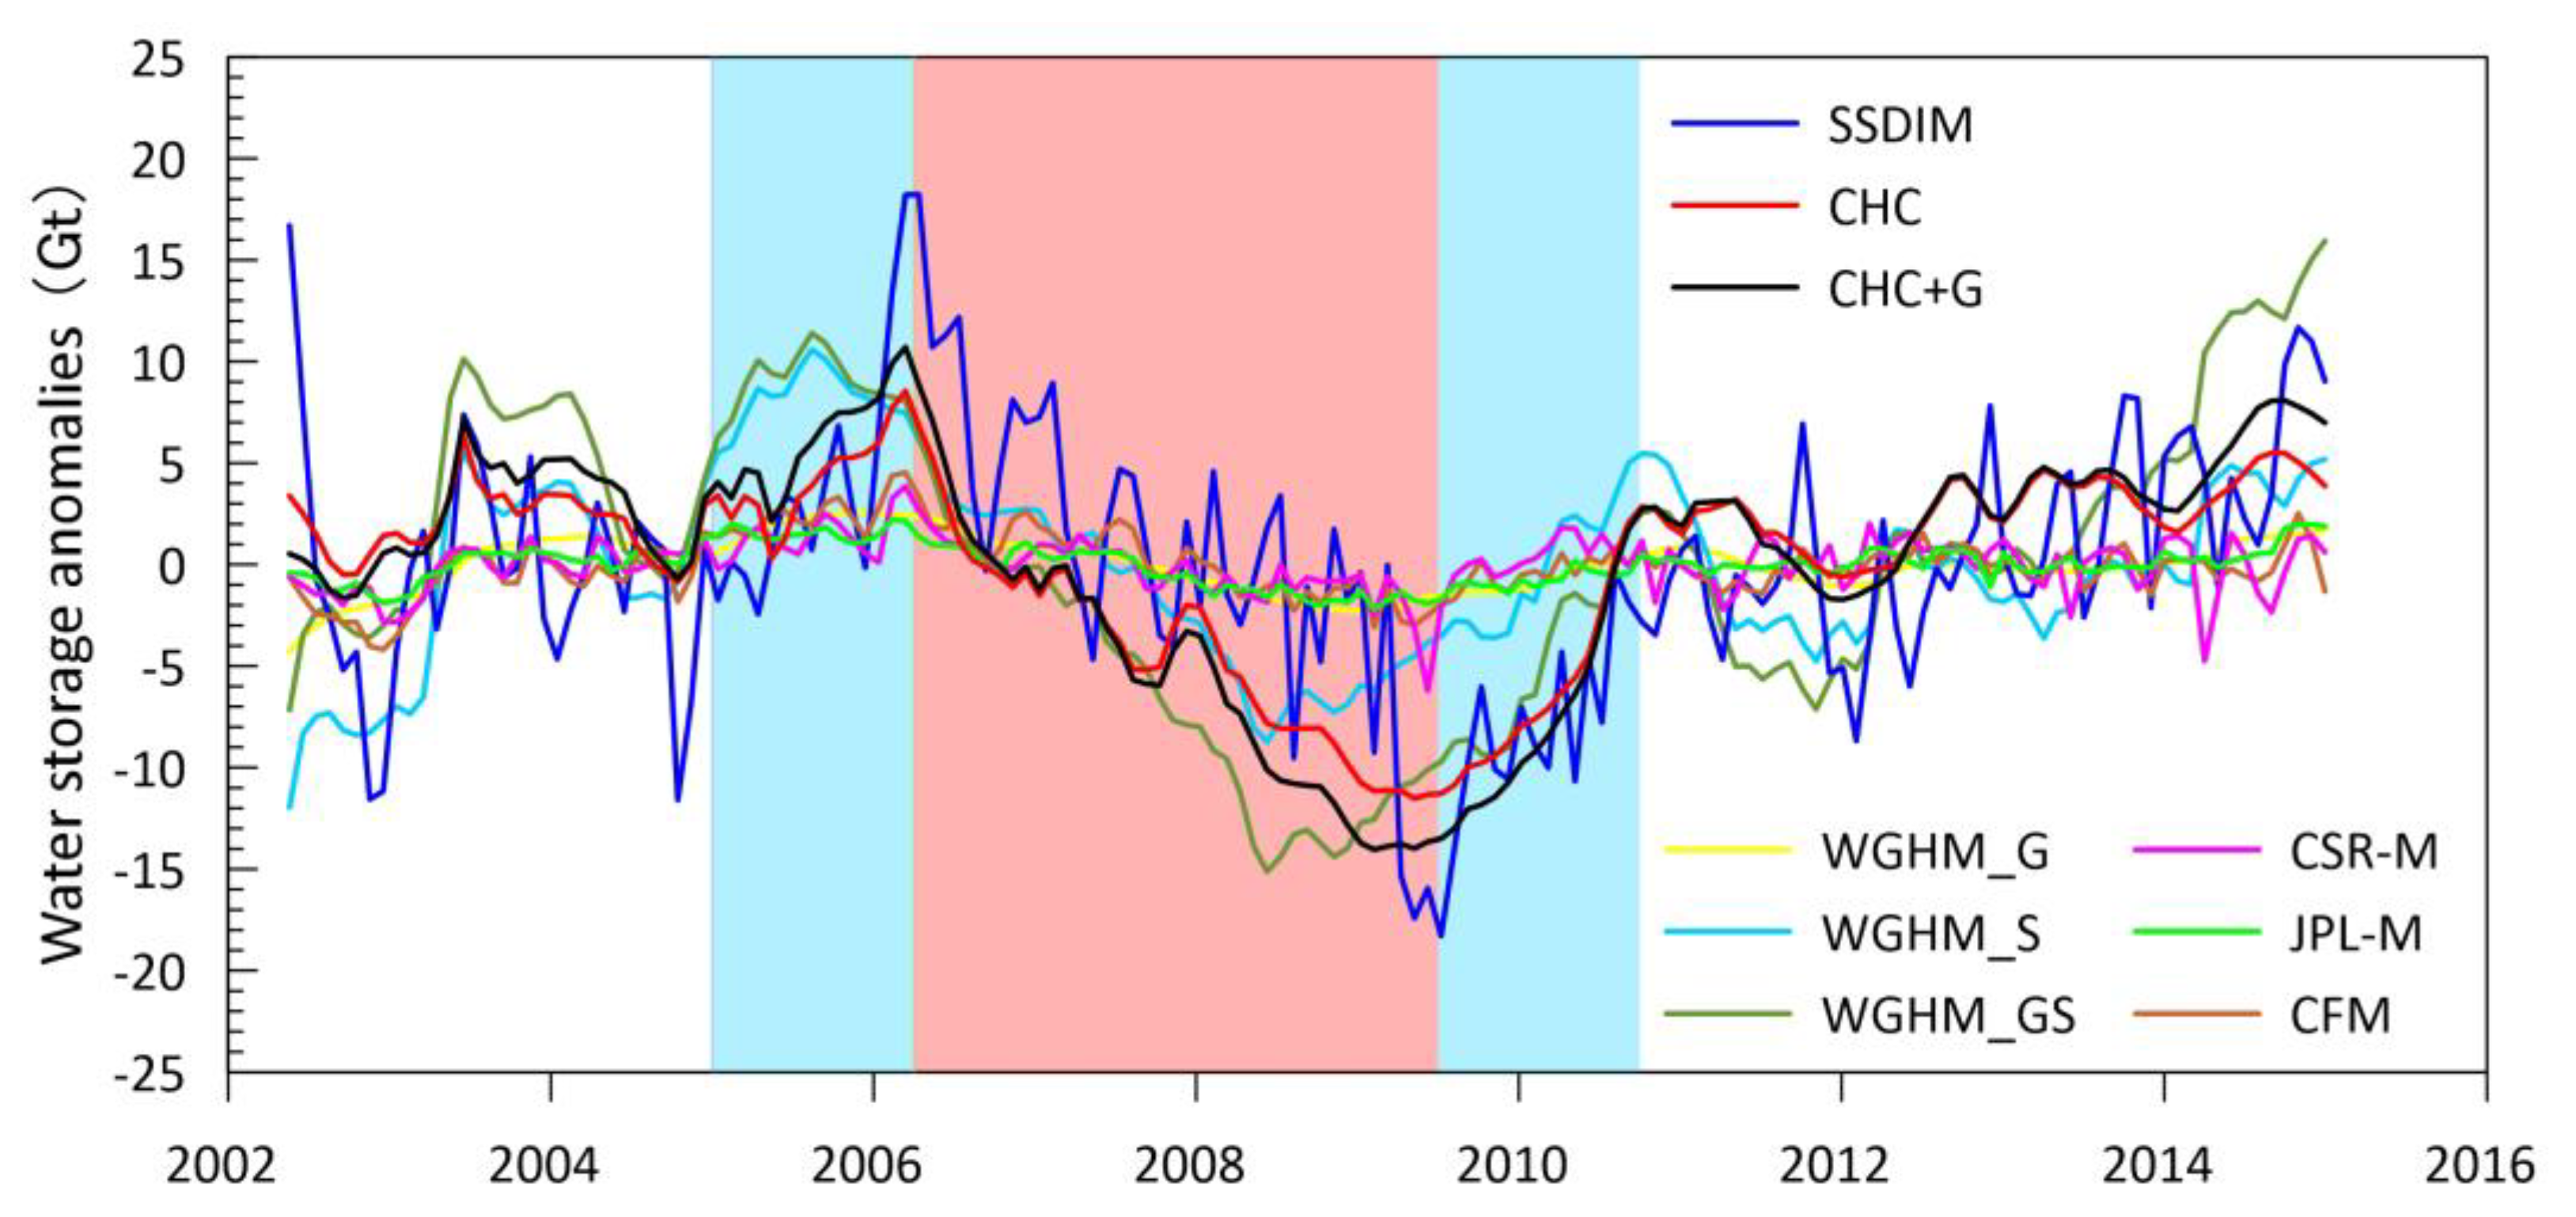
The interannual signals of the water storage components were extracted using least-square polynomial fitting [70]. The selection of the regression parameters was conducted using the hypothesis test and the information criteria [71]. After removing the annual and semi-annual terms, a good agreement was achieved between the time series of the water storage components’ variabilities derived from the SSDIM, CHC, and WGHM_S in Figure 8. We found that these time series exhibit more similar interannual variabilities after taking into account the simulated groundwater (CHC_G and WGHM_GS) produced by the SSDIM. It appears that the groundwater in the Aral Sea contributes to the changes in the interannual water storage, especially during extremely dry (from early 2006 to 2009) and humid periods (from 2005 to early 2006 and from mid-2009 to late-2010) in the Aral Sea. The SSDIM has more high-frequency variations compared to hydrological model outputs and the integration with the hypsometric curves. The smoothing filter was not applied to the post-processing of the SSDIM. In contrast, the water storage from the CFM and the mascon solutions exhibits small interannual fluctuations. During the periods of droughts and flooding, the difference between the SSDIM and the other three GRACE solutions is more obvious.
Moreover, the correlation coefficients and time lags between the interannual water storage components’ variations were determined using the cross-correlation function [72]:
ρ ( τ ) = i A ( t i τ ) B ( t i ) / [ i A ( t i ) 2 i B ( t i ) 2 ] 1 / 2 ,
where ρ ( τ ) is a function of the time shifts τ in the range of −1 to 1, which indicated the degree of linear correlation between time series A ( t ) and B ( t ) .
In fact, a high correlation coefficient does not fully dictate a significant correlation between the time series. It also depends on the degree of freedom (DOF) in the process [73]. Here, we used the Monte Carlo simulation to test the significance. The first-order autoregressive model was used to simulate the red noise sequence instead of the general white noise sequence. This is primarily because most geophysical and meteorological signals related to hydrological changes are closer to red noise and have significant autocorrelations [25]. If the general white noise sequence is used for the simulation, the degree of freedom of the statistics will be overestimated.
Table 2 shows that the JPL-M has the best correlation with the CHC, CHC_G, and WGHM outputs, and the SSDIM provides a slightly worse result than the JPL-M. However, in addition to the SSDIM and CFM, the mascon solutions’ correlations with the CHC, CHC+G, WGHM_G, and WGHM_GS did not all pass the 99% significance test. The CSR-M and CFM have the lowest correlation. This demonstrates that there is a significant linear correlation between the interannual change in the water storage from the SSDIM and that estimated from the CHC and WGHM outputs. The GRACE solutions compare well to each other, which is demonstrated by the correlation coefficients and the confidence test. This highlights that these solutions capture the hydrological responses consistently, even if their ability to quantify the water storage changes in small-scale basins like the Aral Sea varies significantly. There is a 2-month delay between the SSDIM and CHC. One reason for the lagged response of the water storage change in the CHC extraction is that the groundwater discharge/recharge in the Aral Sea is preferentially captured by the CHC based on the altimetry and remote sensing technology rather than by GRACE. Furthermore, the direct interpolation of the discontinuous monthly acquisition of the GRACE data preprocessing is also a possible cause of this delay. In addition, there is also a phase shift between the time series of the SSDIM estimation and the WGHM outputs, which may be related to the lack of sufficient water storage data [74].
These comparisons cross-validate the GRACE solutions, the CHC estimation, and the WGHM outputs. For the GRACE solutions evaluated above, the SSDIM is an effective post-processing strategy for retrieving the water storage changes of the Aral Sea. Unlike the estimation of the CHC, the GRACE-derived observations represent the total water storage, including both the lake water storage and the groundwater. With the aid of the groundwater component exported by the WGHM, our findings show that the groundwater in the Aral Sea affects the change in the interannual water storage, especially during the dry and humid periods. The huge groundwater discharge can be attributed to the decrease in the shallow aquifer pressure caused by the loss of surface water storage. However, based on the long-term trend of the Aral Sea water storage change, the estimation of the CHC (−3.91 ± 0.09 Gt/year) is consistent with that of the SSDIM considering various error sources (−4.78 ± 1.72 Gt/year). This shows that the decrease in the long-term water storage of the Aral Sea is dominated by surface storage, while the contribution of the groundwater is small. This finding is consistent with the results of Cretaux et al. (2013) [12]. Since the influence of the groundwater on the long-term water storage of the Aral Sea is small, the result from the CHC is able to provide two necessary prerequisites: Independent measurements and observation components almost equivalent to that of GRACE, and it verified the reliability of the SSDIM inversion in the Aral Sea.

4.2. The Impact of Human Interventions and Climate Change on the TWS in the Aral Sea Endorheic Basin

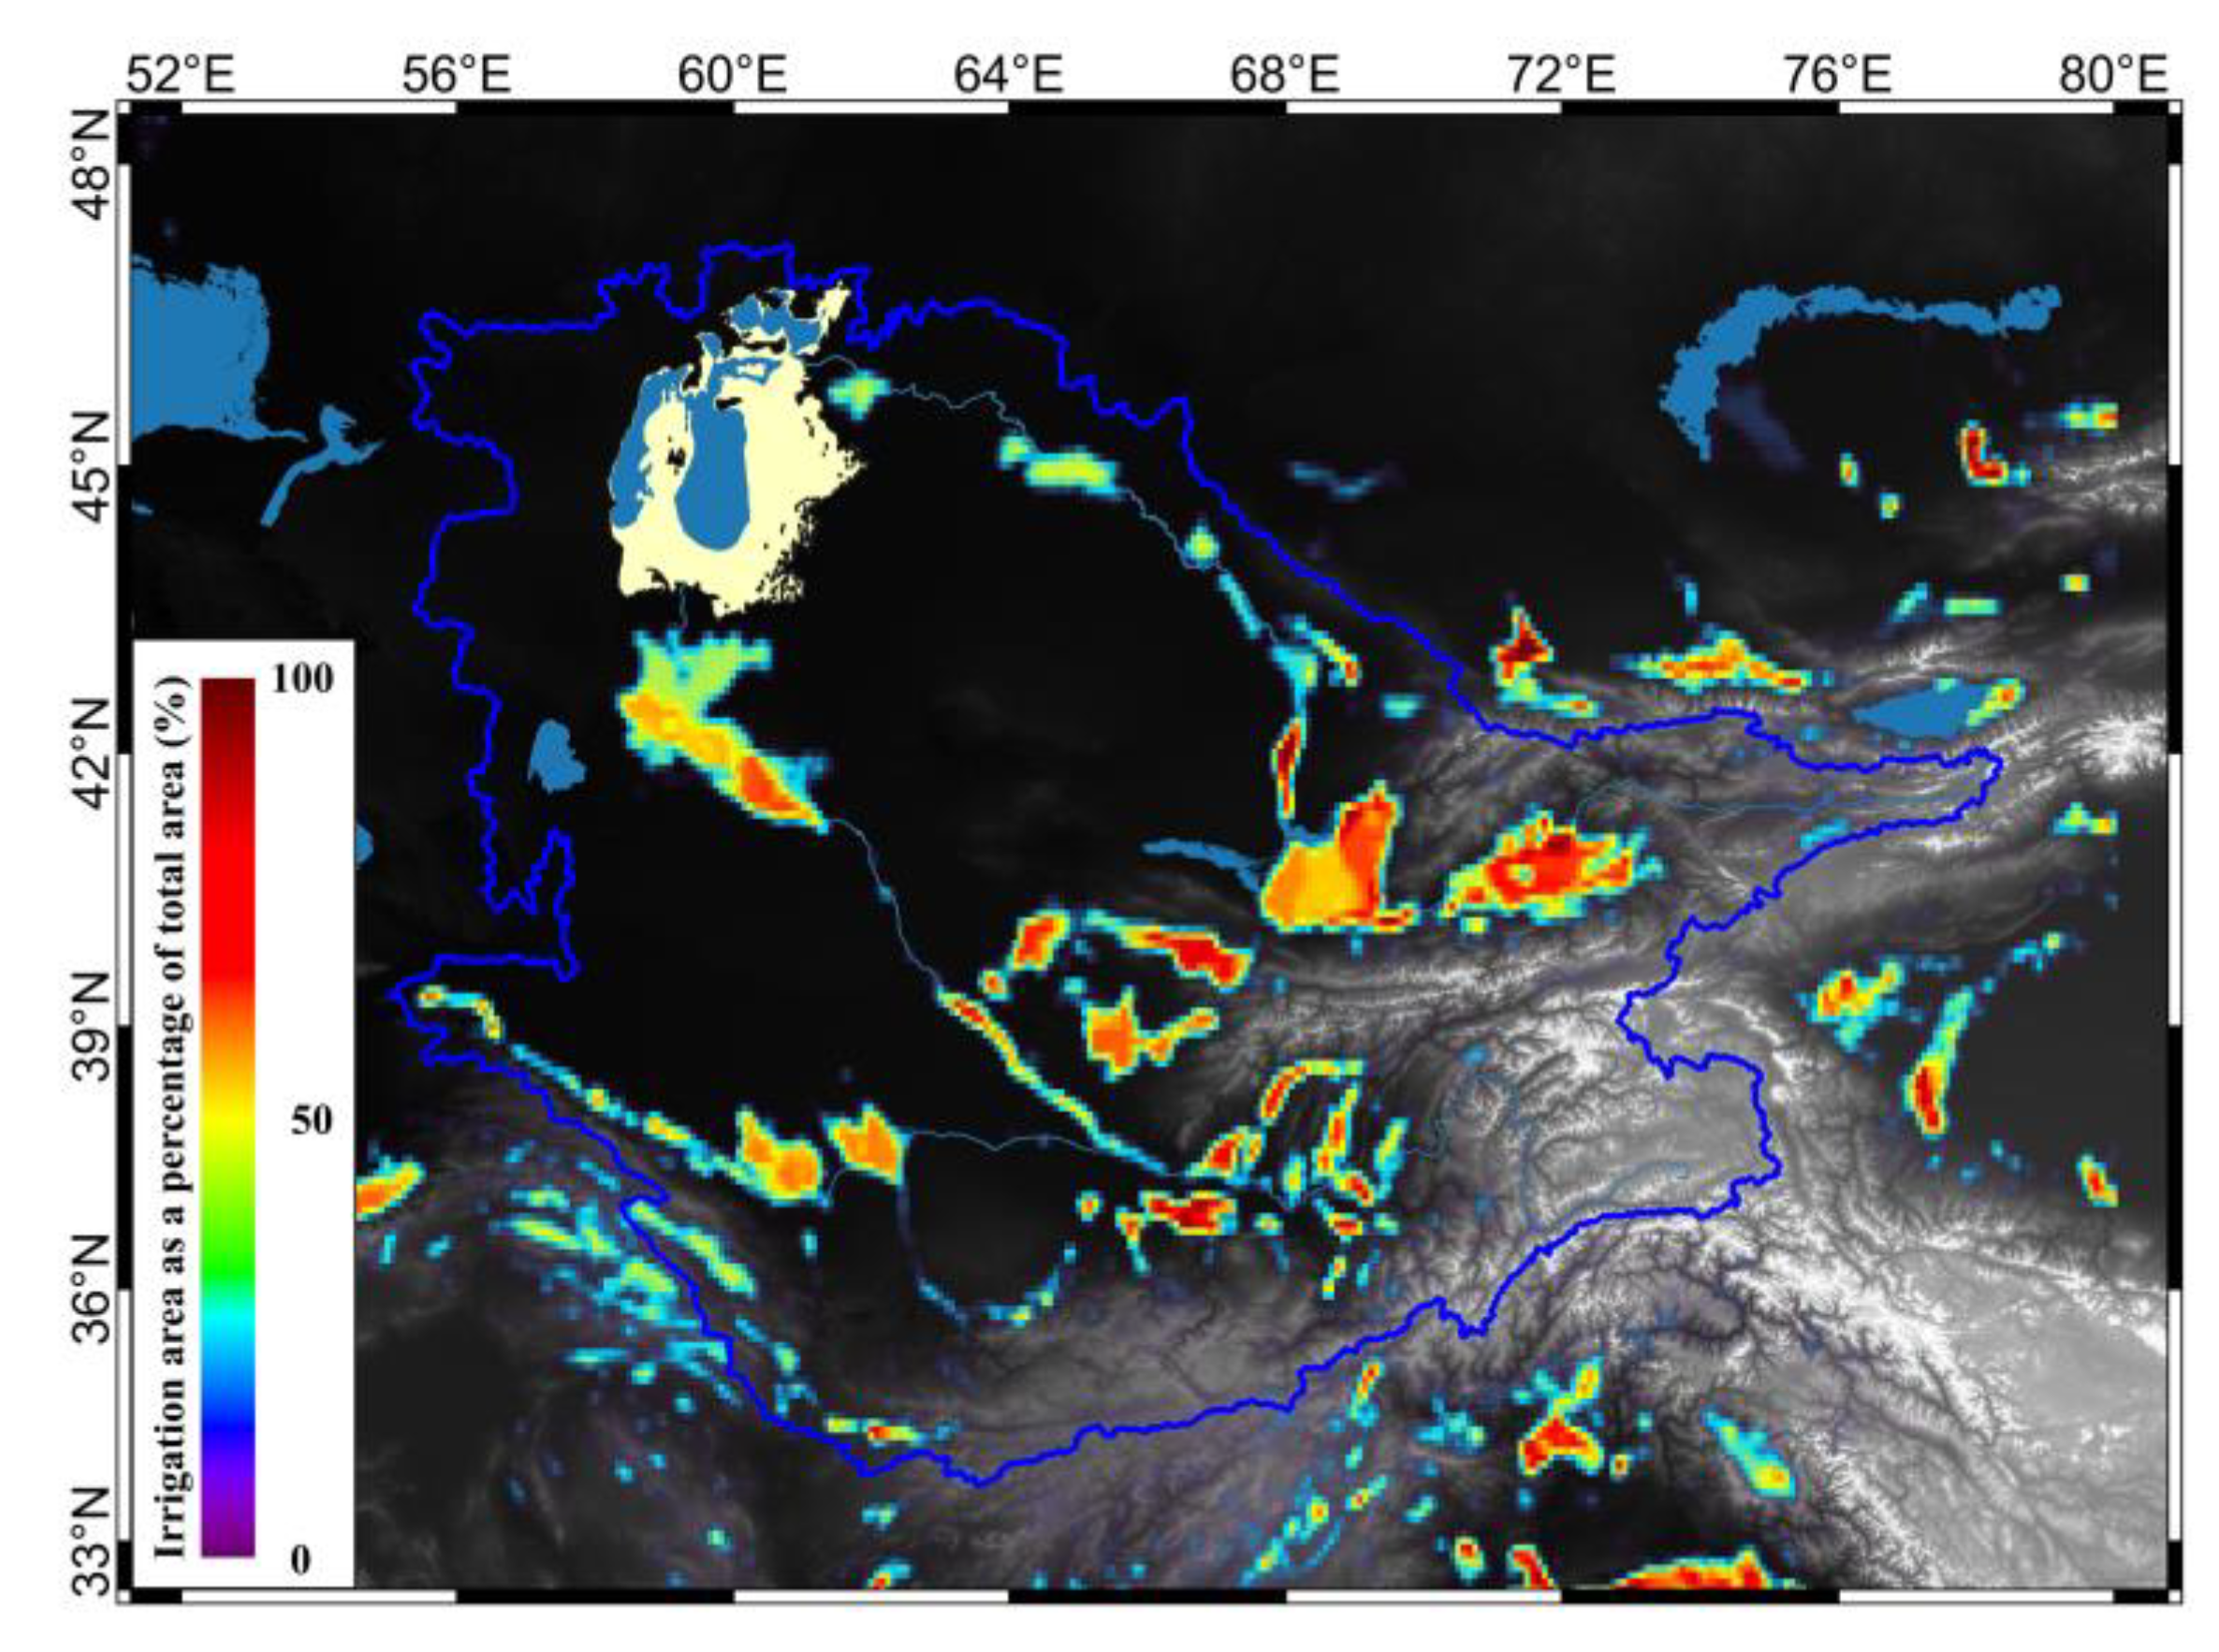
Due to the uneven spatiotemporal distribution of water resources, human interventions in the TWS are significant in the river basin. The desiccation of the Aral Sea is associated with the unsustainable expansion of irrigation in Kazakhstan and Uzbekistan [75]. Over the past half-century, the irrigation area has increased by 64% in this region, which has reduced the river inflow to the Aral Sea and has increased the groundwater withdrawal [76]. During the study period, the Aral Sea shrank at a rapid rate, and there is no sign that this decline will be curbed in the short term. As can be seen from Figure 9, the more intense irrigation areas are distributed in Eastern Uzbekistan and Tajikistan. The SSDIM shows a significant mass loss in this area. Similar patterns were obtained from the JPL-M and CFM solutions in Figure 5. As the headstream of the Amu Darya River, Tajikistan has abundant surface water. About 94% of the irrigation water consumption comes from surface water and only 4.4% from groundwater [77]. Unlike the countries upstream, Uzbekistan faces severe water scarcity, and nearly 99% of the approved groundwater has been used [78]. However, the efficiency of the agricultural irrigation in the basin is relatively low, drip irrigation, sprinkler irrigation, and micro sprinkler irrigation technologies have not been widely promoted, and a large amount of irrigation water is lost through evaporation [79]. In addition, the melting of glaciers also plays a central role in the mass loss in this area [80].
The construction of artificial canals, lakes, dams, and reservoirs is a great embodiment of human intervention in TWS. The Karakum Canal is a typical case. This artificial canal, which took more than 30 years to complete in stages, diverts water from the Amu Darya River into the Karakum Desert for irrigation. In order to speed up the construction time and reduce the cost, the canal was constructed in an unlined way. The entire irrigation hydrological network took 80% of the runoff from the Amu Darya with unconstrained seepage and evaporation in the desert [82]. Similarly, the artificial Altyn Asyr Lake project started in Tajikistan aims to resolve the problems of agriculture and economic development. During the period of 1970–2010, only 40 km3 of collector and drainage water were transferred into the lake, causing the lake to grow, and 82% of the water was evaporated and infiltrated from the lake and canals along the way [83]. In addition, previous studies have shown that the dam on the Amu Darya River not only regulates the river flow but also causes the aquifer to be fully recharged [84]. Combined with the end discharge of the Tedjen River and the Murghab River into the desert, these supplies are considerable. The consequences are consistent with the observations of the TWS from the GRACE data. Figure 5d shows a significant positive trend exists in the Karakum Desert. Since the huge amount of evaporation makes it difficult for surface water and vegetation to exist for a long time, groundwater recharging in the Karakum Desert is expected to be the primary reason for the increase in the TWS. Moreover, the groundwater flowing from east to west in the Karakum Desert causes the spatial pattern of the TWS growth to expand to the west [85]. Given the severe water shortage in the region, the recharge of the desert groundwater is an unreasonable water resources allocation. Furthermore, the unreasonable allocation of the water resource is also reflected in the artificial reservoir operations. According to the statistics, more than 80 water reservoirs have been constructed in the Aral Sea basin with water storage capacities of over 10 million km3 [77]. The discharge and storage of reservoirs located in different countries differ significantly. The upstream countries are cold in winter and need reservoir discharge to generate electricity. This has seriously affected the availability of water and the arrival time of the peak discharge in the downstream countries. As a result, the downstream countries have overexploited the water resources to meet their demands during the dry period.
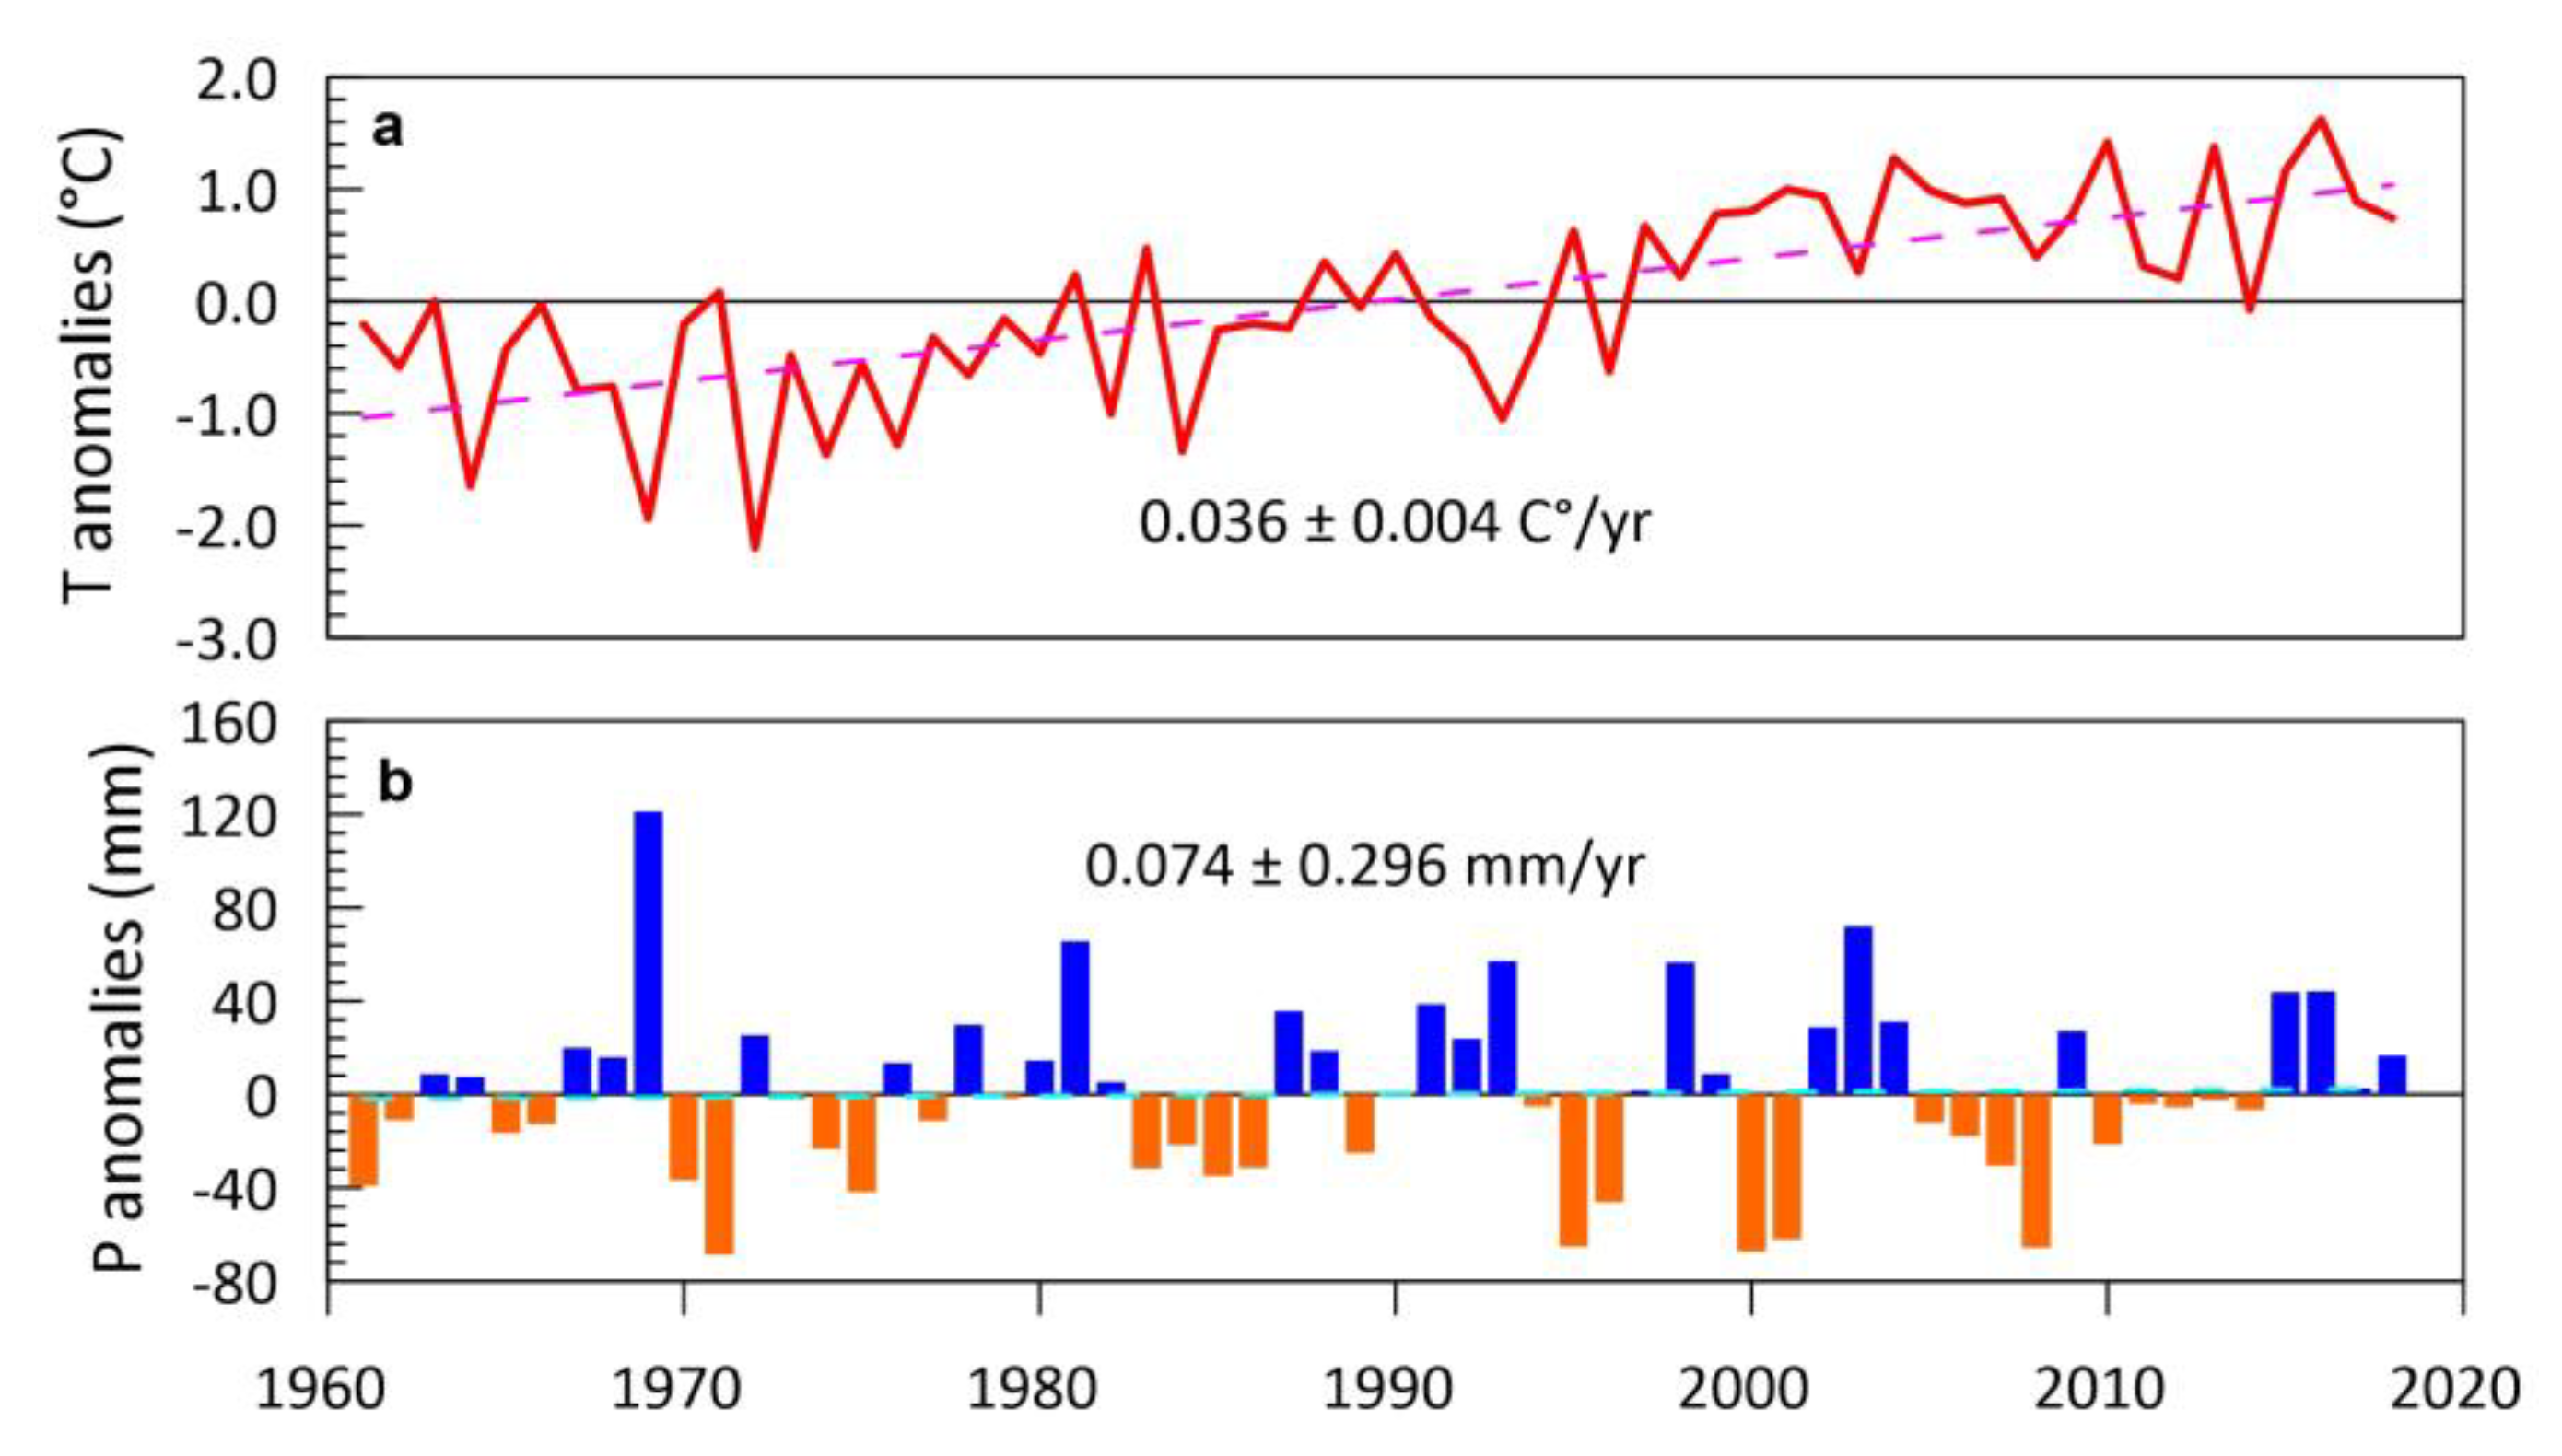
Climate change is expected to further affect the water supply and demand. From 1961 to 2018, the temperature increased by 0.36 °C per decade in the Aral Sea basin (Figure 10a). This is noticeably higher than the global rate. However, the increasing trend in precipitation is not obvious in Figure 10b. The trends in the temperature and precipitation changes had significant seasonal characteristics and regional variations during the study period. In Figure 11a, spring and summer are becoming hotter, and autumn and winter are becoming colder. At the junction of Tajikistan, Afghanistan, and Uzbekistan, which is an extensive agricultural irrigation area, the temperature is increasing year round, and the fastest speed can reach 1 °C per decade. The cooling trend in autumn is significant, and the average cooling trend in the basin is −0.65 °C per decade. The seasonal precipitation changes have been significantly more variable (Figure 11b). In the upper reaches of the Amu Darya and the Syr Darya, precipitation is decreasing in spring and winter with the fastest rate of about −14 mm per decade. Except for the significant increase in precipitation in spring in the local area, the increase in precipitation in the other seasons is very weak.
As stated above, such drier climatic features are becoming more common in the endorheic basin, especially in the last few decades, which leads to a decrease in the available surface water and an increase in the water demand on the middle and lower reaches of the Syr Darya and Amu Darya [86]. In order to meet the increasing demand for production and domestic water, the exploitation of groundwater is increasing continuously [87]. Moreover, the increasing temperature has triggered an accelerated ablation of mountain glaciers in the upper reaches (the Tien Shan and Pamir mountains) [80]. In the past, the optimistic view was that the melting of the upstream glaciers and perennial snow would prevent the deterioration of the gap between the water supply and demand as the temperature increased [88]. However, recent research has shown that the continuous melting of the glaciers increases the discharge of the rivers in the upper reaches, while the runoff in the middle and lower reaches is decreasing with the expansion of agriculture [89]. This poses a more serious challenge to the environmental restoration of the Aral Sea. More requirements need to be put in place for the management of transboundary water resources in the Aral Sea endorheic basin.

5. Conclusions

In this study, we demonstrated the success of the integration of a variety of satellite remote sensing data to establish the dynamic water volume in the Aral Sea from multiple dimensions. Independent observations of the long-term water storage trend of the Aral Sea based on the CHC and SSDIM agree well. By evaluating a variety of GRACE solutions (SSDIM, CFM, CSR-M, and JPL-M), we verified the ability of the SSDIM to reduce the GRACE leakage errors and recover signal attenuation in small-scale areas, such as the Aral Sea. Moreover, with the help of state-of-the-art hydrological models (WGHM), we conducted a qualitative analysis and determined that the groundwater in the Aral Sea affects the change in the interannual water storage, especially during extremely dry and humid periods, while surface storage dominates the shrinking of the Aral Sea based on the long-term water storage change.
Additionally, we investigated the temporal and spatial variations in the total water storage in the endorheic basin. The results indicate that anthropogenic interventions have modified the spatial pattern of the water storage and have caused unreasonable water allocation, especially in the Aral Sea and central Turkmenistan (the Karakum Desert). Furthermore, climate change has further exacerbated the shortage of available water in the middle and lower reaches. Overall, our results highlight the advantages of combining multisatellite data and models with an enhanced post-processing strategy to investigate hydrological regimes. The results of this study improve our understanding of the water storage variations in the Aral Sea and its endorheic basin.

Author Contributions

Conceptualization, D.T., H.S., and C.G.; methodology, D.T., H.S., C.G., J.Z., and X.K.; validation, D.T. and C.G.; data curation, D.T.; writing and original draft preparation, D.T.; writing, reviewing and editing, H.S. and C.G. All authors have read and agreed to the published version of the manuscript.

Funding

This research was funded by National Natural Science Foundation of China (grant 41874093, 41574073, 41604009, and 41674085).

Acknowledgments

The authors are grateful to different agencies for providing the various data sets, including to the USGS for the Landsat data; the ESA for ENVISAT and CryoSat-2 data; the DAHITI, GRLM and Hydroweb for water level data; the CSR for GRACE RL06 product and mascon solution; the JPL for GRACE RL06 product and mascon solution; NASA Goddard Earth Science Data and Information Services Center for the GLDAS/Noah outputs; NOAA’s Earth System Research Laboratory for NCEP/NCAR, GHCN_CAMS, PREC/L, and GPCC data; the Climatic Research Unit (CRU) for the CRU TS4.03 data. We also wish to thank Zizhan Zhang for kindly providing WGHM output data.

Conflicts of Interest

The authors declare no conflicts of interest.

Appendix A

Figure A1. Time series of the annual temperature (right axis) and precipitation (left axis) changes in the endorheic basin.
Remotesensing 12 02408 g0a1
Figure A2. Calibrated hypsometric curves of the Aral Sea’s four water bodies. (a) Tchebas Bay; (b) the North Aral Sea; (c) the West Aral Sea; (d) the East Aral Sea.
Remotesensing 12 02408 g0a2
Figure A3. Water level time series of the Aral Sea from this study, DAHITI, GRLM, and Hydroweb. (a) Tchebas Bay; (b) the North Aral Sea; (c) the West Aral Sea; (d) the East Aral Sea.
Remotesensing 12 02408 g0a3
Figure A4. (a) The tracks of the Jason-series satellites (blue) and the CryoSat-2 (red) over the EAS. (b) CryoSat-2 SARIn waveforms along the track (pass through time: 7 August 2014).
Remotesensing 12 02408 g0a4

References

  1. Micklin, P. Desiccation of the Aral Sea, a water management disaster in the Soviet Union. Science 1988, 241, 1170–1176. [Google Scholar] [CrossRef] [PubMed] [Green Version]
  2. Sahagian, D.L.; Schwartz, F.W.; Jacobs, D.K. Direct anthropogenic contributions to sea level rise in the twentieth century. Nature 1994, 367, 54–57. [Google Scholar] [CrossRef]
  3. Micklin, P.P.; Williams, W.D. Climatic and Hydrologic Changes Around the Aral Sea. In The Aral Sea Basin; Springer: Berlin/Heidelberg, Germany, 1996; Volume 12. [Google Scholar]
  4. Punkari, M.; Droogers, P.; Immerzeel, W.; Korhonen, N.; Lutz, A.; Venäläinen, A. Climate Change and Sustainable Water Management in Central Asia. Available online: https://www.adb.org/publications/climate-change-and-sustainable-water-management-central-asia (accessed on 14 December 2019).
  5. Micklin, P. The past, present, and future Aral Sea. Lakes Reserv. Res. Manag. 2010, 15, 193–213. [Google Scholar] [CrossRef]
  6. Belyaev, A.V. Water Balance and Water Resources of the Aral Sea Basin and Its Man-Induced Changes. GeoJournal 1995, 35, 17–21. [Google Scholar] [CrossRef]
  7. Small, E.E.; Sloan, L.C.; Hostetler, S.; Giorgi, F. Simulating the water balance of the Aral Sea with a coupled regional climate-lake model. J. Geophys. Res. 1999, 104, 6583–6602. [Google Scholar] [CrossRef]
  8. Deng, H.; Chen, Y. Influences of recent climate change and human activities on water storage variations in Central Asia. J. Hydrol. 2017, 544, 46–57. [Google Scholar] [CrossRef]
  9. Kes’, A.; Klyukanova, I. Causes of Aral Sea level variations in the past. Sov. Geogr. 1990, 31, 602–612. [Google Scholar] [CrossRef]
  10. Micklin, P. The Aral Sea Disaster. Annu. Rev. Earth Planet. Sci. 2007, 35, 47–72. [Google Scholar] [CrossRef] [Green Version]
  11. Aladin, N.V.; Plotnikov, I.S.; Potts, W. The Aral Sea desiccation and possible ways of rehabilitating and conserving its Northern part. Environmetrics 1995, 6, 17–29. [Google Scholar] [CrossRef]
  12. Cretaux, J.-F.; Letolle, R.; Bergé-Nguyen, M. History of Aral Sea level variability and current scientific debates. Glob. Planet. Chang. 2013, 110, 99–113. [Google Scholar] [CrossRef]
  13. Birkett, C.M. The contribution of TOPEX/POSEIDON to the global monitoring of climatically sensitive lakes. J. Geophys. Res. Ocean. 1995, 100, 25179–25204. [Google Scholar] [CrossRef]
  14. Crétaux, J.F.; Jelinski, W.; Calmant, S.; Kouraev, A.; Vuglinski, V.; Bergé-Nguyen, M.; Gennero, M.C.; Nino, F.; Abarca Del Rio, R.; Cazenave, A.; et al. SOLS: A lake database to monitor in the Near Real Time water level and storage variations from remote sensing data. Adv. Space Res. 2011, 47, 1497–1507. [Google Scholar] [CrossRef]
  15. Singh, A.; Seitz, F.; Schwatke, C. Inter-annual Water Storage Changes in the Aral Sea from Multi-mission Satellite Altimetry, Optical Remote Sensing, and GRACE Satellite Gravimetry. Remote Sens. Environ. 2012, 123, 187–195. [Google Scholar] [CrossRef]
  16. Schwatke, C.; Dettmering, D.; Bosch, W.; Seitz, F. DAHITI – an innovative approach for estimating water level time series over inland waters using multi-mission satellite altimetry. Hydrol. Earth Syst. Sci. 2015, 19, 4345–4364. [Google Scholar] [CrossRef] [Green Version]
  17. Kravtsova, V. The Aral Sea and coastal zone degradation: Monitoring by space images. In Proceedings of the 31st International Symposium on Remote Sensing of Environment, Saint Petersburg, Russia, 20–24 May 2005. [Google Scholar]
  18. Yang, X.; Wang, N.; He, J.; Hua, T.; Qie, Y. Changes in area and water volume of the Aral Sea in the arid Central Asia over the period of 1960–2018 and their causes. CATENA 2020, 191, 104566. [Google Scholar] [CrossRef]
  19. Shi, W.; Wang, M.; Guo, W. Long-term hydrological changes of the Aral Sea observed by satellites. J. Geophys. Res. Ocean. 2014, 119, 3313–3326. [Google Scholar] [CrossRef]
  20. Sun, F.; Ma, R. Hydrologic changes of Aral Sea: A reveal by the combination of radar altimeter data and optical images. Ann. GIS 2019, 25, 247–261. [Google Scholar] [CrossRef] [Green Version]
  21. Singh, A.; Behrangi, A.; Fisher, J.B.; Reager, J.T. On the Desiccation of the South Aral Sea Observed from Spaceborne Missions. Remote Sens-Basel 2018, 10, 793. [Google Scholar] [CrossRef] [Green Version]
  22. Wang, J.D.; Song, C.Q.; Reager, J.T.; Yao, F.F.; Famiglietti, J.S.; Sheng, Y.W.; MacDonald, G.M.; Brun, F.; Schmied, H.M.; Marston, R.A.; et al. Recent global decline in endorheic basin water storages. Nat. Geosci. 2018, 11, 926–932. [Google Scholar] [CrossRef] [Green Version]
  23. Dapeng, M.; Zhongchang, S.; Jinyun, G. Estimating continental water storage variations in Central Asia area using GRACE data. IOP Conf. Ser. Earth Environ. Sci. 2014, 17, 1–6. [Google Scholar] [CrossRef]
  24. Zmijewski, K.; Becker, R. Estimating the effects of anthropogenic modification on water balance in the Aral Sea watershed using GRACE: 2003–12. Earth Interact. 2014, 18, 1–16. [Google Scholar] [CrossRef]
  25. Gao, C.C.; Lu, Y.; Shi, H.L. Detection and analysis of ice sheet mass changes over 27 Antarctic drainage systems from GRACE RL06 data. Chin. J. Geophys. Chin. 2019, 62, 864–882. [Google Scholar]
  26. Gao, C.C. Theory, Method and Application for Detecting Antarctic Ice Sheet Mass Balance from Time-variable Gravity Measurements; The University of Chinese Academy of Sciences: Wuhan, China, 2015. [Google Scholar]
  27. Wahr, J.; Molenaar, M.; Bryan, F. Time variability of the Earth’s gravity field: Hydrological and oceanic effects and their possible detection using GRACE. J. Geophys. Res. Solid Earth 1998, 103, 30205–30229. [Google Scholar] [CrossRef]
  28. Swenson, S.; Wahr, J. Post-processing removal of correlated errors in GRACE data. Geophys. Res. Lett 2006, 33, 1–4. [Google Scholar] [CrossRef]
  29. Save, H.; Bettadpur, S.; Tapley, B.D. High-resolution CSR GRACE RL05 mascons. J. Geophys. Res. Solid Earth 2016, 121, 7547–7569. [Google Scholar] [CrossRef]
  30. Wiese, D.N.; Landerer, F.W.; Watkins, M.M. Quantifying and reducing leakage errors in the JPL RL05M GRACE mascon solution. Water Resour. Res. 2016, 52, 7490–7502. [Google Scholar] [CrossRef]
  31. Yin, G.; Mariethoz, G.; McCabe, M. Gap-Filling of Landsat 7 Imagery Using the Direct Sampling Method. Remote Sens-Basel 2016, 9, 12. [Google Scholar] [CrossRef] [Green Version]
  32. Zanter, K. Landsat 8 (L8) Data Users Handbook. Available online: https://www.usgs.gov/land-resources/nli/landsat/landsat-8-data-users-handbook (accessed on 20 January 2019).
  33. Xu, H. Modification of normalised difference water index (NDWI) to enhance open water features in remotely sensed imagery. Int. J. Remote Sens 2007, 27, 3025–3033. [Google Scholar] [CrossRef]
  34. Soussi, B. Envisat Altimetry Level 2 Product Handbook. Available online: https://earth.esa.int/documents/700255/3528455/PH_light_2rev0_ESA.pdf/ (accessed on 13 December 2019).
  35. Bouzinac, C. CryoSat Product Handbook. Available online: https://earth.esa.int/documents/10174/125272/CryoSat-Baseline-C-Product-Handbook (accessed on 12 December 2019).
  36. Frappart, F.D.R.; Calmant, S.P.; Cauhope’, M.; Seyler, F.D.R.; Cazenave, A. Preliminary results of ENVISAT RA-2-derived water levels validation over the Amazon basin. Remote Sens Environ. 2006, 100, 252–264. [Google Scholar] [CrossRef] [Green Version]
  37. Medina, C.E.; Gomez-Enri, J.; Alonso, J.J.; Villares, P. Water level fluctuations derived from ENVISAT Radar Altimeter (RA-2) and in-situ measurements in a subtropical waterbody: Lake Izabal (Guatemala). Remote Sens Environ. 2008, 112, 3604–3617. [Google Scholar] [CrossRef]
  38. Costa, P.H.; Oliveira Pereira, E.; Maillard, P. An Original Processing Method of Satellite Altimetry for Estimating Water Levels and Volume Fluctuations in a Series of Small Lakes of the Pantanal Wetland Complex in Brazil. Int. Arch. Photogramm. Remote Sens. Spat. Inf. Sci. 2016, 41, 327–334. [Google Scholar] [CrossRef]
  39. Jain, M.; Andersen, O.B.; Dall, J.; Stenseng, L. Sea surface height determination in the Arctic using Cryosat-2 SAR data from primary peak empirical retrackers. Adv. Space Res. 2015, 55, 40–50. [Google Scholar] [CrossRef]
  40. Zwally, H.J.; Giovinetto, M.B.; Li, J.; Cornejo, H.G.; Beckley, M.A.; Brenner, A.C.; Saba, J.L.; Yi, D. Mass changes of the Greenland and Antarctic ice sheets and shelves and contributions to sea-level rise: 1992–2002. J. Glaciol. 2005, 51, 509–521. [Google Scholar] [CrossRef] [Green Version]
  41. Crétaux, J.-F.; Calmant, S.; Romanovski, V.; Shabunin, A.; Lyard, F.; Bergé-Nguyen, M.; Cazenave, A.; Hernandez, F.; Perosanz, F. An absolute calibration site for radar altimeters in the continental domain: Lake Issykkul in Central Asia. J. Geod. 2008, 83, 723–735. [Google Scholar] [CrossRef]
  42. Khvorostovsky, K.S. Merging and Analysis of Elevation Time Series Over Greenland Ice Sheet From Satellite Radar Altimetry. IEEE T Geosci Remote 2012, 50, 23–36. [Google Scholar] [CrossRef]
  43. Sørensen, L.S.; Simonsen, S.B.; Forsberg, R.; Khvorostovsky, K.; Meister, R.; Engdahl, M.E. 25 years of elevation changes of the Greenland Ice Sheet from ERS, Envisat, and CryoSat-2 radar altimetry. Earth Planet. Sci. Lett. 2018, 495, 234–241. [Google Scholar] [CrossRef]
  44. Villadsen, H.; Andersen, O.B.; Stenseng, L.; Nielsen, K.; Knudsen, P. CryoSat-2 altimetry for river level monitoring—Evaluation in the Ganges-Brahmaputra River basin. Remote Sens Environ. 2015, 168, 80–89. [Google Scholar] [CrossRef]
  45. Håkanson, L. On lake form, lake volume and lake hypsographic survey. Geogr. Ann. Ser. A Phys. Geogr. 1977, 59, 1–30. [Google Scholar] [CrossRef]
  46. Swenson, S.; Wahr, J. Methods for inferring regional surface-mass anomalies from Gravity Recovery and Climate Experiment (GRACE) measurements of time-variable gravity. J. Geophys. Res. Solid Earth 2002, 107, ETG 3-1-ETG 3-13. [Google Scholar] [CrossRef] [Green Version]
  47. Watkins, M.M.; Wiese, D.N.; Yuan, D.N.; Boening, C.; Landerer, F.W. Improved methods for observing Earth’s time variable mass distribution with GRACE using spherical cap mascons. J. Geophys. Res. Solid Earth 2015, 120, 2648–2671. [Google Scholar] [CrossRef]
  48. Longuevergne, L.; Scanlon, B.R.; Wilson, C.R. GRACE Hydrological estimates for small basins: Evaluating processing approaches on the High Plains Aquifer, USA. Water Resour. Res. 2010, 46, 11517. [Google Scholar] [CrossRef]
  49. Wiese, D.N.; Nerem, R.S.; Han, S.C. Expected improvements in determining continental hydrology, ice mass variations, ocean bottom pressure signals, and earthquakes using two pairs of dedicated satellites for temporal gravity recovery. J. Geophys. Res. Solid Earth 2011, 116, 1–17. [Google Scholar] [CrossRef]
  50. Rateb, A.; Kuo, C.; Imani, M.; Tseng, K.H.; Lan, W.H.; Ching, K.; Tseng, T.P. Terrestrial Water Storage in African Hydrological Regimes Derived from GRACE Mission Data: Intercomparison of Spherical Harmonics, Mass Concentration, and Scalar Slepian Methods. Sensors 2017, 17, 566. [Google Scholar] [CrossRef] [PubMed] [Green Version]
  51. Simons, F.J.; Dahlen, F.A.; Wieczorek, M.A. Spatiospectral Concentration on a Sphere. Siam Rev. 2006, 48, 504–536. [Google Scholar] [CrossRef] [Green Version]
  52. Yi, S.; Sun, W.K. Evaluation of glacier changes in high-mountain Asia based on 10 year GRACE RL05 models. J. Geophys. Res. Solid Earth 2014, 119, 2504–2517. [Google Scholar] [CrossRef]
  53. A, G.; Wahr, J.; Zhong, S. Computations of the viscoelastic response of a 3-D compressible Earth to surface loading: An application to Glacial Isostatic Adjustment in Antarctica and Canada. Geophys. J. Int. 2012, 192, 557–572. [Google Scholar] [CrossRef]
  54. Feng, W.; Shum, C.; Zhong, M.; Pan, Y. Groundwater storage changes in China from satellite gravity: An overview. Remote Sens-Basel 2018, 10, 674. [Google Scholar] [CrossRef] [Green Version]
  55. Rodell, M.; Houser, P.; Jambor, U.; Gottschalck, J.; Mitchell, K.; Meng, C.-J.; Arsenault, K.; Cosgrove, B.; Radakovich, J.; Bosilovich, M. The global land data assimilation system. B Am. Meteorol. Soc. 2004, 85, 381–394. [Google Scholar] [CrossRef] [Green Version]
  56. Döll, P.; Kaspar, F.; Lehner, B. A global hydrological model for deriving water availability indicators: Model tuning and validation. J. Hydrol. 2003, 270, 105–134. [Google Scholar] [CrossRef]
  57. Döll, P.; Fiedler, K. Global-scale modeling of groundwater recharge. Hydrol. Earth Syst. Sci. Discuss. 2007, 4, 4069–4124. [Google Scholar] [CrossRef] [Green Version]
  58. Döll, P.; Mueller Schmied, H.; Schuh, C.; Portmann, F.T.; Eicker, A. Global-scale assessment of groundwater depletion and related groundwater abstractions: Combining hydrological modeling with information from well observations and GRACE satellites. Water Resour. Res. 2014, 50, 5698–5720. [Google Scholar] [CrossRef]
  59. Müller Schmied, H.; Eisner, S.; Franz, D.; Wattenbach, M.; Portmann, F.T.; Flörke, M.; Döll, P. Sensitivity of simulated global-scale freshwater fluxes and storages to input data, hydrological model structure, human water use and calibration. Hydrol. Earth Syst. Sci. 2014, 18, 3511–3538. [Google Scholar] [CrossRef] [Green Version]
  60. Birkett, C.; Reynolds, C.; Beckley, B.; Doorn, B. From Research to Operations: The USDA Global Reservoir and Lake Monitor; Springer: Berlin/Heidelberg, Germany, 2011; pp. 19–50. [Google Scholar] [CrossRef]
  61. Kalnay, E.; Kanamitsu, M.; Kistler, R.; Collins, W.; Deaven, D.; Gandin, L.; Iredell, M.; Saha, S.; White, G.; Woollen, J.; et al. The NCEP/NCAR 40-year reanalysis project. B Am. Meteorol. Soc. 1996, 77, 437–471. [Google Scholar] [CrossRef] [Green Version]
  62. Fan, Y.; van den Dool, H. A global monthly land surface air temperature analysis for 1948–present. J. Geophys. Res. 2008, 113, 1–18. [Google Scholar] [CrossRef]
  63. Harris, I.; Osborn, T.J.; Jones, P.; Lister, D. Version 4 of the CRU TS monthly high-resolution gridded multivariate climate dataset. Sci. Data 2020, 7, 1–18. [Google Scholar] [CrossRef] [PubMed] [Green Version]
  64. Chen, M.Y.; Xie, P.P.; Janowiak, J.E.; Arkin, P.A. Global land precipitation: A 50-yr monthly analysis based on gauge observations. J. Hydrometeorol. 2002, 3, 249–266. [Google Scholar] [CrossRef]
  65. Schneider, U.; Finger, P.; Meyer-Christoffer, A.; Rustemeier, E.; Ziese, M.; Becker, A. Evaluating the Hydrological Cycle over Land Using the Newly-Corrected Precipitation Climatology from the Global Precipitation Climatology Centre (GPCC). Atmosphere 2017, 8, 52. [Google Scholar] [CrossRef] [Green Version]
  66. Luthcke, S.B.; Arendt, A.A.; Rowlands, D.D.; McCarthy, J.J.; Larsen, C.F. Recent glacier mass changes in the Gulf of Alaska region from GRACE mascon solutions. J. Glaciol. 2008, 54, 767–777. [Google Scholar] [CrossRef] [Green Version]
  67. Scanlon, B.R.; Zhang, Z.; Save, H.; Wiese, D.N.; Landerer, F.W.; Long, D.; Longuevergne, L.; Chen, J. Global evaluation of new GRACE mascon products for hydrologic applications. Water Resour. Res. 2016, 52, 9412–9429. [Google Scholar] [CrossRef]
  68. Zhang, L.; Yi, S.; Wang, Q.; Chang, L.; Tang, H.; Sun, W. Evaluation of GRACE mascon solutions for small spatial scales and localized mass sources. Geophys. J. Int. 2019, 218, 1307–1321. [Google Scholar] [CrossRef]
  69. Wang, J.; Sheng, Y.; Wada, Y. Little impact of the Three Gorges Dam on recent decadal lake decline across China’s Yangtze Plain. Water Resour. Res. 2017, 53, 3854–3877. [Google Scholar] [CrossRef] [Green Version]
  70. Fong Chao, B. Interannual length-of-day variation with relation to the southern oscillation/El Nino. Geophys. Res. Lett. 1984, 11, 541–544. [Google Scholar] [CrossRef] [Green Version]
  71. Baur, O. On the computation of mass-change trends from GRACE gravity field time-series. J. Geodyn 2012, 61, 120–128. [Google Scholar] [CrossRef]
  72. Jenkins, G.M.; Watts, D.G. Spectral Analysis and Its Applications; Holden Day Inc: San Francisco, CA, USA, 1968. [Google Scholar]
  73. Chao, B.; Chung, C. On Estimating the Cross Correlation and Least Squares Fit of One Data Set to Another With Time Shift. Earth Space Sci. 2019, 6, 1409–1415. [Google Scholar] [CrossRef]
  74. Döll, P.; Fritsche, M.; Eicker, A.; Schmied, H.M. Seasonal water storage variations as impacted by water abstractions: Comparing the output of a global hydrological model with GRACE and GPS observations. Surv. Geophys. 2014, 35, 1311–1331. [Google Scholar] [CrossRef]
  75. Cretaux, J.F.; Kostianoy, A.G.; Bergé-Nguyen, M.; Kouraev, A. Present-Day Water Balance of the Aral Sea Seen from Satellite; Barale, V., Gade, M., Eds.; Springer: Cham, Switzerland, 2019. [Google Scholar] [CrossRef]
  76. Micklin, P. The future Aral Sea: Hope and despair. Environ. Earth Sci. 2016, 75, 844. [Google Scholar] [CrossRef]
  77. Frenken, K. Irrigation in Central Asia in figures AQUASTAT Survey-2012; Food and Agriculture Organization of the United Nations: Rome, Italy, 2013; Volume 39. [Google Scholar]
  78. Rakhmatullaev, S.; Huneau, F.d.r.; Kazbekov, J.; Le Coustumer, P.; Jumanov, J.; El Oifi, B.; Motelica-Heino, M.; Hrkal, Z. Groundwater resources use and management in the Amu Darya river basin (Central Asia). Environ. Earth Sci. 2010, 59, 1183. [Google Scholar] [CrossRef] [Green Version]
  79. Bekchanov, M.; Ringler, C.; Bhaduri, A.; Jeuland, M. Optimizing irrigation efficiency improvements in the Aral Sea Basin. Water Resour. Econ. 2016, 13, 30–45. [Google Scholar] [CrossRef]
  80. Brun, F.; Berthier, E.; Wagnon, P.; Kääb, A.; Treichler, D. A spatially resolved estimate of High Mountain Asia glacier mass balances from 2000 to 2016. Nat. Geosci. 2017, 10, 668–673. [Google Scholar] [CrossRef]
  81. Siebert, S.; Henrich, V.; Frenken, K.; Burke, J. Update of the Digital Global Map of Irrigation Areas to Version 5; Rheinische Friedrich-Wilhelms-Universität, Bonn, Germany and Food and Agriculture Organization of the United Nations: Rome, Italy, 2013. [Google Scholar]
  82. Jappar, M.; Tursunov, A.A. The Aral Sea disaster, an inland lake in Central Asia; Xinjiang Science & Medical Publishing House: Urumqi, China, 1996; Volume 115. (In Chinese) [Google Scholar]
  83. Pyagay, E.T. Forecast of the Water–Salt Balance in the Turkmen Lake Altyn Asyr; Zonn, I.S., Kostianoy, A.G., Eds.; Springer: Berlin/Heidelberg, Germany, 2013; Volume 28. [Google Scholar]
  84. Saiko, T.A.; Zonn, I.S. Irrigation expansion and dynamics of desertification in the Circum-Aral region of Central Asia. Appl. Geogr. 2000, 20, 349–367. [Google Scholar] [CrossRef]
  85. Esenov, P.E. Groundwaters and Salinization of Soils in Turkmenistan; Springer: Berlin/Heidelberg, Germany, 2013; pp. 141–150. ISBN 978-3-642-38606-0. [Google Scholar]
  86. Siegfried, T.; Bernauer, T.; Guiennet, R.; Sellars, S.; Robertson, A.W.; Mankin, J.; Bauer-Gottwein, P.; Yakovlev, A. Will climate change exacerbate water stress in Central Asia? Clim. Chang. 2012, 112, 881–899. [Google Scholar] [CrossRef]
  87. Liu, Y.; Cheng, Y.; Ge, L. Analysis on exploitation status, potential and strategy of groundwater resources in the five countries of Central Asia. J. Groundw. Sci. Eng. 2018, 6, 49–57. [Google Scholar]
  88. Malone, E.L. Glaciers and Hydrologic Changes/Impacts. Available online: https://pdf.usaid.gov/pdf_docs/Pnadu628.pdf (accessed on 11 November 2019).
  89. Zou, S.; Jilili, A.; Duan, W.; Maeyer, P.D.; de Voorde, T.V. Human and Natural Impacts on the Water Resources in the Syr Darya River Basin, Central Asia. Sustainability 2019, 11, 3084. [Google Scholar] [CrossRef] [Green Version]
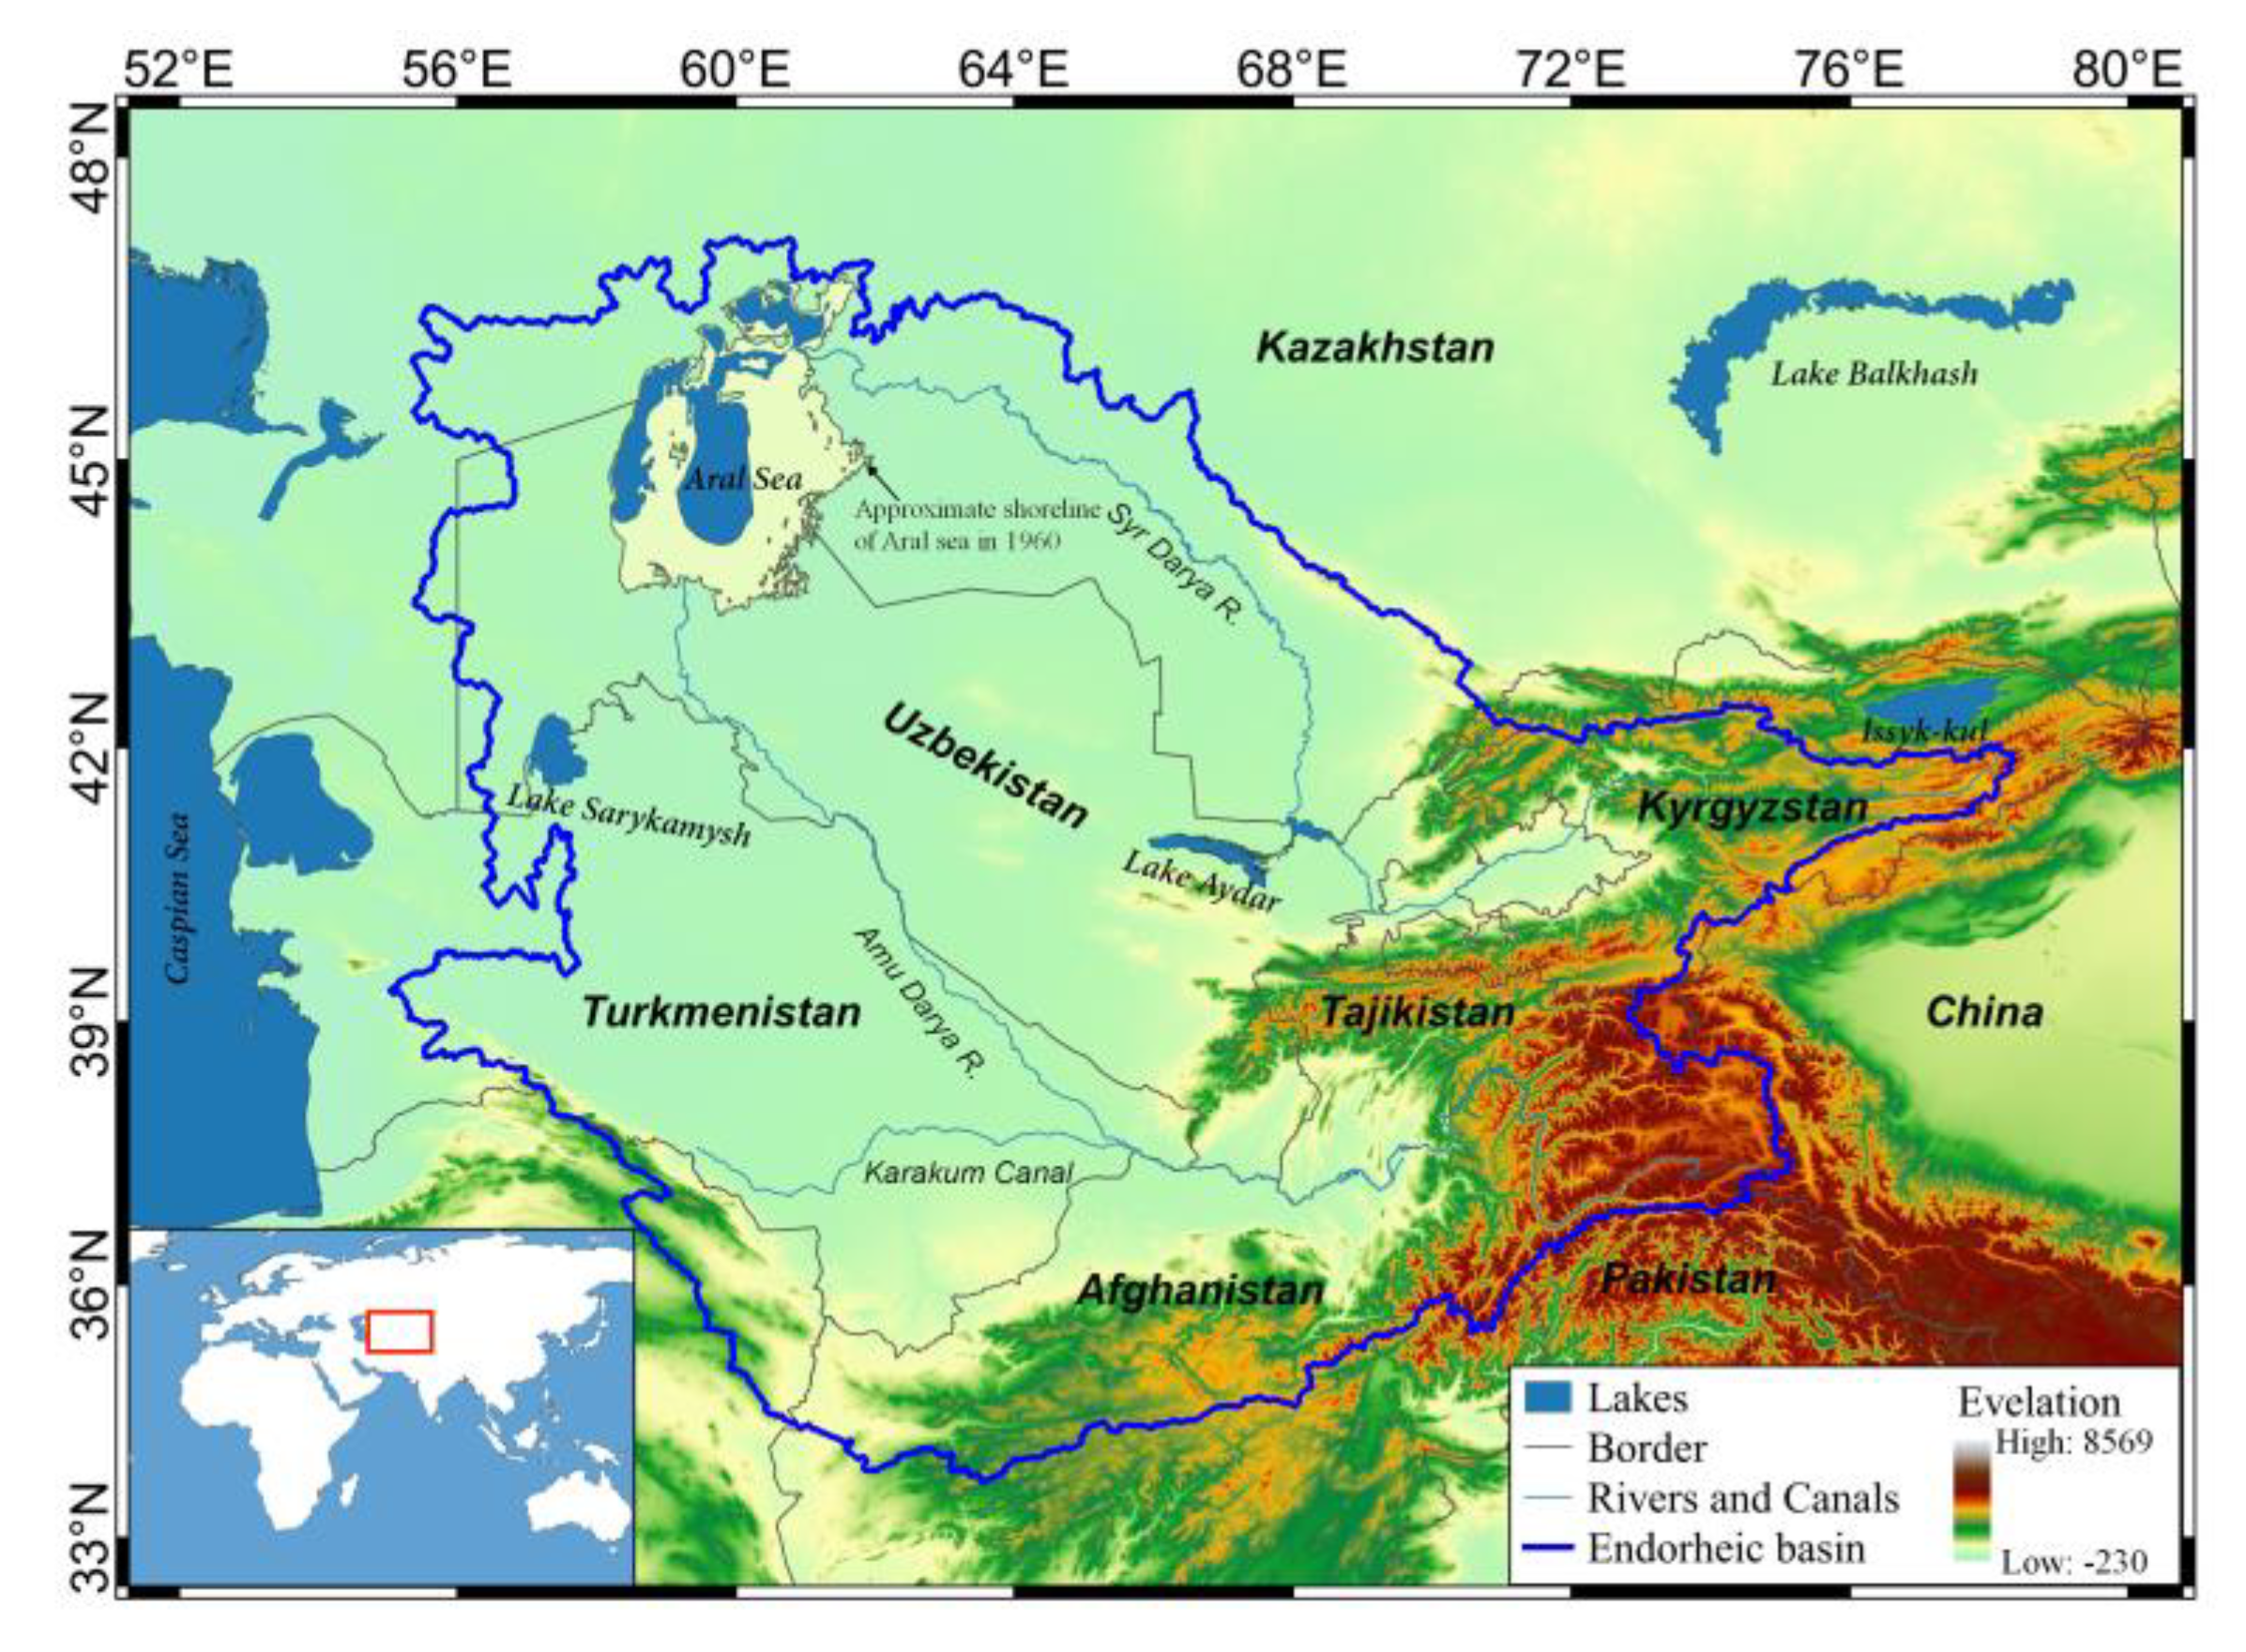
Figure 1. The Aral Sea endorheic basin. The endorheic boundary was obtained from the hydrological data and maps based on shuttle elevation derivatives at multiple scales (HydroSHEDS). URL: www.hydrosheds.org.
Remotesensing 12 02408 g001
Figure 2. The shoreline changes of the Aral Sea from the Landsat images. The grey extent represents the Aral Sea area in 1960. The blue dotted rectangle represents the range-derived water storage changes of the Aral Sea (longitude: 58–61.8° E, latitude: 43.7–47° N).
Remotesensing 12 02408 g002
Figure 3. Water level (blue) and surface area (red) changes in the four parts of the Aral Sea. (a) Tchebas Bay; (b) the North Aral Sea; (c) the West Aral Sea; and (d) the East Aral Sea.
Remotesensing 12 02408 g003
Figure 4. Water storage anomaly (Gt). (a) Tchebas bay; (b) the North Aral Sea; (c) the West Aral Sea; and (d) the East Aral Sea. The solid blue line is the long-term trend in the water storage, and the blue shade represents the 95% confidence interval.
Remotesensing 12 02408 g004
Figure 5. The spatial pattern of the TWS changes in terms of the equivalent water thickness (EWT) in mm/year. (a) The GRACE CSR mascon solution (CSR-M); (b) The GRACE JPL mascon solution (JPL-M); (c) The combined filtering method (CFM); (d) The Slepian spatiospectral concentration method (SSCM).
Remotesensing 12 02408 g005
Figure 6. Water storage anomalies of the Aral Sea derived from the GRACE solutions and the calibrated hypsometric curves (CHC).
Remotesensing 12 02408 g006
Figure 7. TWS anomalies of the endorheic basin derived from the GRACE solutions. The solid curves represent the mean GRACE-derived results, and the dashed curve is the smoothed result from the mean GRACE-derived TWS anomalies (13-month smoothing).
Remotesensing 12 02408 g007
Figure 8. Interannual variabilities in the water storage components in the Aral Sea. WGHM_S refers to the surface water component from the WGHM; WGHM_G refers to the ground water from the WGHM; CHC+G refers to the sum of the surface water storage derived from the CHC and the groundwater components exported by the WGHM. CSR-M, JPL-M, CFM, and SSDIM refer to the total water storage based on the CSR-M, JPL-M, CFM, and SSDIM, respectively.
Remotesensing 12 02408 g008
Figure 9. Irrigation area in the endorheic basin (area equipped for irrigation expressed as the percentage of total area). Date from the Global Map of Irrigation Areas version 5 [81].
Remotesensing 12 02408 g009
Figure 10. (a) Annual average temperature anomalies in the Aral Sea endorheic basin. (b) Annual average precipitation anomalies in the Aral Sea endorheic basin. The robust and moderate temperature (GHCN-CAMS) and precipitation (GPCC) datasets are described in Section 2.6.
Remotesensing 12 02408 g010
Figure 11. (a) Spatiotemporal variations in the seasonal temperature (2002–2018). (b) Spatiotemporal variations in seasonal precipitation (2002–2018). (Spring: March, April, and May; Summer: June, July, and August; Autumn: September, October, and November; Winter: December, January, and February) The black dots represent a significant trend at levels of p < 0.1.
Remotesensing 12 02408 g011
Table 1. A list of all of the datasets used in this study.
DatabaseTypeTime RangeSourceReference
DAHITIWater level2002–2018Satellite altimetrySchwatke et al. [16]
GRLMWater level2002–2018Satellite altimetryBirkett et al. [60]
Hydroweb
NCEP/NCAR
Water level
Temperature
2002–2018
1960–2018
Satellite altimetry
Reanalysis dataset
Crétaux et al. [14]
Kalnay et al. [61]
GHCN_CAMS
CRU
Temperature
Temperature
1960–2018
1960–2018
Based on gauge data
Based on gauge data
Yun et al. [62]
Harris et al. [63]
PREC/LPrecipitation1960–2018Based on gauge dataChen et al. [64]
GPCC
CRU
Precipitation
Precipitation
1960–2018
1960–2018
Based on gauge data
Based on gauge data
Schneider et al. [65]
Harris et al. [63]
Table 2. Cross-correlation analysis.
CFMCSR-MJPL-MCHCCHC+GWGHM_GWGHM_GS
RτRτRτRτRτRτRτ
SSDIM0.64 **00.42 **00.58 **00.64 **−20.65 **−20.59 **−10.60 **−1
CFM--0.68 **00.79 **00.43 **00.49 **00.74 **10.52 **1
CSR-M----0.62 **00.37 *10.40 *10.53 **00.40 *−1
JPL-M------0.7100.76 *00.82 **00.79 **0
CHC--------0.99 **00.63 *10.82 *−1
CHC+G----------0.71 *00.88 **−1
WGHM_G------------0.80 **0
Note: * and ** indicate significant correlations of more than 95% and 99% Monte Carlo confidence test, respectively.