Article

Exploring the Use of DSCOVR/EPIC Satellite Observations to Monitor Vegetation Phenology

1
Joint Global Change Research Institute, Pacific Northwest National Lab, College Park, MD 20720, USA
2
Universities Space Research Association, Columbia, MD 21046, USA
3
Department of Geological and Atmospheric Sciences, Iowa State University, Ames, IA 50011, USA
*
Author to whom correspondence should be addressed.
Remote Sens. 2020, 12(15), 2384; https://doi.org/10.3390/rs12152384
Submission received: 26 June 2020 / Revised: 13 July 2020 / Accepted: 22 July 2020 / Published: 24 July 2020
(This article belongs to the Special Issue Global Biospheric Monitoring with Remote Sensing)

Abstract

:
Vegetation phenology plays a pivotal role in regulating several ecological processes and has profound impacts on global carbon exchange. Large-scale vegetation phenology monitoring mostly relies on Low-Earth-Orbit satellite observations with low temporal resolutions, leaving gaps in data that are important for monitoring seasonal vegetation phenology. High temporal resolution satellite observations have the potential to fill this gap by frequently collecting observations on a global scale, making it easier to study change over time. This study explored the potential of using the Earth Polychromatic Imaging Camera (EPIC) onboard the Deep Space Climate Observatory (DSCOVR) satellite, which captures images of the entire sunlit face of the Earth at a temporal resolution of once every 1–2 h, to observe vegetation phenology cycles in North America. We assessed the strengths and shortcomings of EPIC-based phenology information in comparison with the Moderate-resolution Imaging Spectroradiometer (MODIS), Enhanced Thematic Mapper (ETM+) onboard Landsat 7, and PhenoCam ground-based observations across six different plant functional types. Our results indicated that EPIC could capture and characterize seasonal changes of vegetation across different plant functional types and is particularly consistent in the estimated growing season length. Our results also provided new insights into the complementary features and benefits of the four datasets, which is valuable for improving our understanding of the complex response of vegetation to global climate variability and other disturbances and the impact of phenology changes on ecosystem productivity and global carbon exchange.

Graphical Abstract

1. Introduction

The capability to accurately observe vegetation phenology (i.e., seasonal greening and browning) cycles allows us to understand how these cycles are changing in time and space due to climate, urbanization, and other natural and anthropogenic influences [1,2,3,4]. This is important for understanding associations between the environment and public health [5,6], maximizing crop production [7], and managing ecosystems [8], amongst other applications. Acquiring vegetation phenology observations on a local, national, and even global scale is difficult due to the heterogeneity of vegetation, a large quantity of data that needs to be collected for all-encompassing conditions, and geographic barriers, which creates a gap in the amount of information that is available.
One of the primary ways to overcome these limitations is with remote sensing of Earth from space. For decades, vegetation phenology data has been gathered through remote sensing by Earth-observing satellites due to their ability to continuously monitor, store, and create large-scale observational records [9,10,11]. Previous studies have successfully used vegetation indices estimated from remote sensing observations to derive vegetation phenology indicators [12,13]. Despite being more comprehensive than in-situ observations, the current satellites/sensors that are widely used for this purpose (e.g., the Moderate-resolution Imaging Spectroradiometer (MODIS) onboard Terra and Aqua, Enhanced Thematic Mapper (ETM+) onboard Landsat) have low temporal resolutions (i.e., once every 8 days or longer due to cloud contamination), which is a shortcoming, leaving major voids in required data. This lack of observations is worse for some regions and ecosystems during key phenological stages. Therefore, a global remote sensing source with a high temporal resolution is desired [12]. For example, more advanced geostationary satellites with the high temporal resolution, such as Himawari-8 and Meteosat Second Generation (MSG), have been found to have the potential to fill this temporal gap and improve monitoring of vegetation phenology [14,15].
Nevertheless, the spatial coverage of geostationary satellites is confined to certain regions due to their orbital geometry/constraints. Additional efforts of fusing multiple geostationary satellite observations are necessary, with due consideration to their sensor to sensor differences and required cross-calibration, for developing globally consistent vegetation phenology datasets. In contrast, the Earth Polychromatic Imaging Camera (EPIC) observations from the Deep Space Climate Observatory (DSCOVR) satellite, which has 1–2 h temporal resolution and global coverage, offer a great opportunity to fill the existing void in high temporal resolution observations of vegetation phenology from space. The DSCOVR satellite is a partnership between the National Aeronautics and Space Administration (NASA), National Oceanic and Atmospheric Administration (NOAA), and United States Air Force (USAF) and was launched into space on 11 February 2015, with a planned five-year mission life. DSCOVR orbits at the Sun-Earth Lagrange point 1, where the gravitational forces from the Sun and Earth equal the centrifugal force felt by the satellite, allowing DSCOVR to essentially be parked in space. The EPIC instrument onboard DSCOVR is unique from other remote sensing devices due to its temporal resolution and global coverage. The orbital geometry of the DSCOVR satellite, together with EPIC focal plane length, provide images of the entire sunlit face of the Earth at 10 km spatial resolution and 1–2 h temporal resolution. This combination of spatial and temporal resolution is unique compared with other commonly used sensors/satellites for phenology observations [16]. DSCOVR/EPIC observations have been used to estimate leaf area index [17] and surface downward solar radiation globally [18]. In comparison, the MODIS reflectance product has a spatial resolution of 500 m and temporal resolution of 1 to 2 days, but its images are frequently affected by cloud and aerosol [19]; while the Landsat 7 product has a higher spatial resolution of 30 m but a coarser temporal resolution of 16 days, at best [20].
The purpose of this study was to explore the ability of EPIC observations to monitor vegetation phenology. The knowledge gained by evaluating EPIC’s ability to observe seasonal changes in Earth’s vegetation phenology and its changes compared to MODIS and Landsat will provide additional capability and insight for obtaining and using vegetation phenology for a variety of uses and provide some insight on where such application is most beneficial. Near-surface observations from the PhenoCam network [21,22] are used as the reference ground-truth benchmark. This paper is organized as follows: Section 2 describes the study sites, datasets, and methodology; Section 3 presents the results of the study; Section 4 provides a discussion about the advantages and disadvantages of EPIC for estimating vegetation phenology and some potential sources of uncertainties; Section 5 presents the conclusions.

2. Material and Methods

2.1. Study Sites and Datasets

To investigate the strengths and weaknesses of EPIC to observe phenology cycles for various vegetation types, we used a combination of ground measurements (PhenoCam), Landsat, and MODIS, and 176 study locations/sites around North America were chosen based on the existing network of PhenoCam sites. PhenoCam is an open-access ecosystem phenology camera network with 393 sites worldwide, and all of its pictures and derived data are available to the public free of charge. PhenoCam allows near-surface remote sensing without cloud and atmosphere interference across 10 vegetation types [21]. The sites in this study were selected based on the duration of observations and quality of data, determined by PhenoCam’s “site type” classification system. All 176 sites are classified as “Type 1”, meaning they follow PhenoCam protocol to produce the highest quality data. All 176 sites also had data available during the years of interest for this study (2016–2018). After removing sites with sparse data and understory canopy views, the total number of sites with suitable data was reduced to 92 (Figure 1). Although PhenoCam data were not available for all years at all sites, we used data from all sites during the available years. Following these guidelines, 17 agriculture, 41 deciduous broadleaf, 12 evergreen needleleaf, 14 grassland, 6 shrub, and 2 wetland sites were selected for this study. Sample pictures/images of the sites are shown in Figure 2, where the PhenoCam pictures of ‘mead1’ and ‘harvardhemlock’ are green, while ‘dukehw’, ‘konza’, ‘luckyhills’, and ‘merbleue’ present more yellow hues. ‘Merbleue’ also has an evident mix of vegetation, with trees sparsely throughout.
The EPIC intermittent observations began on 4 July 2015, and continuous observations began in September 2015. Due to a technical issue with DSCOVR’s positioning system, the satellite entered safe mode on 27 June 2019, but has been fully operational since 2 March 2020. For EPIC observations, atmospherically corrected surface reflectance product was extracted from NASA’s EarthData platform [23], and snow and cloud contaminated pixels were removed. For Landsat and MODIS observations, the Google Earth Engine (GEE) platform was used to extract the Landsat 7 surface-reflectance data from the United States Geological Survey (USGS) data archive [24], and MODIS nadir Bidirectional Reflectance Distribution Function (BRDF)-adjusted reflectance data [25], for the pixel(s) that encompass the PhenoCam site. For EPIC and MODIS, using data from January 2016 through December 2018 allowed us to observe three full seasonal vegetation cycles. For Landsat, observations from January 2008 through December 2018 were used to calculate the long term mean for this dataset (see details in Section 2.2).
In addition, we recognized that the scale mismatch might complicate the analysis of phenology using observations from EPIC (10 km), MODIS (500 m), and Landsat (30 m). Therefore, we characterized the land cover heterogeneity at each PhenoCam site with MODIS land cover product (MCD12Q1). We used MCD12Q1 land cover type 1 data (International Geosphere-Biosphere Programme (IGBP) classification scheme) and calculated the fraction of MODIS pixels (frac) that were located in the EPIC 10 km pixel and classified as the similar vegetation type as suggested by the PhenoCam dataset. We defined a homogeneous site if frac>80% for a given vegetation type. Out of the 92 sites included in this study, 36 were found to be homogeneous, and 56 were identified as heterogeneous. We specifically used the homogeneous and heterogeneous sites to examine the scale effects on our analysis that are presented in Section 3.4.

2.2. Estimating Phenological Indicators

We used the Enhanced Vegetation Index (EVI) to derive vegetation phenology products instead of the Normalized Difference Vegetation Index (NDVI) due to the fact that NDVI is easily saturated and affected by soil background as well as atmospheric aerosols, whereas EVI is less sensitive to these effects and better depicts the vegetation signal. For example, EVI has improved sensitivity for high biomass regions and is better suited for vegetation monitoring by minimizing the effects of the canopy background signal and atmosphere influences [26]. We used the EVI derived from EPIC observations from 1 January 2016, through 31 December 2018.
For the three sensors/satellites (Landsat, MODIS, and DSCOVR), the EVI is used as a measure of the greenness of vegetation and an indicator of the phenology cycle [11,27,28]. For the in-situ observations (PhenoCam), the Green Chromatic Coordinate (GCC) was used for our analysis as this is the color index used by PhenoCam to process their imagery. GCC uses the mean intensity of each of three color channels—red, green, and blue (RGB), which are stacked to make one image. Each pixel within the image is assigned a Digital Number (DN) triplet, where the intensity of each color layer is represented in the DN. GCC has been used as an index in several vegetation phenology studies [29] and is computed as [22],
G C C = G D N R D N + G D N + B D N
where RDN, GDN, and BDN are the mean red, green, and blue DN in the image or region of interest.
We recognized that these are two different indices, and this might lead to some discrepancies in the results. The EVI and GCC time series have different scales, but exhibit similar shapes and patterns, which allowed us to derive and use two key phenology indicators from these independent datasets—Start of Season (SOS) and End of Season (EOS), regardless of types of sensors/dataset, but based on the same method as described below.
The EVI was calculated from three different sensors/satellite observations. For EPIC observations, mean EVI was calculated for each day based on all observations from that day. For all data, we removed snow and cloud contaminated pixels and then computed EVI as [1],
E V I = 2.5   ( N I R R E D ) ( N I R + C 1 R E D C 2 B L U E + L )
where NIR, BLUE, and RED are near-infrared, blue, and red reflectance measurements, and C1 = 6, C2 = 7.5, L = 1 [26,30]. For the PhenoCam observations, provisional GCC data for each site was downloaded directly from the PhenoCam website [21].
The double logistic function methodology was adopted from a previous study to derive SOS and EOS dates for these datasets [1]. We defined SOS as the date when the first derivative of the function reached the maximum, and EOS as the date when it reached the minimum. These definitions have been widely used in several other similar studies [1,15,22,23,24]. For PhenoCam, MODIS, and EPIC, a daily mean GCC or EVI was calculated for each Day of Year (DOY) based on all observations for that date, respectively. Each time-series data were then fitted with the double logistic function [1];
f ( t ) = v 1 + v 2 ( 1 1 + e m 1 ( t n 1 ) 1 1 + e m 2 ( t n 2 ) )
where f(t) is the EVI value for a specific DOY, v1 is the background EVI level for the year, v2 is the amplitude of EVI for the year, and m1 and n1 and m2 and n2 are a pair of parameters that detect trends of green-up (m) and senescence (n) phases [1]. Then, SOS and EOS were derived using Equation (3), according to their definitions. Figure 3 shows all EVI data based on EPIC observations in 2018, with best double logistic function fit, and derived SOS and EOS values for one of the grassland sites (i.e., ‘konza’).
Landsat observations are sparse due to the temporal nature of this satellite (i.e., 8-day revisit time) and cloud contamination, so a long-term mean [13] was calculated to improve the fitting of the function to fewer data points. This was done by applying the double logistic function to all the available Landsat data from 2008 to 2018, and this time series was then used to determine a 10-year average value for SOS and EOS. The interannual variability of SOS and EOS was then determined by the available observations for each individual year based on the methods reported in [13].

3. Results

3.1. Estimation of SOS and EOS

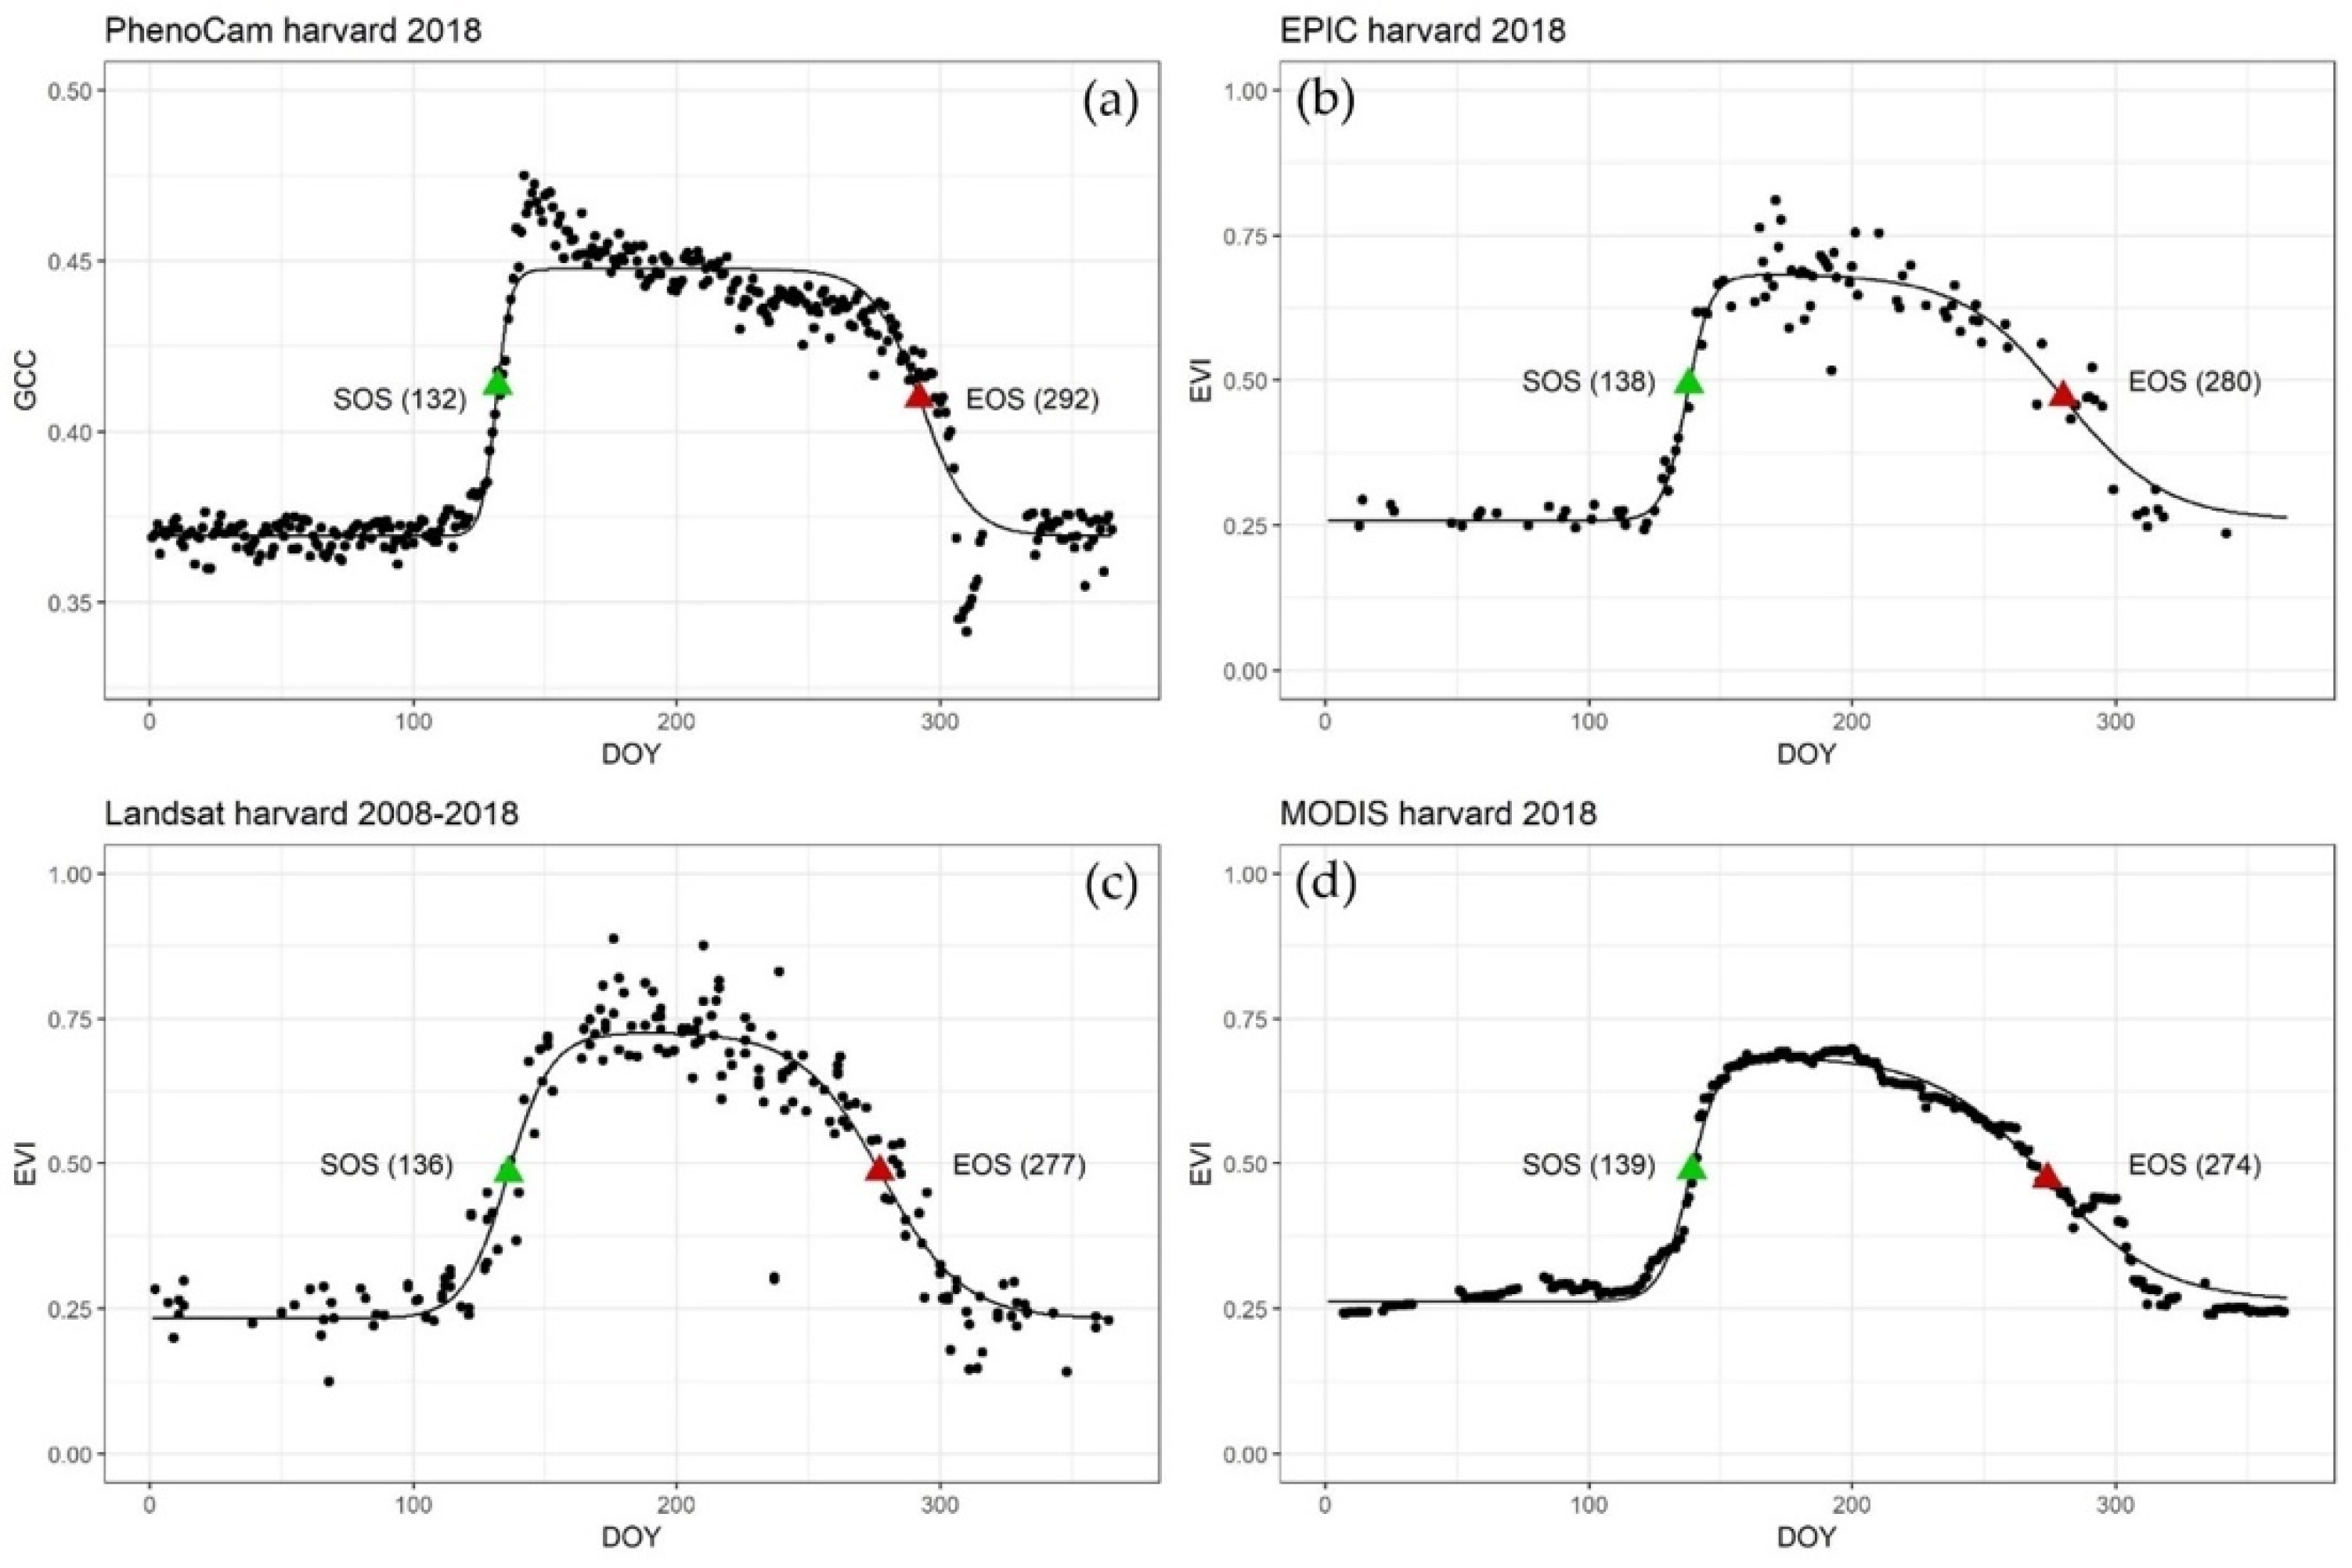
Our results indicated that EPIC observations, despite coarse spatial resolution of 10 km, could depict vegetation phenology cycles for a range of vegetation types examined in this study. We examined variations in the best-fit of the double logistic function [Equation (3)] for EPIC, MODIS, Landsat, and PhenoCam observations by vegetation type (Figure 4 and Appendix A). One site for each vegetation type was randomly selected, stipulating that data was available from all datasets during the year 2018 for that site for comparison purposes. Note that the SOS and EOS values based on Landsat observations were calculated based on the long-term mean (see Section 2, Materials and Methods). While the derived SOS and EOS values varied among the four datasets, the shape of the phenology curve for a vegetation type (e.g., agriculture, grassland, etc.) was typically consistent among the four datasets. We acknowledge the scale match between the PhenoCam view (<1 km), EPIC (10 km), Landsat (30 m), and MODIS (500 m); however, as shown in Figure 4, EPIC could depict vegetation phenology cycles, despite its lower spatial resolution, as well as MODIS and Landsat.

3.2. Overall Performance of Different Remote Sensing Observations

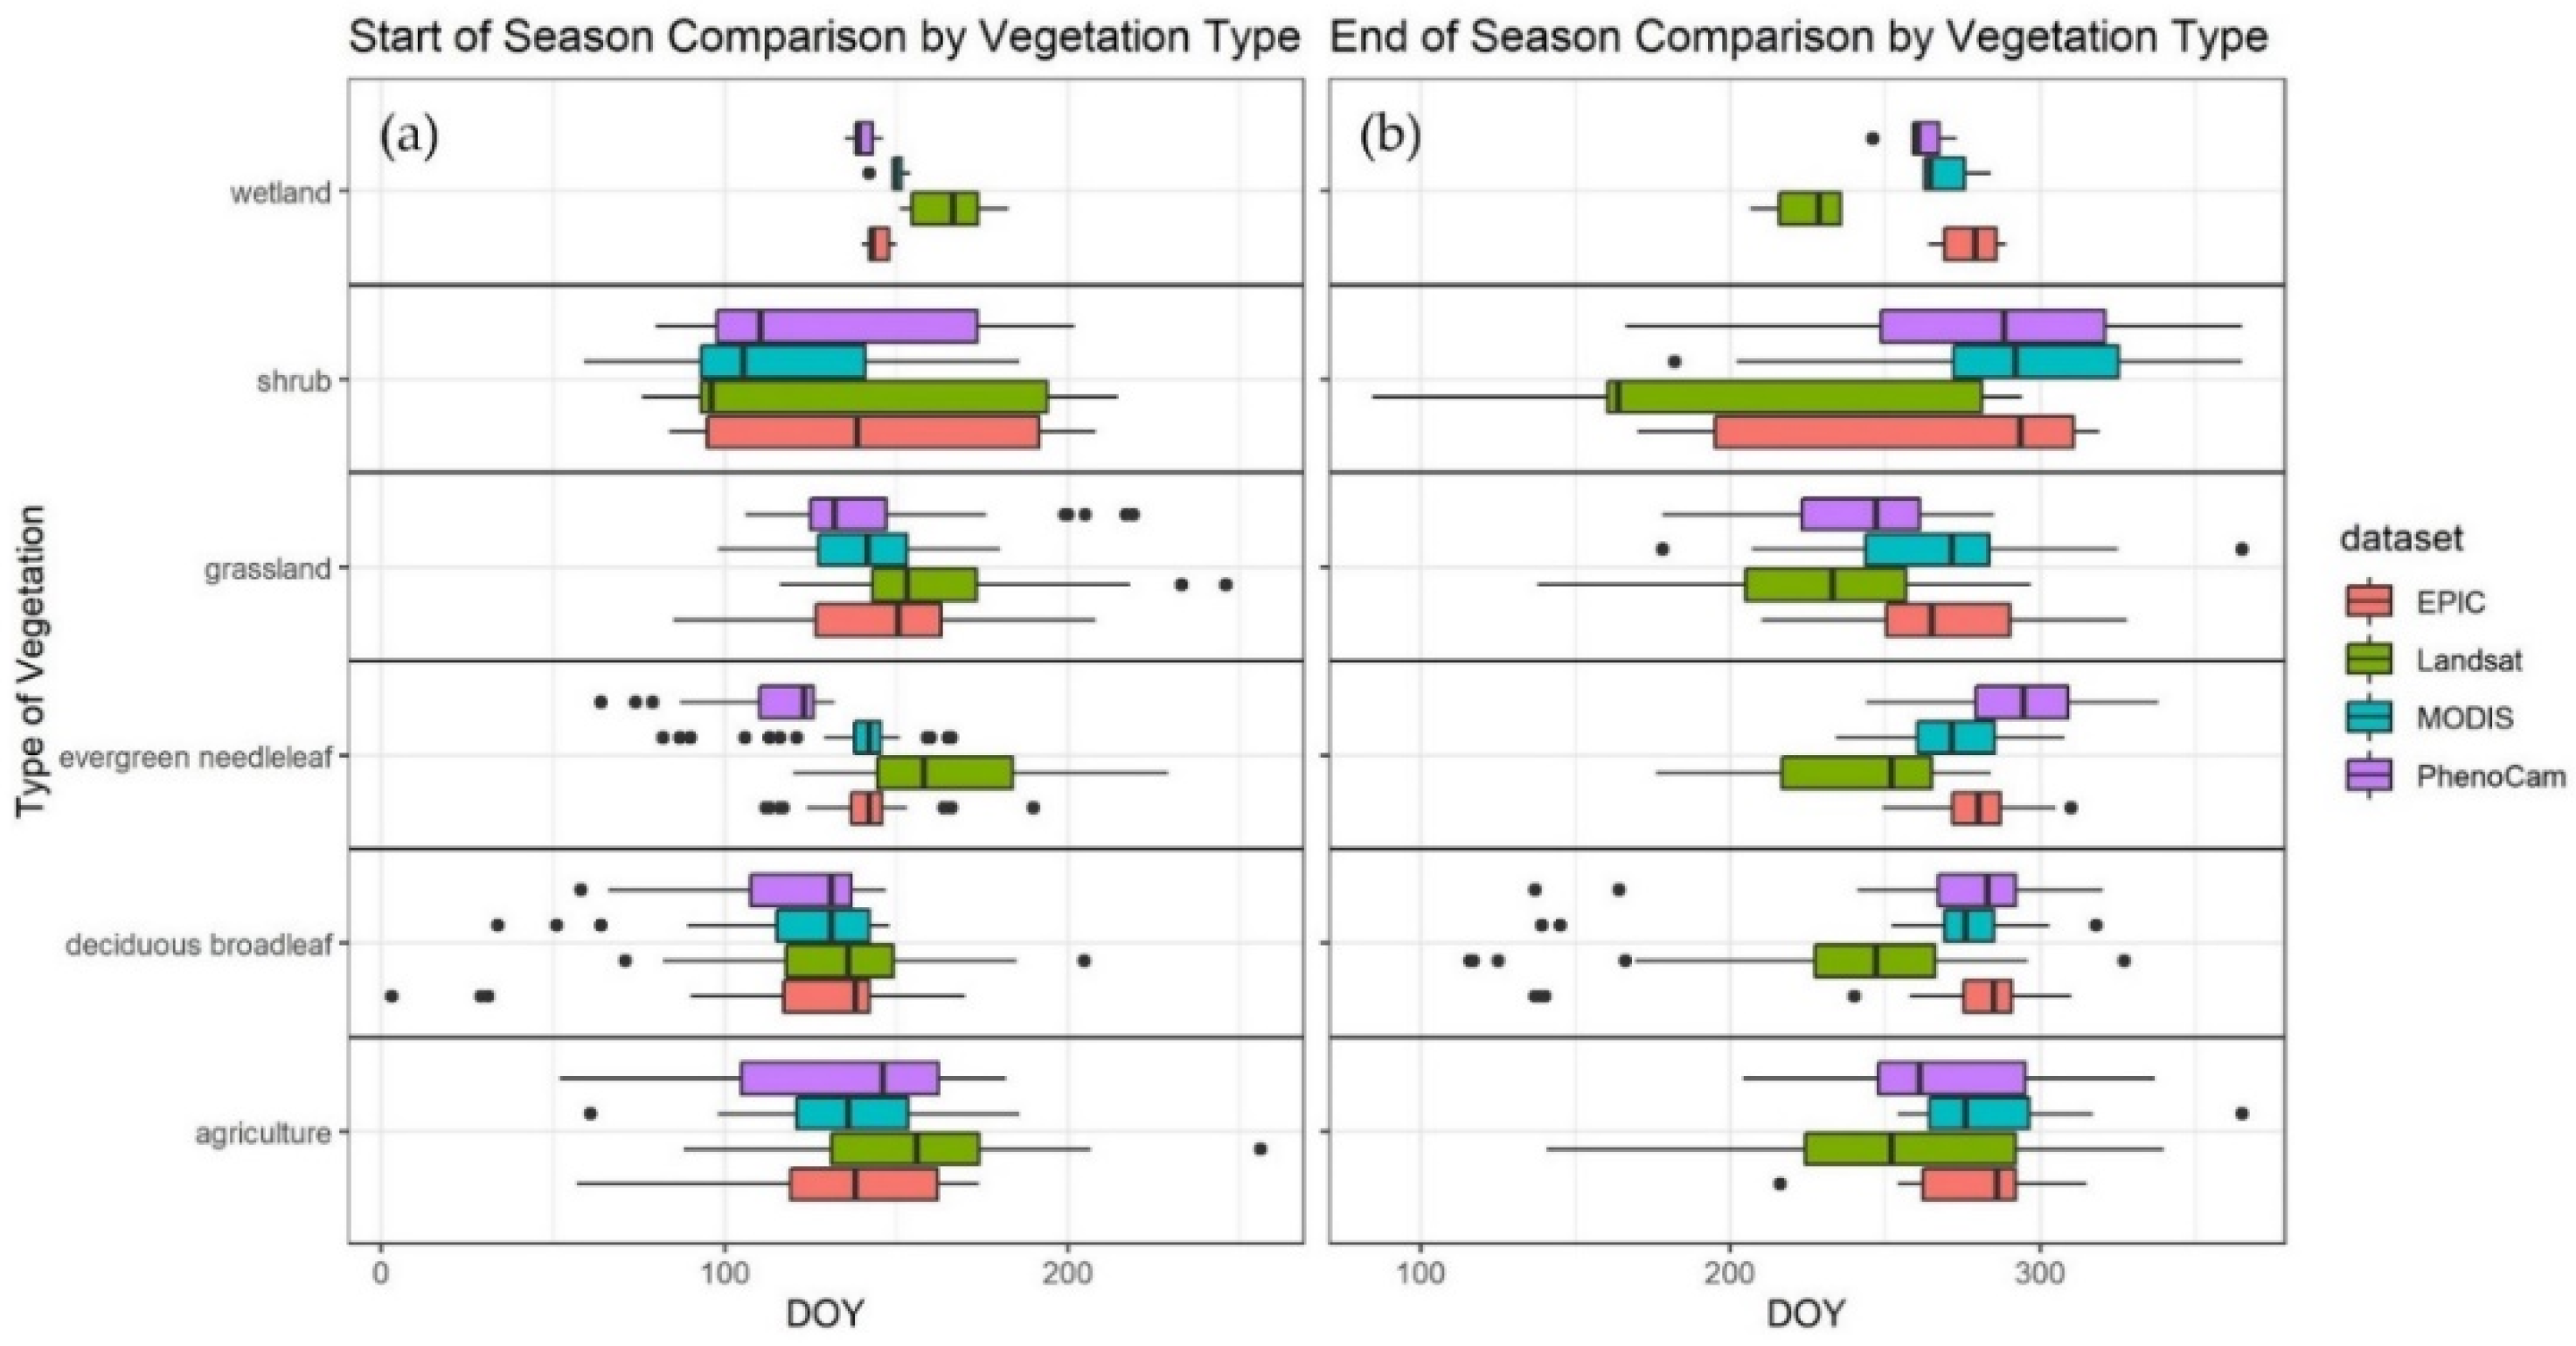
Figure 5 shows the spread of SOS and EOS observations by vegetation type for years 2016–2018 based on the four datasets. The four datasets generally captured the SOS and EOS dates well, especially for deciduous broadleaf and agricultural sites as compared to other vegetation types. However, MODIS and EPIC observations were relatively more consistent with PhenoCam than Landsat, which often indicated a later SOS and an earlier EOS. Sites classified by PhenoCam as shrub displayed a wide range of SOS and EOS indicators, though observations were sparse, and there was only data for six shrub sites. The derived SOS and EOS from satellite observations were inconsistent for wetland and evergreen needleleaf sites when compared with PhenoCam.
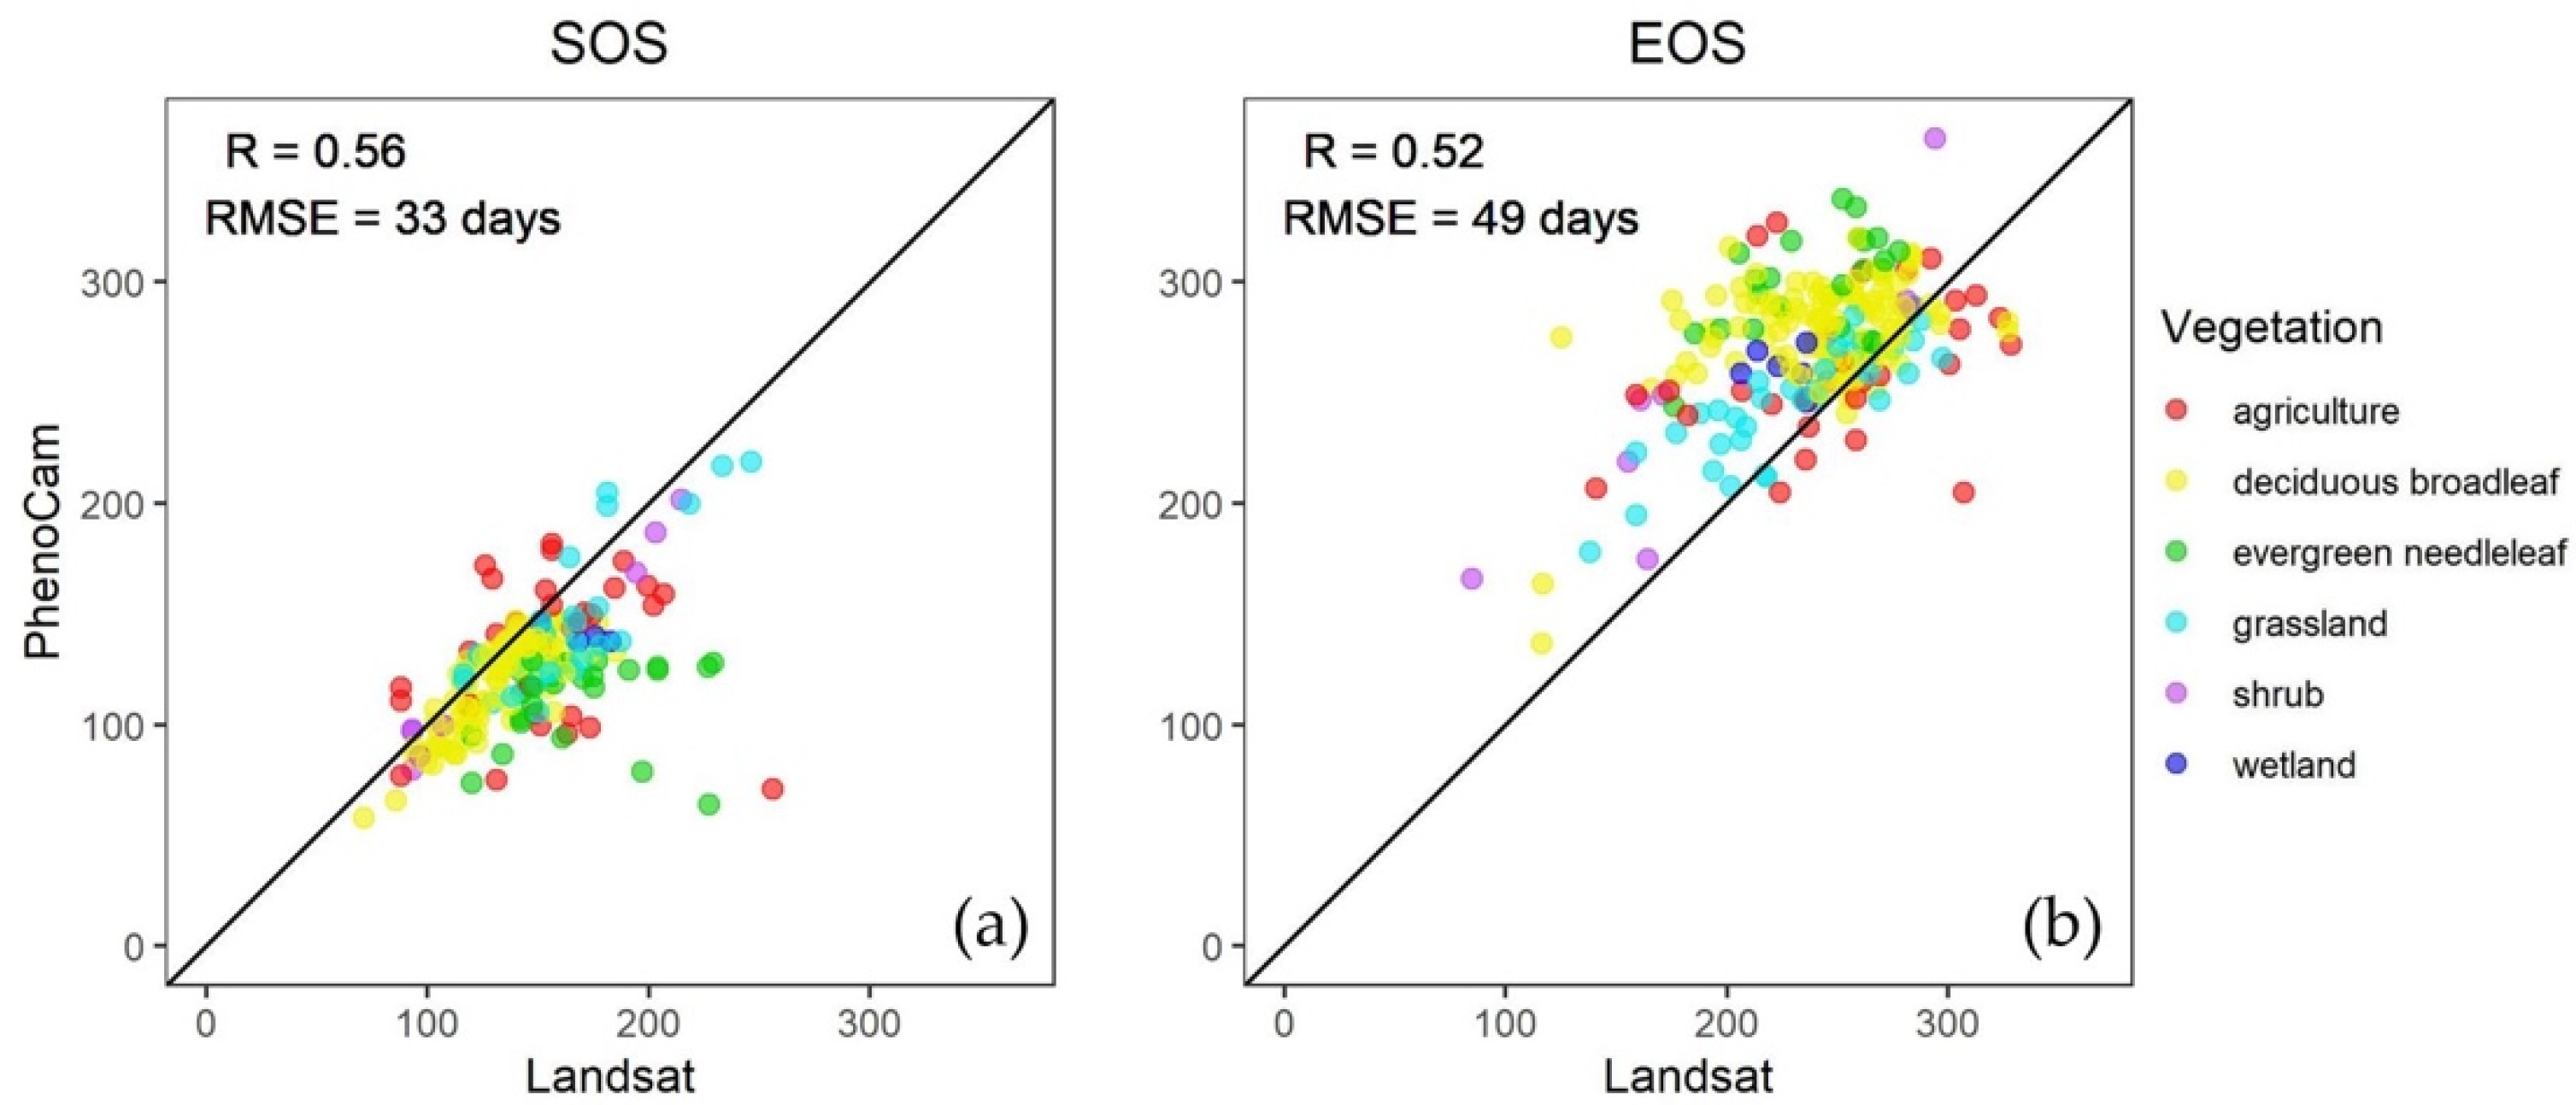
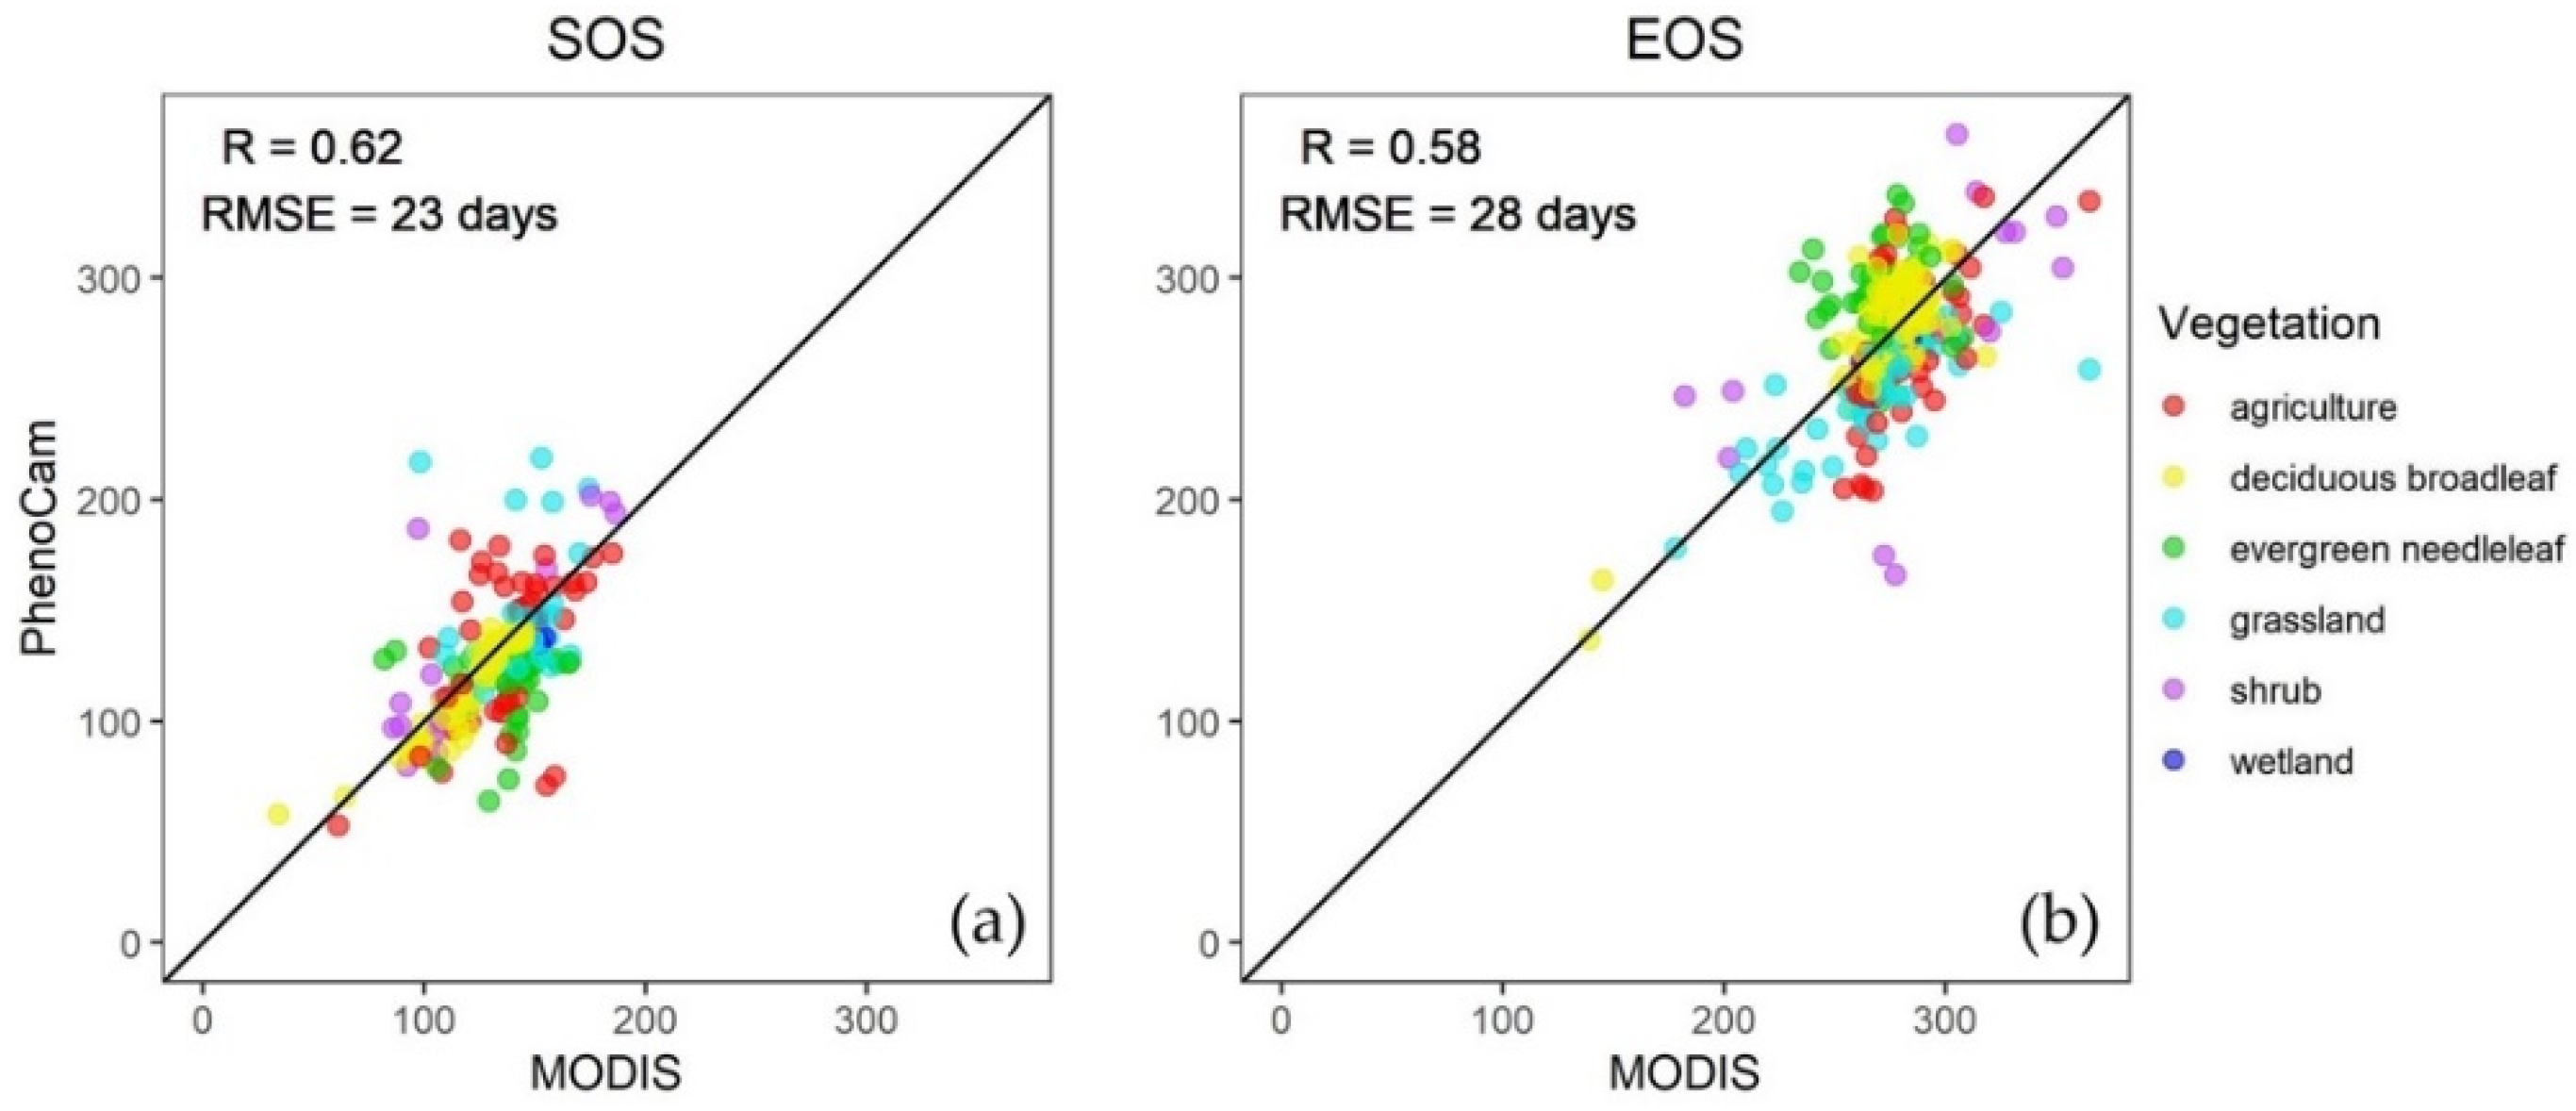
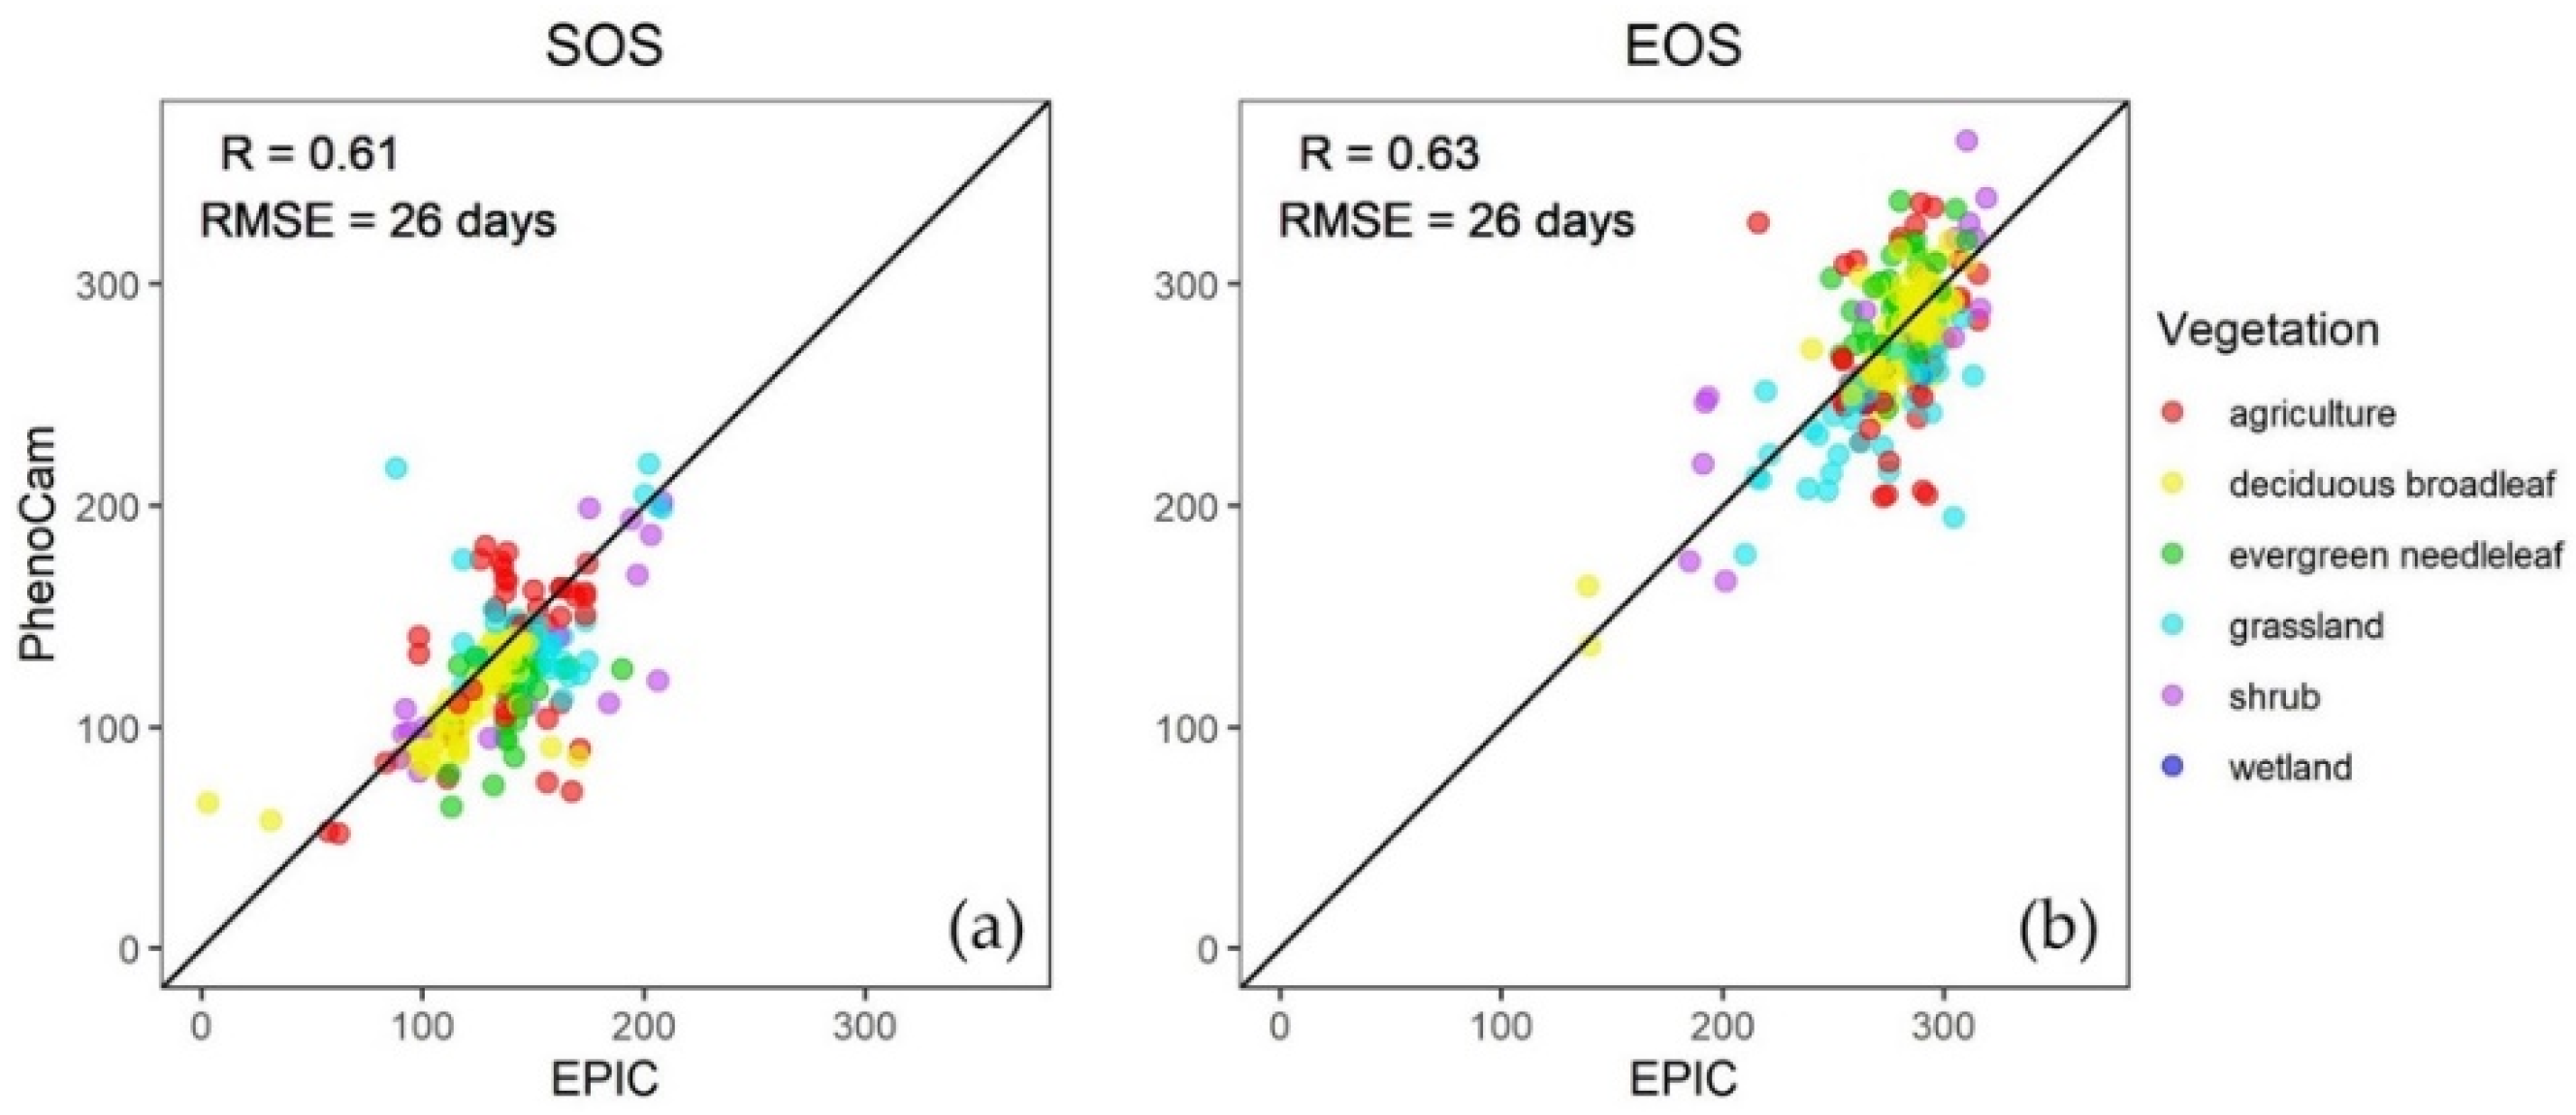
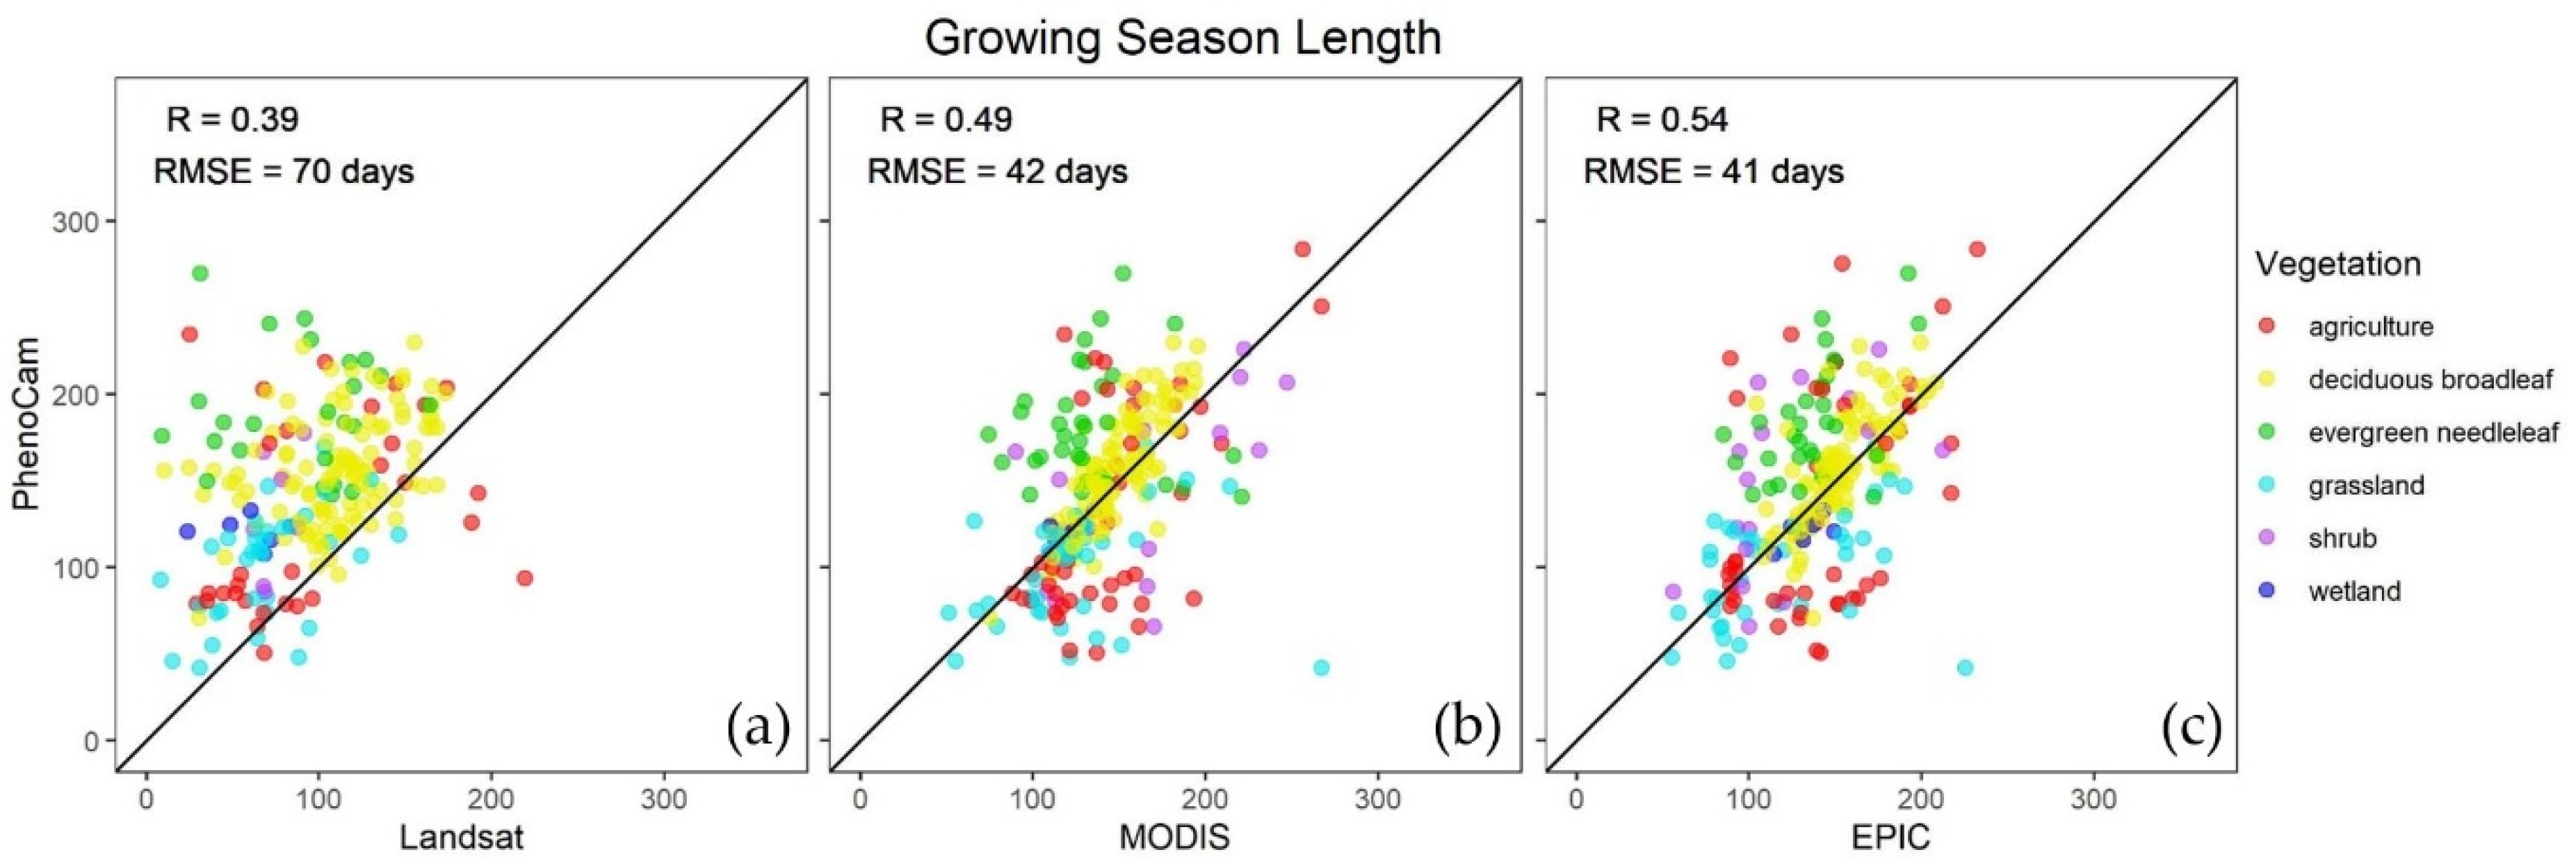
SOS and EOS from Landsat, MODIS, and EPIC showed a positive correlation of varying strength with those derived from PhenoCam observation. The three space-based observing systems captured the SOS very well when compared with PhenoCam, with MODIS demonstrating slightly better performance than EPIC (Figure 6a, Figure 7a and Figure 8a). However, EPIC appeared to perform the best in capturing EOS when compared with PhenoCam, relative to Landsat and MODIS (Figure 6b, Figure 7b and Figure 8b). Landsat often observed a later SOS and an earlier EOS than PhenoCam (Figure 6), confirming the results presented in Figure 5. EPIC observations often indicated a later SOS compared to PhenoCam (Figure 8a). There was a robust positive correlation between PhenoCam and the three satellite-based datasets (Figure 9) for Growing Season Length (GSL = EOS − SOS). Overall, Landsat observations consistently suggested a shorter GSL than the actual length observed by PhenoCam (Figure 9a), while MODIS and EPIC observations were more consistent with PhenoCam. In particular, EPIC most accurately observed GSL with the highest correlation coefficient and smallest Root Mean Square Error (RMSE), as seen in Figure 9c.

3.3. Performance of Different Remote Sensing Observations Across Different Plant Functional Types

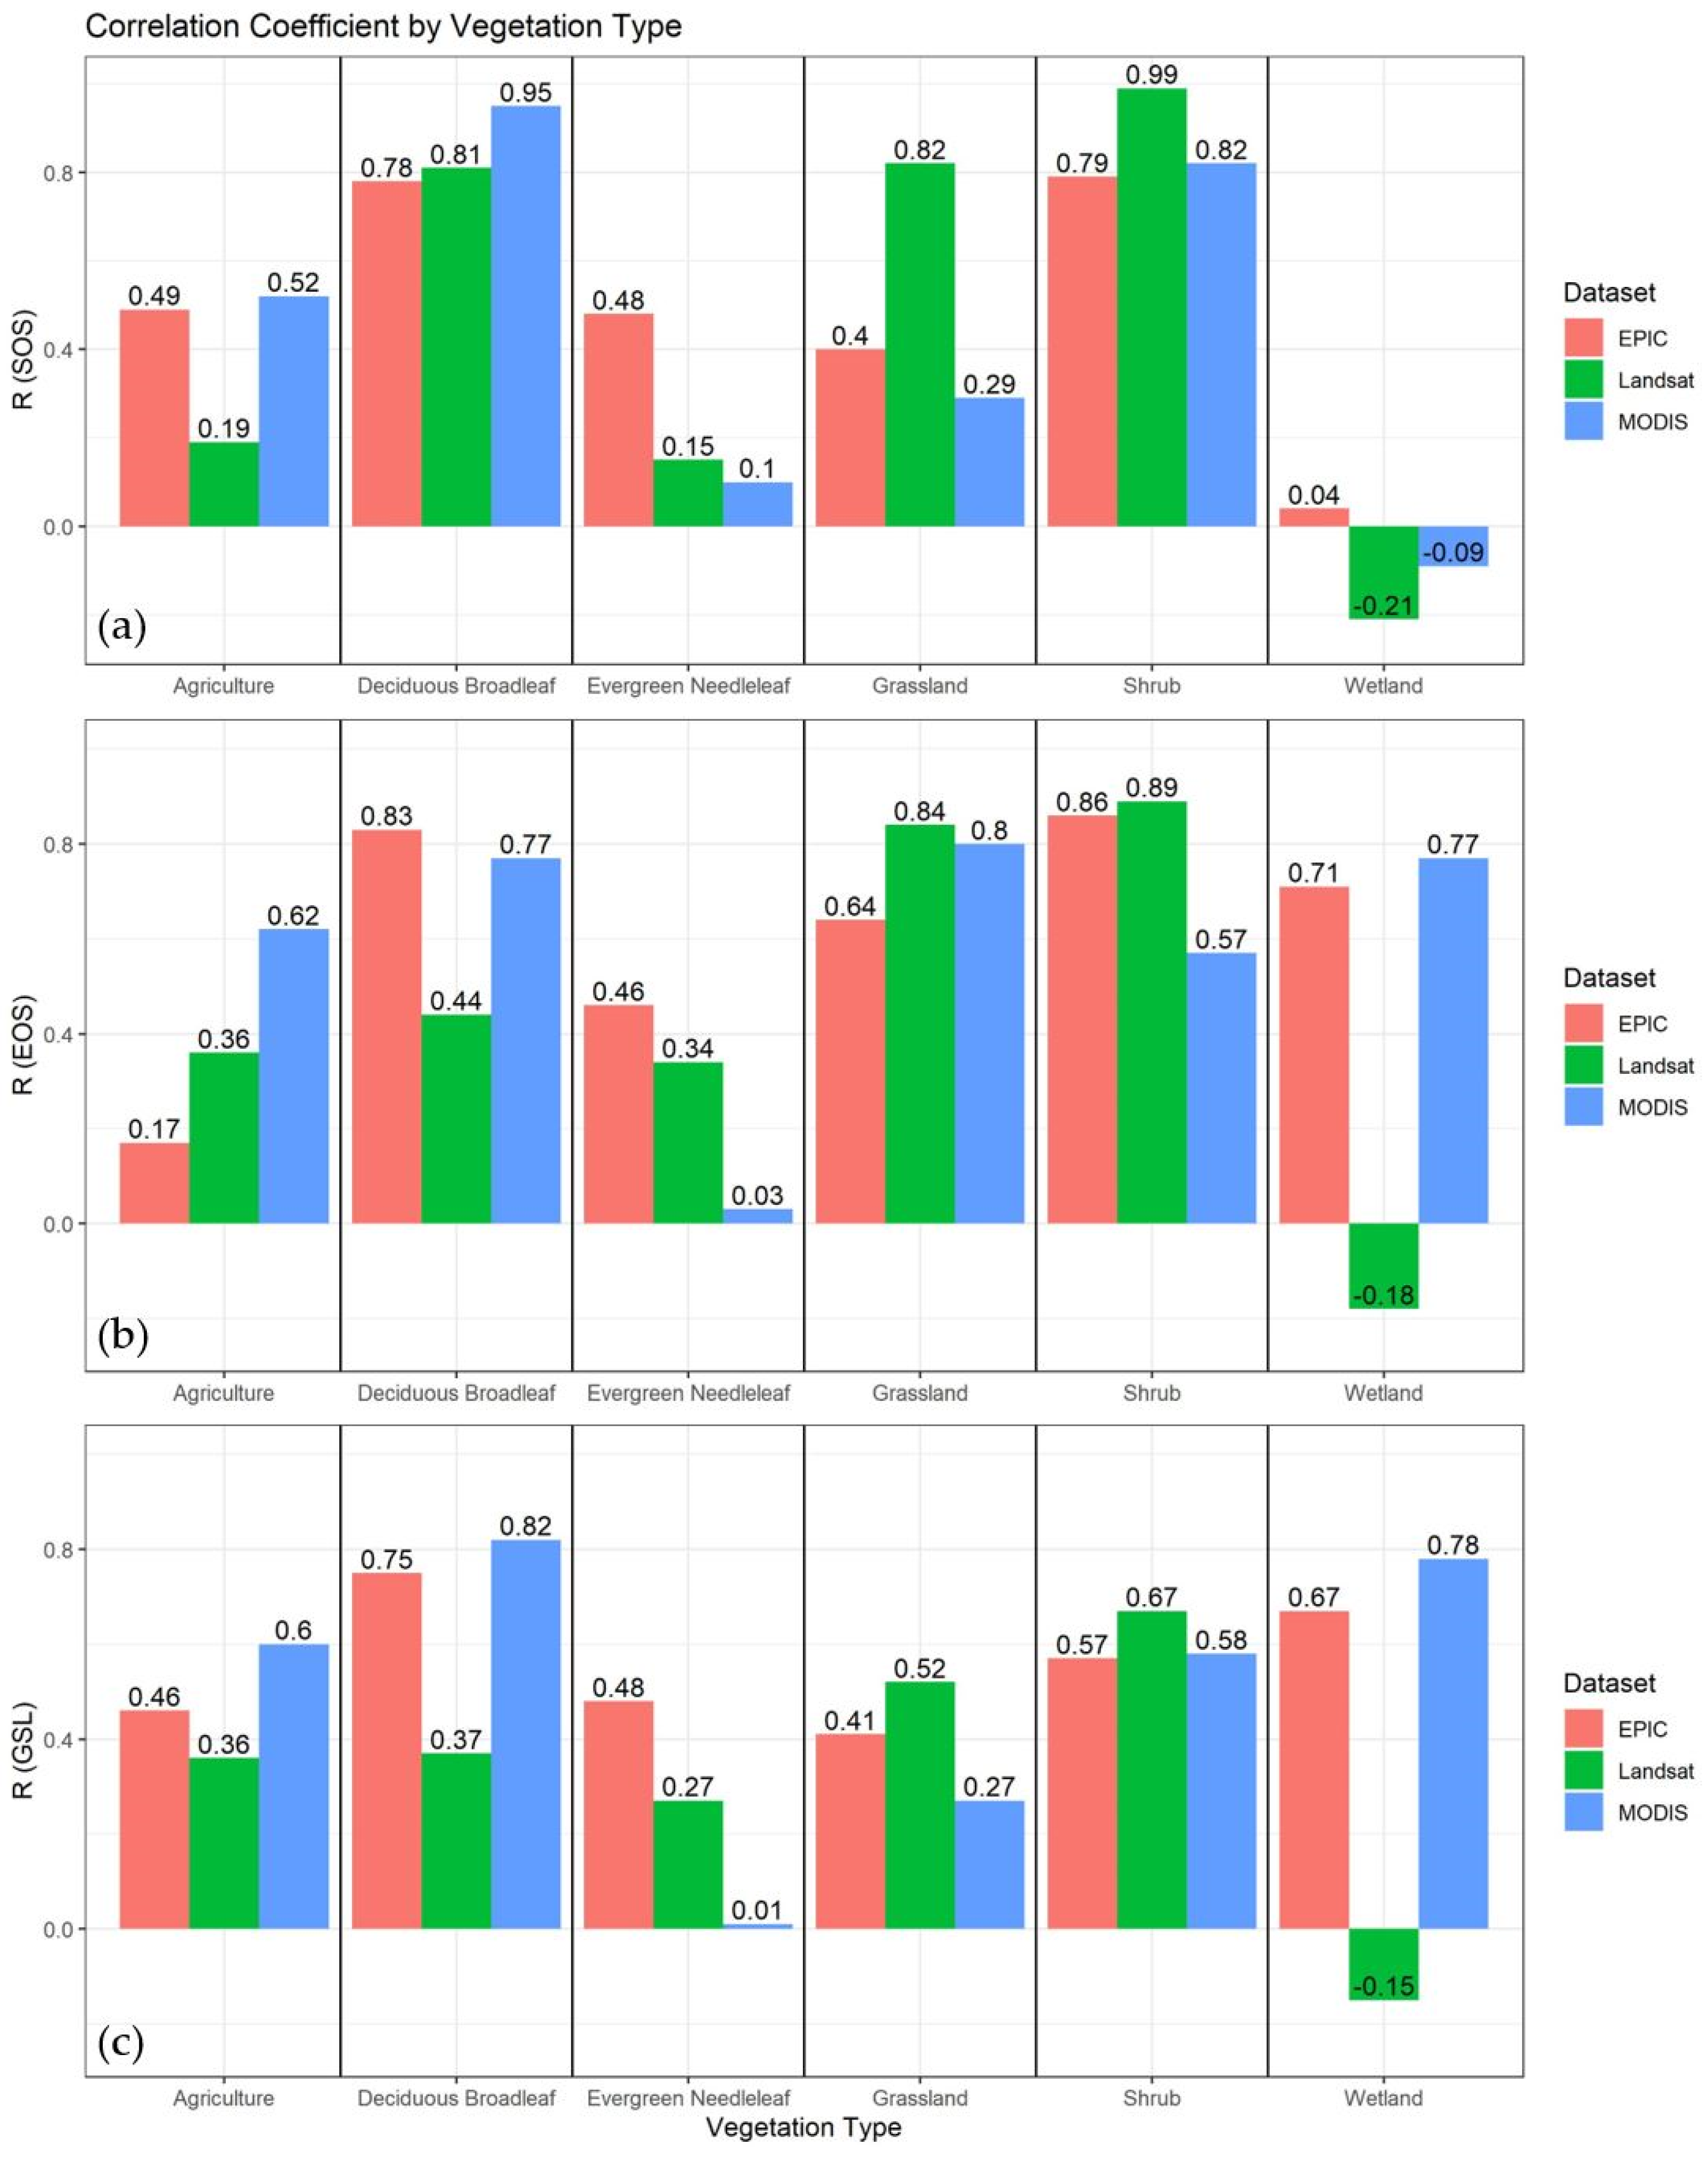
To evaluate the performance of the three satellite-based datasets as compared with PhenoCam, the correlation coefficient (R) for each dataset with PhenoCam was computed for SOS, EOS, and GSL and the six vegetation types (Figure 10a–c, respectively). Figure 11 displays the RMSE of these correlations for SOS, EOS, and GSL and the six vegetation types (Figure 11a–c).
Figure 10a, which displays the correlation of SOS observations only, shows that grassland, shrub, and wetland sites were best captured by Landsat, agriculture and deciduous broadleaf sites by MODIS, and evergreen needleleaf by EPIC. EPIC performed relatively well and was the most consistent for all vegetation types, excluding wetland. Landsat showed the weakest correlation in depicting SOS for agriculture and evergreen needleleaf sites, and MODIS had the weakest correlation for evergreen needleleaf, grassland, and wetland sites. The EOS for grassland and shrub sites was best depicted by Landsat; EOS for agriculture and wetland sites was best depicted by MODIS; and EOS for deciduous broadleaf and evergreen needleleaf sites was best depicted by EPIC (Figure 10b). EPIC performed well at accurately detecting EOS on all vegetation types except for agriculture, while Landsat underperformed for agriculture, deciduous broadleaf, evergreen needleleaf, and wetland sites, and MODIS did poorly for depicting EOS for evergreen needleleaf sites. Landsat depicted the best GSL correlation for grassland and shrub sites; MODIS showed best results for agriculture, deciduous broadleaf, and wetland; and EPIC performed best for evergreen needleleaf sites (Figure 10c). While Landsat and MODIS had shortcomings in observing GSL for some vegetation types, EPIC was the most consistent for all vegetation types. All datasets had relatively high RMSE (Figure 11), with Landsat almost consistently displaying the highest RMSE for all vegetation types except for grassland. This was possibly due to the low number of observations and observation noise in the Landsat data that may result from depicting land-surface heterogeneity due to higher spatial resolution, and/or due to its coarse temporal resolution and confounding effects of seasonal and inter-seasonal changes. Note that we used the entire Landsat data record (2008–2018) because of the sparse annual observations due to clouds.

3.4. Scale Effects on Derived Phenology Indicators

Due to the range of spatial resolutions among the datasets used in this study, the scale effects could be substantial [31]. An evaluation of the homogeneity of each site was conducted to discern which EPIC pixels are homogeneous (and, therefore, free of scale effects) by the percentage of vegetation type present in each pixel based on the MODIS land cover type data. To understand the impact of this spatial scale effect, Pearson correlation coefficient (R) and RMSE values were calculated for the 36 homogeneous and 56 heterogeneous sites independently.
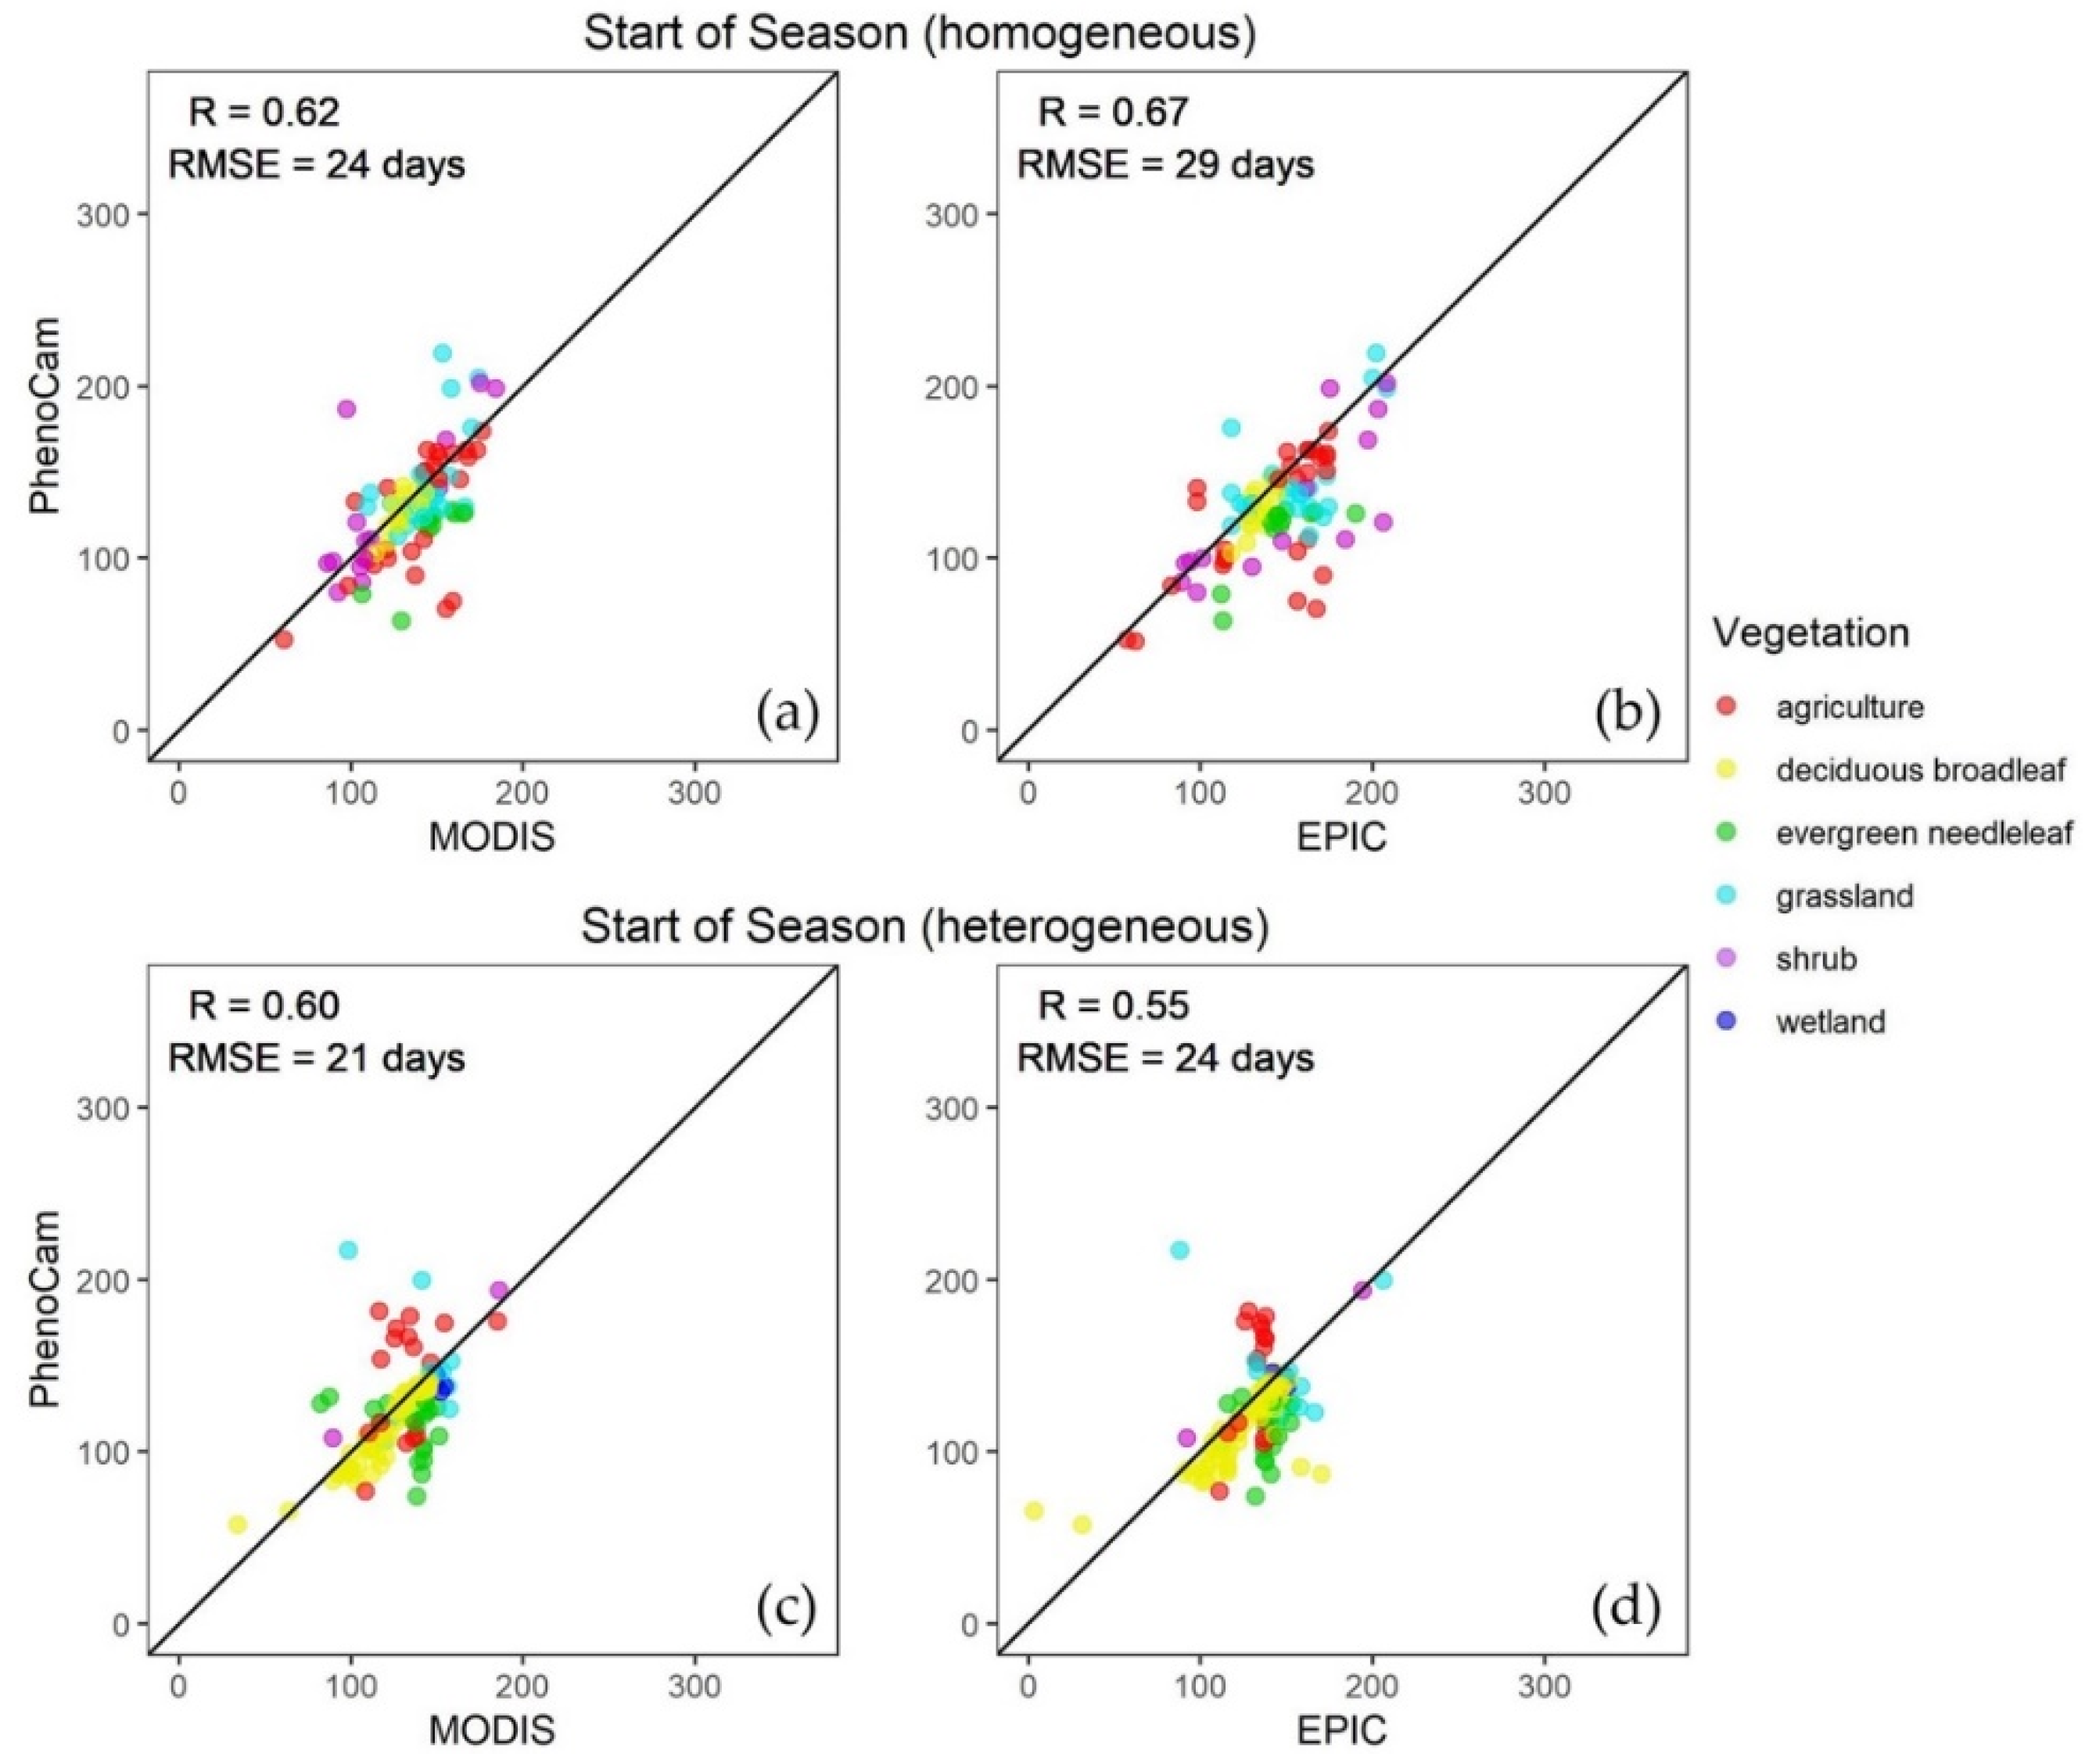
Figure 12 displays the derived SOS from MODIS and EPIC data for homogeneous and heterogeneous sites. The results of the combined data (all sites) are presented in Figure 7a for MODIS, where R = 0.62 and RMSE = 23 days, and Figure 8a for EPIC, where R = 0.61 and RMSE = 26 days. Figure 12a shows that for MODIS, the R value stayed the same, while RMSE increased by one day for homogeneous sites. Figure 12b shows that for EPIC, the R value increased noticeably, and RMSE increased slightly for homogeneous sites. Figure 12c shows that for MODIS, the R and RMSE values decreased slightly for heterogeneous sites, while for EPIC, the R value decreased noticeably, and the RMSE decreased slightly. These results indicated that EPIC observations for SOS are more impacted by the scale effects, as displayed by the wider range between R values in homogeneous and heterogeneous sites. Here, EPIC is more accurate in estimating SOS values for homogeneous sites, while MODIS is more accurate for heterogeneous sites.
Figure 13 displays the derived EOS from MODIS and EPIC data for homogeneous and heterogeneous sites. The results of the combined data (all sites) are presented in Figure 7b for MODIS, where R = 0.58 and RMSE = 28 days, and Figure 8b for EPIC, where R = 0.63 and RMSE = 26 days. Figure 13a,b show that for both MODIS and EPIC, the R and RMSE values increased slightly for homogeneous sites. Figure 13c,d show that for both MODIS and EPIC, the R and RMSE values decreased slightly for heterogeneous sites. As a whole, EPIC estimated EOS more accurately than MODIS for homogeneous and heterogeneous sites. In comparison to Figure 12, the spread of R values was much less for EPIC’s EOS observations than for SOS observations (0.03 and 0.12, respectively), indicating that site homogeneity had less of an impact on the accuracy of observations for EOS.
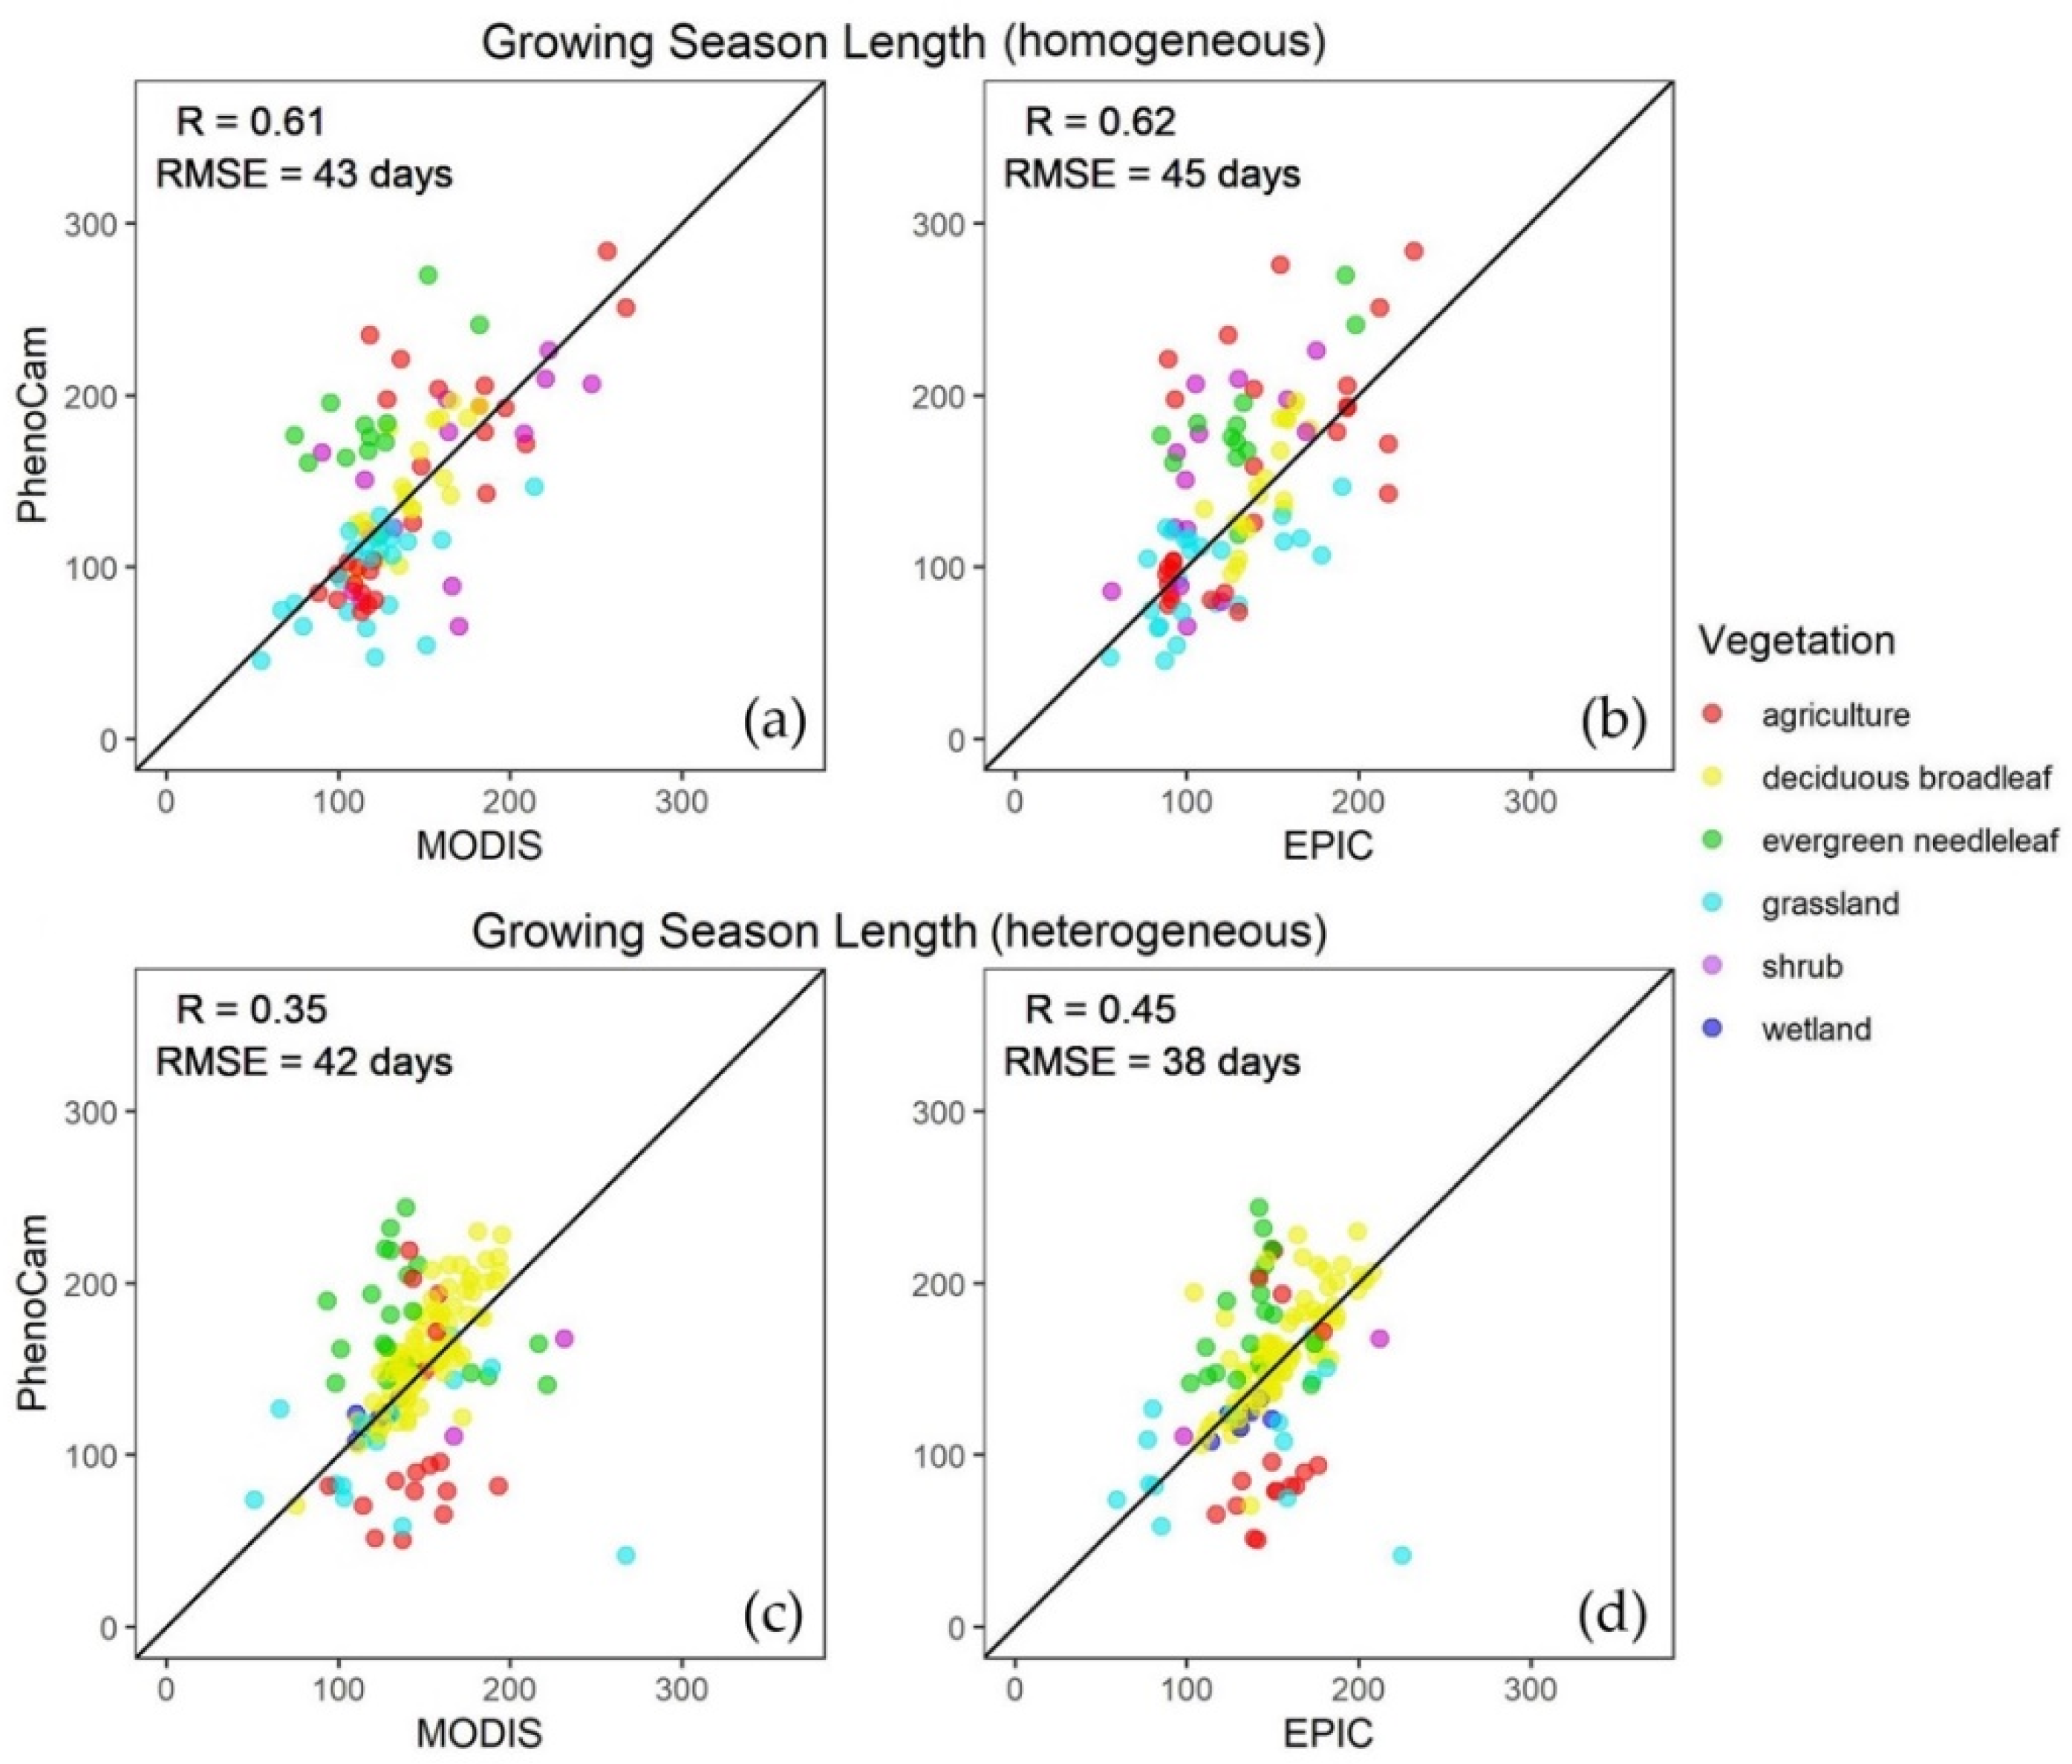
Figure 14 displays the derived growing season length from MODIS and EPIC data. The results of the combined data (all sites) are presented in Figure 9, where for MODIS, R = 0.49 and RMSE = 42 days, and for EPIC, R = 0.54 and RMSE = 41 days, respectively. Figure 14a,b show that for homogeneous sites, the R values increased noticeably, while RMSE increased slightly for both MODIS and EPIC. Figure 14c,d show that for heterogeneous sites, the R value decreased noticeably, while RMSE stayed constant for MODIS, and for EPIC, the R value also decreased noticeably, while RMSE decreased slightly. It is worth noting that EPIC still has a better performance than MODIS in the heterogeneous sites. The results of Figure 12, Figure 13 and Figure 14 indicated that there is a scale effect present, which could potentially affect the accuracy and efficacy of derived phenology indicators for depicting the inter-site and interannual variation (indicated by lower R values) of phenology, but likely has limited impacts on the overall error (indicated by similar RMSEs) of the growing season length with EPIC observations at a coarser spatial resolution.

4. Discussion

In this study, we examined the potential of using observations from the EPIC sensor on DSCOVR satellite, which has a significant advantage of observing the sunlit portion of the entire Earth once every 1–2 h at a 10 km spatial resolution, to derive vegetation phenology indicators (SOS, EOS, and GSL). Comparing these indicators with ones derived from the ground-based PhenoCam observations as a benchmark, we found that EPIC at least has similar performance in detecting the seasonal transition dates of these indicators and, thus, confirmed EPIC’s suitability for monitoring vegetation phenology for different vegetation types, globally. Moreover, we found that MODIS and Landsat could depict the onset of greening (SOS), but are less accurate in depicting the senescence phase (EOS). In contrast, EPIC is more consistent in accurately depicting both SOS and EOS across different vegetation types (Figure 6, Figure 7 and Figure 8). This can be attributed to the temporal resolution differences of the three datasets, with EPIC having more frequent observations at a lower spatial resolution, and MODIS and Landsat having fewer observations at a higher spatial resolution. Landsat, specifically, only has about 15 high-quality pixel observations per year due to a combination of its orbital geometry and cloud contamination, which makes it difficult to precisely detect inter- and intra-seasonal changes in vegetation phenology, whereas MODIS has limited observation data due to the cloud contamination [32,33,34]. By contrast, DSCOVR/EPIC can capture short-term variations due to its high temporal resolution (1–2 h). EPIC’s ability to better depict both SOS and EOS makes it an attractive option for studying GSL (Figure 9). In addition, EPIC’s near-hotspot observing angle helps minimize the impact of complex canopy structure on surface reflectance, characterized by the Bidirectional Reflectance (BRDF) [35,36,37]. This may explain EPIC’s superior performance in detecting evergreen needleleaf forest phenology since the evergreen needleleaf forest has the strongest BRDF effects due to the discrete tree crowns. Therefore, the promising performance of EPIC in detecting the vegetation phenology cycle may allow us to use EPIC in similar ways as MODIS for a variety of ecological applications [38,39]. Because of EPIC’s excellent ability to observe phenology cycles in deciduous forests, it can be used as a suitable dataset to quantify the duration and severity of the pollen season. Several species of deciduous trees, such as birch and oak, produce potent allergenic pollen [40], and satellite phenology has the potential to characterize the relationship between phenology and pollen season [6] and ultimately its association with pollen allergies [41].
It is clear that there are a few disadvantages of using EPIC data for monitoring vegetation phenology. First, DSCOVR/EPIC is a new satellite/sensor, and its observation is for a relatively short period, which limits its use in producing a long-term record of vegetation phenology, which could be particularly useful for climate change studies. Second, the EPIC observations show greater scatter/variability than MODIS due to its coarser spatial resolution. Thus, EPIC may be less suitable for monitoring phenology for ecosystems and regions with high land cover heterogeneity. Although the scale effects have some impacts on EPIC-derived phenology, EPIC still shows good performance compared to PhenoCam observations (Figure 12, Figure 13 and Figure 14), probably due to integrated observations over a larger area and more frequently and the near-hotspot observations that minimize the sun-sensor-satellite geometrical effects [31]. However, DSCOVR/EPIC is continuing its mission and accumulating more data with its advantageous features. One can also apply advanced data fusion technologies [12] to fuse EPIC with other high spatial resolution satellite observations (e.g., MODIS) to generate a hybrid data product, which has both high spatial and temporal resolutions. The fused data product will alleviate the problem caused by land surface heterogeneity and potentially provide a better foundation for monitoring phenology of evergreen needleleaf forests, considering the outstanding performance of phenology detection of EPIC for that type of vegetation.
In this study, we used EVI as the indicator of vegetation growth and applied the double logistic function to fit the EVI time series for phenology detection. Although this is the most widely accepted approach of extracting the key phenological transition dates, it is worth noting that other vegetation indices, such as Leaf Area Index (LAI) [42] and 2-band Enhanced Vegetation Index (EVI2) [43], and other fitting functions, such as polynomial function, Gaussian function, and Fourier periodic function, are commonly employed for similar purposes [12]. The use of alternative vegetation indices and fitting functions may result in a difference in the results to some degree and is worth further exploration. In addition, the analysis in this study is limited to North America as it has the largest amount of PhenoCam data and covers all major vegetation types. The analysis can be further extended to ascertain the suitability of EPIC and proposed methodology for a greater number of PhenoCam sites across a larger geographic area and climate zones, and a longer period of the ongoing observations from EPIC.

5. Conclusions

This study is the first of its kind in exploring the use of EPIC observations from the DSCOVR satellite to observe seasonal changes in the phenology of Earth’s vegetation. Our results indicated that EPIC observations that have a high temporal resolution (1–2 h) are capable of capturing the seasonal dynamics of vegetation phenology, as represented by the SOS, EOS, and GSL indicators, for a variety of land surface cover types in North America. We found that while MODIS is slightly better than EPIC at observing SOS in comparison to PhenoCam, overall, EPIC captures EOS better than both MODIS and Landsat and is more consistent across all vegetation types. We suggest that this is probably due to the higher temporal resolution of EPIC observation, especially when observing a more homogeneous land cover type (i.e., deciduous broadleaf forests). Additionally, despite its coarse spatial resolution, EPIC is able to detect small changes in land cover greening for all vegetation/site types, as demonstrated by its ability to replicate the shape of the PhenoCam in situ observational time series.

Author Contributions

Conceptualization, G.R.A., D.H., and M.C.; methodology, D.H., X.L., and Y.Z.; formal analysis, M.W. and D.H.; investigation, M.W.; data curation, M.W. and D.H.; writing—original draft preparation, M.W. and G.R.A.; writing—review and editing, M.W., D.H., G.R.A., Y.Z., X.L., and M.C.; visualization, M.W.; supervision, G.R.A., M.C., and D.H. All authors have read and agreed to the published version of the manuscript.

Funding

The preliminary research for this study was supported by the Department of Energy Office of Science Summer Undergraduate Laboratory Internship Program, in which M.W. was a participant, and then by a Laboratory Directed Research and Development Project by the Pacific Northwest National Laboratory awarded to M.C. Additional funding was provided by the NASA INCA grant, for which G.R.A. was the Principal Investigator, and a NASA Arctic Boreal Vulnerability Experiment Phase 2 Project awarded to M.C.

Acknowledgments

We thank our many collaborators, including site PIs and technicians, for their efforts in support of PhenoCam. The development of PhenoCam has been funded by the Northeastern States Research Cooperative, NSF’s Macrosystems Biology program (awards EF-1065029 and EF-1702697), and DOE’s Regional and Global Climate Modeling program (award DE-SC0016011). We acknowledge additional support from the US National Park Service Inventory and Monitoring Program and the USA National Phenology Network (grant number G10AP00129 from the United States Geological Survey), and from the USA National Phenology Network and North Central Climate Science Center (cooperative agreement number G16AC00224 from the United States Geological Survey). Additional funding, through the National Science Foundation’s LTER program, has supported research at Harvard Forest (DEB-1237491) and Bartlett Experimental Forest (DEB-1114804). We also thank the USDA Forest Service Air Resource Management program and the National Park Service Air Resources program for contributing their camera imagery to the PhenoCam archive. We express our appreciation to NASA for making satellite observations publicly available for this study. M.W. thanks Ghassem Asrar, Dalei Hao, and Min Chen for their guidance and mentoring during this project and her summer internship. She also thanks other mentors Ben Bond-Lamberty and Stephanie Pennington for their teaching and advice for data analysis and visualization and Matthew Brueseke and Matthew Kirk for their influence and support in pursuing her career during undergraduate classes.

Conflicts of Interest

The authors declare no conflict of interest.

Appendix A

Figure A1. Derived vegetation phenology indicators of SOS and EOS from EVI for agriculture study site ‘arsmnswanlake1’ based on (a) PhenoCam, (b) EPIC, (c) Landsat, and (d) MODIS observations. The green triangles indicate SOS, and the red triangles indicate EOS for each time series. The y-axis scale was kept constant for Landsat, MODIS, and EPIC, but adjusted for PhenoCam to better show the shape of the curve.
Remotesensing 12 02384 g0a1
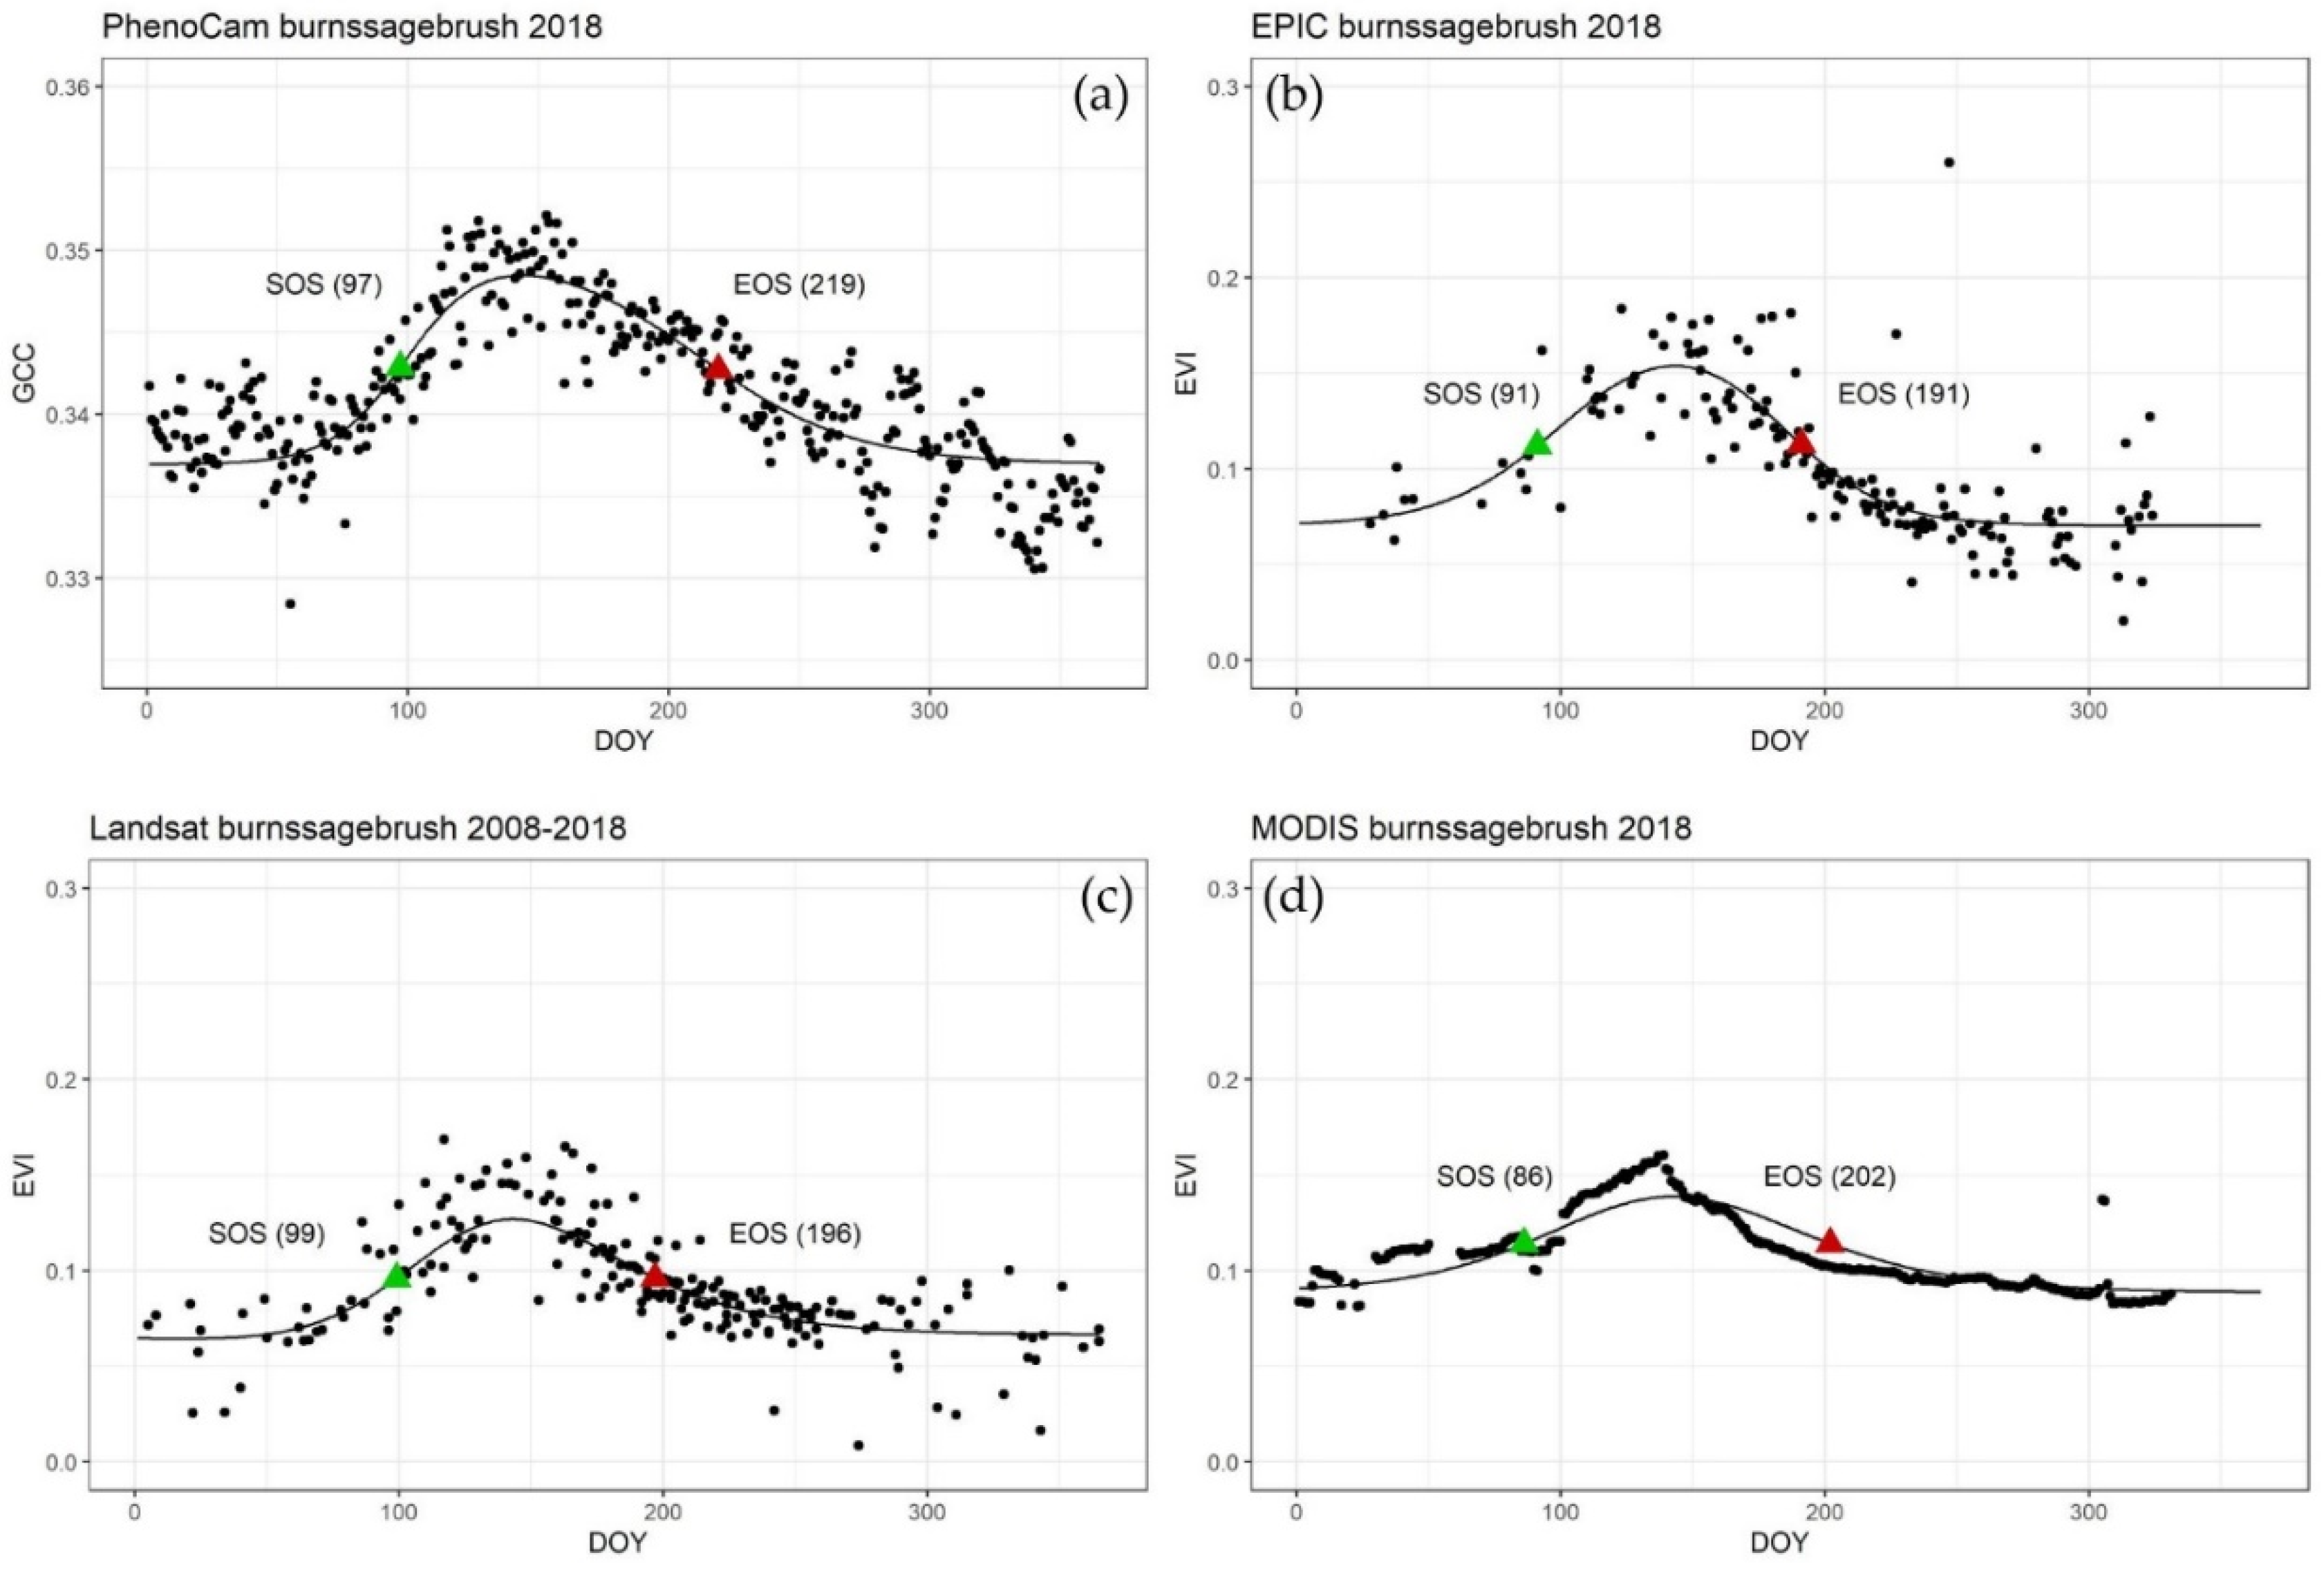
Figure A2. Derived vegetation phenology indicators of SOS and EOS from EVI for shrub study site ‘burnssagebrush’ based on (a) PhenoCam, (b) EPIC, (c) Landsat, and (d) MODIS observations. The green triangles indicate SOS, and the red triangles indicate EOS for each time series. The y-axis scale was kept constant for Landsat, MODIS, and EPIC, but adjusted for PhenoCam to better show the shape of the curve.
Remotesensing 12 02384 g0a2
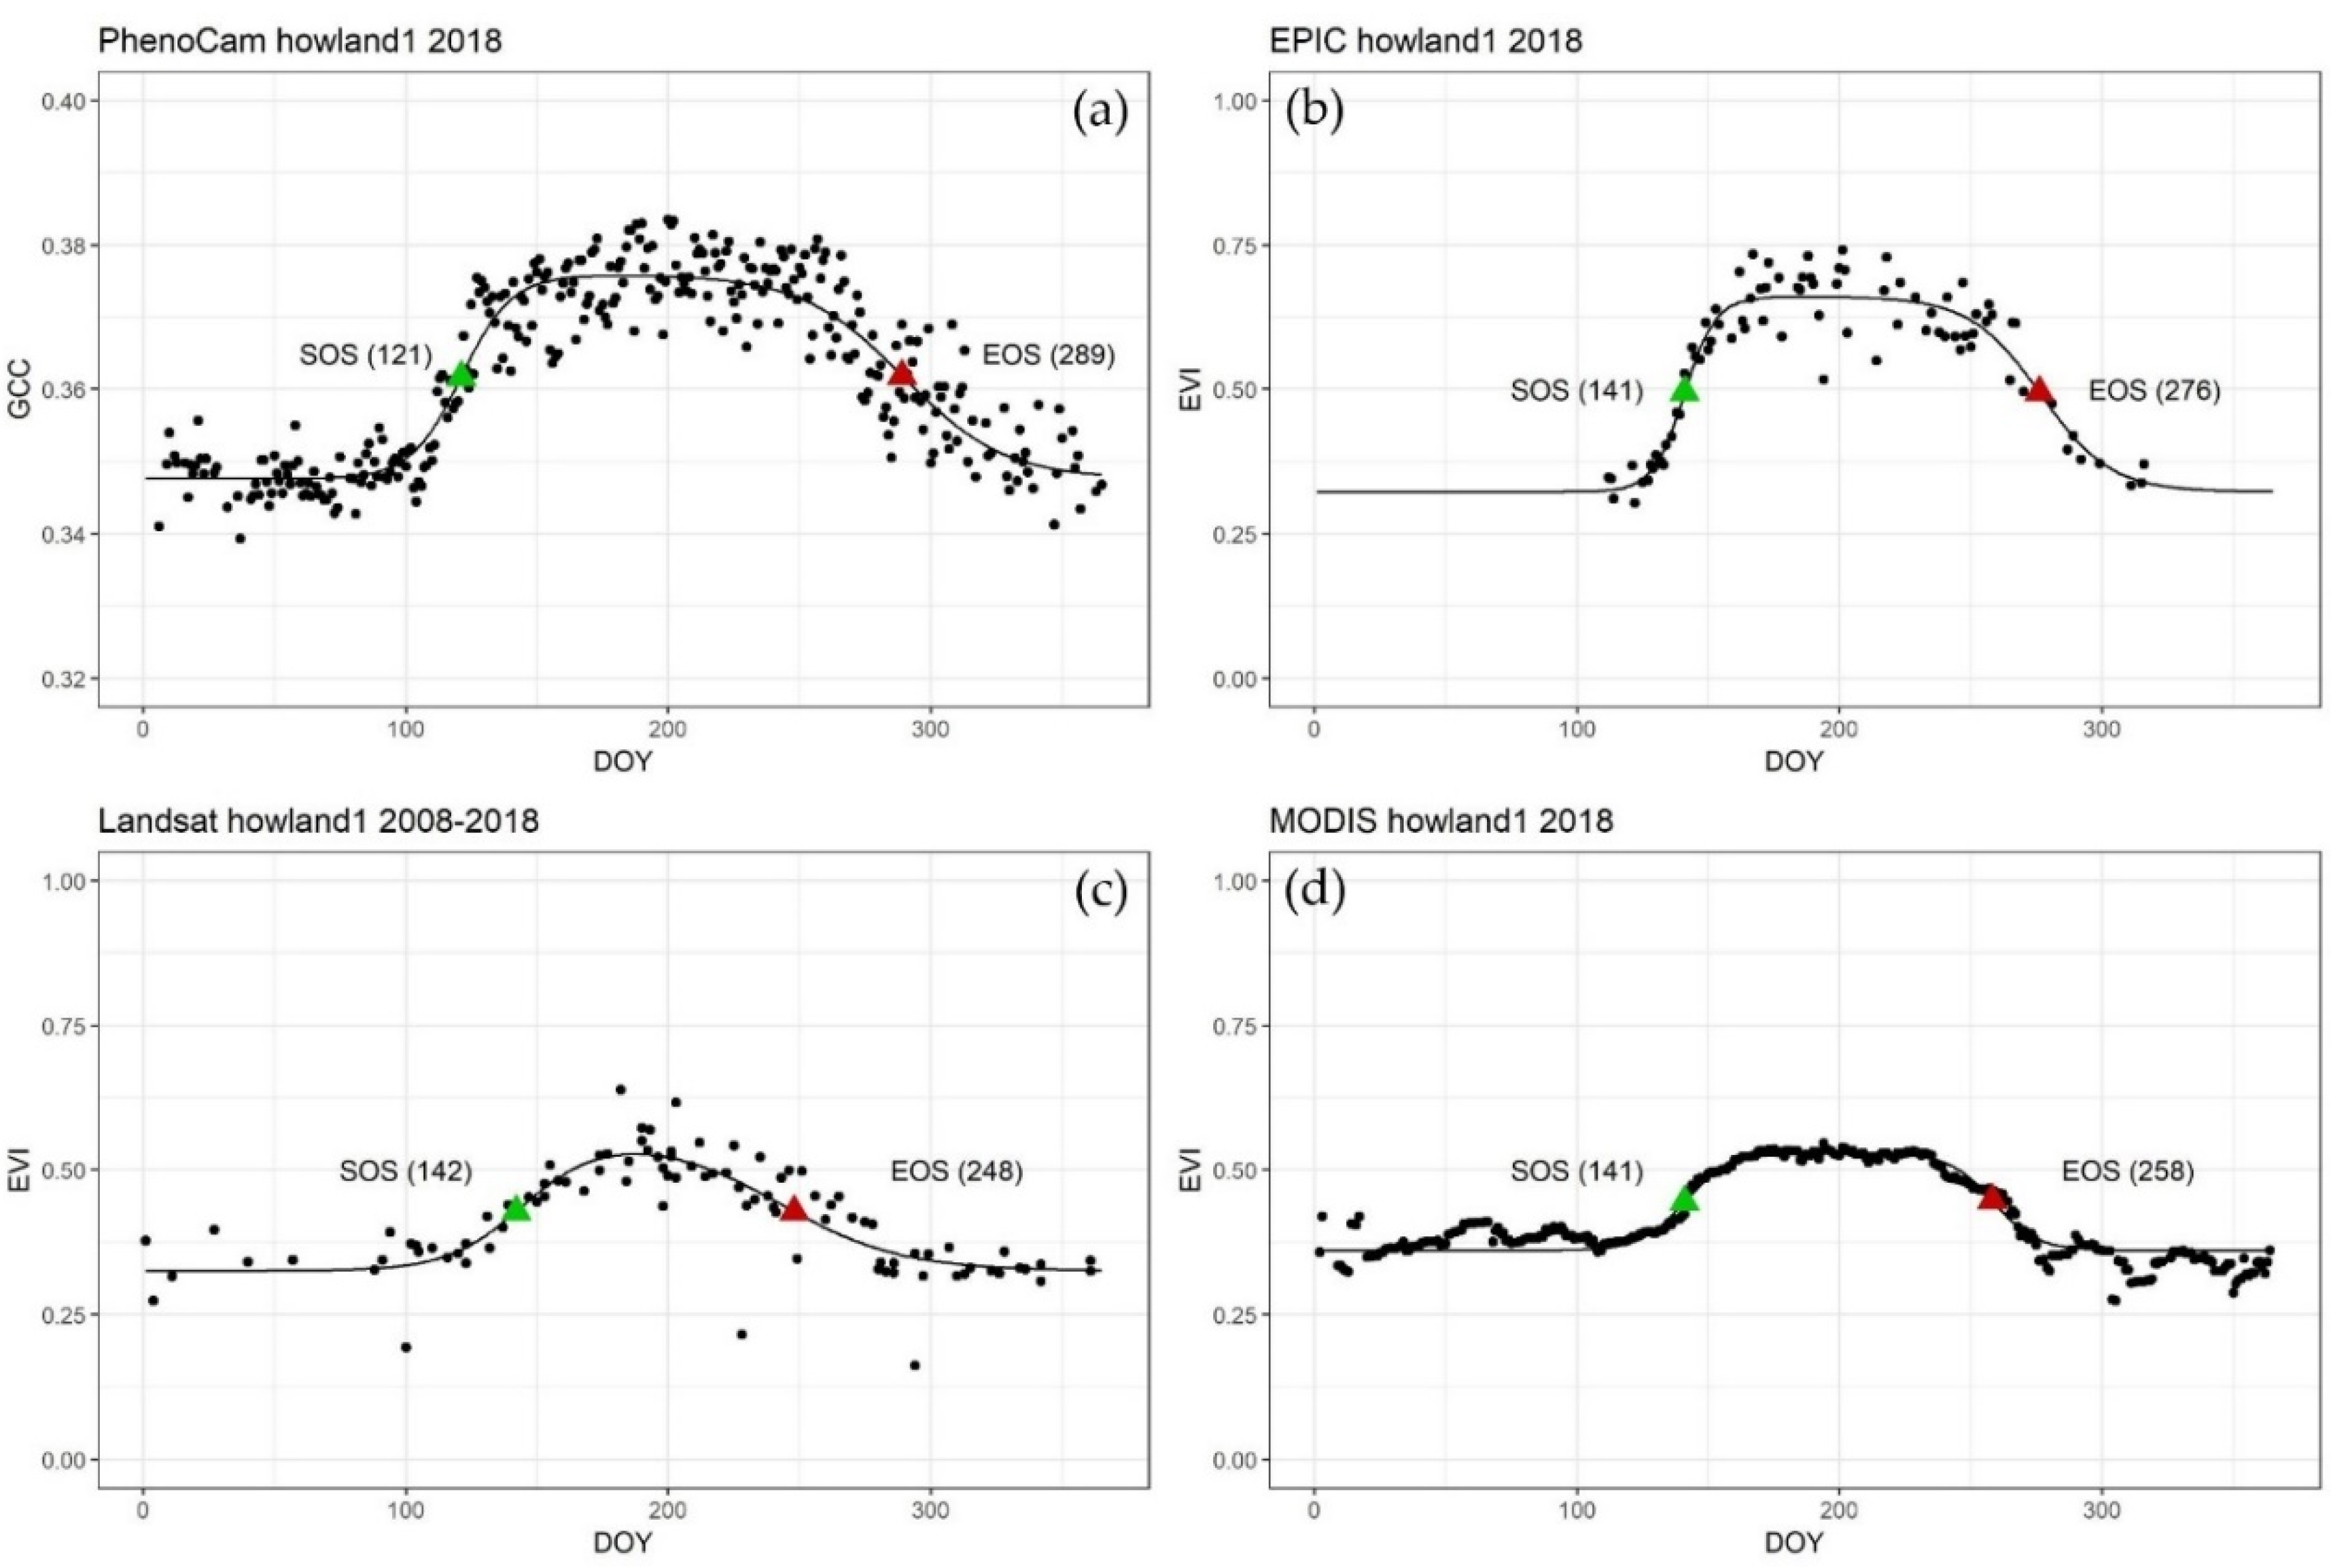
Figure A3. Derived vegetation phenology indicators of SOS and EOS from EVI for evergreen needleleaf study site ‘howland1’ based on (a) PhenoCam, (b) EPIC, (c) Landsat, and (d) MODIS observations. The green triangles indicate SOS, and the red triangles indicate EOS for each time series. The y-axis scale was kept constant for Landsat, MODIS, and EPIC, but adjusted for PhenoCam to better show the shape of the curve.
Remotesensing 12 02384 g0a3
Figure A4. Derived vegetation phenology indicators of SOS and EOS from EVI for grassland study site ‘konza’ based on (a) PhenoCam, (b) EPIC, (c) Landsat, and (d) MODIS observations. The green triangles indicate SOS, and the red triangles indicate EOS for each time series. The y-axis scale was kept constant for Landsat, MODIS, and EPIC, but adjusted for PhenoCam to better show the shape of the curve.
Remotesensing 12 02384 g0a4
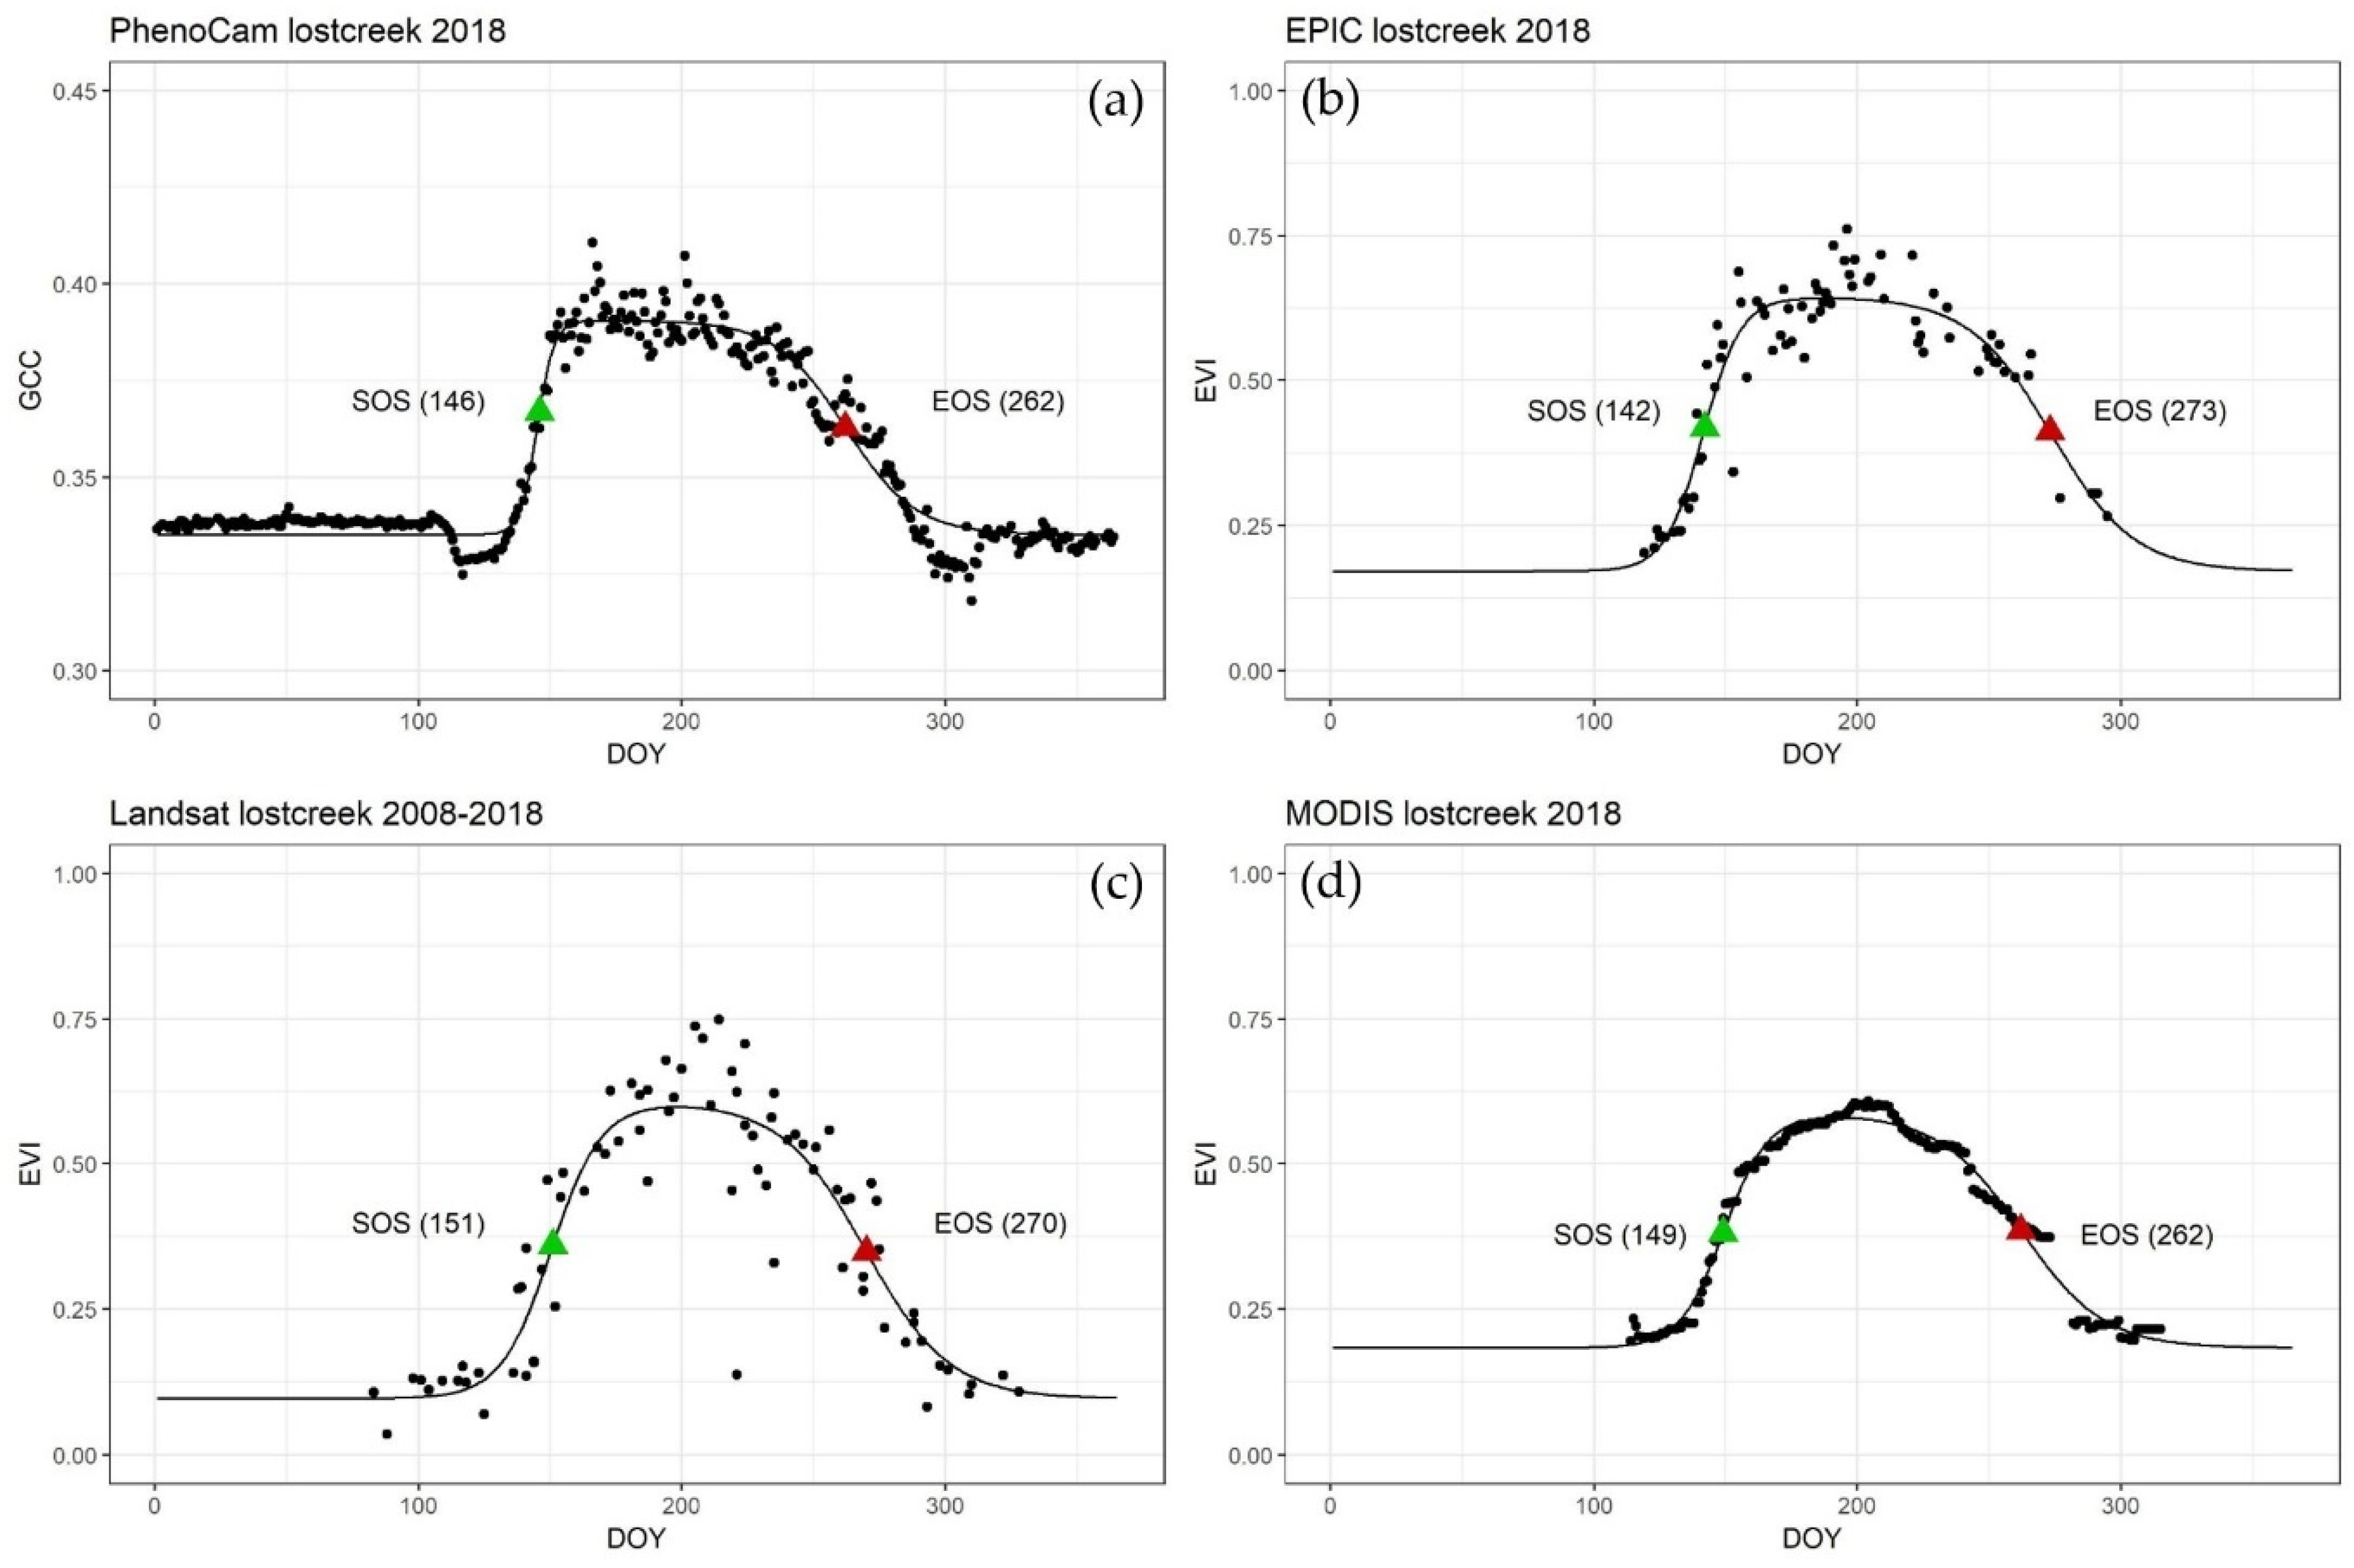
Figure A5. Derived vegetation phenology indicators of SOS and EOS from EVI for wetland study site ‘lostcreek’ based on (a) PhenoCam, (b) EPIC, (c) Landsat, and (d) MODIS observations. The green triangles indicate SOS, and the red triangles indicate EOS for each time series. The y-axis scale was kept constant for Landsat, MODIS, and EPIC, but adjusted for PhenoCam to better show the shape of the curve.
Remotesensing 12 02384 g0a5

References

  1. Li, X.; Zhou, Y.; Asrar, G.R.; Mao, J.; Li, X.; Li, W. Response of vegetation phenology to urbanization in the conterminous United States. Glob. Chang. Boil. 2016, 23, 2818–2830. [Google Scholar] [CrossRef] [PubMed]
  2. Lucht, W.; Cramer, W. Climatic Control of the High-Latitude Vegetation Greening Trend and Pinatubo Effect. Science 2002, 296, 1687–1689. [Google Scholar] [CrossRef] [PubMed] [Green Version]
  3. Zhang, X.; Friedl, M.A.; Schaaf, C.; Strahler, A.H. Climate controls on vegetation phenological patterns in northern mid- and high latitudes inferred from MODIS data. Glob. Chang. Boil. 2004, 10, 1133–1145. [Google Scholar] [CrossRef]
  4. Zhou, L.; Tucker, C.; Kaufmann, R.K.; Slayback, D.; Shabanov, N.V.; Myneni, R. Variations in northern vegetation activity inferred from satellite data of vegetation index during 1981 to 1999. J. Geophys. Res. Atmos. 2001, 106, 20069–20083. [Google Scholar] [CrossRef]
  5. Li, X.; Zhou, Y.; Meng, L.; Asrar, G.R.; Lu, C.; Wu, Q. A dataset of 30 m annual vegetation phenology indicators (1985–2015) in urban areas of the conterminous United States. Earth Syst. Sci. Data 2019, 11, 881–894. [Google Scholar] [CrossRef] [Green Version]
  6. Sapkota, A.; Murtugudde, R.; Curriero, F.C.; Upperman, C.R.; Ziska, L.; Jiang, C. Associations between alteration in plant phenology and hay fever prevalence among US adults: Implication for changing climate. PLoS ONE 2019, 14, e0212010. [Google Scholar] [CrossRef]
  7. Bolton, D.K.; Friedl, M.A. Forecasting crop yield using remotely sensed vegetation indices and crop phenology metrics. Agric. For. Meteorol. 2013, 173, 74–84. [Google Scholar] [CrossRef]
  8. Nemani, R.R.; Hashimoto, H.; Votava, P.; Melton, F.; Wang, W.; Michaelis, A.; Mutch, L.; Milesi, C.; Hiatt, S.; White, M.A. Monitoring and forecasting ecosystem dynamics using the Terrestrial Observation and Prediction System (TOPS). Remote Sens. Environ. 2009, 113, 1497–1509. [Google Scholar] [CrossRef]
  9. Justice, C.; Townshend, J.R.G.; Holben, B.N.; Tucker, C.J. Analysis of the phenology of global vegetation using meteorological satellite data. Int. J. Remote Sens. 1985, 6, 1271–1318. [Google Scholar] [CrossRef]
  10. Reed, B.; Schwartz, M.; Xiao, X. Phenology of Ecosystem Processes; Noormets, A., Ed.; Springer: Berlin, Germany, 2009; pp. 231–246. ISBN 978-1-4419-0025-8. [Google Scholar]
  11. Zhang, X.; Friedl, M.A.; Schaaf, C.; Strahler, A.H.; Hodges, J.C.; Gao, F.; Reed, B.C.; Huete, A. Monitoring vegetation phenology using MODIS. Remote Sens. Environ. 2003, 84, 471–475. [Google Scholar] [CrossRef]
  12. Zeng, L.; Wardlow, B.; Xiang, D.; Hu, S.; Li, D. A review of vegetation phenological metrics extraction using time-series, multispectral satellite data. Remote Sens. Environ. 2020, 237, 111511. [Google Scholar] [CrossRef]
  13. Li, X.; Zhou, Y.; Asrar, G.R.; Meng, L. Characterizing spatiotemporal dynamics in phenology of urban ecosystems based on Landsat data. Sci. Total. Environ. 2017, 605, 721–734. [Google Scholar] [CrossRef] [PubMed]
  14. Yan, N.; Zhang, X.; Yu, Y.; Guo, W. A Comparison of Tropical Rainforest Phenology Retrieved From Geostationary (SEVIRI) and Polar-Orbiting (MODIS) Sensors Across the Congo Basin. IEEE Trans. Geosci. Remote Sens. 2016, 54, 4867–4881. [Google Scholar] [CrossRef] [Green Version]
  15. Miura, T.; Nagai, S.; Takeuchi, M.; Ichii, K.; Yoshioka, H. Improved Characterisation of Vegetation and Land Surface Seasonal Dynamics in Central Japan with Himawari-8 Hypertemporal Data. Sci. Rep. 2019, 9, 1–12. [Google Scholar] [CrossRef] [PubMed] [Green Version]
  16. Marshak, A.; Herman, J.; Adam, S.; Karin, B.; Carn, S.; Cede, A.; Geogdzhayev, I.; Huang, D.; Huang, L.-K.; Knyazikhin, Y.; et al. Earth Observations from DSCOVR EPIC Instrument. Bull. Am. Meteorol. Soc. 2018, 99, 1829–1850. [Google Scholar] [CrossRef] [PubMed]
  17. Yang, B.; Knyazikhin, Y.; Mõttus, M.; Rautiainen, M.; Stenberg, P.; Yan, L.; Chen, C.; Yan, K.; Choi, S.; Park, T.; et al. Estimation of leaf area index and its sunlit portion from DSCOVR EPIC data: Theoretical basis. Remote Sens. Environ. 2017, 198, 69–84. [Google Scholar] [CrossRef] [PubMed] [Green Version]
  18. Hao, D.; Asrar, G.R.; Zeng, Y.; Zhu, Q.; Wen, J.; Xiao, Q.; Chen, M. Estimating hourly land surface downward shortwave and photosynthetically active radiation from DSCOVR/EPIC observations. Remote Sens. Environ. 2019, 232, 111320. [Google Scholar] [CrossRef]
  19. MODIS Web. Available online: https://modis.gsfc.nasa.gov/about/design.php (accessed on 17 April 2020).
  20. Landsat 7 « Landsat Science. Available online: https://landsat.gsfc.nasa.gov/landsat-7/ (accessed on 26 June 2020).
  21. Richardson, A.D. Phenocam Explorer. Available online: http://explore.phenocam.us/ (accessed on 29 April 2020).
  22. Richardson, A.D.; Hufkens, K.; Milliman, T.; Aubrecht, D.M.; Chen, M.; Gray, J.M.; Johnston, M.R.; Keenan, T.F.; Klosterman, S.T.; Kosmala, M.; et al. Tracking vegetation phenology across diverse North American biomes using PhenoCam imagery. Sci. Data 2018, 5, 180028. [Google Scholar] [CrossRef]
  23. Earthdata Search. Available online: https://search.earthdata.nasa.gov/search/granules?p=C1451664065-LARC_ASDC&tl=1547731863!4!! (accessed on 17 April 2020).
  24. USGS Landsat 7 Collection 1 Tier 1 TOA Reflectance. Available online: https://developers.google.com/earth-engine/datasets/catalog/LANDSAT_LE07_C01_T1_TOA (accessed on 17 April 2020).
  25. MCD43A4.006 MODIS Nadir BRDF-Adjusted Reflectance, Daily 500m. Available online: https://developers.google.com/earth-engine/datasets/catalog/MODIS_006_MCD43A4 (accessed on 17 April 2020).
  26. Liu, H.Q.; Huete, A. A feedback based modification of the NDVI to minimize canopy background and atmospheric noise. IEEE Trans. Geosci. Remote Sens. 1995, 33, 457–465. [Google Scholar] [CrossRef]
  27. Melaas, E.; Friedl, M.A.; Zhu, Z. Detecting interannual variation in deciduous broadleaf forest phenology using Landsat TM/ETM+ data. Remote Sens. Environ. 2013, 132, 176–185. [Google Scholar] [CrossRef]
  28. Zhu, Z.; Fu, Y.; Woodcock, C.E.; Olofsson, P.; Vogelmann, J.; Holden, C.; Wang, M.; Dai, S.; Yu, Y. Including land cover change in analysis of greenness trends using all available Landsat 5, 7, and 8 images: A case study from Guangzhou, China (2000–2014). Remote Sens. Environ. 2016, 185, 243–257. [Google Scholar] [CrossRef] [Green Version]
  29. Sonnentag, O.; Hufkens, K.; Teshera-Sterne, C.; Young, A.M.; Friedl, M.; Braswell, B.; Milliman, T.; O’Keefe, J.; Richardson, A.D. Digital repeat photography for phenological research in forest ecosystems. Agric. For. Meteorol. 2012, 152, 159–177. [Google Scholar] [CrossRef]
  30. Huete, A.; Didan, K.; Miura, T.; Rodriguez, E.; Gao, X.; Ferreira, L. Overview of the radiometric and biophysical performance of the MODIS vegetation indices. Remote Sens. Environ. 2002, 83, 195–213. [Google Scholar] [CrossRef]
  31. Liu, L.; Cao, R.; Shen, M.; Chen, J.; Wang, J.; Zhang, X. How Does Scale Effect Influence Spring Vegetation Phenology Estimated from Satellite-Derived Vegetation Indexes? Remote. Sens. 2019, 11, 2137. [Google Scholar] [CrossRef] [Green Version]
  32. Wilson, A.M.; Jetz, W. Remotely Sensed High-Resolution Global Cloud Dynamics for Predicting Ecosystem and Biodiversity Distributions. PLoS Boil. 2016, 14, e1002415. [Google Scholar] [CrossRef] [PubMed]
  33. Wilson, A.M.; Parmentier, B.; Jetz, W. Systematic land cover bias in Collection 5 MODIS cloud mask and derived products—A global overview. Remote Sens. Environ. 2014, 141, 149–154. [Google Scholar] [CrossRef]
  34. Wang, Y.; Zhao, C. Can MODIS cloud fraction fully represent the diurnal and seasonal variations at DOE ARM SGP and Manus sites? J. Geophys. Res. Atmos. 2017, 122, 329–343. [Google Scholar] [CrossRef]
  35. Hapke, B.; Dimucci, D.; Nelson, R.; Smythe, W. The cause of the hot spot in vegetation canopies and soils: Shadow-hiding versus coherent backscatter. Remote. Sens. Environ. 1996, 58, 63–68. [Google Scholar] [CrossRef] [Green Version]
  36. Goel, N.S.; Qin, W.; Wang, B. On the estimation of leaf size and crown geometry for tree canopies from hotspot observations. J. Geophys. Res. Space Phys. 1997, 102, 29543–29554. [Google Scholar] [CrossRef]
  37. Wenhan, Q.; Yueqin, X. On the hotspot effect of leaf canopies: Modeling study and influence of leaf shape. Remote Sens. Environ. 1994, 50, 95–106. [Google Scholar] [CrossRef]
  38. Sakamoto, T.; A Gitelson, A.; Arkebauer, T.J. MODIS-based corn grain yield estimation model incorporating crop phenology information. Remote Sens. Environ. 2013, 131, 215–231. [Google Scholar] [CrossRef]
  39. Funk, C.; Budde, M.E. Phenologically-tuned MODIS NDVI-based production anomaly estimates for Zimbabwe. Remote Sens. Environ. 2009, 113, 115–125. [Google Scholar] [CrossRef]
  40. Pollen Allergies|AAFA.org. Available online: https://www.aafa.org/pollen-allergy/ (accessed on 17 April 2020).
  41. Sapkota, A.; Dong, Y.; Li, L.; Asrar, G.; Zhou, Y.; Li, X.; Coates, F.; Spanier, A.J.; Matz, J.; Bielory, L.; et al. Association Between Changes in Timing of Spring Onset and Asthma Hospitalization in Maryland. JAMA Netw. Open 2020, 3, e207551. [Google Scholar] [CrossRef] [PubMed]
  42. Myneni, R.B.; Hoffman, S.; Knyazikhin, Y.; Privette, J.L.; Glassy, J.; Tian, Y.; Wang, Y.; Song, X.; Zhang, Y.; Smith, G.R.; et al. Global products of vegetation leaf area and fraction absorbed PAR from year one of MODIS data. Remote. Sens. Environ. 2002, 83, 214–231. [Google Scholar] [CrossRef] [Green Version]
  43. Jiang, Z.; Huete, A.; Didan, K.; Miura, T. Development of a two-band enhanced vegetation index without a blue band. Remote Sens. Environ. 2008, 112, 3833–3845. [Google Scholar] [CrossRef]
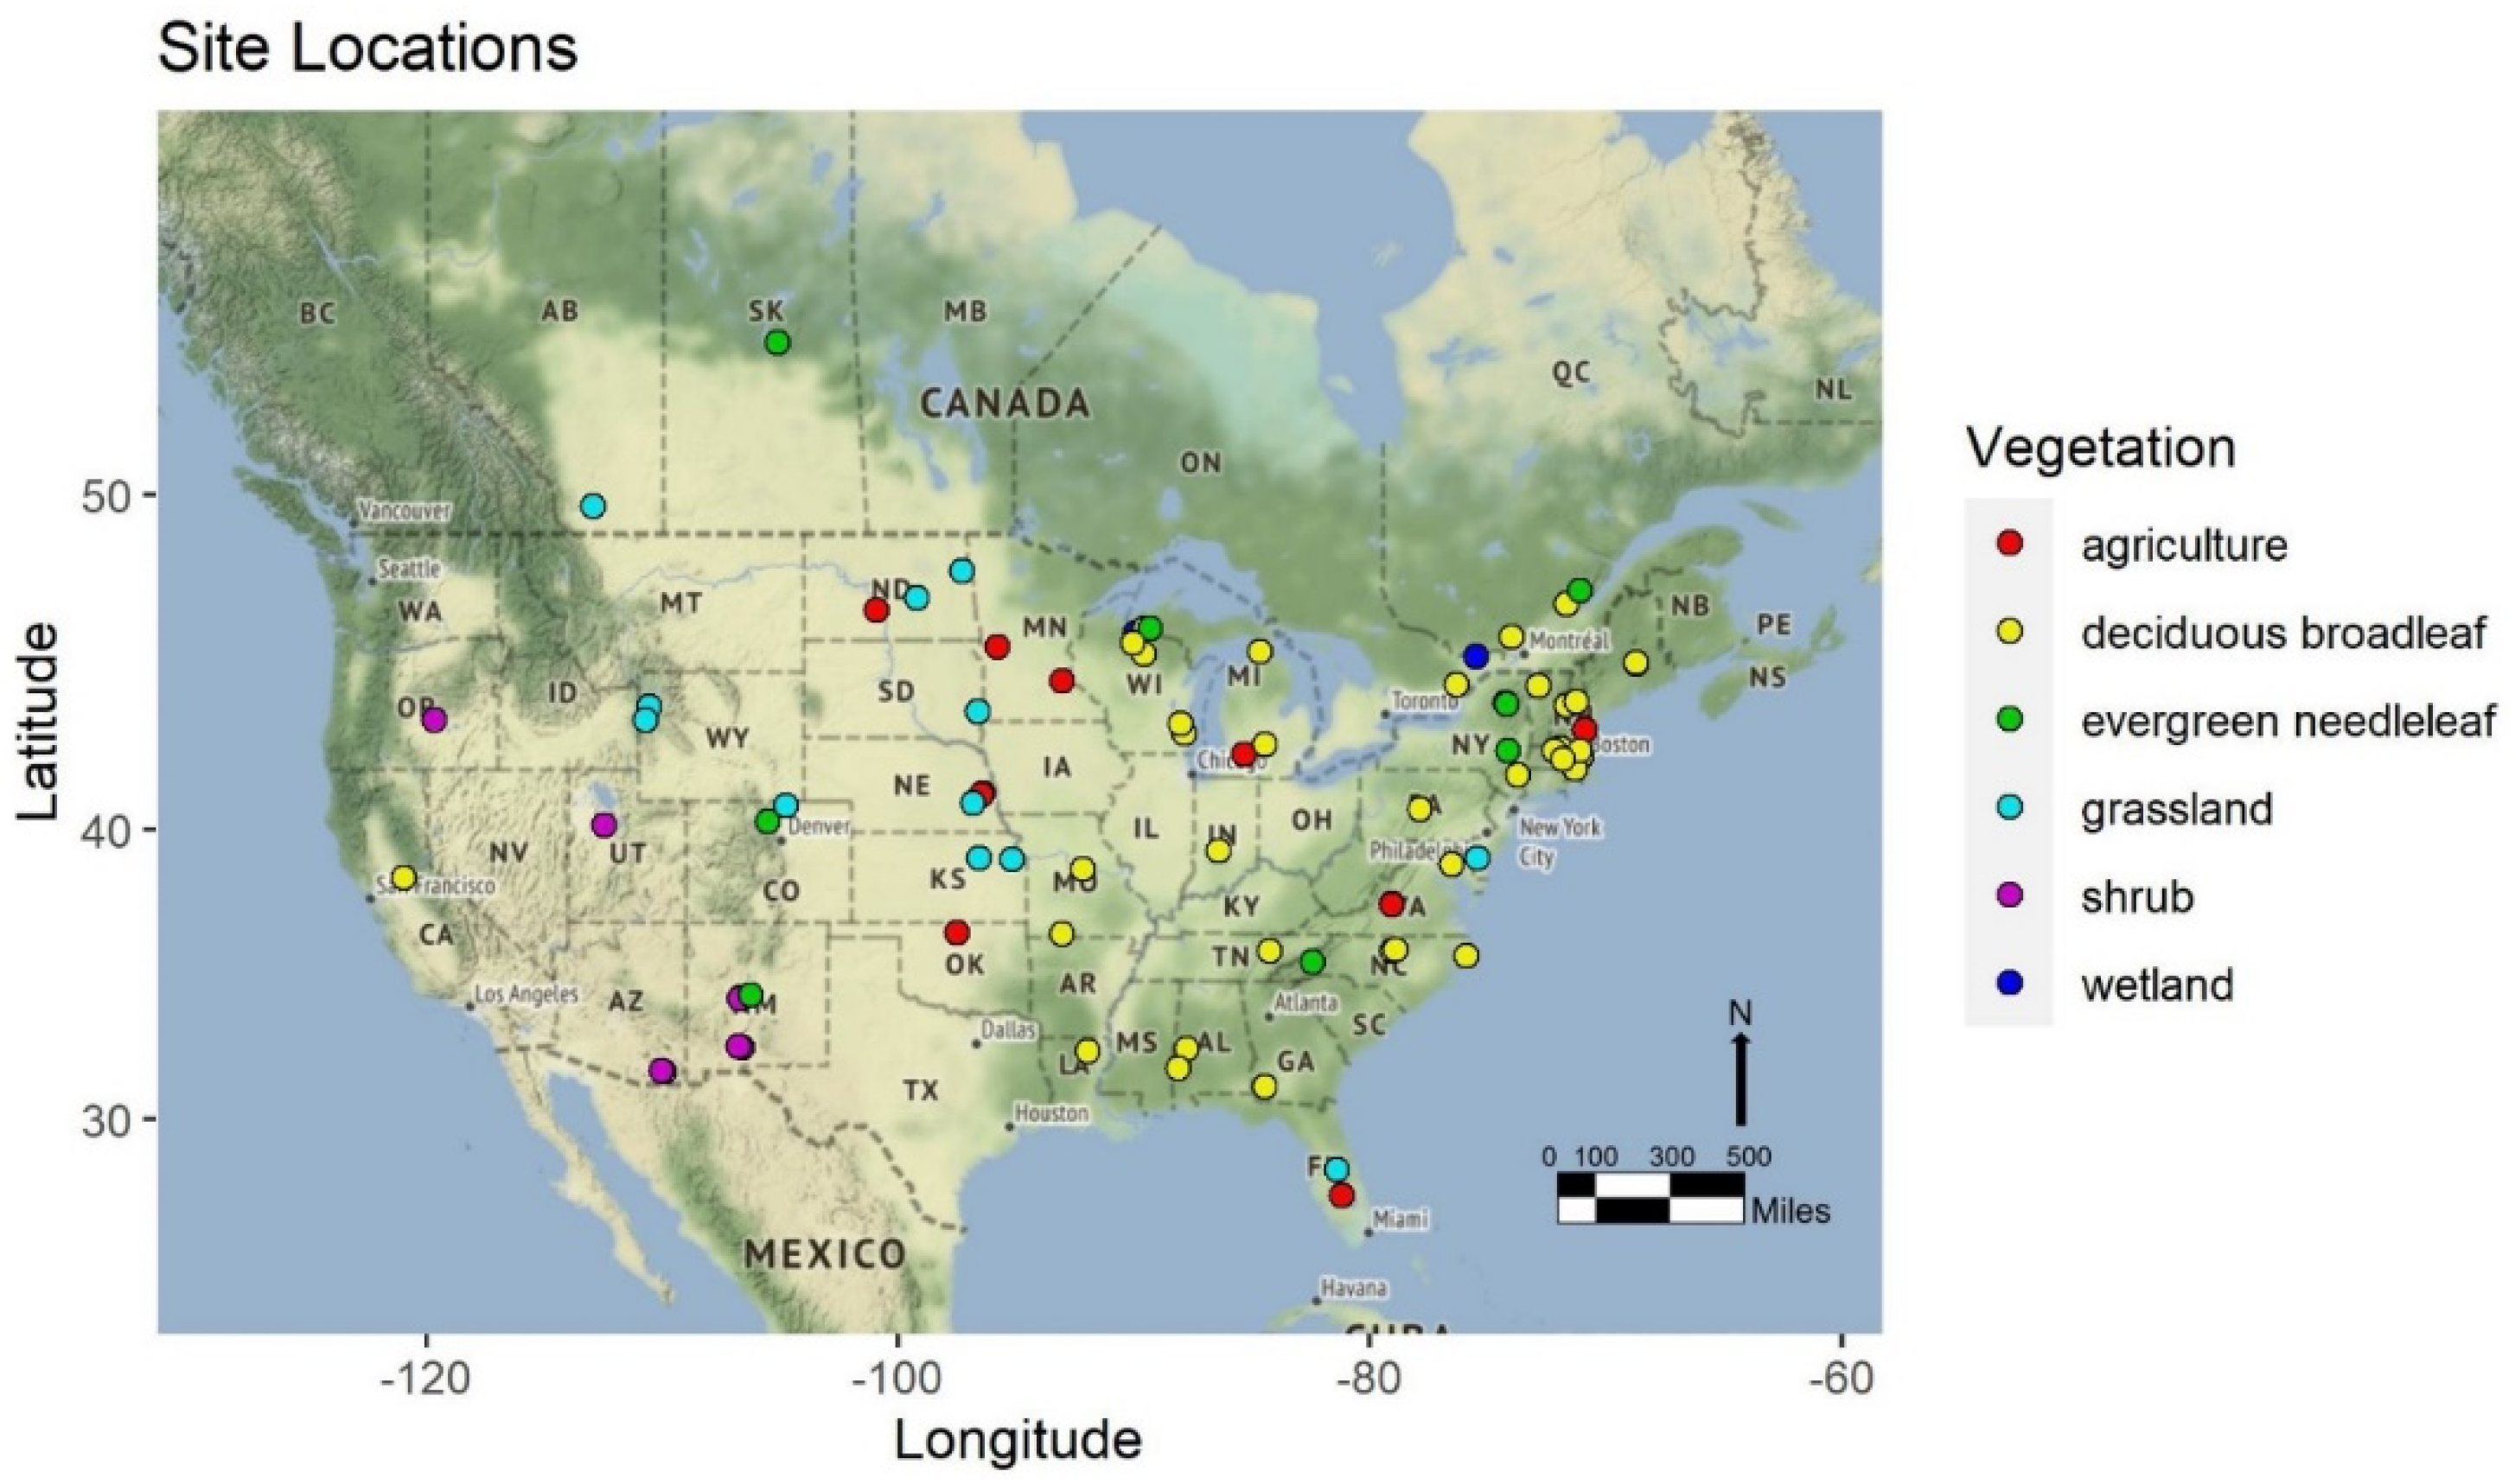
Figure 1. Locations of the 92 sites used in this study.
Remotesensing 12 02384 g001
Figure 2. PhenoCam pictures/images, representing the six land cover types used in this study, including site name and general location. The first row of pictures is for February 2017, and the second row is for July 2017. Pictures/images were obtained from the PhenoCam online gallery [21].
Remotesensing 12 02384 g002
Figure 3. Derived vegetation phenology indicators of Start of Season (SOS) and End of Season (EOS) from Enhanced Vegetation Index (EVI) for Konza Prairie (konza) study site (grassland), based on Earth Polychromatic Imaging Camera (EPIC) observations in 2018. The green triangle represents SOS at DOY = 128, and the red triangle represents EOS at DOY = 294. A similar analysis was conducted for the other 96 study sites (data is not presented here).
Remotesensing 12 02384 g003
Figure 4. Derived vegetation phenology indicators of SOS and EOS from EVI for Harvard Forest (harvard) study site (deciduous broadleaf), based on (a) PhenoCam, (b) EPIC, (c) Landsat, and (d) MODIS observations. The green triangles represent SOS, and the red triangles represent EOS for each vegetation type and dataset. The y-axis scale was kept constant for Landsat, MODIS, and EPIC, but amplified for PhenoCam for better illustration of the shape of the curve. Additional figures for the remaining five land cover types are in Appendix A.
Remotesensing 12 02384 g004
Figure 5. Derived (a) SOS and (b) EOS from PhenoCam, Landsat, MODIS, and EPIC for years 2016, 2017, and 2018, displayed for different land cover types.
Remotesensing 12 02384 g005
Figure 6. The correlation between Landsat and PhenoCam (a) SOS and (b) EOS DOY over 2016–2018.
Remotesensing 12 02384 g006
Figure 7. The correlation between MODIS and PhenoCam (a) SOS and (b) EOS DOY over 2016–2018.
Remotesensing 12 02384 g007
Figure 8. The correlation between EPIC and PhenoCam (a) SOS and (b) EOS DOY over 2016–2018.
Remotesensing 12 02384 g008
Figure 9. The correlation between Growing Season Length (GSL) (in days) for PhenoCam and (a) Landsat, (b) MODIS, and (c) EPIC over 2016–2018.
Remotesensing 12 02384 g009
Figure 10. The correlation of three satellite-based datasets and PhenoCam for (a) SOS, (b) EOS, and (c) GSL phenology indicators, by vegetation type from 2016–2018.
Remotesensing 12 02384 g010
Figure 11. The Root Mean Square Error (RMSE) (unit: days) for three satellite-based datasets and PhenoCam for (a) SOS, (b) EOS, and (c) GSL phenology indicators, by vegetation type from 2016–2018. Note, the y-axis of Figure 10c has different increments.
Remotesensing 12 02384 g011
Figure 12. The correlation of SOS (in days) for PhenoCam and (a) MODIS and (b) EPIC for homogeneous sites only, and PhenoCam and (c) MODIS and (d) EPIC for heterogeneous sites only during 2016–2018.
Remotesensing 12 02384 g012
Figure 13. The correlation of EOS (in days) for PhenoCam and (a) MODIS and (b) EPIC for homogeneous sites only, and PhenoCam and (c) MODIS and (d) EPIC for heterogeneous sites only during 2016–2018.
Remotesensing 12 02384 g013
Figure 14. The correlation of GSL (in days) for PhenoCam and (a) MODIS and (b) EPIC for homogeneous sites only, and PhenoCam and (c) MODIS and (d) EPIC for heterogeneous sites only during 2016–2018.
Remotesensing 12 02384 g014