Quantifying the Actual Impacts of Forest Cover Change on Surface Temperature in Guangdong, China


Abstract

1. Introduction
2. Data and Methods
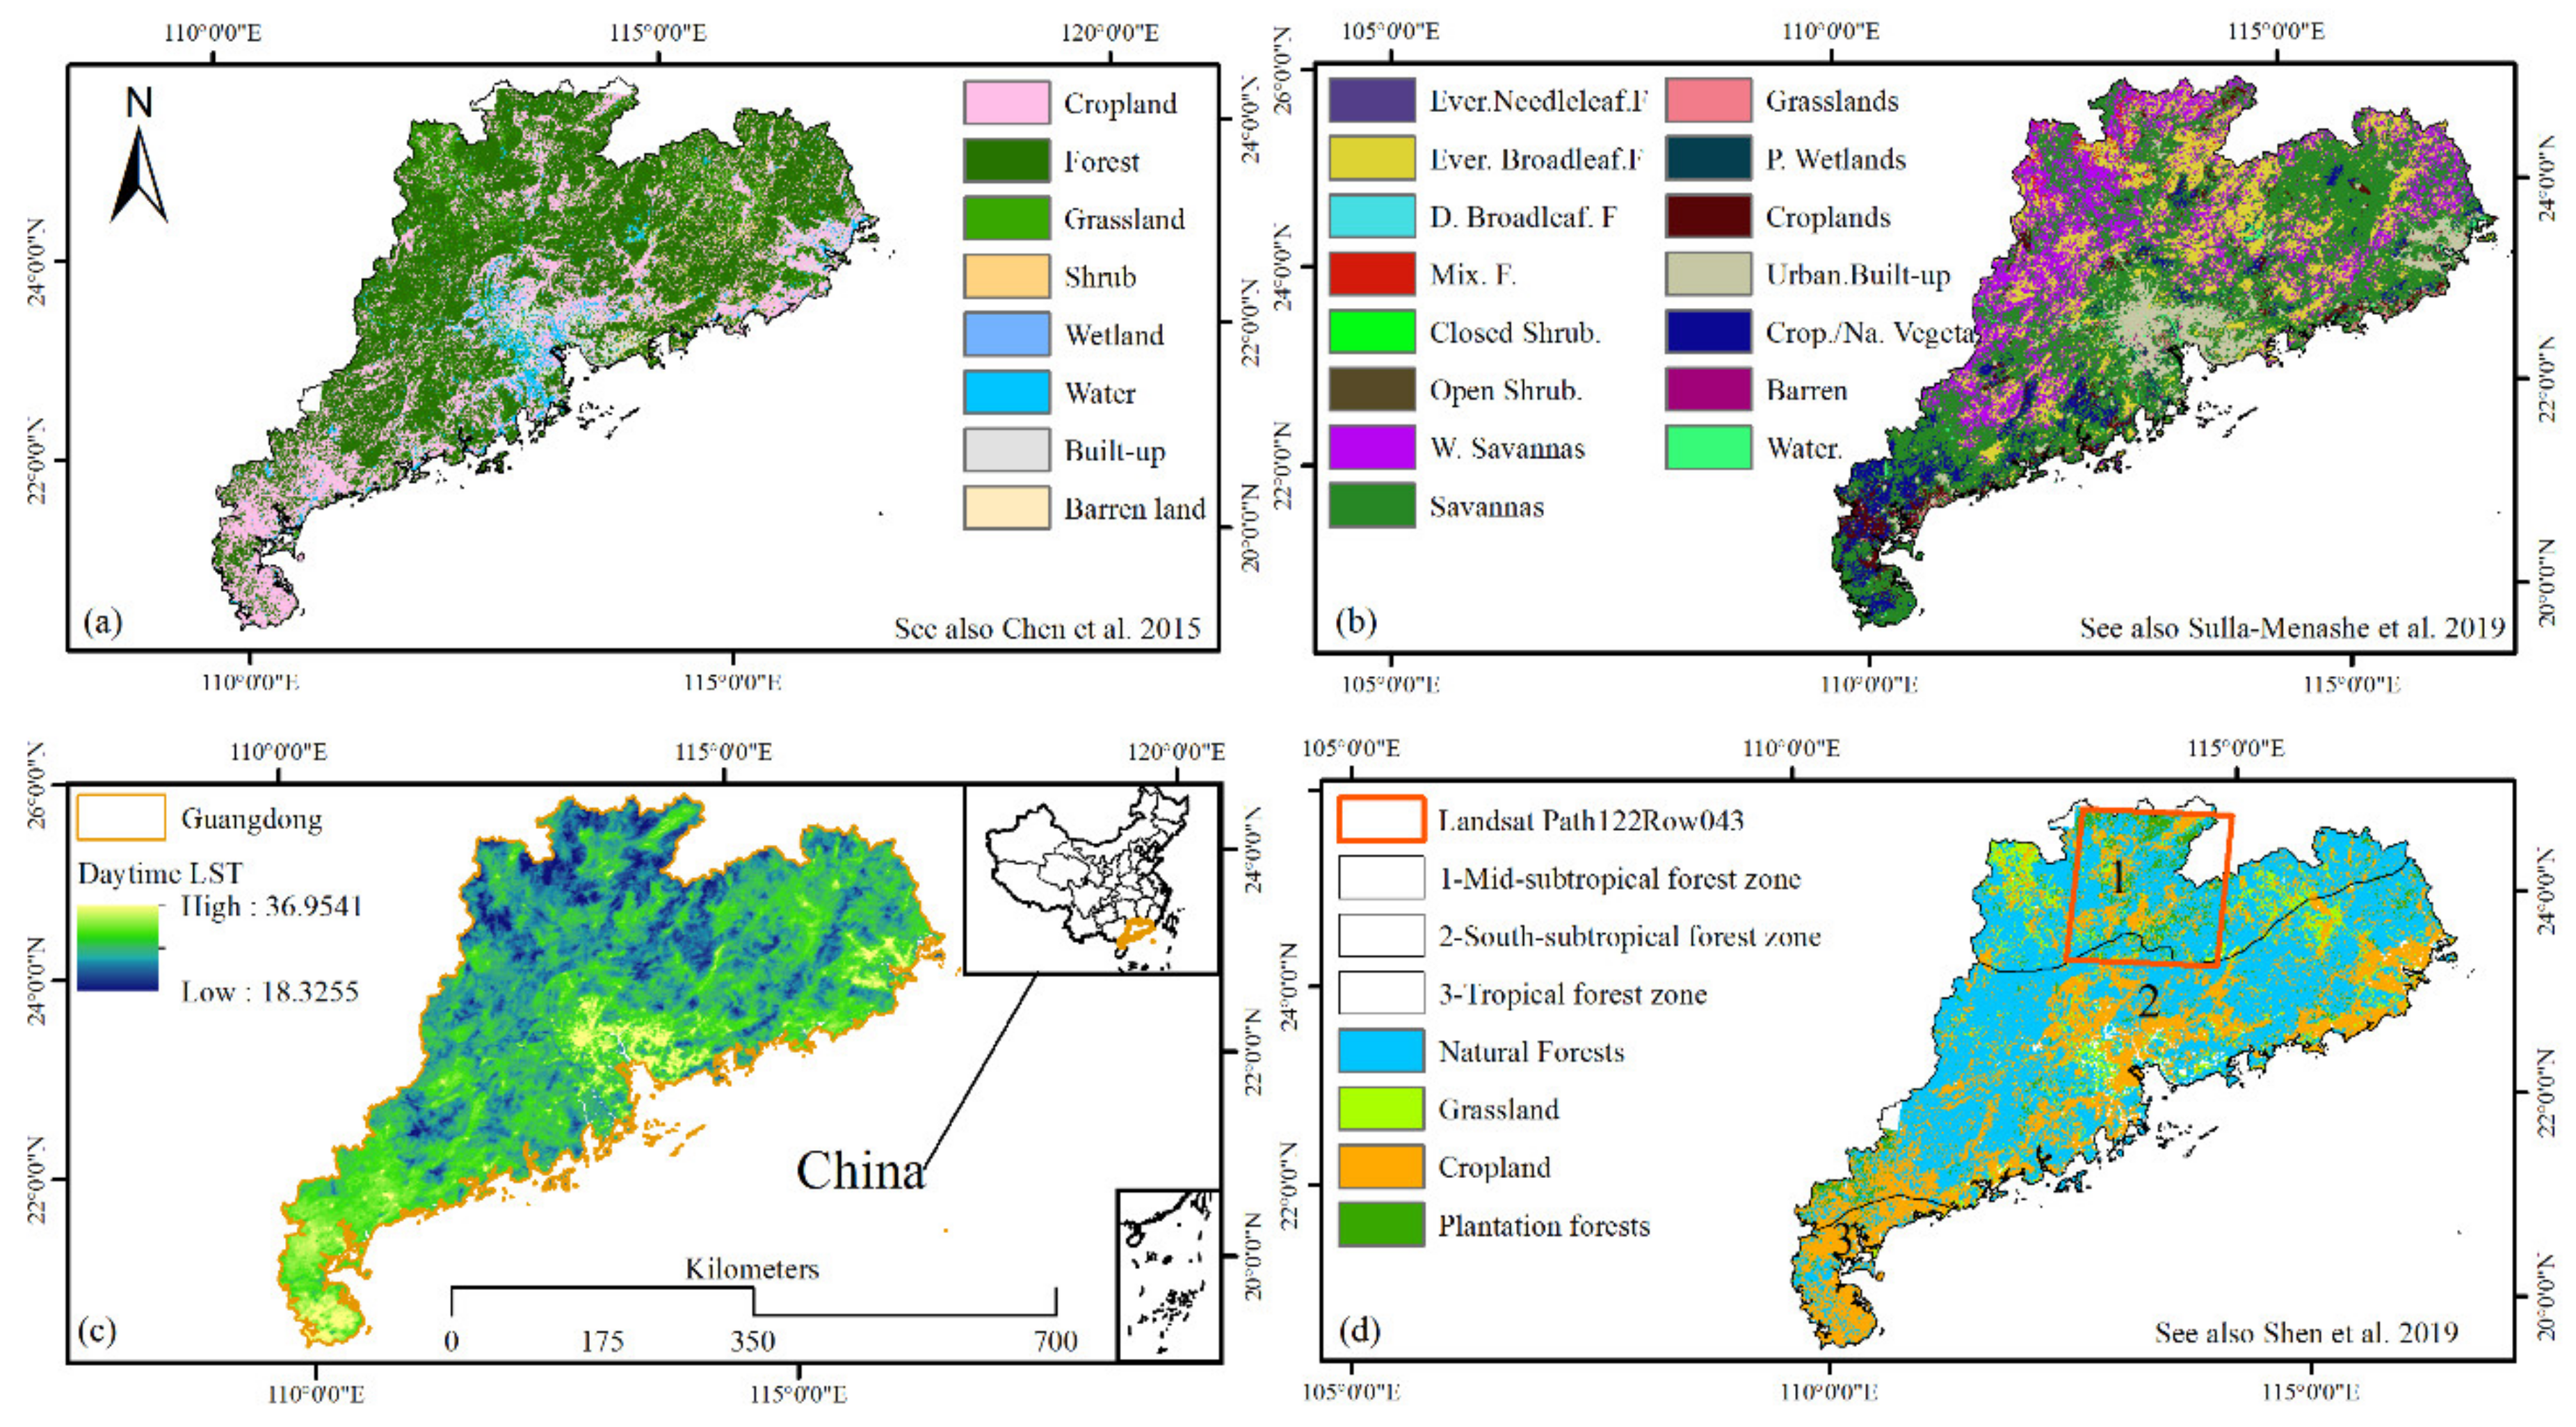
2.1. Study Area
2.2. Forest Cover Datasets
2.3. Estimation of Forest Cover Change
2.3.1. Forest Loss and Gain Characterization
2.3.2. Accuracy Assessment and Area Estimation of Post-Classification Change Analysis
2.4. Extraction of Land Surface Variables and Climate Variables
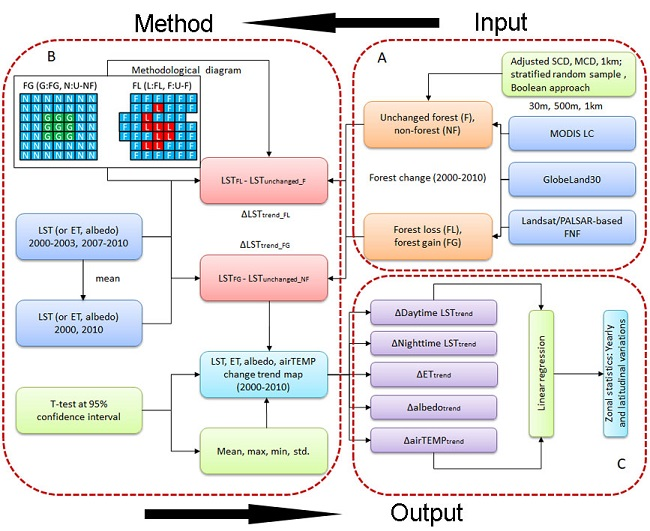
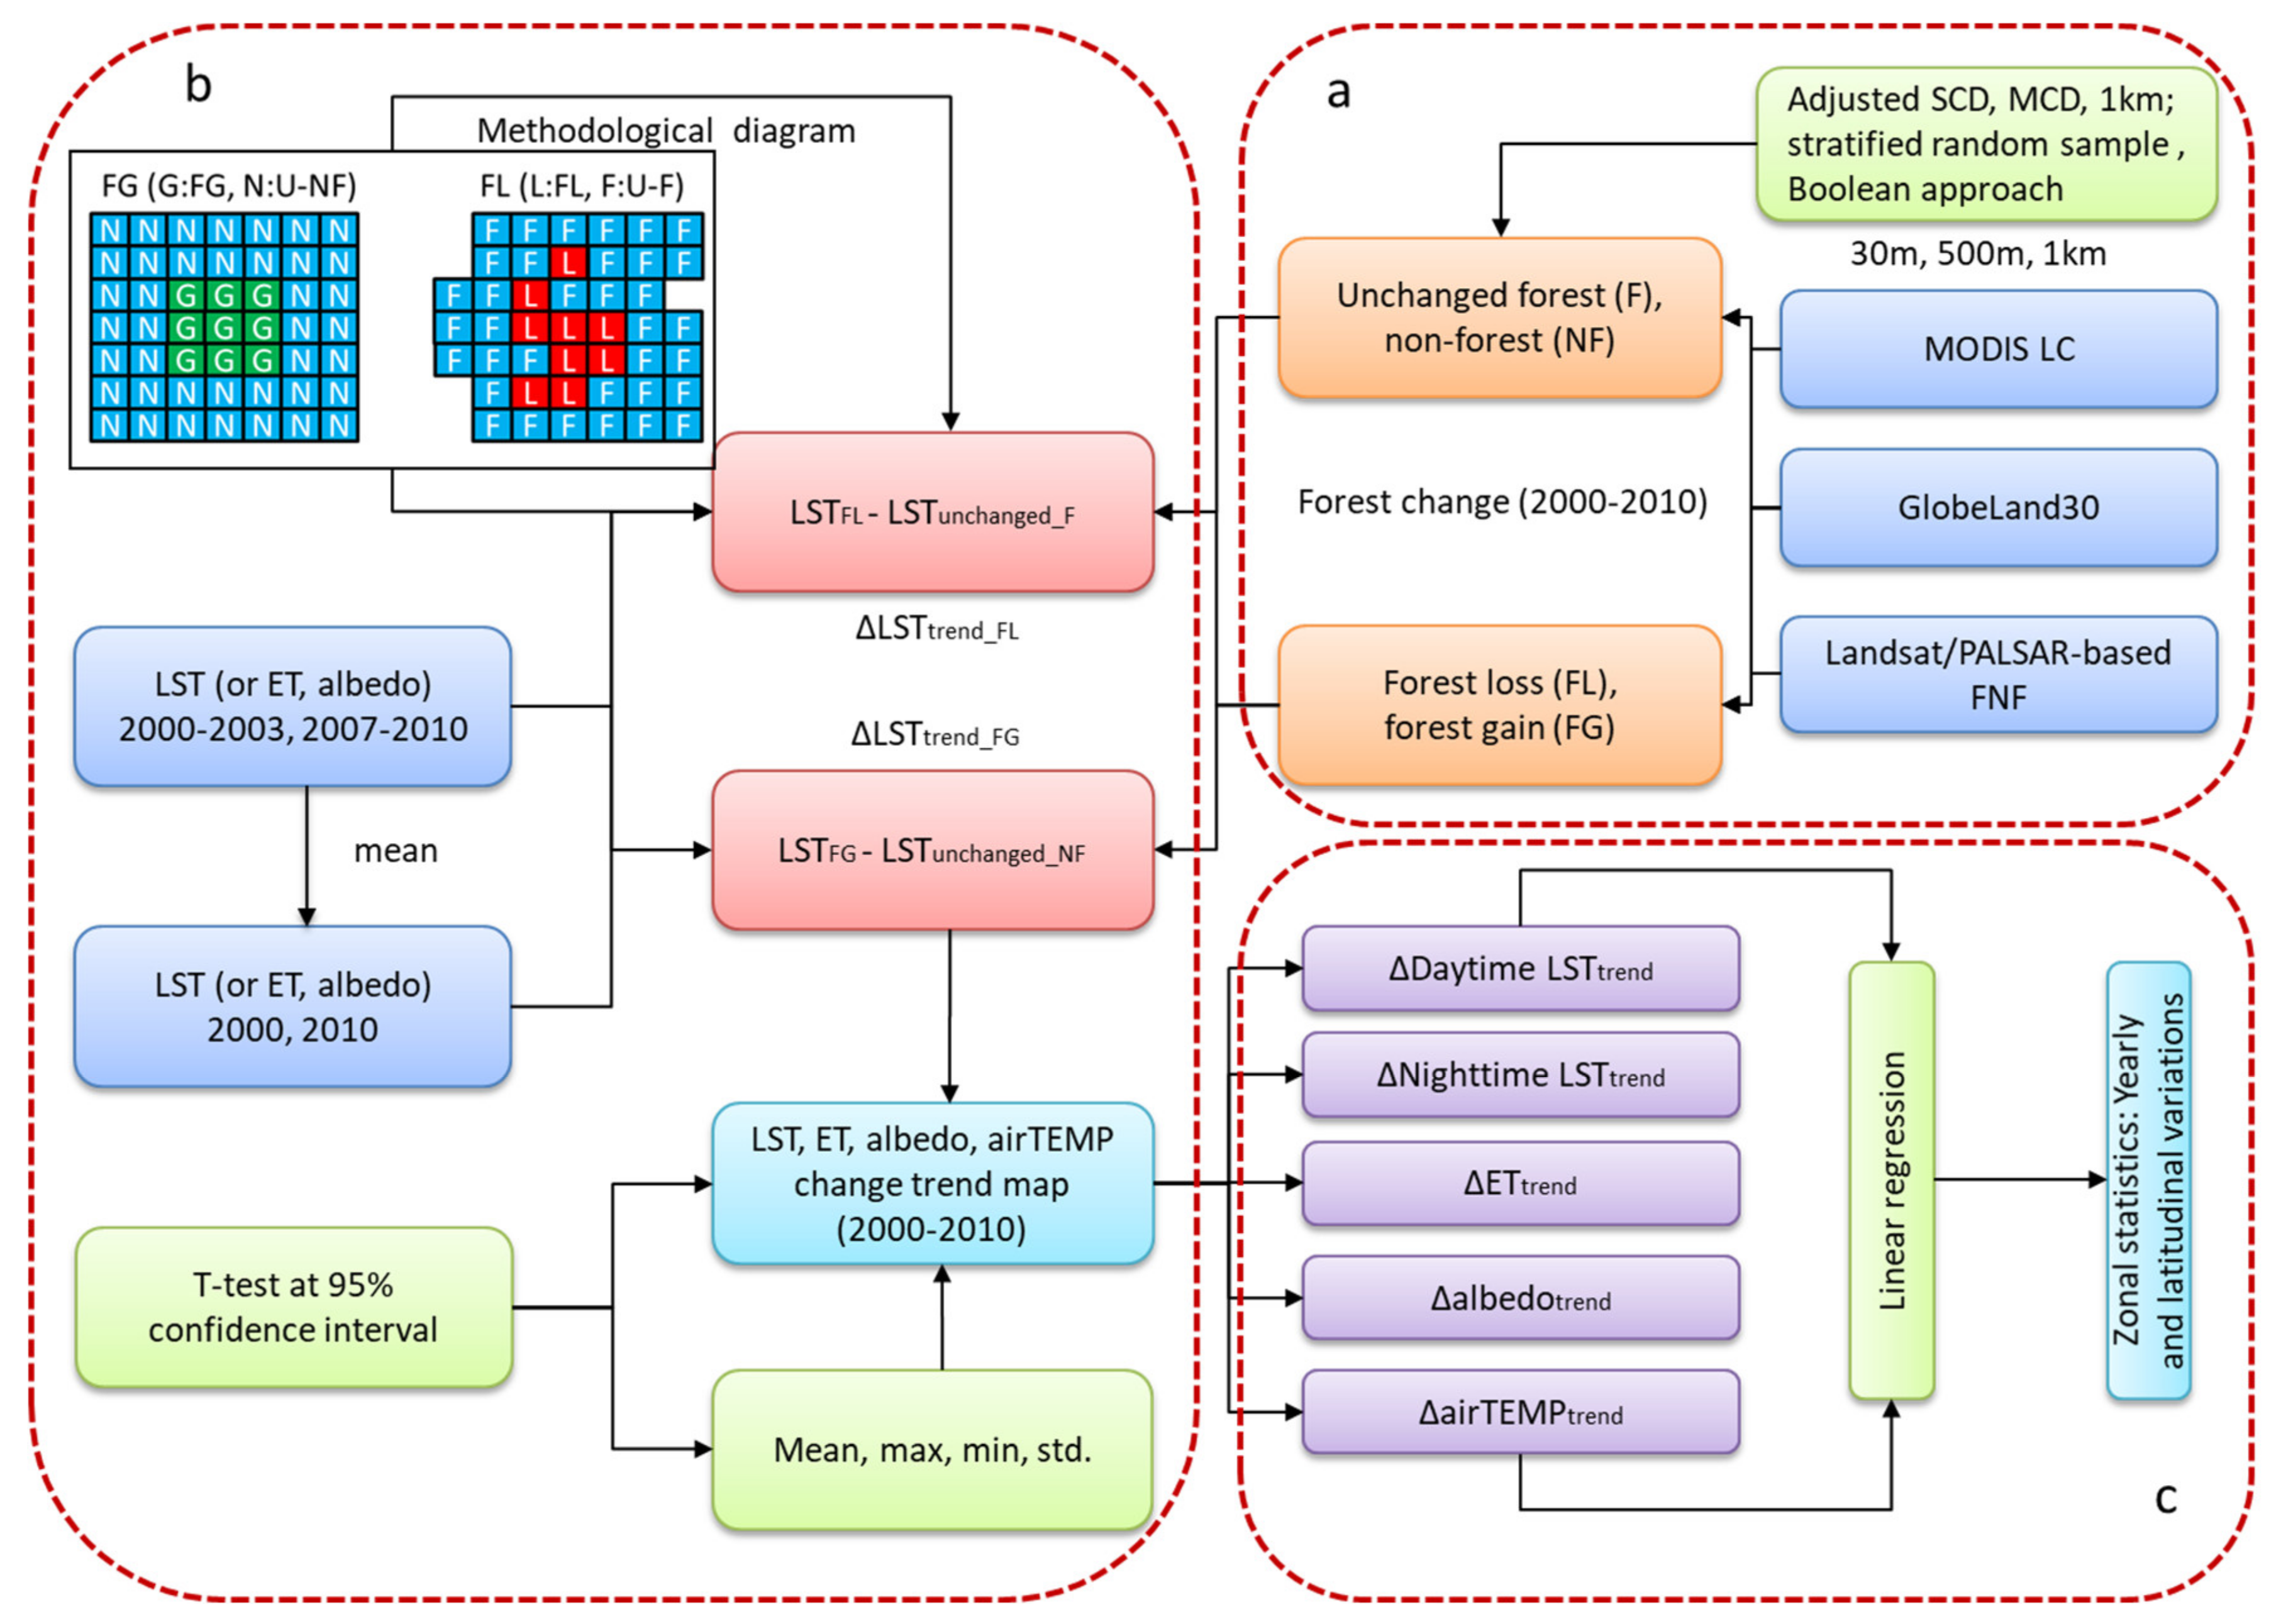
2.5. Spatiotemporal Analysis Method for LST Change due to Forest Cover Change
3. Results
3.1. Forest Area Estimates from Satellite Datasets with Different Spatial Resolution
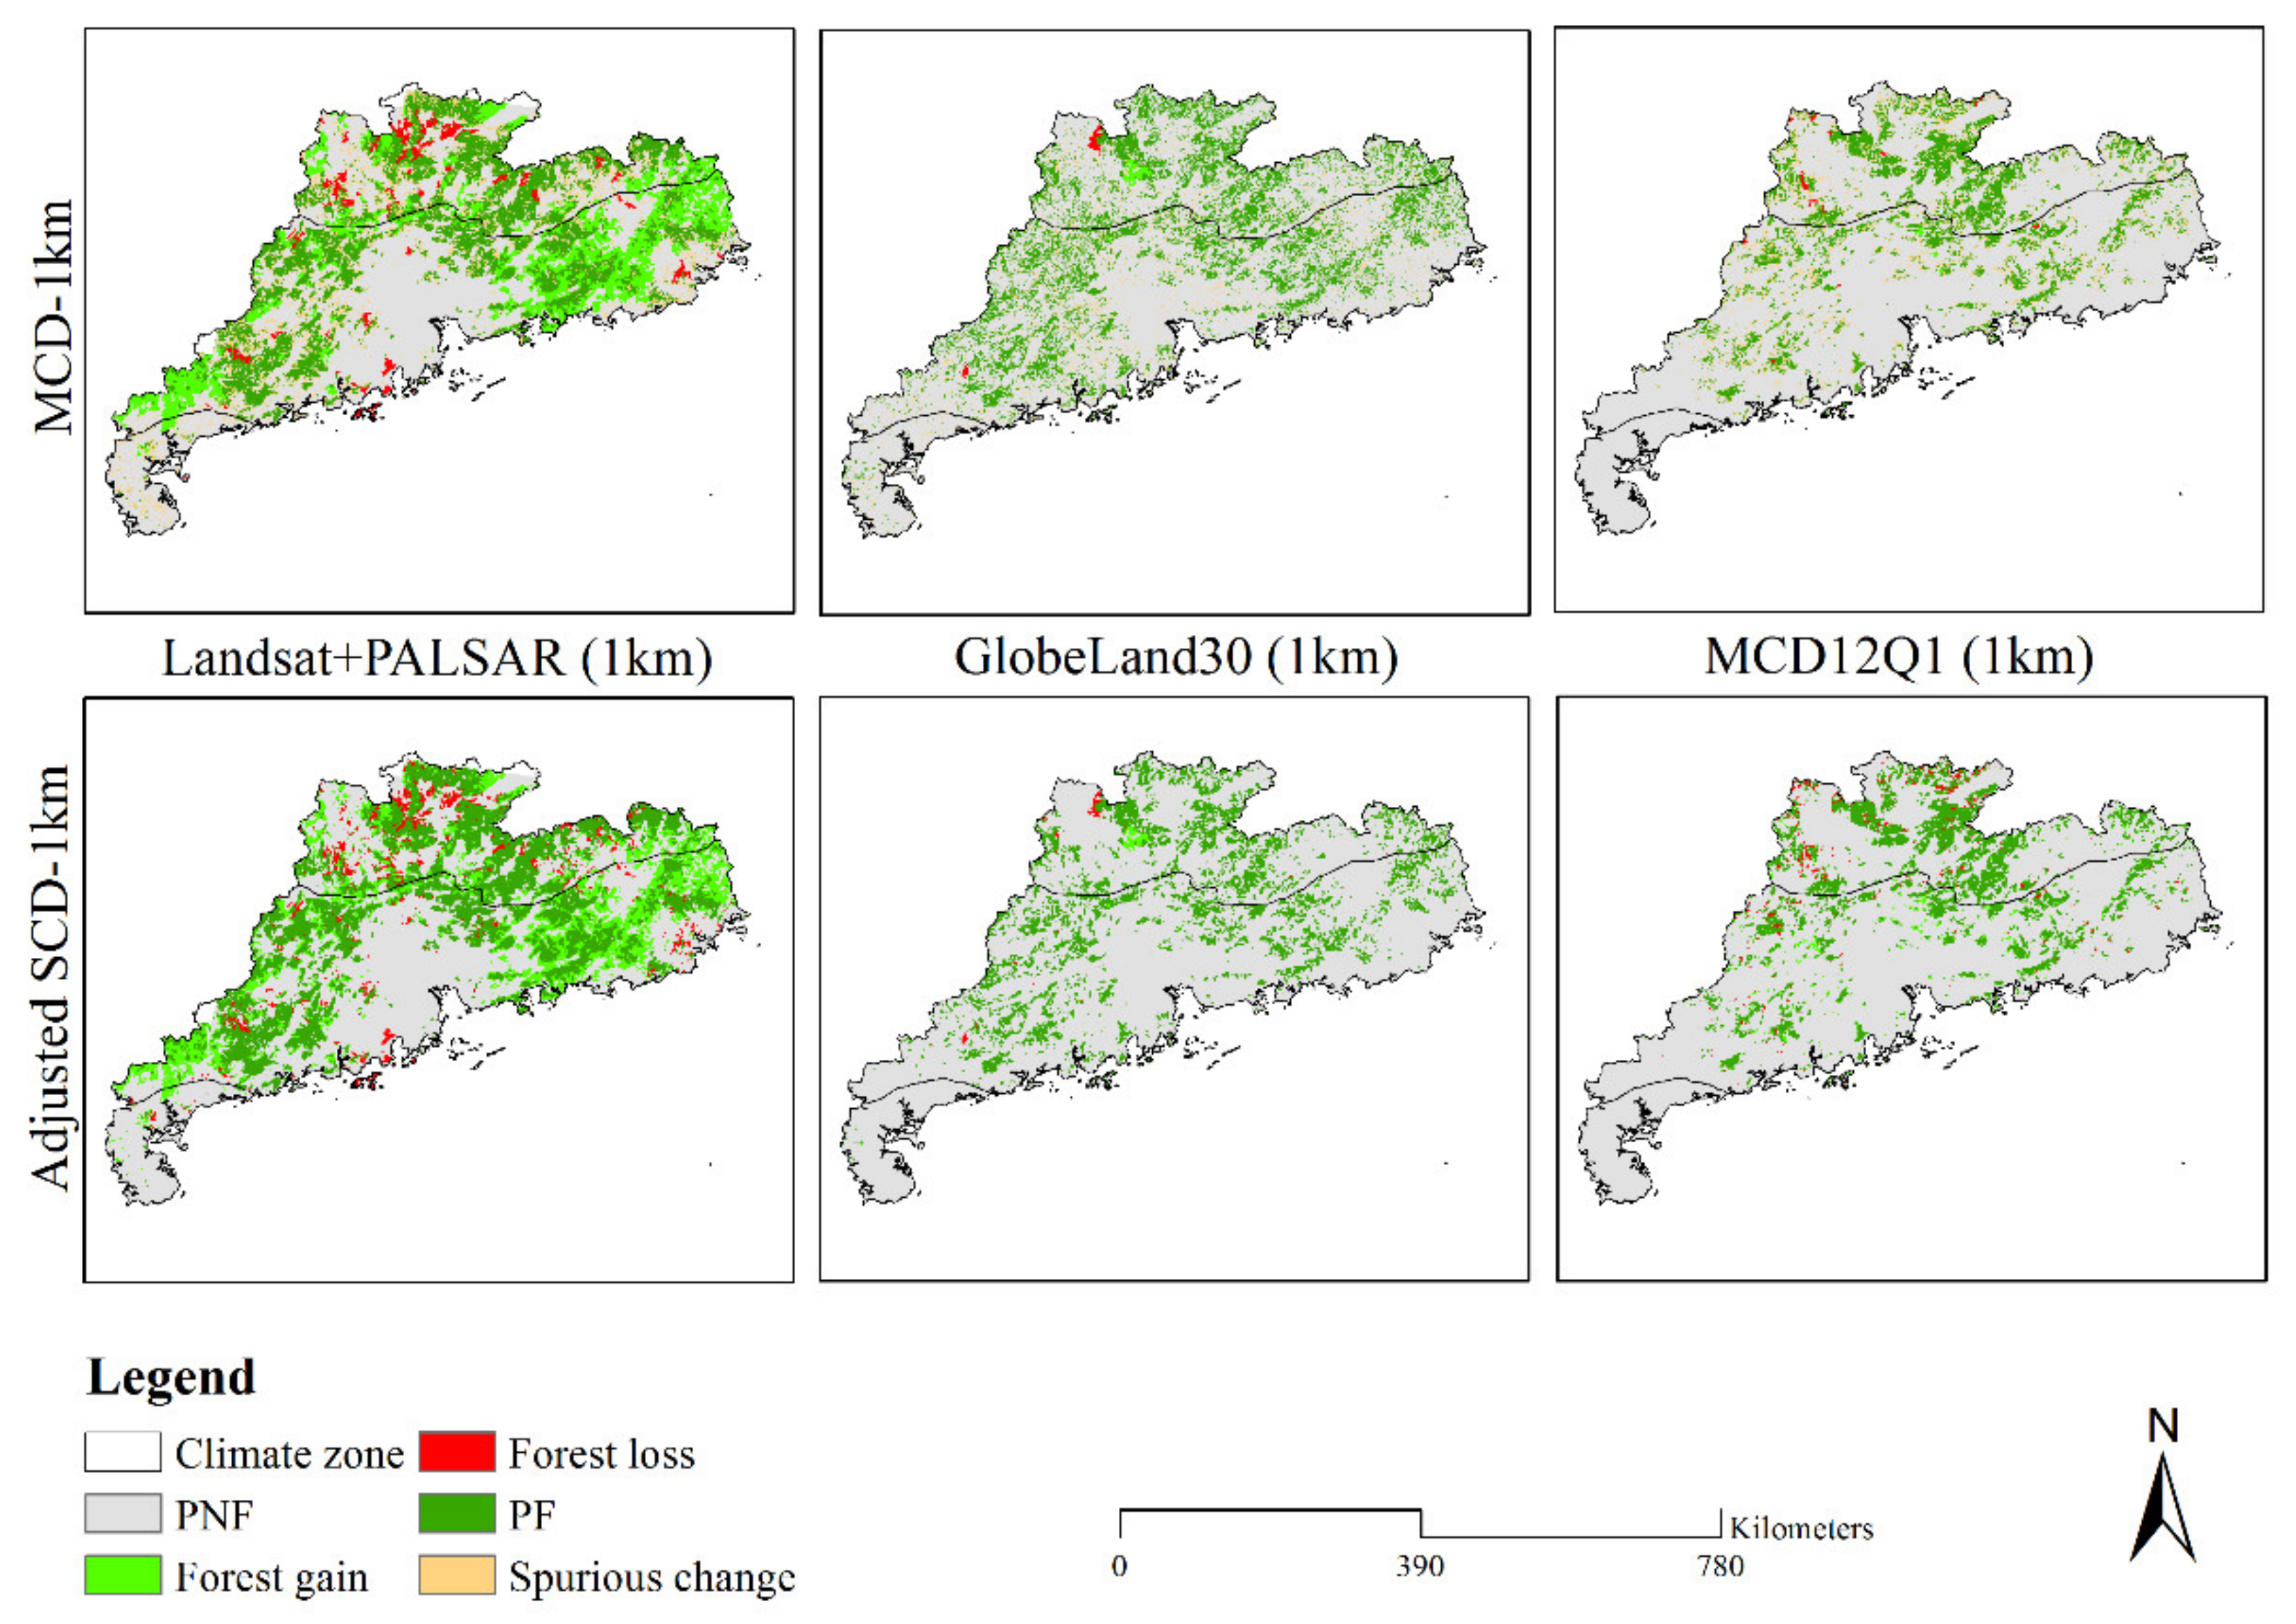
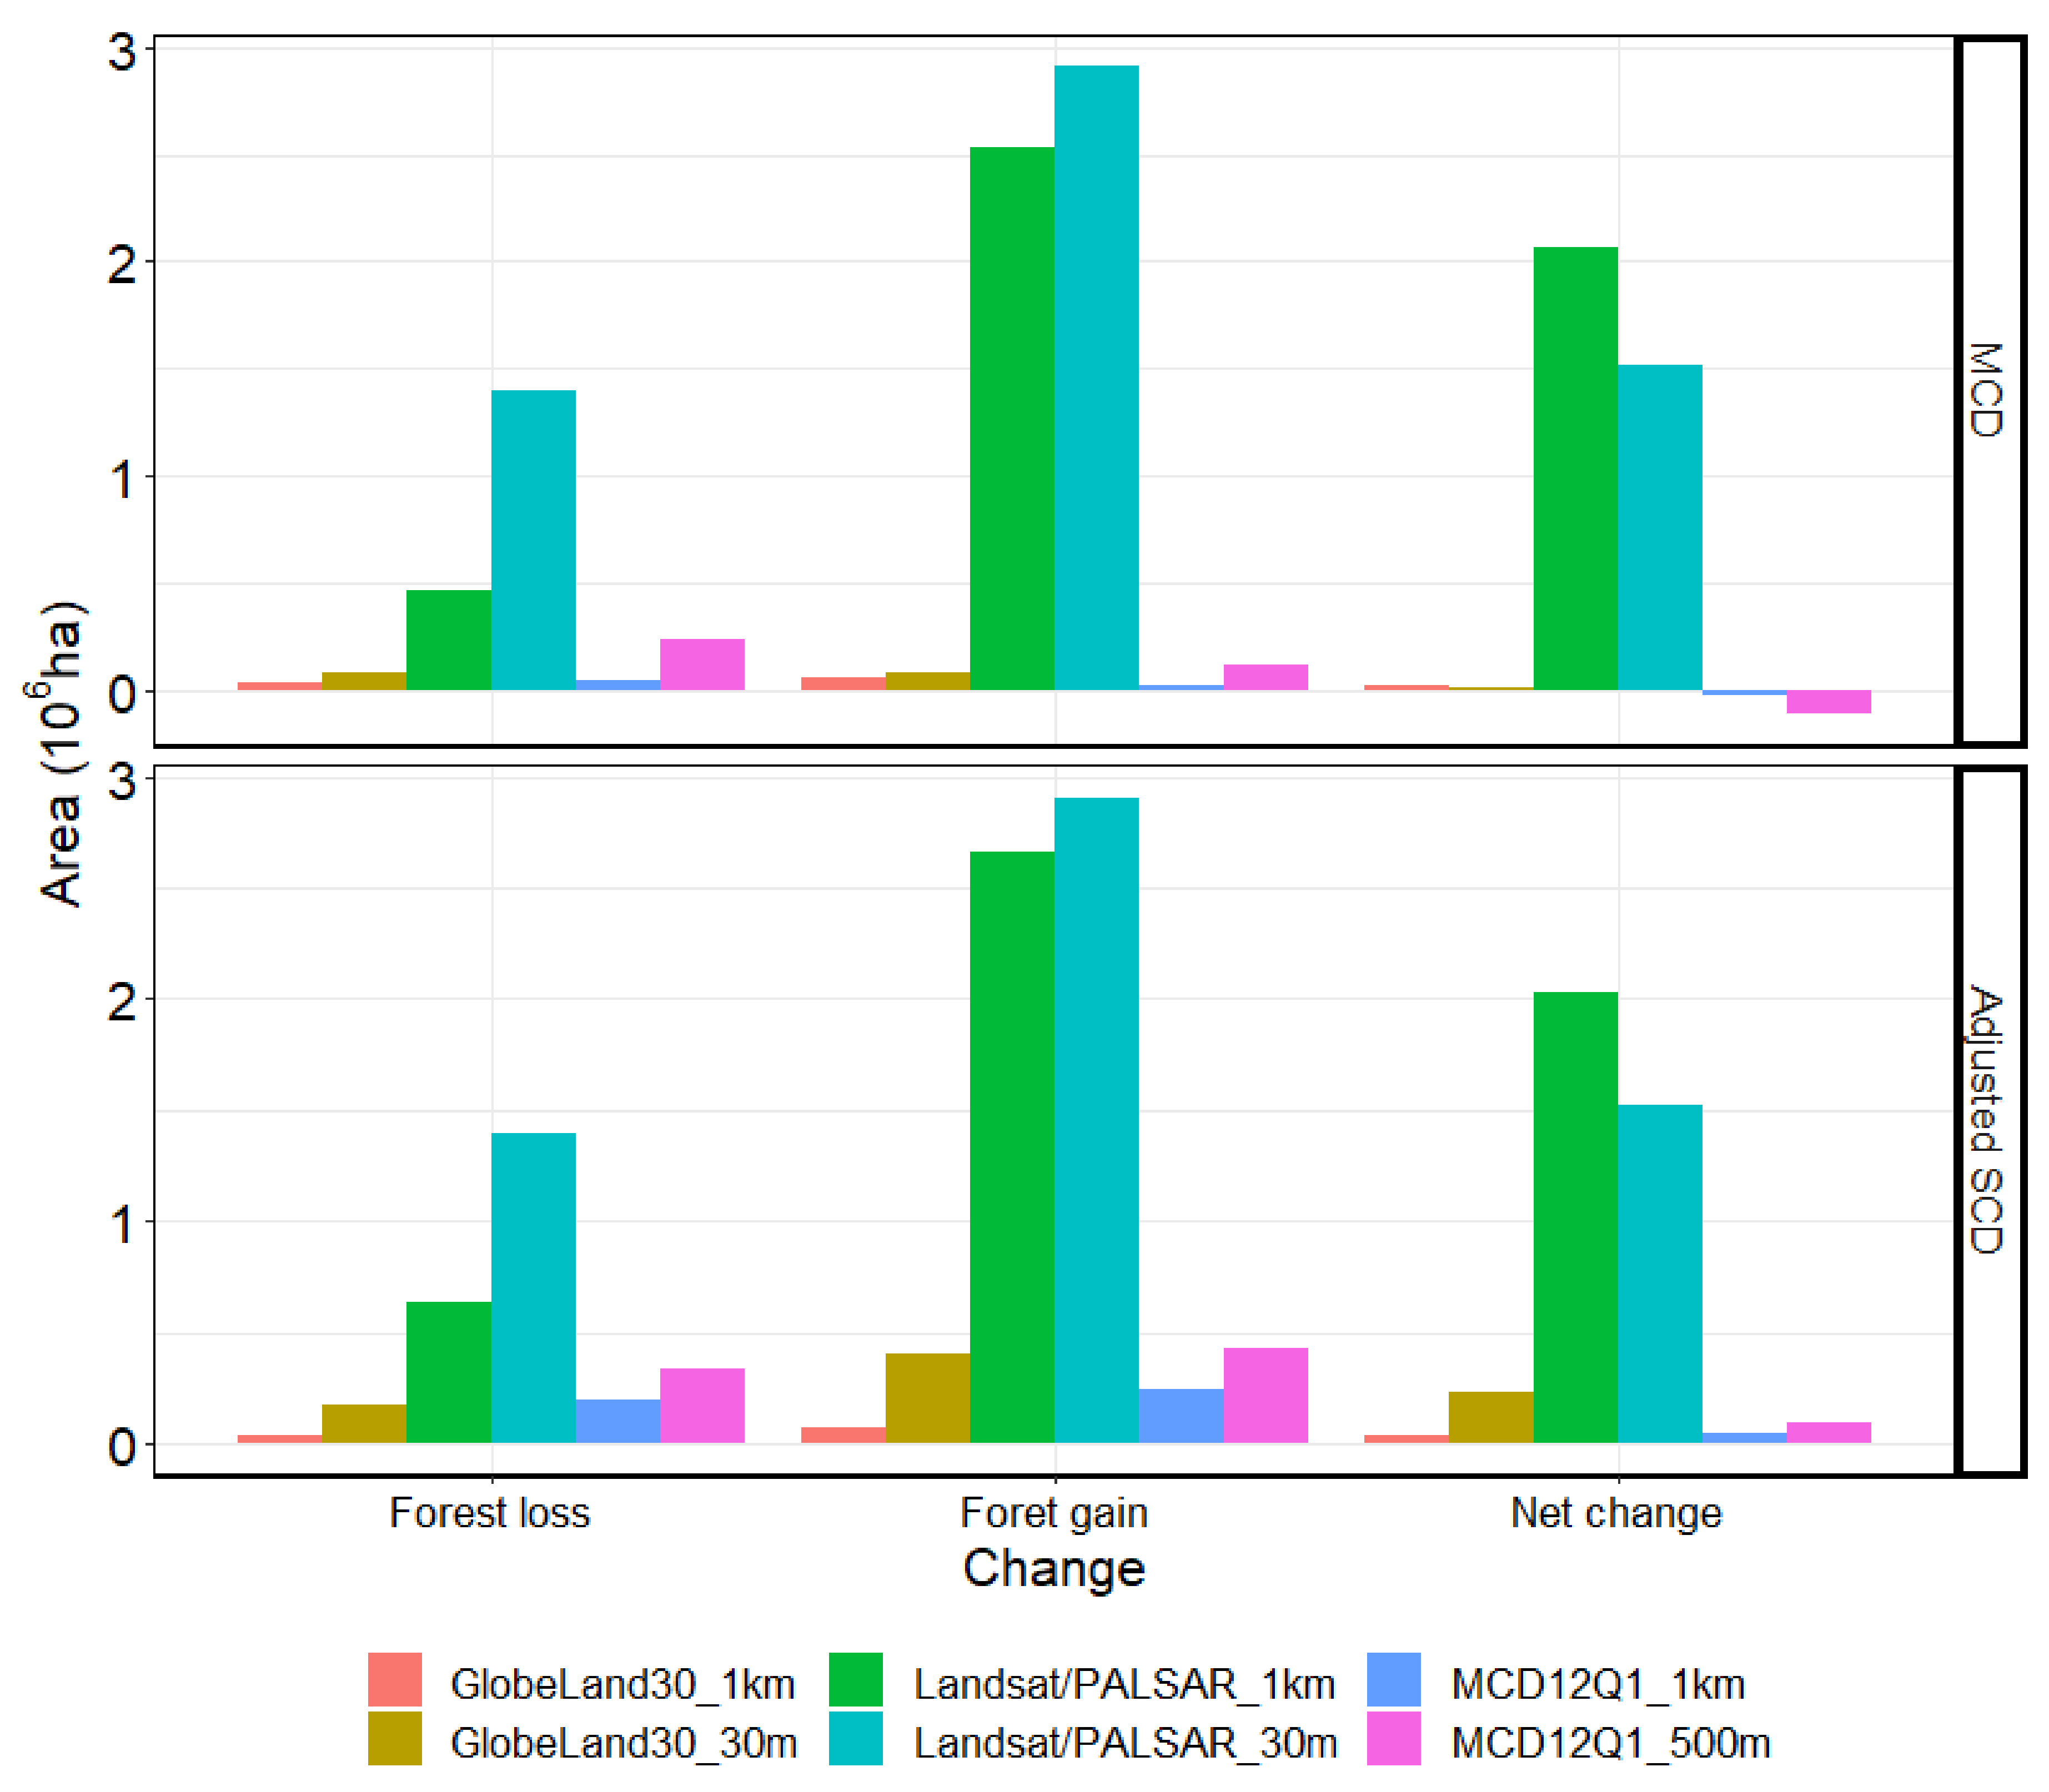
3.2. Forest Cover Change Estimates from Datasets with Different Spatial Resolutions
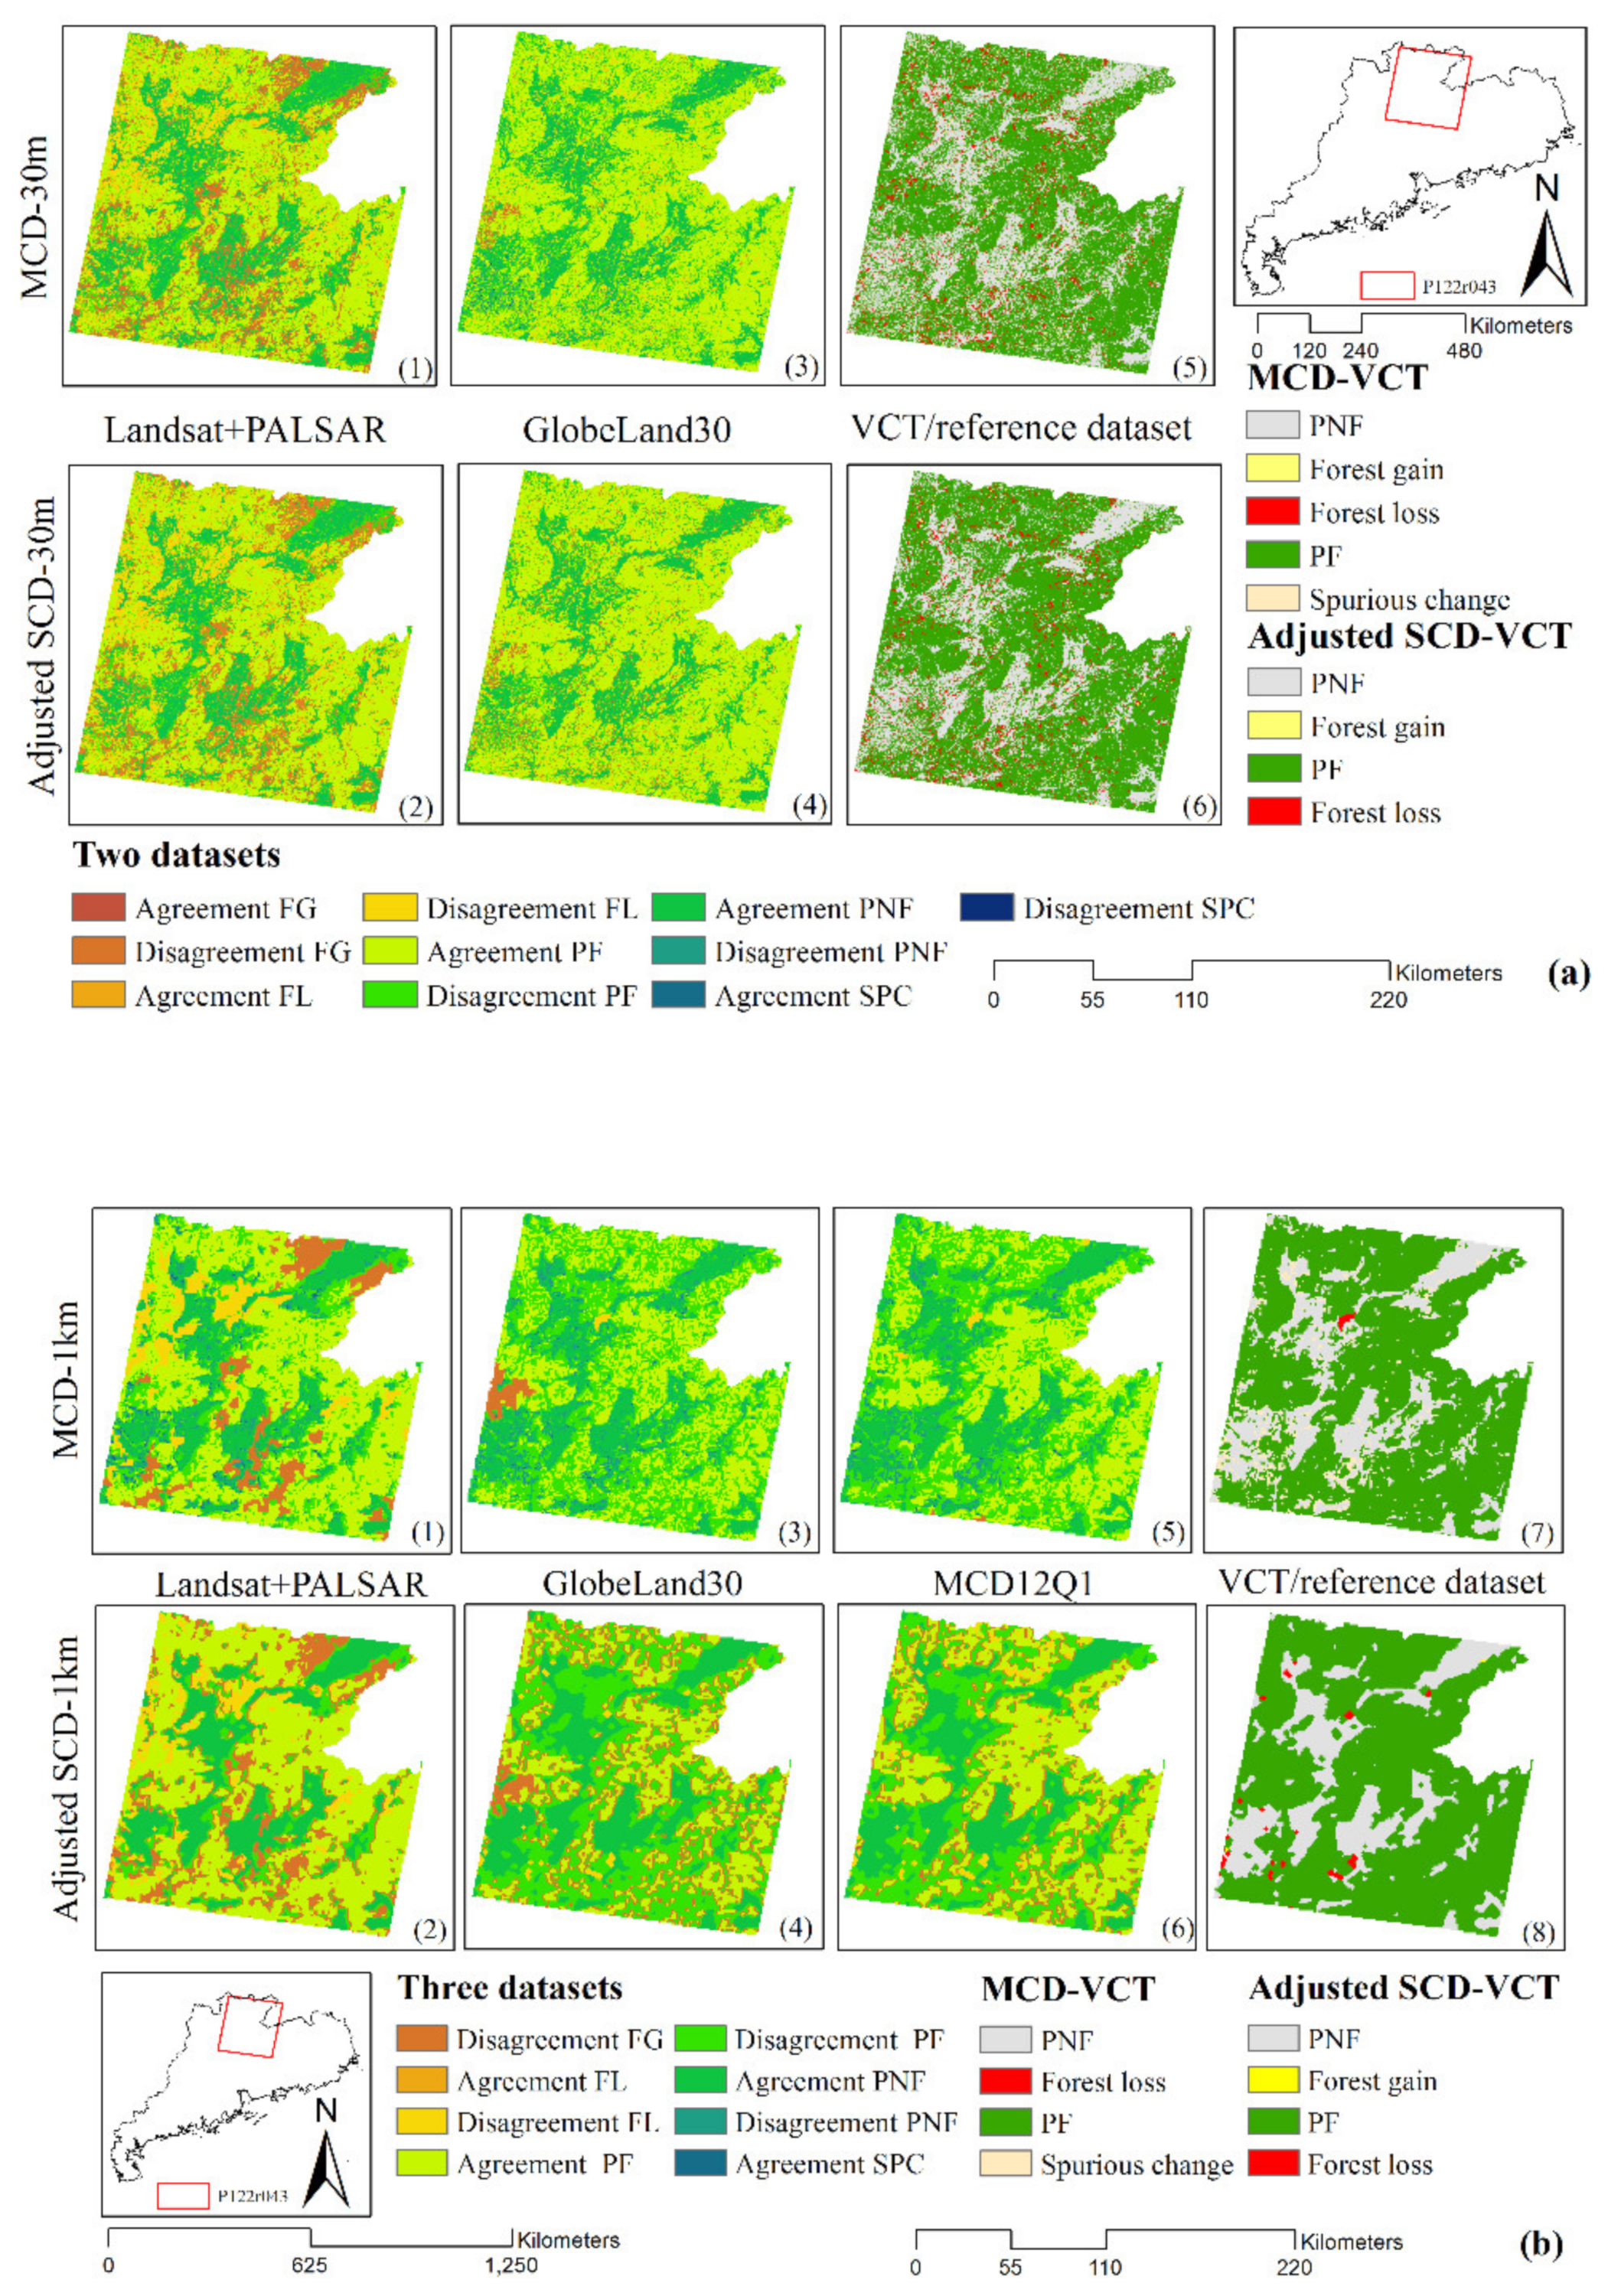
3.2.1. Assessment of Post-Classification Change Maps in Northern Guangdong
3.2.2. Analysis of Forest Cover Change in Guangdong Province
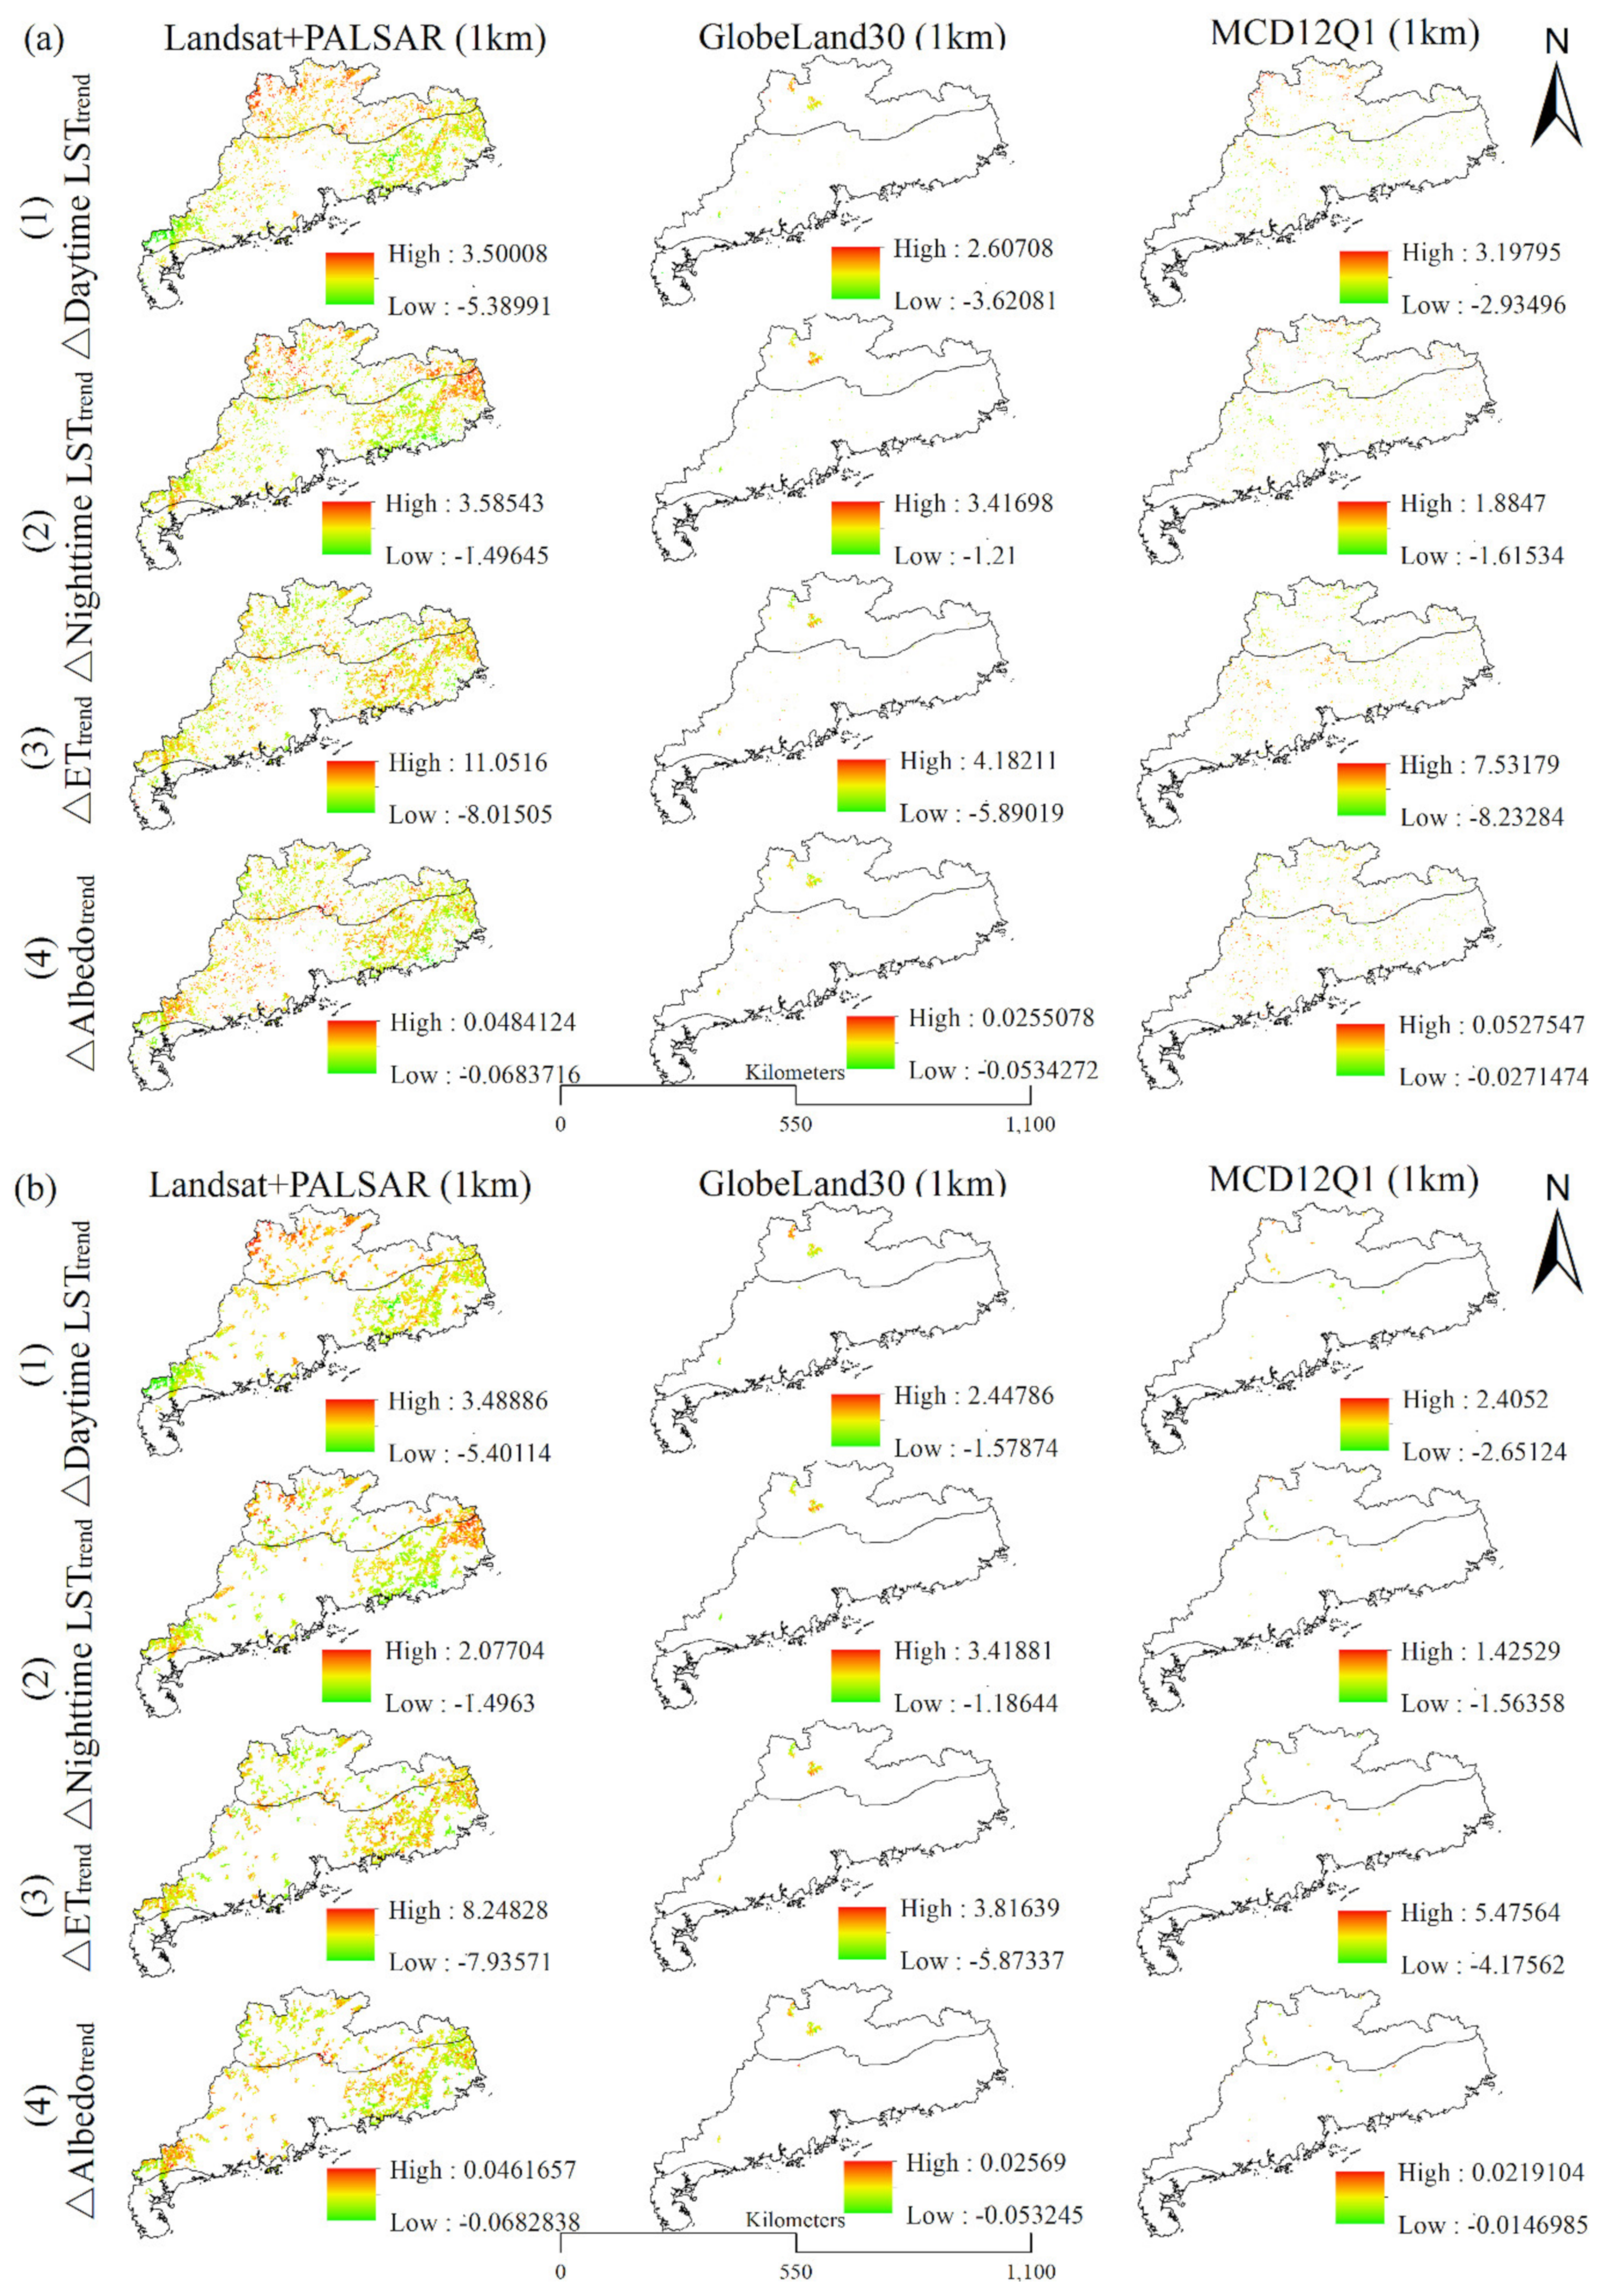
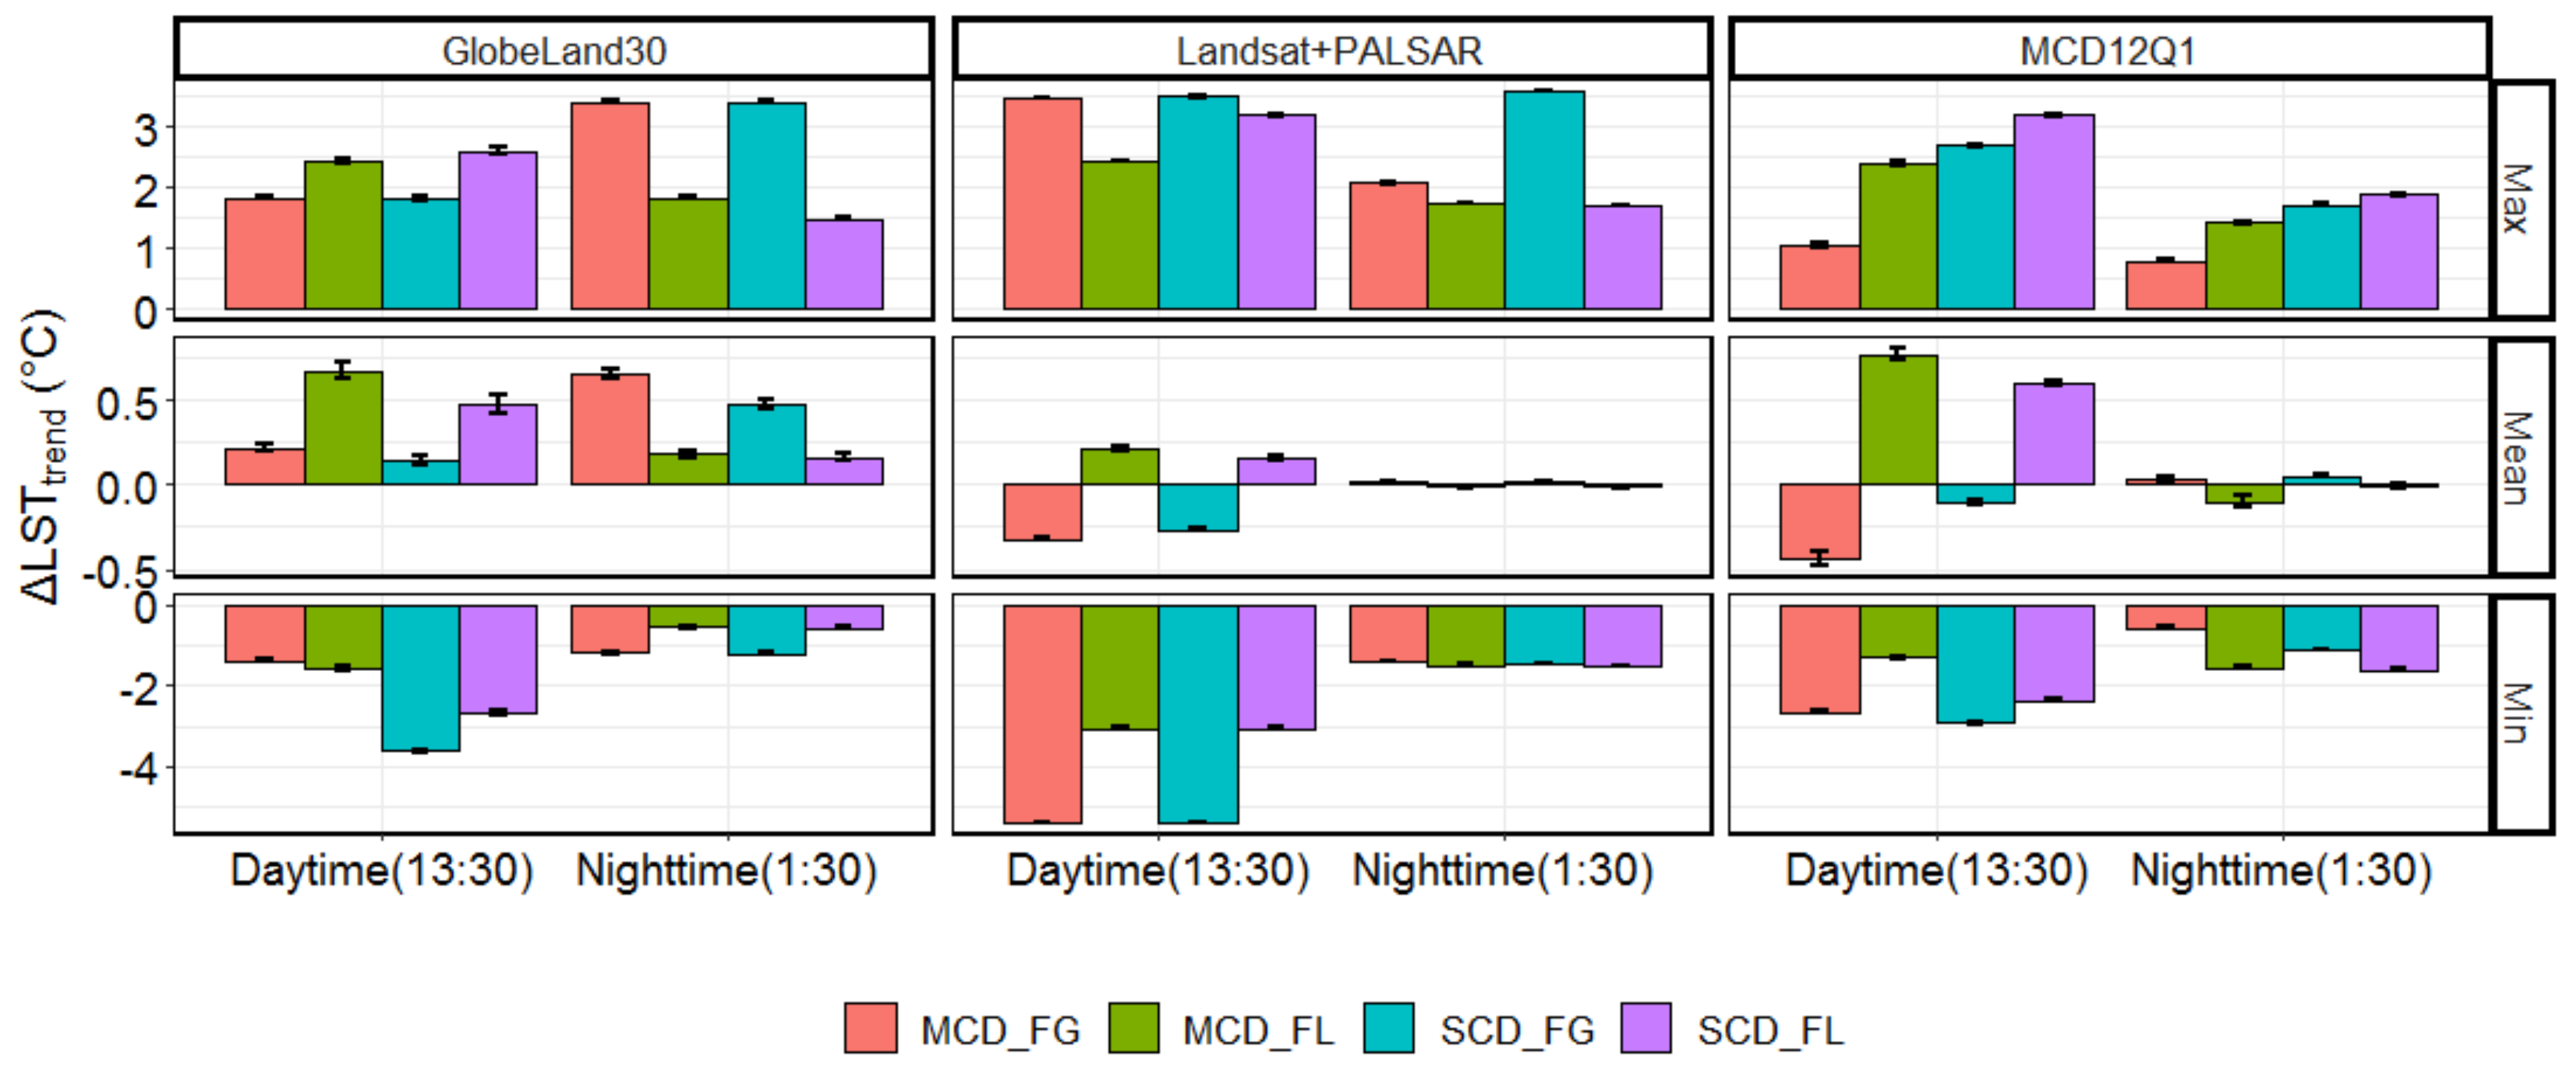
3.3. Spatiotemporal Impacts of Forest Cover Change on Surface Temperature
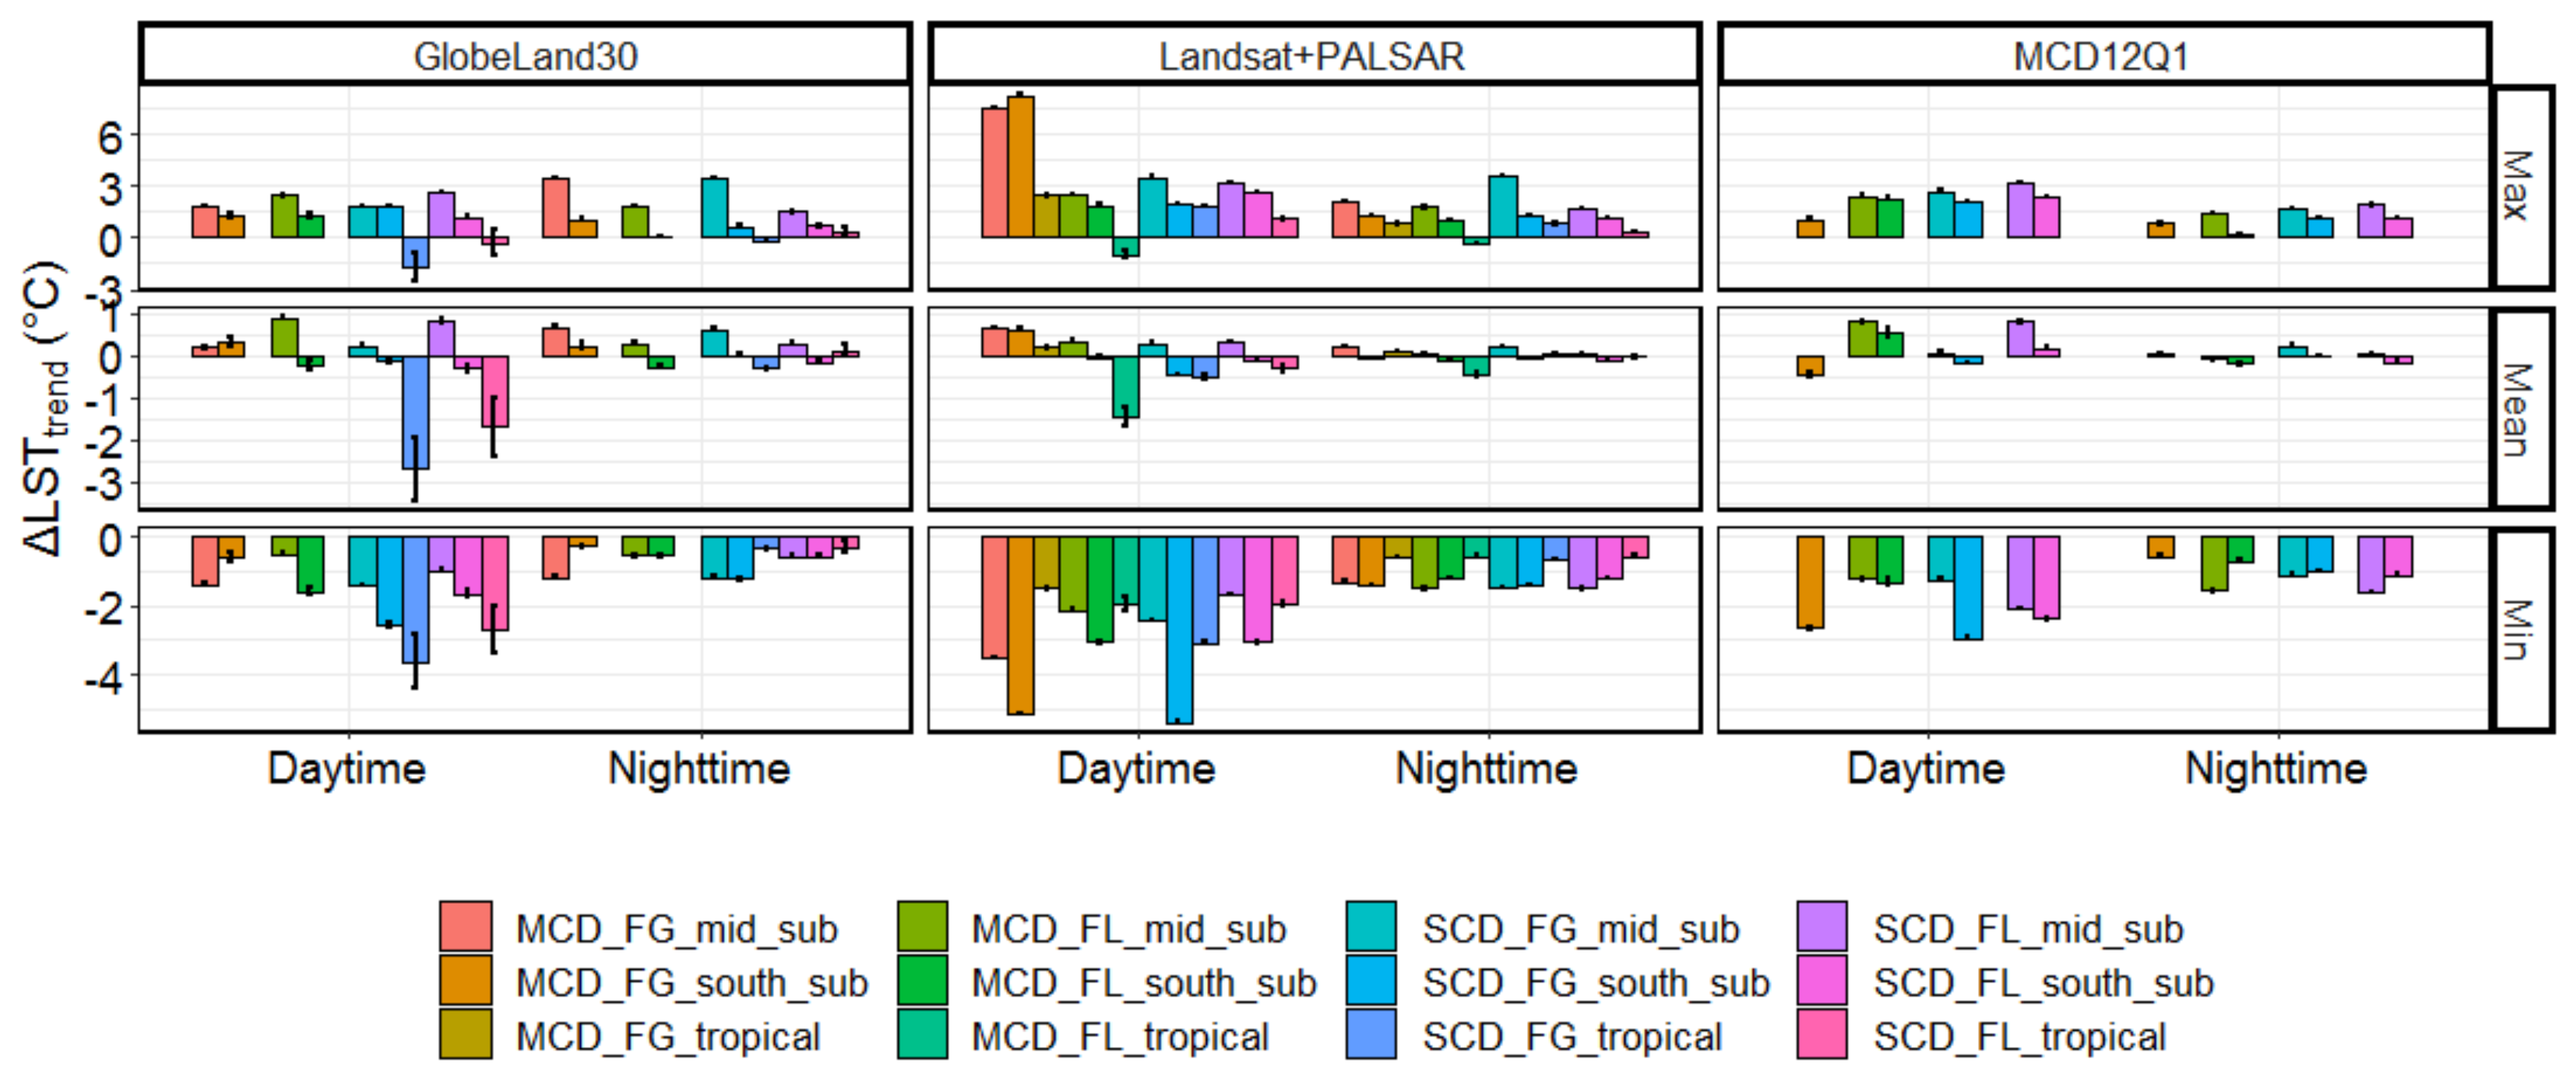
3.3.1. Effects of Forest Loss and Gain on Yearly and Latitudinal Variations of LST Change
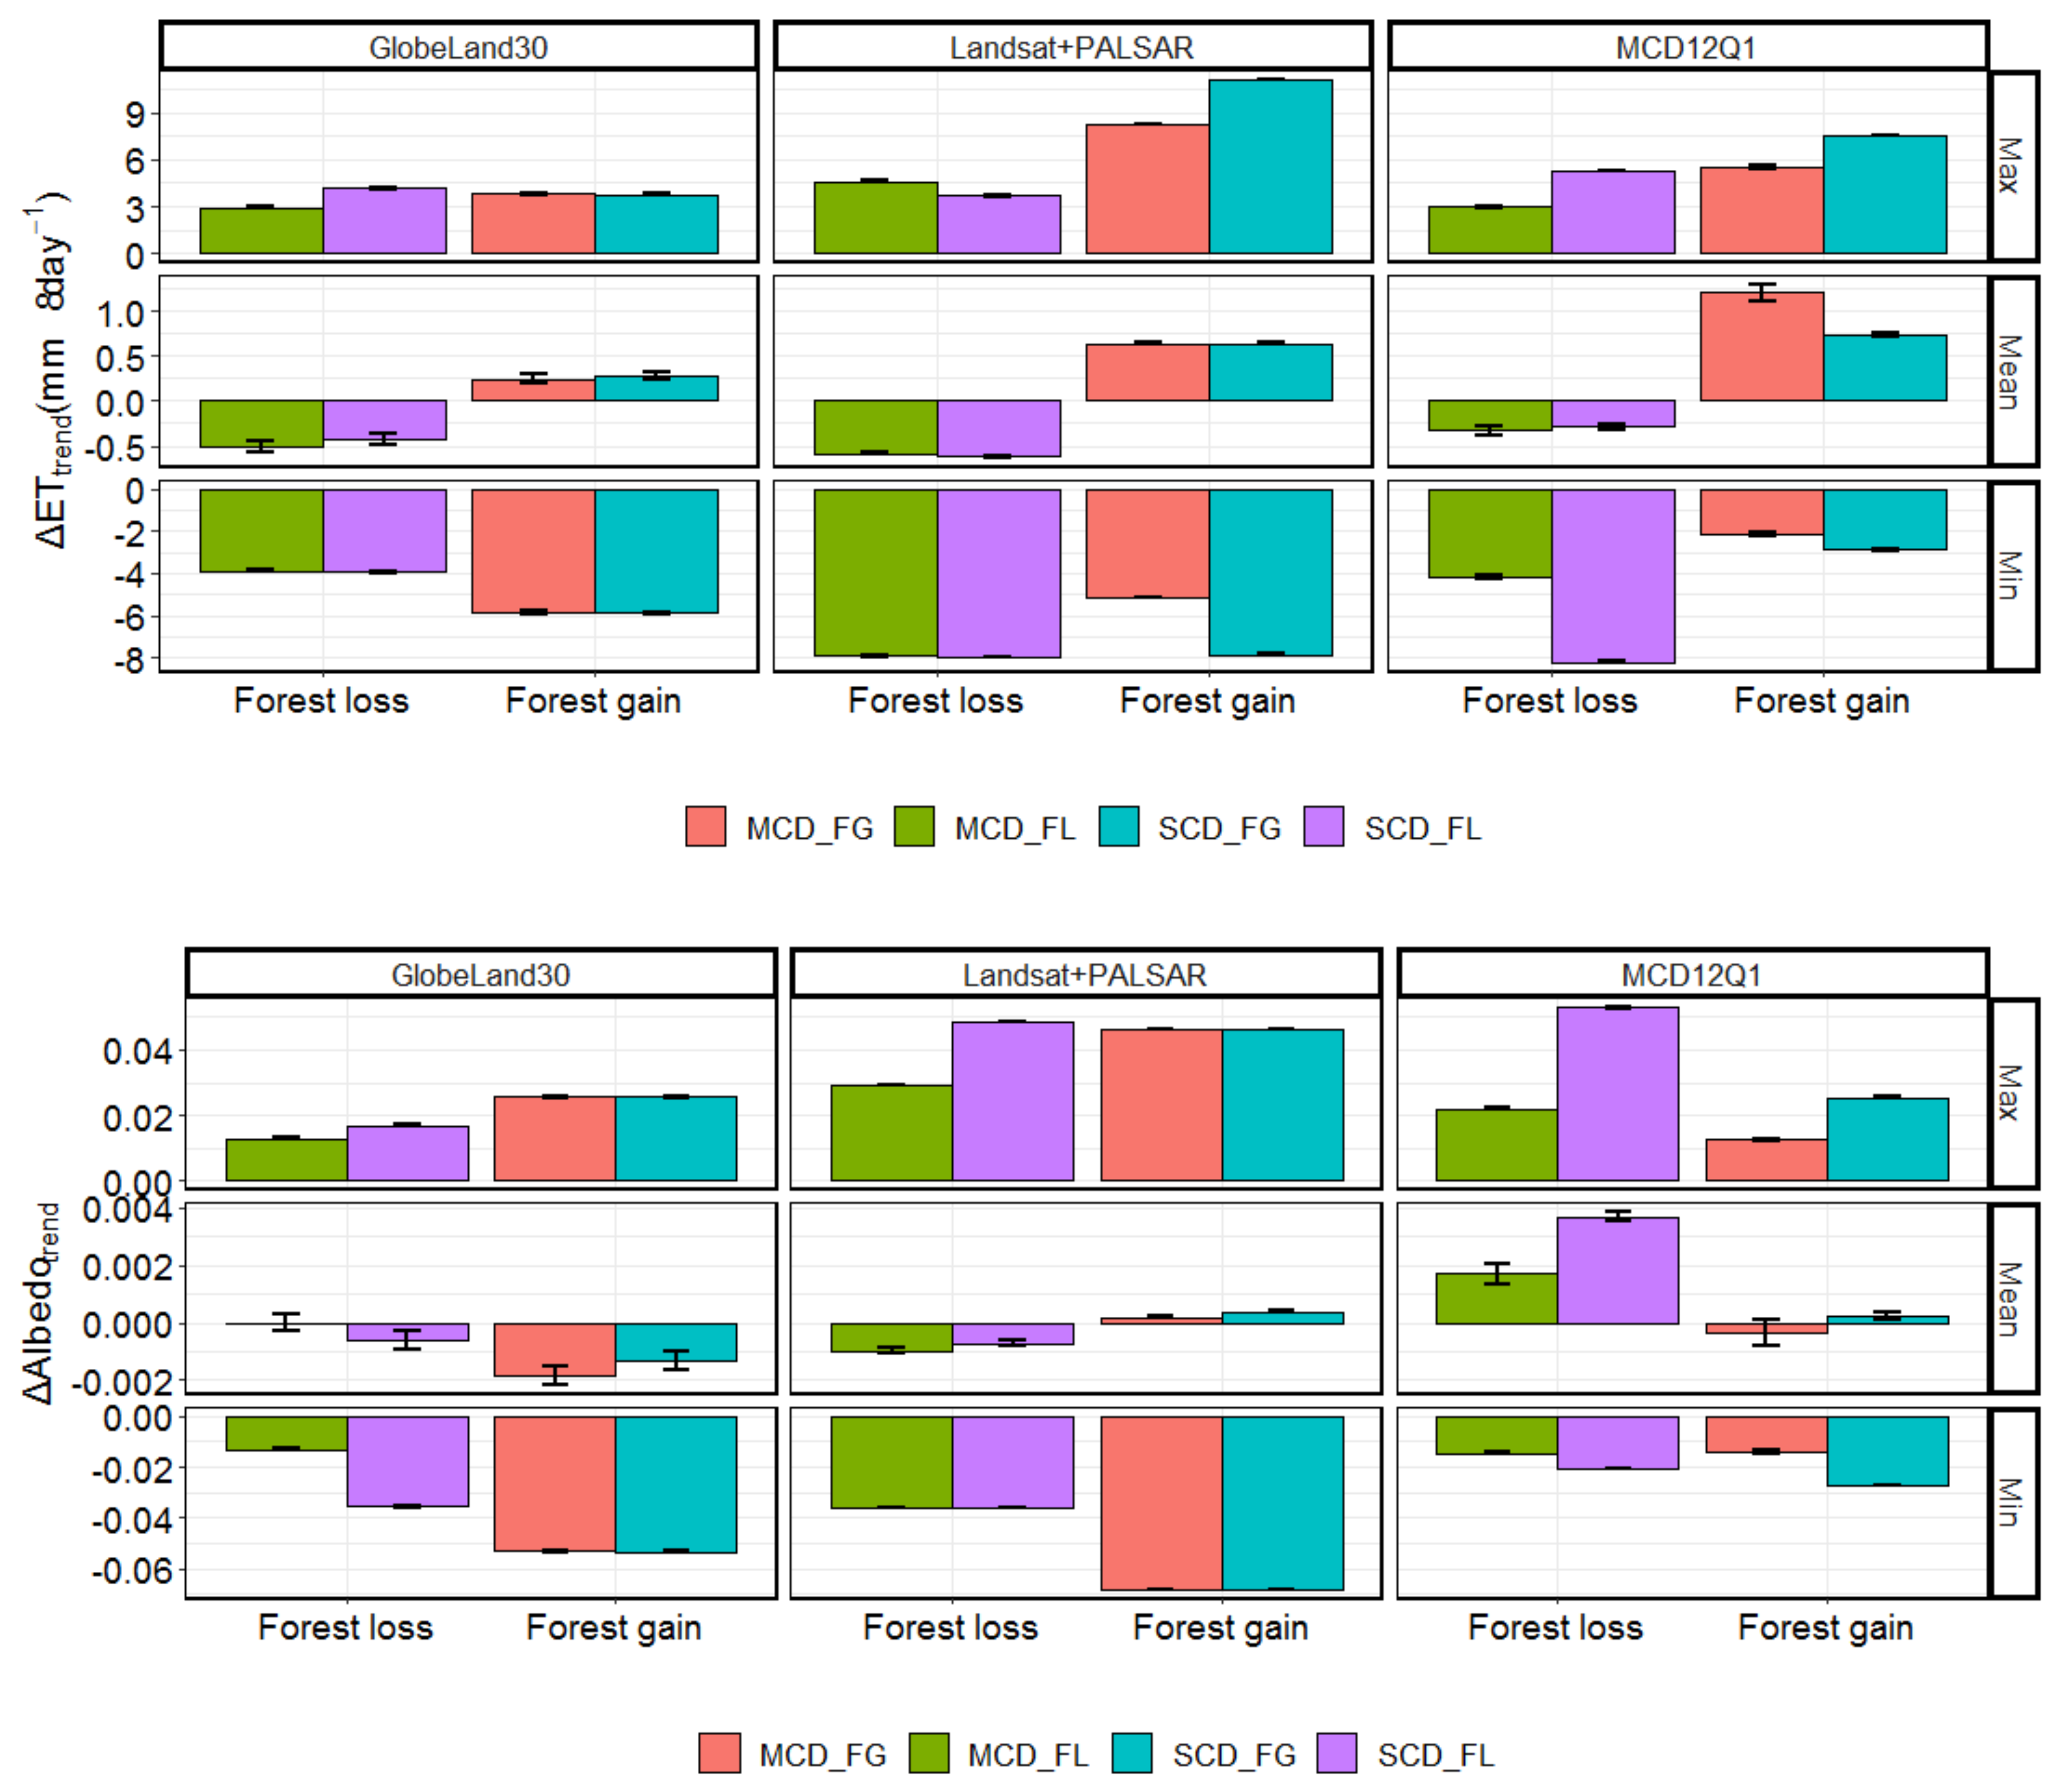
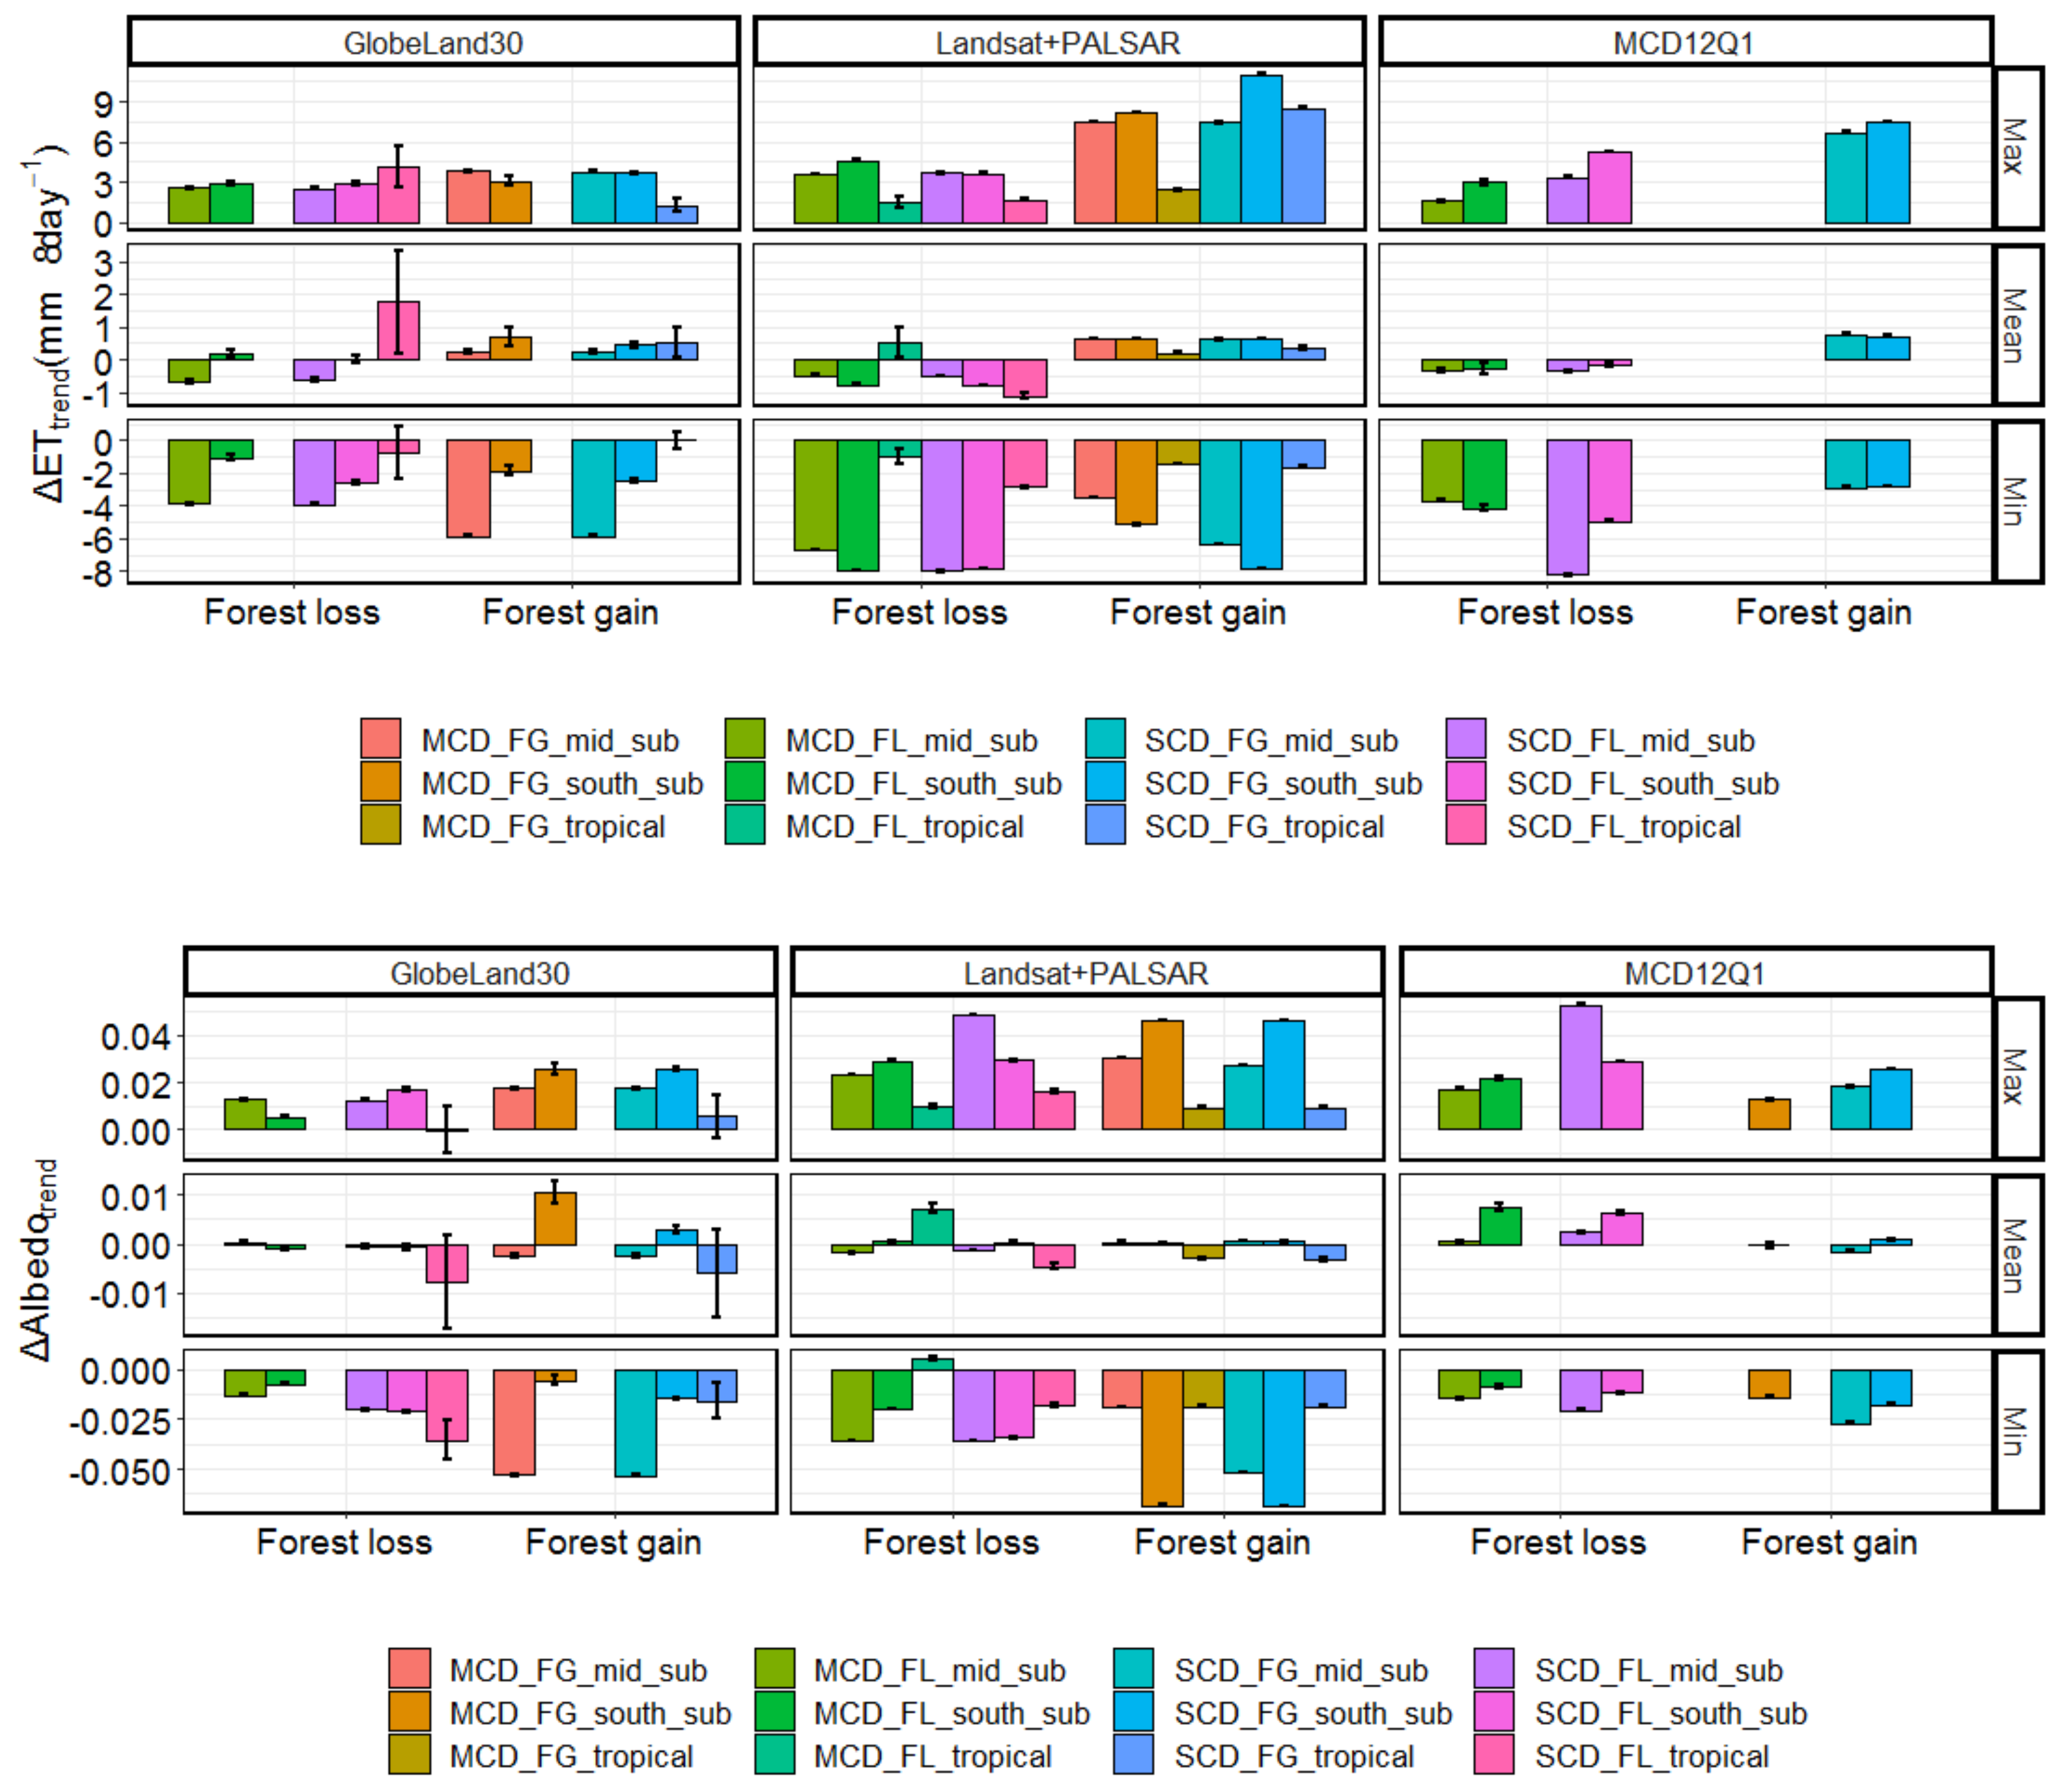
3.3.2. ET and Albedo Changes Related to Forest Loss and Gain and Their Impacts on Yearly and Latitudinal Variations of LST Change
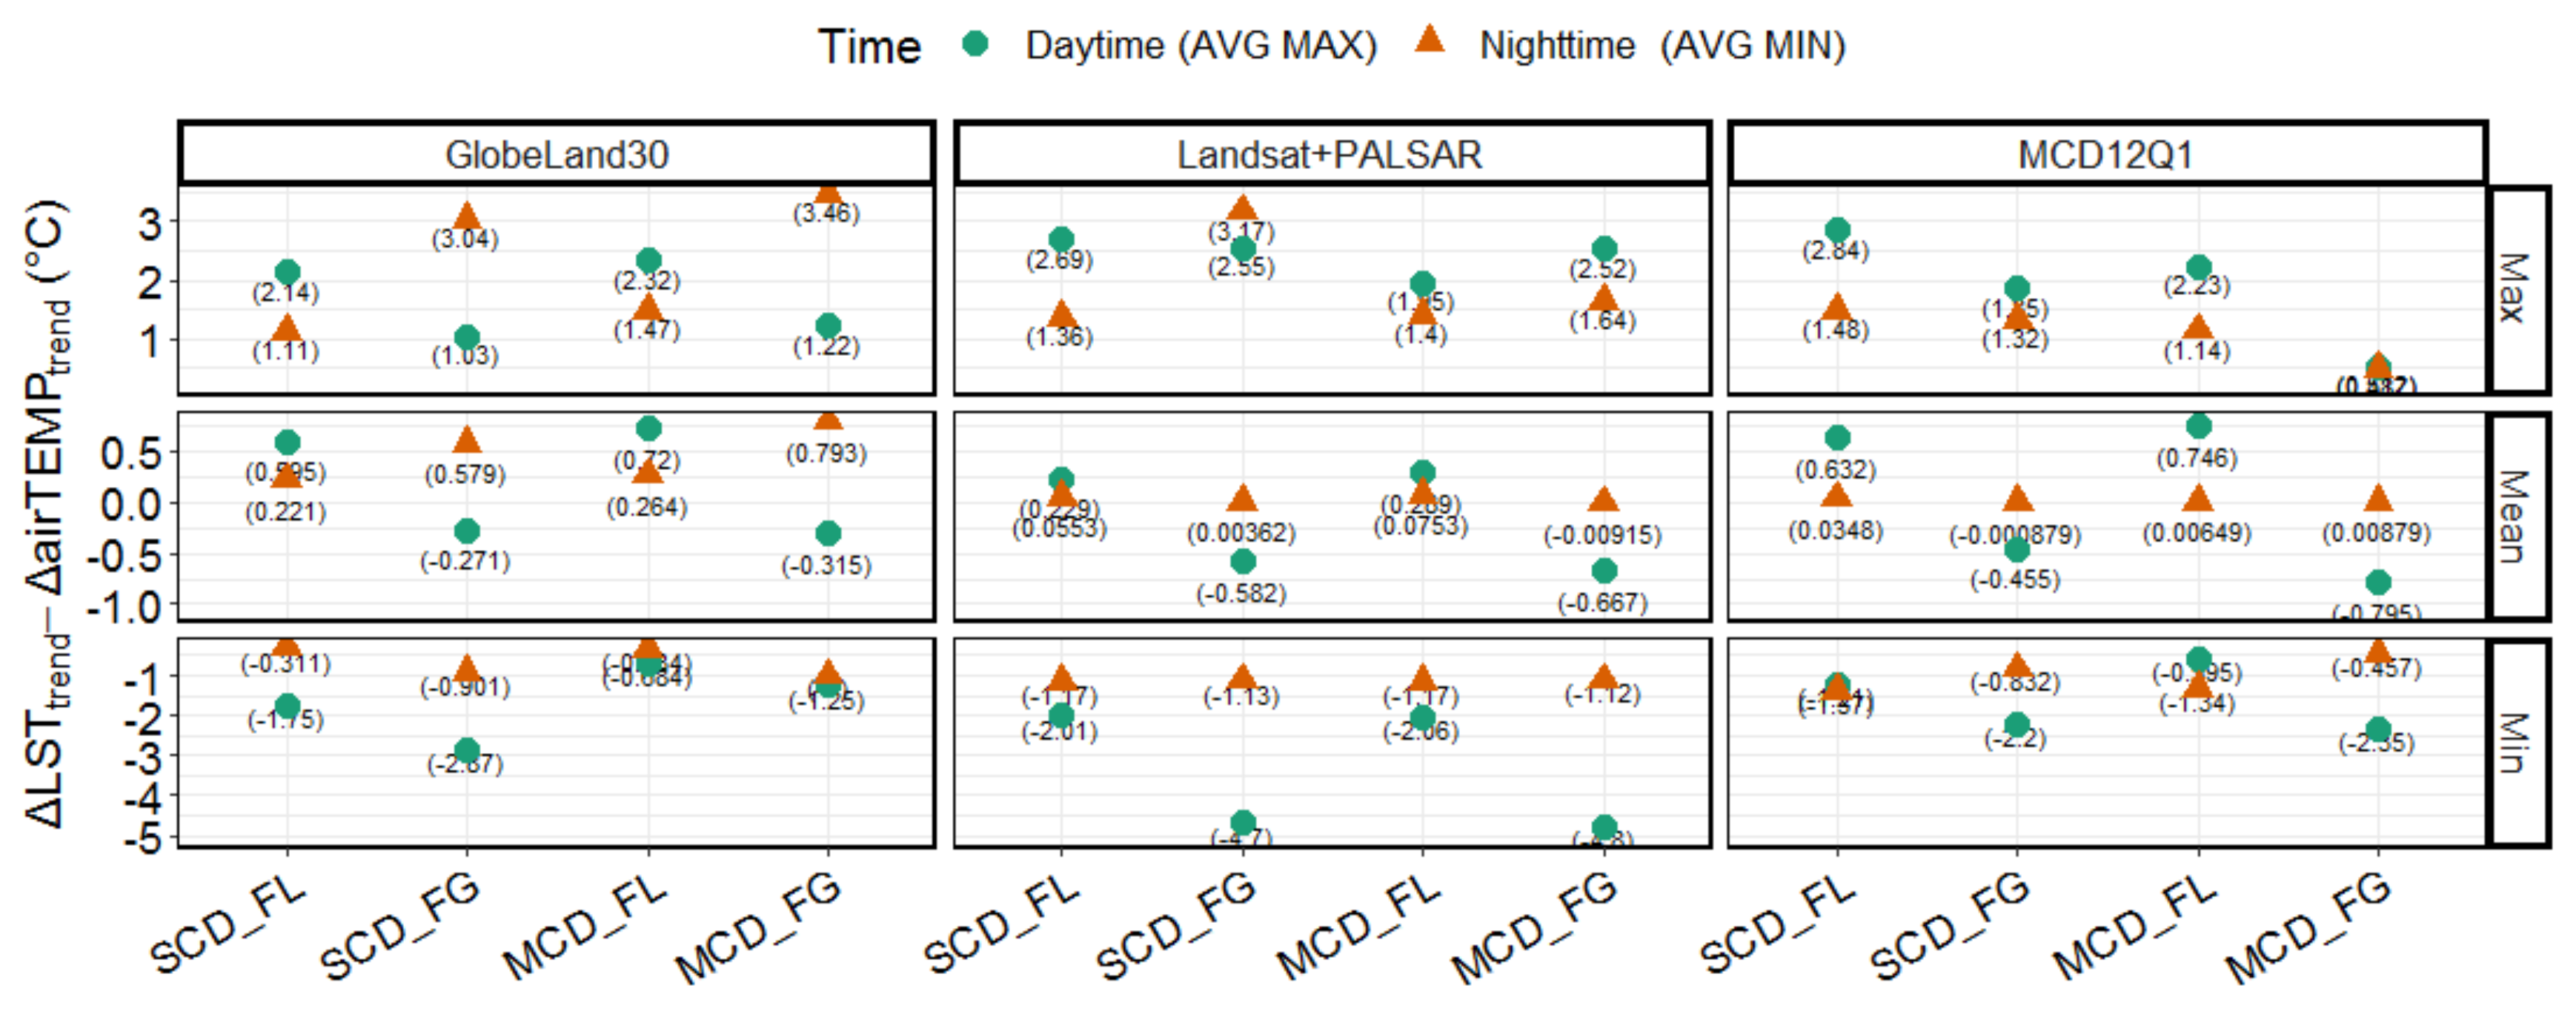
3.4. Analysis of the Interrelationships about the Impacts of Forest Cover Change on Air Temperature and LST
4. Discussion
4.1. The Importance of Pre-Assessment Method in Forest Cover Change
4.2. Evaluation of the Impacts of Forest Change on Temperature
4.3. Limitations and Insights of This Study
5. Conclusions
Supplementary Materials
Author Contributions
Funding
Acknowledgments
Conflicts of Interest
References
- Bathiany, S.; Claussen, M.; Brovkin, V.; Raddatz, T.; Gayler, V. Combined biogeophysical and biogeochemical effects of large-scale forest cover changes in the MPI earth system model. Biogeosciences 2010, 7, 1383–1399. [Google Scholar] [CrossRef]
- Bonan, G.B. Forests and climate change forcings, feedbacks, and the climate benefits of forests. Science 2008, 320, 1444–1449. [Google Scholar] [CrossRef] [PubMed]
- Bright, R.M.; Davin, E.; O’Halloran, T.; Pongratz, J.; Zhao, K.; Cescatti, A. Local temperature response to land cover and management change driven by non-radiative processes. Nat. Clim. Change 2017, 7, 296–302. [Google Scholar] [CrossRef]
- Chase, T.N.; Pielke, R.A., Sr.; Kittel, T.G.F.; Nemani, R.R.; Running, S.W. Simulated impacts of historical land cover changes on global climate in northern winter. Clim. Dyn. 2000, 16, 93–105. [Google Scholar] [CrossRef]
- Zhao, K.; Jackson, R. Biophysical forcings of land-use changes from potential forestry activities in North America. Ecol. Monogr. 2014, 84, 329–353. [Google Scholar] [CrossRef]
- Burakowski, E.; Tawfik, A.; Ouimette, A.; Lepine, L.; Novick, K.; Ollinger, S.; Zarzycki, C.; Bonan, G. The role of surface roughness, albedo, and Bowen ratio on ecosystem energy balance in the Eastern United States. Agric. For. Meteorol. 2018, 249, 367–376. [Google Scholar] [CrossRef]
- Chen, L.; Dirmeyer, P.A. Reconciling the disagreement between observed and simulated temperature responses to deforestation. Nat. Commun. 2020, 11, 202. [Google Scholar] [CrossRef]
- Huang, B.; Hu, X.; Fuglstad, G.A.; Zhou, X.; Zhao, W.; Cherubini, F. Predominant regional biophysical cooling from recent land cover changes in Europe. Nat. Commun. 2020, 11, 1–13. [Google Scholar] [CrossRef]
- Li, Z.; Tang, B.; Wu, H.; Ren, H.; Yan, G.; Wan, Z.; Trigo, I.F.; Sobrino, J.A. Satellite-derived land surface temperature: Current status and perspectives. Remote Sens. Environ. 2013, 131, 14–37. [Google Scholar] [CrossRef]
- Alkama, R.; Cescatti, A. Biophysical climate impacts of recent changes in global forest cover. Science 2016, 351, 600–604. [Google Scholar] [CrossRef]
- Lee, X.; Goulden, M.L.; Hollinger, D.Y.; Barr, A.; Black, T.A.; Bohrer, G.; Bracho, R.; Drake, B.; Goldstein, A.; Gu, L.; et al. Observed increase in local cooling effect of deforestation at higher latitudes. Nature 2011, 479, 384–387. [Google Scholar] [CrossRef] [PubMed]
- Senior, R.A.; Hill, J.K.; Gonzalez Del Pliego, P.; Goode, L.K.; Edwards, D.P. A pantropical analysis of the impacts of forest degradation and conversion on local temperature. Ecol. Evol. 2017, 7, 7897–7908. [Google Scholar] [CrossRef] [PubMed]
- Strandberg, G.; Kjellström, E. Climate impacts from afforestation and deforestation in Europe. Earth Interact. 2019, 23, 1–27. [Google Scholar] [CrossRef]
- Wang, L.; Lee, X.; Schultz, N.; Chen, S.; Wei, Z.; Fu, C.; Gao, Y.; Yang, Y.; Lin, G. Response of surface temperature to afforestation in the Kubuqi Desert, Inner Mongolia. J. Geophys. Res. Atmos. 2018, 123, 948–964. [Google Scholar] [CrossRef]
- Li, Y.; Zhao, M.; Mildrexler, D.J.; Motesharrei, S.; Mu, Q.; Kalnay, E.; Zhao, F.; Li, S.; Wang, K. Potential and Actual impacts of deforestation and afforestation on land surface temperature. J. Geophys. Res. Atmos. 2016, 121, 14372–14386. [Google Scholar] [CrossRef]
- Peng, S.S.; Piao, S.; Zeng, Z.; Ciais, P.; Zhou, L.; Li, L.Z.; Myneni, R.B.; Yin, Y.; Zeng, H. Afforestation in China cools local land surface temperature. Proc. Natl. Acad. Sci. USA 2014, 111, 2915–2919. [Google Scholar] [CrossRef]
- Perugini, L.; Caporaso, L.; Marconi, S.; Cescatti, A.; Quesada, B.; de Noblet-Ducoudré, N.; House, J.I.; Arneth, A. Biophysical effects on temperature and precipitation due to land cover change. Environ. Res. Lett. 2017, 12, 053002. [Google Scholar] [CrossRef]
- Prevedello, J.A.; Winck, G.R.; Weber, M.M.; Nichols, E.; Sinervo, B. Impacts of forestation and deforestation on local temperature across the globe. PLoS ONE 2019, 14, e0213368. [Google Scholar] [CrossRef]
- Devaraju, N.; de Noblet-Ducoudré, N.; Quesada, B.; Bala, G. Quantifying the relative importance of direct and indirect biophysical effects of deforestation on surface temperature and teleconnections. J. Clim. 2018, 31, 3811–3829. [Google Scholar] [CrossRef]
- Duveiller, G.; Forzieri, G.; Robertson, E.; Li, W.; Georgievski, G.; Lawrence, P.; Wiltshire, A.; Ciais, P.; Pongratz, J.; Sitch, S.; et al. Biophysics and vegetation cover change: A process-based evaluation framework for confronting land surface models with satellite observations. Earth Syst. Sci. Data 2018, 10, 1265–1279. [Google Scholar] [CrossRef]
- MacDougall, A.H.; Beltrami, H. Impact of deforestation on subsurface temperature profiles: Implications for the borehole paleoclimate record. Environ. Res. Lett. 2017, 12, 074014. [Google Scholar] [CrossRef]
- Anderson, R.G.; Canadell, J.G.; Randerson, J.T.; Jackson, R.B.; Hungate, B.A.; Baldocchi, D.D.; Ban-Weiss, G.A.; Bonan, G.B.; Caldeira, K.; Cao, L.; et al. Biophysical considerations in forestry for climate protection. Front. Ecol. Environ. 2011, 9, 174–182. [Google Scholar] [CrossRef]
- Tang, B.; Zhao, X.; Zhao, W. Local effects of forests on temperatures across Europe. Remote Sens. 2018, 10, 529. [Google Scholar] [CrossRef]
- Ge, J.; Guo, W.; Pitman, A.J.; De Kauwe, M.G.; Chen, X.; Fu, C. The nonradiative effect dominates local surface temperature change caused by afforestation in China. J. Clim. 2019, 32, 4445–4471. [Google Scholar] [CrossRef]
- Li, Y.; Zhao, M.; Motesharrei, S.; Mu, Q.; Kalnay, E.; Li, S. Local cooling and warming effects of forests based on satellite observations. Nat. Commun. 2015, 6, 6603. [Google Scholar] [CrossRef] [PubMed]
- Shen, W.; Li, M.; Huang, C.; He, T.; Tao, X.; Wei, A. Local land surface temperature change induced by afforestation based on satellite observations in Guangdong plantation forests in China. Agric. For. Meteorol. 2019, 276–277, 107641. [Google Scholar] [CrossRef]
- Hansen, M.C.; Potapov, P.V.; Moore, R.; Hancher, M.; Turubanova, S.A.; Tyukavina, A.; Thau, D.; Stehman, S.V.; Goetz, S.J.; Loveland, T.R.; et al. High-resolution global maps of 21st-century forest cover change. Science 2013, 342, 850–853. [Google Scholar] [CrossRef]
- Pitman, A.J.; Avila, F.B.; Abramowitz, G.; Wang, Y.P.; Phipps, S.J.; de Noblet-Ducoudre, N. Importance of background climate in determining impact of land-cover change on regional climate. Nat. Clim. Change 2011, 1, 472–475. [Google Scholar] [CrossRef]
- Novo-Fernández, A.; Franks, S.; Wehenkel, C.; López-Serrano, P.M.; Molinier, M.; López-Sánchez, C.A. Landsat time series analysis for temperate forest cover change detection in the Sierra Madre Occidental, Durango, Mexico. Int. J. Appl. Earth Obs. Geoinf. 2018, 73, 230–244. [Google Scholar] [CrossRef]
- Wickham, J.D.; Wade, T.G.; Riitters, K.H. Empirical analysis of the influence of forest extent on annual and seasonal surface temperatures for the continental United States. Global Ecol. Biogeogr. 2013, 22, 620–629. [Google Scholar] [CrossRef]
- Liang, S.; Wang, J. Chapter 25—Forest Cover Changes: Mapping and Climatic Impact Assessment. In Advanced Remote Sensing; Academic Press: Cambridge, MA, USA, 2020; pp. 915–952. [Google Scholar] [CrossRef]
- Olofsson, P.; Foody, G.M.; Herold, M.; Stehman, S.V.; Woodcock, C.E.; Wulder, M.A. Good practices for estimating area and assessing accuracy of land change. Remote Sens. Environ. 2014, 148, 42–57. [Google Scholar] [CrossRef]
- Olofsson, P.; Foody, G.M.; Stehman, S.V.; Woodcock, C.E. Making better use of accuracy data in land change studies: Estimating accuracy and area and quantifying uncertainty using stratified estimation. Remote Sens. Environ. 2013, 129, 122–131. [Google Scholar] [CrossRef]
- Chen, J.; Chen, J.; Liao, A.; Cao, X.; Chen, L.; Chen, X.; He, C.; Han, G.; Peng, S.; Lu, M.; et al. Global land cover mapping at 30m resolution: A POK-based operational approach. ISPRS J. Photogramm. 2015, 103, 7–27. [Google Scholar] [CrossRef]
- Shimada, M.; Itoh, T.; Motooka, T.; Watanabe, M.; Shiraishi, T.; Thapa, R.; Lucas, R. New global forest/non-forest maps from ALOS PALSAR data (2007–2010). Remote Sens. Environ. 2014, 155, 13–31. [Google Scholar] [CrossRef]
- Shen, W.; Li, M.; Huang, C.; Tao, X.; Li, S.; Wei, A. Mapping annual forest change due to afforestation in Guangdong province of China using active and passive remote sensing data. Remote Sens. 2019, 11, 490. [Google Scholar] [CrossRef]
- Sulla-Menashe, D.; Gray, J.M.; Abercrombie, S.P.; Friedl, M.A. Hierarchical mapping of annual global land cover 2001 to present: The MODIS Collection 6 Land Cover product. Remote Sens. Environ. 2019, 222, 183–194. [Google Scholar] [CrossRef]
- Seebach, L.; Strobl, P.; Vogt, P.; Mehl, W.; San-Miguel-Ayanz, J. Enhancing post-classification change detection through morphological post-processing—A sensitivity analysis. Int. J. Remote Sens. 2013, 34, 7145–7162. [Google Scholar] [CrossRef]
- Thomas, N.E.; Huang, C.Q.; Goward, S.N.; Powell, S.; Schleeweis, K.; Hinds, A. Validation of North American forest disturbance dynamics derived from Landsat time series stacks. Remote Sens. Environ. 2011, 115, 19–32. [Google Scholar] [CrossRef]
- Lei, X.D.; Tang, M.P.; Lu, Y.C.; Hong, L.X.; Tian, D.L. Forest inventory in China: Status and challenges. Int. For. Rev. 2009, 11, 52–63. [Google Scholar] [CrossRef]
- Huang, C.Q.; Coward, S.N.; Masek, J.G.; Thomas, N.; Zhu, Z.L.; Vogelmann, J.E. An automated approach for reconstructing recent forest disturbance history using dense Landsat time series stacks. Remote Sens. Environ. 2010, 114, 183–198. [Google Scholar] [CrossRef]
- Shen, W.J.; Li, M.S.; Wei, A.S. Spatio-temporal variations in plantation forests disturbance and recovery of Northern Guangdong Province using yearly Landsat time series observations (1986–2015). Chin. Geogr. Sci. 2017, 27, 600–613. [Google Scholar] [CrossRef]
- Huang, C.; Davis, L.S.; Townshend, J.R.G. An assessment of support vector machines for land cover classification. Int. J. Remote Sens. 2002, 23, 725–749. [Google Scholar] [CrossRef]
- Wan, Z. New refinements and validation of the MODIS Land-Surface Temperature/Emissivity products. Remote Sens. Environ. 2008, 112, 59–74. [Google Scholar] [CrossRef]
- Mu, Q.Z.; Zhao, M.S.; Running, S.W. Improvements to a MODIS global terrestrial evapotranspiration algorithm. Remote Sens. Environ. 2011, 115, 1781–1800. [Google Scholar] [CrossRef]
- Schaaf, C.B.; Gao, F.; Strahler, A.H.; Lucht, W.; Li, X.; Tsang, T.; Lewis, P. First operational BRDF, albedo nadir reflectance products from MODIS. Remote Sens. Environ. 2002, 83, 135–148. [Google Scholar] [CrossRef]
- Mildrexler, D.J.; Zhao, M.; Running, S.W. A global comparison between station air temperatures and MODIS land surface temperatures reveals the cooling role of forests. J. Geophys. Res. 2011, 116. [Google Scholar] [CrossRef]
- Bai, Y.; Feng, M.; Jiang, H.; Wang, J.; Zhu, Y.; Liu, Y. Assessing consistency of five global land cover data sets in China. Remote Sens. 2014, 6, 8739–8759. [Google Scholar] [CrossRef]
- Li, Y.; Sulla-Menashe, D.; Motesharrei, S.; Song, X.P.; Kalnay, E.; Ying, Q.; Li, S.; Ma, Z. Inconsistent estimates of forest cover change in China between 2000 and 2013 from multiple datasets: Differences in parameters, spatial resolution, and definitions. Sci. Rep. 2017, 7, 8748. [Google Scholar] [CrossRef]
- Pérez-Hoyos, A.; García-Haro, F.J.; San-Miguel-Ayanz, J. Conventional and fuzzy comparisons of large scale land cover products: Application to CORINE, GLC2000, MODIS and GlobCover in Europe. ISPRS J. Photogramm. 2012, 74, 185–201. [Google Scholar] [CrossRef]
- Wessels, K. Mapping regional land cover with MODIS data for biological conservation: Examples from the Greater Yellowstone Ecosystem, USA and Para State, Brazil. Remote Sens. Environ. 2004, 92, 67–83. [Google Scholar] [CrossRef]
- Wulder, M.A.; Coops, N.C.; Roy, D.P.; White, J.C.; Hermosilla, T. Land cover 2.0. Int. J. Remote Sens. 2018, 39, 4254–4284. [Google Scholar] [CrossRef]
- Gebhardt, S.; Wehrmann, T.; Ruiz, M.A.M.; Maeda, P.; Bishop, J.; Schramm, M.; Kopeinig, R.; Cartus, O.; Kellndorfer, J.; Ressl, R.; et al. MAD-MEX: Automatic wall-to-wall land cover monitoring for the Mexican REDD-MRV program using all Landsat data. Remote Sens. 2014, 6, 3923–3943. [Google Scholar] [CrossRef]
- Homer, C.; Dewitz, J.; Fry, J.; Coan, M.; Hossain, N.; Larson, C.; Herold, N.; McKerrow, A.; VanDriel, J.N.; Wickham, J. Completion of the 2001 national land cover database for the counterminous United States. Photogramm. Eng. Remote Sens. 2007, 73, 337. [Google Scholar]
- Duveiller, G.; Hooker, J.; Cescatti, A. The mark of vegetation change on Earth’s surface energy balance. Nat. Commun. 2018, 9, 679. [Google Scholar] [CrossRef] [PubMed]
- Quattrochi, D.A.; Wentz, E.; Lam, N.S.-N.; Emerson, C.W. Integrating Scale in Remote Sensing and GIS; CRC Press: Boca Raton, FL, USA, 2017. [Google Scholar]
- Foody, G.M. Harshness in image classification accuracy assessment. Int. J. Remote Sens. 2008, 29, 3137–3158. [Google Scholar] [CrossRef]
- Serra, P.; Pons, X.; Saurí, D. Post-classification change detection with data from different sensors: Some accuracy considerations. Int. J. Remote Sens. 2003, 24, 3311–3340. [Google Scholar] [CrossRef]
- Singh, A. Review article digital change detection techniques using remotely-sensed data. Int. J. Remote Sens. 1989, 10, 989–1003. [Google Scholar] [CrossRef]
- Hall, A. The role of surface albedo feedback in Climate. J. Clim. 2004, 17, 1550–1568. [Google Scholar] [CrossRef]
- Townshend, J.R.; Masek, J.G.; Huang, C.Q.; Vermote, E.F.; Gao, F.; Channan, S.; Sexton, J.O.; Feng, M.; Narasimhan, R.; Kim, D.; et al. Global characterization and monitoring of forest cover using Landsat data: Opportunities and challenges. Int. J. Digit. Earth 2012, 5, 373–397. [Google Scholar] [CrossRef]
- Popkin, G. How much can forest fight climate change? Trees are supposed to slow global warming, but growing evidence suggests they might not always be climate saviours. Nature 2019, 565, 280–282. [Google Scholar] [CrossRef]
- Davin, E.L.; de Noblet-Ducoudré, N. Climatic Impact of global-scale deforestation: Radiative versus nonradiative processes. J. Clim. 2010, 23, 97–112. [Google Scholar] [CrossRef]
- Kueppers, L.M.; Snyder, M.A.; Sloan, L.C.; Cayan, D.; Jin, J.; Kanamaru, H.; Kanamitsu, M.; Miller, N.L.; Tyree, M.; Du, H.; et al. Seasonal temperature responses to land-use change in the western United States. Global Planet. Change 2008, 60, 250–264. [Google Scholar] [CrossRef]
- Liu, T.; Yu, L.; Bu, K.; Yan, F.; Zhang, S. Seasonal local temperature responses to paddy field expansion from rain-fed farmland in the cold and humid Sanjiang Plain of China. Remote Sens. 2018, 10, 2009. [Google Scholar] [CrossRef]
- Liu, Z.; Notaro, M.; Gallimore, R. Indirect vegetation-soil moisture feedback with application to Holocene North Africa climate. Global Change Biol. 2010, 16, 1733–1743. [Google Scholar] [CrossRef]
- Li, Y.; De Noblet-Ducoudré, N.; Davin, E.L.; Motesharrei, S.; Zeng, N.; Li, S.; Kalnay, E. The role of spatial scale and background climate in the latitudinal temperature response to deforestation. Earth Syst. Dyn. 2016, 7, 167–181. [Google Scholar] [CrossRef]
- Li, D.; Wang, L. Sensitivity of surface temperature to land use and land cover change-induced biophysical changes: The scale issue. Geophys. Res. Lett. 2019, 46, 9678–9689. [Google Scholar] [CrossRef]


| Dataset | Source | Forest Definition | Overall Accuracy | Reference |
|---|---|---|---|---|
| GlobeLand30 | Landsat-like | Canopy cover > 30% (including sparse woods over 10–30%) | 84%–89% | [34] |
| SGB-NDVI/FNF | Landsat/PALSAR | Canopy cover > 10% | 83%–86% | [36] |
| MCD12Q1 | MODIS | Tree height > 2 m, tree cover > 60% | 74% | [37] |
| Dataset | Source | Forest Definition | Overall Accuracy | Reference |
|---|---|---|---|---|
| NFIs | Ground, and remote sensing plot observations | Canopy cover 20%, diameter at breast height (DBH) > 5 cm | [40] | |
| VCT | Landsat (Path122Row043) | Pixels with low IFZ values (~0) are close to the spectral center of forest samples | 92% | [41,42] |
| Year | NFI | GlobeLand30 (30-m/1-km) | MCD12Q1 (500-m/1-km) | Landsat/PALSAR (30-m/1-km) |
|---|---|---|---|---|
| 2000 | 8.27 | 9.75/4.32 | 3.02/3.17 | 6.05/5.91 |
| 2010 | 8.74 | 9.74/4.33 | 3.04/3.18 | 7.55/7.61 |
© 2020 by the authors. Licensee MDPI, Basel, Switzerland. This article is an open access article distributed under the terms and conditions of the Creative Commons Attribution (CC BY) license (http://creativecommons.org/licenses/by/4.0/).
Share and Cite
Shen, W.; He, J.; Huang, C.; Li, M. Quantifying the Actual Impacts of Forest Cover Change on Surface Temperature in Guangdong, China. Remote Sens. 2020, 12, 2354. https://doi.org/10.3390/rs12152354
Shen W, He J, Huang C, Li M. Quantifying the Actual Impacts of Forest Cover Change on Surface Temperature in Guangdong, China. Remote Sensing. 2020; 12(15):2354. https://doi.org/10.3390/rs12152354
Chicago/Turabian StyleShen, Wenjuan, Jiaying He, Chengquan Huang, and Mingshi Li. 2020. "Quantifying the Actual Impacts of Forest Cover Change on Surface Temperature in Guangdong, China" Remote Sensing 12, no. 15: 2354. https://doi.org/10.3390/rs12152354
APA StyleShen, W., He, J., Huang, C., & Li, M. (2020). Quantifying the Actual Impacts of Forest Cover Change on Surface Temperature in Guangdong, China. Remote Sensing, 12(15), 2354. https://doi.org/10.3390/rs12152354